Article

Upscaling Asphalt Performance: A Multiscale Energy Framework and Artificial Neural Network Prediction

1
School of Civil Engineering and Transportation, South China University of Technology, Guangzhou 510641, China
2
Guangdong Provincial Key Laboratory of Modern Civil Engineering Technology, Guangzhou 510641, China
3
Department of Civil and Environmental Engineering, The Hong Kong Polytechnic University, Hong Kong 999077, China
4
College of Architecture and Civil Engineering, Beijing University of Technology, Beijing 100124, China
*
Author to whom correspondence should be addressed.
Buildings 2026, 16(10), 2041; https://doi.org/10.3390/buildings16102041
Submission received: 10 April 2026 / Revised: 6 May 2026 / Accepted: 18 May 2026 / Published: 21 May 2026

Abstract

The macroscopic resistance of asphalt mixtures to permanent deformation is fundamentally governed by the mechanical properties of the constituent asphalt mortar; however, a unified evaluation system that quantitatively links the energy evolution between these two scales is currently lacking. This study aims to bridge this gap by establishing a multiscale framework to characterize and predict the recoverable and dissipated energy behaviors of asphalt materials. To achieve this, Multi-Stress Creep Recovery (MSCR) tests and Multi-Sequence Repeated Loading (MSRL) tests were conducted on asphalt mortar and mixtures, respectively, to capture energy evolution under varying stress, temperature, and gradation conditions. Subsequently, Multiple Linear Regression (MLR) and Artificial Neural Network (ANN) models were developed to correlate mesoscopic mortar parameters with macroscopic mixture performance. Experimental results reveal that energy indicators are significantly influenced by loading stress and aggregate skeleton, with finer gradations exhibiting greater responsiveness to stress changes. A strong cross-scale dependency was identified, evidenced by a correlation coefficient of 0.86 between the recoverable energy of the mixture ( U r m i x ) and that of the mortar ( U r m o r t a r ). Furthermore, the developed ANN model demonstrated exceptional predictive accuracy ( R 2 0.99 ) in upscaling energy indicators. This study develops a multiscale energy framework that integrates experimentally derived energy indicators from asphalt mortar and asphalt mixture, enabling the prediction of macroscopic mixture performance from mesoscopic mortar energy evolution rather than relying solely on empirical machine-learning correlations.

1. Introduction

As of 2024, China’s total highway mileage has exceeded 5.3 million kilometers, cementing its status as a global leader in road infrastructure [1,2]. With this extensive network in place, the industry focus is shifting from rapid development to sustainable, refined maintenance practices, driven by resource scarcity and environmental concerns. Consequently, pavement engineering must adopt more rigorous, performance-oriented design methodologies. A critical component of this transition involves evaluating the high-temperature performance of asphalt layers, specifically their resistance to permanent deformation (rutting) under repeated axle loads [3,4]. Permanent deformation remains one of the most persistent and challenging forms of pavement distress. While various testing methods have been developed to assess rutting resistance [5,6], the underlying mechanisms of damage are highly complex, governed by the dynamic interplay of material composition, environmental factors, and traffic loads [7,8]. Analyzing these factors in isolation is experimentally difficult due to the challenges of controlling variables and collecting large-scale data [9,10]. These limitations underscore the urgent need for more effective and fundamental methods of performance evaluation.
Energy-based analysis offers a comprehensive framework for characterizing material behavior by interpreting deformation as a process of energy transfer and dissipation. Unlike conventional indicators such as modulus and strength, which often fail to capture behavior under varying stress cycles [11], energy dissipation metrics provide intrinsic insights into fatigue life and load-bearing capacity [12,13]. Previous research has demonstrated the efficacy of this approach: Huang et al. established strong correlations between fracture energy and dissipated energy [14], while Song et al. utilized equivalent energy approaches to study mixtures containing recycled asphalt pavement (RAP) [15]. Further studies have employed surface free energy [16] and modified Griffith criteria [17] to evaluate durability and cracking thresholds. Similarly, Luo proposed energy-based models to simulate deformation [18], and Boudabbous explored energy dissipation ratios to characterize fatigue [19]. These contributions confirm that analyzing dissipated energy is essential for understanding long-term pavement structural integrity [20,21]. Although these studies have confirmed the effectiveness of energy-based indicators in characterizing asphalt material behavior [22], most of them remain focused on a single material scale, such as binder, mortar, or mixture [23]. As a result, they provide limited insight into how energy storage and dissipation at the mesoscopic mortar are transferred to the macroscopic deformation of asphalt mixtures [24,25].
Concurrently, the role of asphalt mortar in determining the macroscopic performance of asphalt mixtures has garnered increasing attention [26,27]. As the matrix composed of fine aggregates and filler [28,29], asphalt mortar binds the coarse aggregates and predominantly governs the mixture’s viscoelastic and fatigue characteristics [30,31,32,33]. Establishing the linear viscoelastic range of the mortar is a fundamental step in this characterization [34,35]. Previous investigations, such as Kim’s work on sand asphalt fatigue [36,37] and studies defining fine aggregate thresholds [38,39,40], illustrate that a deep understanding of mortar mechanics is necessary to bridge the gap between mesoscopic material behavior and macroscopic performance. Despite the recognized role of asphalt mortar in mixture performance [41], its energy-based contribution to mixture-level permanent deformation remains insufficiently understood.
To effectively link these scales, artificial neural networks (ANN) offer robust computational capabilities. By emulating biological neural connections, ANNs can process complex, non-linear relationships that traditional regression models struggle to capture [42]. In pavement engineering, ANNs have been successfully applied to predict structural layer thickness [43], dynamic modulus [44], indirect tensile strength [45,46], and performance indicators such as rut depth [47], crack propagation [48], and surface smoothness [49]. The high predictive accuracy achieved in these domains demonstrates the feasibility of applying machine learning to upscale energy characteristics from mortar to mixture. Despite the accuracy, conventional ANN-based models often lack physically interpretable input structures, limiting their application in mechanism-based material evaluation [50].
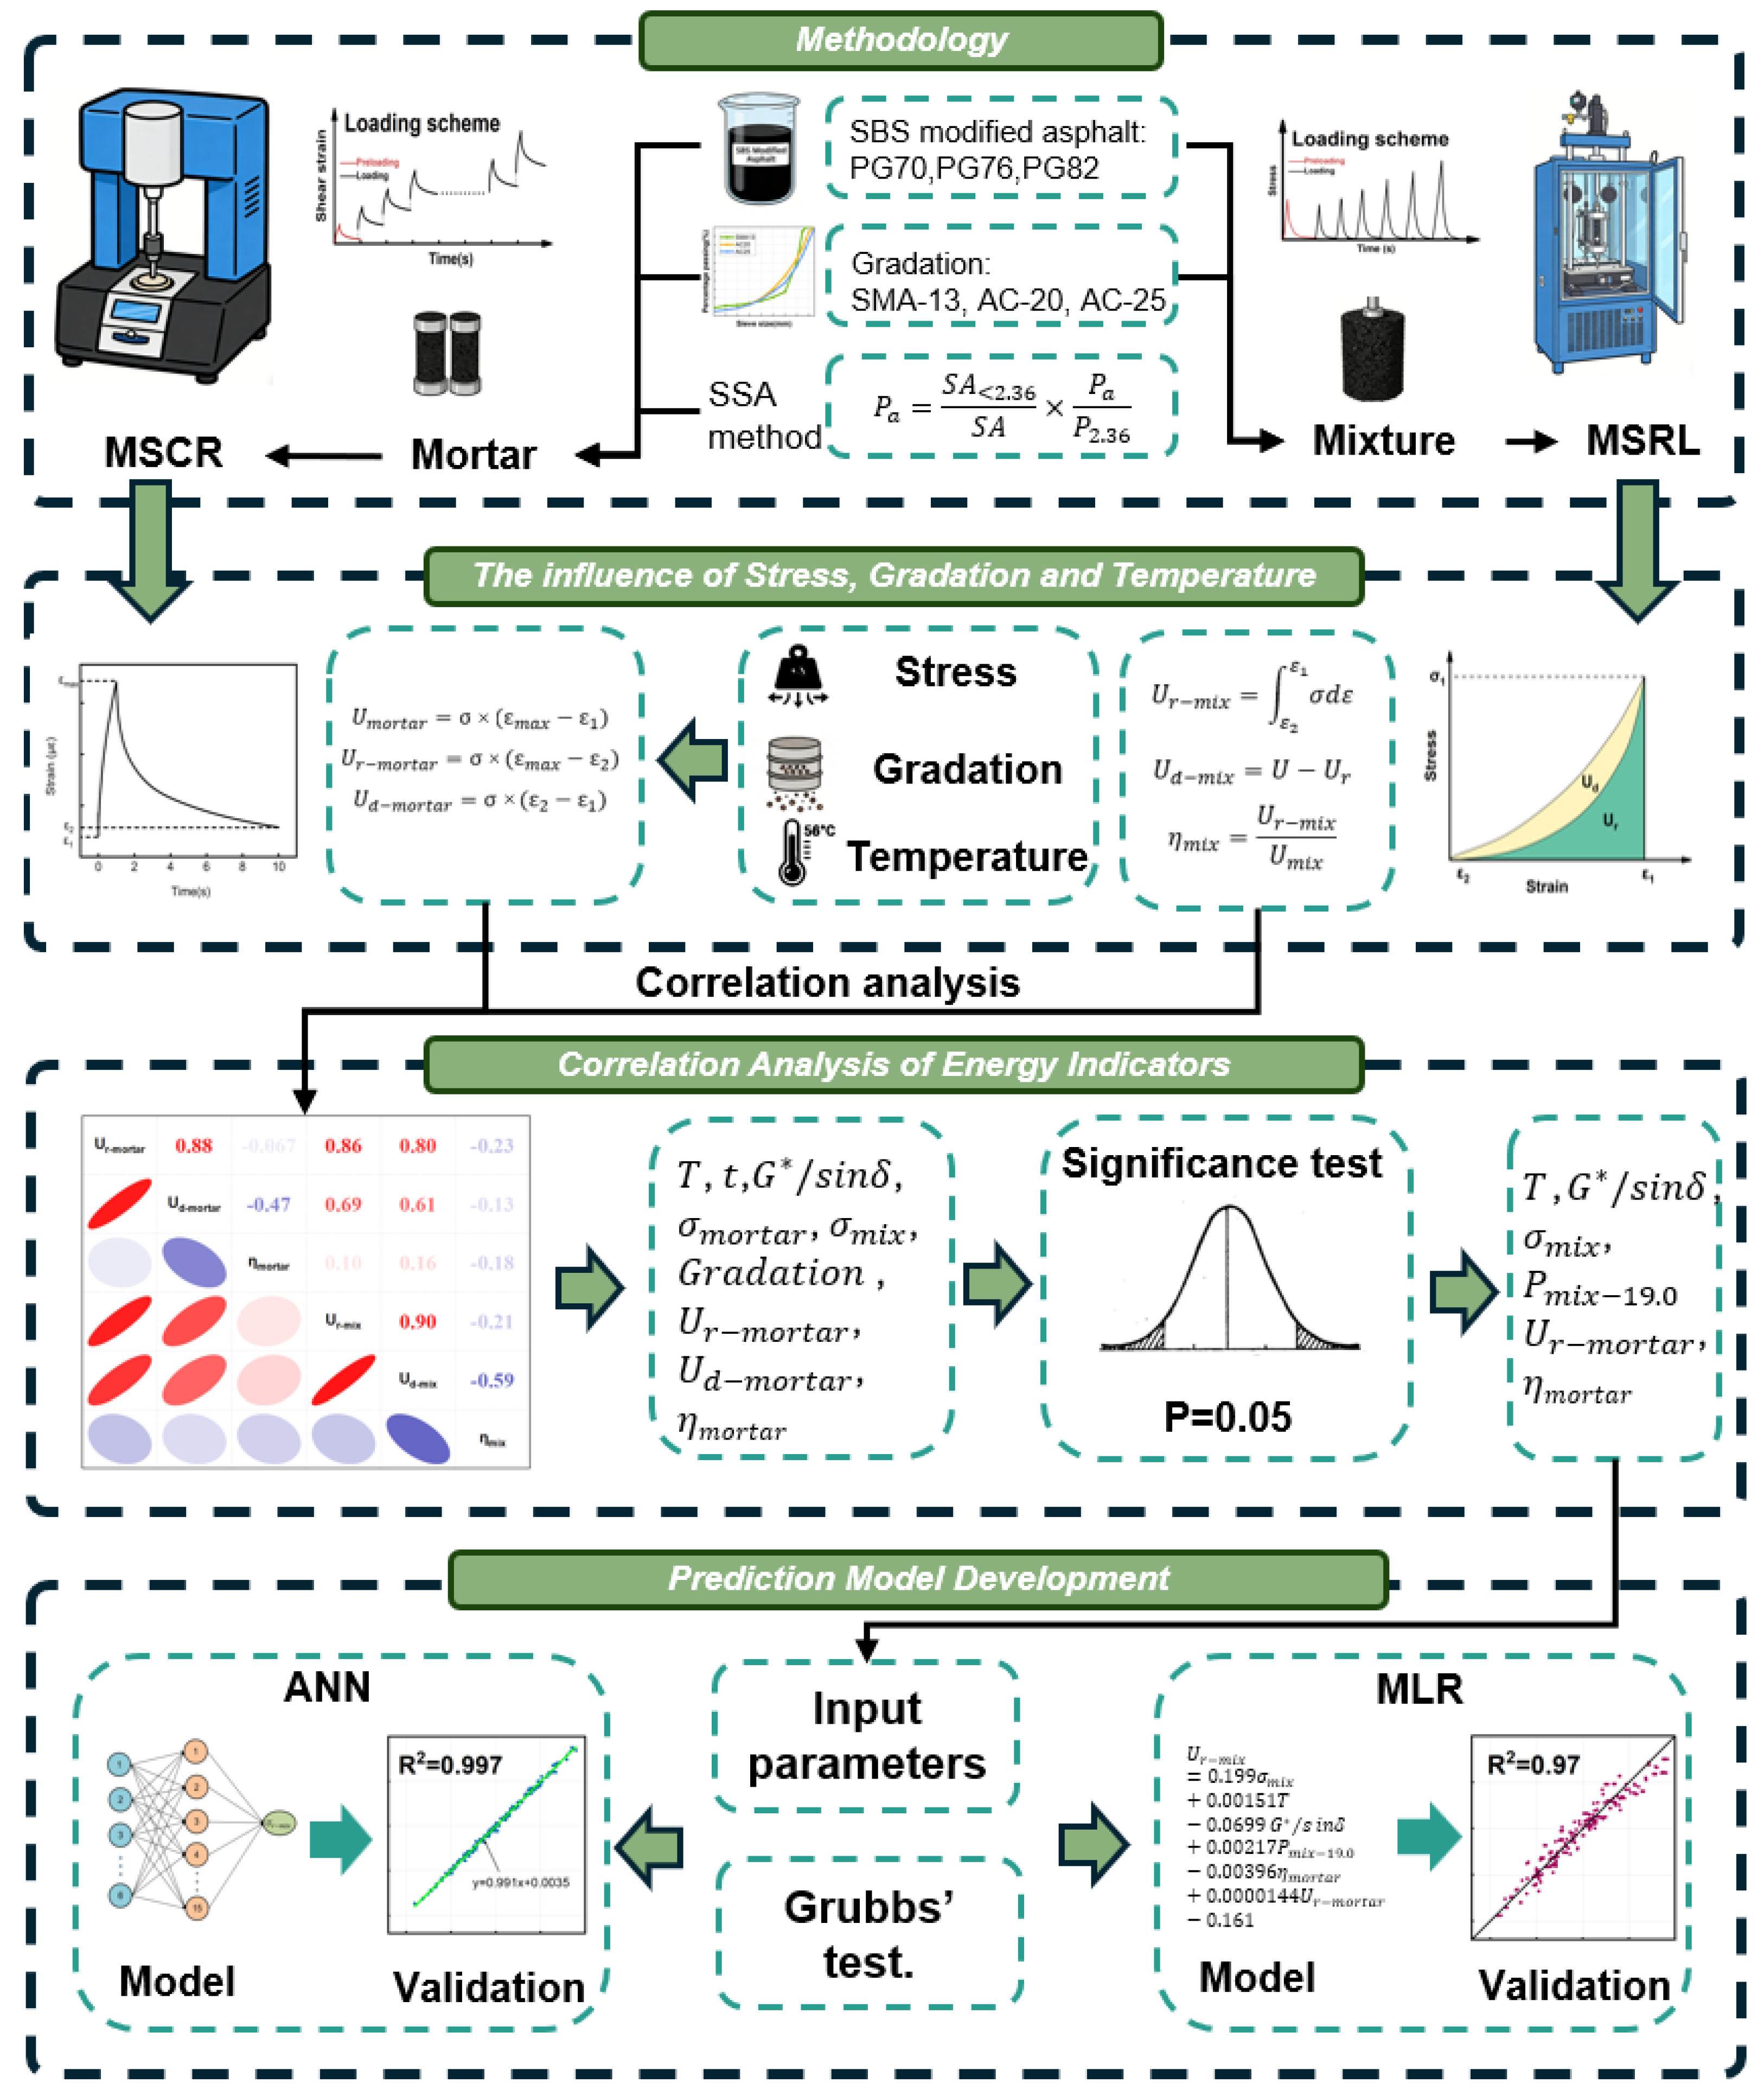
Despite these advancements, a significant gap remains in evaluating the evolution of recoverable and irrecoverable energy under repeated loading conditions. This study aims to quantify the energy behavior of asphalt mortar and develop a cross-scale prediction model for asphalt mixtures. As illustrated in the research framework (Figure 1), this study employs Multi-Stress Creep Recovery (MSCR) and Multi-Sequence Repeated Loading (MSRL) tests to analyze the effects of stress, gradation, and temperature on energy evolution. Furthermore, it establishes Multiple Linear Regression (MLR) and ANN models to bridge the scale from mortar to mixture, providing a novel, energy-based framework for evaluating asphalt material performance. The novelty of this study lies not merely in applying an ANN model, but in integrating experimentally derived energy indicators from asphalt mortar and asphalt mixture into a unified cross-scale upscaling framework.

2. Materials and Methods

2.1. Materials

2.1.1. Asphalt Binder

Three types of styrene–butadiene–styrene (SBS) modified asphalt binders, namely PG70, PG76, and PG82, were used in this study. All binders were supplied by Guangdong Jianghe Expressway Co., Ltd., located in Jiangmen, China. The fundamental physical properties of these binders were tested in accordance with relevant standards and are summarized in Table 1.

2.1.2. Aggregates and Mineral Filler

Basalt was selected as the coarse and fine aggregate material for preparing both the asphalt mixture and asphalt mortar specimens. The physical properties of the coarse and fine aggregates are detailed in Table 2 and Table 3, respectively. Limestone mineral powder was employed as the filler; its basic performance indicators are presented in Table 4.

2.2. Methodology

2.2.1. Asphalt Mortar Design and Preparation

To investigate the multiscale relationship between mortar and mixture, three standard asphalt mixtures were selected: SMA-13, AC-20, and AC-25. Correspondingly, three asphalt mortar types were designed, designated as FSMA13, FAC20, and FAC25.
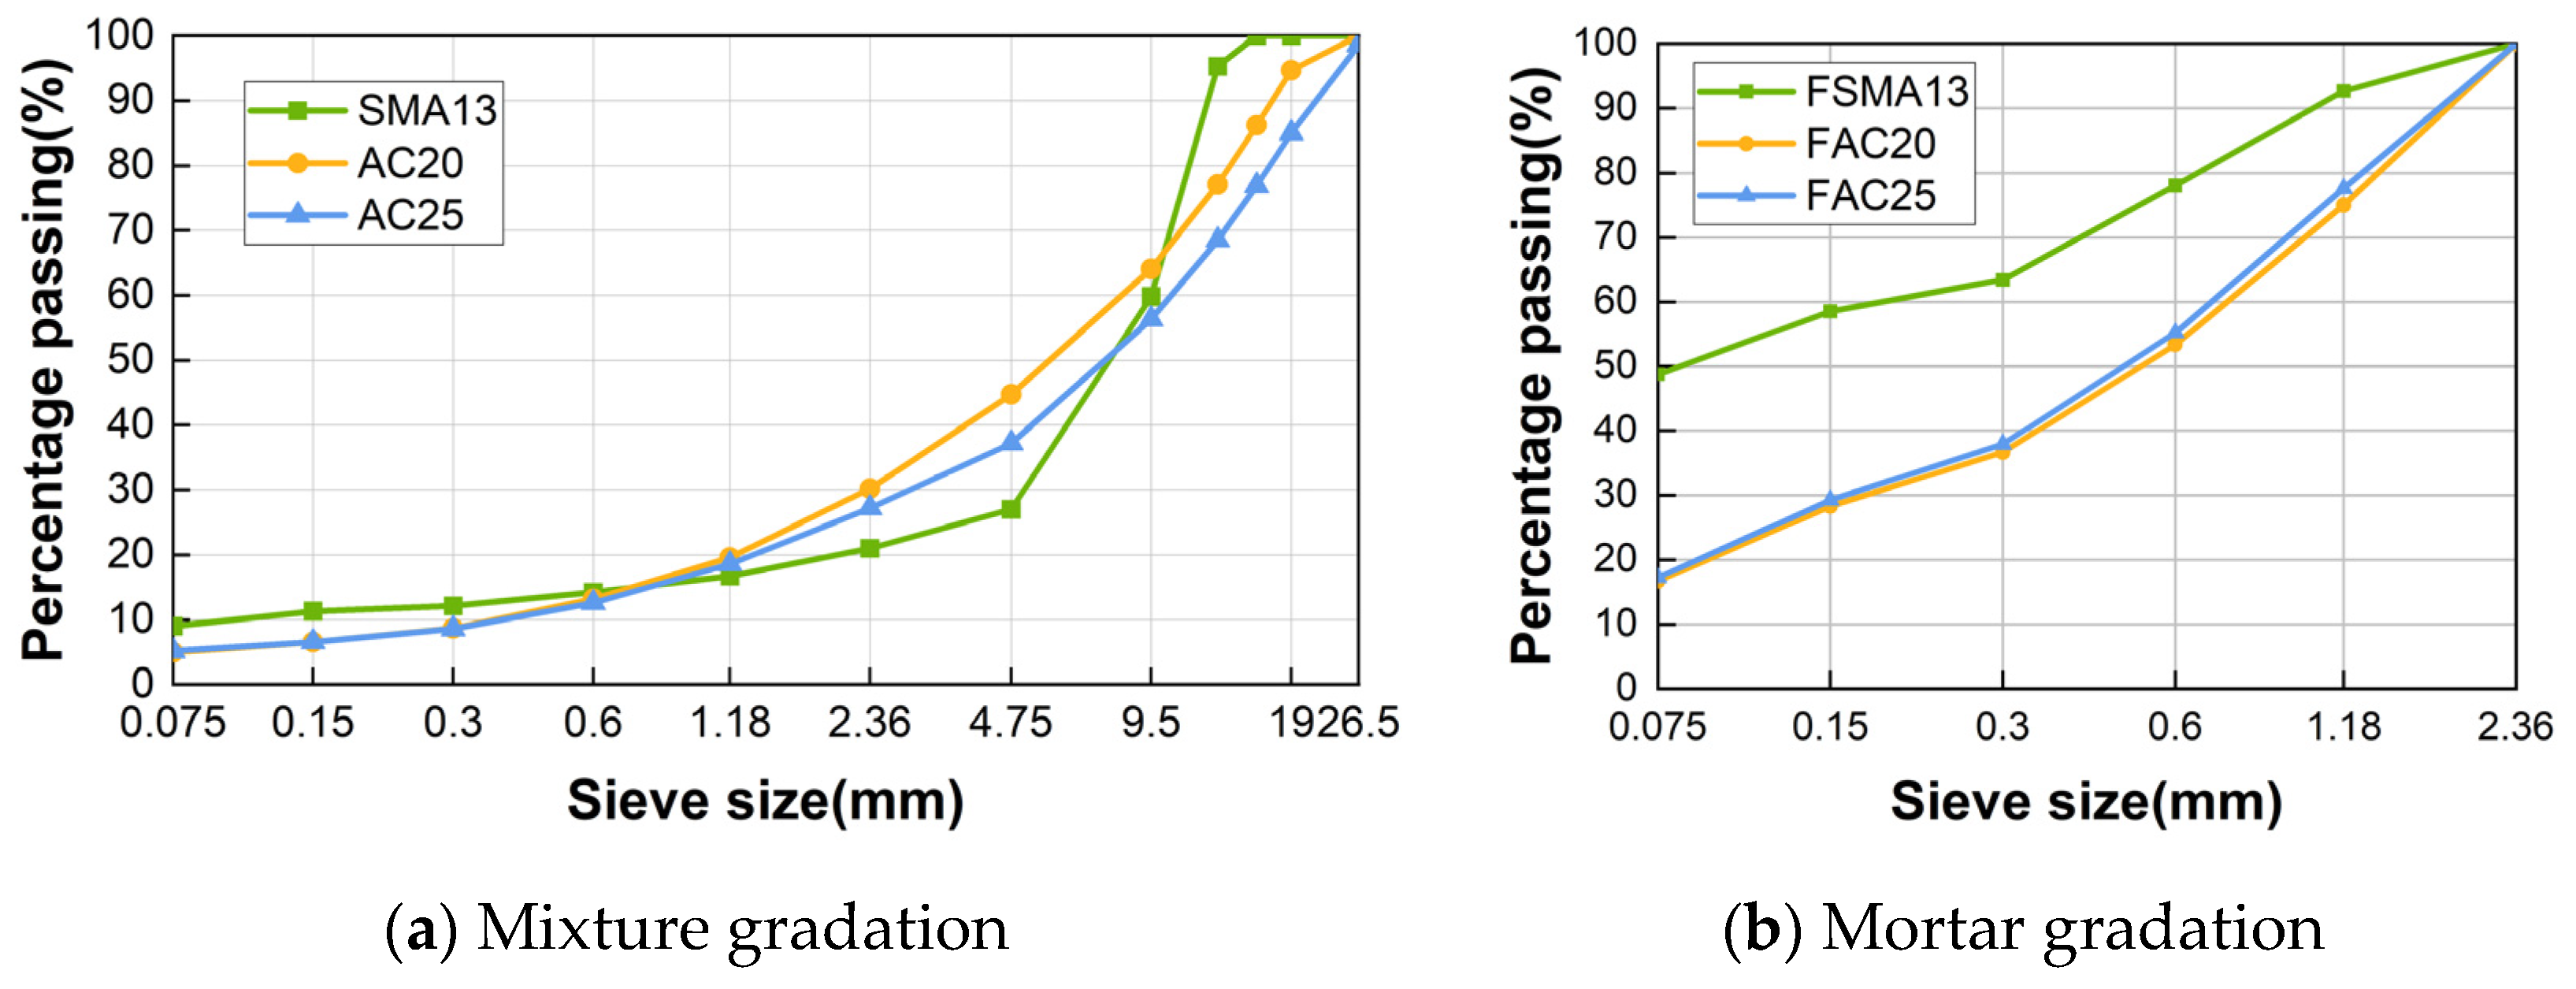
The gradation of the asphalt mortar was derived based on the equivalent passing percentage of the fine aggregate fraction (particle size < 2.36 mm) within the respective asphalt mixture. Figure 2 presents the corresponding gradation for the three mixtures. The optimal asphalt-aggregate ratio for the mortar was determined using the Specific Surface Area (SSA) method [51]. The total specific surface area ( S A ) of the aggregates in the mixture is calculated using Equation (1):
S A = P i × F A i
where
S A : Specific surface area of aggregates (m2/kg);
P i : Percentage passing of aggregates at sieve size i (%);
F A i : Surface area coefficient for aggregate size i , as given in Table 5 [52].
Subsequently, the asphalt-aggregate ratio for the mortar ( P a m o r t a r ) is calculated by apportioning the asphalt content based on the surface area contribution of the fine aggregates, as shown in Equation (2) [53,54,55]:
P a m o r t a r = S A < 2.36 / S A × P a / P 2.36
P a m o r t a r : Asphalt-aggregate ratio of asphalt mortar (%);
S A < 2.36 : Specific surface area of aggregates passing through 2.36 mm sieve (m2/kg);
P a : Optimum asphalt–aggregate ratio of the asphalt mixture (%);
P 2.36 : Percentage passing through the 2.36 mm sieve in the asphalt mixture (%).
The calculated composition parameters for the three mortar types are listed in Table 6. Notably, the asphalt content in the mortar is significantly higher than in the bulk mixture due to the extensive surface area of the fine particle fraction.

2.2.2. Experimental Testing Protocols

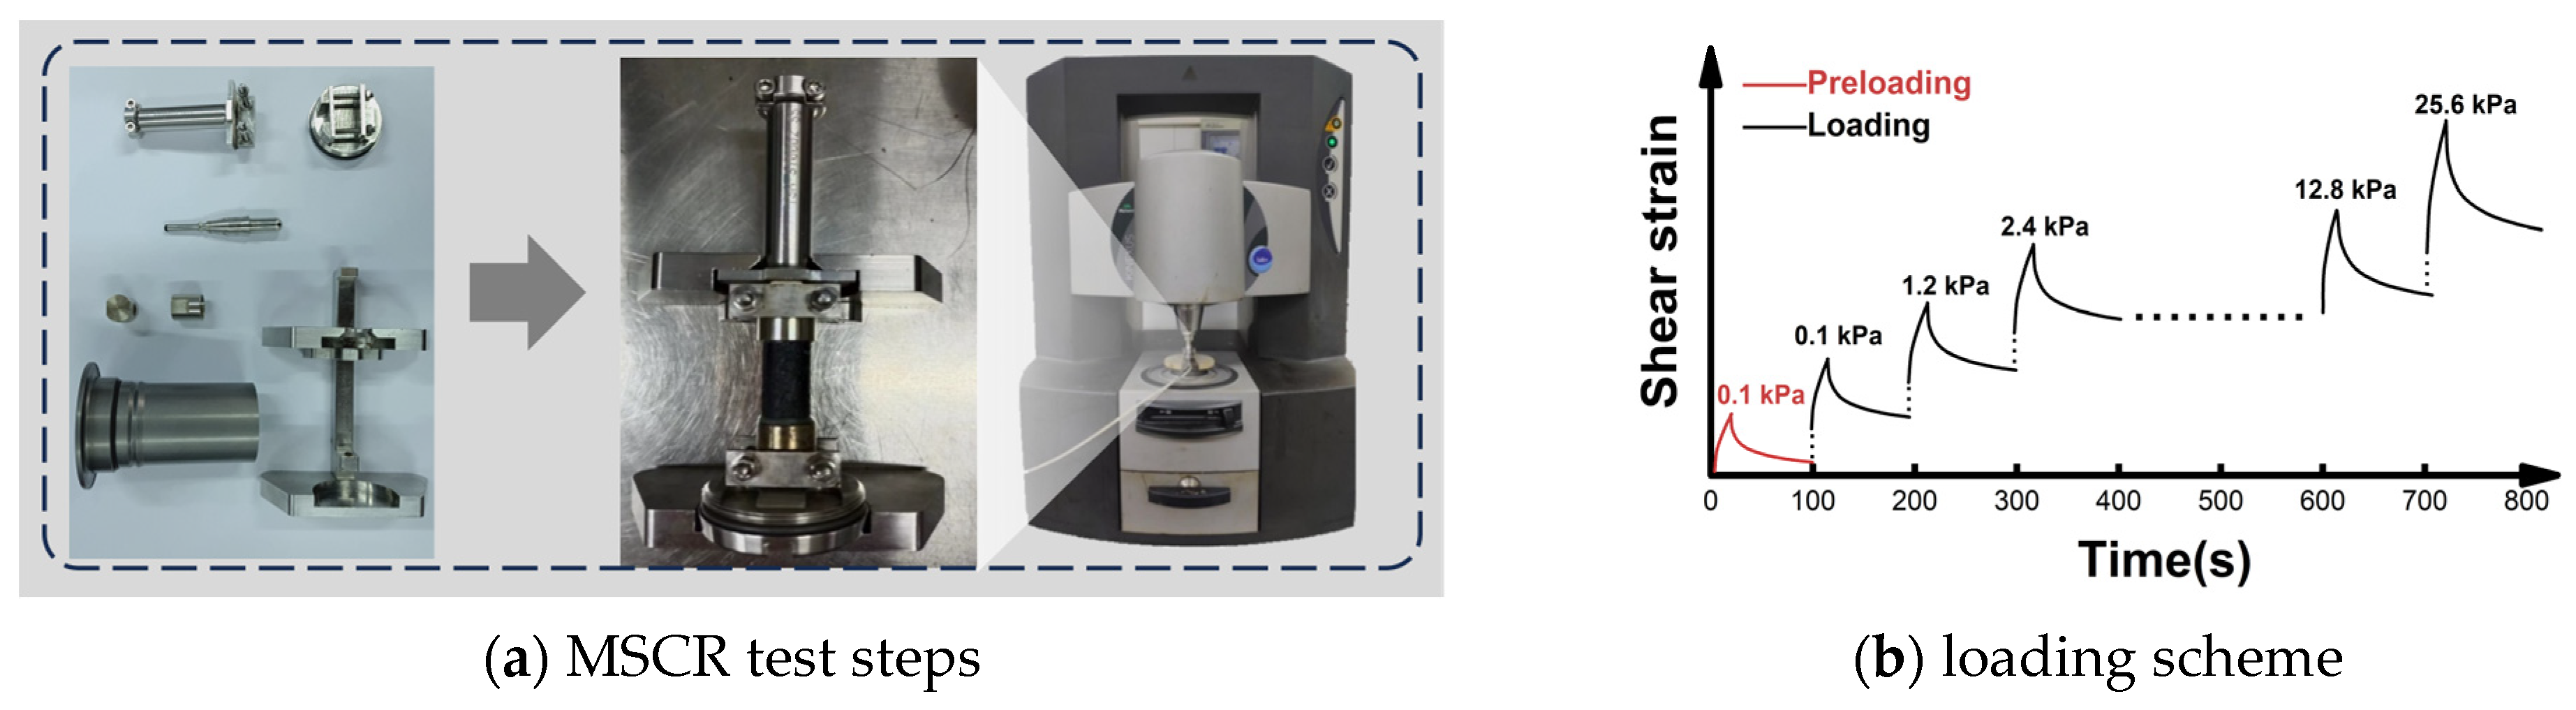
The MSCR test was conducted on the asphalt mortar using a Dynamic Shear Rheometer (DSR) in stress-controlled mode.
Figure 3 shows the test setup and loading scheme. According to previous studies [22,51], the test consisted of seven stress levels (0.1, 1.2, 2.4, 3.2, 6.4, 12.8, and 25.6 kPa), with an initial preloading phase at 0.1 kPa (red in Figure 3b). This stress range covers the transition from low-stress viscoelastic response to high-stress nonlinear deformation, which enables the effective characterization of the stress sensitivity of recoverable and dissipated energy [51]. Each level involved 10 loading–unloading cycles (1 s load followed by 9 s recovery), resulting in a total of 80 cycles.
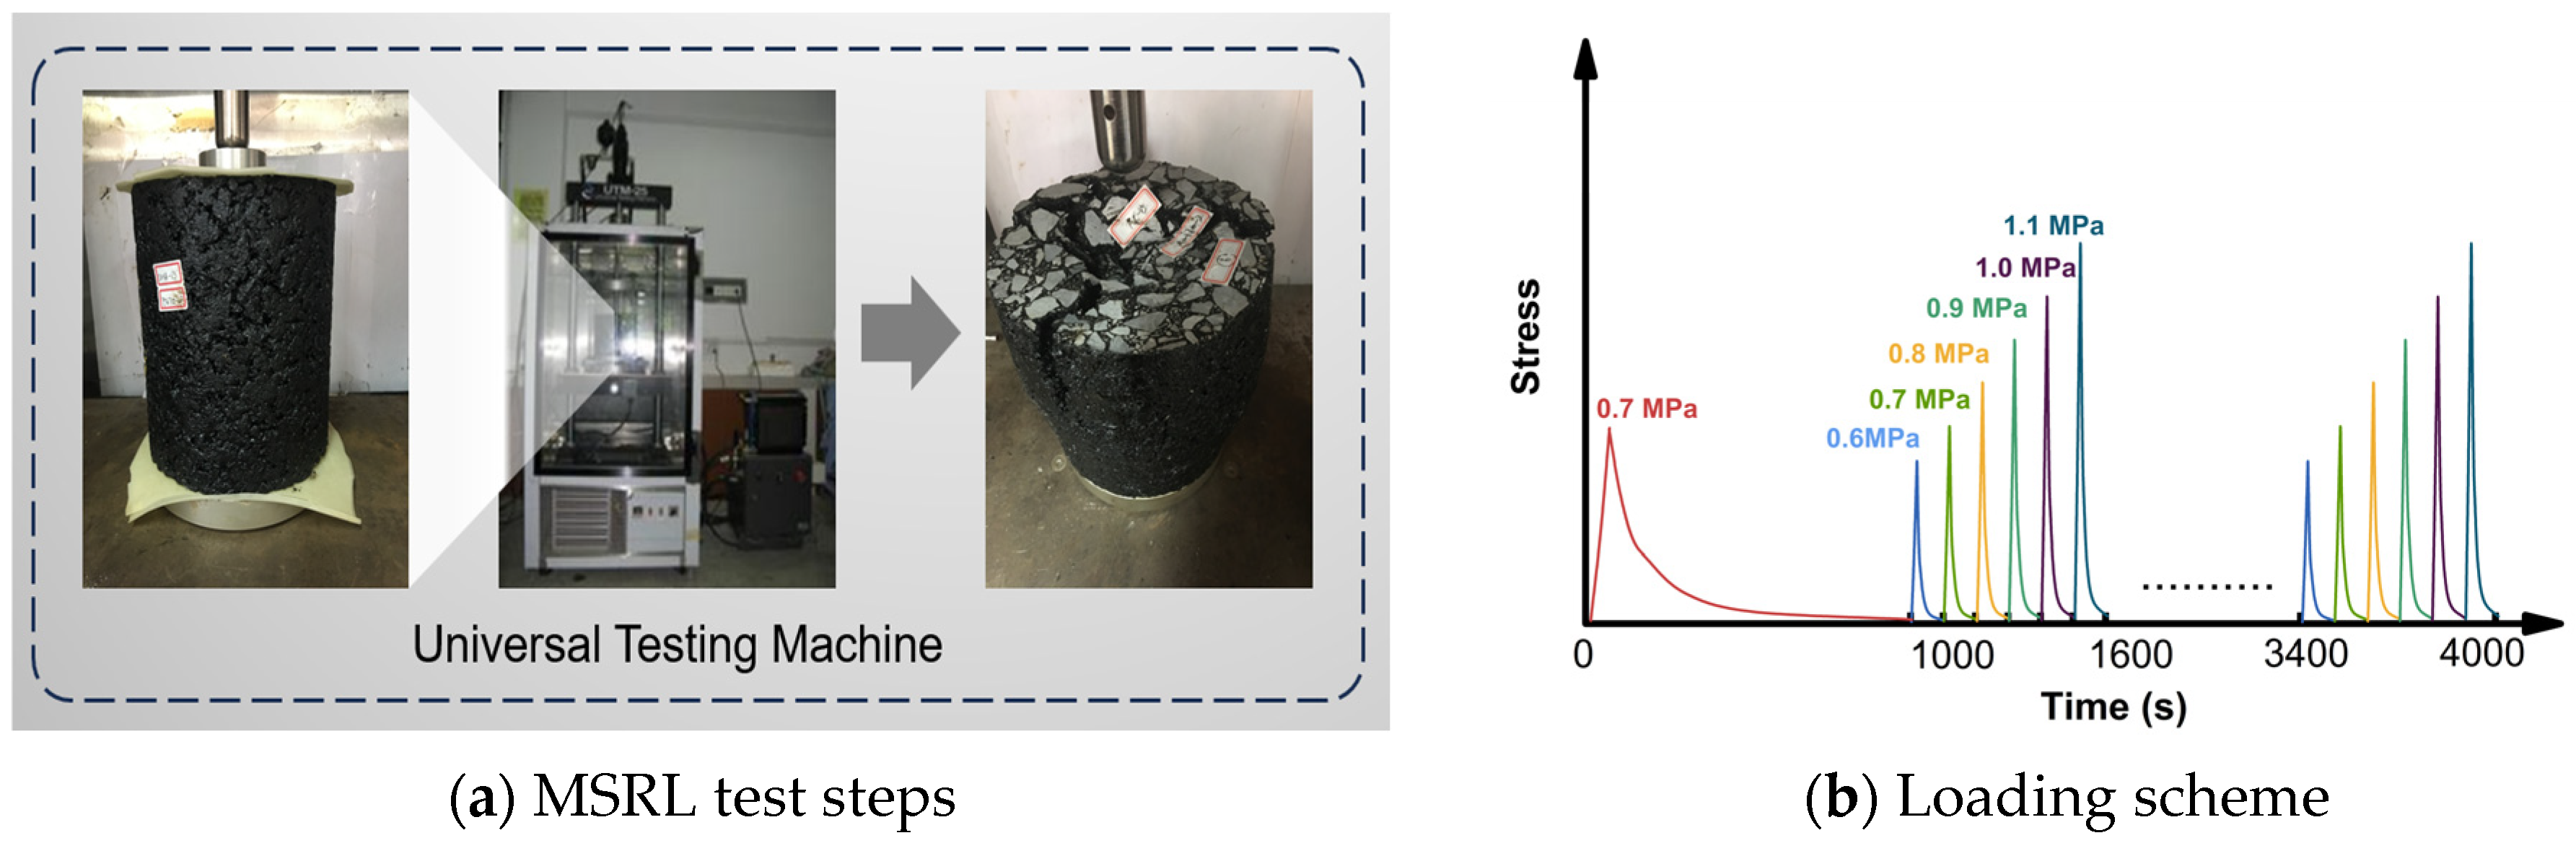
High-temperature creep behavior of the asphalt mixtures was assessed using the Multi-Sequence Repeated Loading (MSRL) test on a Universal Testing Machine (UTM). Figure 4 illustrates the test setup and loading pattern. Each cycle lasted 1 s, with 0.1 s loading and 0.9 s unloading. A preloading phase of 1000 cycles at 0.7 Mpa was applied (red curve in Figure 4b). Subsequently, six stress levels (0.6, 0.7, 0.8, 0.9, 1.0, and 1.1 Mpa) were applied sequentially, with 100 cycles at each level, which is consistent with the protocols reported in previous studies [56]. Thus, each specimen underwent one preloading stage followed by five loading cycles.

2.2.3. Energy-Based Evaluation Framework

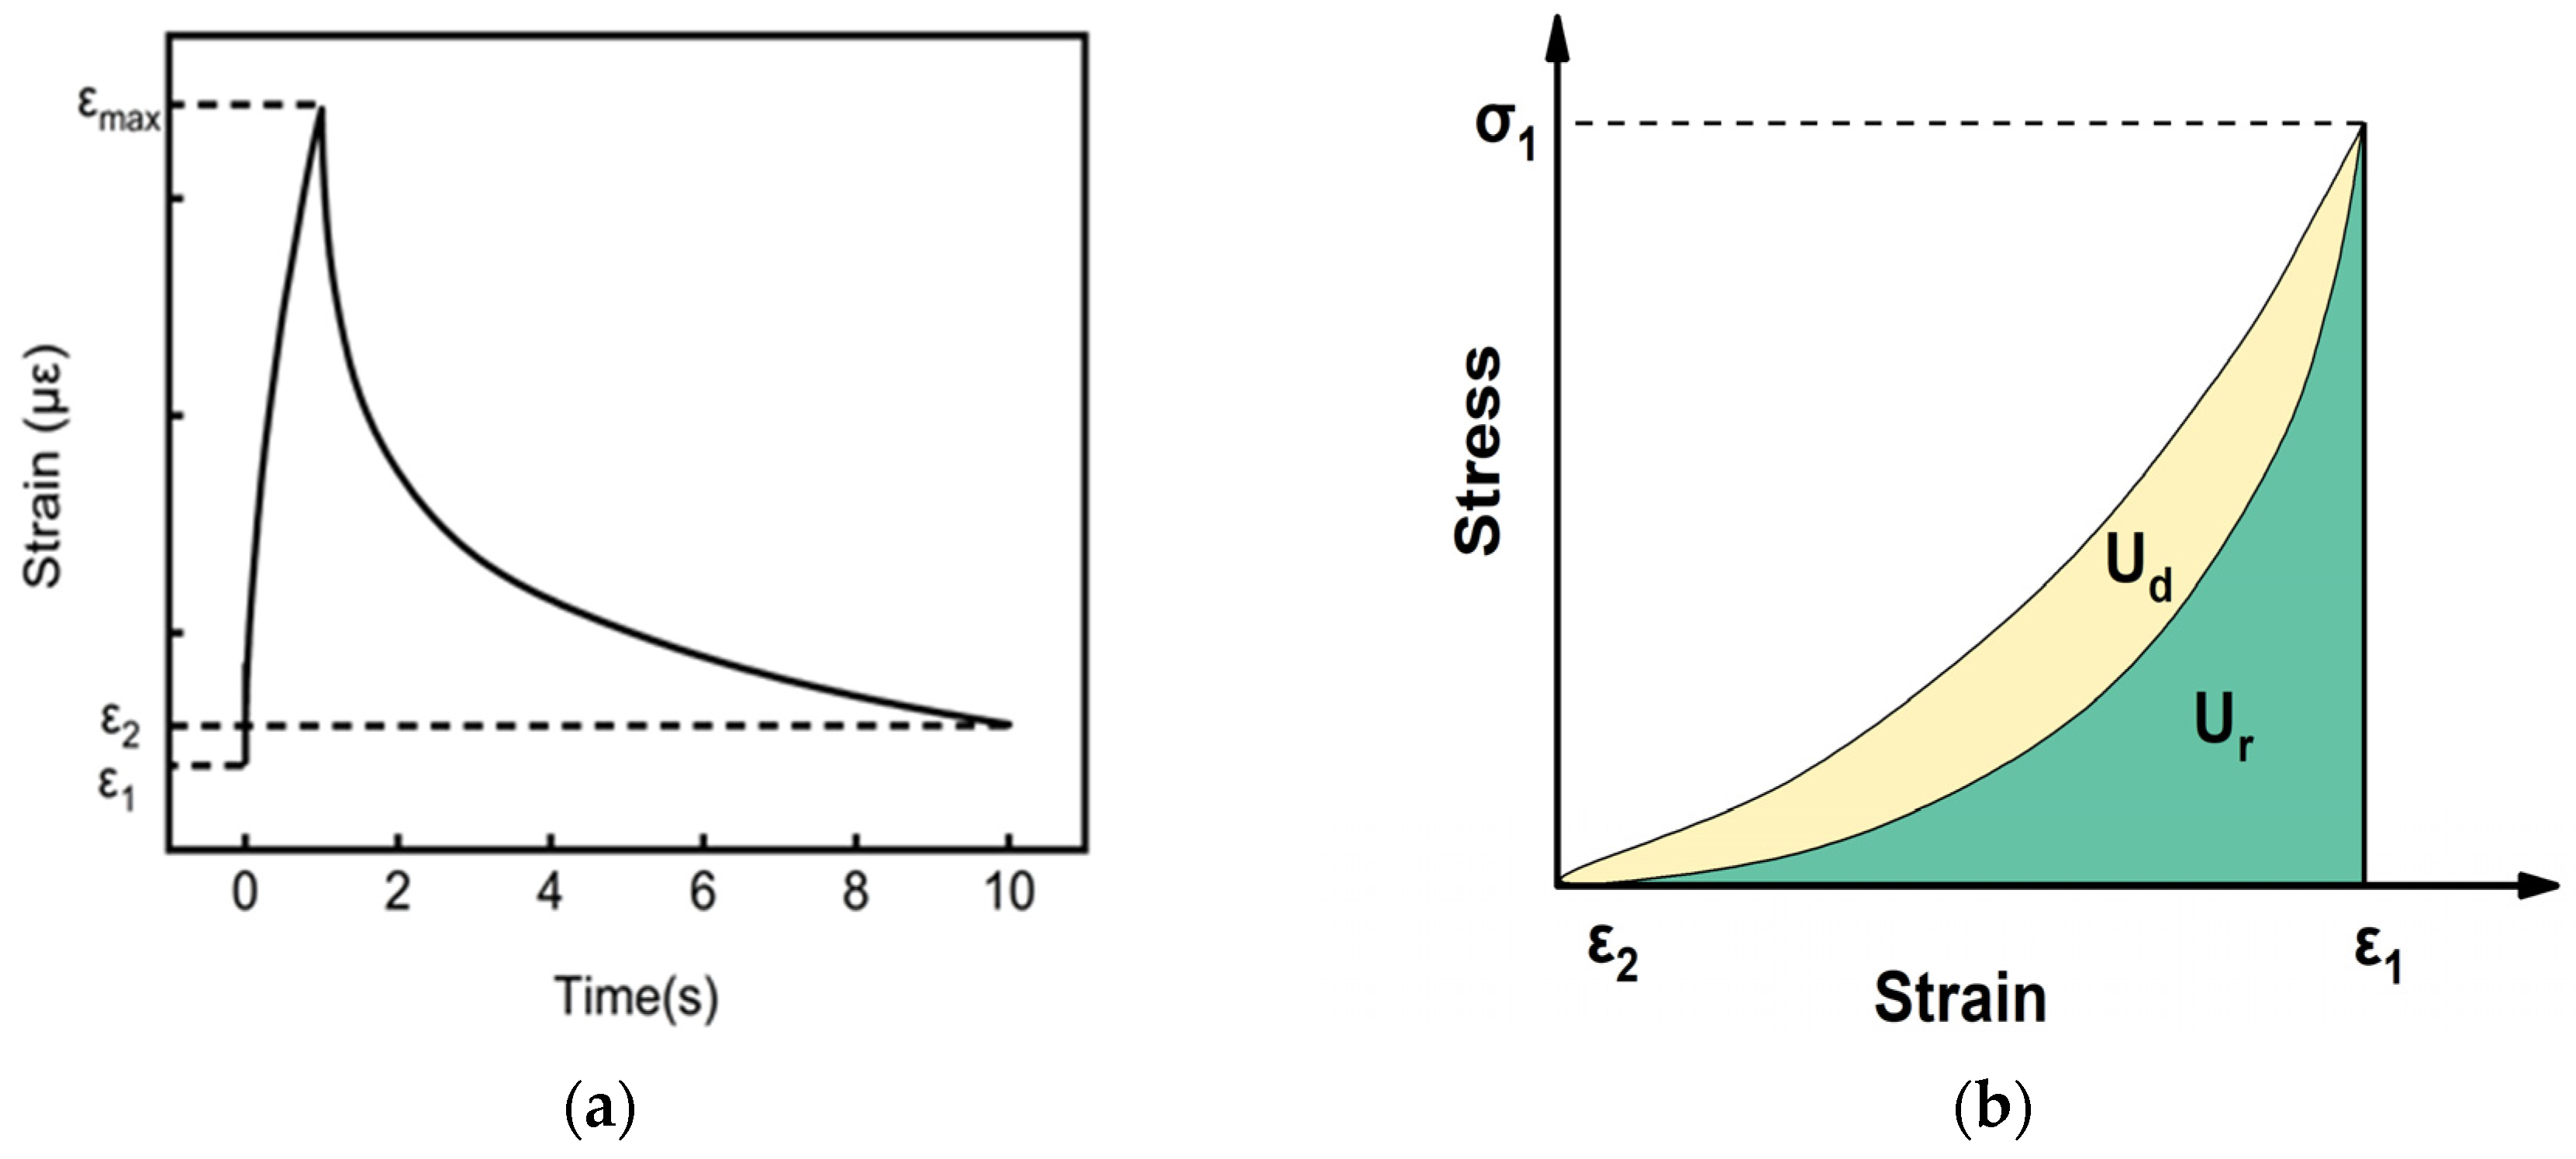
Both mortar and mixture specimens exhibit viscoelastic responses characterized by a combination of recoverable (elastic) and irrecoverable (viscous/plastic) deformation. This study quantifies this behavior using three energy indicators: total input energy ( U ), recoverable energy ( U r ), and dissipated energy ( U d ). For asphalt mortar (MSCR test), as shown in Figure 5a, the deformation does not fully recover due to the presence of permanent (plastic) deformation. The indicators are defined based on the shear stress–strain curve of a single cycle:
U m o r t a r = σ × ( ε m a x ε 1 )
U r m o r t a r = σ × ( ε m a x ε 2 )
U d m o r t a r = σ × ( ε 2 ε 1 )
η m o r t a r = U r m o r t a r U m o r t a r
where:
U m o r t a r : Input energy of asphalt mortar;
U r m o r t a r : Recoverable energy;
U d m o r t a r : Dissipated energy;
η m o r t a r : Recoverable energy coefficient;
σ: Applied stress;
ε m a x : Peak strain;
ε 1 : Initial strain;
ε 2 : Final strain after recovery.
For asphalt mixtures (MSRL test) as shown in Figure 5b, the total input energy is the area under the loading portion of the stress–strain curve. The recoverable energy is represented by the area under the unloading curve (green), while the difference between them (yellow) corresponds to the dissipated energy. The higher the recoverable energy and recoverable energy coefficient, the lower the dissipated energy, and the stronger the resistance to high-temperature permanent deformation. The indicators are calculated from the integral of the stress–strain hysteresis loop:
U m i x = 0 ε 1 σ d ε
U r m i x = ε 2 ε 1 σ d ε
U d m i x = U U r
η m i x = U r m i x U m i x
where:
U m i x : Input energy (sum of green and yellow areas);
U r m i x : Recoverable energy (green area);
U d m i x : Dissipated energy (yellow area);
σ 1 : Maximum stress value during the loading phase;
ε 1 : Maximum strain during loading;
ε 2 : Final strain after unloading;
η m i x : Recoverable energy coefficient.
To analyze the effect of loading stress on energy indicators, the last five cycles at each stress level were averaged, as early-stage fluctuations tend to diminish in the later cycles. This approach provides a more stable and representative assessment of the material’s energy response under repeated loading.
It should be noted that this study aims to investigate the variation in energy indicators of mortar during permanent deformation and to correlate these indicators with those of asphalt mixtures. Therefore, six stress levels in the MSCR test (1.2, 2.4, 3.2, 6.4, 12.8, and 25.6 kPa) were selected, corresponding to the six stress levels in the MSRL test (0.6, 0.7, 0.8, 0.9, 1.0, and 1.1 Mpa), so as to establish a correspondence between the energy indicators of asphalt mixtures and mortars.
Potential uncertainty and variability should be considered when interpreting the energy indicators. Such variability may arise from slight differences in mortar and mixture preparation, temperature control, and the nonlinear viscoelastic response of asphalt materials under high stress or high temperature. To reduce these effects, the energy indicators were calculated using the averaged values from the stable loading cycles, and abnormal data were screened before model development.

3. Experimental Result Analysis

3.1. Influence of Applied Stress on Energy Indicators

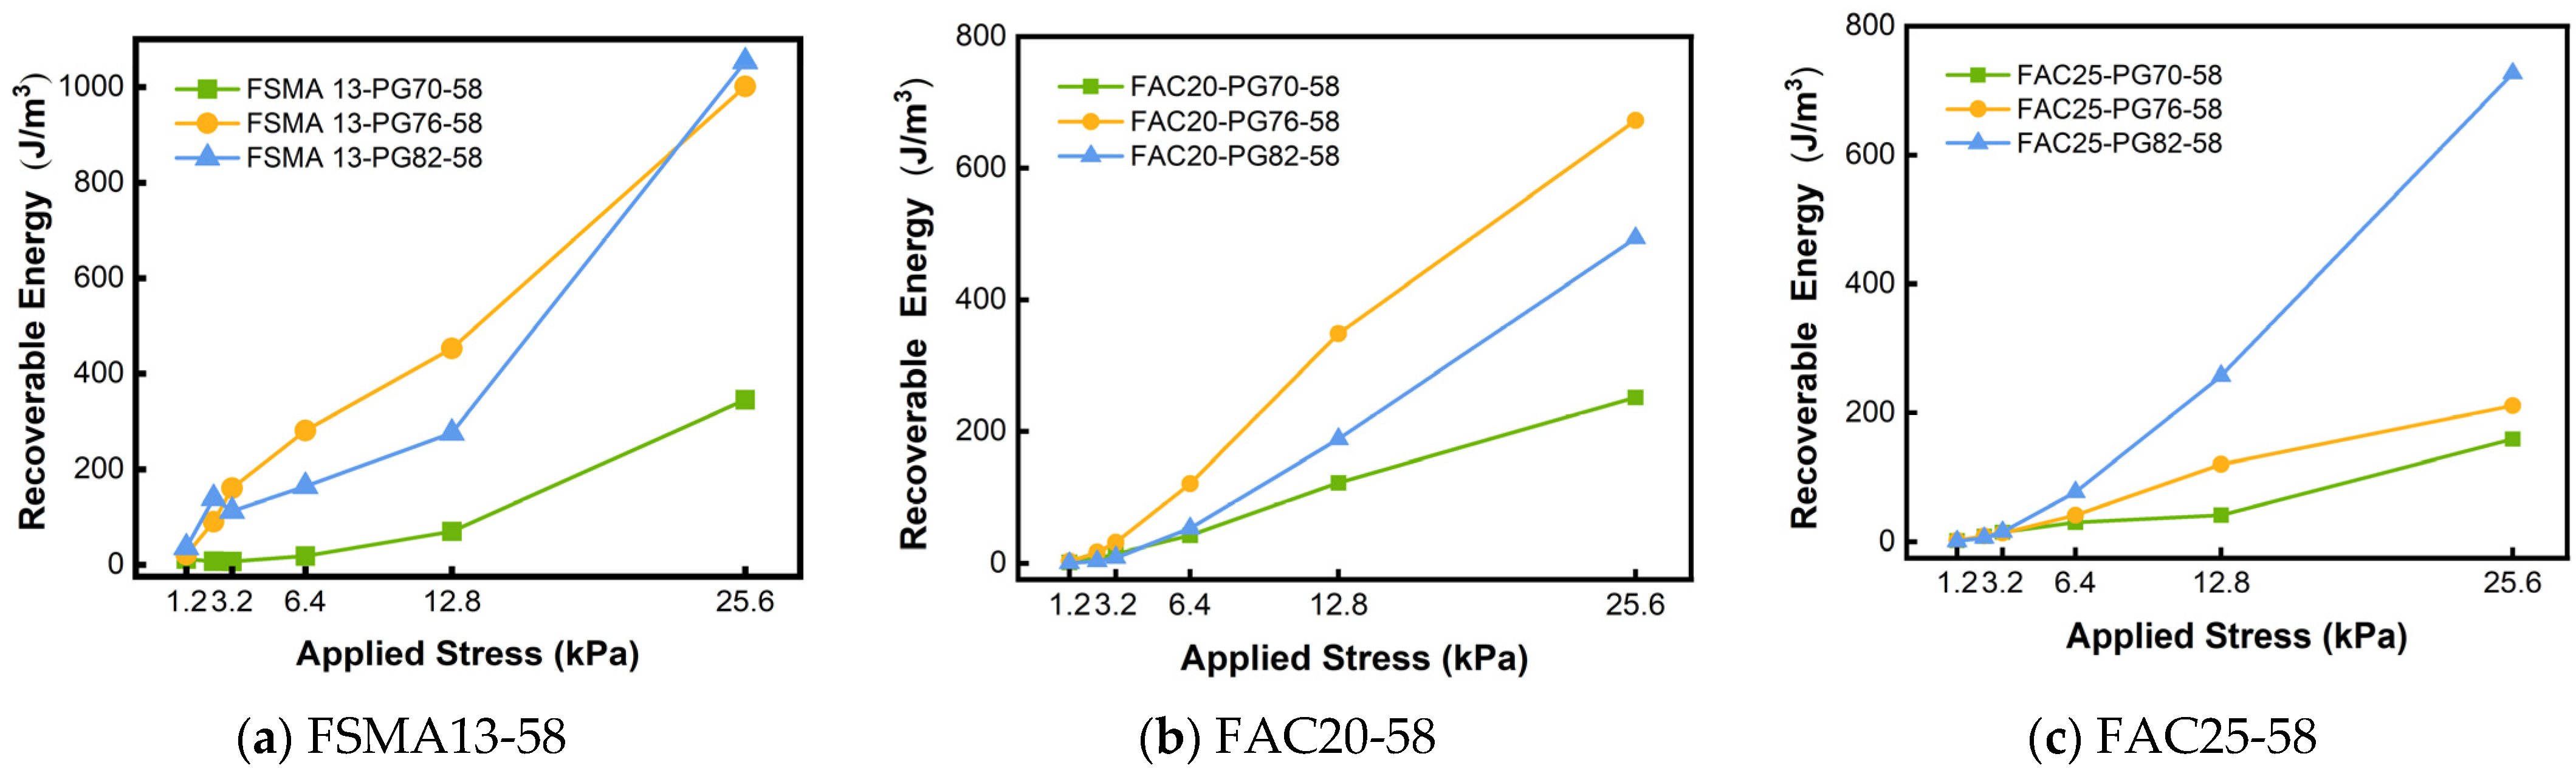
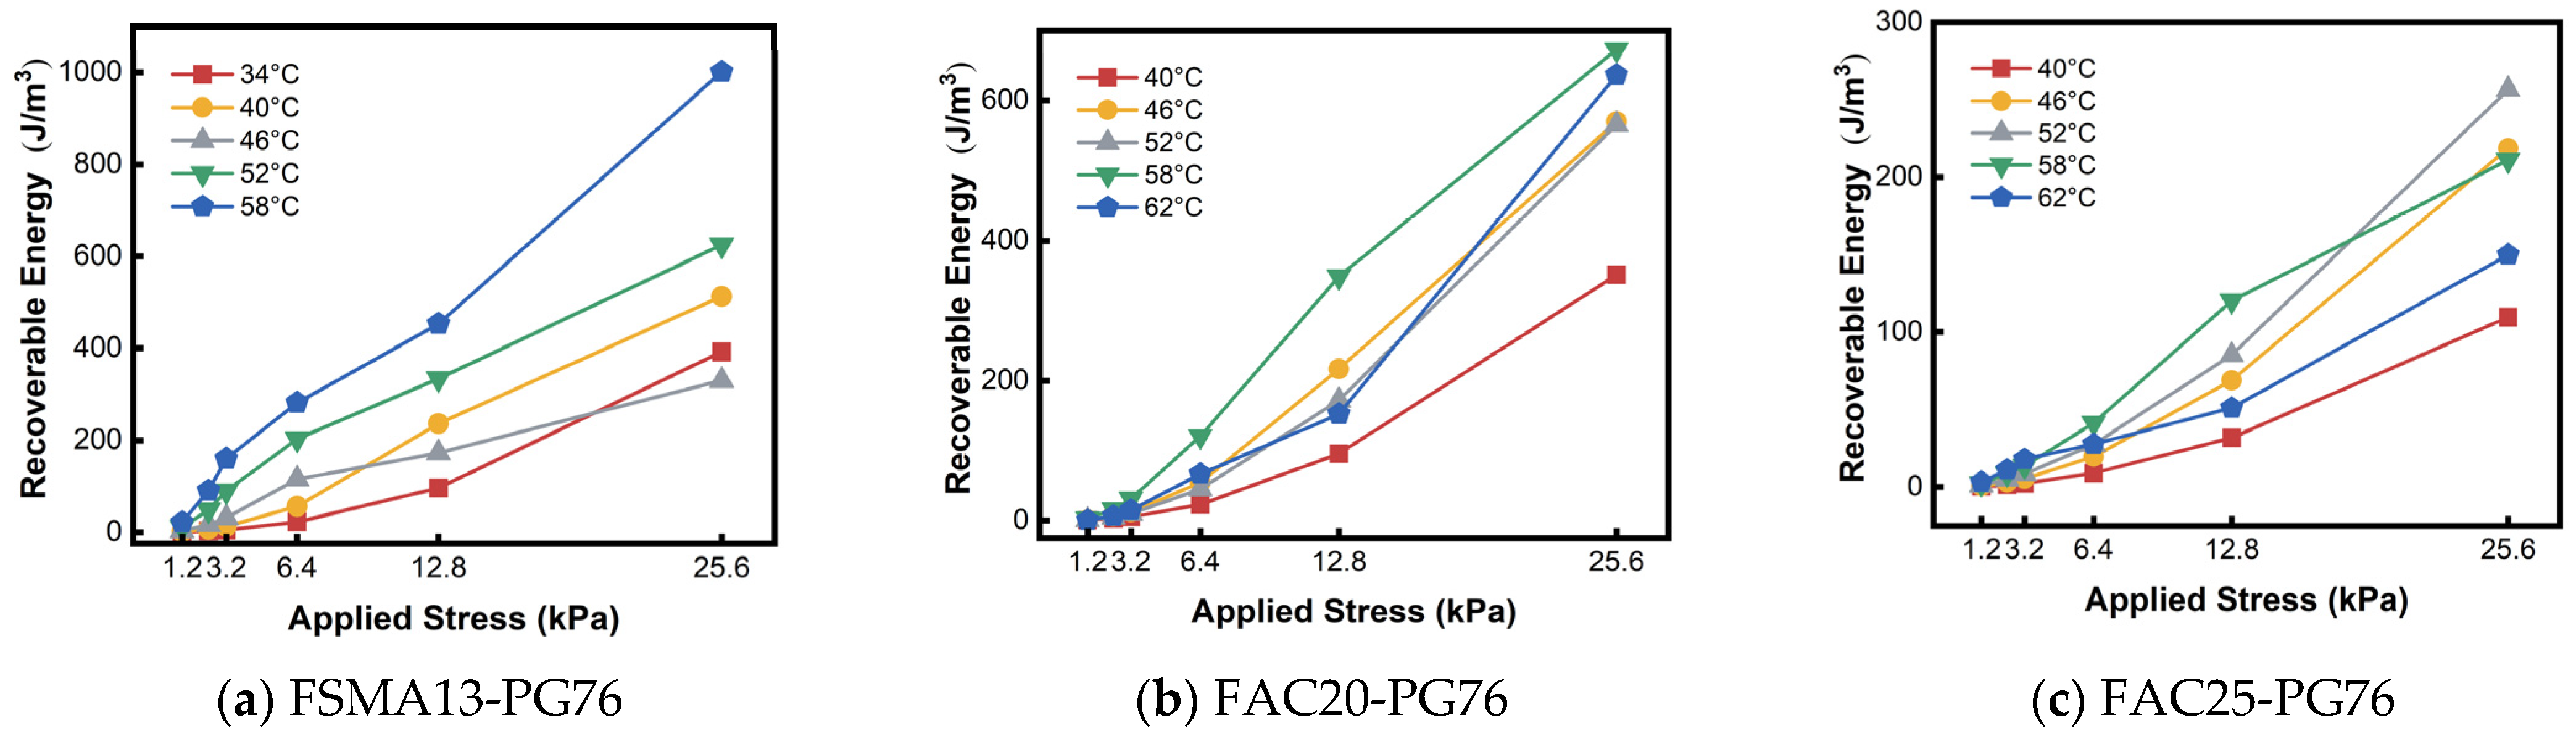
The evolution of recoverable energy ( U r m o r t a r ) as a function of applied stress is depicted in Figure 6. A distinct positive correlation is observed across all specimens: as applied stress increases, U r m o r t a r rises, with the rate of growth accelerating at higher stress levels. This trend aligns with physical expectations, as higher stress inputs induce greater viscoelastic deformation, thereby increasing the potential for elastic recovery during the unloading phase. Notably, the magnitude of energy recovery is heavily dependent on the gradation type. The finer gradation (FSMA13) exhibits a significantly more substantial increase in recoverable energy compared to the coarser FAC20 and FAC25 mortars.
The pronounced stress sensitivity observed in the finer gradation (FSMA13) can be attributed to the micromechanical interaction between the asphalt binder and the aggregate surface. This interpretation is supported by the concept of binder immobilization at the aggregate–binder interface [57,58]. In asphalt mortar, part of the binder can be physically adsorbed or constrained near the mineral surface, forming an interfacial or structural binder phase that differs from free binder in mobility and rheological response. Finer gradations provide a larger specific surface area and therefore increase the proportion of such immobilized binder. As a result, FSMA13 can store more recoverable energy under moderate stress because of stronger binder–aggregate interaction, but it may also exhibit more pronounced nonlinear deformation once the applied stress exceeds the stability of the interfacial binder network.
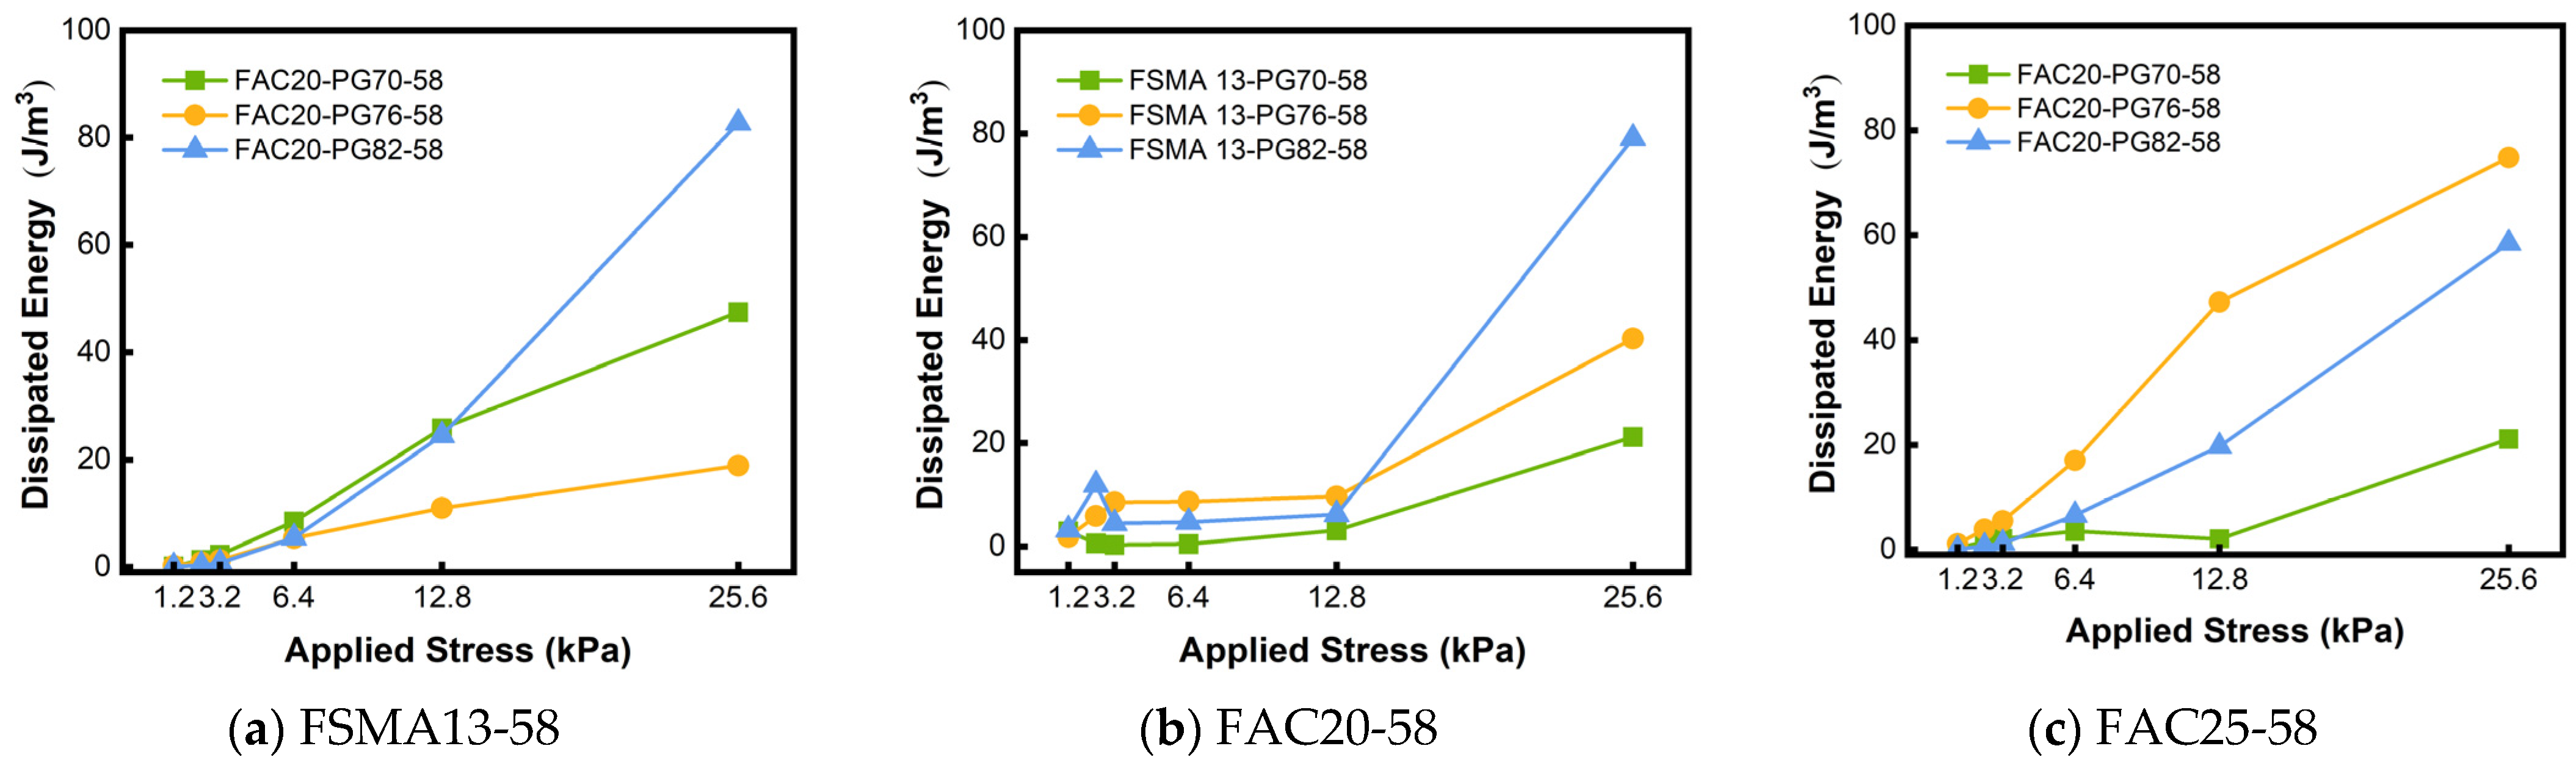
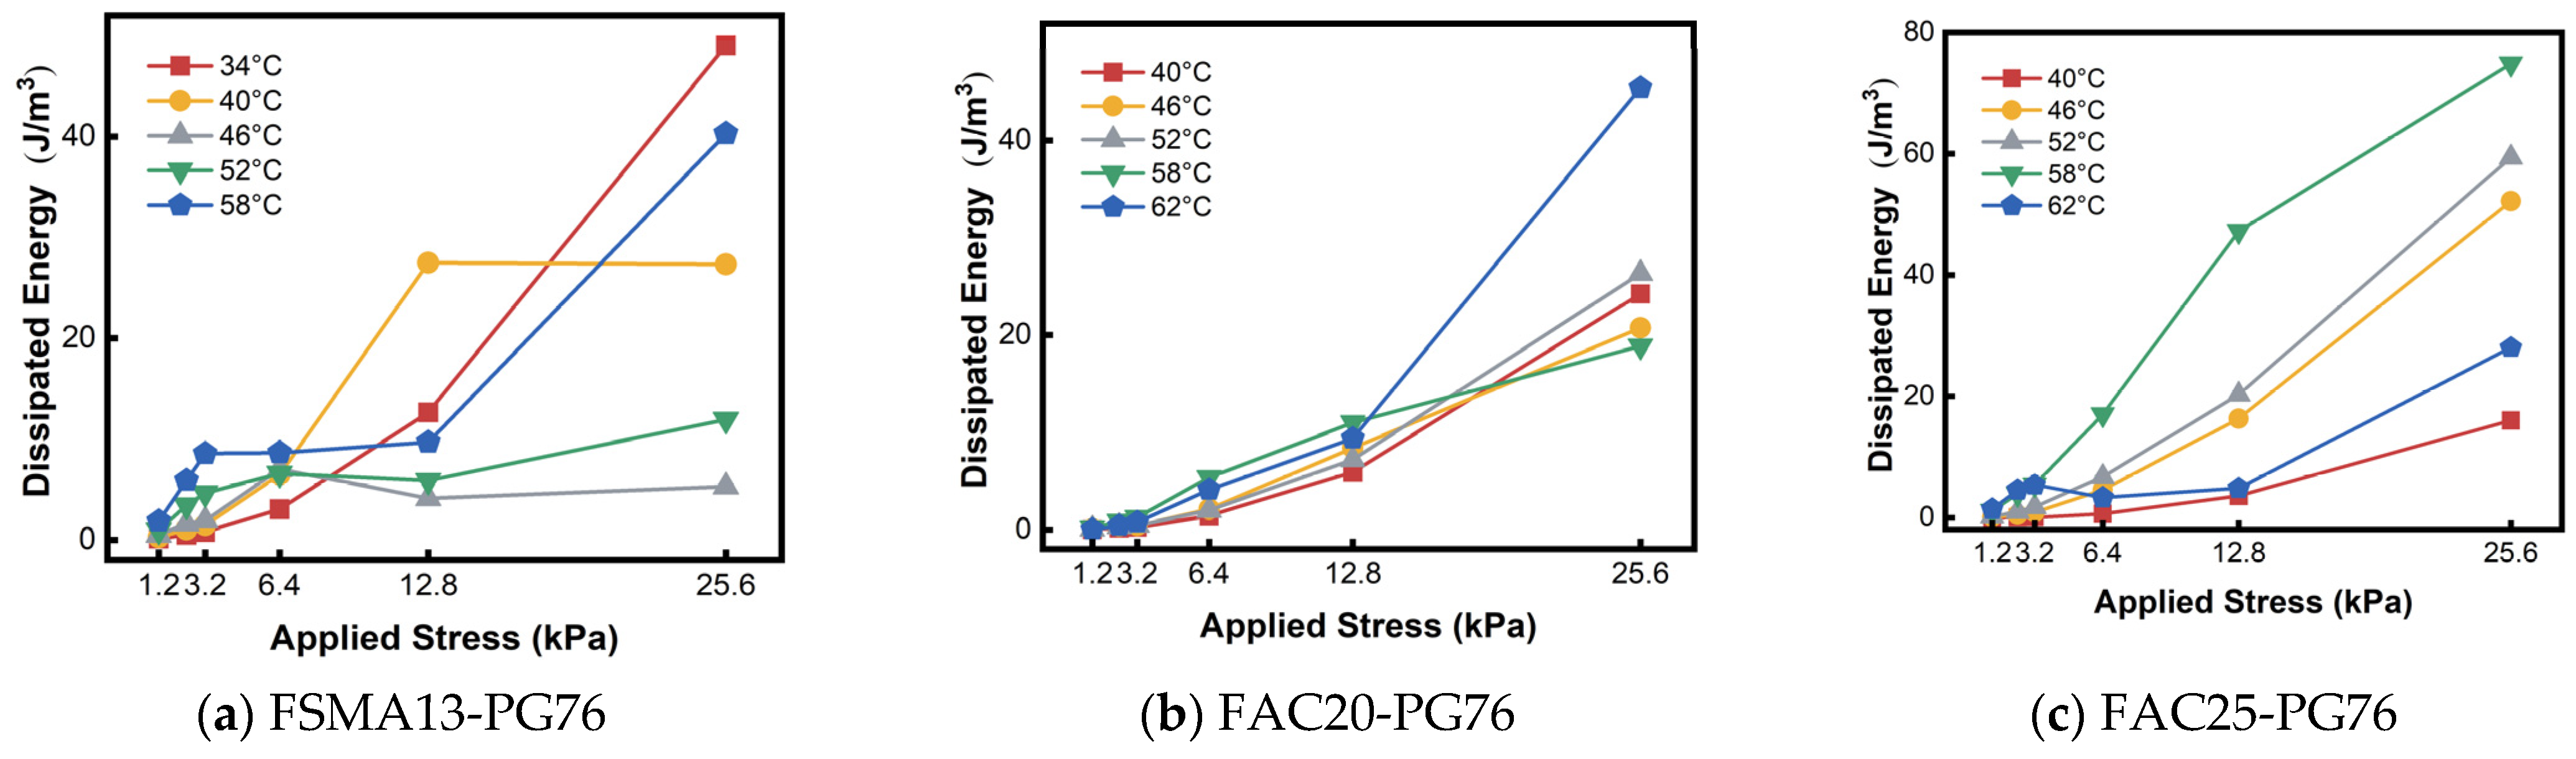
Figure 7 illustrates the relationship between applied stress and dissipated energy (U_(d-mortar)). Similar to recoverable energy, dissipated energy increases with stress. However, the response of FSMA13 is non-linear; a sharp increase is observed when stress rises from 12.8 kPa to 25.6 kPa, indicative of significant internal plastic deformation. In contrast, FAC20 and FAC25 display a more gradual increase, suggesting that their coarser aggregate structures offer greater resistance to shear flow.
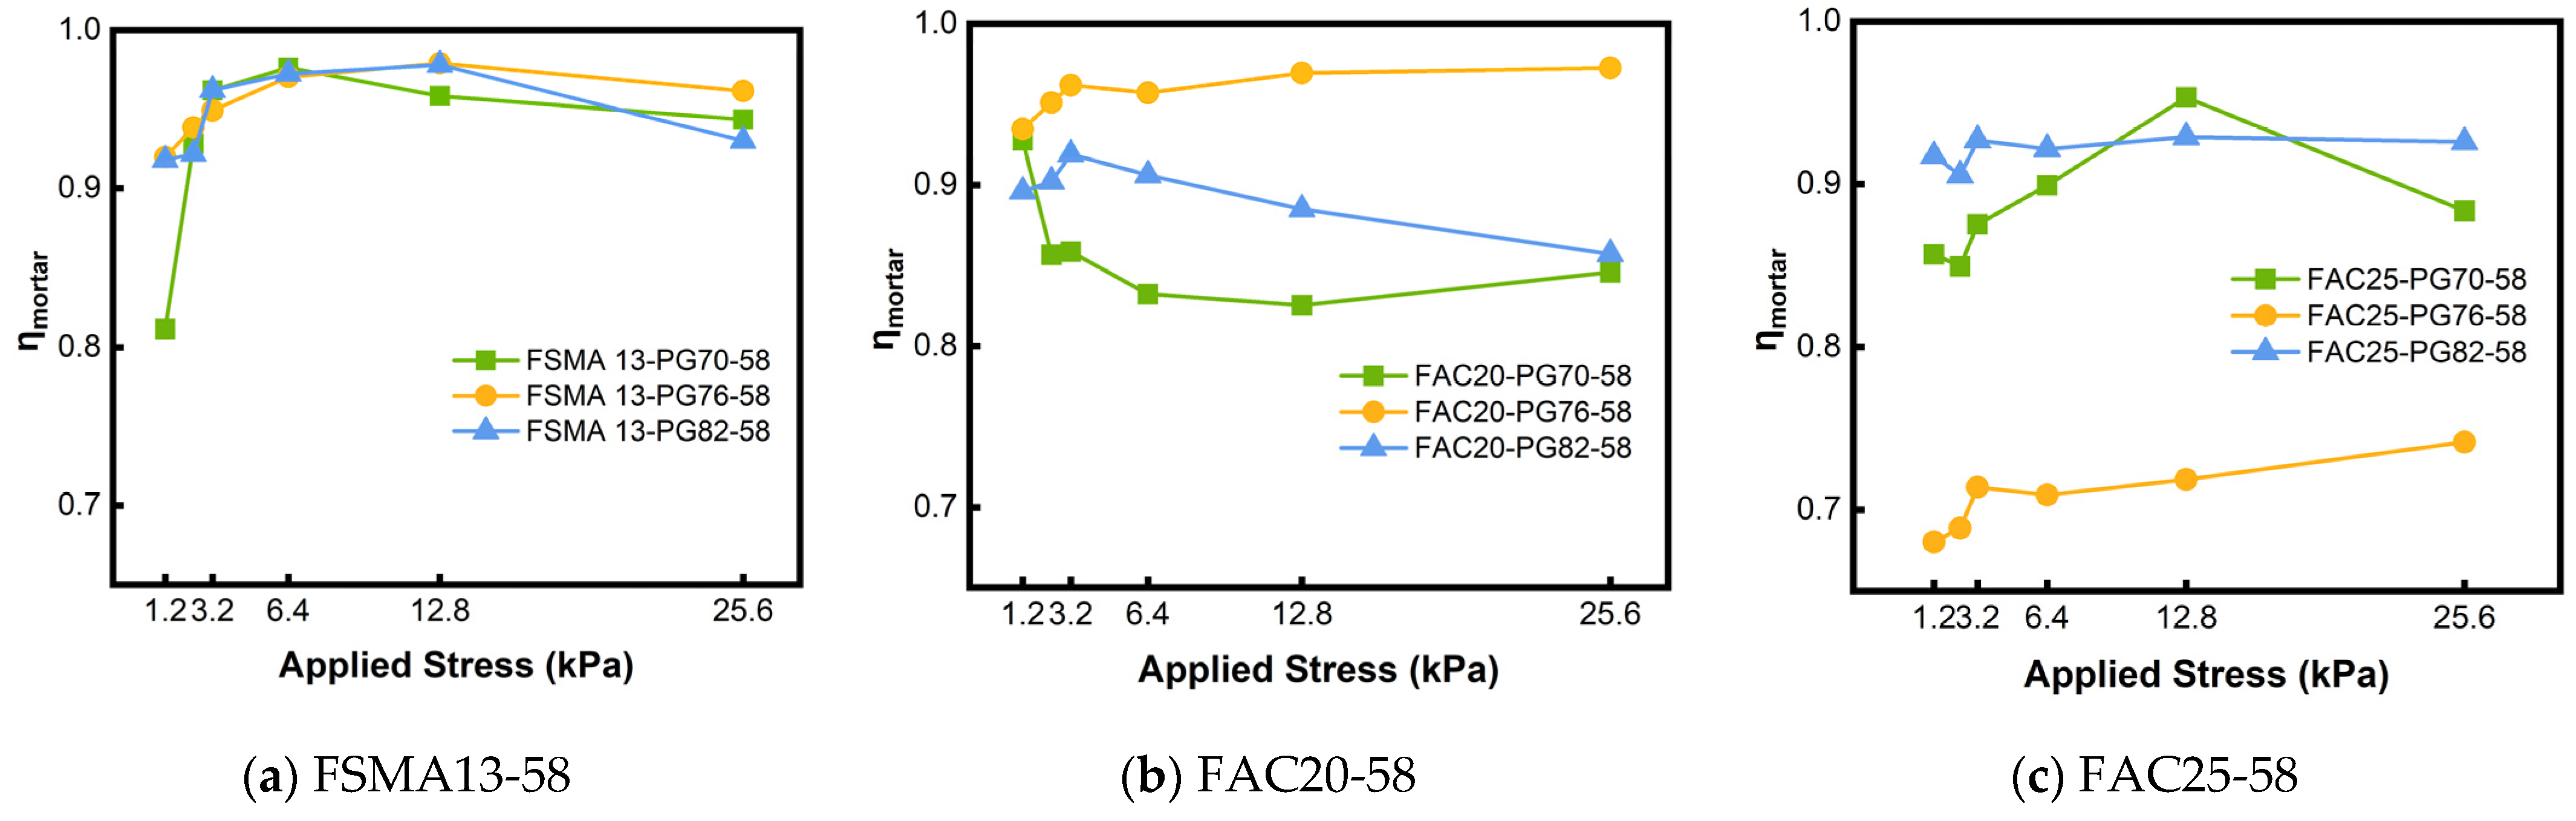
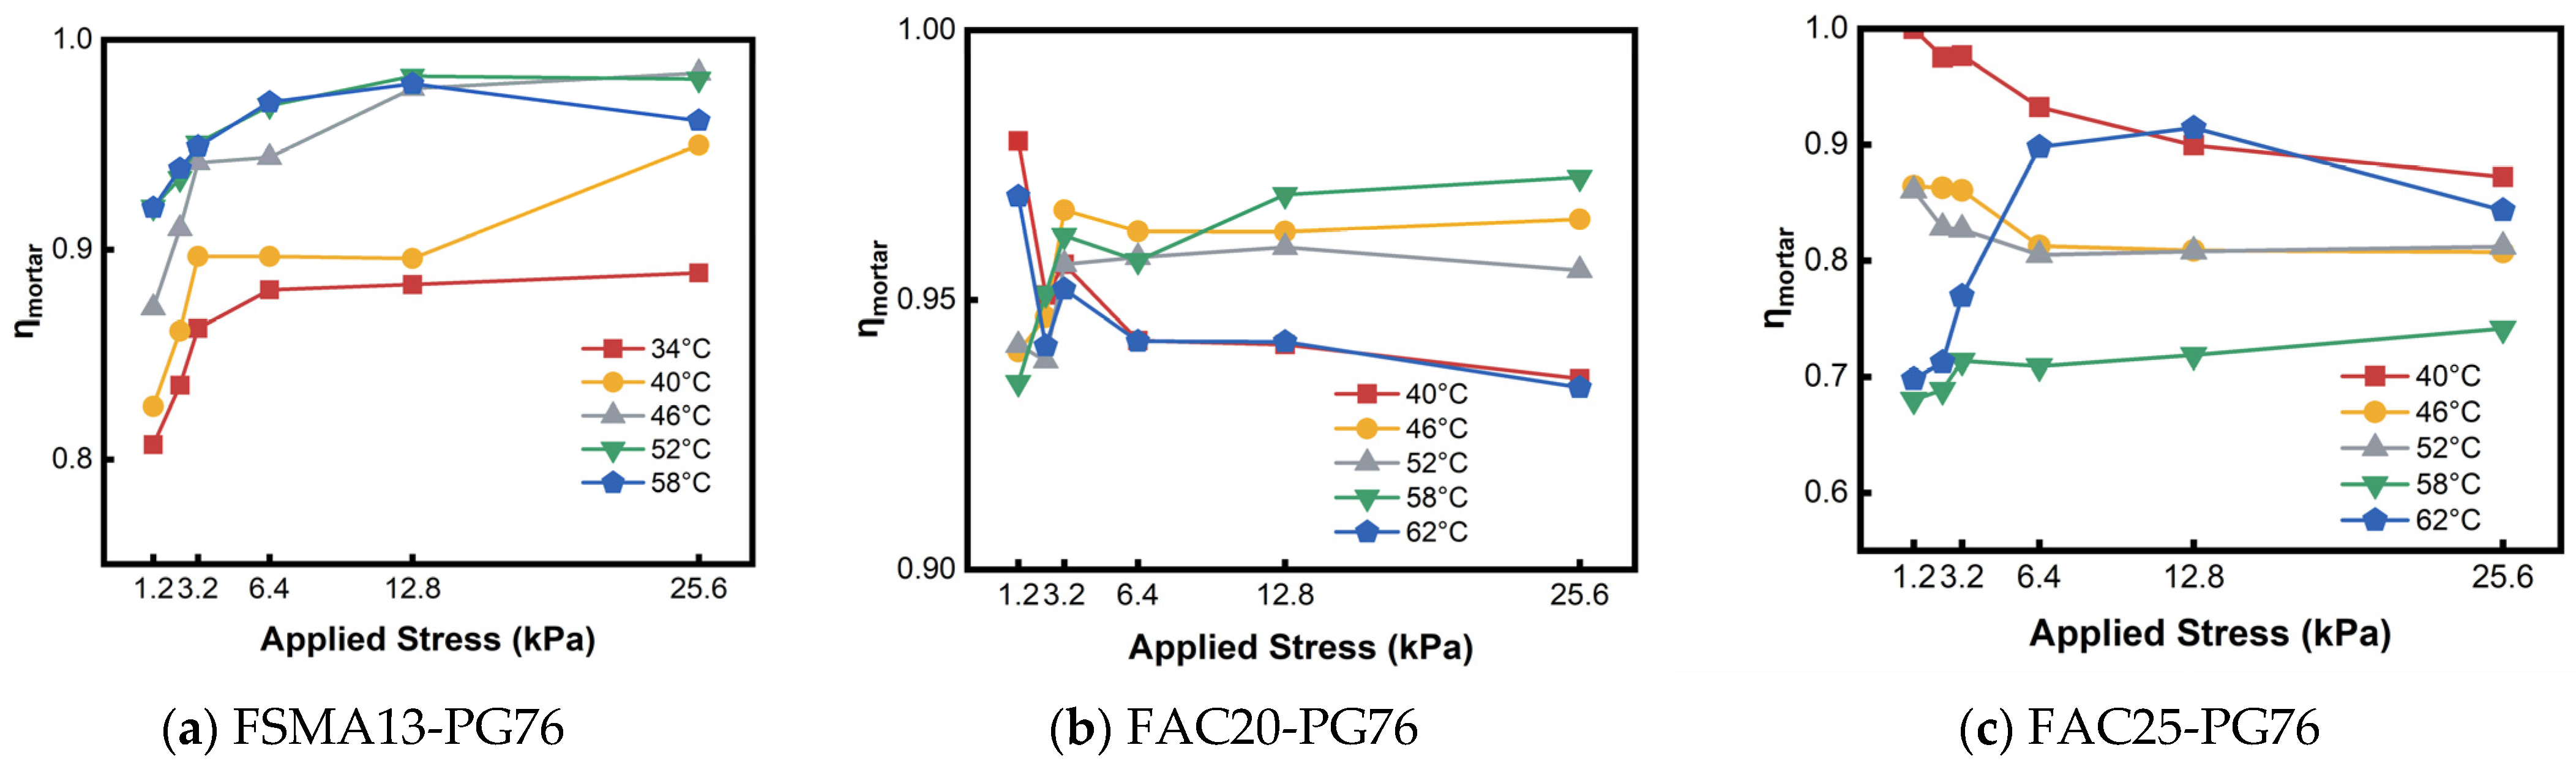
The recoverable energy coefficient (ηmortar), presented in Figure 8, provides further insight into structural integrity. For FSMA13, ηmortar initially increases but drops sharply at 12.8 kPa, confirming that high stress levels compromise the structural stability of the fine-aggregate matrix. Conversely, FAC20 and FAC25 exhibit more stable responses, although slight fluctuations are observed due to the heterogeneity introduced by larger particles.

3.2. Influence of Asphalt Mortar Gradation on Energy Indicators

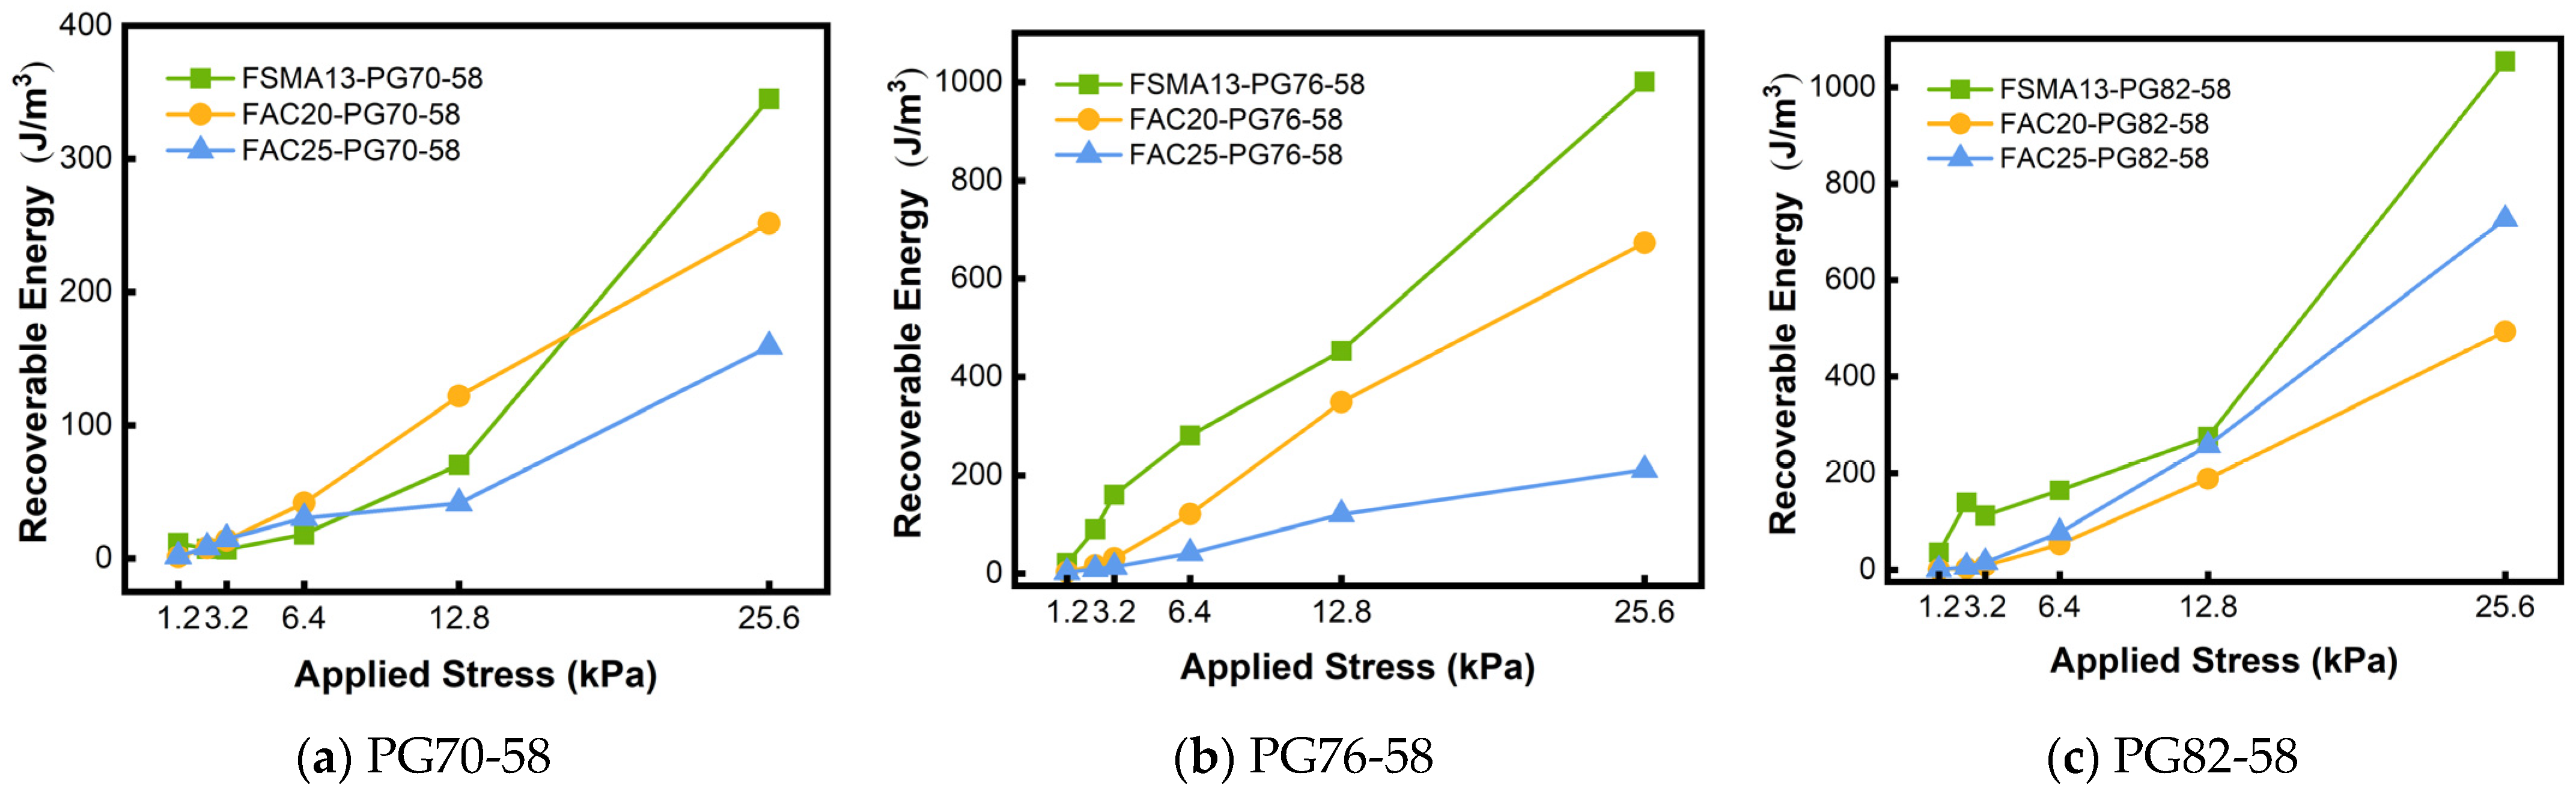
Aggregate gradation dictates the particle packing and internal stress distribution within the mortar. As shown in Figure 9, at low stress levels, the influence of gradation on recoverable energy is minimal, with all mortar types exhibiting similar values. However, distinct divergence occurs as stress increases. The FSMA13 specimens consistently demonstrate the highest sensitivity to load, a trend that holds true across all three binder types (PG70, PG76, and PG82). This reinforces the observation that finer particle skeletons facilitate greater elastic storage capacity but are more responsive to stress variations.
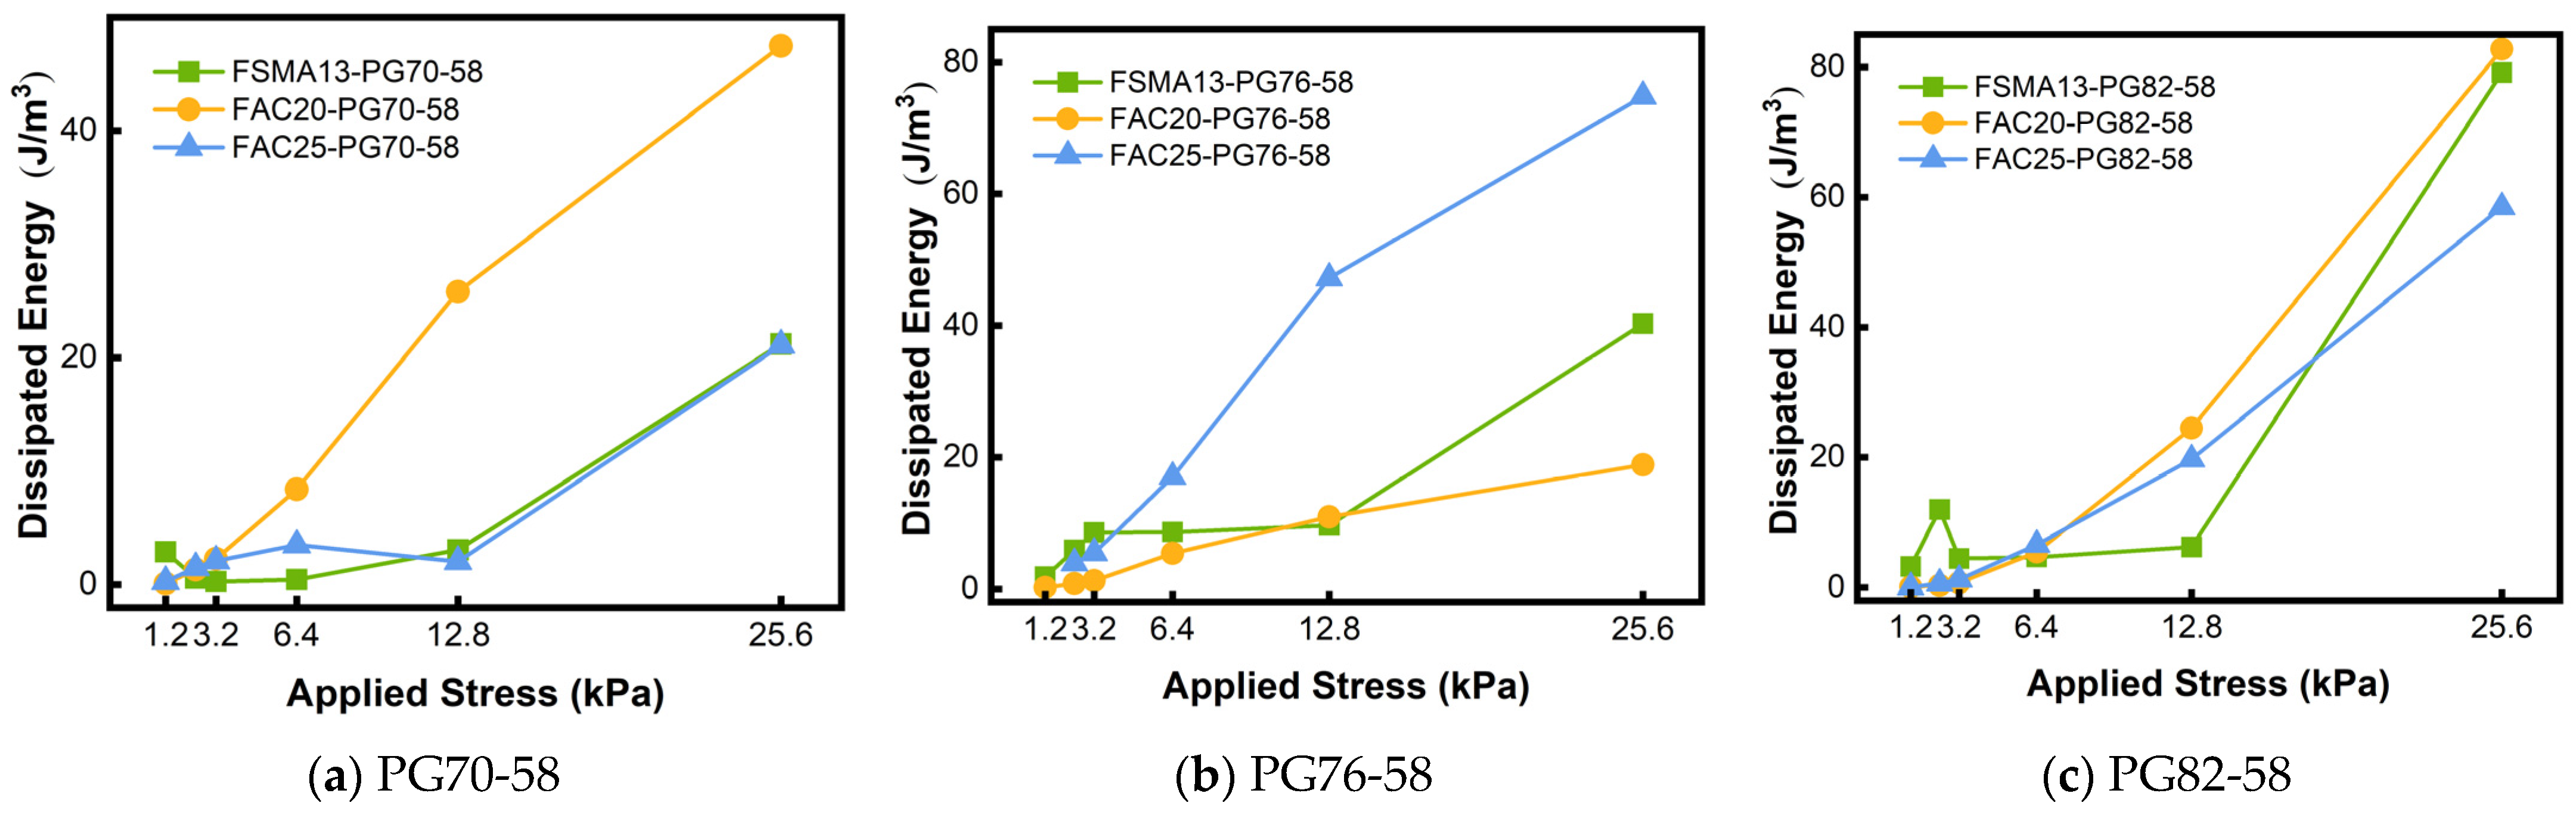
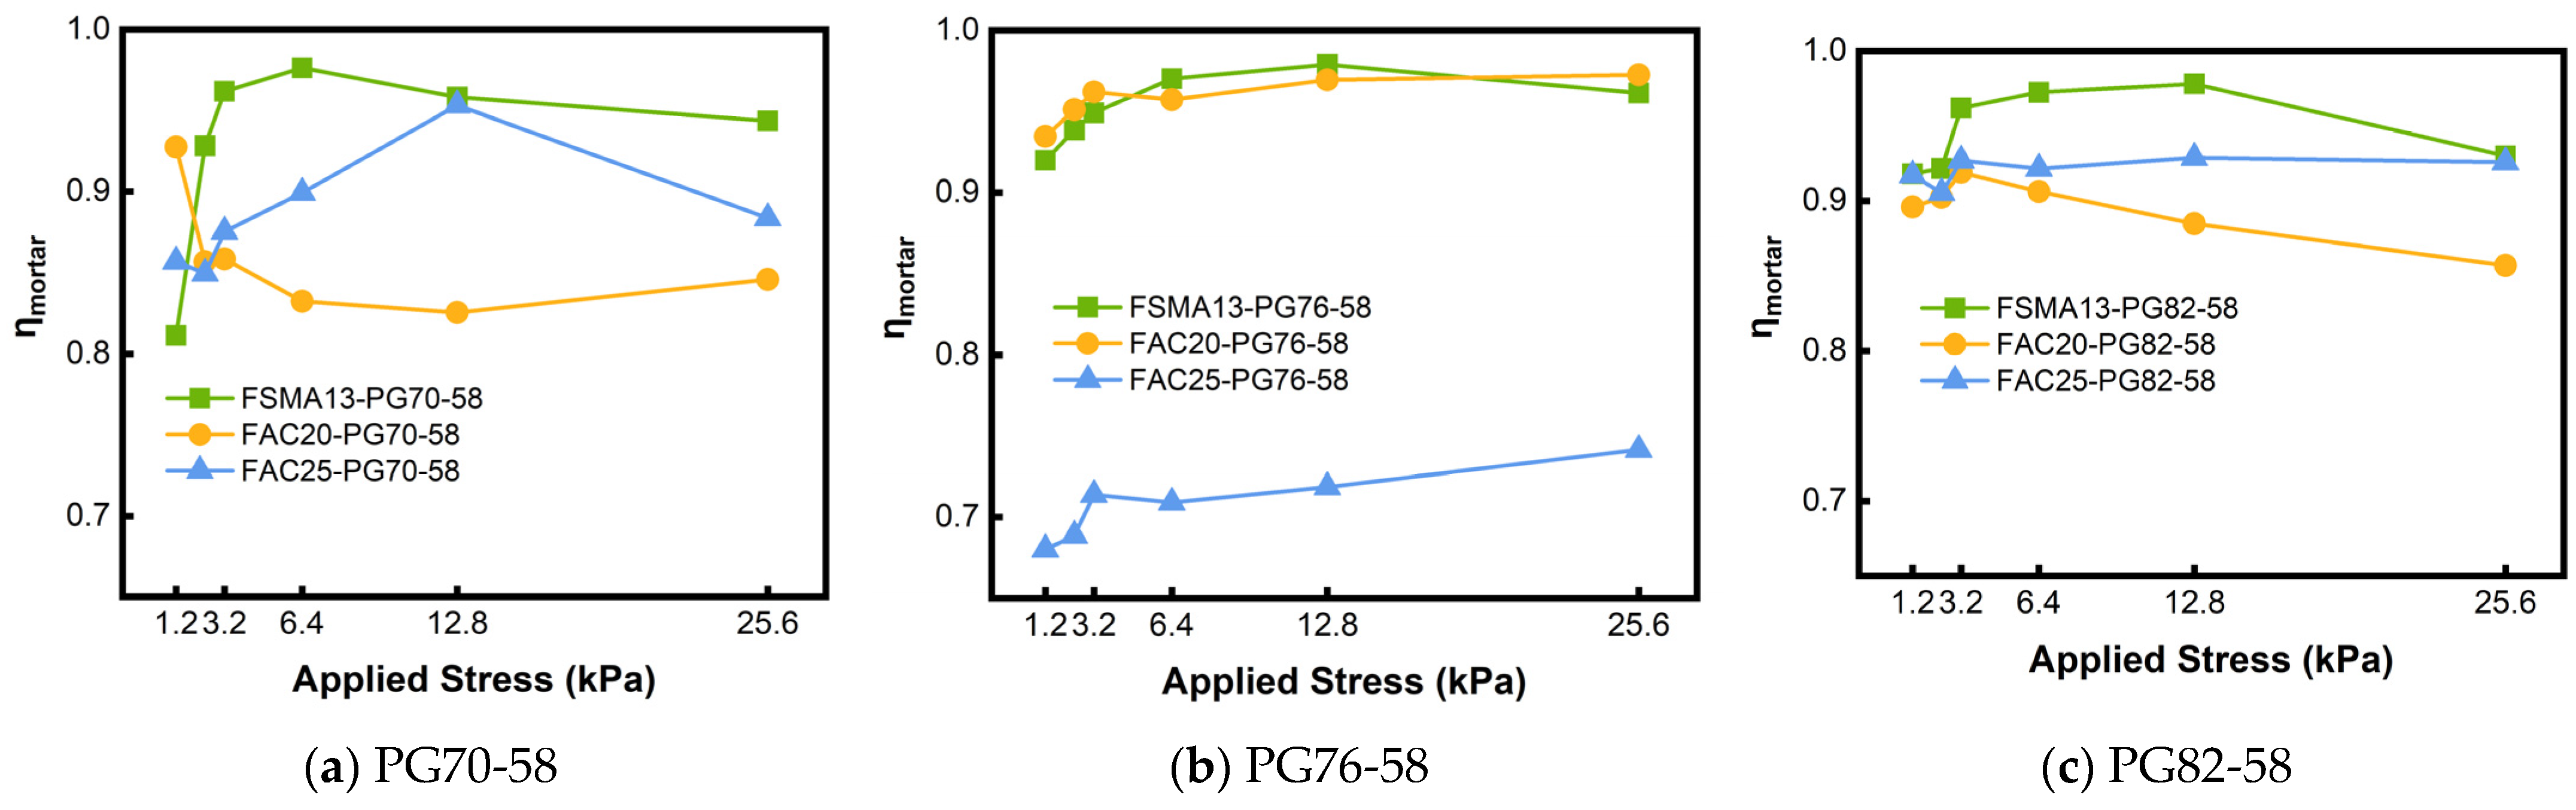
The influence of gradation on dissipated energy (Figure 10) and the recoverable energy coefficient (Figure 11) appears less systematic. Unlike the clear trends observed for recoverable energy, the dissipated energy values fluctuate irregularly across gradation types. This irregularity likely stems from measurement uncertainties at low stresses (due to initial seating effects) and the complex interplay between thermal softening and excessive deformation at high stresses (above 6.4 kPa). These factors complicate the distinction between recoverable and permanent strain, leading to non-monotonic variations in dissipation metrics.

3.3. Influence of Temperature on Energy Indicators

Temperature significantly modulates the viscoelastic response of asphalt mortar. Figure 12 presents the variation in recoverable energy with temperature. For the PG76 binder, recoverable energy generally increases as the temperature rises from 34 °C to 58 °C. This suggests that within this range, thermal energy enhances molecular mobility, allowing for greater deformation and subsequent recovery. However, a critical performance threshold is observed. When the temperature exceeds 58 °C, reaching 62 °C, the recoverable energy sharply declines, reverting to levels similar to those observed at lower temperatures.
A peak of recoverable energy was observed at 58 °C, which highlights a key phase transition in SBS-modified binders. Below 58 °C, the increase in temperature facilitates the mobility of the asphalt molecules, enhancing the material’s ability to undergo elastic deformation. However, 58 °C likely approaches the softening point or the critical phase transition temperature of the polymer network within the modified binder. Beyond this threshold (at 62 °C), the polymer network—which provides the elastic “memory” of the material—begins to lose its dominance to the viscous flow of the base bitumen. This thermal softening compromises the material’s structural integrity, leading to a dominance of permanent deformation (viscous flow) over elastic recovery, resulting in the observed decrease in energy performance.
Similar trends are reflected in the dissipated energy (Figure 13) and the recoverable energy coefficient (Figure 14). Dissipated energy generally increases with temperature due to enhanced viscous flow. The recoverable energy coefficient peaks around 58 °C for most specimens, before declining at 62 °C. This confirms that while moderate heating promotes viscoelastic activity, excessive temperature induces thermal damage that outweighs the benefits of increased binder mobility. Notably, the FAC25 mortar maintains a relatively high coefficient even at 62 °C, likely due to the stabilizing effect of its coarser aggregate skeleton, which is less sensitive to thermal variations than the binder-rich fine matrix.

4. Prediction Model Development

To quantify the cross-scale relationship of energy evolution, predictive models were developed to estimate the recoverable energy of the asphalt mixture ( U r m i x ) based on asphalt mortar properties and loading conditions. The dataset comprised 1474 data points derived from the MSCR and MSRL tests, processed after removing outliers using Grubbs’ test.

4.1. Correlation Analysis of Energy Indicators

Prior to model construction, the normality of the six energy indicators (recoverable energy, dissipated energy, and recoverable energy coefficient for both mortar and mixture) was assessed. As the data did not follow a normal distribution, Spearman’s rank correlation analysis was employed to evaluate the inter-variable relationships.
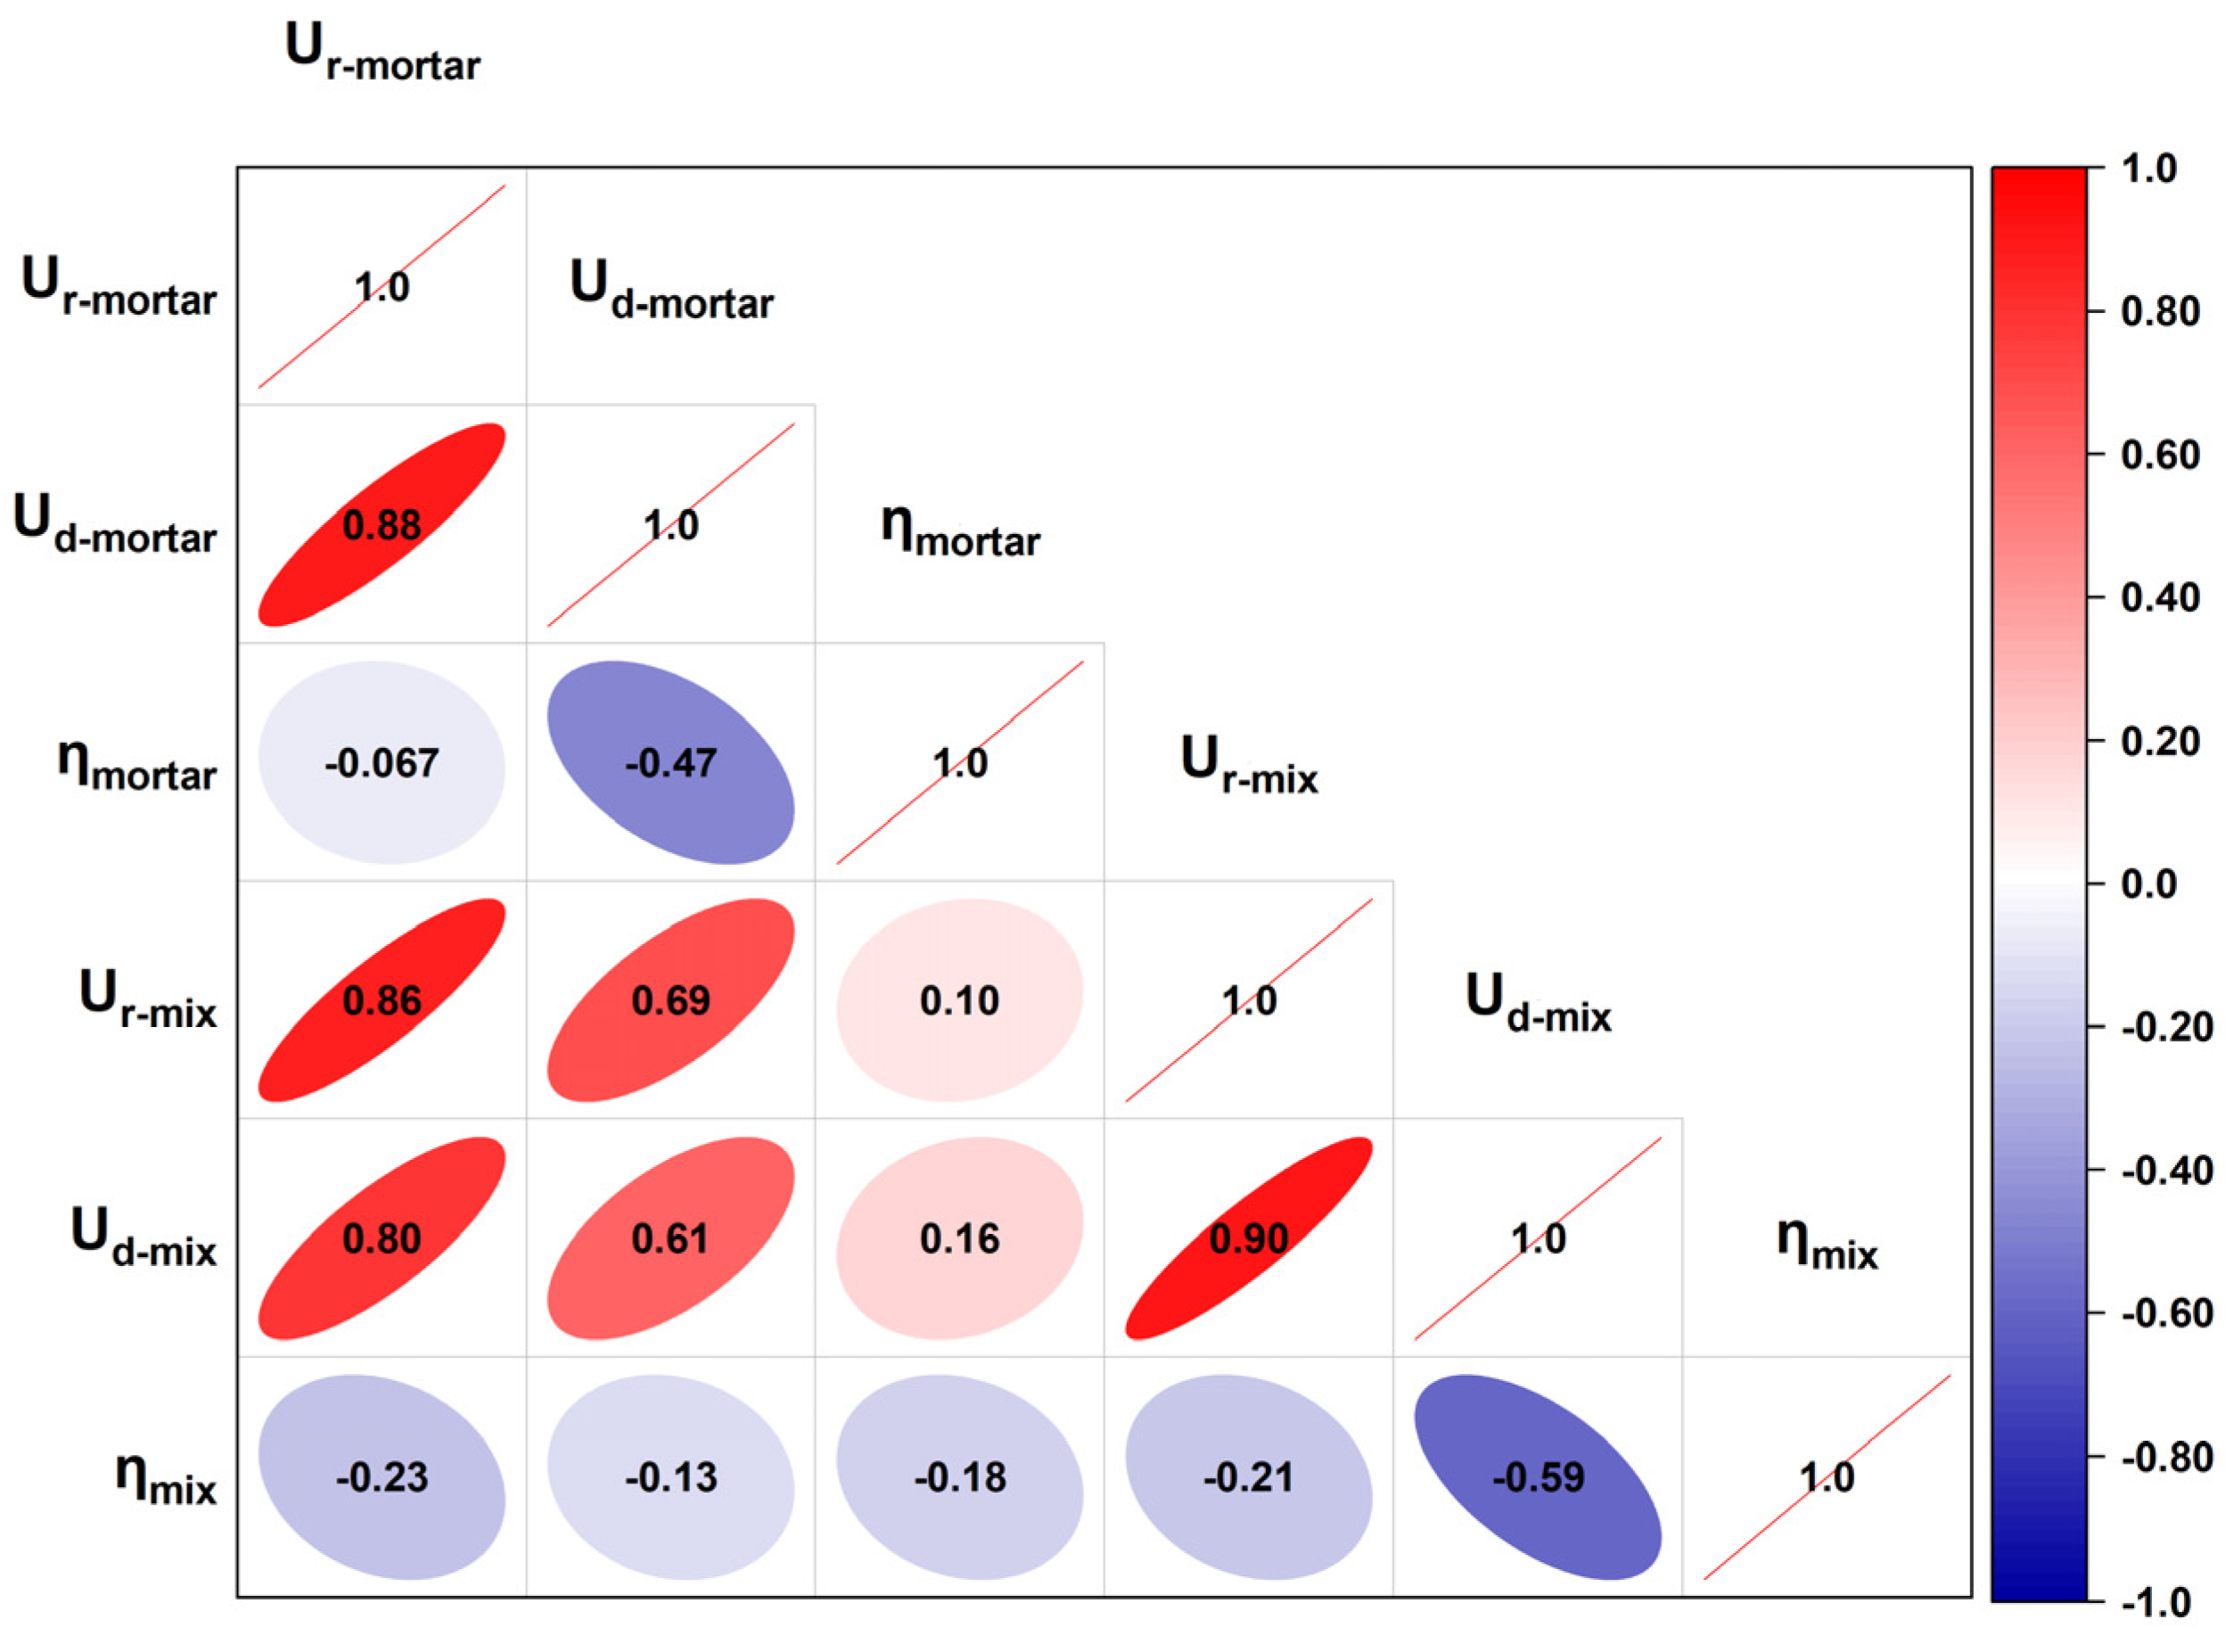
The correlation matrix (Figure 15) reveals significant dependencies between the scales. A strong positive correlation was identified between the recoverable energy of the mixture ( U r m i x ) and the recoverable energy of the mortar ( U r m o r t a r ), with a coefficient of 0.86. Similarly, a moderate positive correlation (0.69) was observed with the mortar’s dissipated energy ( U d m o r t a r ). Notably, U r m i x and U d m i x exhibited a very strong correlation (0.90), implying a linear dependency; therefore, only U r m i x was selected as the target output variable for predictive modeling. These findings confirm that the macroscopic energy characteristics of the mixture are intrinsically linked to the mesoscopic energy dissipation of the mortar.

4.2. Selection of Model Input Parameters

To identify the optimal predictors for U r m i x , a stepwise regression analysis was conducted using IBM SPSS statistical software (version 25). Potential inputs considered were: test temperature ( T ), loading times ( t ), binder rheology ( G / s i n δ ), applied stresses ( σ m o r t a r , σ m i x ) aggregate gradation of the mixture (percentage passing of 26.5 mm, 19 mm, 16 mm, 13.2 mm, 9.5 mm, 4.75 mm, 2.36 mm, 1.18 mm, 0.6 mm, 0.3 mm, 0.15 mm, 0.075 mm), gradation of the mortar (percentage passing of 2.36 mm, 1.18 mm, 0.6 mm, 0.3 mm, 0.15 mm, 0.075 mm), and the three mortar energy indicators ( U r m o r t a r , U d m o r t a r , and η m o r t a r ). The significance of the relationship between each potential input and U r m i x was assessed using a 95% confidence level, with the p-value as the key indicator. Typically, a p-value less than 0.05 signifies a statistically significant relationship, while a value equal to or greater than 0.05 denotes non-significance. To diagnose multicollinearity among the candidate input variables, the variance inflation factor (VIF) and tolerance were examined during the stepwise regression procedure. In this study, variables with VIF values greater than 10 or tolerance values lower than 0.10 were considered to have severe multicollinearity and were therefore excluded from the final model. Table 7 reveals that significant relationships with U r m i x were found for the mixture’s loading conditions (temperature T (°C) and applied stress σ m i x ), G / s i n δ , percentage passing of 19 mm sieve of mixture, the mortar’s U r m o r t a r and η m o r t a r . Several gradation-related variables showed extremely low tolerance values because they were highly correlated with the retained mixture gradation parameter, namely the percentage passing of the 19.0 mm sieve. Therefore, these variables were removed to avoid redundancy and unstable coefficient estimation in the regression model. The parameters demonstrating significant correlations with U r m i x , as presented in Table 7, were selected as inputs to the model for subsequent analysis.
Temperature governs binder viscosity and the transition between elastic recovery and viscous flow, while applied stress determines the external work input and the degree of nonlinear deformation under repeated loading. The binder rheological parameter reflects the intrinsic high-temperature deformation resistance of asphalt, and the percentage passing of the 19.0 mm sieve represents the contribution of the coarse aggregate skeleton to load transfer and structural stability. The mortar-scale energy indicators provide direct mechanistic information: recoverable energy reflects elastic energy storage, dissipated energy represents viscous/plastic deformation and damage accumulation, and the recoverable energy coefficient characterizes the efficiency of energy recovery during loading–unloading cycles. Therefore, these variables are selected as they can characterize the core mechanisms governing cross-scale energy transfer from asphalt mortar to asphalt mixture.

4.3. Model Evaluation Metrics

To evaluate the predictive accuracy of the model, the coefficient of determination ( R 2 ), mean squared error (MSE) and root mean squared error (RMSE) was employed. The error metrics were computed using the following equations:
S S r e s = i = 1 n ( y i y ^ i ) 2
S S t o t = i = 1 n ( y i y ¯ ) 2
R 2 = 1 S S r e s S S t o t
M S E = 1 n i = 1 n ( y ^ i y i ) 2
R M S E = 1 n i = 1 n ( y ^ i y i ) 2
where:
y ^ i : Predicted value;
y i : Actual value;
n : Number of data points;
S S r e s : Residual sum of squares, the sum of the squared differences between y ^ i and y i ;
S S t o t : Total sum of squares, the sum of the squared differences between y i and y ¯ ;
R 2 : coefficient of determination;
M S E : Mean Squared Error;
R M S E : Root Mean Squared Error.

4.4. Multiple Linear Regression (MLR) Model

IBM SPSS was employed to develop the U r m i x multiple linear regression model, with the inputs being the selected significantly correlated variables. The database was randomly divided into two groups—one for training the model (85% of the data points) and the other for validating the developed model (15% of the dataset). Equation (11) presents the developed model.
U r m i x = 0.199 σ m i x + 0.00151 T 0.0699 G * / s i n δ + 0.00217 P m i x 19.0 0.00396 η m o r t a r + 0.0000144 U r m o r t a r 0.161
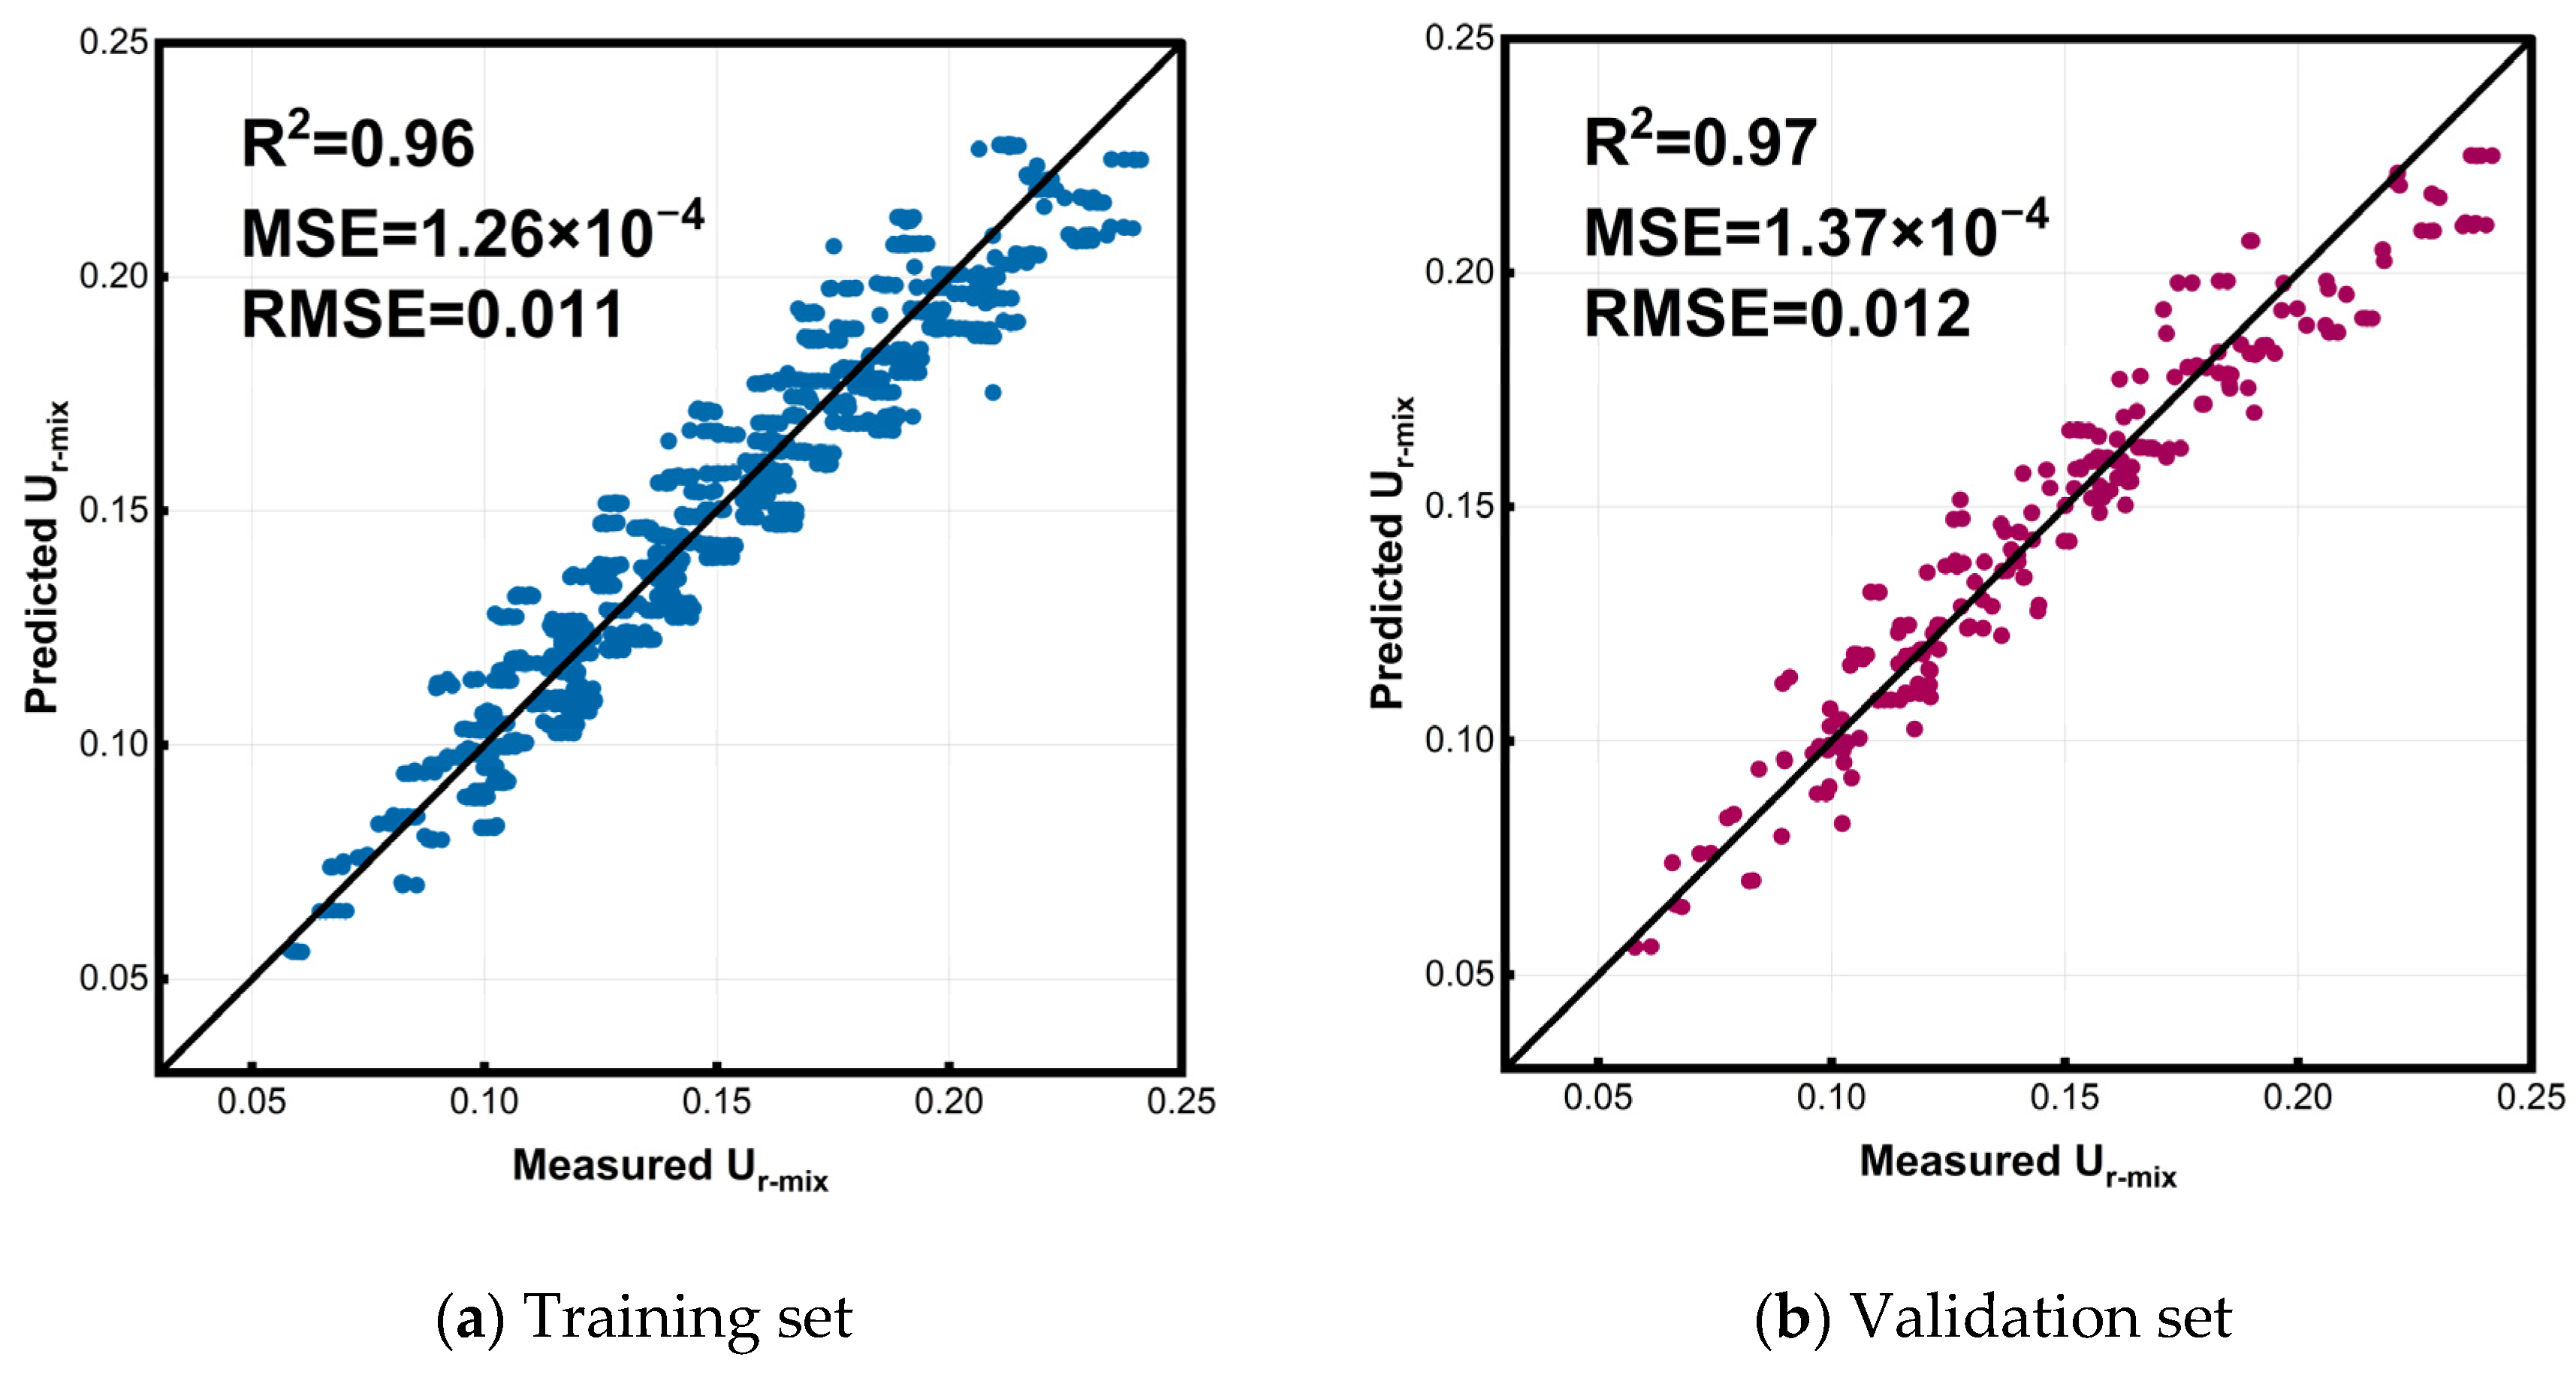
Figure 16 presents the results predicted by the developed multiple linear model. As shown in Figure 16a, the developed multiple linear model provides reasonable predictive accuracy, with an R2 of 0.96. Figure 16b presents the validation of the developed multiple linear regression model; a dataset accounting for 15% of the total data, which was excluded from the model training phase, was utilized. As illustrated, the comparison between the predicted and measured U r m i x resulted in an R2 value of 0.97.

4.5. Artificial Neural Network (ANN) Model

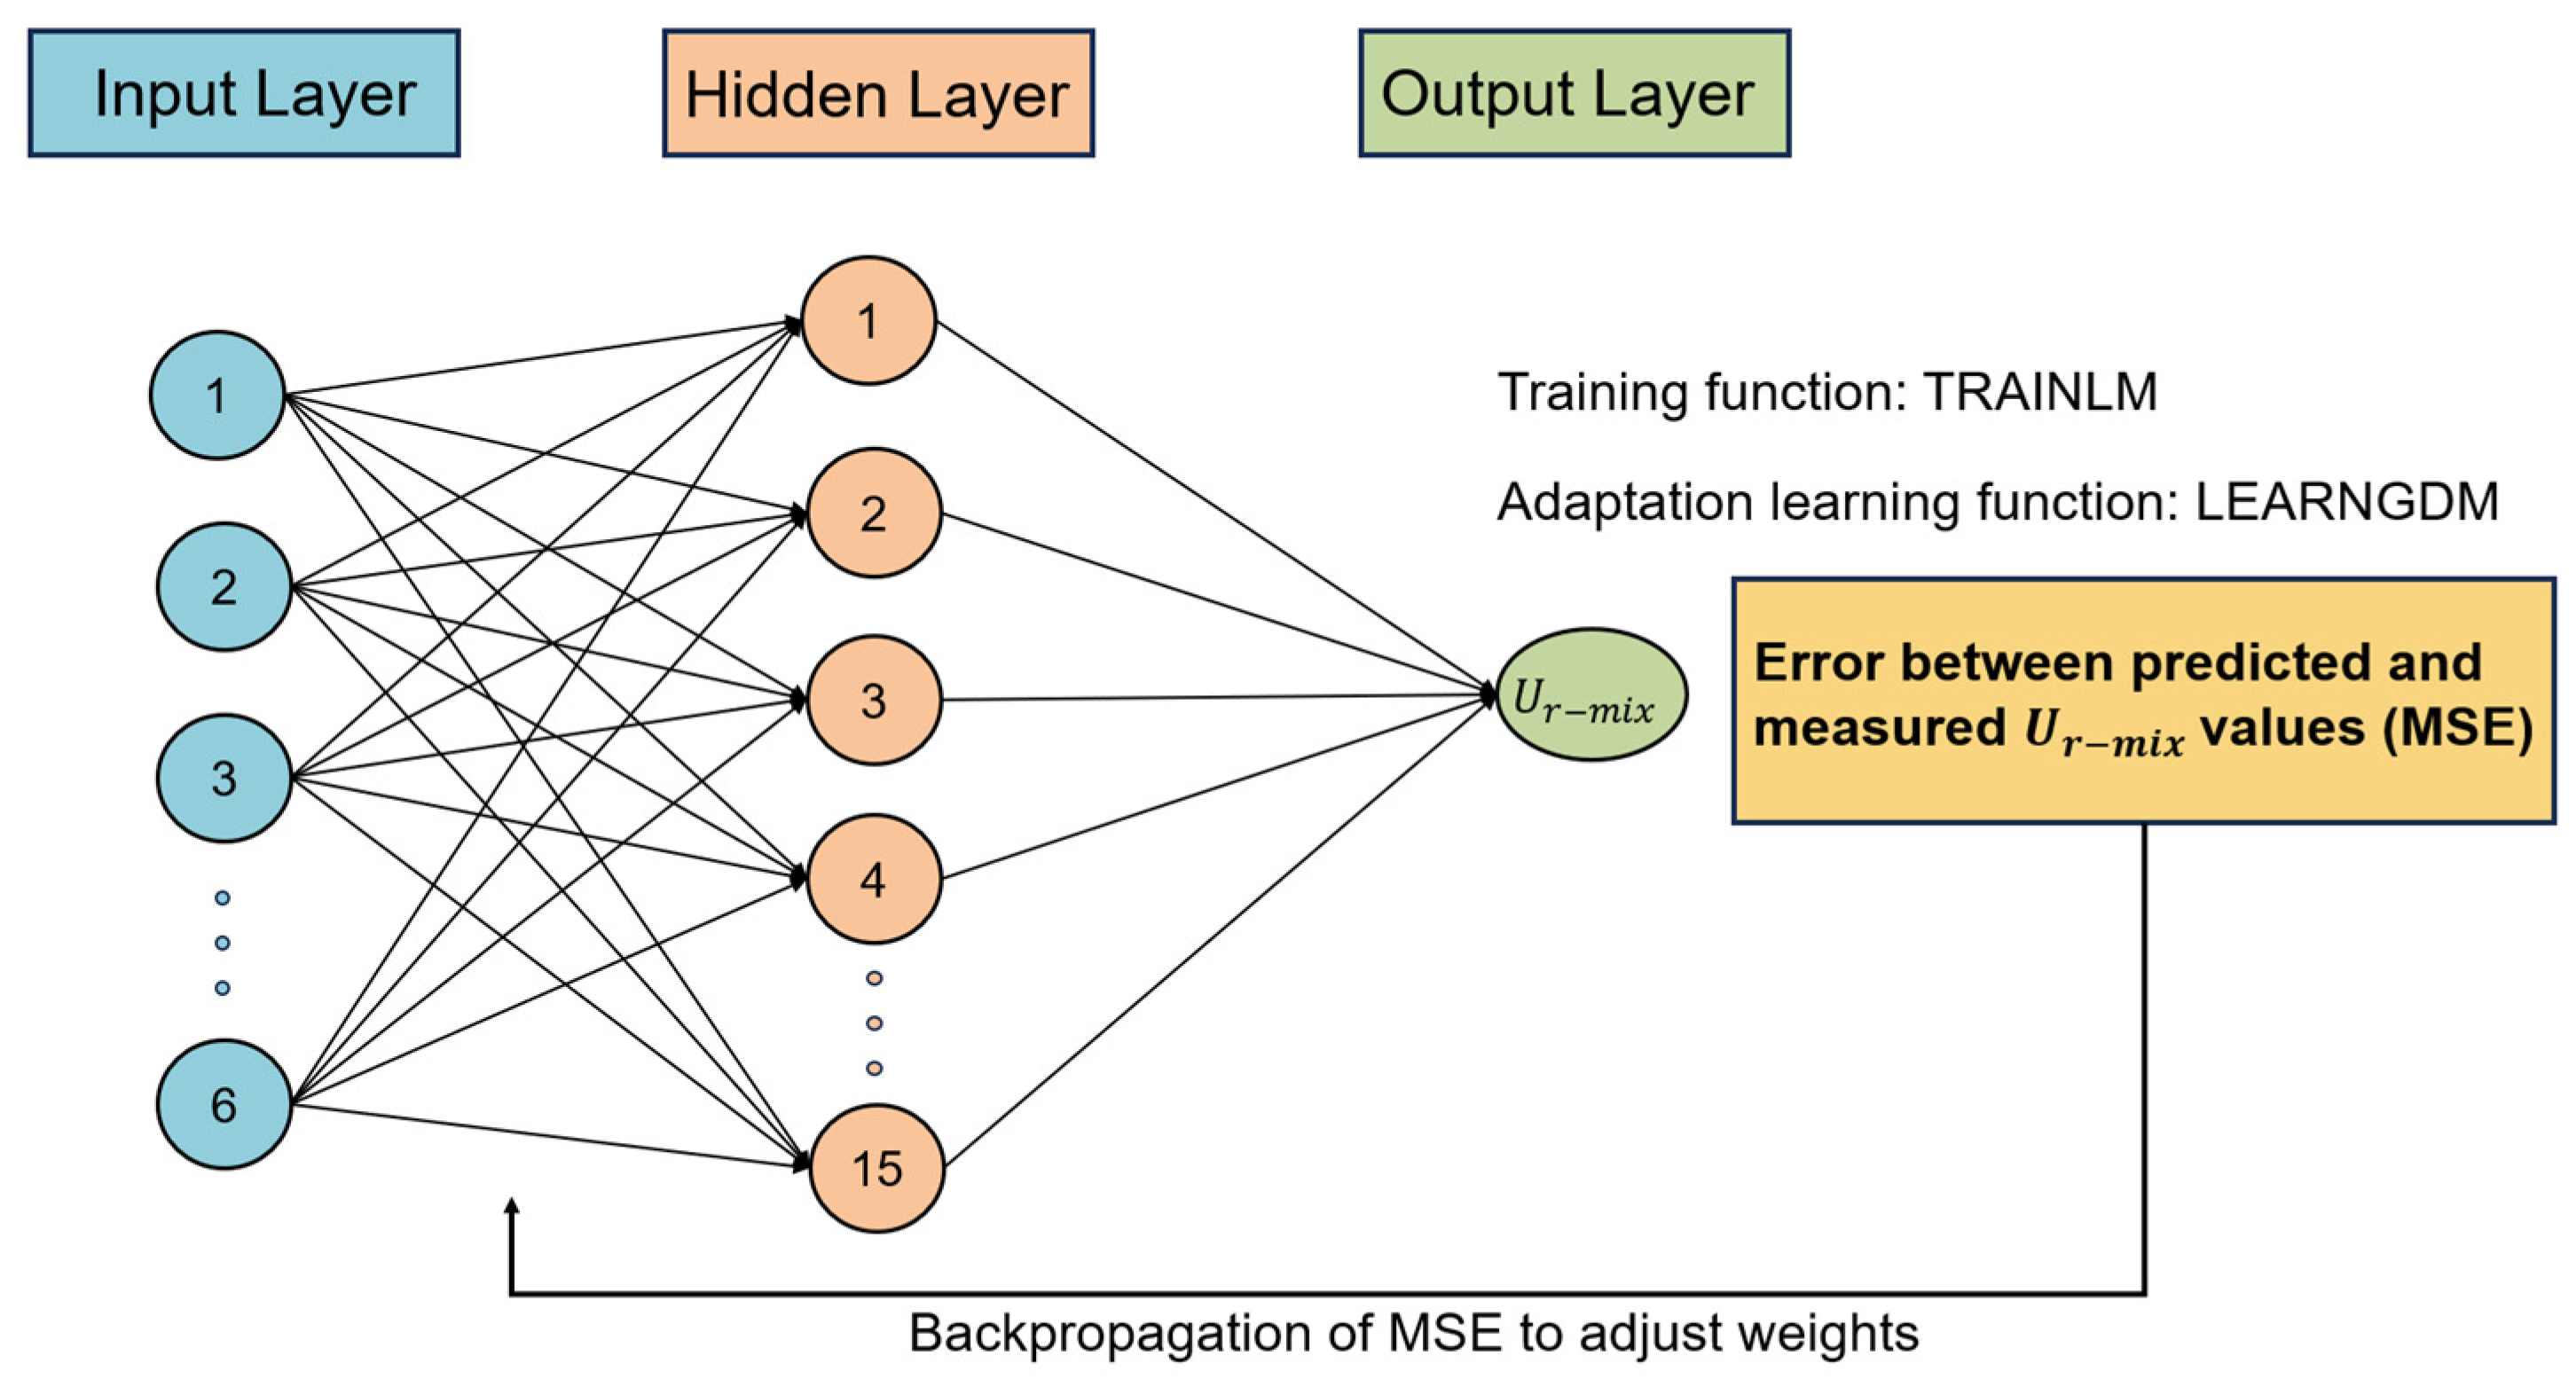
In this study, a backpropagation (BP) artificial neural network model was constructed to predict U r m i x . The model consists of a single hidden layer containing 15 neurons, which utilizes the TANSIG transfer function, and an output layer that also applies the TANSIG transfer function. LEARNGDM was employed as the adaptive learning function for computing the weight adjustments of given neurons, taking into account the neuron’s input, error, weight (or bias), learning rate, and momentum constant. TRAINLM served as the network training function, updating weight and bias values utilizing the Levenberg–Marquardt optimization algorithm. The model was developed using the Artificial Neural Network toolbox in MATLAB (R2025b). Since there is no universally accepted rule for determining the optimal ANN architecture, the network structure was optimized through an architecture sensitivity analysis. Candidate networks with different numbers of hidden-layer neurons were trained and compared under the same training algorithm, transfer functions, data division strategy, and stopping criteria. The final topology was selected based on the validation performance to balance prediction accuracy and generalization capability.
As presented in Table 8, the model with 15 hidden neurons provides the best balance between prediction accuracy and generalization performance. Furthermore, a single-hidden-layer neural network was employed, which can deliver satisfactory nonlinear approximation performance while mitigating redundant model complexity and the risk of overfitting. Therefore, the ANN model with one hidden layer and 15 neurons was selected as the final architecture. The main architectural parameters for the developed ANN model are presented in Table 9. The architecture of the artificial neural network is depicted in Figure 17.
The data accounting for 85% of the entire collected database (including 1253 data points) is used for developing the ANN model, while the remaining 15% of the database (221 data points) is reserved for model testing and is not used for training. The data used for model development (1253 data points) is randomly divided into two parts: 70% for training, 15% for validation.
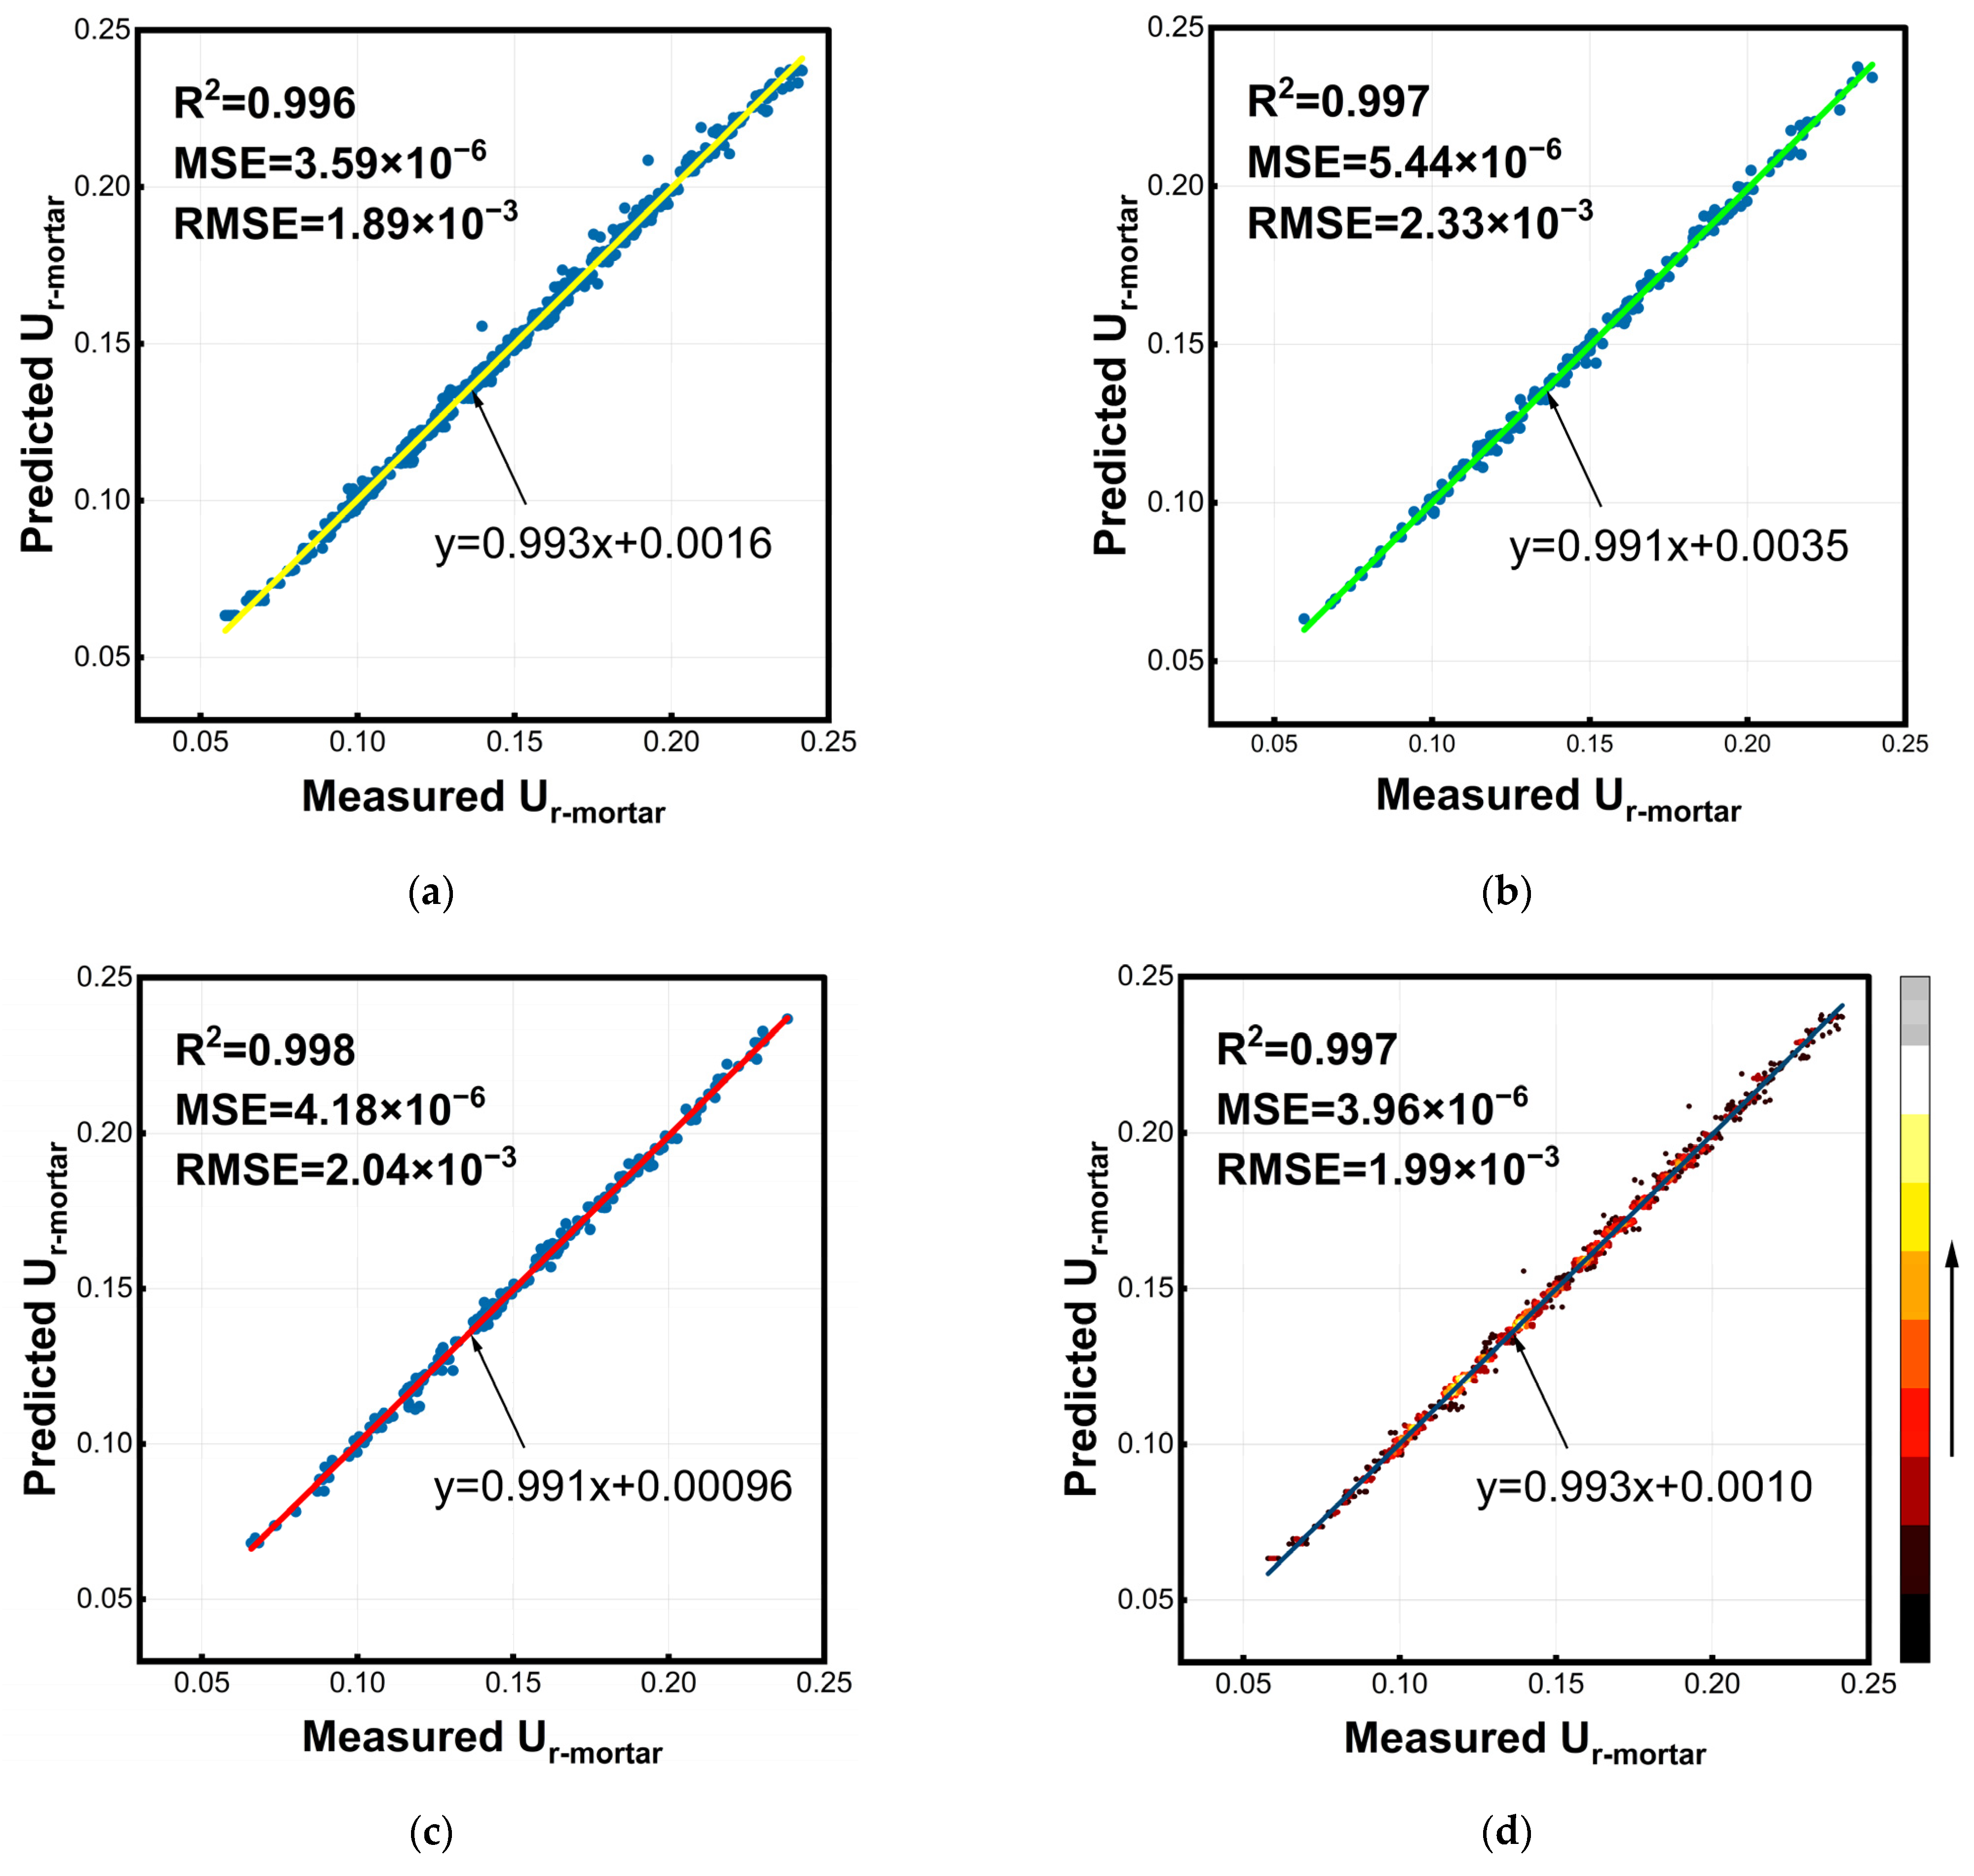
Figure 18 presents the results of the ANN model derived from the training, validation, testing, and all data used for model development. For the recoverable energy of asphalt mixtures, the predicted values show excellent agreement with the measured data, achieving a coefficient of determination (R2) of 0.998 and a root mean square error (RMSE) of only 3.67 × 10⁻⁶. The fact that the regression line is close to the ideal Y = X line demonstrates the model’s excellent predictive precision, likely resulting from the predominant contribution of stable elastic deformation to the recoverable energy computation. The R2 values for the training, validation, testing, and all data used in model development are all above 0.99, indicating that the predictive accuracy of the proposed artificial neural network model is “excellent” and superior to the multiple linear regression model developed in this study.
To further evaluate the robustness and generalization capability of the ANN model, five-fold cross-validation was performed. The entire dataset was randomly divided into five mutually exclusive subsets. To avoid potential data leakage caused by repeated measurements from the same specimen, all data points belonging to the same specimen were assigned to the same fold.
In each validation run, four subsets were used for model calibration, while the remaining subset was used as an independent testing fold. Within the calibration data, 15% of the samples were further used as the validation set for early stopping. This procedure was repeated five times so that each subset was used once as the testing fold. To avoid data leakage, the normalization parameters were determined only from the training subset in each fold and then applied to the corresponding validation and testing subsets. The prediction performance was evaluated using R2, RMSE, and MAE, and the final cross-validation results were reported as the mean and standard deviation across the five testing folds.
Five-fold cross-validation was performed to further assess the robustness of the ANN model. As shown in Table 10, the five-fold cross-validation yielded an average testing R2 of 0.978 ± 0.01, with RMSE and MAE values of 0.006 ± 0.001 and 0.004 ± 0.001, respectively. The relatively stable testing performance across the five folds indicates that the proposed ANN model has good generalization capability and is not overly sensitive to a specific data partition.
Although the ANN model achieved very high R2 values, potential overfitting was carefully considered. The comparable performance among the training, validation, testing, and K-fold cross-validation results suggests that the model did not merely memorize the training data. In addition, the high prediction accuracy can be partly explained by the strong physical dependency between mortar-scale and mixture-scale recoverable energy indicators.


5. Conclusions

Earlier studies generally focused on energy evolution at a single material scale, and therefore provided limited evidence on how mesoscopic energy behavior contributes to macroscopic mixture performance. This study integrates mortar energy indicators with mixture energy indicators and establishes a quantitative mortar-to-mixture linkage. The proposed ANN model differs from such empirical applications because its input structure is based on physically meaningful variables, including temperature, stress, binder rheology, gradation, and mortar-scale energy indicators. Therefore, this study develops a physically interpretable multiscale framework that integrates energy-based mechanisms with data-driven prediction for asphalt mixture performance evaluation. The primary conclusions drawn from this research are as follows:
(1) The energy evolution of asphalt mortar is highly dependent on stress levels, temperature, and aggregate gradation. Mortars with finer gradation (e.g., FSMA13) exhibited significantly higher stress sensitivity, with recoverable energy increasing by over 80% as stress rose from 1.2 kPa to 25.6 kPa.
(2) A distinct physical link between the mesoscopic and macroscopic scales was confirmed. Spearman correlation analysis revealed a strong positive relationship between the recoverable energy of the mixture ( U r m i x ) and that of the mortar ( U r m o r t a r ), yielding a correlation coefficient of 0.86.
(3) Stepwise regression analysis determined that six key parameters statistically govern the mixture’s recoverable energy: test temperature ( T ), applied mixture stress ( σ m i x ), binder rheology ( G * / s i n ), aggregate gradation ( P m i x 19.0 ), and the mortar’s energy indicators ( U r m o r t a r and η m o r t a r ).
(4) Machine learning proved effective for upscaling material properties. Compared with the MLR model, the ANN model achieved higher prediction accuracy, with an R2 of 0.998 in the random data split and an average testing R2 of 0.9781 in five-fold cross-validation.
Overall, this study confirms that mortar-scale energy evolution can serve as an effective basis for predicting mixture-level performance. The proposed framework provides a practical pathway for preliminary asphalt mixture evaluation based on mortar-scale energy testing. Linking mortar energy evolution with mixture-level deformation performance, it can help reduce the reliance on extensive mixture-scale repeated loading tests.
Although the ANN model showed high predictive accuracy, it was developed within a limited experimental domain. Future work should incorporate broader material combinations, environmental conditions, aging states, and independent field data.

Author Contributions

Conceptualization, H.Y., Z.K. and Z.M.; methodology, Z.T., Y.Z. and Y.L.; software, Z.M., Z.K. and Z.T.; validation, L.Y., Y.Z. and Y.L.; formal analysis, L.Y.; investigation, H.Y., L.Y. and Z.T.; data curation, Z.M., Z.K. and L.Y.; writing—original draft preparation, Z.M.; writing—review and editing, Z.M. and Z.T.; supervision, H.Y.; funding acquisition, H.Y. All authors have read and agreed to the published version of the manuscript.

Funding

This research was funded by the Guangdong Basic and Applied Basic Research Foundation, grant number 2025A1515011435.

Data Availability Statement

The data presented in this study are available on request from the corresponding author.

Conflicts of Interest

The authors declare no conflicts of interest.

References

  1. Lei, B.; Li, R.; Luo, Z. Intelligent Monitoring System for Highway Roadbed Based on Combination Neural Network Algorithm. Int. J. High Speed Electron. Syst. 2024, 34, 2440049. [Google Scholar] [CrossRef]
  2. Tan, Z.; Guo, F.; Yu, H.; Cao, P.; Leng, Z.; Xu, C. Virtual Generation and Quantitative Characterization of 3D Aggregate Skeletons in Asphalt Mixtures. Powder Technol. 2026, 480, 122454. [Google Scholar] [CrossRef]
  3. Salim, R.; Gundla, A.; Zalghout, A.; Underwood, B.S.; Kaloush, K.E. Relationship between Asphalt Binder Parameters and Asphalt Mixture Rutting. Transp. Res. Rec. J. Transp. Res. Board 2019, 2673, 431–446. [Google Scholar] [CrossRef]
  4. Tan, Z.; Leng, Z.; Gong, M.; Cao, P.; Xu, C. Thermo-Mechanical Modeling of Pavement’s Response Considering Asphalt Concrete’s Tension-Compression Asymmetry. Comput.-Aided Civ. Infrastruct. Eng. 2026, 41, 100005. [Google Scholar] [CrossRef]
  5. Chaturabong, P.; Bahia, H.U. Mechanisms of Asphalt Mixture Rutting in the Dry Hamburg Wheel Tracking Test and the Potential to Be Alternative Test in Measuring Rutting Resistance. Constr. Build. Mater. 2017, 146, 175–182. [Google Scholar] [CrossRef]
  6. Du, Y.; Chen, J.; Han, Z.; Liu, W. A Review on Solutions for Improving Rutting Resistance of Asphalt Pavement and Test Methods. Constr. Build. Mater. 2018, 168, 893–905. [Google Scholar] [CrossRef]
  7. Daniel, J.S.; Kim, Y.R. Laboratory Evaluation of Fatigue Damage and Healing of Asphalt Mixtures. J. Mater. Civ. Eng. 2001, 13, 434–440. [Google Scholar] [CrossRef]
  8. de Mello, L.G.R.; de Farias, M.M.; Kaloush, K.E. Using Damage Theory to Analyze Fatigue of Asphalt Mixtures on Flexural Tests. Int. J. Pavement Res. Technol. 2018, 11, 617–626. [Google Scholar] [CrossRef]
  9. Das, B.P.; Das, S.; Siddagangaiah, A.K. Probabilistic Modeling of Fatigue Damage in Asphalt Mixture. Constr. Build. Mater. 2021, 269, 121300. [Google Scholar] [CrossRef]
  10. Shen, S.; Chiu, H.-M.; Huang, H. Characterization of Fatigue and Healing in Asphalt Binders. J. Mater. Civ. Eng. 2010, 22, 846–852. [Google Scholar] [CrossRef]
  11. Zhang, D.; Birgisson, B.; Luo, X. A New Dynamic Modulus Predictive Model for Asphalt Mixtures Based on the Law of Mixtures. Constr. Build. Mater. 2020, 255, 119348. [Google Scholar] [CrossRef]
  12. Tang, D.; Ran, J.; Gao, F.; Zhang, N.; Zhao, Y. Study on the Formation Mechanism of Reflective Cracks in Semi-Rigid Base Asphalt Pavement Based on Energy Evolution Mechanism. Constr. Build. Mater. 2025, 491, 142652. [Google Scholar] [CrossRef]
  13. Tan, Z.; Li, H.; Leng, Z.; Jelagin, D.; Cao, P.; Du, C.; Yin, B. Constitutive Modelling and Systematic Evaluation of Asphalt Concrete’s Viscoelastic Tension-Compression Asymmetry Effect on Pavement Performance. Int. J. Pavement Eng. 2024, 25, 2338282. [Google Scholar] [CrossRef]
  14. Huang, W.; Yu, H.; Lin, Y.; Zheng, Y.; Ding, Q.; Tong, B.; Wang, T. Energy Analysis for Evaluating Durability of Porous Asphalt Mixture. Constr. Build. Mater. 2022, 326, 126819. [Google Scholar] [CrossRef]
  15. Song, W.; Xu, Z.; Xu, F.; Wu, H.; Yin, J. Fracture Investigation of Asphalt Mixtures Containing Reclaimed Asphalt Pavement Using an Equivalent Energy Approach. Eng. Fract. Mech. 2021, 253, 107892. [Google Scholar] [CrossRef]
  16. Alvarez, A.E.; Ovalles, E.; Martin, A.E. Comparison of Asphalt Rubber-Aggregate and Polymer Modified Asphalt–Aggregate Systems in Terms of Surface Free Energy and Energy Indices. Constr. Build. Mater. 2012, 35, 385–392. [Google Scholar] [CrossRef]
  17. Ling, M.; Zhang, Y.; Kaseer, F.; Martin, A.E.; Lytton, R.L. Investigation of Fracture Behavior of Asphalt Mixture Composite Using Energy-Based Approach. Compos. Part B Eng. 2020, 181, 107324. [Google Scholar] [CrossRef]
  18. Luo, X.; Li, H.; Deng, Y.; Zhang, Y. Energy-Based Kinetics Approach for Coupled Viscoplasticity and Viscofracture of Asphalt Mixtures. J. Eng. Mech. 2020, 146, 04020100. [Google Scholar] [CrossRef]
  19. Boudabbous, M.; Millien, A.; Petit, C.; Neji, J. Energy Approach for the Fatigue of Thermoviscoelastic Materials: Application to Asphalt Materials in Pavement Surface Layers. Int. J. Fatigue 2013, 47, 308–318. [Google Scholar] [CrossRef]
  20. Norouzi, A.; Sabouri, M.; Richard Kim, Y. Fatigue Life and Endurance Limit Prediction of Asphalt Mixtures Using Energy-Based Failure Criterion. Int. J. Pavement Eng. 2017, 18, 990–1003. [Google Scholar] [CrossRef]
  21. Saha, G.; Biligiri, K.P. Fracture Damage Evaluation of Asphalt Mixtures Using Semi-Circular Bending Test Based on Fracture Energy Approach. Eng. Fract. Mech. 2015, 142, 154–169. [Google Scholar] [CrossRef]
  22. Shu, L.; Xu, D.; Ni, F.; Jiang, J.; Wang, J.; Zhang, Z. Evaluating the Aging and Fatigue Performance of In-Situ Asphalt Mortar through Multiple Stress Creep Recovery and Energy-Based Methods. Constr. Build. Mater. 2024, 456, 139304. [Google Scholar] [CrossRef]
  23. Rachman, A.; Yang, S.-H.; Nguyen, M.-N.; Rachman, F. Enhancing Hamburg Wheel Tracking Test Analysis: A Novel Energy-Based Performance Index. Constr. Build. Mater. 2024, 445, 137666. [Google Scholar] [CrossRef]
  24. Chen, M.; Javilla, B.; Hong, W.; Pan, C.; Riara, M.; Mo, L.; Guo, M. Rheological and Interaction Analysis of Asphalt Binder, Mastic and Mortar. Materials 2019, 12, 128. [Google Scholar] [CrossRef]
  25. Yu, H.; Deng, Y.; Deng, G.; Dong, N. Correlations between Energy Dissipation Characteristics and the Rheological Property Degradation of Asphalt Binders. Buildings 2024, 14, 292. [Google Scholar] [CrossRef]
  26. Tan, Z.; Guo, Y.; Hu, G.; Chen, R.; Wang, Y.; Yin, B.; Leng, Z. Upcycling Waste Wind Turbine Blades into Fiber-Reinforced Asphalt Mortar: A Chemical Recycling Approach and Performance Assessment. Constr. Build. Mater. 2025, 489, 142352. [Google Scholar] [CrossRef]
  27. Li, R.; Ma, X.; Chen, J.; Tang, N.; Zhu, H.; Leng, Z.; Tan, Z. Performance Enhancement of Recycled Asphalt Mixtures Using Polyurethane Prepolymer. Constr. Build. Mater. 2026, 526, 146402. [Google Scholar] [CrossRef]
  28. Gong, X.; Romero, P.; Dong, Z.; Li, Y. Investigation on the Low Temperature Property of Asphalt Fine Aggregate Matrix and Asphalt Mixture Including the Environmental Factors. Constr. Build. Mater. 2017, 156, 56–62. [Google Scholar] [CrossRef]
  29. Kong, L.; Mo, S.; Wang, N. High-Temperature Performance of Asphalt Mortar Using Surface and Interface Theory. J. Mater. Civ. Eng. 2015, 27, C4014009. [Google Scholar] [CrossRef]
  30. Leng, Z.; Tan, Z.; Cao, P.; Zhang, Y. An Efficient Model for Predicting the Dynamic Performance of Fine Aggregate Matrix. Comput. Aided Civ. Eng. 2021, 36, 1467–1479. [Google Scholar] [CrossRef]
  31. Zhang, Y.; Leng, Z. Quantification of Bituminous Mortar Ageing and Its Application in Ravelling Evaluation of Porous Asphalt Wearing Courses. Mater. Des. 2017, 119, 1–11. [Google Scholar] [CrossRef]
  32. Tan, Z.; Li, H.; Leng, Z.; Yin, B.; Li, D.; Zou, F.; Cao, P. Fatigue Performance Analysis of Fine Aggregate Matrix Using a Newly Designed Experimental Strategy and Viscoelastic Continuum Damage Theory. Mater. Struct. 2024, 57, 130. [Google Scholar] [CrossRef]
  33. Li, H.; Tan, Z.; Li, R.; Luo, X.; Zhang, Y.; Leng, Z. Mechanistic Modeling of Fatigue Crack Growth in Asphalt Fine Aggregate Matrix under Torsional Shear Cyclic Load. Int. J. Fatigue 2024, 178, 107999. [Google Scholar] [CrossRef]
  34. De Rezende, L.R.; Kommidi, S.R.; Kim, Y.-R.; Khedmati, M. Strain Sweep Fatigue Testing of Sand Asphalt Mortar to Investigate the Effects of Sample Geometry, Binder Film Thickness, and Testing Temperature. Transp. Res. Rec. J. Transp. Res. Board 2021, 2675, 516–529. [Google Scholar] [CrossRef]
  35. Tan, Z.; Guo, F.; Leng, Z.; Yang, Z.; Cao, P. A Novel Strategy for Generating Mesoscale Asphalt Concrete Model with Controllable Aggregate Morphology and Packing Structure. Comput. Struct. 2024, 296, 107315. [Google Scholar] [CrossRef]
  36. Kim, Y.-R. Mechanistic Fatigue Characterization and Damage Modeling of Asphalt Mixtures; Texas A&M University: College Station, TX, USA, 2003. [Google Scholar]
  37. Kim, Y.-R.; Little, D.N.; Lytton, R.L. Fatigue and Healing Characterization of Asphalt Mixtures. J. Mater. Civ. Eng. 2003, 15, 75–83. [Google Scholar] [CrossRef]
  38. Zhu, H.; Nodes, J.E. Contact Based Analysis of Asphalt Pavement with the Effect of Aggregate Angularity. Mech. Mater. 2000, 32, 193–202. [Google Scholar] [CrossRef]
  39. Dai, Q.; You, Z. Prediction of Creep Stiffness of Asphalt Mixture with Micromechanical Finite-Element and Discrete-Element Models. J. Eng. Mech. 2007, 133, 163–173. [Google Scholar] [CrossRef]
  40. Underwood, B.S.; Kim, Y.R. Experimental Investigation into the Multiscale Behaviour of Asphalt Concrete. Int. J. Pavement Eng. 2011, 12, 357–370. [Google Scholar] [CrossRef]
  41. Zhao, S.; You, Q.; Sesay, T. Fine Aggregate Sizes Effects on the Creep Behavior of Asphalt Mortar. Constr. Build. Mater. 2022, 342, 127931. [Google Scholar] [CrossRef]
  42. Wang, C.; Zhang, H.; Xie, L.; Zhu, C.; Jin, Z.; Hu, X.; Zhang, T.; Cai, G.; Liu, S. ANN-Based Prediction of Compressive Strength in Sustainable HPC Using Industrial Waste. Constr. Build. Mater. 2025, 505, 144780. [Google Scholar] [CrossRef]
  43. Plati, C.; Georgiou, P.; Papavasiliou, V. Simulating Pavement Structural Condition Using Artificial Neural Networks. Struct. Infrastruct. Eng. 2016, 12, 1127–1136. [Google Scholar] [CrossRef]
  44. Rezazadeh Eidgahee, D.; Jahangir, H.; Solatifar, N.; Fakharian, P.; Rezaeemanesh, M. Data-Driven Estimation Models of Asphalt Mixtures Dynamic Modulus Using ANN, GP and Combinatorial GMDH Approaches. Neural Comput. Appl. 2022, 34, 17289–17314. [Google Scholar] [CrossRef]
  45. Kim, D.-H.; Lee, S.-J.; Moon, K.-H.; Jeong, J.-H. Prediction of Indirect Tensile Strength of Intermediate Layer of Asphalt Pavements Using Artificial Neural Network Model. Arab. J. Sci. Eng. 2021, 46, 4911–4922. [Google Scholar] [CrossRef]
  46. Esra’a, I.A.; Abo-Qudais, S.A. Modeling of Creep Compliance Behavior in Asphalt Mixes Using Multiple Regression and Artificial Neural Networks. Constr. Build. Mater. 2018, 159, 635–641. [Google Scholar] [CrossRef]
  47. Hussan, S.; Kamal, M.A.; Hafeez, I.; Ahmad, N.; Khanzada, S.; Ahmed, S. Modelling Asphalt Pavement Analyzer Rut Depth Using Different Statistical Techniques. Road Mater. Pavement Des. 2020, 21, 117–142. [Google Scholar] [CrossRef]
  48. Moniri, A.; Ziari, H.; Amini, A.; Hajiloo, M. Investigating the ANN Model for Cracking of HMA in Terms of Temperature, RAP and Fibre Content. Int. J. Pavement Eng. 2022, 23, 545–557. [Google Scholar] [CrossRef]
  49. Alatoom, Y.I.; Al-Suleiman (Obaidat), T.I. Development of Pavement Roughness Models Using Artificial Neural Network (ANN). Int. J. Pavement Eng. 2022, 23, 4622–4637. [Google Scholar] [CrossRef]
  50. Zhong, K.; Meng, Q.; Sun, M.; Luo, G. Artificial Neural Network (ANN) Modeling for Predicting Performance of SBS Modified Asphalt. Materials 2022, 15, 8695. [Google Scholar] [CrossRef]
  51. Li, S.; Shi, X.; Si, C.; Bao, B.; Hu, M. Correlation between the Rheological Properties of Asphalt Mortar and the High-Temperature Performance of Asphalt Mixture. Coatings 2023, 13, 1058. [Google Scholar] [CrossRef]
  52. Panda, R.P.; Das, S.S.; Sahoo, P.K. An Empirical Method for Estimating Surface Area of Aggregates in Hot Mix Asphalt. J. Traffic Transp. Eng. (Engl. Ed.) 2016, 3, 127–136. [Google Scholar] [CrossRef]
  53. Tan, X.; Yang, J.; Zhuang, H.; Xu, J.; Gao, J.; Wan, T.; Zhang, J. Exploring the Physical Hardening Characteristics of Asphalt Mortars and Mixtures Based on Gradient Particle Size. Constr. Build. Mater. 2025, 493, 143159. [Google Scholar] [CrossRef]
  54. Fang, M.; Park, D.; Singuranayo, J.L.; Chen, H.; Li, Y. Aggregate Gradation Theory, Design and Its Impact on Asphalt Pavement Performance: A Review. Int. J. Pavement Eng. 2019, 20, 1408–1424. [Google Scholar] [CrossRef]
  55. Lira, B.; Jelagin, D.; Birgisson, B. Gradation-Based Framework for Asphalt Mixture. Mater. Struct. 2013, 46, 1401–1414. [Google Scholar] [CrossRef]
  56. Cao, R.; Li, H.; Yao, L.; Jiang, J.; Leng, Z.; Ni, F.; Zhao, Z. Comparative Analysis of Cold In-Place Recycling for Roadway Maintenance and Rehabilitation from the Perspectives of Technical-Cost-Environmental Nexus. J. Clean. Prod. 2024, 439, 140768. [Google Scholar] [CrossRef]
  57. He, Y.; Zhang, J.; Gao, B.; Wang, L.; Li, Y.; Guo, F.; Huang, G. Experimental Investigation of the Interface Interaction between Asphalt Binder and Mineral Filler from the Aspects of Materials Properties. Constr. Build. Mater. 2023, 393, 132094. [Google Scholar] [CrossRef]
  58. Li, F.; Yang, Y.; Wang, L. The Interfacial Interaction between Asphalt Binder and Mineral Filler: A Comprehensive Review on Mechanisms, Evaluation Methods and Influence Factors. Int. J. Pavement Eng. 2022, 23, 4291–4305. [Google Scholar] [CrossRef]
Figure 1. Flowchart of this research plan.
Buildings 16 02041 g001
Figure 2. Gradation curve.
Buildings 16 02041 g002
Figure 3. MSCR test procedure for asphalt mortar.
Buildings 16 02041 g003
Figure 4. MSRL testing procedure for asphalt mixture.
Buildings 16 02041 g004
Figure 5. Schematic diagram of a single loading cycle for MSCR and MSRL tests. (a) Strain evolution during a single MSCR loading–unloading cycle; (b) Schematic of stress–strain response in a single MSRL cycle.
Buildings 16 02041 g005
Figure 6. Influence of applied stress on recoverable energy.
Buildings 16 02041 g006
Figure 7. Influence of applied stress on dissipated energy.
Buildings 16 02041 g007
Figure 8. Influence of applied stress on recoverable energy coefficient.
Buildings 16 02041 g008
Figure 9. Influence of gradation on recoverable energy.
Buildings 16 02041 g009
Figure 10. Influence of gradation on dissipated energy.
Buildings 16 02041 g010
Figure 11. Influence of gradation on recoverable energy coefficient.
Buildings 16 02041 g011
Figure 12. Influence of temperature on recoverable energy.
Buildings 16 02041 g012
Figure 13. Influence of temperature on dissipated energy.
Buildings 16 02041 g013
Figure 14. Influence of temperature on recoverable energy coefficient.
Buildings 16 02041 g014
Figure 15. Plot of the correlation coefficients among the six energy indicators of mortar and mixture.
Buildings 16 02041 g015
Figure 16. Measured and predicted U_(r-mix) by the multiple linear regression model.
Buildings 16 02041 g016
Figure 17. Structure of the ANN model.
Buildings 16 02041 g017
Figure 18. Results of the training, validation, testing, and all data of the ANN model. (a) Training set; (b) Validation set; (c) Testing set; (d) Full dataset, in panel (d), color intensity indicates the local density of data points.
Buildings 16 02041 g018
Table 1. The properties of asphalt binders.
Test ItemPG70PG76PG82Test Method
Penetration (0.1 mm)605143T0604-2000
Ductility (cm)28.333.234.1T0605-1993
Softening point (°C)72.082.085.0T0606-2000
Dynamic viscosity at 60 °C31,00039,00044,000T0625-2000
Density (g/cm3)1.0311.0311.031T0603-1993
G / s i n δ 1.98 (70 °C)1.77 (76 °C)1.89 (82 °C)AASHTO M 320-10
G / s i n δ (short-term aged)2.94 (70 °C)3.05 (76 °C)2.77 (82 °C)
Table 2. The properties of coarse aggregate.
Test ItemTest IndicatorSpecificationTest Method
Crushing value (%)15.5≤30T0316-2005
Apparent relative density2.756≥2.45T0304-2005
Los Angeles abrasion loss (%)12.4≤35T0317-2005
Content of elongated and flaky particles (%)7.4≤20T0312-2005
Table 3. The properties of fine aggregate.
Test ItemTest IndicatorSpecificationTest Method
Sand equivalent (%)79.6≥60T0334-1994
Apparent relative density2.815≥2.45T0328-2005
Angularity (s)40.8≥30T0345-2005
Table 4. The basic performance indicators of the mineral powder.
Test ItemTest IndicatorSpecificationTest Method
Apparent density (g/cm3)2.715≥2.45T0352-2000
Water content (%)0.3≤1.0T0103-2005
Hydrophilic coefficient0.6≤1.0T0353-2005
Passing rate (%)0.6 mm100100T 0351-2000
0.15 mm99.390~100
0.075 mm95.570~100
Table 5. Surface area coefficients of aggregate particle sizes.
Sieving Size (mm)4.752.361.180.60.30.150.075
Surface Area Coefficient0.00410.00820.001640.028710.06140.12290.3277
Note: For aggregates larger than 4.75 mm, the coefficient is 0.0041.
Table 6. Calculated Asphalt-aggregate Ratio for Asphalt Mortar.
GradationSA (m2/kg)SA<2.36 (m2/kg)Pa (%)P2.36 (%)Pa−mortar (%)
FSMA137.0106.4895.820.526.2
FAC204.9904.4334.430.013.0
FAC254.9194.4254.429.013.6
Table 7. Stepwise regression results for input variable selection.
Potential Inputsp-ValueSignificant?
T (°C)1.30 × 10−181yes
t 0.510no
G / s i n δ 7.59 × 10−65yes
σ m o r t a r 0.608no
σ m i x 0yes
U r m o r t a r 1.80 × 10⁻²yes
U d m o r t a r 0.329no
η m o r t a r 2.60 × 10⁻³yes
Mixture 19.0 mm Percentage passing (Pmix−19.0)8.12 × 10⁻¹⁴yes
Note: “Yes” indicates statistical significance at the 95% confidence level (p < 0.05), whereas “No” indicates non-significance (p ≥ 0.05).
Table 8. Performance comparison of ANN models with different numbers of hidden neurons.
Hidden NeuronsR2 (Train)MSE (Train)RMSE (Train)R2 (Validation)MSE (Validation)RMSE (Validation)
50.9810.00300.05490.98480.00280.0525
80.9960.00120.03410.99320.00120.0350
100.9970.00060.02510.99560.00080.0282
120.9970.00050.02330.99680.00060.0240
150.9980.00050.02170.99710.00050.0229
200.9970.00040.02010.99700.00050.0233
Table 9. The main architectural parameters for the developed ANN model.
ANN Structure ParameterInput
Hidden Layers1
Nodes (Neurons) of Hidden Layers15
Transfer Function of Hidden LayersTANSIG
Transfer Function of Output LayerTANSIG
Input Size6
Output Size1
Training FunctionTRAINLM
Adaptation Learning FunctionLEARNGDM
Table 10. Five-fold cross-validation results of the ANN model.
FoldR2 (Train)RMSE (Train)MAE (Train)R2 (Test)RMSE (Test)MAE (Test)
10.9970.0020.0020.9690.0080.006
20.9950.0030.0020.9830.0050.004
30.9970.0020.0020.9640.0070.005
40.9980.0020.0010.9910.0040.003
50.9940.0030.0020.9840.0050.003
Mean---0.9780.0060.004
SD---0.0110.0020.001
Disclaimer/Publisher’s Note: The statements, opinions and data contained in all publications are solely those of the individual author(s) and contributor(s) and not of MDPI and/or the editor(s). MDPI and/or the editor(s) disclaim responsibility for any injury to people or property resulting from any ideas, methods, instructions or products referred to in the content.