Article

Distinct Contributions of Building-Integrated PV and BESS to Energy and Cost Reduction Using Measured Operational Data

Department of Building Energy Research, Korea Institute of Civil Engineering and Building Technology, Goyang 10223, Republic of Korea
*
Author to whom correspondence should be addressed.
Buildings 2026, 16(10), 2038; https://doi.org/10.3390/buildings16102038
Submission received: 6 May 2026 / Revised: 19 May 2026 / Accepted: 20 May 2026 / Published: 21 May 2026

Abstract

Despite the widespread deployment of combined PV–BESS systems in community buildings, the distinct contributions of each technology to energy consumption reduction and electricity cost savings remain poorly quantified under real operational conditions. Three years of measured hourly operational data (2023–2025) from a twelve-building mixed-use complex in Siheung-si, South Korea, were analyzed to disaggregate the contributions of a 105.84 kW PV array and a 216 kWh BESS operating under a time-of-use (TOU) electricity tariff. PV and BESS contributions were separated by computing hourly energy flows from measured generation, charging, and discharging data. PV self-consumption accounted for all energy savings, totaling 270,028 kWh over the study period, while the BESS recorded a net energy loss of −7833 kWh due to round-trip efficiency losses. In contrast, the BESS contributed to electricity cost reduction by shifting on-peak consumption to off-peak charging periods, accounting for 13–15% of total annual cost savings. Total electricity cost reduction over three years reached $31,020, with on-peak periods contributing 70.3% of savings. These results establish that PV and BESS serve fundamentally distinct functions: PV reduces both energy consumption and electricity costs through direct self-consumption, while BESS operates as a cost-shifting mechanism through TOU arbitrage without reducing net energy use. The quantitative results provide a practical basis for evaluating PV–BESS systems in community-scale buildings under real-world tariff conditions.

1. Introduction

The deployment of photovoltaic (PV) systems and battery energy storage systems (BESS) has expanded rapidly over the past decade, driven by declining technology costs and supportive policy frameworks aimed at reducing building sector carbon emissions [1,2,3]. The integration of these two technologies has emerged as a central strategy for reducing electricity costs and improving energy self-sufficiency in buildings and communities [4,5,6,7]. PV systems reduce grid electricity demand through direct self-consumption of on-site generation, while BESS enables temporal shifting of electricity consumption by charging during low-tariff periods and discharging during high-tariff periods.
Although both technologies are frequently deployed together, their individual contributions to energy and cost reduction operate through fundamentally distinct mechanisms and are rarely quantified separately in field-based studies. Under time-of-use (TOU) electricity tariff structures, the cost impact of PV and BESS depends not only on the total volume of energy shifted but also on the tariff period during which each technology operates. PV generation, concentrated in daytime mid-peak and on-peak hours, displaces high-tariff grid consumption. BESS, by contrast, increases off-peak consumption through charging while reducing on-peak demand through discharge, generating cost savings through tariff period arbitrage. These distinct mechanisms imply that energy savings and cost savings attributable to each technology may differ substantially in both magnitude and direction, and their disaggregation is essential for accurate performance evaluation and system sizing [8,9]. In particular, aggregate performance metrics conflate the contributions of both technologies and may misrepresent the individual performance of each system component.
Despite the growing deployment of combined PV–BESS systems, quantitative field-based evidence that disentangles the individual contributions of each technology remains limited. Simulation-based studies have explored the optimal sizing and scheduling of PV–BESS systems under TOU tariffs, including community-scale configurations with mixed building types; however, their findings are constrained by assumed system parameters and idealized operating conditions [10,11,12,13]. Studies based on measured operational data have primarily focused on aggregate performance metrics, such as self-consumption ratio, peak demand reduction, and total electricity cost savings, without attributing these outcomes to each technology independently [14]. As a result, the relative roles of PV self-consumption and BESS peak-shifting in determining system economics remain poorly understood. This limitation is becoming increasingly important as PV–BESS systems are deployed across a growing range of configurations, from individual buildings with on-site installations to multi-building communities sharing a common grid connection point. The applicable scope of PV is also expanding beyond conventional rooftop arrays to building-integrated photovoltaic (BIPV) systems incorporating façade-mounted modules [15]. As recent studies have highlighted the value of data-driven forecasting for BESS operation [16] and the sensitivity of storage economics to TOU tariff structures [17], accurate component-level quantification is becoming essential for reliable performance assessment.
In both configurations, attributing energy and cost outcomes to individual components without a systematic accounting framework is inherently difficult, making the disaggregation gap identified above practically significant. Importantly, the energy accounting approach required for this disaggregation depends only on measured generation, charging, and discharging data at the grid connection point, and is therefore equally applicable to both configurations.
This study addresses this gap using three years of measured hourly operational data (2023–2025) from a community-scale PV–BESS system in a twelve-building mixed-use complex in South Korea. An energy accounting method based on measured generation, charging, and discharging data is applied to attribute the contributions of PV self-consumption and BESS peak-shifting to energy and electricity cost reduction under a TOU tariff structure. This method requires only on-site metered data at the grid connection point, without simulation or additional instrumentation. This approach enables transparent and reproducible quantification of individual system contributions under real operational conditions. The present analysis provides field-based quantification of PV and BESS contributions separated by TOU period and establishes a practical energy accounting methodology applicable to both community-scale and individual building PV–BESS systems, including BIPV installations. The results further demonstrate that, under real operational conditions, BESS functions as a cost-shifting mechanism that achieves electricity cost savings through TOU arbitrage without reducing net energy use. The findings are expected to provide practical reference data for evaluating combined PV–BESS systems and to support evidence-based decisions regarding system sizing and tariff design.

2. Materials and Methods

2.1. Site Description and System Specifications

The twelve-building mixed-use complex is located in Siheung-si, South Korea, and served as the study site [4]. The community comprises buildings with various functions including offices, classrooms, exhibition halls, accommodation, and cultural facilities, with a total floor area of 17,809.72 m2. Despite their functional diversity, all buildings are served under a single grid connection point, and the aggregated community load profile is dominated by weekday daytime occupancy patterns. Weekend loads are substantially lower and exhibit flatter diurnal patterns, consistent with reduced occupancy across the majority of building types in the community.
The energy-sharing system was installed in October 2022, and the grid power is supplied at 22.9 kV with a contracted power of 1500 kW. The energy system consists of three roof-integrated PV systems and one BESS installed for collective community use. PV systems were installed on three buildings within the community with a total capacity of 105.84 kW. The BESS has a power conversion system (PCS) rated at 100.5 kW and a battery capacity of 216 kWh, operated with a state of charge range of 10–90%. The BESS was operated under a fixed schedule: charging during off-peak periods and discharging during on-peak periods. The nominal charge and discharge times are as specified in Table 1. The seasonal timing adjustment of the discharge start time operates within the framework of the fixed schedule and does not constitute a dynamic or optimized control strategy. Key system specifications are summarized in Table 1.

2.2. Data Collection and Analysis Methodology

Hourly measurement data collected from January 2023 to December 2025 were obtained from the building energy management system (BEMS) installed at the community, covering three complete calendar years. The analysis is based on time-of-use hourly metered data. The baseline electricity consumption without PV and BESS is reconstructed from measured data using Equation (1). Three assumptions underlie this reconstruction: (1) the community load is independent of the presence or absence of PV and BESS; (2) all PV generation is self-consumed on site with no grid export; and (3) the net impact of BESS on grid consumption is represented by the difference between discharge and charge energy. The validity of assumption (2) is supported by two lines of evidence: the measured PV self-consumption ratio was confirmed to be 100% across all three years of the study period, and the total installed PV capacity of 105.84 kW represents approximately 7% of the community’s contracted power of 1500 kW. Minor discrepancies exist between hourly accumulated values and monthly meter readings due to communication errors causing partial data loss, with several months across the study period showing substantially reduced values. The affected months include March, September, and December 2024, and September, October, and November 2025. These months were retained in the annual totals as recorded rather than excluded or imputed, as the underlying physical system operation continued uninterrupted throughout.
To quantify the individual contributions of PV and BESS to energy and cost reduction, the energy accounting method described in Equations (1)–(4) was applied. Equation (1) reconstructs the estimated baseline electricity consumption without PV and BESS by adding PV self-consumption and the net BESS energy balance back to the measured consumption. Equation (2) defines PV self-consumption as the lesser of PV generation and measured consumption, reflecting the constraint that PV output cannot exceed the building load. Equation (3) defines PV surplus energy as the remainder after self-consumption. Equation (4) calculates the electricity consumption charge (energy component of the tariff) as the sum of consumption in each TOU period multiplied by the corresponding tariff rate. Since the community load was present in every hour of the study period and exceeded PV generation at all times, no surplus PV energy was exported to the grid, and all PV generation was fully self-consumed on site.
The electricity tariff applied is the General Service (B), High-Voltage A, Option II rate schedule of the Korea Electric Power Corporation (KEPCO), applicable to customers with a contract demand of 300 kW or more. Consumption is classified into off-peak, mid-peak, and on-peak periods with rates varying by season: summer (June–August), spring/fall (March–May, September–October), and winter (November–February). Saturday on-peak consumption is metered as mid-peak, and Sunday consumption is entirely classified as off-peak. Two KEPCO tariff revisions affected the applicable rate schedule during the study period: the first took effect on 1 January 2023, which also introduced a revised season–time-period classification; the second took effect on 16 May 2023. Subsequent revisions through April 2025 did not alter the applicable rates, which remained unchanged for the remainder of the study period. Each hourly consumption value was assigned the tariff rate corresponding to its revision period, season, and time-of-use classification. The time-of-use period classifications by season applied in this study are summarized in Table 2 [18].
E b e f o r e = E a f t e r + E P V ,   s e l f + E B E S S , d i s E B E S S , c h g
E P V ,   s e l f = m i n E P V ,   E a f t e r
E P V ,   s u r p l u s = E P V E P V ,   s e l f
C = E o f f · r o f f + E m i d · r m i d + E p e a k · r p e a k
where
  • E b e f o r e : estimated electricity consumption without PV and BESS (kWh);
  • E a f t e r : measured electricity consumption with PV and BESS installed (kWh);
  • E P V : PV generation (kWh);
  • E P V ,   s e l f : PV self-consumption (kWh);
  • E P V ,   s u r p l u s : PV surplus energy exported to grid (kWh);
  • E B E S S , c h g : BESS charging energy (kWh);
  • E B E S S , d i s : BESS discharging energy (kWh);
  • E o f f ,   E m i d ,   E p e a k : electricity consumption during off-peak, mid-peak, and on-peak periods (kWh);
  • r o f f ,   r m i d ,   r p e a k : electricity tariffs for off-peak, mid-peak, and on-peak periods (KRW/kWh);
  • C : electricity energy charge (KRW).

3. Results and Discussion

3.1. System Operation Characteristics

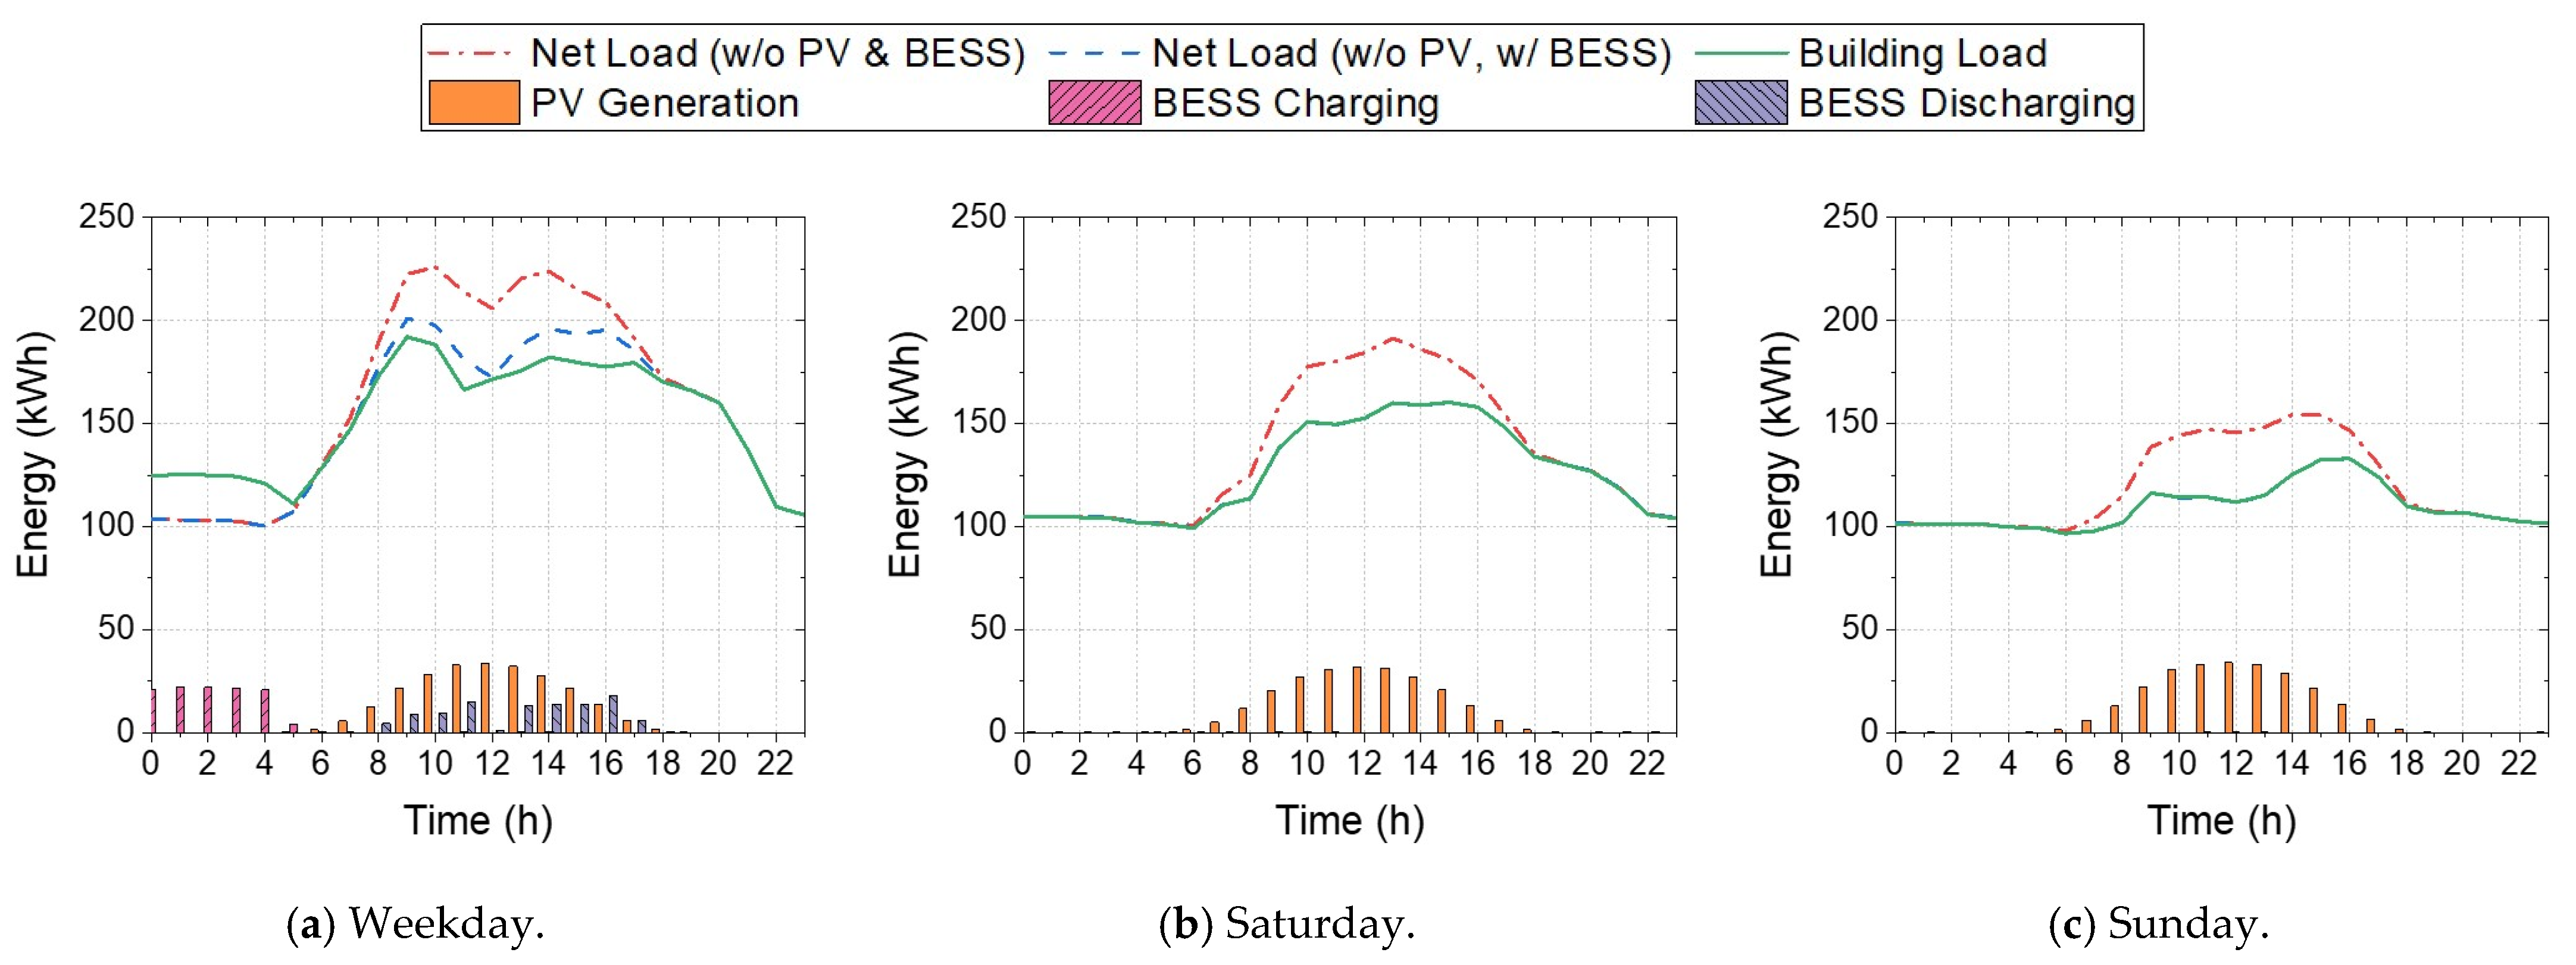
The average hourly load profiles reveal distinct operational patterns by day type. Figure 1 shows three load profiles. Building Load is the measured electricity consumption with PV and BESS in operation. Net Load (w/o PV & BESS) is the estimated baseline grid demand, reconstructed by removing PV and BESS contributions. Net Load (w/o PV, w/BESS) is the intermediate case in which only the BESS contribution is retained. The three-year average (2023–2025) profiles are shown for weekdays (Monday–Friday), Saturdays, and Sundays. On weekdays, the load profile exhibits a distinct double-peak pattern during the morning (09:00–12:00) and afternoon (13:00–17:00) hours, corresponding to the on-peak TOU periods. PV generation rises from approximately 08:00, reaching its maximum near midday, and partially offsets the daytime load. BESS charging is concentrated in the early morning hours (00:00–05:00) during the off-peak period, while discharging occurs during on-peak periods, reducing grid imports during the most expensive tariff hours. The nominal BESS discharge schedule spans 10:00–12:00 and 13:00–17:00 (Table 1). In summer and winter, HVAC systems are pre-operated prior to occupancy, elevating the building load before the standard on-peak window. The discharge start time was accordingly shifted earlier during these seasons, which accounts for the BESS discharge activity observed before 10:00 in the seasonal average profiles. On Saturdays, the load level is moderately lower than on weekdays, and BESS discharging is less pronounced. On Sundays, the load profile is flatter throughout the day, with all consumption metered at off-peak rates and BESS operation suspended entirely under the fixed schedule.

3.2. Energy and Cost Analysis

The annual energy balance results are presented in Table 3. Over three years, the total estimated electricity consumption without PV and BESS ( E b e f o r e ) was 4,007,640 kWh, while the measured consumption ( E a f t e r ) was 3,745,454 kWh, yielding a total energy reduction of 262,186 kWh (6.5%). PV self-consumption was the primary driver of energy savings, totaling 270,028 kWh over three years, with annual values of 88,889 kWh (2023), 102,468 kWh (2024), and 78,671 kWh (2025). In contrast, the BESS recorded a net energy loss across all months and all three years. The BESS net energy balance, defined as the difference between discharging and charging energy, was −2716 kWh (2023), −2873 kWh (2024), and −2244 kWh (2025), totaling −7833 kWh over the study period. This net loss arises from round-trip efficiency losses inherent to the battery system: energy dissipated during charging and discharging cycles means the BESS consumes more grid energy than it returns. The absolute magnitude of this loss is small (approximately 0.2% of total three-year grid consumption). Nevertheless, this result confirms that the BESS does not contribute to net energy reduction and should be evaluated based on its cost-shifting performance. The three-year average round-trip efficiency of 91.4% is consistent with the round-trip efficiencies generally exceeding 90% reported for lithium-ion BESS in AC-coupled configurations. The stability of the round-trip efficiency across all three years, with annual values showing no meaningful trend, indicates that the battery system maintained consistent electrochemical performance without measurable capacity degradation over the study period. This is attributable in part to the conservative state-of-charge operating range (10–90%) and the low cycle depth imposed by the fixed charge–discharge schedule. The PV self-consumption ratio was 100% across all years, confirming that the installed PV capacity did not exceed the community load in any hour. The PV self-sufficiency ratio, defined as the share of measured electricity consumption covered by PV self-consumption, averaged 7.2% annually (7.2% in 2023, 8.2% in 2024, and 6.3% in 2025).
Beyond the aggregate energy balance, the installation of the PV–BESS system also altered the distribution of grid energy consumption across TOU periods, as presented in Table 4. While on-peak and mid-peak consumption decreased substantially, off-peak consumption is consistently higher after PV–BESS installation than the estimated baseline because BESS charging during off-peak hours adds to grid imports. On-peak consumption showed the most significant reduction, decreasing from 1,004,091 kWh to 830,478 kWh over three years (−17.3%). Mid-peak consumption also decreased by 132,837 kWh (−8.7%), driven primarily by PV self-consumption during daytime mid-peak hours.
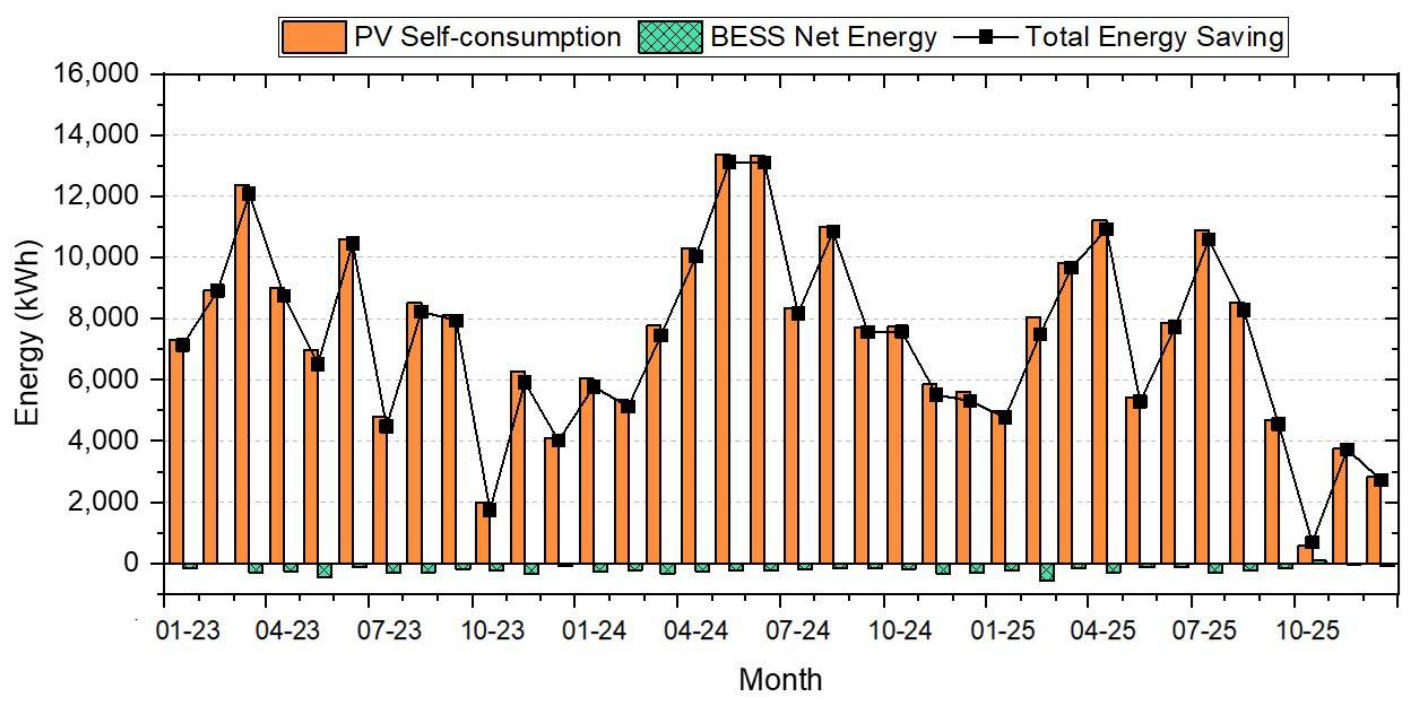
Figure 2 presents the monthly PV self-consumption and BESS net energy, along with their combined contribution expressed as total energy saving. PV self-consumption exhibits a clear seasonal pattern, peaking in spring and early summer and declining in winter, consistent with seasonal solar irradiance variations. The BESS net energy is defined as the difference between discharging and charging energy; this value is negative across all months due to round-trip efficiency losses, indicating that the BESS consumes more grid energy than it returns. Accordingly, the total energy saving is calculated as the sum of PV self-consumption and BESS net energy, and is dominated by the PV contribution.
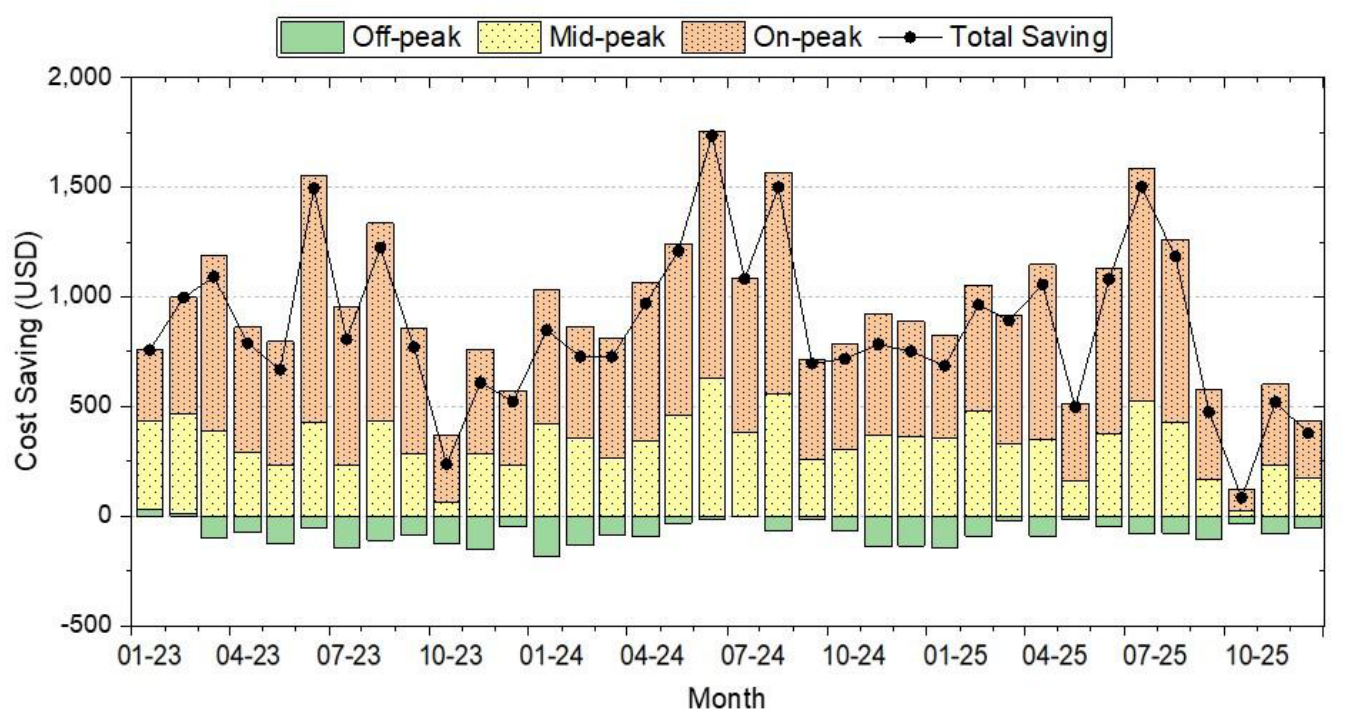
The annual electricity costs by TOU period, before and after PV–BESS installation, are summarized in Table 5. All cost values are converted from Korean Won (KRW) to US dollars (USD) using a fixed exchange rate of 1400 KRW/USD. The total electricity cost decreased from $366,223 to $335,203, achieving a cumulative cost saving of $31,020 over three years, averaging $10,340 per year or approximately $862 per month. The on-peak period contributed the largest share of cost savings at $21,812, followed by mid-peak savings of $12,027. Off-peak costs increased by $2818 as a direct consequence of BESS charging operations, consistent with the energy analysis results. On-peak savings accounted for 70.3% of total three-year cost savings.
On-peak cost savings consistently dominated total savings throughout the study period, while off-peak costs remained elevated due to BESS charging loads. Seasonal peaks in cost savings coincide with summer months (June–August), when on-peak tariff rates are highest and PV generation is substantial, reflecting the combined effect of reduced on-peak consumption and higher applicable tariff rates. Monthly electricity cost savings by TOU period are illustrated in Figure 3.
These results highlight the fundamentally distinct roles of the two technologies. While PV systems contributed to both energy and cost reduction through direct self-consumption, in this study, the BESS functioned exclusively as a cost-shifting mechanism. The net energy balance of the BESS was negative across all months, yet the BESS achieved meaningful electricity cost reduction by exploiting the price differential between off-peak charging and on-peak discharging. The relatively modest BESS cost-saving contribution reflects capacity constraints. With a battery capacity of 216 kWh and a PCS rated at 100.5 kW, the daily energy that can be shifted is inherently limited relative to the community’s contracted power of 1500 kW.
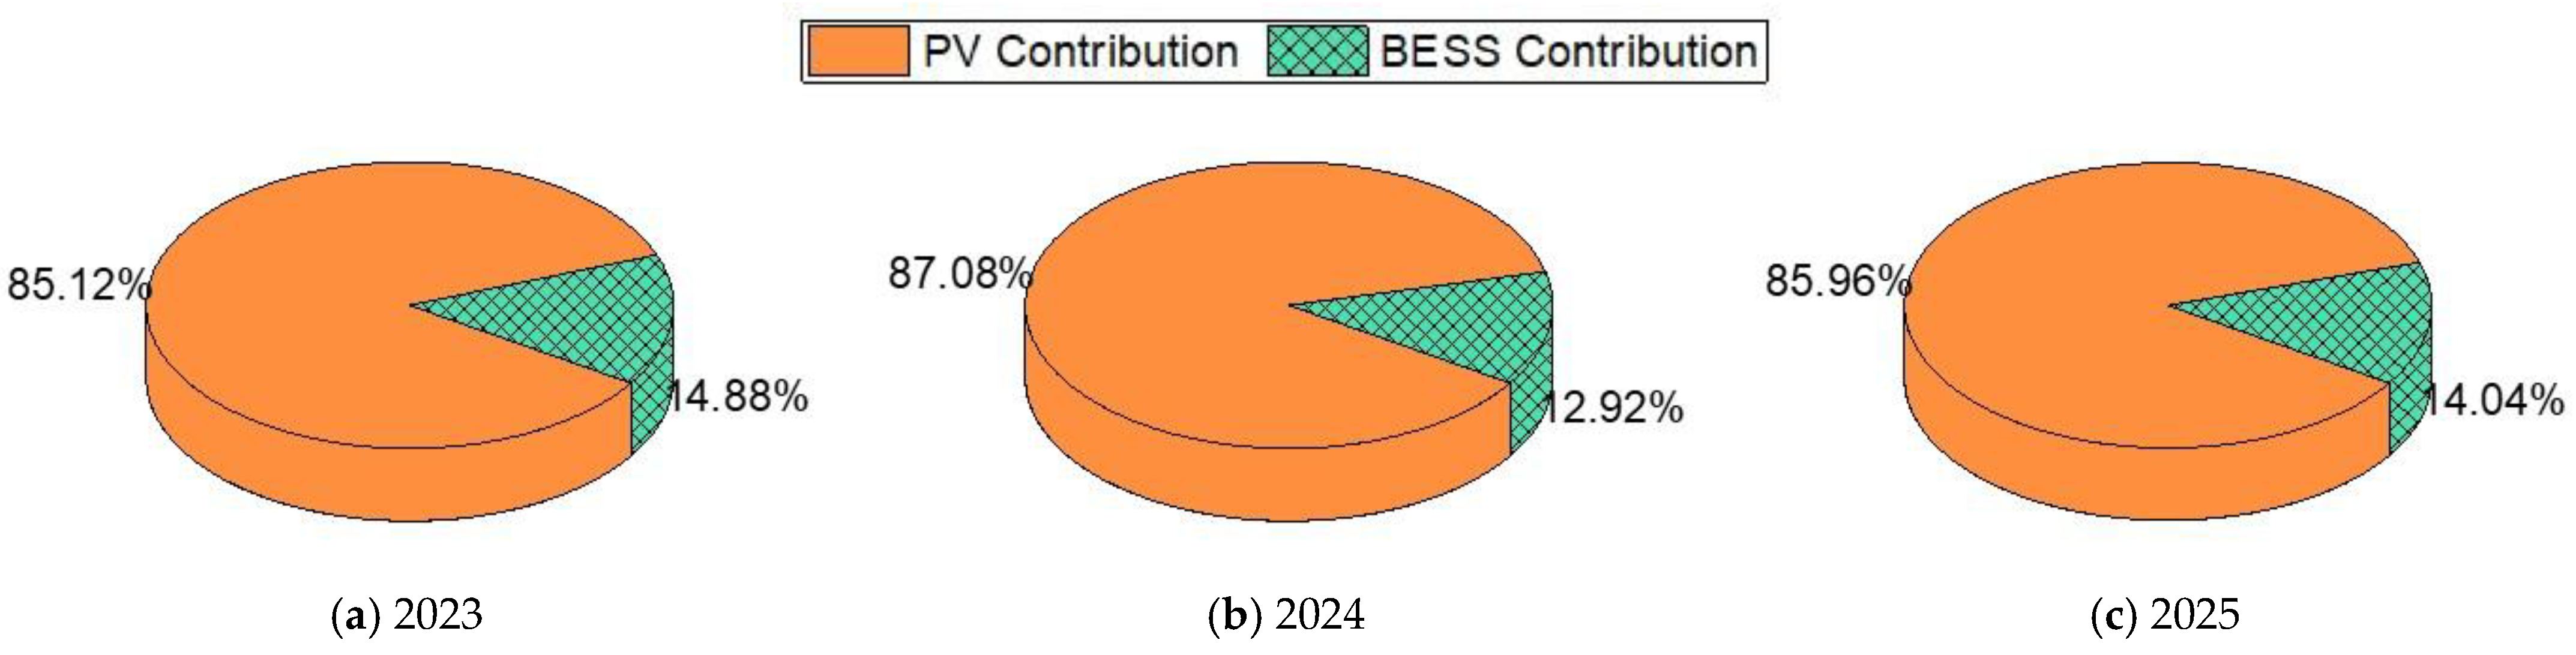
The annual breakdown of electricity cost savings attributed to PV self-consumption and BESS peak-shifting is presented in Figure 4. The PV contribution was calculated as the product of PV self-consumption energy and the corresponding TOU tariff rate at each hour. The BESS contribution was defined as the net cost reduction from BESS operation, computed as the difference between BESS discharge revenue and BESS charging cost at their respective tariff rates. On average, PV self-consumption accounted for approximately 86% of total annual cost savings (85–87% across individual years), while BESS contributed the remaining 14% (13–15%).
The stability of this contribution ratio across the three years indicates that the cost-saving performance of each system remained consistent throughout the study period, with PV as the primary driver and BESS serving a supplementary role in cost reduction. This consistency suggests that the relative contributions of PV and BESS are largely determined by system configuration and tariff structure under a given operational strategy, rather than year-to-year variability in system performance. These findings highlight that on-peak cost displacement should be considered the primary performance metric for evaluating combined PV–BESS systems under TOU tariff structures, as aggregate energy or cost reduction metrics may obscure the distinct functional roles of each technology.
Several limitations of this study should be acknowledged. First, partial data loss due to BEMS communication errors in several months across the study period may result in slight underestimation of annual energy and cost totals; the 2025 annual values are most likely affected. Second, the cost analysis covers only the consumption-based energy charge component of the KEPCO tariff; demand charges are excluded. Because BESS reduces on-peak power imports, its total economic benefit may be underestimated. Third, the fixed BESS charge–discharge schedule represents the actual operational condition but may not represent the maximum achievable cost savings; optimized scheduling could yield higher TOU arbitrage benefits. Fourth, results are specific to this site, tariff structure, and system configuration, and may not generalize directly to other contexts.

4. Conclusions

Three years of measured operational data (2023–2025) from a community-scale PV–BESS energy-sharing system were analyzed to quantify the distinct contributions of each technology. The system comprises 105.84 kW PV, 216 kWh BESS operating under a fixed charge–discharge schedule, and is subject to the KEPCO General Service B High-Voltage A Option II TOU tariff. The central finding is that PV and BESS serve fundamentally distinct functional roles: PV reduces both energy consumption and electricity costs through direct self-consumption, while BESS functions as a cost-shifting mechanism that achieves electricity cost savings through TOU arbitrage, though with a marginal net energy loss due to round-trip efficiency. The key findings are as follows. First, PV self-consumption totaled 270,028 kWh over the study period and was the primary driver of energy savings. The BESS incurred a cumulative net energy loss of −7833 kWh due to round-trip efficiency losses. The resulting net energy reduction amounted to 262,186 kWh over three years. Second, total electricity cost savings over three years amounted to $31,020. The on-peak period contributed the largest share of savings (70.3%), confirming that on-peak tariff displacement is the dominant cost-saving mechanism. Third, PV self-consumption accounted for approximately 85–87% of total annual cost savings, while BESS TOU arbitrage contributed the remaining 13–15%. The BESS contribution was limited by its installed capacity relative to the community’s contracted power demand.
The findings have direct practical relevance for system designers, building owners, and policymakers. For system designers: the quantitative disaggregation of PV and BESS contributions provides reference values for capacity planning, enabling evaluation of whether BESS capacity is proportionate to the achievable cost-shifting benefit under TOU tariffs. For building owners: PV is the primary driver of both energy and cost reduction, while BESS contributes a supplementary cost-shifting benefit; this distinction is relevant for investment prioritization. For policymakers: the quantitative evidence that BESS functions exclusively as a cost-shifting mechanism under TOU tariffs provides a basis for designing storage incentive programs and evaluating tariff structures.
Although this study analyzes a community-scale system, the energy accounting methodology is equally applicable to individual buildings. The disaggregation approach relies solely on metered generation, charging, and discharging data at the grid connection point, and is therefore applicable regardless of system scale. The primary data requirements for applying this methodology to other sites are: (1) hourly metered PV generation, (2) BESS charging and discharging energy, and (3) total grid consumption at the connection point, along with the applicable TOU tariff schedule. Future work will examine these dynamics in broader deployment contexts, including BIPV-integrated systems and configurations incorporating optimized control strategies or direct PV-to-BESS charging, using field measurement data.

Author Contributions

Conceptualization, J.E. and G.-S.C.; methodology, J.E.; data curation, J.E.; formal analysis, J.E.; visualization, J.E.; writing—original draft preparation, J.E.; writing—review and editing, J.E. and G.-S.C.; supervision, G.-S.C. All authors have read and agreed to the published version of the manuscript.

Funding

This work was supported by the Korea Institute of Energy Technology Evaluation and Planning (KETEP) and the Ministry of Climate, Energy & Environment (MCEE) of the Republic of Korea (No. RS-2024-00459594).

Data Availability Statement

Data are contained within the article.

Conflicts of Interest

The authors declare no conflicts of interest.

References

  1. IEA. Renewables 2023; IEA: Paris, France, 2024. [Google Scholar]
  2. IEA. Batteries and Secure Energy Transitions; IEA: Paris, France, 2024. [Google Scholar]
  3. IRENA. Renewable Capacity Statistics 2024; IRENA: Abu Dhabi, United Arab Emirates, 2024. [Google Scholar]
  4. Eum, J.; Lee, H.; Choi, G.-S. Analysis of the Operational Outcomes of an Energy-Sharing System for Low-Carbon Energy Community in South Korea. Buildings 2023, 13, 2797. [Google Scholar] [CrossRef]
  5. Han, G.; An, Y.; Kim, J.-K.; Jung, D.E.; Joo, H.-J.; Kim, H.; Kim, M.-H. Analysis of grid flexibility in 100% electrified urban energy community: A year-long empirical study. Sustain. Cities Soc. 2024, 113, 105648. [Google Scholar] [CrossRef]
  6. Li, B.; Liu, Z.; Wu, Y.; Wang, P.; Liu, R.; Zhang, L. Review on photovoltaic with battery energy storage system for power supply to buildings: Challenges and opportunities. J. Energy Storage 2023, 61, 106763. [Google Scholar] [CrossRef]
  7. Li, Y.; Qian, F.; Gao, W.; Fukuda, H.; Wang, Y. Techno-economic performance of battery energy storage system in an energy sharing community. J. Energy Storage 2022, 50, 104247. [Google Scholar] [CrossRef]
  8. Pan, X.; Khezri, R.; Mahmoudi, A.; Muyeen, S.M. Optimal planning of solar PV and battery storage with energy management systems for Time-of-Use and flat electricity tariffs. IET Renew. Power Gener. 2022, 16, 1206–1219. [Google Scholar] [CrossRef]
  9. Wu, Y.; Liu, Z.; Li, B.; Liu, J.; Zhang, L. Energy management strategy and optimal battery capacity for flexible PV-battery system under time-of-use tariff. Renew. Energy 2022, 200, 558–570. [Google Scholar] [CrossRef]
  10. Chen, X.; Liu, Z.; Wang, P.; Li, B.; Liu, R.; Zhang, L.; Zhao, C.; Luo, S. Multi-objective optimization of battery capacity of grid-connected PV-BESS system in hybrid building energy sharing community considering time-of-use tariff. Appl. Energy 2023, 350, 121727. [Google Scholar] [CrossRef]
  11. Zhao, Z. Operation Simulation and Economic Analysis of Household Hybrid PV and BESS Systems in the Improved TOU Mode. Sustainability 2023, 15, 8853. [Google Scholar] [CrossRef]
  12. Hossain, J.; Kadir, A.F.A.; Shareef, H.; Manojkumar, R.; Saeed, N.; Hanafi, A.N. A Grid-Connected Optimal Hybrid PV-BES System Sizing for Malaysian Commercial Buildings. Sustainability 2023, 15, 10564. [Google Scholar] [CrossRef]
  13. Liu, C.; Liu, Z.; Wu, Y.; Li, B.; Liu, R. A group-based optimization design for PV-BESS in energy-sharing hybrid communities. Appl. Energy 2025, 391, 125896. [Google Scholar] [CrossRef]
  14. Zhao, G.; Clarke, J.; Searle, J.; Lewis, R.; Baker, J. Economic analysis of integrating photovoltaics and battery energy storage system in an office building. Energy Build. 2023, 284, 112980. [Google Scholar] [CrossRef]
  15. Quach, T.; Elstner, L.; Stumpf, E.; Schindler, M. A comprehensive case study of a full-size BIPV facade. Energies 2025, 18, 1293. [Google Scholar] [CrossRef]
  16. Yang, Z.; Kong, D.; Chen, Z.; Zhang, Z.; Du, D.; Zhu, Z. A Data-Driven Battery Energy Storage Regulation Approach Integrating Machine Learning Forecasting Models for Enhancing Building Energy Flexibility—A Case Study of a Net-Zero Carbon Building in China. Buildings 2025, 15, 3611. [Google Scholar] [CrossRef]
  17. Tang, H.; Zhang, Y.; Zheng, Z. How Time-of-Use Tariffs and Storage Costs Shape Optimal Hybrid Storage Portfolio in Buildings. Buildings 2026, 16, 42. [Google Scholar] [CrossRef]
  18. Korea Electric Power Corporation. Electric Rates Table (Effective 1 April 2025). Available online: https://online.kepco.co.kr/ (accessed on 30 March 2026).
Figure 1. Average hourly load profiles by day type, representing the three-year average (2023–2025).
Buildings 16 02038 g001
Figure 2. Monthly energy contributions of PV self-consumption and BESS net energy to total energy saving (kWh).
Buildings 16 02038 g002
Figure 3. Monthly electricity cost savings by time-of-use period (USD).
Buildings 16 02038 g003
Figure 4. Annual contribution of PV self-consumption and BESS to electricity cost savings (2023–2025).
Buildings 16 02038 g004
Table 1. Key specifications of the energy system.
ComponentSpecificationComponentSpecification
Community total floor area17,809.72 m2BESS PCS rated power100.5 kW
Number of buildings12BESS battery capacity216 kWh
Contracted power1500 kWBESS operating SOC range10–90%
PV total capacity105.84 kWBESS charging schedule00:00–05:00
PV capacity per building45.36 kW, 37.80 kW, 22.68 kWBESS discharging schedule10:00–12:00, 13:00–17:00
Table 2. Time-of-use period classification by season under the KEPCO tariff schedule.
TOU PeriodSummer
(June–August)
Spring/Fall
(March–May, September–October)
Winter
(November–February)
Off-peak22:00–08:0022:00–08:0022:00–08:00
Mid-peak08:00–11:00,
12:00–13:00,
18:00–22:00
08:00–11:00,
12:00–13:00,
18:00–22:00
08:00–09:00,
12:00–16:00,
19:00–22:00
On-peak11:00–12:00,
13:00–18:00
11:00–12:00,
13:00–18:00
09:00–12:00,
16:00–19:00
Table 3. Annual energy summary of the PV-BESS community system (kWh).
Year E b e f o r e
(kWh)
E a f t e r
(kWh)
E s a v i n g
(kWh)
E P V
(kWh)
E B E S S , c h g
(kWh)
E B E S S , d i s
(kWh)
20231,326,276.21,240,112.886,163.488,888.731,823.629,107.4
20241,350,657.51,251,062.599,595.0102,467.632,406.129,533.5
20251,330,706.01,254,278.576,427.578,671.226,967.524,723.8
Total4,007,639.73,745,453.8262,185.9270,027.591,197.283,364.7
Table 4. Annual grid energy consumption by time-of-use period (kWh).
YearOff-Peak (kWh)Mid-Peak (kWh)On-Peak (kWh)Total (kWh)
BeforeAfterBeforeAfterBeforeAfterBeforeAfter
2023499,432.0515,405.2
(−3.2%)
501,188.0458,598.4
(8.5%)
325,656.2266,109.2
(18.3%)
1,326,276.21,240,112.8
(6.5%)
2024504,140.3519,188.3
(−3.0%)
510,478.8458,995.8
(10.1%)
336,038.4272,878.3
(18.8%)
1,350,657.51,251,062.5
(7.4%)
2025482,040.3495,284.1
(−2.7%)
506,268.9467,504.4
(7.7%)
342,396.8291,490.1
(14.9%)
1,330,706.01,254,278.5
(5.7%)
Total1,485,612.61,529,877.6
(−3.0%)
1,517,935.71,385,098.6
(8.7%)
1,004,091.4830,477.6
(17.3%)
4,007,639.73,745,453.8
(6.5%)
Values in parentheses indicate the percentage change relative to the before value.
Table 5. Annual electricity cost by time-of-use period (USD; 1 USD = 1400 KRW).
YearOff-Peak (USD)Mid-Peak (USD)On-Peak (USD)Total (USD)
BeforeAfterBeforeAfterBeforeAfterBeforeAfter
202330,62331,606
(−3.2%)
44,38140,661
(8.4%)
41,27734,052
(17.5%)
116,280106,319
(8.6%)
202432,68533,667
(−3.0%)
47,68442,976
(9.9%)
44,50636,487
(18.0%)
124,875113,130
(9.4%)
202531,32032,173
(−2.7%)
47,72744,128
(7.5%)
46,02139,453
(14.3%)
125,068115,754
(7.4%)
Total94,62897,446
(−3.0%)
139,792127,765
(8.6%)
131,804109,992
(16.5%)
366,223335,203
(8.5%)
Values in parentheses indicate the percentage change relative to the before value.
Disclaimer/Publisher’s Note: The statements, opinions and data contained in all publications are solely those of the individual author(s) and contributor(s) and not of MDPI and/or the editor(s). MDPI and/or the editor(s) disclaim responsibility for any injury to people or property resulting from any ideas, methods, instructions or products referred to in the content.