Article

Nonlinear Dynamic Response of Pretensioned Saddle-Shaped Membrane Structure Under Rainstorm Load: Numerical Simulation and Experimental Verification

1
School of Civil Engineering and Transportation, Guangzhou University, Guangzhou 510006, China
2
Guangdong Engineering Technology Research Center for Complex Steel Structures, Guangzhou University, Guangzhou 510006, China
3
Housing and Urban-Rural Development Bureau of Xuzhou District, Yibin 644603, China
*
Author to whom correspondence should be addressed.
Buildings 2026, 16(10), 2010; https://doi.org/10.3390/buildings16102010
Submission received: 23 March 2026 / Revised: 4 May 2026 / Accepted: 14 May 2026 / Published: 20 May 2026
(This article belongs to the Section Building Structures)

Abstract

Membrane roofs with saddle geometry are widely used in stadiums and public facilities that are highly exposed to rainfall. However, current design practice typically considers rainfall only in terms of seepage effects, drainage requirements, or static stability checks, while the influence of extreme rainfall on dynamic behavior and prestress loss has not been comprehensively quantified. In this study, the behavior of a restored engineering-scale saddle-shaped membrane roof under three representative rainfall intensities (50, 300, and 550 mm/h) is investigated through combined laboratory experiments (span L = 2.52 m) and numerical simulations, with particular emphasis on how supporting conditions and pretension levels affect vertical displacement, vibration propagation, and rainfall-induced edge-cable pretension loss. The findings are intended to reveal response mechanisms and trends, while quantitative extrapolation to full-size roofs should be conducted with scaling considerations. The numerical model is validated against the experimental results through comparisons of cable forces and vertical displacements. The results indicate that while the maximum vertical displacement induced by heavy rainfall is small (millimeter-level) and does not cause immediate failure, the rainfall event induces a significant permanent loss of pretension (a maximum observed relaxation of 10.4% in the edge cables for the tested specimen) in the edge cables. This relaxation degrades the structural stiffness, potentially compromising aerodynamic stability under subsequent wind events. Consequently, for the tested configuration, post-rainfall pretension inspection is recommended for events exceeding 300 mm/h, with retensioning suggested if significant tension loss is detected. This recommendation should be interpreted as an indicative engineering reference for the present specimen rather than a universal criterion for all saddle membrane roofs.

1. Introduction

Membrane roofs are lightweight spatial structural systems in which prestressed flexible surfaces, typically made of high-strength coated fabrics, are anchored to bracing and tensioning frames [1]. Due to their low stiffness and lightweight nature, these structures are prone to significant deformation under external environmental loads such as wind, rain, snow, and impact, leading to potential dynamic relaxation or structural damage [2,3]. In recent years, saddle membrane roofs have been widely adopted for canopies and stadium stands in southern China, a region frequently subjected to short-term heavy rainfall during monsoon and typhoon seasons. However, several engineering projects have reported serviceability issues, such as excessive water accumulation (ponding), significant deflection, and even local tearing of the membrane following extreme rainfall events. These incidents have raised concerns among designers and maintenance engineers regarding the adequacy of current design measures [4,5,6], which predominantly focus on wind and snow loads while often neglecting the dynamic impact and cumulative effects of heavy rainfall.
Extensive research has been conducted on the aerodynamic response of membrane structures. Based on wind tunnel experiments, field monitoring, and numerical fluid structure interaction (FSI) analyses, the behaviors of ridge-valley membranes, saddle-shaped membrane roofs, and other flexible membrane systems under wind actions have been studied in detail [7,8,9,10,11]. Recent studies have further revealed the flow-field characteristics, vibration responses, and aerodynamic stability of saddle-shaped and membrane roof systems under wind-induced FSI conditions [12,13,14]. Frameworks for nonlinear aeroelastic stability and random vibration reliability have been developed for orthotropic membrane roofs, alongside proposals for structural health monitoring systems for long-span structures [15]. These studies underscore that the prestress level, cable stiffness, and geometric configuration determine the dynamic amplification and flutter risk. Crucially, they assume a stable initial prestress, which may not be valid if prior rainfall events have already induced relaxation.
In parallel, studies on impact dynamics have shown that membrane structures exhibit measurable nonlinear transient vibrations under hail and falling debris [16,17,18]. Through experiments and numerical simulations on membranes and cable–membrane systems with different geometries, previous studies have clarified the nonlinear transient vibration, energy transmission, and boundary-restraint effects of flexible membrane systems under impact loading [19,20]. Although these studies provide an important basis for understanding impact mechanics, they mainly concern solid projectiles rather than the continuous fluid impact associated with heavy rainfall.
In contrast, the direct effect of rainfall loads on flexible roofs, particularly tensioned membrane structures, has received less attention. While progress has been made in calculating rain loads, wind-driven rain effects, and coupled wind–rain responses [21,22,23,24,25,26,27], most existing studies rely on simplified geometries or scaled models. Experimental and numerical investigations on rectangular and saddle-shaped membranes indicate that heavy rainfall can cause transient vibration and measurable prestress loss, which subsequently affects wind resistance and structural reliability [28,29,30]. However, a systematic and quantitative understanding of the spatio-temporal response and the stress relaxation mechanism of engineering-scale saddle membrane roofs under pure heavy rainfall remains insufficient. In particular, there is still a lack of: (i) engineering-scale experimental data directly quantifying edge-cable pretension loss under representative extreme rainfall intensities; (ii) validated numerical models that isolate the momentum-flux effect of rainfall without wind and relate it to stiffness degradation of the membrane–cable system; (iii) experimentally supported criteria for post-rainfall inspection and retensioning based on measured prestress loss. Furthermore, although classical theories on raindrop spectra and kinetic energy provide a basis for physical rain models, field monitoring data and systematic engineering-scale evidence for evaluating prestress loss under extreme rainfall remain limited.
To address these gaps, this study investigates the dynamic response and prestress loss of an engineering-scale saddle-shaped membrane roof subjected to pure rainfall (without wind) through coordinated laboratory experiments and numerical simulations. Although wind-driven rain is more representative of actual environmental conditions, the pure-rainfall assumption is intentionally adopted here as a controlled baseline case, so that the independent effect of rainfall momentum flux on the membrane–cable system can be identified and validated without interference from aerodynamic loading. Unlike previous studies that mainly considered simplified membrane forms, scaled models, coupled environmental effects, or discrete impact events, the present work focuses on a practical saddle-shaped membrane system and specifically examines its rainfall-induced nonlinear response, vibration propagation, and edge-cable tension loss. In this way, the cumulative influence of rainfall on membrane prestress and structural stiffness can be quantified more clearly. In addition, it directly measures edge-cable tension loss after rainfall and evaluates its implication for structural stiffness degradation and post-event maintenance.
The key novelties and contributions are as follows: (1) A physics-based rainfall loading model is developed by converting the raindrop size spectrum and momentum conservation into an equivalent transient pressure field, and it is implemented in LS-DYNA as a time-varying distributed load for flexible membrane systems. (2) Engineering-scale controlled rainfall experiments (span L = 2.52 m) are conducted under multiple rainfall intensities (50–550 mm/h) to obtain displacement time histories and to directly quantify edge-cable tension loss/relaxation induced by rainfall. (3) A validated numerical model calibrated against experimental measurements is established to reveal the mechanisms of vibration propagation and stiffness degradation, as well as to interpret how boundary relaxation modifies the dynamic characteristics. (4) Engineering-oriented implications are provided, including a post-event inspection/retensioning criterion derived from the observed prestress-loss behavior, and a discussion of how rainfall-induced pretension reduction may increase vulnerability to subsequent wind actions.

2. Methods

2.1. Rainfall Intensity

Rainfall intensity, defined as the amount of rain falling per unit time (mm/h), is a critical parameter for determining the magnitude of rain loads in structural design and for assessing the risk of damage to membrane roofs. In this study, the maximum 1 min rainfall intensity, expressed as an equivalent rainfall rate in mm/h, is selected as the governing parameter. Owing to the low mass and stiffness of saddle-shaped membrane roofs, rainfall acts as a transient distributed excitation, making a short-term peak rainfall measure more relevant for evaluating rain-induced vibration and prestress loss. Accordingly, the maximum 1 min rainfall intensity is used here to represent the peak loading condition associated with structural dynamic response, rather than the total rainfall during a complete storm event. Table 1 shows the top five records of the maximum rainfall intensity in one minute from 105 meteorological stations in 31 major provincial capital cities in 1975–1984 [31].

2.2. Raindrop Spectrum

The raindrop spectrum describes the distribution of raindrop sizes and their corresponding number concentration per unit volume of air. The Marshall–Palmer (M–P) distribution [32] is one of the most widely used raindrop spectra in both domestic and international studies. Although the M–P distribution was originally developed as a general raindrop spectrum, it remains a practical approximation for engineering rainfall-load modeling. Under extreme rainfall conditions, the actual drop size distribution may deviate from the classical M–P form; however, in the present study, it is adopted as a baseline representation to establish a consistent equivalent load model for engineering-scale response analysis. Its expression is given by Equations (1) and (2):
n ( D ) = n 0 e x p ( Λ D )
Λ = 4.1 I 0.21
where the unit of n ( D ) is m 3 · m m 1 , n 0 = 8 × 1 0 3 ( n u m b e r · m 3 · m m 1 ), Λ is the slope factor, and I is the rainfall intensity (unit is mm/h).

2.3. Volumetric Fraction of Raindrops Within a Specific Diameter Range

In a certain rainfall intensity, the proportion of the volume of all raindrops within a specific diameter range in this rainfall is the percentage of rainfall in the air. The volumetric fraction of raindrops within a specific diameter range is defined as the ratio of the total droplet volume in that diameter range to the unit volume of air. It is calculated according to Equations (3) and (4).
α = 1 6 π d 3 N
N = e 4.1 I   0.21 d m e e 4.1 I   0.21 d m e I 0.21 n 0 4.1
where N is raindrop number density, unit: m−3, raindrop diameter   d = ( d m i n + d m a x ) / 2 .

2.4. Calculation Formula of Heavy Rainfall Load

Based on the principle of momentum conservation, the rainfall-induced pressure P is evaluated as an equivalent transient load using Equations (5) and (6).
p r = i ρ w α i v i 2
α i = n i · π d i 3 6
The present formulation should be understood as an engineering-scale equivalent pressure model based on the classical momentum-flux principle, rather than as a new fundamental hydrodynamic law, where p r is the equivalent rainfall pressure (Pa), ρ w is the density of rain (kg/m3), α i is the volumetric fraction of raindrops in air for diameter class i (dimensionless), and v i is the terminal velocity of raindrops in that diameter range (m/s). n i is the number density of raindrops (m−3) in the corresponding diameter interval, and d i is the representative droplet diameter (m) for that interval. A dimensional check shows that α i is dimensionless, because n i has the unit m−3 and π d i 3 /6 has the unit m3. Therefore, ρ w has the unit of mass density (kg/m3). Multiplication by v i 2 gives kg/(m·s2), which is equivalent to N/m2 = Pa. The present formulation is therefore dimensionally consistent with pressure. It should be noted that this equivalent-load model does not simulate local impact details. This simplification is consistent with the objective of the present study, which is to evaluate the global dynamic response and pretension loss of the membrane-cable system rather than the local hydrodynamic details at the droplet scale. The rainfall load is therefore represented as an equivalent momentum-flux load based on representative droplet diameters and terminal velocities. In other words, the model is intended to capture the mean impulse transfer from rainfall to the membrane at the structural scale, while local processes such as droplet breakup, splashing, and microscopic energy dissipation are beyond its present scope.
The approximate expression for the terminal velocity of raindrops (m/s) is given in Equation (7) [33], where d denotes the raindrop diameter (mm):
V = 0.0561 d 3 0.912 d 2 + 5.03 d 0.254
To ensure the physical soundness of the proposed momentum-based rainfall load model, it is independently benchmarked against established theoretical formulations. Specifically, Equation (6) is derived from the classical momentum flux principle, and its numerical predictions align well with the widely adopted rain load expressions by Fu et al. and Choi. For instance, at I = 550 mm/h, the present model yields P = 94.3 Pa, while Fu et al.’s formula (P = ρwIvt/g) gives 96.7 Pa and Choi’s integrated form gives 93.8 Pa—deviations < 2.6% [34,35]. This confirms the model’s consistency with independent theoretical benchmarks. It should be noted that this empirical formula is used as an engineering approximation for typical rainfall droplet sizes. The resulting terminal velocity may still be affected by factors such as droplet deformation and atmospheric conditions, and therefore involves modeling uncertainty.

2.5. Experimental Setup and Instrumentation

2.5.1. Test Material

A Mecca PVC-coated fabric commonly used in engineering practice was adopted as the membrane material in the tests. The basic mechanical properties supplied by the manufacturer are listed in Table 2.
The geometry of the saddle membrane is governed by the edge-cable tension and the membrane prestress. The membrane material in this test belongs to class P membrane material, so the membrane pretension level is 3.0 MPa, and the edge-cable tension value is 7.5 kN. The membrane material components used in the experiment are cut and processed into the required shape by the professional membrane structure company. The membrane materials are connected with the tensioning device by using the corner connector.

2.5.2. Test Device

  • Tensioning device
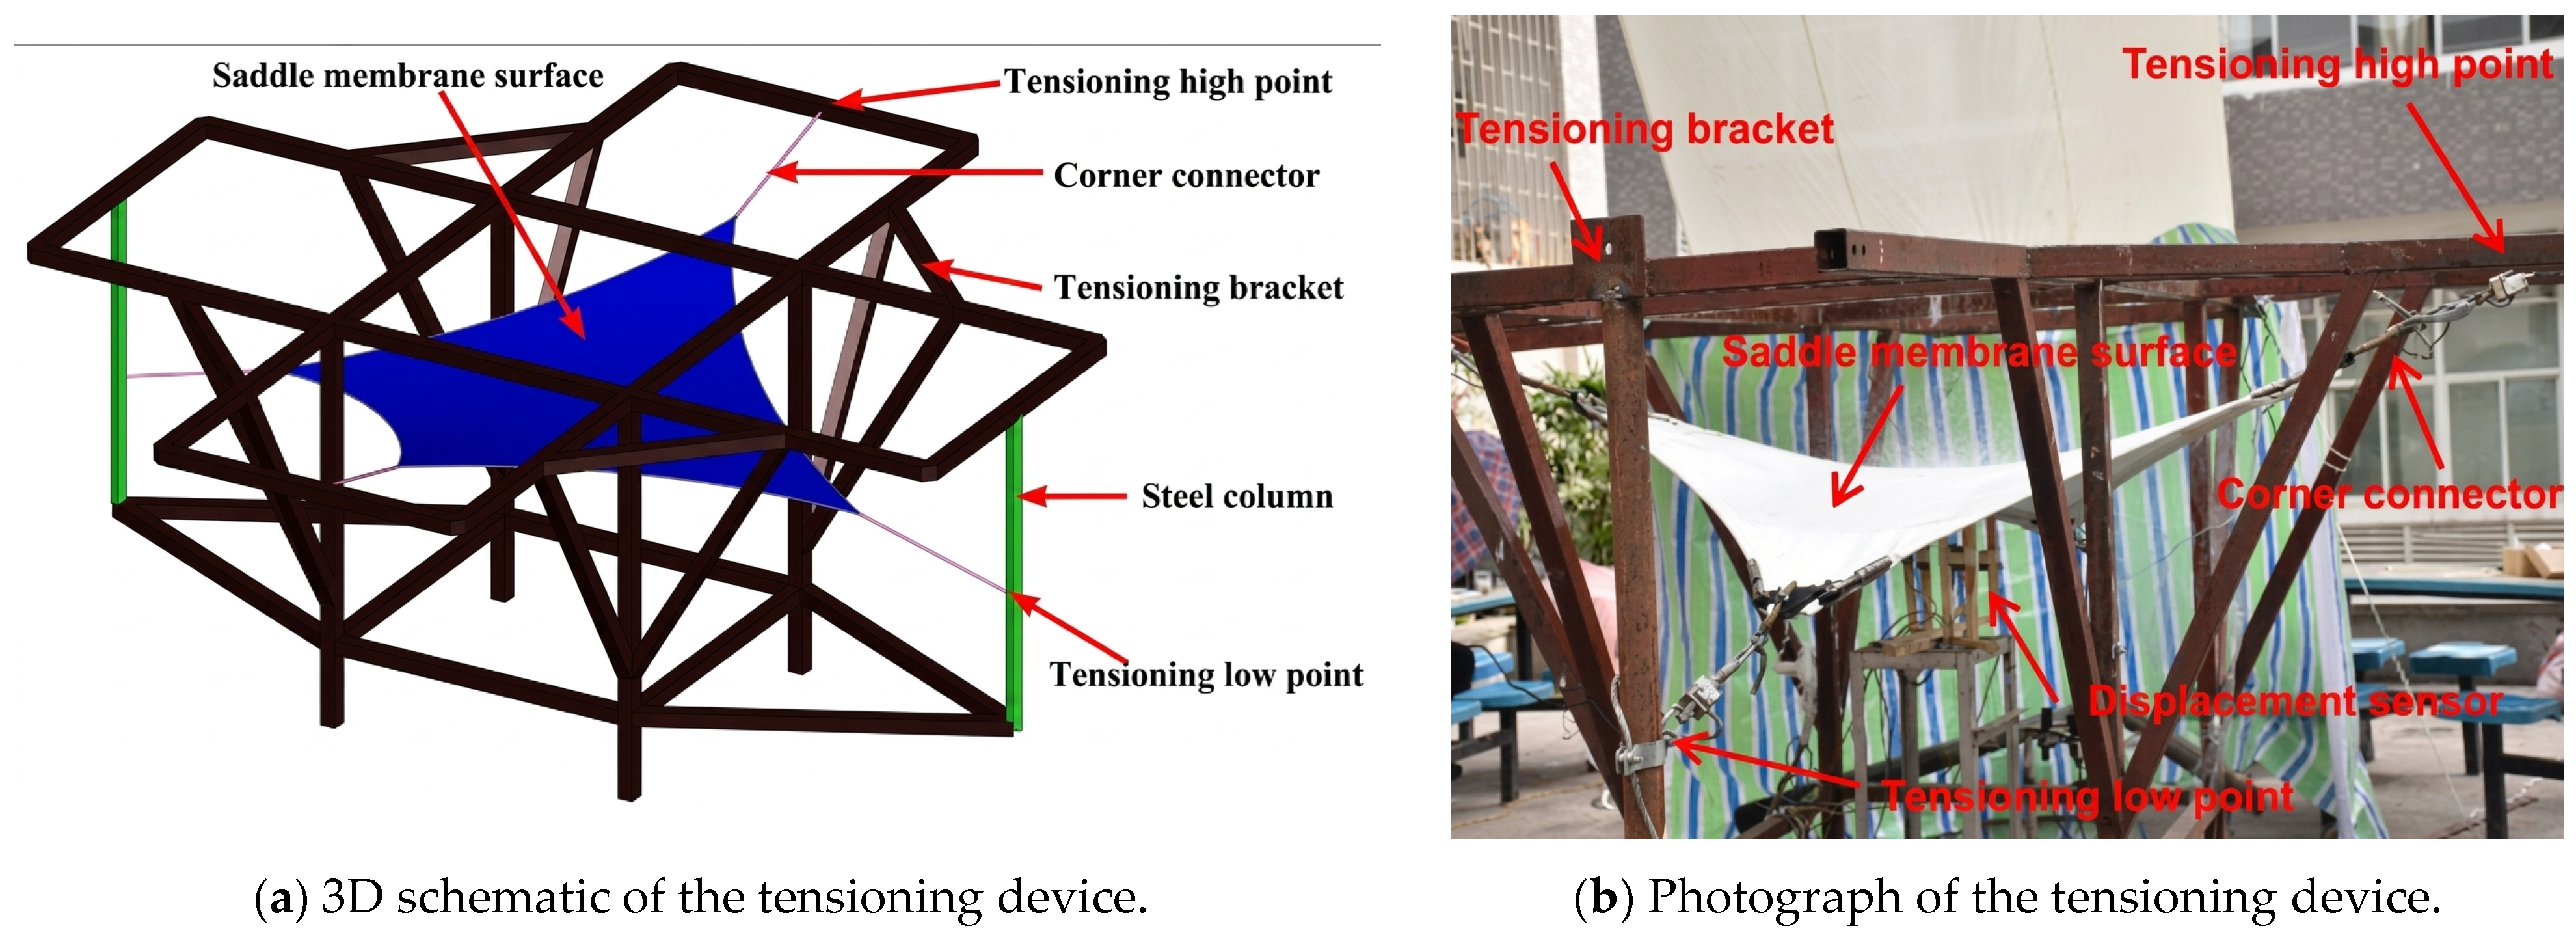
The membrane is tensioned by means of a cross-screw tensioning device. The saddle membrane specimen has a span of 2.52 m. The edge cables are formed by shaped steel wire ropes, and the tensioning frame is fabricated from welded 60 mm × 60 mm square steel tubes with a wall thickness of 3 mm. Additional diagonal braces are provided at the four corners of the frame to ensure sufficient stiffness and stability under rainfall loading. The saddle membrane was formed by arranging two opposite corner supports at a higher elevation and the other two at a lower elevation. The same support geometry was used in the numerical model, so that the elevation difference defining the saddle shape was treated consistently in both approaches. The saddle membrane is tensioned in the central area of the membrane through the corner connectors, as shown in Figure 1.
2.
Load application device
The load applied in this experiment is mainly divided into two parts: membrane pretension and heavy rainfall load.
In the saddle membrane structure, prestress is introduced into the membrane through the tensioning of the edge cables. When the membrane material is tensioned, the adjustable parts are adjusted to the required position, the membrane structure is pretensioned by the edge cable, and the tension of the edge cable is measured by the tension meter. In order to avoid stress concentration and effectively transfer the internal force, the rigid plate is connected with the threaded rod through the screws in the corner of the membrane, and the other end of the threaded rod is connected with the tension sensor through the wire rope.
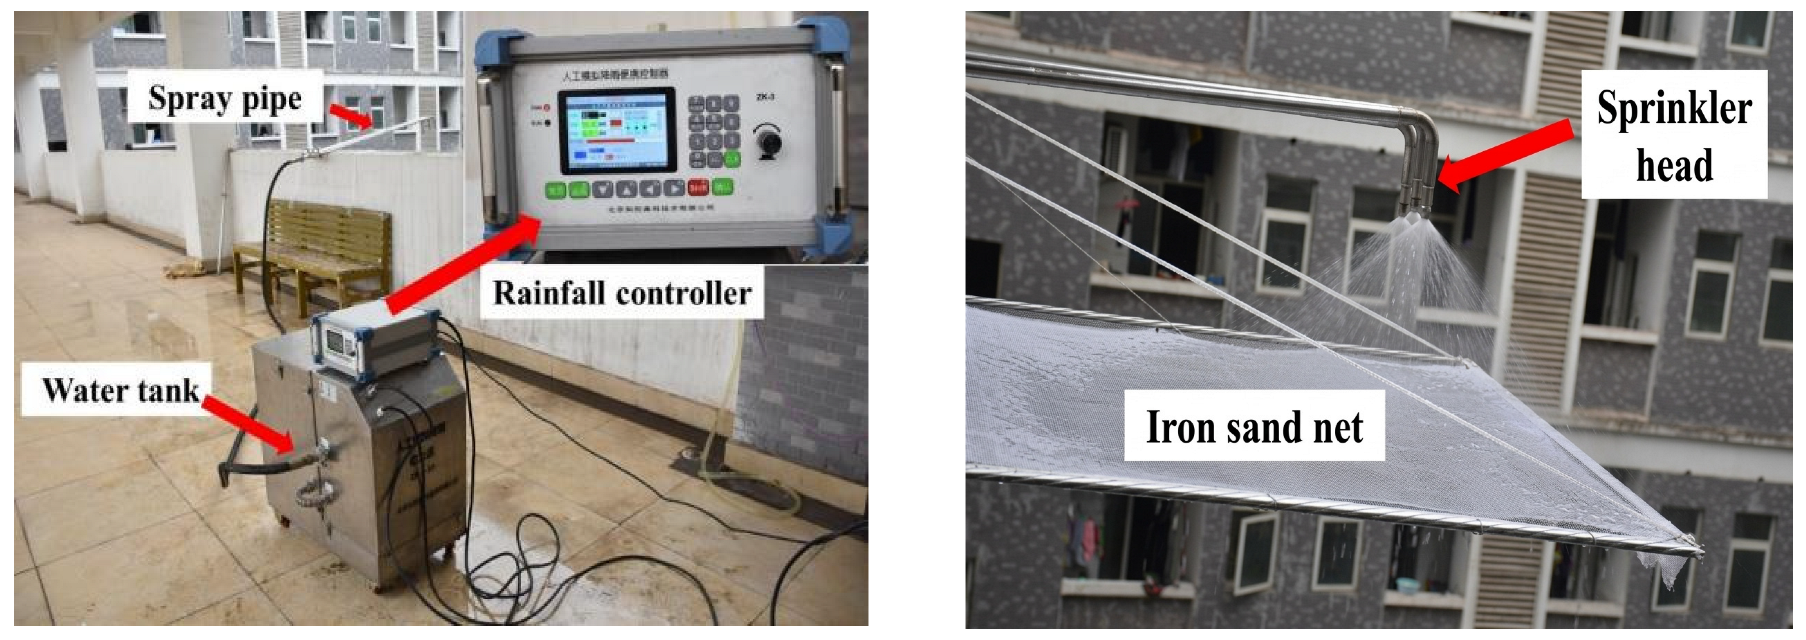
In this test, the rainfall load was generated using a sprinkler-based artificial rainfall simulation system composed of a rainfall controller, water tank, and nozzle assembly. The device is shown in Figure 2 and the technical parameters provided by the manufacturer are shown in Table 3.
To reduce raindrop atomization and improve the rainfall distribution over the specimen area, an iron mesh was placed at an appropriate distance below the sprinkler head, as shown in Figure 2. The controllable raindrop size range of the artificial rainfall system is 1.7–2.8 mm (Table 3). This range was adopted because it can produce relatively stable droplets with limited atomization over a 7.5 m falling height. In relation to natural rainfall, these diameters correspond to medium-size raindrops that are relevant to rainfall momentum transfer and impact loading, although the system does not reproduce the full natural raindrop size spectrum.
The final velocity of raindrops with different diameters from different heights is different. In order to make raindrops reach the maximum terminal velocity of natural falling, the falling height should reach 7–8 m [36]. In this experiment, the rainfall height is 7.5 m, and the rainfall intensity is applied by adjusting the water supply pressure by the rainfall controller. Three rainfall intensities—50 mm/h, 300 mm/h and 550 mm/h—are adopted.
In both the experimental and numerical investigations, the rainfall loading is treated as spatially uniform over the effective loaded area to provide a controlled baseline for model validation and for identifying the fundamental structural response to rainfall impact. This assumption is consistent with the experimental design: the nozzle position was adjusted to align with the membrane center, and an iron mesh and water-retaining curtain were introduced to reduce atomization and to improve rainfall uniformity before the effective loading stage. Therefore, the purpose of the uniform-loading assumption is not to reproduce the full spatial variability of natural rainfall, but to establish a repeatable baseline condition under pure rainfall excitation for isolating the structural response mechanism.
3.
Data acquisition device
Two main instruments were used in the experiment. The first was a ZLDS100 series non-contact laser displacement sensor, which was employed to record in real time the vertical displacements at the measuring points on the membrane. According to the manufacturer’s specifications, the ZLDS100 sensor series provides different measurement ranges from 2 mm to 1250 mm, with a resolution of up to 0.01% at full scale, a linearity of ±0.1% at full scale, a maximum frequency response of 9.4 kHz, and IP67 protection. The sensor also supports synchronous acquisition of multiple channels, which is suitable for dynamic displacement measurements of the membrane surface.
The second instrument was an HP-10K digital push–pull gauge, which was used to control and monitor the edge cable tension before and after rainfall loading, so that the relaxation rate could be evaluated and the membrane pretension could be checked against the experimental design requirements. According to the manufacturer’s specifications, the HP-10K gauge has 0.5 class accuracy, a minimum reading of 0.001 N, and an RS-232 communication interface for data transmission and recording.

2.6. Experimental Procedure and Measurement Points

2.6.1. Measurement Points

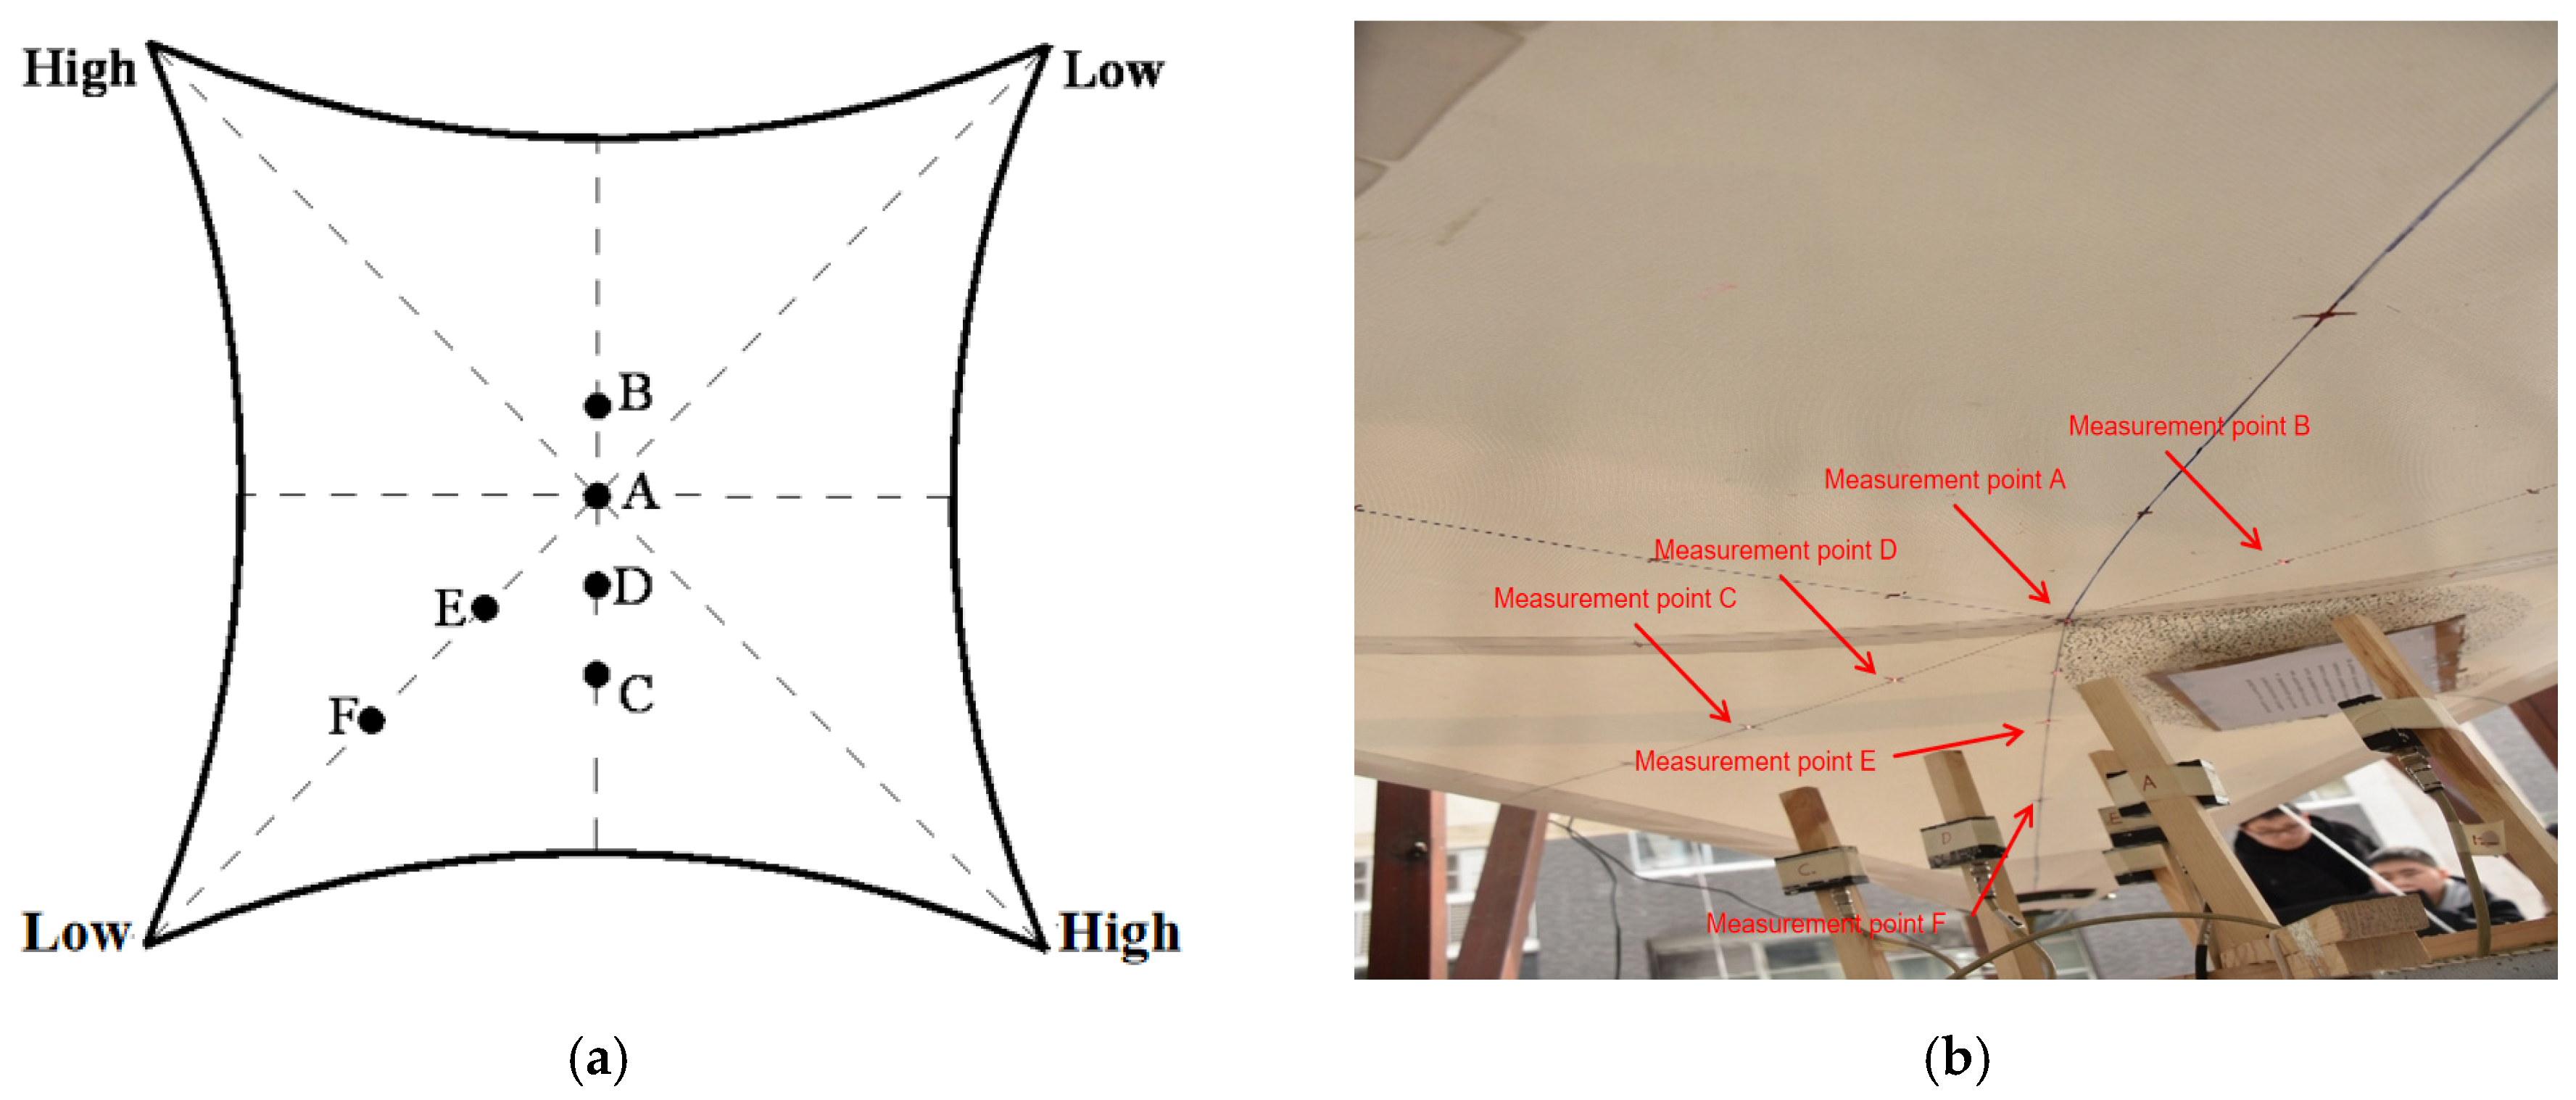
To enable consistency between the numerical simulation and the experiment, the same six feature points were defined on the membrane in both cases, as shown in Figure 3. In the experiment, they corresponded to the locations of the laser displacement sensors, while in the numerical model, these points were used as output nodes for extracting displacement time histories. Point A is located at the center of the membrane. Points C and F are situated at the half-span positions, whereas Points B, D and E lie at the three-quarter span locations; Points B and D are symmetric with respect to the membrane centerline. “High” and “Low” indicate the corner points with higher and lower elevations in the saddle-shaped membrane geometry.

2.6.2. Experiment Procedure

In order to ensure the smooth execution and reproducibility of the experimental procedure, the following systematic steps are taken to carry out the experiment:
  • The membrane material and the tensioning device are connected and fixed by corner connectors.
  • The HP-10K digital display push–pull meter is installed between the corner connecting plate and the tension point.
  • The length of threaded rod is adjusted to make the membrane material coincide with the center point of the tension device.
  • The pretension is applied to the membrane by applying pretension, and the threaded rod at four corners is adjusted repeatedly to observe HP-10K readings, so that each tension meter reading finally reached the required stable value.
  • The position of the sprinkler head is adjusted so that it is located directly above the center of the membrane and the tensioning device.
  • A curtain is placed above the membrane to prevent the interference of residual water on the membrane vibration.
  • The six ZLDS100 non-contact laser displacement sensors are fixed at the designated positions below A–F of the 6 measuring points on the membrane, and debugging is carried out to ensure that the laser emitted by the sensors is irradiated to the corresponding positions of each measurement point correctly. The sensors are connected to the computer for data collection.
  • The water retaining curtain was placed under the iron mesh at an appropriate position, and adjusted the rainfall intensity to the required value through the rainfall controller until the water drops ejected from the nozzle fall evenly. After a stable rainfall state was reached, the membrane specimen was exposed to rainfall loading for approximately 20 s, which was selected to capture the short-term dynamic response under intense rainfall in a controlled manner. The curtain was then moved back to intercept the falling water, and the test was completed. Repeated runs were conducted under the same loading condition to check the stability of the experimental system, reduce the influence of accidental operational disturbances, and identify representative response records with consistent trends. In the original experimental protocol, these repeated runs were mainly used for repeatability checking and representative-data selection rather than for a formal statistical uncertainty analysis. Therefore, the following sections present representative displacement time-history curves and the corresponding peak-response values extracted from the retained representative records.

2.7. Numerical Modeling (LS-DYNA) and Assumptions

The finite element software ANSYS/LS-DYNA (version 2020 R1) was employed to conduct the numerical simulations. An explicit dynamic solver was adopted in this study, because the problem involves strong geometric nonlinearity, tension-dominated membrane–cable behavior, and short-duration time-varying rainfall loading. Compared with an implicit scheme, the explicit solver is more robust for tracing nonlinear transient responses and avoids possible convergence difficulties associated with large deformation and stiffness changes during vibration. The following assumptions are made:
1. The cable and membrane elements are flexible components that can carry tension but not compression. 2. Both the cables and the membrane remain in the elastic range. 3. The cable and membrane elements are connected through idealized hinged joints that do not transfer bending moment and do not allow relative slip at the connection interface. 4. The membrane is modeled as an orthotropic linear-elastic material in the warp and weft directions, while the edge cables are modeled as isotropic linear-elastic elements. 5. The falling process of raindrop impacting the membrane is regarded as the ideal vertical falling, corresponding to a pure-rainfall condition without wind. 6. The rainfall load is assumed to be uniformly distributed over the effective loaded area to maintain consistency with the controlled laboratory rainfall condition. Because this study aims to establish a benchmark case for pure rainfall excitation and to separate the influence of rainfall momentum input from additional complexities caused by spatially non-uniform rain fields, the membrane material used is a PVC-coated fabric with distinct warp and weft mechanical properties. In the numerical model, it is represented by an orthotropic linear-elastic formulation (Table 4) to capture the primary in-plane anisotropy, while more complex effects—such as material nonlinearity, viscoelasticity, and yarn–coating interaction—are not considered in the present study.

2.8. Material Properties, Element Types, Mesh and Units

SHELL163 and LINK167 elements were used to model the membrane and the edge cables, respectively. For SHELL163, the fully integrated thin-membrane algorithm was adopted to reduce hourglass effects and improve numerical stability. According to the spatial geometry of the saddle membrane structure, the membrane surface and edge cables were discretized using a mapped mesh composed of triangular elements, with a characteristic element size of 5 cm. This mesh size corresponds to approximately 1/50 of the structural span and was selected as a compromise between computational efficiency and the need to capture the global curvature, deformation mode, stress redistribution, and cable-force variation of the engineering-scale specimen. This choice was also supported by preliminary trial calculations and previous numerical studies on saddle membrane structures under impact loading, in which comparable mesh scales were found to be sufficient for stable global-response prediction [37].
A formal mesh sensitivity study was not conducted in the present work. Nevertheless, the global displacement response considered in this study is mainly governed by the overall saddle geometry, prestress level, boundary restraint, and equivalent rainfall load. Therefore, the adopted 5 cm mesh is considered acceptable for engineering-level prediction of the overall displacement trend. It should be noted, however, that local stress concentrations near the corners and cable–membrane connections may be more sensitive to mesh density, and formal mesh-convergence analysis is still required for future high-fidelity local-response assessment. The numerical simulation adopts the same material parameters as the experimental study. The selected material properties and unit system are shown in Table 4 and Table 5.

2.9. Form-Finding and Prestress/Edge-Cable Initialization

The saddle-shaped membrane structure is a highly nonlinear system with very low inherent stiffness, and it relies on prestress to maintain its shape and load-carrying capacity. In this study, the support displacement method combined with an iterative form-finding procedure using a low elastic modulus was employed to obtain the equilibrium shape of the saddle membrane. In the experiment, the target cable forces were achieved by adjustment and measurement. The membrane prestress and edge-cable tension were introduced by temperature reduction and initial strain, respectively, to reproduce the final prestressed equilibrium state of the experimental specimen rather than the detailed tightening sequence. After the equilibrium configuration was established, the rainfall-response analysis was carried out using the explicit dynamic solver in LS-DYNA.
The form-finding model is identical to the experimental specimen: the saddle-shaped membrane has a span of L = 2.52 m, and rise-to-span ratios of 1/12 and 1/10 are considered. Four corner points are fixed on the steel frame, and the initial pretension set on the membrane pretension is 3.0 kN/m (equivalent to ≈3.0 MPa for a 1.0 mm thickness), and the initial tension of the edge cable is 7.5 kN. In the numerical model, the cables are arranged along the four boundary edges of the saddle membrane, consistent with the experimental specimen, and are modeled using LINK167 elements connected to the membrane boundary nodes. Figure 4 shows the process of shape-finding analysis for saddle membrane by using the above methods and steps.
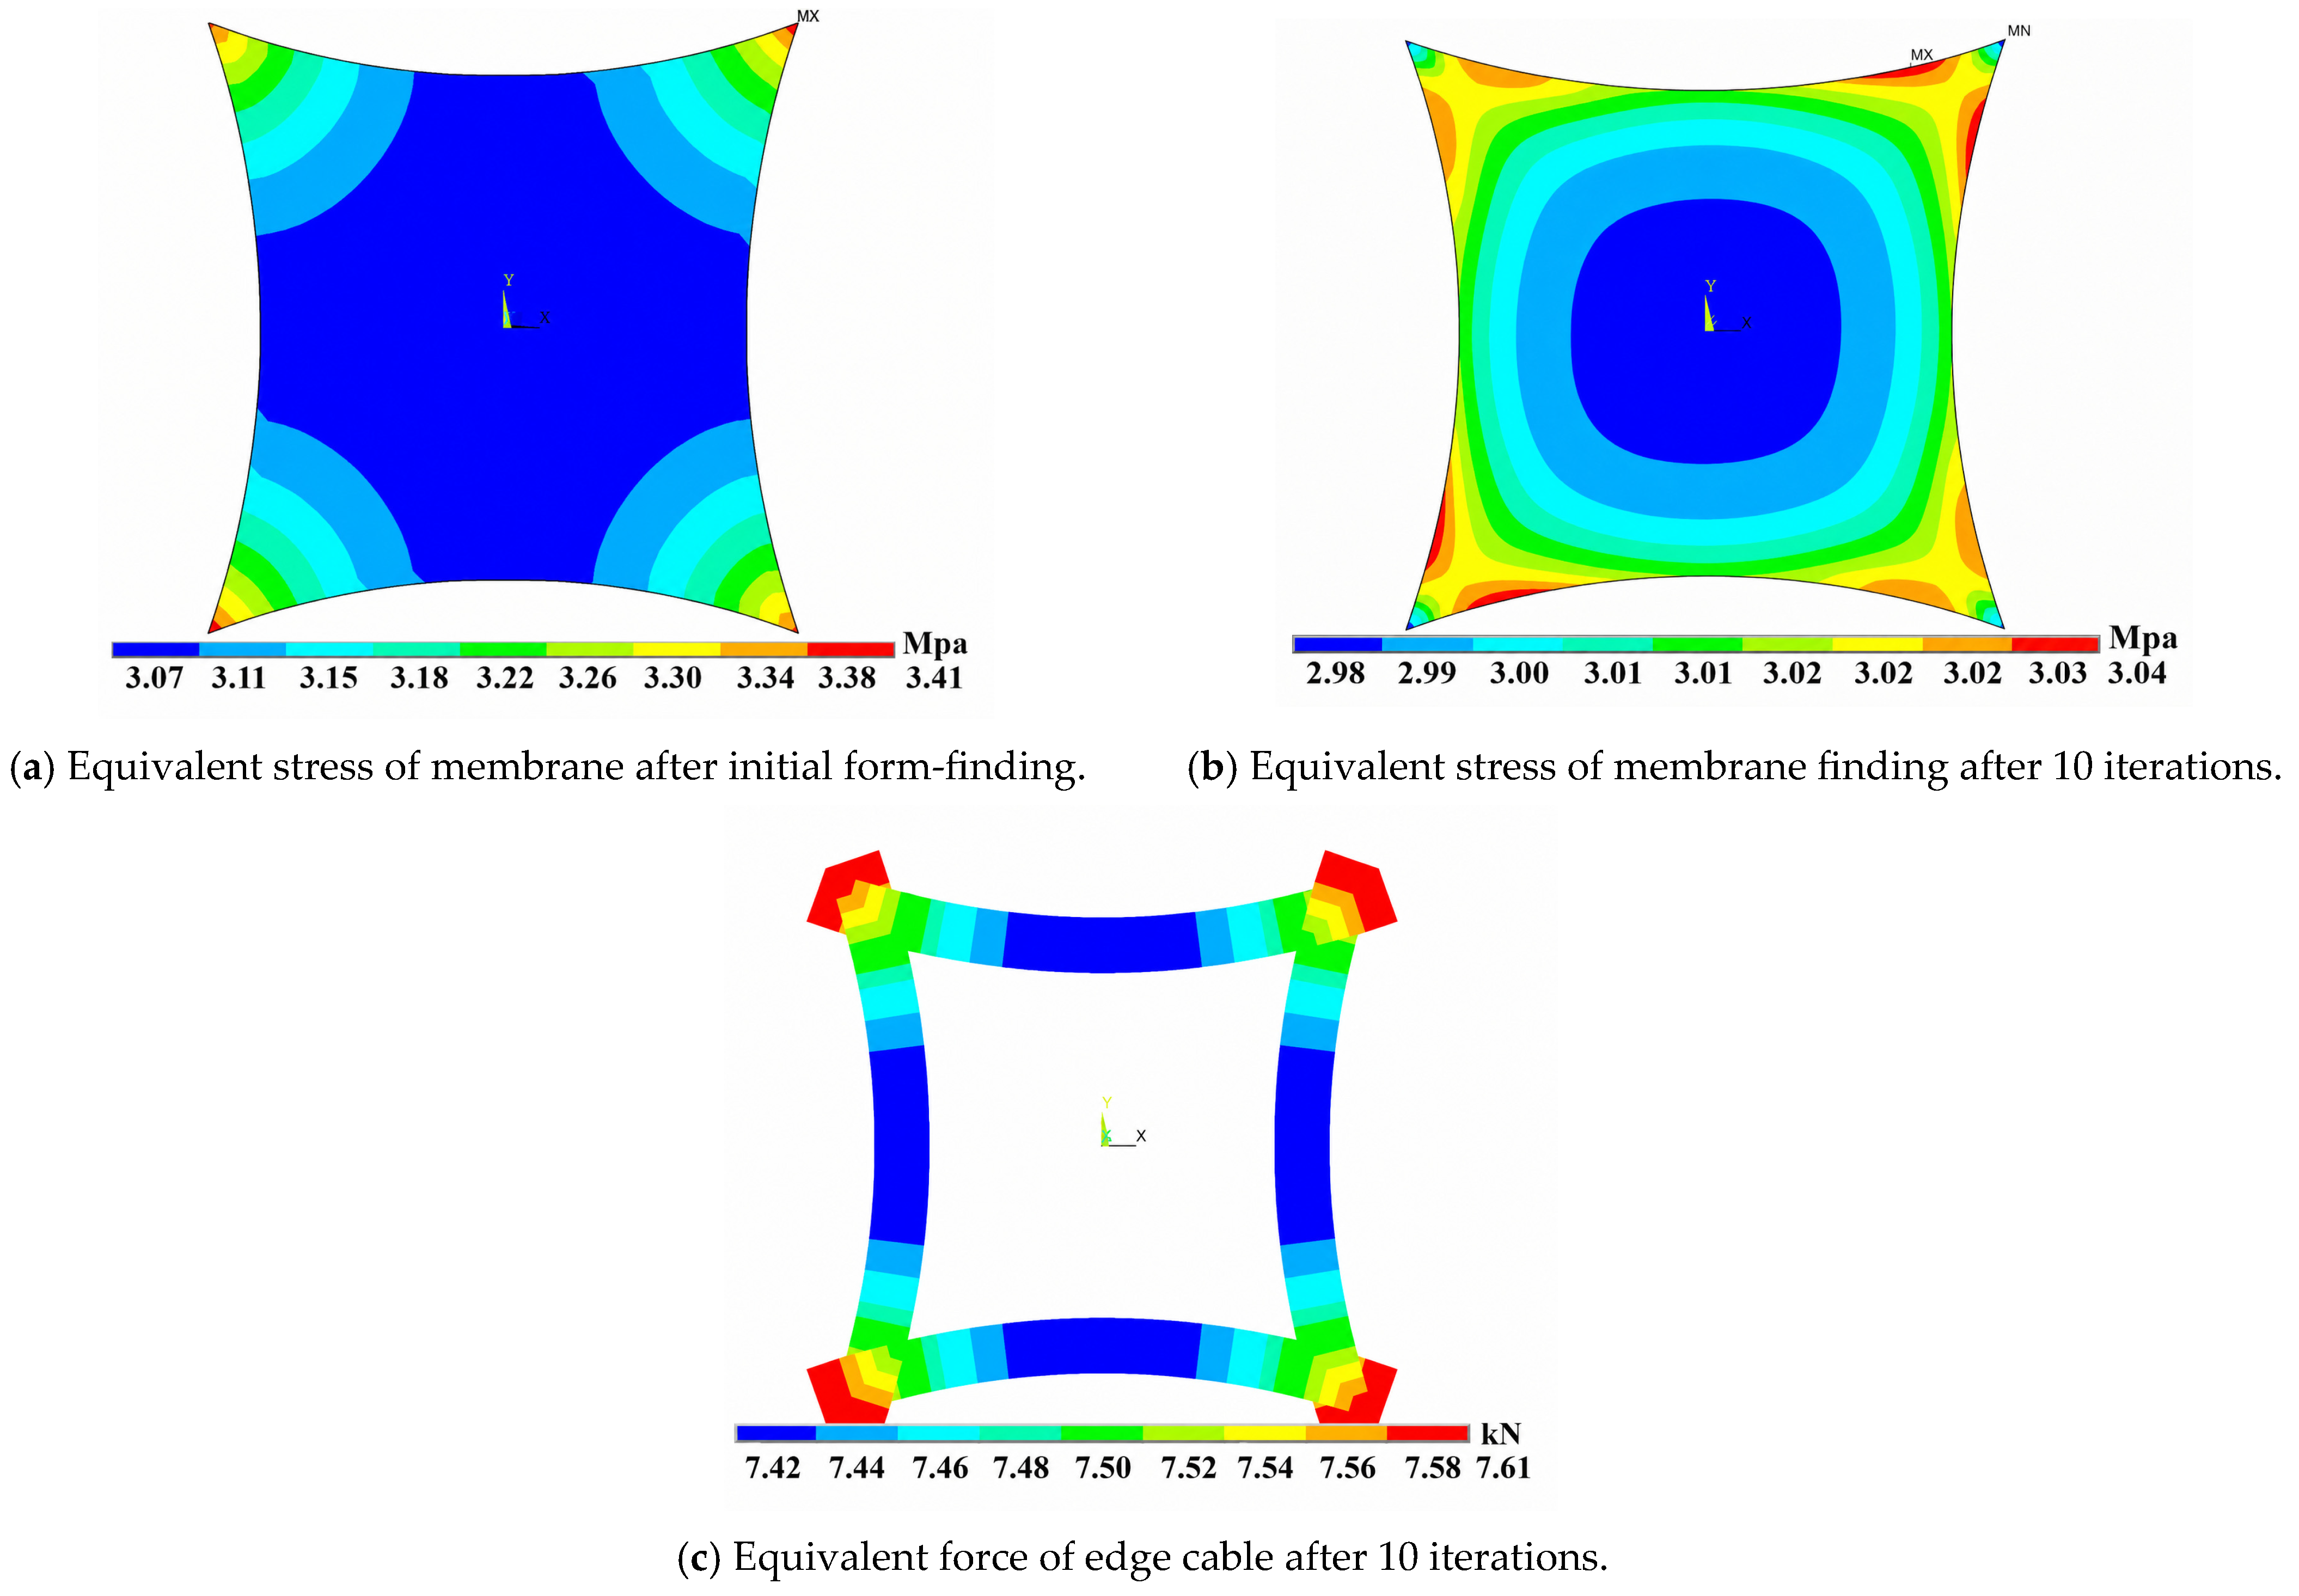
As can be seen from Figure 4, the minimum and maximum equivalent stresses in the membrane are 3.07 MPa and 3.41 MPa, respectively, after the initial form-finding step, with a difference of about 11%. The maximum stress is mainly concentrated at the four corners of the membrane, while the central region shows the minimum stress. Here, the “10 iterations” refer to the iterations of the form-finding procedure rather than the time-integration steps of the subsequent dynamic analysis. To assess convergence of the form-finding procedure, the uniformity of the membrane stress field and edge-cable tension was used as the quantitative indicator of equilibrium. After 10 iterations, the maximum and minimum equivalent membrane stresses are 3.04 MPa and 2.98 MPa, respectively, corresponding to a difference of only 2.01%. Meanwhile, the maximum and minimum tensions in the edge cables are 7.61 kN and 7.42 kN, respectively, with a variation of 2.52%. This indicates that, after 10 iterations, the stress distributions of both the membrane and the edge cables have become sufficiently uniform, and the resulting configuration was therefore taken as the initial equilibrium state for the subsequent rainfall-response simulation.

3. Results

3.1. Experimental Results

Unless otherwise stated, the experimental curves presented below are representative results selected from repeated runs conducted under the same condition after confirming the consistency of the observed response trend. The corresponding peak-response values reported in the tables were extracted from the retained representative records, rather than from a formal statistical averaging procedure. This treatment was adopted because the repeated runs in the original experimental campaign were primarily intended to reduce the influence of occasional human or operational errors and to obtain representative response data.
Adopting the method of control variables in the experiment, the rise–span ratio, rainfall intensity, and edge-cable tension, three conditions are combined, including two kinds of rise–span ratio (1/10 and 1/12), three kinds of rainfall intensity (50 mm/h, 300 mm/h and 550 mm/h), and three kinds of edge-cable tension (1 kN, 2 kN and 3 kN). The dynamic responses of membrane feature points were compared by combining experiments under different conditions.

3.1.1. Each Feature Point of Different Membranes

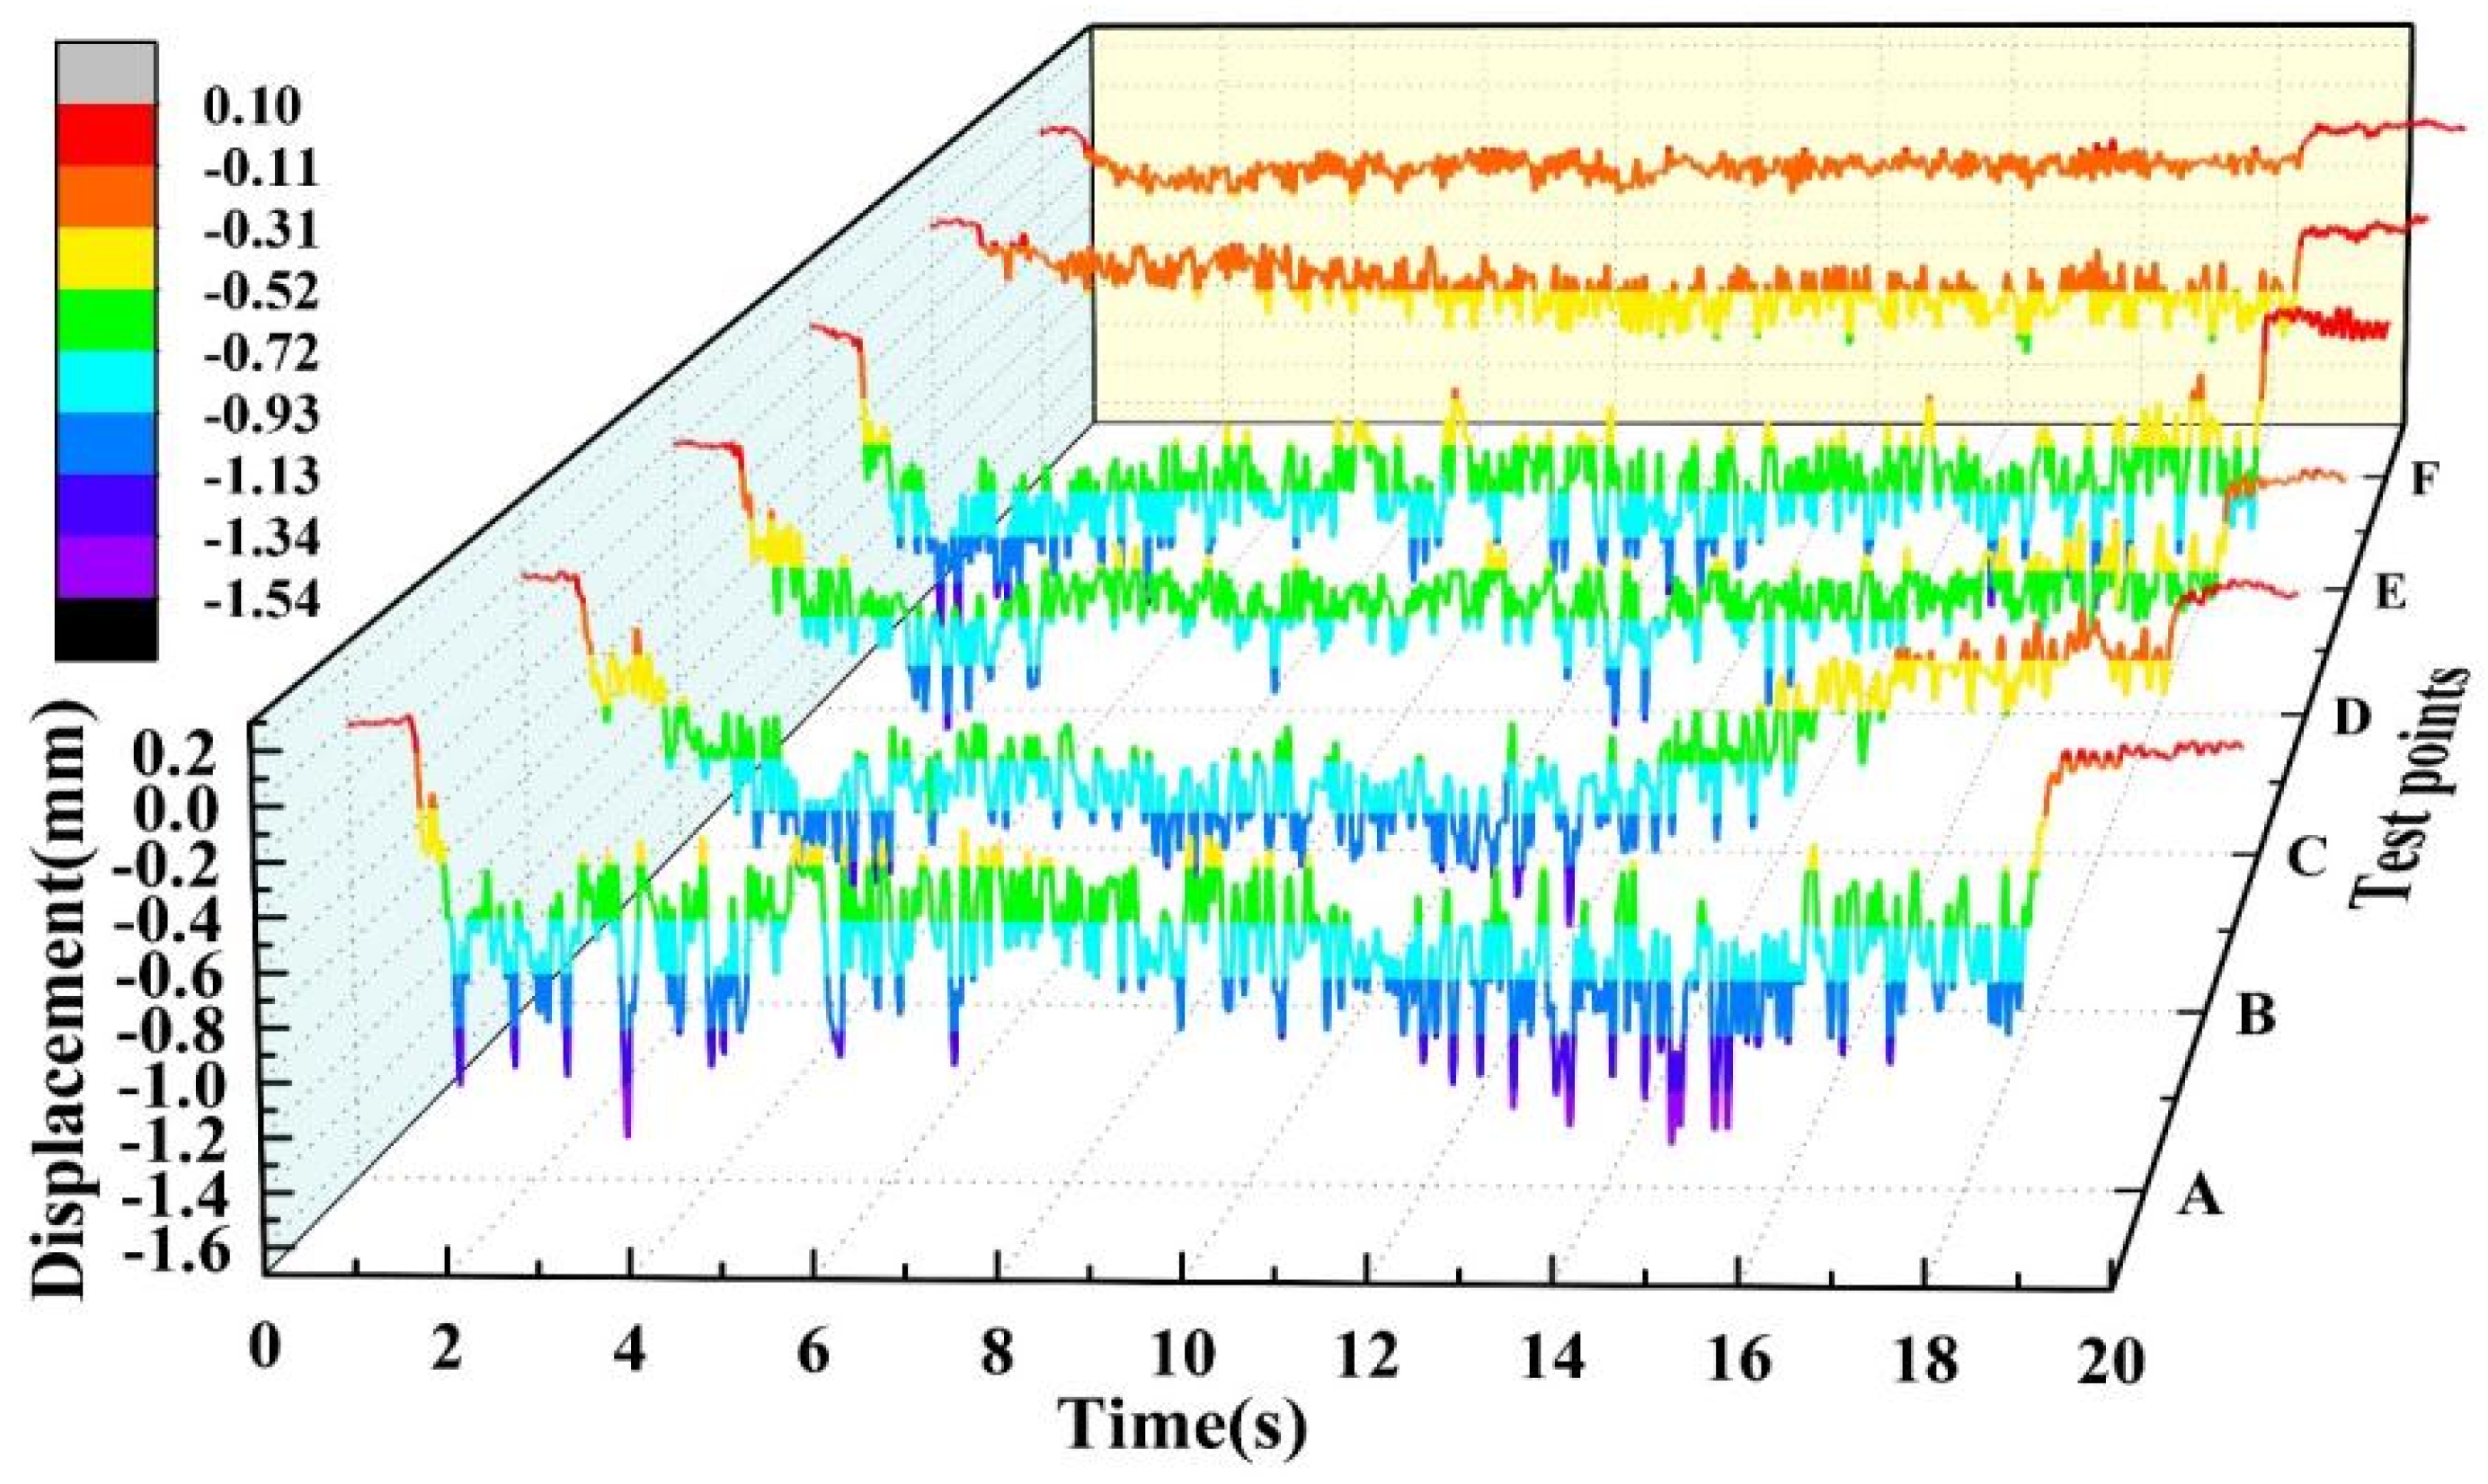
To illustrate more clearly the dynamic response of the saddle membrane structure under rainfall loading, a quantitative analysis of the experimental results is carried out for the specified test conditions. A specimen with a rise-to-span ratio of 1/10, a membrane prestress of 3.0 MPa and an edge-cable tension of 7.5 kN is selected. Under a rainfall intensity of 550 mm/h, the displacement time histories of the membrane feature points are obtained, as shown in Figure 5.
As illustrated in Figure 5, the maximum deformation and displacement, measuring 1.55 mm, occurs at the central Point A of the membrane. Points B and D, being symmetric points closest to the center, exhibit the subsequent millimeter-level dynamic response of 1.38 mm and 1.40 mm, respectively. The proximity of these values indicates that the vibration propagates outward from the center under rainfall excitation. Consequently, the amplitude of the displacement time-history curves diminishes for Points C, E, and F, with maximum displacements of 1.2 mm, 0.6 mm, and 0.35 mm. This data leads to the conclusion that the structure exhibited a measurable dynamic response, with a peak displacement of 1.55 mm at the center. While the displacement magnitude is small relative to the span, the vibration characteristics confirm the transmission of rain-induced energy to the boundary cables. Similarly, the peak velocities and accelerations for all feature points on the saddle membrane (with a 1/10 rise-to-span ratio, 3.0 MPa prestress, and 7.5 kN edge-cable tension) under the 550 mm/h rainfall intensity are summarized in Table 6.
As evidenced by the data in Table 6, Point A, located at the membrane center, records the highest values of displacement, velocity, and acceleration. Points B and D, which are symmetrically arranged around the center, show similar response levels, whereas the responses at Points E and F are much smaller. This spatial variation indicates that the rainfall-induced disturbance is strongest in the central region and gradually weakens as it propagates toward the boundaries.
In addition to displacement, the velocity and acceleration responses provide further insight into the dynamic behavior of the membrane roof. The peak velocity reflects the rate of vibration development and the transmission intensity of dynamic energy through the prestressed membrane surface, while the peak acceleration is more directly associated with local inertial effects and short-duration force demand at the membrane–cable connections and boundary restraints. Therefore, although the overall displacement remains small, the concentration of relatively higher velocity and acceleration near the impact region suggests that repeated heavy rainfall may still contribute to local connection disturbance, cumulative relaxation, and increased sensitivity of the membrane–cable system under subsequent environmental loading.

3.1.2. Different Rainfall Intensity

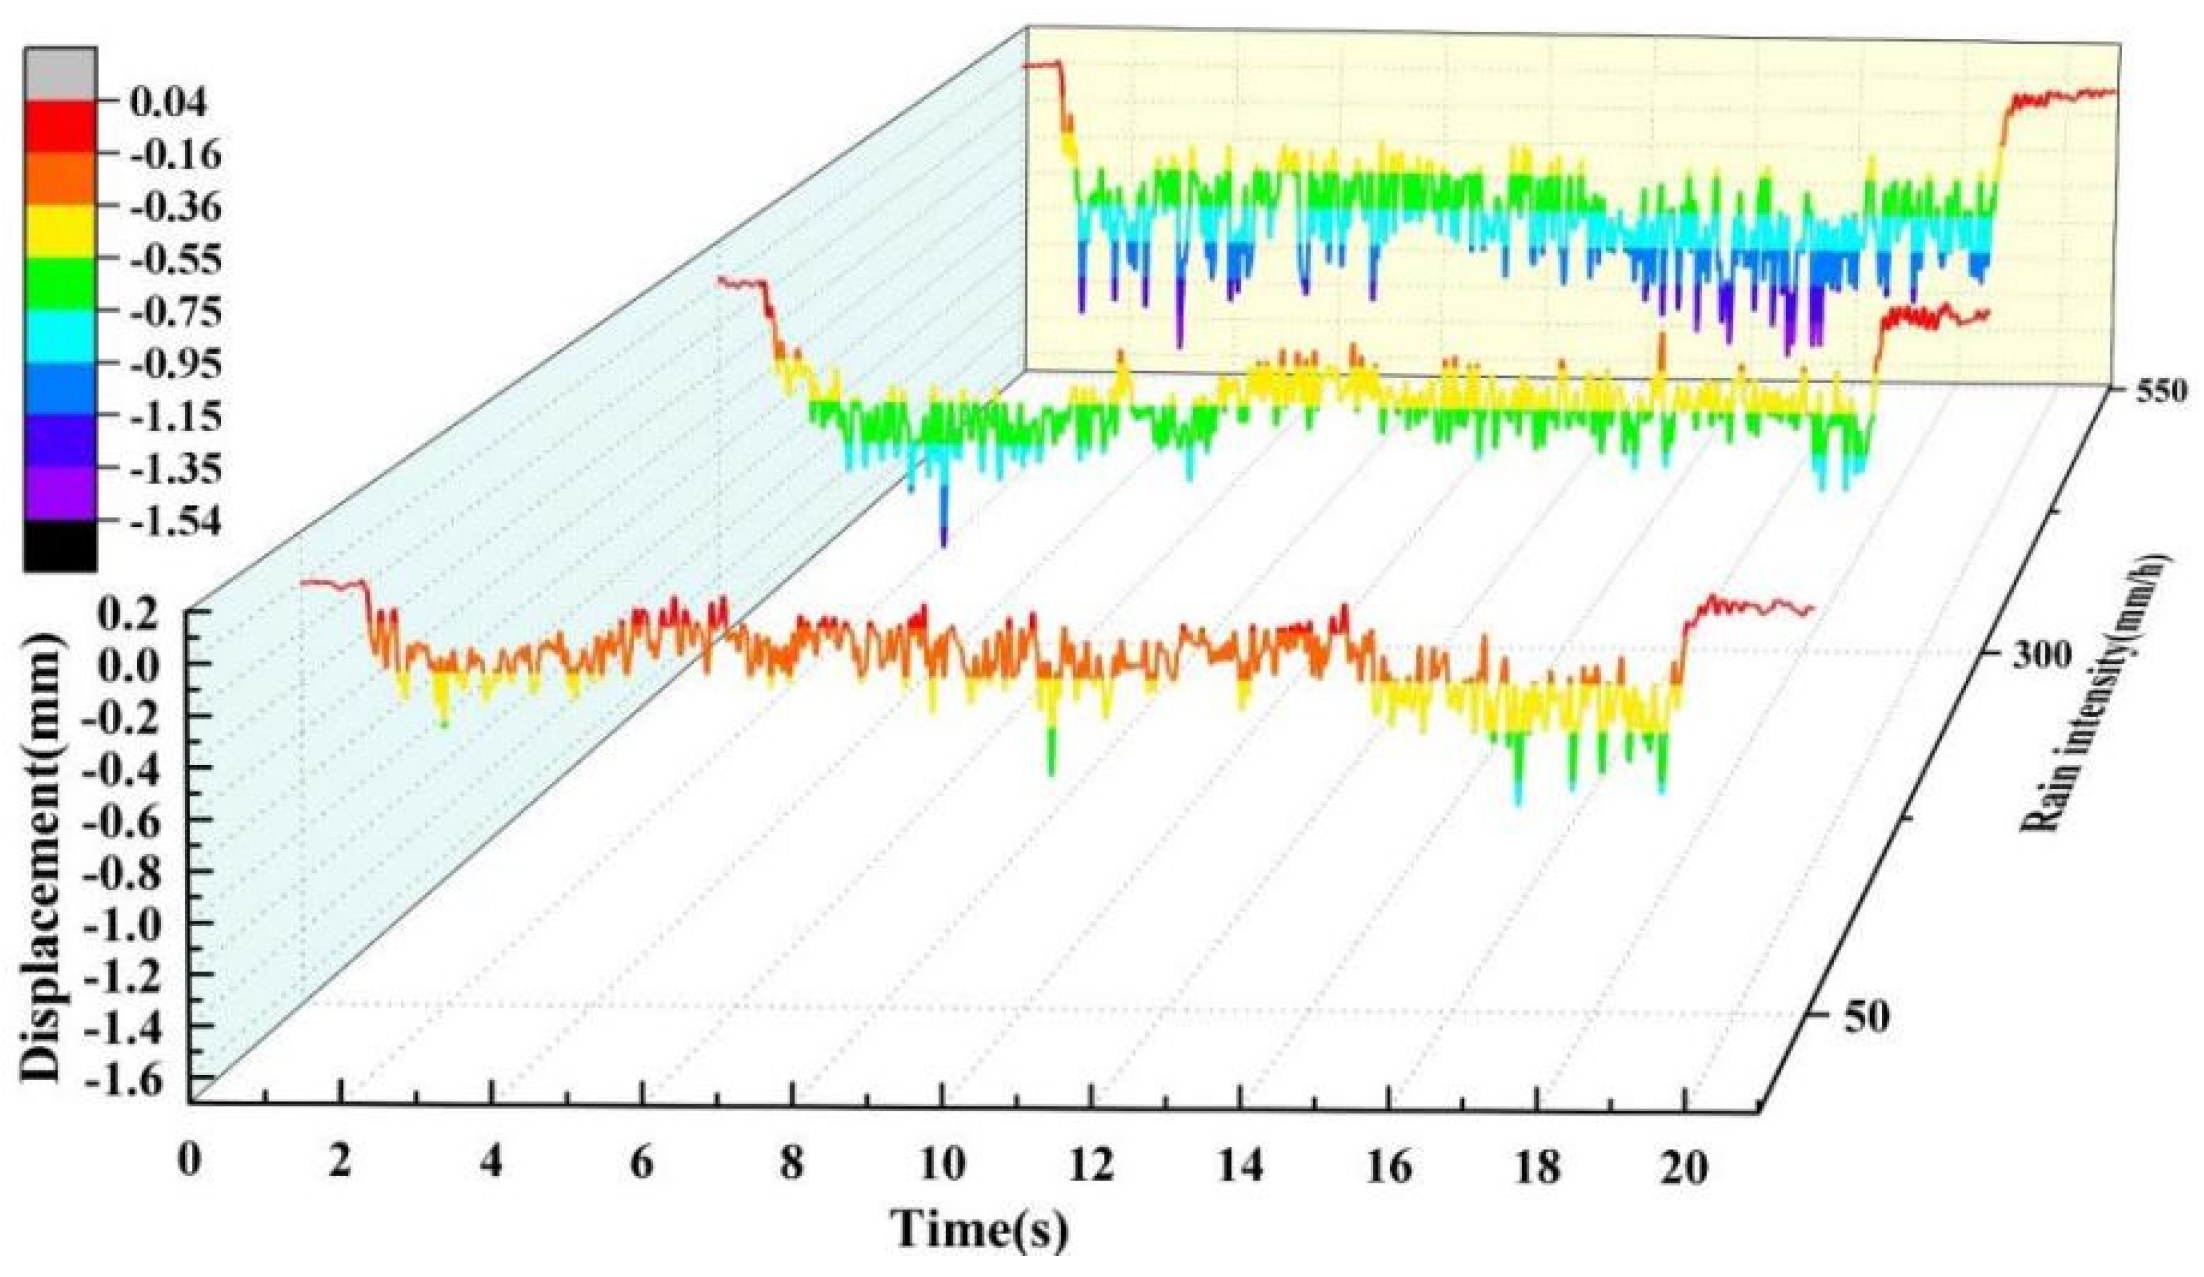
This study analyzes the dynamic response at the central Point A of a membrane structure (characterized by a 1/10 rise-to-span ratio, 3.0 MPa prestress, and 7.5 kN cable tension) under rainfall intensities of 50, 300, and 550 mm/h. The corresponding displacement time-history curve is shown in Figure 6.
As indicated in Figure 6, the maximum displacement at Point A increases with rainfall intensity, measuring 0.86 mm, 1.25 mm, and 1.55 mm under intensities of 50 mm/h, 300 mm/h, and 550 mm/h, respectively. This trend is accompanied by an acceleration in the rate of change in both vibration amplitude and velocity.

3.1.3. Different Rise Span Ratio

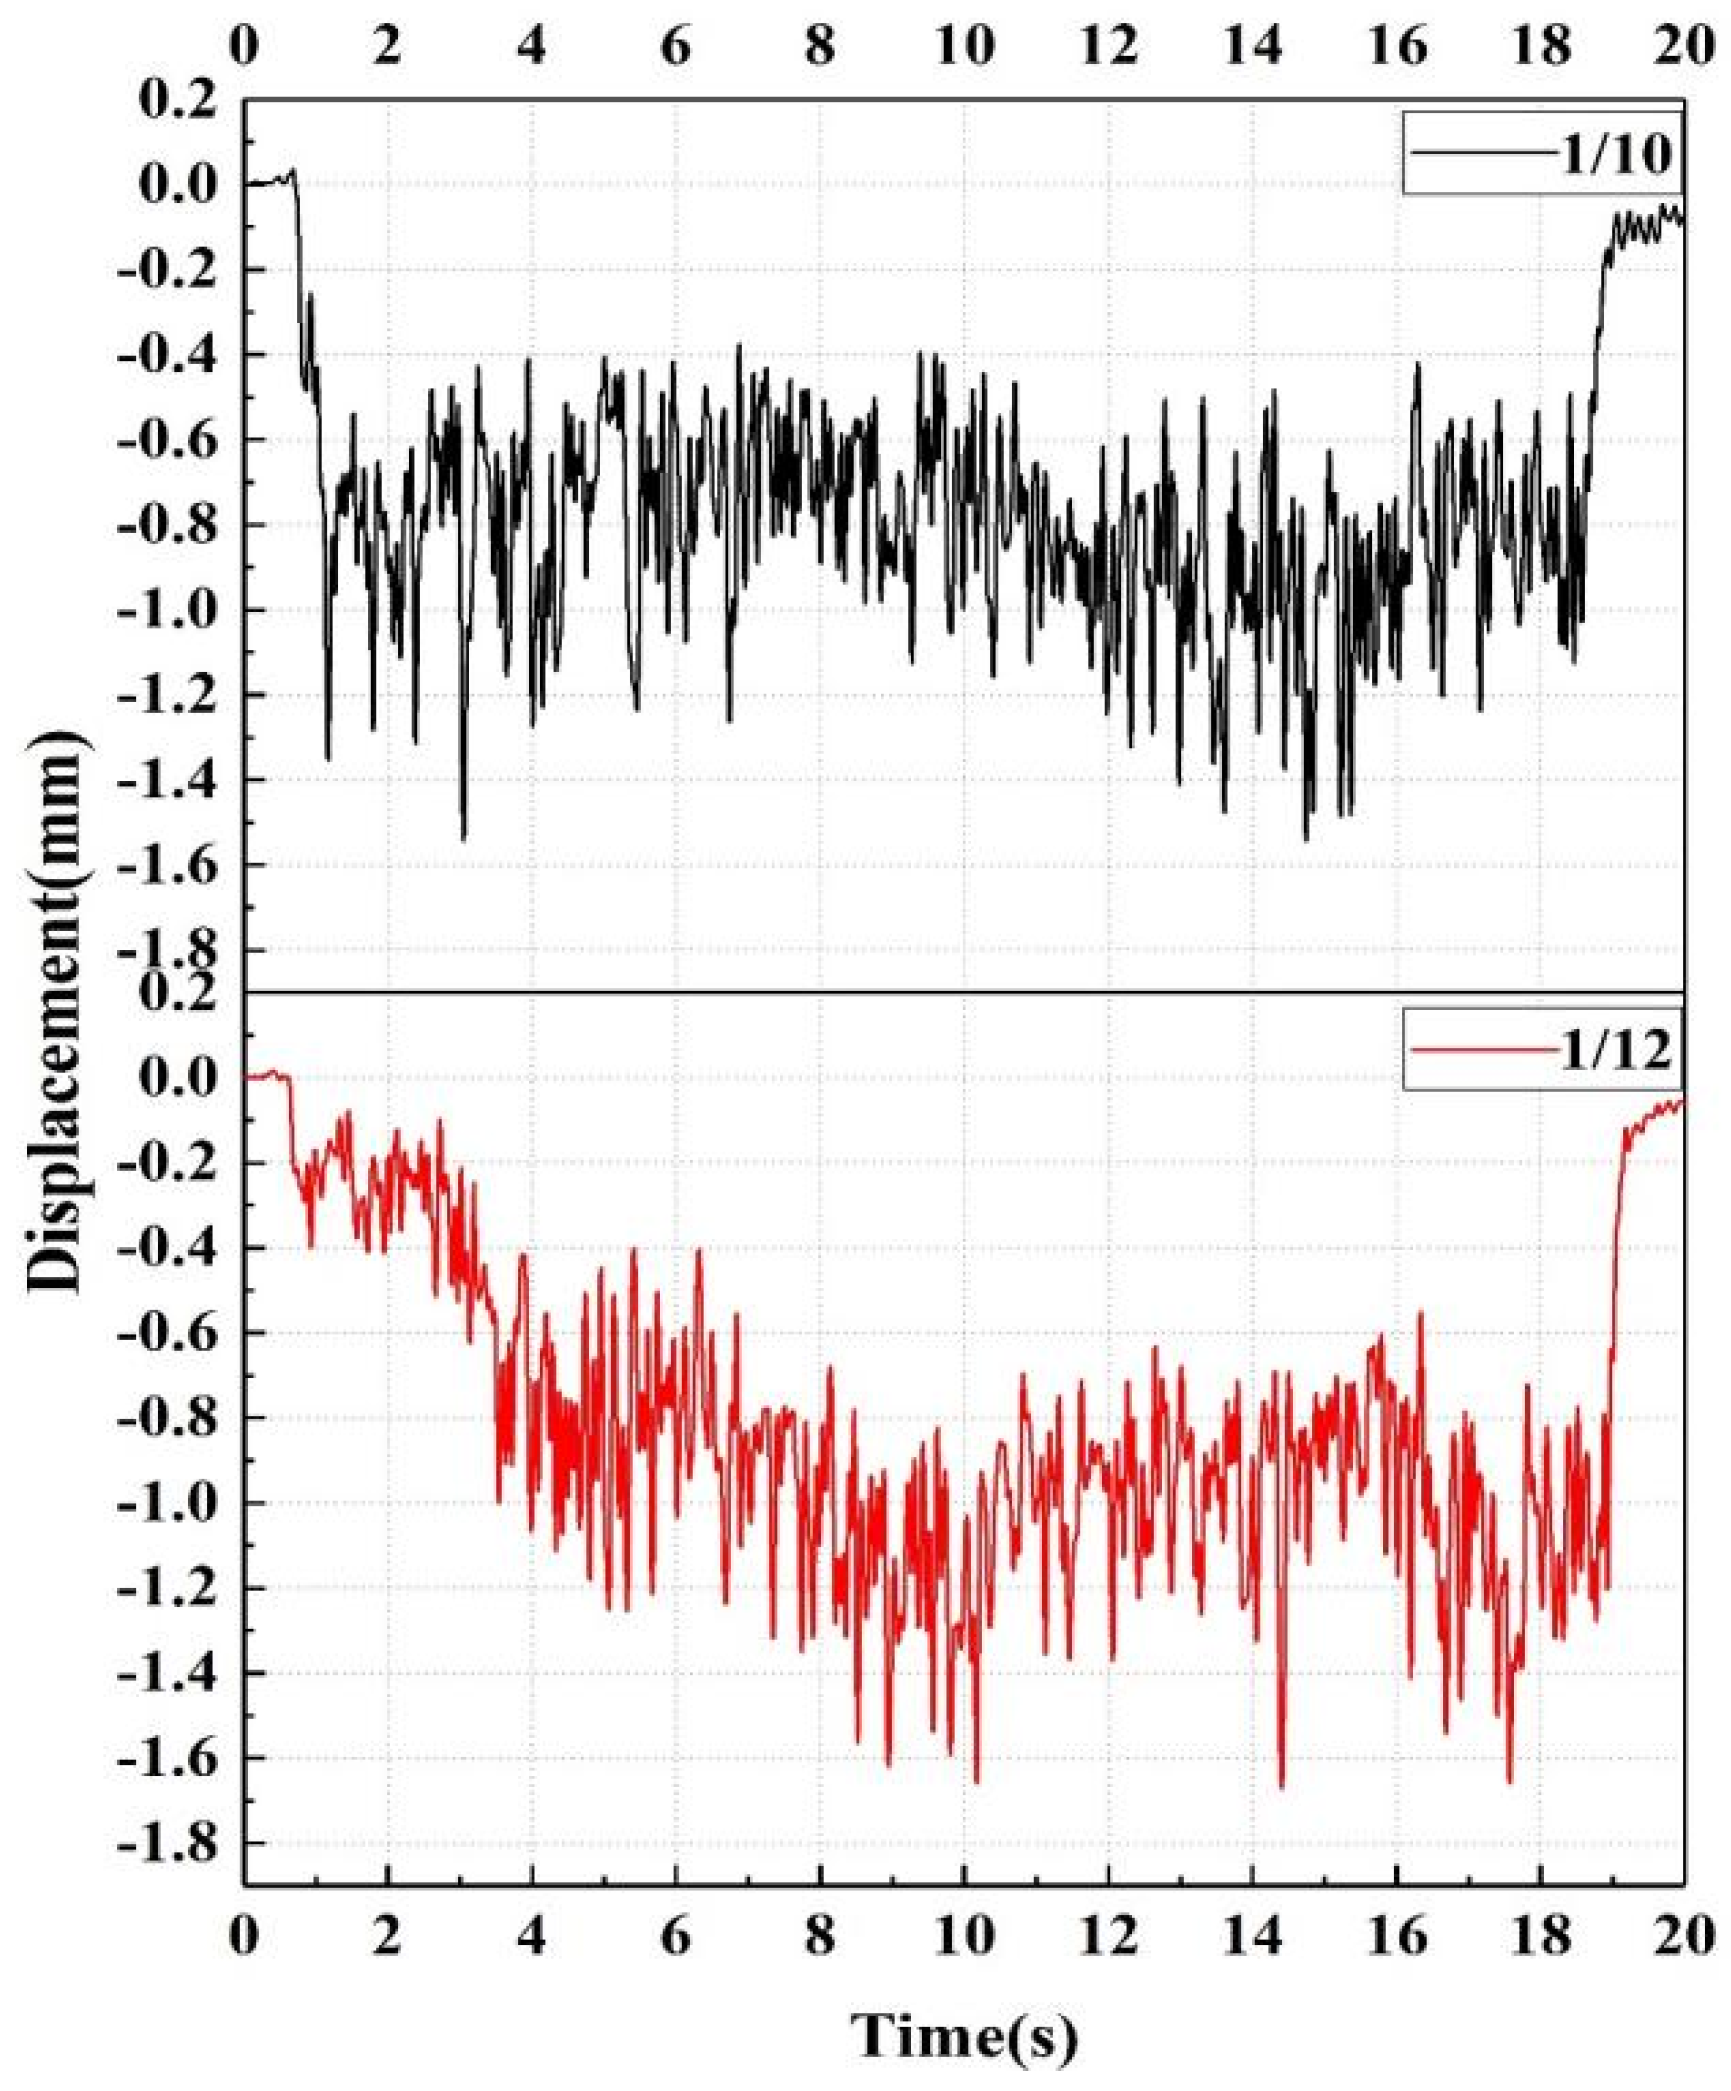
The experimental data for the central Point A (with a membrane prestress of 3.0 MPa and an edge cable tension of 7.5 kN) were analyzed for rise-to-span ratios of 1/10 and 1/12 under a rainfall intensity of 550 mm/h. The resulting dynamic response time-history curve for Point A is shown in Figure 7.
As illustrated in Figure 7, the maximum displacements for membranes with rise-to-span ratios of 1/10 and 1/12 are 1.55 mm and 1.67 mm, respectively. The membrane with the 1/12 ratio also exhibits a broader displacement variation range during the rainfall event. This indicates that, under the same prestress and boundary conditions, a smaller rise-to-span ratio leads to a more flexible structural form and a lower geometric stiffness against out-of-plane disturbance. As a result, the membrane becomes more sensitive to rainfall-induced vibration. In a more general sense, the present results suggest that a flatter saddle membrane is more vulnerable to dynamic deformation under heavy rainfall, even when the displacement remains at the millimeter level.

3.1.4. Different Edge Cable Tension

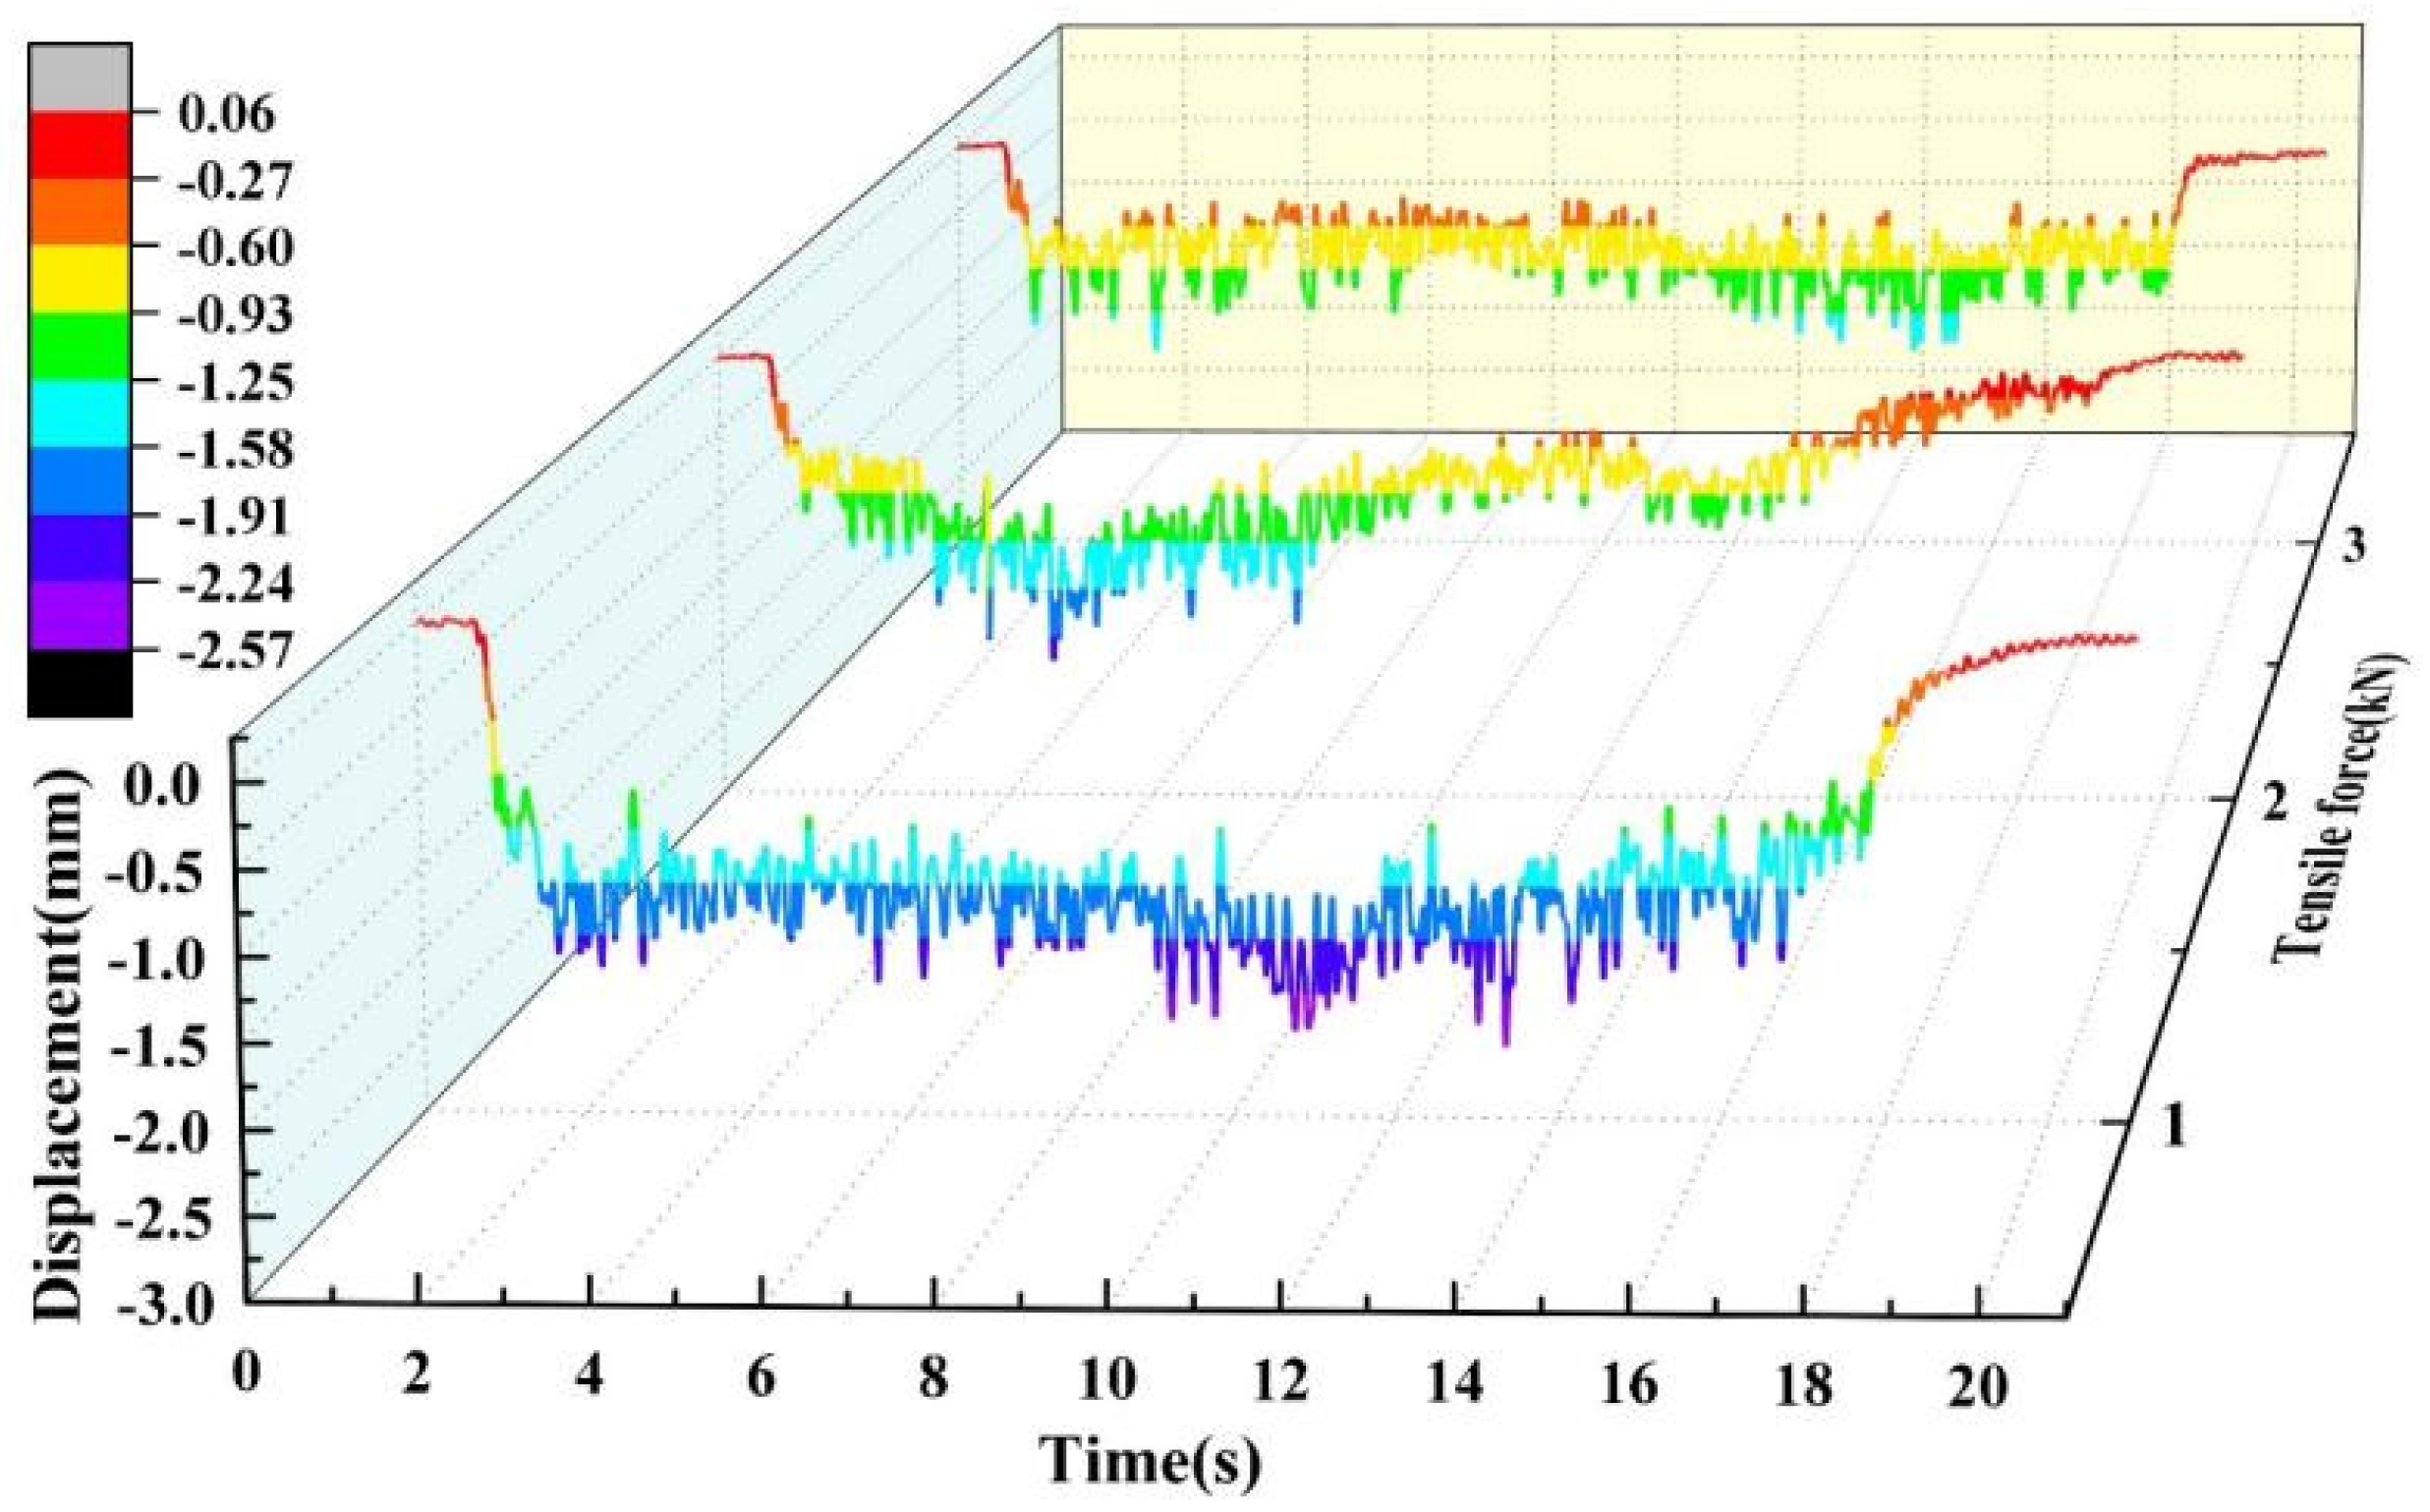
The experimental data for Point A at the membrane center were processed for a saddle membrane structure with rise-to-span ratios of 1/10 and 1/12 under a rainfall intensity of 550 mm/h. The analysis was conducted for three different edge-cable tension values: 1 kN, 2 kN, and 3 kN. The resulting dynamic response time-history curve for Point A is presented in Figure 8.
The data in Figure 8 reveals an inverse correlation between edge-cable tension and the maximum displacement at Point A, with recorded values of 2.56 mm, 2.08 mm, and 1.55 mm for tensions of 1 kN, 2 kN, and 3 kN, respectively. This trend indicates that a higher edge cable tension provides stronger boundary restraint and increases the effective stress stiffness of the membrane–cable system, which suppresses the development of out-of-plane vibration under rainfall impact. This reflects the role of edge cable tension in enhancing boundary restraint and prestress-dependent stress stiffness, which together reduce the dynamic deformation of the membrane under rainfall excitation.

3.1.5. Analysis of Edge-Cable Tension Loss and System Prestress Relaxation

Prestress relaxation of the membrane–cable system, manifested as a decrease in the tension of the four edge cables after heavy rainfall loading, is quantified by the relaxation ratio (Y). The cable forces are measured with a digital push–pull gauge, providing pre-load (N1) and post-load (N2) values tabulated in Table 7. The relaxation rate is computed using the following Equation (8):
Y = N 1 N 2 N 1 × 100 %
The measured cable forces before and after rainfall application (Table 7), obtained from the retained representative test record, indicate a noticeable prestress loss for the tested specimen under the present experimental condition, with a maximum relaxation rate of 10.4% and an average value of 8.13% among the four edge cables. These values should be interpreted as case-specific observations for the reported engineering-scale test rather than as statistically generalized parameters. The observed relaxation may be associated with the combined effects of cyclic dynamic deformation, local material viscoelasticity, and possible micro-slip at the membrane–corner connections. From a structural viewpoint, this reduction in prestress implies a decrease in effective stiffness and may adversely affect the subsequent dynamic performance of the membrane–cable system.
The present result provides experimental evidence that heavy rainfall can induce measurable relaxation in a prestressed saddle membrane roof. However, because the prestress-loss data were obtained under limited test conditions, additional repeated tests and broader parametric studies are still required before establishing a generalized prediction rule or design-level threshold for rainfall-induced relaxation.

3.2. Numerical Results

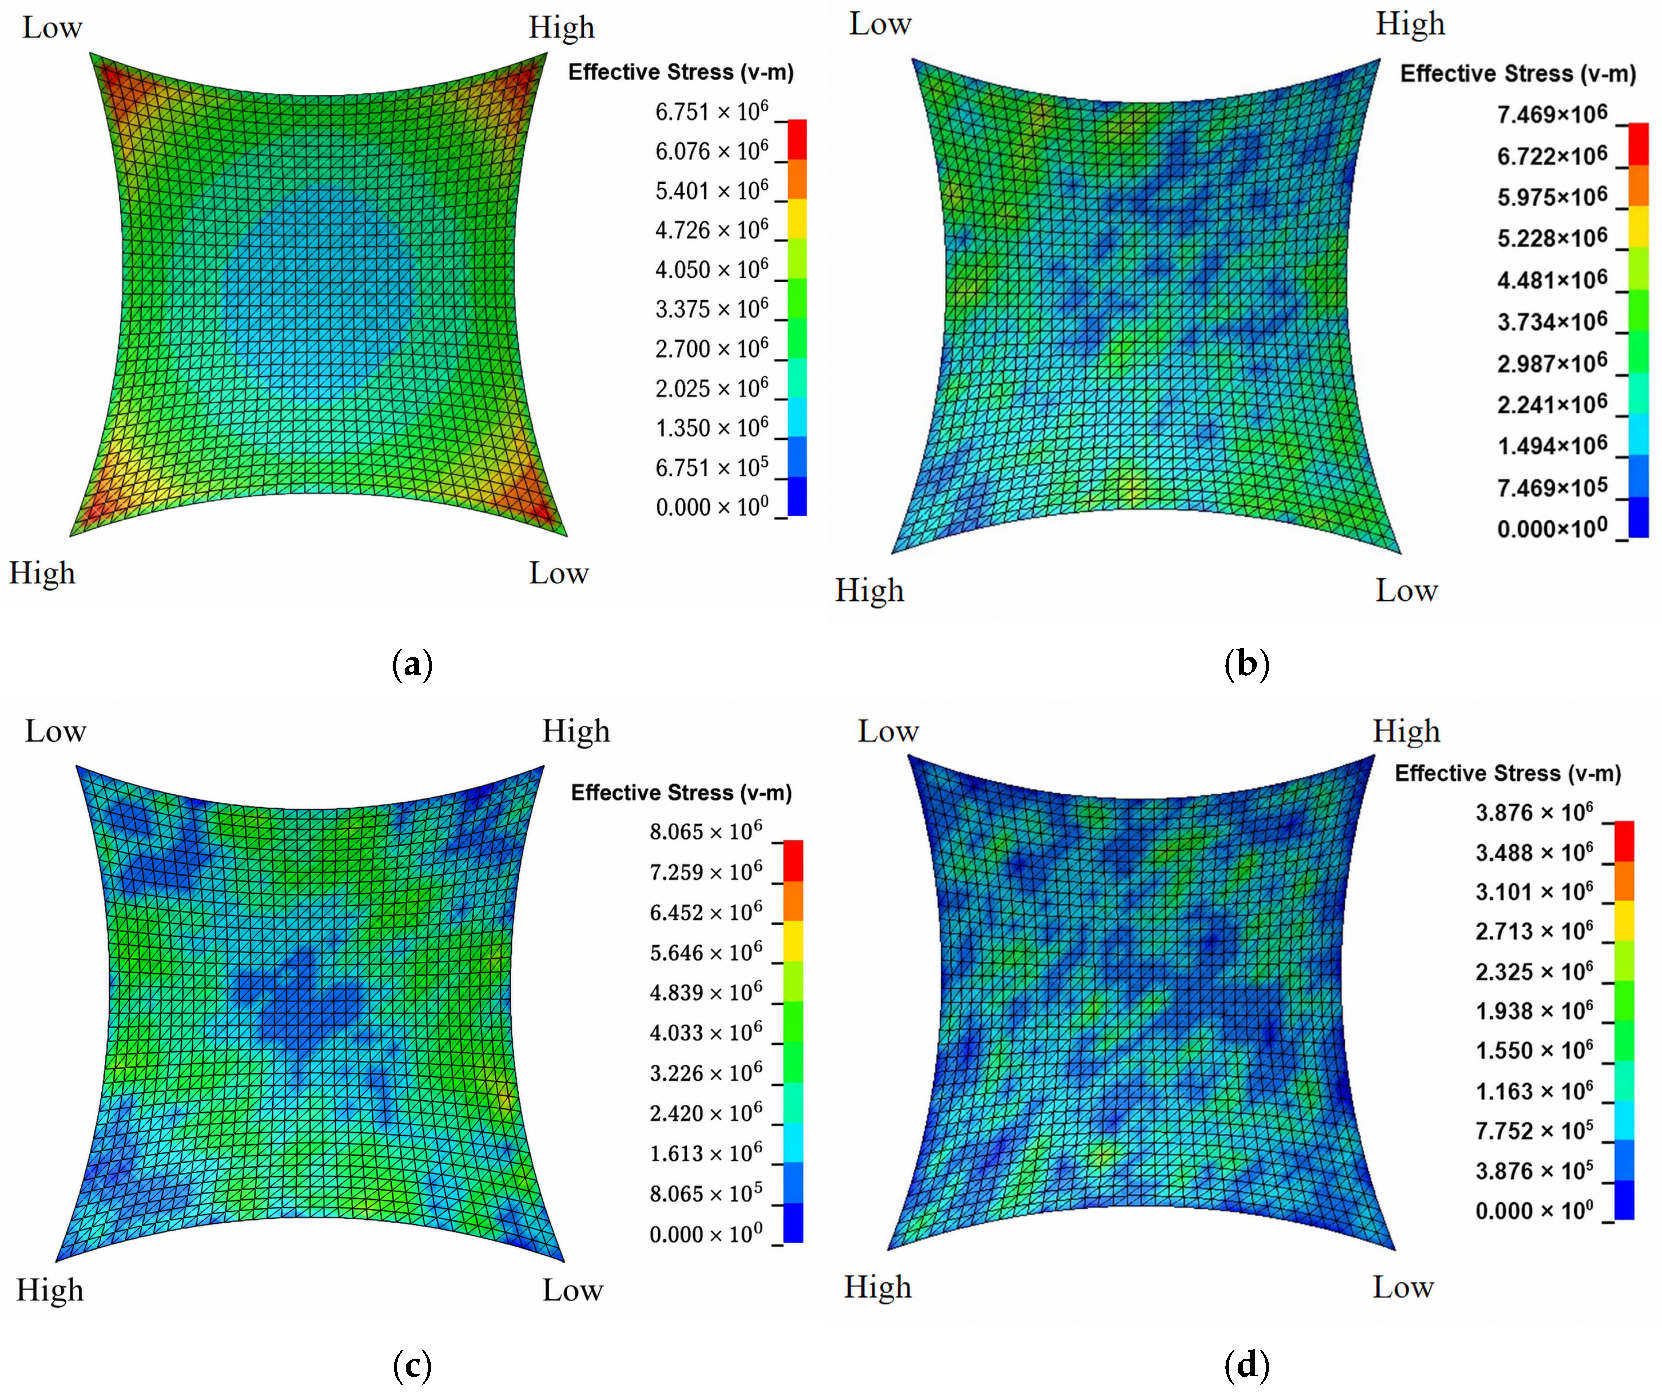
In the numerical simulation, the rainfall time history load is represented by P · ω ( t ) , where P is the heavy rainfall load (according to Equations (5) and (6), the different levels rainfall load can be obtained). The ω ( t ) is the type function of rainstorm load, which is obtained by rainfall experiment and solved by dynamic response analysis according to the time history load of the heavy rainfall. For the case study, a saddle membrane with 3.0 MPa prestress, 7.5 kN edge-cable tension and a rise-to-span ratio of 1/10 is analyzed under a heavy rainfall intensity of 550 mm/h. The numerical simulation scheme is depicted in Figure 9. “High” and “Low” denote the corner points with higher and lower elevations of the saddle-shaped membrane, respectively. The von Mises stress is expressed in MPa.
  • As illustrated in Figure 9a, before the heavy rainfall load acts on the membrane, the whole membrane is in the initial equilibrium state, the stress distribution is relatively uniform, and the maximum stress appears at the corner of the membrane.
  • As illustrated in Figure 9b, the heavy rainfall load starts to act on the membrane, resulting in vertical downward deformation of the membrane. The deformation of the area between the two high points on the membrane is significantly greater than that at the two low points on the membrane, so the stress distribution in the two high points of the membrane is greater than that in the two low points on the membrane.
  • As illustrated in Figure 9c, when the vertical displacement at the membrane center reaches its peak under sustained rainfall loading, the stress in the two low point membrane belt areas of the membrane increases and the stress distribution area becomes significantly larger.
  • As illustrated in Figure 9d, when the vertical displacement at the loading point on the membrane reaches its maximum, the vibration wave propagates to the cable boundary under the influence of membrane tension. Due to the partial energy dissipation of the vibration wave on the membrane, the stress distribution on the membrane is relatively uniform when the vibration wave stops transmitting and reaches the equilibrium position again.

3.2.1. Analysis of Numerical Simulation Results of Feature Points on Membrane

For the case with a rainfall intensity of 550 mm/h, membrane prestress of 3.0 MPa, edge-cable tension of 7.5 kN and a rise-to-span ratio of 1/10, the displacement time histories of all feature points are presented in Figure 10 to illustrate their dynamic responses.
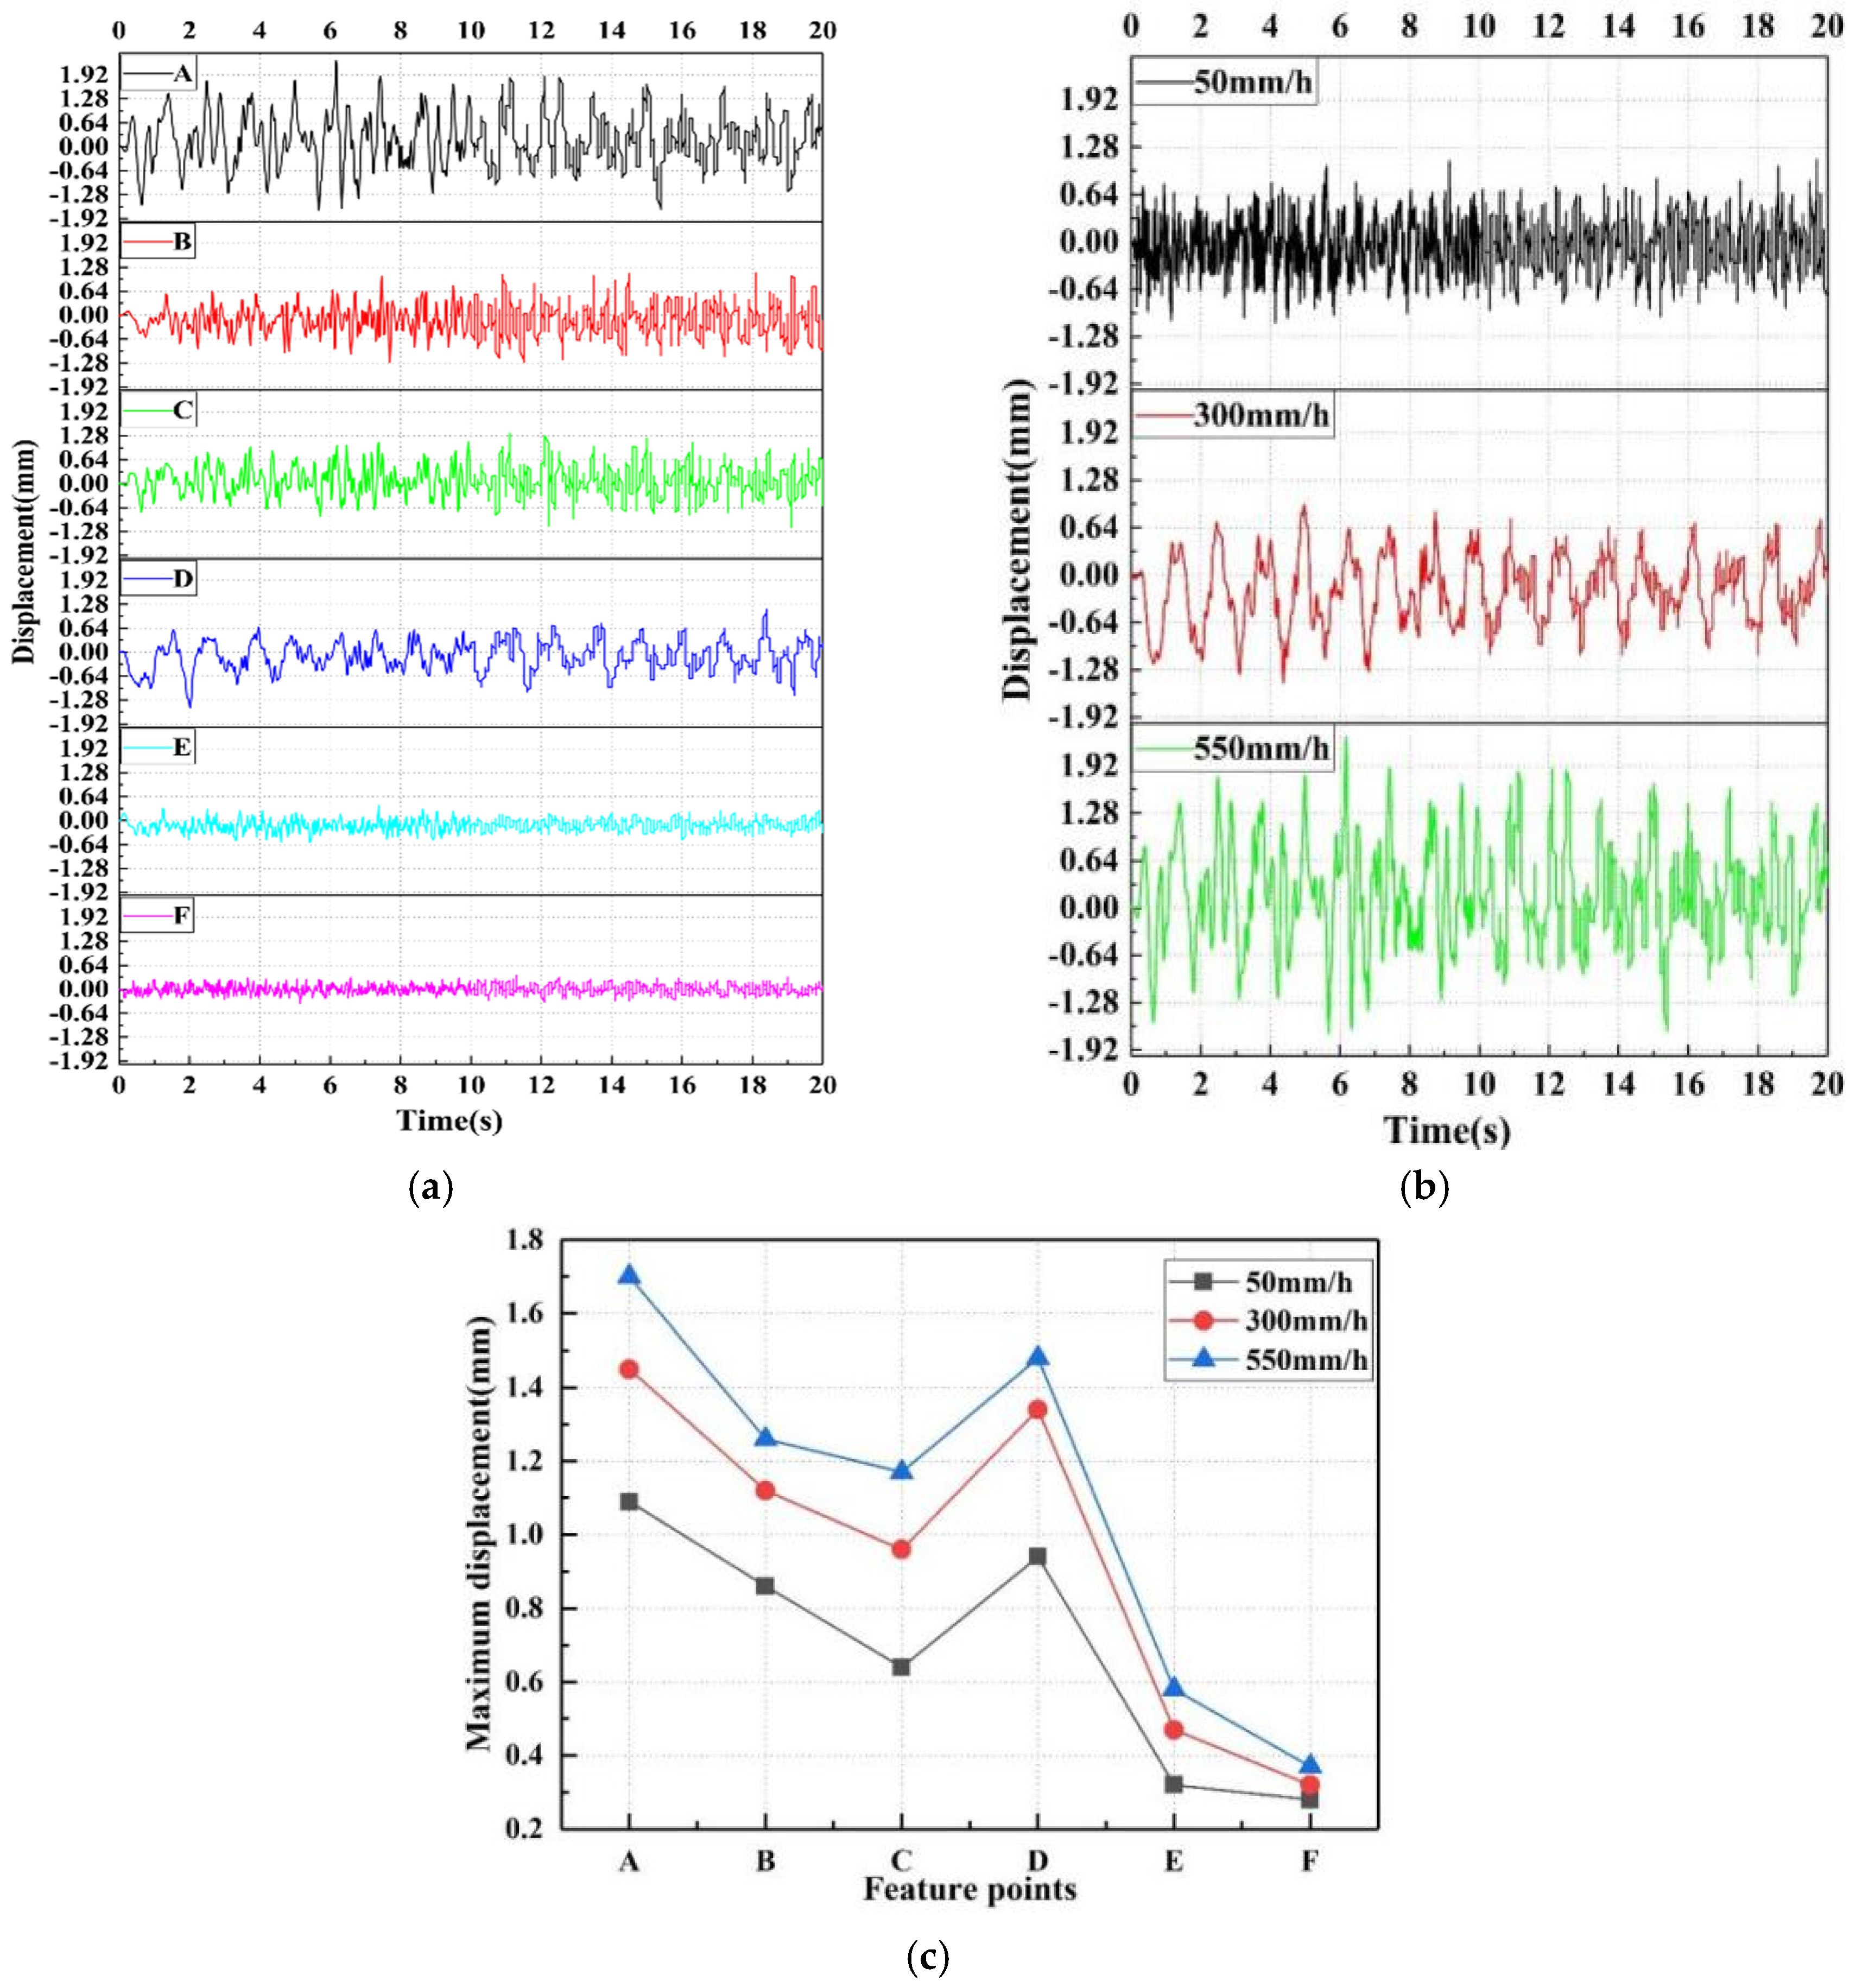
Figure 10a illustrates the time histories of vertical displacement at various feature points under a rainfall intensity of 550 mm/h. As expected, the maximum displacement (1.70 mm) occurs at the membrane center (Point A), attributed to the greatest distance from the boundary constraints and the lowest in-plane stress stiffness in this region. The displacement amplitude attenuates progressively towards the edges (0.37 mm at Point F), consistent with the energy dissipation of vibration waves propagating through the membrane material and being absorbed by the edge cables. The symmetric Points B and D exhibit similar magnitudes, confirming the symmetry of both the structure and the applied load. Points B and D are symmetric points, and they are closest to the central Point A of the membrane, so they are significantly affected by the vibration of the membrane, and their vibration deformation amplitude is second only to Point A. The displacement of Point E and Point F, which are far from the central point of the membrane, is significantly smaller than other feature points of the membrane. The main reason for this is part of the energy of the vibration wave is consumed in the process of transmitting from the central point of the membrane, so the vibration displacement becomes smaller, which also conforms to the transmission law of the vibration wave.

3.2.2. Numerical Analysis of Responses Under Different Rainfall Intensities

The saddle membrane structure with rise span ratio of 1/10, membrane prestress of 3.0 MPa and edge cable tension of 7.5 kN is selected. The numerical results of the center point A were analyzed under the action of three rainfall intensities of 50 mm/h, 300 mm/h and 550 mm/h, and the displacement time-history curve of the center Point A of the membrane was obtained, as shown in Figure 10b. In the same way, the maximum displacement of feature Points B–F on the membrane under three different rainfall intensities can also be obtained, as shown in Table 8 and Figure 10c.
As illustrated in Figure 10b,c and Table 8, the central Point A exhibits millimeter-level dynamic response, and the maximum displacement at each feature point increases with increasing rainfall intensity. For a given rainfall intensity, the peak displacement decreases as the distance from Point A increases, although the temporal variation in the responses at different points is similar. This behavior arises because the stresses are more concentrated near the membrane center, leading to millimeter-level transient vibration there, whereas the edge cables provide additional restraint along the edges. Consequently, feature points closer to the edge cables experience smaller deformations and displacements.

3.3. Validation

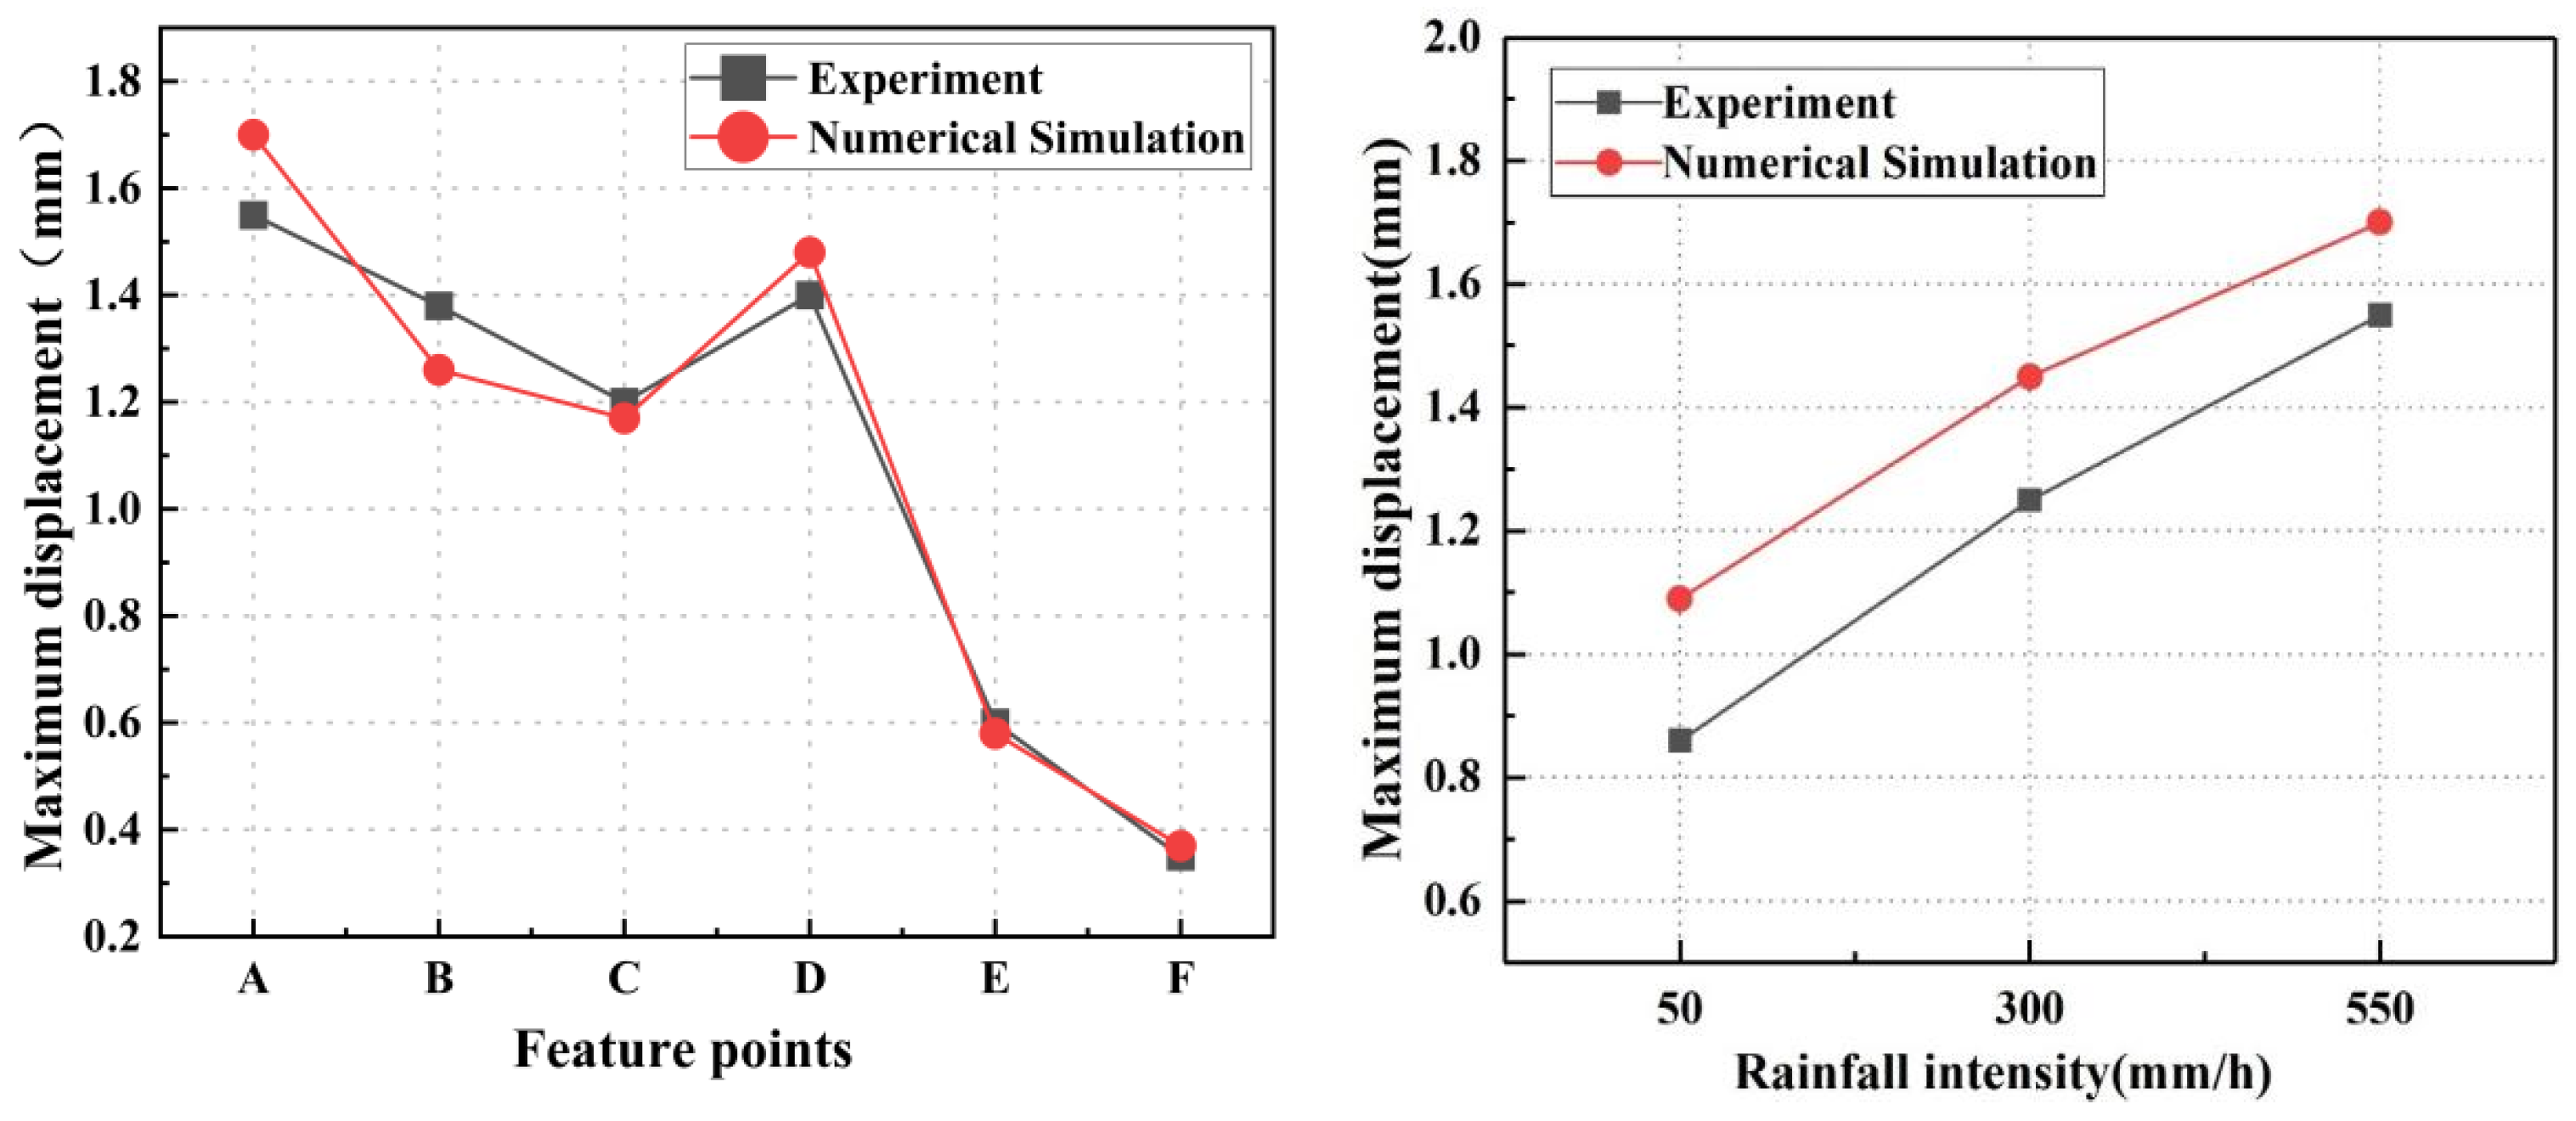
A comparative analysis was conducted between the experimental and numerical simulation results for the saddle membrane structure under heavy rainfall conditions. The analyzed structure had a membrane prestress of 3.0 MPa, a edge-cable tension of 7.5 kN, and a rise-to-span ratio of 1/10. The comparison includes both the spatial distribution of peak displacements at the six feature points and the variation in the central displacement under different rainfall intensities, as summarized in Table 9 and Table 10 and illustrated in Figure 11.
As shown in Table 9 and Figure 11, for the 550 mm/h rainfall case, both the experimental and numerical results indicate that the maximum displacement occurs at the membrane center (Point A). The predicted peak displacement at Point A is 1.70 mm, compared with the experimental value of 1.55 mm. For the six feature points, the absolute percentage errors of the predicted peak displacements are 9.7% (A), 8.7% (B), 2.5% (C), 5.7% (D), 3.3% (E), and 5.7% (F), giving a mean absolute percentage error of 5.9% and an RMSE of 0.087 mm. These results indicate that the numerical model reproduces the spatial distribution of membrane displacement with reasonable accuracy.
Table 10 further shows the comparison under different rainfall intensities at Point A. For rainfall intensities of 50, 300, and 550 mm/h, the relative errors between the numerical and experimental peak displacements are 26.7%, 16.0%, and 9.7%, respectively, with an RMSE of 0.196 mm. Although the relative error is larger at lower rainfall intensity, the corresponding absolute displacement level is also smaller, so the absolute discrepancy remains limited. Overall, the numerical model captures both the spatial response pattern and the intensity-dependent amplification trend, which supports its applicability for engineering-level assessment of saddle membrane roofs under heavy rainfall.
Despite these differences, the quantified error indices and the consistent reproduction of the spatial response pattern and intensity-dependent amplification suggest that the proposed modeling framework provides reasonable validation at the engineering-response level for the tested saddle membrane roof under heavy rainfall. It should be noted, however, that the present validation concerns the combined loading-structure model rather than an independent verification of the rainfall load model itself. A separate assessment of the load formulation would require direct measurements of rainfall impact pressure or droplet-scale interaction data, which are not available in the present study.

4. Discussion

The preceding numerical and experimental results show that heavy rainfall can cause localized vibration, outward wave propagation, and measurable prestress loss in saddle-shaped membrane roofs. While the overall agreement between simulation and experiment supports the validity of the proposed model, some discrepancies remain and require further interpretation. Therefore, this section discusses the rain-induced response mechanism, the reasons for model–test differences, the structural implications of prestress relaxation, and the practical recommendations and limitations arising from the present study.

4.1. Rain-Induced Vibration Characteristics and Response Mechanism

The dynamic response of the saddle membrane roof under heavy rainfall exhibits a clear propagation pattern: the vibration initiates near the rain-impact region and then spreads outward toward the boundary cables. This behavior can be understood within the mechanics of a prestressed flexible membrane. Because the membrane has very small bending stiffness, the out-of-plane disturbance induced by rainfall is transmitted mainly through the in-plane tension field rather than through flexural action as in conventional rigid plates. Therefore, the vibration propagation is governed primarily by membrane prestress, geometric stiffness, and boundary restraint.
From this viewpoint, the larger response at the membrane center can be explained by its greater distance from the boundary constraints and its relatively weaker out-of-plane restraint. Once rainfall introduces continuous momentum input in the central region, the disturbance propagates through the prestressed membrane surface toward the edges. During this process, the amplitude gradually attenuates because part of the vibration energy is redistributed and dissipated through material damping, local connection friction, stress redistribution, and cable-boundary restraint. The smaller responses measured near the edges are therefore mechanically consistent with the response of a bounded membrane–cable system.
This interpretation is also consistent with the observed parametric trends. Increasing edge-cable tension enhances the stress stiffness and boundary restraint, thereby suppressing transverse vibration. By contrast, a smaller rise-to-span ratio reduces the geometric stiffness of the saddle surface and leads to a larger out-of-plane response under the same rainfall excitation. In this sense, the observed vibration propagation pattern is not only an experimental phenomenon, but also a mechanically expected response of a prestressed membrane structure under localized transient loading.

4.2. Interpretation of Model–Test Discrepancies and Engineering Implications

The discrepancies between the numerical and experimental results mainly stem from modeling idealizations and uncertainties in the test conditions. In the experiment, the actual cable–membrane connections may exhibit local slip and finite boundary stiffness, which can alter the effective restraint and the associated energy dissipation. In addition, the applied rainfall field inevitably contains spatial and temporal non-uniformities, whereas the numerical model assumes a uniformly distributed load. These factors become relatively more influential when the response amplitude is small, which is consistent with the larger relative errors observed under low rainfall intensity in the validation results.
Nevertheless, the numerical model reproduces the main deformation pattern and the increasing response trend with rainfall intensity, demonstrating acceptable engineering accuracy in evaluating the heavy-rainfall response of saddle membrane roofs. From an engineering perspective, the measured prestress loss suggests that post-event pretension inspection should be considered after extreme rainfall. For the tested specimen, a rainfall intensity of 300 mm/h may be taken as an indicative reference level; beyond this level, the membrane–cable system should be checked for possible stiffness reduction and tension loss, and retensioning may be required if a significant decrease in pretension is detected. By contrast, full-scale roofs generally exhibit greater flexibility, larger unsupported spans, and exposure to wind-driven rain and spatio-temporal rainfall non-uniformity. Therefore, although the observed relaxation mechanism is physically meaningful, the corresponding numerical threshold should still be recalibrated on a project-specific basis by considering geometry, viscoelastic properties, and realistic loading conditions.

4.3. Prestress Loss Mechanism and Structural Implications After Heavy Rainfall

After heavy rainfall excitation, the saddle membrane roof exhibits a measurable prestress loss. Although the associated displacement response remains at the millimeter level and does not imply immediate structural failure for the present specimen, it still indicates a real dynamic disturbance and should be interpreted together with the observed reduction in prestress. In the present study, this relaxation is interpreted as the combined result of cyclic dynamic deformation, material viscoelasticity, and local frictional slip within the cable–membrane system under repeated impact loading. From an engineering standpoint, a reduction in prestress implies a loss of in-service stiffness, which may amplify subsequent dynamic responses and increase sensitivity to other environmental actions. Recent developments in cable-force monitoring and intelligent cable systems for prestressed spatial structures indicate that post-rainfall inspection of cable-force variation is technically feasible for membrane–cable systems [38,39]. Nevertheless, the quantitative level of prestress loss reported here is derived from limited experimental conditions and should therefore be regarded as preliminary engineering-scale evidence rather than a universally applicable value.

4.4. Limitations and Future Work

Several limitations should be acknowledged. First, the rainfall action is simplified as ideal vertical impact, and aerodynamic effects, multidirectional raindrop trajectories, and refined droplet–membrane contact processes are not explicitly modeled. In addition, the experimental rainfall simulation employed a controllable droplet size range of 1.7–2.8 mm, which represents only part of the natural raindrop spectrum, and the rainfall loading was treated as spatially uniform over the effective area. These simplifications were adopted to establish a controlled baseline for isolating the effect of rainfall momentum flux on membrane vibration and prestress relaxation; however, they may influence the local impact distribution and the quantitative prediction of peak response.
Second, the present study considers pure rainfall without wind. In actual service conditions, membrane roofs are often subjected to coupled wind–rain actions, which may modify raindrop trajectories, spatial loading patterns, and the resulting structural response. Therefore, the present conclusions are most directly applicable to rainfall-dominant conditions and should not be interpreted as a complete representation of wind–rain interaction effects.
Third, the numerical model does not explicitly account for local connection slip or the finite bending stiffness of the boundary connection region. These idealizations may affect the effective restraint, local force transfer, and energy dissipation of the membrane–cable system, and may therefore contribute to the differences between numerical and experimental results.
In addition, although repeated runs were conducted to check experimental consistency, complete time-history records of every repeated run were not systematically archived because the original protocol focused on representative-response identification rather than statistical uncertainty quantification. Therefore, standard deviations or error bars for all peak responses cannot be reliably provided in the present study. Future tests should retain all repeated records and report statistical descriptors such as standard deviations and coefficients of variation.
Another limitation is that a systematic mesh convergence assessment was not carried out in the present study. The adopted 5 cm mesh was selected to capture the global curvature and deformation mode of the saddle membrane with acceptable computational efficiency. Therefore, its influence on the main global displacement trend is expected to be less significant than its influence on local stress concentration and local peak responses. Nevertheless, formal mesh refinement and convergence verification are still required in future work to quantify the mesh-related uncertainty more rigorously.
Finally, the engineering recommendations are derived from a specific saddle membrane configuration with specific geometry, prestress level, material properties, and boundary conditions. Therefore, the proposed inspection and re-tensioning suggestion should be regarded as an indicative reference for the tested specimen rather than a universal criterion. Its broader applicability still requires verification modeling through additional experiments and parametric studies on other structural configurations.
Overall, these limitations are expected to affect the quantitative accuracy of local and peak responses more than the main qualitative trends identified in this study. Future work should therefore incorporate improved boundary/contact, more realistic stochastic rainfall fields, coupled wind–rain effects, and systematic sensitivity and mesh-convergence analyses to further enhance the predictive reliability of the model.


5. Conclusions

Based on the comparative numerical and experimental study of a saddle membrane structure under heavy rainfall, o the study indicates that the rain-induced dynamic behavior of saddle membrane roofs is governed by the combined effects of localized momentum input, membrane tension distribution, and boundary restraint. The following conclusions can be drawn:
  • Heavy rainfall induces a spatially non-uniform dynamic response, with the largest vibration occurring at the membrane center and then attenuating toward the boundary cables. Under 550 mm/h rainfall, the peak displacement, velocity, and acceleration at Point A reached 1.55 mm, 9.17 mm/s, and 4.82 m/s2, respectively, whereas the displacement at Point F was only 0.35 mm. This indicates that the rain-induced response is essentially a tension-dominated transverse-wave propagation process governed by membrane prestress, geometric stiffness, and boundary restraint.
  • The response amplitude is jointly controlled by rainfall intensity, structural geometry, and boundary pretension. The peak displacement at Point A increased from 0.86 mm to 1.25 mm and 1.55 mm as the rainfall intensity increased from 50 mm/h to 300 mm/h and 550 mm/h, respectively. A smaller rise-to-span ratio and lower edge-cable tension also produced larger responses, confirming that rainfall effects depend on the coupling between external excitation and the stiffness characteristics of the membrane–cable system.
  • Although the rainfall-induced displacement remained at the millimeter level and did not directly imply immediate failure, heavy rainfall caused a measurable prestress loss in the edge cables, with observed relaxation rates ranging from 6.60% to 10.40% under the reported test condition and an average of 8.13%. This suggests that the main structural significance of heavy rainfall lies in its reduction of effective stiffness and prestress reserve, which may increase vulnerability to subsequent environmental actions.
  • The numerical model reproduced the main response pattern and intensity-dependent trend with reasonable engineering accuracy. Under 550 mm/h rainfall, the predicted peak displacement at Point A was 1.70 mm, compared with the experimental value of 1.55 mm, with an error of about 9.7%. This supports the applicability of the proposed experimental–numerical framework for engineering-level assessment of rainfall-induced response and prestress relaxation, while the validation should be interpreted at the global structural-response level rather than as a complete physical validation of droplet-scale impact mechanics.
  • For the tested saddle membrane configuration, post-rainfall pretension inspection should be considered after extreme rainfall, particularly when rainfall intensity exceeds 300 mm/h. However, this suggestion should be regarded as an indicative reference for the present specimen rather than a universal criterion for all membrane roofs.

Author Contributions

Z.L., Data curation, Formal analysis, Investigation, Validation, Visualization, Writing—original draft; C.L., Funding acquisition, Methodology, Project administration, Resources, Supervision, Writing—review and editing; H.S., Data curation, Investigation, Validation, Visualization, Writing—original draft; T.L., Formal analysis, Investigation, Validation, Writing—original draft; P.L., Formal analysis, Investigation, Validation; X.L., Investigation, Validation, Visualization; S.J., Investigation, Validation; Y.L., Methodology, Resources. All authors have read and agreed to the published version of the manuscript.

Funding

This research was supported by the National Natural Science Foundation of China (Project Numbers 51608060), Guangzhou Science and Technology Project (Project number 202102010455).

Data Availability Statement

The original contributions presented in this study are included in the article. Further inquiries can be directed to the corresponding author.

Conflicts of Interest

Author Yanyun Liu was employed by Housing and Urban–Rural Development Bureau of Xuzhou District. The remaining authors declare that the research was conducted in the absence of any commercial or financial relationships that could be construed as a potential conflict of interest.

References

  1. Yang, S.; Zhao, B.; Chen, W. The added mass of a biaxial tensioned membrane in still air. Thin-Walled Struct. 2024, 195, 111531. [Google Scholar] [CrossRef]
  2. Chesnokov, A.V.; Mikhailov, V.V. Cable roof with stiffening girder and flexible membrane shell. Mag. Civ. Eng. 2024, 17, 12902. [Google Scholar] [CrossRef]
  3. Bakhshizadeh, A.; Sadeghi, K.; Ahmadi, S.; Royaei, J. Damage identification in long-span cable-stayed bridges under multiple support excitations. Int. J. Civ. Eng. 2023, 21, 1275–1290. [Google Scholar] [CrossRef]
  4. Tang, T.; Yang, D.H.; Wang, L.; Zhang, J.R.; Yi, T.H. Design and application of structural health monitoring system in long-span cable–membrane structure. Earthq. Eng. Eng. Vib. 2019, 18, 461–474. [Google Scholar] [CrossRef]
  5. Hu, J.H.; Chen, W.J.; Ren, S.J.; Zhang, S.H.; Qu, Y.G.; Yin, Y.; Yang, D. Building performance monitoring and analysis of a large-span aerogel-membrane airport terminal. Eng. Struct. 2020, 219, 110837. [Google Scholar] [CrossRef]
  6. Silva, J.C.M.; da Silva, J.G.S. Effects of geometric nonlinearity and aerodynamic damping on the dynamic structural response of tall buildings: A case study. Int. J. Civ. Eng. 2025, 23, 615–636. [Google Scholar] [CrossRef]
  7. Li, D.; Qiu, Y.; Wu, F.; Cheng, Z.; Zhao, C.; Lai, Z. Study on fluid–structure interaction of closed-type saddle membrane structure based on PIV technology. Eng. Struct. 2026, 348, 121776. [Google Scholar] [CrossRef]
  8. Chen, F.; Li, T.; Yang, Q. Fluid–structure interaction characteristics of tension membrane structures under free-vibration and forced-vibration based on numerical simulation. Thin-Walled Struct. 2025, 214, 113290. [Google Scholar] [CrossRef]
  9. Nava-González, R.; Pozos-Estrada, A.; Lopez-Ibarra, A. Development of fragility curves for tall buildings with tuned liquid dampers for vibration control under wind loading. Int. J. Civ. Eng. 2025, 23, 57–70. [Google Scholar] [CrossRef]
  10. Fang, Y.; Chen, W.; Zhang, D.; Zhao, B. Neural network-based prediction of wind-induced responses in large-span air-supported membrane structures. Thin-Walled Struct. 2025, 209, 112892. [Google Scholar] [CrossRef]
  11. Chavez, M.; Baskaran, A.; Feng, C.; Gan Chowdhury, A. Effect of assembly construction on the wind induced pressure of membrane roofs. Eng. Struct. 2020, 221, 110725. [Google Scholar] [CrossRef]
  12. Li, D.; Shen, R.; Zhu, Q.; Lu, L.Y.; Ding, H.; Yang, X.Q. Flow field characteristics and vibration responses of saddle-shaped membrane structures. Phys. Fluids 2024, 36, 107106. [Google Scholar] [CrossRef]
  13. Li, D.; Qiu, Y.; Shen, R.; Wang, Z.; Liao, Y. Experimental study of fluid–structure interaction of flexible saddle-shaped tensioned membrane roofs in laminar flows. Phys. Fluids 2025, 37, 083633. [Google Scholar] [CrossRef]
  14. Song, W.J.; Liu, H.B.; Yu, H.D. Probabilistic evaluation method of wind resistance of membrane roofs based on aerodynamic stability. Buildings 2024, 14, 3725. [Google Scholar] [CrossRef]
  15. Sun, X.; Yu, R.; Wu, Y. Investigation on wind tunnel experiments of ridge–valley tensile membrane structures. Eng. Struct. 2019, 187, 280–298. [Google Scholar] [CrossRef]
  16. Guo, J.; Zheng, Z.; Wu, S. An impact vibration experimental research on the pretension rectangular membrane structure. Adv. Mater. Sci. Eng. 2015, 2015, 387153. [Google Scholar] [CrossRef]
  17. Li, D.; Zheng, Z.L.; He, C.; Liu, C.Y. Dynamic response of pre-stressed orthotropic circular membrane under impact load. J. Vib. Control 2018, 24, 4010–4022. [Google Scholar] [CrossRef]
  18. Li, D.; Zheng, Z.L.; Yang, R.; Zhang, P. Analytical Solutions for stochastic vibration of orthotropic membrane under random impact Load. Materials 2018, 11, 1231. [Google Scholar] [CrossRef]
  19. Xu, J.; Zhang, Y.; Zhao, Q.; Zhang, L. Experiment and simulation analysis on Dynamic response of plane cable–membrane structure under impact load. Thin-Walled Struct. 2022, 171, 108814. [Google Scholar] [CrossRef]
  20. Liu, C.J.; Xie, H.B.; Deng, X.W.; Liu, J.; Wang, M.F.; Jiang, S. Random vibration of composite saddle membrane structure under the impact loading. Compos. Struct. 2021, 269, 114020. [Google Scholar] [CrossRef]
  21. Elishakoff, I.; Ajenjo, A. Closed-form random vibration response for columns on elastic foundation and subjected to axial force. Eng. Struct. 2019, 194, 431–440. [Google Scholar] [CrossRef]
  22. Choi, E.C.C. Determination of wind-driven-rain intensity on building faces. J. Wind Eng. Ind. Aerodyn. 1994, 51, 55–69. [Google Scholar] [CrossRef]
  23. Choi, E.C.C. Modelling of wind-driven rain and its soil detachment effect on hill slopes. J. Wind Eng. Ind. Aerodyn. 2002, 90, 1081–1097. [Google Scholar] [CrossRef]
  24. Abuku, M.; Janssen, H.; Poesen, J.; Roels, S. Impact, absorption and evaporation of raindrops on building facades. Build. Environ. 2009, 44, 113–124. [Google Scholar] [CrossRef]
  25. Kubilay, A.; Derome, D.; Blocken, B.; Carmeliet, J. CFD simulation and validation of wind-driven rain on a building facade with an Eulerian multiphase model. Build. Environ. 2013, 61, 69–81. [Google Scholar] [CrossRef]
  26. Luo, Z.; Zheng, Z.; Yang, R.; Zhang, P. The nonlinear vibration response of umbrella-shaped membrane structure under heavy rainfall loads. Buildings 2025, 15, 2529. [Google Scholar] [CrossRef]
  27. Fu, X.; Li, H.N.; Li, G.; Dong, Z.Q. Fragility analysis of a transmission tower under combined wind and rain loads. J. Wind Eng. Ind. Aerodyn. 2020, 199, 104098. [Google Scholar] [CrossRef]
  28. Zheng, Z.L.; Zhang, G.X.; Li, D.; Liu, C.J. Dynamic response of rectangular membrane excited by heavy rainfall. J. Vib. Control 2019, 25, 777–792. [Google Scholar] [CrossRef]
  29. Liu, C.J.; Wang, F.; He, L.; Deng, X.W.; Liu, J.; Wu, Y.Y. Experimental and numerical investigation on dynamic responses of the umbrella membrane structure excited by heavy rainfall. J. Vib. Control 2021, 27, 675–684. [Google Scholar] [CrossRef]
  30. Pan, R.J.; Liu, C.J.; Liu, J.; Zheng, Z.; Jiang, S.; Sun, Y.; Huang, W. Dynamic response and reliability of saddle membrane under wind-driven rain load. J. Vib. Shock 2023, 42, 295–303. (In Chinese) [Google Scholar]
  31. Sun, X.G. Distribution of Rainfall Intensity in Major Chinese Cities; Meteorological Press: Beijing, China, 2004. [Google Scholar]
  32. Marshall, J.S.; Palmer, W.M.K. The distribution of raindrops with size. J. Meteorol. 1948, 5, 165–166. [Google Scholar] [CrossRef]
  33. Van Dijk, A.I.J.M.; Bruijnzeel, L.A.; Rosewell, C.J. Rainfall intensity–kinetic energy relationships: A critical literature appraisal. J. Hydrol. 2002, 261, 1–23. [Google Scholar] [CrossRef]
  34. Fu, X.; Li, H.N.; Yang, Y.B. Calculation of rain load based on single raindrop impinging experiment and applications. J. Wind Eng. Ind. Aerodyn. 2015, 147, 85–94. [Google Scholar] [CrossRef]
  35. Fu, X.; Li, H.N. Effect of Raindrop Size Distribution on Rain Load and Its Mechanism in Analysis of Transmission Towers. Int. J. Struct. Stab. Dyn. 2018, 18, 1850115. [Google Scholar] [CrossRef]
  36. Laws, J.O. Measurements of the fall-velocity of water drops and raindrops. Trans. Am. Geophys. Union 1941, 22, 709–721. [Google Scholar] [CrossRef]
  37. Liu, C.J.; Deng, X.W.; Liu, J.; Peng, T.J.; Yang, S.P.; Zheng, Z.L. Dynamic response of saddle membrane structure under hail impact. Eng. Struct. 2020, 214, 110597. [Google Scholar] [CrossRef]
  38. Ou, T.; Zhu, W.X.; Lan, C.G.; Bai, B.P.; Bai, S.; Qiu, Y.W.; Liu, R.; Shen, Q.X. Development and engineering application of fiber Bragg grating intelligent cable in large-span hyperbolic parabolic spatial cable network. Structures 2024, 68, 107196. [Google Scholar] [CrossRef]
  39. Xu, J.; Xu, L.; Ma, Q.; Han, Q. Force evaluation of internal cable of prestressed grids based on field monitoring and hierarchical objective model updating. J. Civ. Struct. Health Monit. 2023, 13, 709–727. [Google Scholar] [CrossRef]
Figure 1. Saddle-shaped membrane structure experimental device.
Buildings 16 02010 g001
Figure 2. Sprinkler-based artificial rainfall simulation system.
Buildings 16 02010 g002
Figure 3. Schematic diagram of feature points on membrane and corresponding measuring point map of sensor. (a) Numerical schematic of feature points (A–F) on the saddle membrane; (b) Experimental arrangement of the corresponding sensor (A–F) locations.
Buildings 16 02010 g003
Figure 4. Analysis process of membrane form-finding.
Buildings 16 02010 g004
Figure 5. Representative displacement time-history curves of the feature points.
Buildings 16 02010 g005
Figure 6. Representative displacement time-history curves of Point A under different rainfall intensities.
Buildings 16 02010 g006
Figure 7. Representative displacement time-history curves at Point A for different rise-to-span ratios.
Buildings 16 02010 g007
Figure 8. Representative displacement time-history curves of Point A under different edge-cable tensions.
Buildings 16 02010 g008
Figure 9. Dynamic response process of the saddle membrane under heavy rainfall loading. (a) Before importing the time history curve of the storm load; (b) After importing the time history of the storm load; (c) Under the continuous impact of heavy rainstorms; (d) After the impact of the heavy rain subsided.
Buildings 16 02010 g009
Figure 10. Displacement response characteristics of membrane structures under heavy rain loads. (a) Time histories of vertical displacement at the membrane feature points. (b) Numerical simulation of displacement time-history curve for different rainfall intensities. (c) Comparison of peak displacements for the feature points on the membrane.
Buildings 16 02010 g010
Figure 11. Comparison of experimental and numerical simulation results of the maximum displacement of the membrane structure.
Buildings 16 02010 g011
Table 1. Records of maximum 1 min rainfall intensity, 1975–1984 (top 5).
PlaceMaximum Rainfall Intensity (mm/h)TimeRainfall Event Duration (h)
Guangzhou540.542 June 19841
Haikou458.168 April 19791
Nanping (Fujian)416.7613 June 19821
Yangjiang (Guangdong)402.8431 May 19782
Shantou (Guangdong)402.004 June 19761
The maximum rainfall intensity values in Table 1 are peak 1 min intensities. “Rainfall event duration (h)” denotes the approximate total duration of the corresponding rainfall event, not the duration of the peak intensity. Considering the possible upper bound of rainfall intensity, the present study examines the dynamic response of a saddle-shaped membrane structure under three representative rainfall intensities: 50, 300 and 550 mm/h.
Table 2. Membrane material parameters.
Material ParameterTechnical Data
Yarn thickness1100 dtex high-strength low-yarn polyester yarn
Fabric density12/12 yarn/cm
Thickness1.0 mm
Gram weight950 g/m2
Elastic modulus (longitude/weft)1720/1490 MPa
Tensile strength (longitude/weft)4400/4200 N/5 cm
Tear strength (warp/weft)600/550 N/5 cm
Bond strength>120 N/5 cm
Surface treatmentDouble-sided PVDF high self-cleaning coating
Table 3. Technical parameters of artificial simulated rainfall device.
Technical ParameterTechnical Data
Effective rainfall area1.2 m × 1.2 m
Continuous variation range of rainfall intensity0.83~8.33 mm/min or 2.08~12.5 mm/min
Maximum resolution of rainfall monitoring0.1 mm/min
Rainfall uniformity coefficient>0.86
Regulation range of raindrop size1.7~2.8 mm
Table 4. Model material properties.
Elementh (mm)ρ (kg/m3)Ex (MPa)Ey (MPa)NUXY
SHELL1631950172014900.34
LINK167——78501.5 × 105530.3
Table 5. Unit system.
MassLengthTimeForceStressDensityYoung’sVelocityGravity
kgmsNPakg/m3Pam/s9.806
Table 6. Dynamic response parameters of different membrane feature points.
Feature PointABCDEF
Maximum displacement (mm)1.551.381.201.400.600.35
Maximum speed (mm/s)9.177.116.127.794.182.16
Maximum acceleration (m/s2)4.823.173.153.342.561.36
Note: The values correspond to representative experimental records selected after repeated testing consistency checking.
Table 7. Membrane relaxation rate.
Edge Cable Serial Number1234
N1 (kN)7.507.507.507.50
N2 (kN)6.966.726.887.01
Relaxation rate (%)7.2010.408.306.60
Table 8. Maximum displacement of feature points at different rainfall intensity (mm).
Rainfall Intensity50 mm/h300 mm/h550 mm/h
Feature Point
A1.091.451.70
B0.861.121.26
C0.640.961.17
D0.941.341.48
E0.320.470.58
F0.280.320.37
Table 9. Maximum displacement of feature points at rainfall intensity of 550 mm/h (mm).
Feature PointABCDEF
Experiment1.551.381.201.400.600.35
Ansys1.701.261.171.480.580.37
Table 10. Maximum displacement under different rainfall intensities (mm).
Rainfall Intensity50 mm/h300 mm/h550 mm/h
Experiment0.861.251.55
Ansys1.091.451.70
Disclaimer/Publisher’s Note: The statements, opinions and data contained in all publications are solely those of the individual author(s) and contributor(s) and not of MDPI and/or the editor(s). MDPI and/or the editor(s) disclaim responsibility for any injury to people or property resulting from any ideas, methods, instructions or products referred to in the content.