Article

Evaluating the Resilience of Urban–Rural Information Infrastructure Systems: A Hybrid Concept Lattice–DEMATEL–VIKOR Model in Shandong, China


School of Management Engineering, Shandong Jianzhu University, Jinan 250101, China
*
Author to whom correspondence should be addressed.
Buildings 2026, 16(10), 1905; https://doi.org/10.3390/buildings16101905

Submission received: 19 March 2026 / Revised: 3 May 2026 / Accepted: 9 May 2026 / Published: 11 May 2026

Abstract

Urban–rural information infrastructure (URII) serves as the backbone of the “Digital Village” strategy; however, it faces significant threats from natural disasters and socioeconomic disparities. This study proposes a comprehensive resilience evaluation framework based on the pressure–state–response (PSR) theory. To address the limitations of traditional subjective weighting, we construct an integrated assessment framework that combines the entropy weight method with an improved concept lattice-weighted cluster DEMATEL method, effectively handling cognitive differences among experts. Using Lijin County in Shandong Province as a case study, we assess resilience levels from 2018 to 2022 via the VIKOR method. The results indicate a robust upward trajectory in overall resilience, progressing from a low-level state in 2018 to a high-resilience state in 2022. However, a dimensional comparative analysis identifies pressure resilience as the most critical weak point; consequently, the study establishes that the priority for future resilience enhancement follows the order: pressure > state > response. Based on these findings, specific countermeasures focusing on disaster risk monitoring and infrastructure redundancy are proposed to foster sustainable rural digital development.

1. Introduction

As highlighted in the 2025 Sustainable Development Goals Report and the World Cities Report, the resilience of information infrastructure has become a pressing concern amid intensifying climate extremes [1]. Rural areas, however, face inherent structural disadvantages compared with urban regions [2]. This thus widens the urban–rural resilience gap. In China, urban–rural information infrastructure (URII) constitutes a cornerstone of the “Digital Village” and “Digital China” strategies [3,4], underpinning critical functions such as digital governance, emergency response, and agricultural monitoring [5,6,7].
However, the systemic fragility of rural information networks remains prominent [8]. Constrained by deep-seated factors such as lagging rural economies, low construction standards, scarce disaster reduction resources, and the outmigration of technical labor [9], the underlying information networks are highly prone to collapse when hit by extreme disasters [10]. It is worth noting that information infrastructure exhibits complex network characteristics, where local damage can readily trigger cascading risk propagation through network topology [11]. Given the increasing frequency of external disturbances, it has become an urgent imperative to effectively enhance the resistance, recovery, and adaptive capabilities of these systems.
Extensive academic discussions have focused on the development and impact of information infrastructure [12,13,14,15]. It has been well documented that these systems drive digital transformation and empower vulnerable populations in developing countries [16,17,18,19]. However, existing research on infrastructure resilience exhibits a clear bias toward urban areas [20,21,22] and the organizational level [23,24,25]. Within the rural context, a few studies have begun examining the disaster resistance and economic effects of rural power grids [26,27,28], information and communication technologies [8,29,30], and smart technologies [31,32,33,34]. Nevertheless, research specifically targeting the resilience of rural information infrastructure remains extremely scarce. Furthermore, current studies on rural information systems are predominantly qualitative [35] or conceptual [36], lacking an operational, quantitative assessment framework suitable for rural environments. Therefore, it is of great significance to establish a quantitative evaluation method tailored to rural information infrastructure.
Several theoretical frameworks exist for resilience assessment, including the BRIC [37], TOSE [38], and pressure–state–response (PSR) models [39]. To better adapt to complex rural scenarios, this study adopts the PSR model to construct the evaluation indicator system. This model systematically captures the dynamic interactions among external risks (pressure), infrastructure status (state), and management interventions (response) [40,41]. In terms of assessment methods, hybrid multi-criteria decision-making (MCDM) models have proven applicable to information system continuity assessment. For instance, combining DEMATEL and VIKOR has been successfully applied to disaster recovery site selection for big data systems [42]. Building upon this indicator system and methodological foundation, this paper integrates concept lattice, DEMATEL, and VIKOR methods to form an integrated multi-criteria assessment framework designed for the quantitative evaluation of URII resilience. Specifically:
First, the traditional DEMATEL method is widely used in safety management [43,44], but it relies on expert scoring, which makes it susceptible to subjective bias. It often also obscures cognitive differences among experts from diverse backgrounds. To overcome this limitation, this study introduces the concept lattice method [45] to cluster and integrate expert opinions. This effectively identifies and fuses heterogeneous cognition, significantly improving the objectivity of judgments regarding inter-indicator relationships. Second, resilience assessment inherently faces the challenge of conflicting indicators and inconsistent dimensions. To address this, the VIKOR method [46] is introduced as a multi-criteria decision tool. Compared to traditional ranking methods, VIKOR better accounts for compromise solutions among conflicting criteria, providing a reliable basis for ranking resilience levels. Third, these methods are organically integrated to form a systematic hybrid assessment framework [47]. It can be argued that this methodological system not only fills the gap in quantitative resilience assessment for rural information infrastructure but also provides a reliable reference for measuring the resilience of other infrastructure systems in complex environments.
This study selects Lijin County in Shandong Province as a typical case for empirical analysis. Located in the Yellow River Delta, it faces compound risks from saline–alkali land and frequent floods, making it an ideal stress-test scenario. Simultaneously, as a pilot area for digital village construction, it exhibits unique characteristics of government-led rapid digital transformation. Its development trajectory reflects the “development–security” paradox common in transitional economies. It thus offers valuable lessons for developing countries balancing agricultural modernization with infrastructure shock resistance. This research aims to provide theoretical support and policy references for building high-resilience information infrastructure, serving the implementation of the national “Digital Village” strategy. Furthermore, it offers insights for other developing countries facing similar challenges, contributing to the global collaborative effort toward resilience and sustainable development in urban and rural areas under multiple crises.

2. Construction of Evaluation Indicator System

According to the triangulation method proposed in the qualitative research, textual data is collected from different channels, and different time, space and survey objects [47]. Therefore, this paper collects textual data through a literature search, material data collection, field research and three other ways to achieve the multiple combination of research data.
(1)
The CNKI full-text database and Web of Science database were used as search sources; subject combination search terms were designed by brainstorming method; and the relevant Chinese and English literature was searched and traced in the time period from January 2015 to December 2025.
(2)
The main search engines such as Peking University Database, Google, Bing and Baidu were used as the search sources to search the relevant materials such as rural information infrastructural policy documents, typical digital village cases, interview reports, news media reports and other related materials from January 2015 to December 2025.
(3)
Field research was conducted to visit the current situation of URII construction in the pilot areas of digital villages and to gain an in-depth understanding of the problems faced by urban and rural information infrastructure.
A total of 168 texts were collected through the above three methods. Some relevant texts are shown in Table 1 below.
To ensure transparency and scientific rigor, the construction of the URII resilience evaluation indicators followed a systematic three-stage filtering process based on the PSR theoretical framework.
First, the PSR framework was utilized to conceptualize URII resilience: pressure (P) refers to the strain exerted on the system by various disturbance factors, such as human interference and natural risks, over a specific period; state (S) represents the system’s condition and redundancy when subjected to these pressures; and response (R) denotes the system’s self-adaptation, reflecting its capacity to learn, change, and cope with post-impact challenges.
Stage 1: Literature Mining. An initial pool of 45 candidate indicators was extracted from the 168 collected documents, including policy papers, the academic literature, survey reports and typical case.
Stage 2: PSR Framework Alignment. These candidate indicators were systematically mapped onto the predefined pressure, state, and response dimensions to ensure theoretical relevance.
Stage 3: A panel of 10 experts was convened to evaluate the categorized indicators against three strict criteria: rural relevance, conceptual independence, and county-level data availability. To ensure the reliability and representativeness of the assessment, all selected experts possess over 10 years of professional experience and hold senior titles in fields directly related to information infrastructure and rural resilience. The panel was carefully balanced across academia, public administration, and industry practice, as detailed in Table 2. Based on the experts’ collective judgment, indicators exhibiting high multicollinearity or lacking continuous, publicly accessible statistical data at the county level were either eliminated or merged.
Through this rigorous process of text analysis and expert validation, the candidate indicators were refined and consolidated, yielding a final evaluation indicator system comprising 21 core indicators, as presented in Table 3.

3. Research Areas and Methods

3.1. Overview of the Study Area

Lijin County belongs to Dongying City, Shandong Province. It is located in the north of Shandong Province, between 118°07′–118°54′ E and 37°22′–38°12′ N. It is 102.5 km long from north to south and 8.5–25 km wide from east to west, with a total area of 1665.6 square kilometers. It has jurisdiction over two subdistricts, four towns, two townships and one provincial economic development zone. Lijin County has established the order of digital upgrading of different types of infrastructure, and has steadily promoted the construction of smart agriculture, intelligent transportation, a smart power grid, smart logistics, and digital rural cultural infrastructure. Its goals are to enhance the construction of digital agriculture platform, strengthen the application of digital technology, promote the full connection of digital agriculture and rural revitalization, accelerate the pace of agricultural and rural modernization, promote agricultural development and increase farmers’ income. In order to continue to promote the special protection of villages, the county should focus on protecting natural features, folk culture, historical sites and other traditional characteristics of resources, with the help of the Internet platform, to revitalize rural cultural tourism and special cultural industries.
However, there are also some challenges in the process of information infrastructure construction in Lijin County, such as the lack of unified planning and scattered capital investment. As the only county-level digital village pilot in Dongying City, a study on the resilience of URII in Lijin County can consolidate the foundation of digital village construction in Lijin County and provide a typical reference for the implementation of “Digital Village” strategies in other regions.

3.2. Data Sources and Study Period

Severe external shocks constitute the core scenarios for resilience assessment. Selecting a time window encompassing such shocks accurately captures a system’s absorptive, adaptive, and recovery capacities [57]. A closed time window prevents interference from irrelevant temporal data. It ensures the assessment remains focused on the complete “shock–response–recovery” chain. The primary impact of the pandemic was concentrated in early 2020 (January to April). Specifically, on 26 January 2020, Dongying City initiated a Level I emergency response to a major public health crisis, officially entering the shock phase. The city achieved comprehensive recovery by late March, subsequently transitioning into a normalized prevention and control phase. The 2018–2022 timeframe perfectly satisfies the requirements of this closed time window. Furthermore, 2018 marks the critical milestone when China’s “Digital Village” strategy was officially launched. Meanwhile, 2022 represents the concluding phase of the preliminary digital infrastructure rollout. Together, these years form a complete initial life cycle of digital village development. Based on these dual considerations, this study sets the empirical data timeframe to the 2018–2022 period.
Data were collected from the Dongying Statistical Yearbook (2019–2023), Lijin County Government Work Reports (2018–2022), Lijin County National Economic and Social Development Statistical Bulletins (2018–2022), Lijin County Budget Implementation Reports (2018–2022), and other publicly available sources, and compiled into a research database for evaluating the resilience level of URII in Lijin County during 2018–2022. Missing values in the panel data were addressed using linear interpolation, resulting in a fully complete data matrix. A review of government statistical documentation confirms that the definitions and calculation methods of all selected indicators remained unchanged throughout 2018–2022, with data collection and reporting strictly adhering to national protocols even during the pandemic phase. To maintain structural continuity, temporary pandemic-specific metrics were deliberately excluded; all variables are continuous series spanning the full 5-year period. The pandemic is treated as a macro exogenous shock, its impact internalized through observable fluctuations in continuous variables. For instance, E-commerce Employment Activities (A5), Fund Input for Disaster Reduction (A18), and Emergency Management Ability (A17) exhibited pronounced leaps around 2020. These variations were objectively captured by the entropy weight method and reflect the genuine response of the rural information infrastructure under external stress.

3.3. Research Methods

3.3.1. Combinatorial Weighting Method

(1)
Data preprocessing and objective weighting
Let i = 1,2 , , T index the evaluation years ( T = 5 ) and j = 1,2 , , n index the evaluation indicators. To eliminate dimensional inconsistencies, the raw panel data v i j are first normalized into q i j [ 0,1 ] using the standard min–max method. For positive indicators:
q i j = v i j m i n ( v j ) m a x ( v j ) m i n ( v j )
For negative indicators:
q i j = m a x ( v j ) v i j m a x ( v j ) m i n ( v j )
Subsequently, the entropy weight method is applied. The information entropy e j and the objective weight ω j s for the j -th indicator are computed as:
e j = 1 ln T i = 1 T p i j l n ( p i j ) , ω j s = 1 e j k = 1 n ( 1 e k )
where p i j = q i j / i = 1 T q i j (with p i j l n ( p i j ) = 0 if p i j = 0 ), T is the number of evaluation years ( T = 5 ), and n is the total number of evaluation indicators. Note that q i j = 0 and q i j = 1 correspond, respectively, to the lowest and highest observed levels of indicator j during the 5-year study period. Zero values are handled in the entropy calculation by the convention 0   l n   0 = 0 , and the normalized scale aligns naturally with the subsequent VIKOR ideal solutions.
(2)
Subjective influence scoring and expert weighting
A panel of m experts ( m = 10 ) is invited to rate the impact of indicator S i on S j using the following scale: 0 (no impact), 1 (minor), 2 (moderate), 3 (major), 4 (very significant). The scoring result of the k -th expert ( k = 1,2 , , m ) forms a direct influence matrix Z k = ( z i j k ) n × n .
(a)
To objectively cluster expert opinions, the concept lattice method is employed. A formal context is defined as a triple K = ( O , A , R ) , where O = { o 1 , o 2 , , o m } is the set of objects (experts); and A is the set of attributes, each attribute a p q representing the judgment that “expert’s score for indicator pair ( p , q ) is above the group mean”. R O × A is the binary relation: ( o k , a p q ) R if and only if z p q k > z ˉ p q , where z ˉ p q = 1 m k = 1 m z p q k is the mean score of all experts for that pair.
(b)
Based on this formal context, derivation operators are defined: for X O , X * = { a A o X , ( o , a ) R } ; for Y A , Y * = { o O a Y , ( o , a ) R } .
A pair ( X , Y ) is a formal concept if and only if X * = Y and Y * = X . The extent X represents the group of experts clustered into the same lattice node based on identical scoring patterns, and the intent Y represents the consensus attributes of that group.
(c)
Experts with exactly the same attribute set are grouped into one class, resulting in l mutually disjoint classes. Let β i be the number of experts in class i .
To determine expert weights, we impose two conditions: (i) the sum of all individual expert weights equals unity, i.e., i = 1 l β i λ i = 1 , where λ i is the weight assigned to each expert in class i ; (ii) the class-level weight is proportional to the number of experts in that class, i.e., β i = c λ i for some constant c .
Solving these equations with c = i = 1 l β i 2 yields λ i = β i / c . Thus, the weight of the k -th expert is λ i if that expert belongs to class i .
(3)
Construction of the comprehensive influence matrix
The aggregated direct influence matrix Z = ( z i j ) n × n is obtained by weighting each expert’s matrix:
z i j = k = 1 m λ k z i j k
To ensure convergence of the infinite series, Z is normalized into matrix B = [ b i j ] n × n as:
b i j = z i j m a x 1 i n j = 1 n z i j + ϵ , ϵ = 10 6
This guarantees ρ ( B ) < 1 . The comprehensive influence matrix C , which captures both direct and indirect impacts, is then computed using the convergent power series:
C = B ( I B ) 1
where I is the identity matrix.
(4)
Centrality and cause degree analysis
From C = [ c i j ] n × n , the influence degree (row sum) d i = j = 1 n c i j and the affected degree (column sum) r i = j = 1 n c j i are calculated. The centrality degree y i = d i + r i indicates the overall importance of indicator i , while the cause degree z i = d i r i reveals whether it is a net cause (positive) or net effect (negative). The subjective weight ω i o is derived as:
ω i o = y i 2 + z i 2 j = 1 n y j 2 + z j 2
(5)
Combinatorial weight determination
Finally, the objective weight ω j s and the subjective weight ω j o are integrated to obtain the combined weight ω j :
ω j = ω j o ω j s j = 1 n ω j o ω j s

3.3.2. Resilience Evaluation Method

The VIKOR method is used to evaluate the resilience level of URII. Let x i j = q i j denote the normalized value of indicator j in year i .
(1)
Ideal solutions
The positive ideal solution x j * and negative ideal solution x j are determined as:
x j * = m a x i x i j
x j = m i n i x i j
(2)
Group utility and individual regret
The group utility S i and individual regret R i for the i -th evaluation year are computed as:
S i = j = 1 n ω j x j * x i j x j * x j
R i = m a x j ω j x j * x i j x j * x j
where ω j is the combined weight from Equation (8).
(3)
Comprehensive evaluation value
The comprehensive evaluation value Q i is calculated as:
Q i = ε S i S S + S + ( 1 ε ) R i R R + R
where S + = m a x   i S i , S = m i n   i S i , R + = m a x   i R i , R = m i n   i R i , and ε [ 0,1 ] is the compromise coefficient. When ε > 0.5 , the decision favors group utility maximization; when ε < 0.5 , it favors individual regret minimization. In this study, ε = 0.5 is adopted, representing a balanced compromise.
(4)
Ranking of evaluation objects
The evaluation objects are ranked in ascending order of S i , R i , and Q i . The object with the lowest Q i value is considered the compromise optimal solution if both of the following conditions are satisfied:
Condition 1 (Acceptable advantage):
Q ( A ( 2 ) ) Q ( A ( 1 ) ) 1 T 1
where A ( 1 ) and A ( 2 ) are the evaluation objects ranked first and second by Q value, and T is the number of evaluation years ( T = 5 ).
Condition 2 (acceptable stability): A ( 1 ) must also be the best-ranked object by at least one of S or R values.
If either condition is not met, a set of compromise solutions is obtained rather than a single optimal object.
(5)
Resilience indicator
To facilitate subsequent resilience level analysis, the resilience indicator U R is calculated such that a higher value indicates stronger resilience:
U R = 1 Q
(6)
Resilience grade classification
After calculating the URII resilience indicator through the above process, according to the calculation results, the resilience level of URII is divided into five grades: very low resilience, low resilience, medium resilience, high resilience and very high resilience, as shown in Table 4 below. To facilitate meaningful interpretation of the resilience scores, the five-tier classification in Table 4 is accompanied by qualitative descriptors of system performance. Very low resilience characterizes a highly fragile state with limited inherent capacity to absorb disturbances. Low resilience indicates that foundational functions are in place, yet post-disruption recovery remains sluggish. Medium resilience reflects the ability to manage routine stressors, though the system may still be compromised under severe shocks. High resilience corresponds to a robust condition in which response mechanisms are swift and efficient. Finally, very high resilience denotes an advanced state of adaptive governance, where the system not only recovers but also learns and evolves in the face of adversity.

4. Analysis of Evaluation Results

4.1. Weight of Resilience Level Indicator

4.1.1. Subjective Empowerment Results

Based on the effect strength of each indicator, values were assigned using a five-point scale: no impact (0 points), minor impact (1 point), moderate impact (2 points), major impact (3 points), and very significant impact (4 points). Consequently, 10 initial direct impact matrices were obtained. To mitigate scoring variances arising from the experts’ diverse disciplinary backgrounds, the final direct influence matrix for the URII resilience indicator system in Lijin County was constructed using the conceptual lattice group decision-making method.
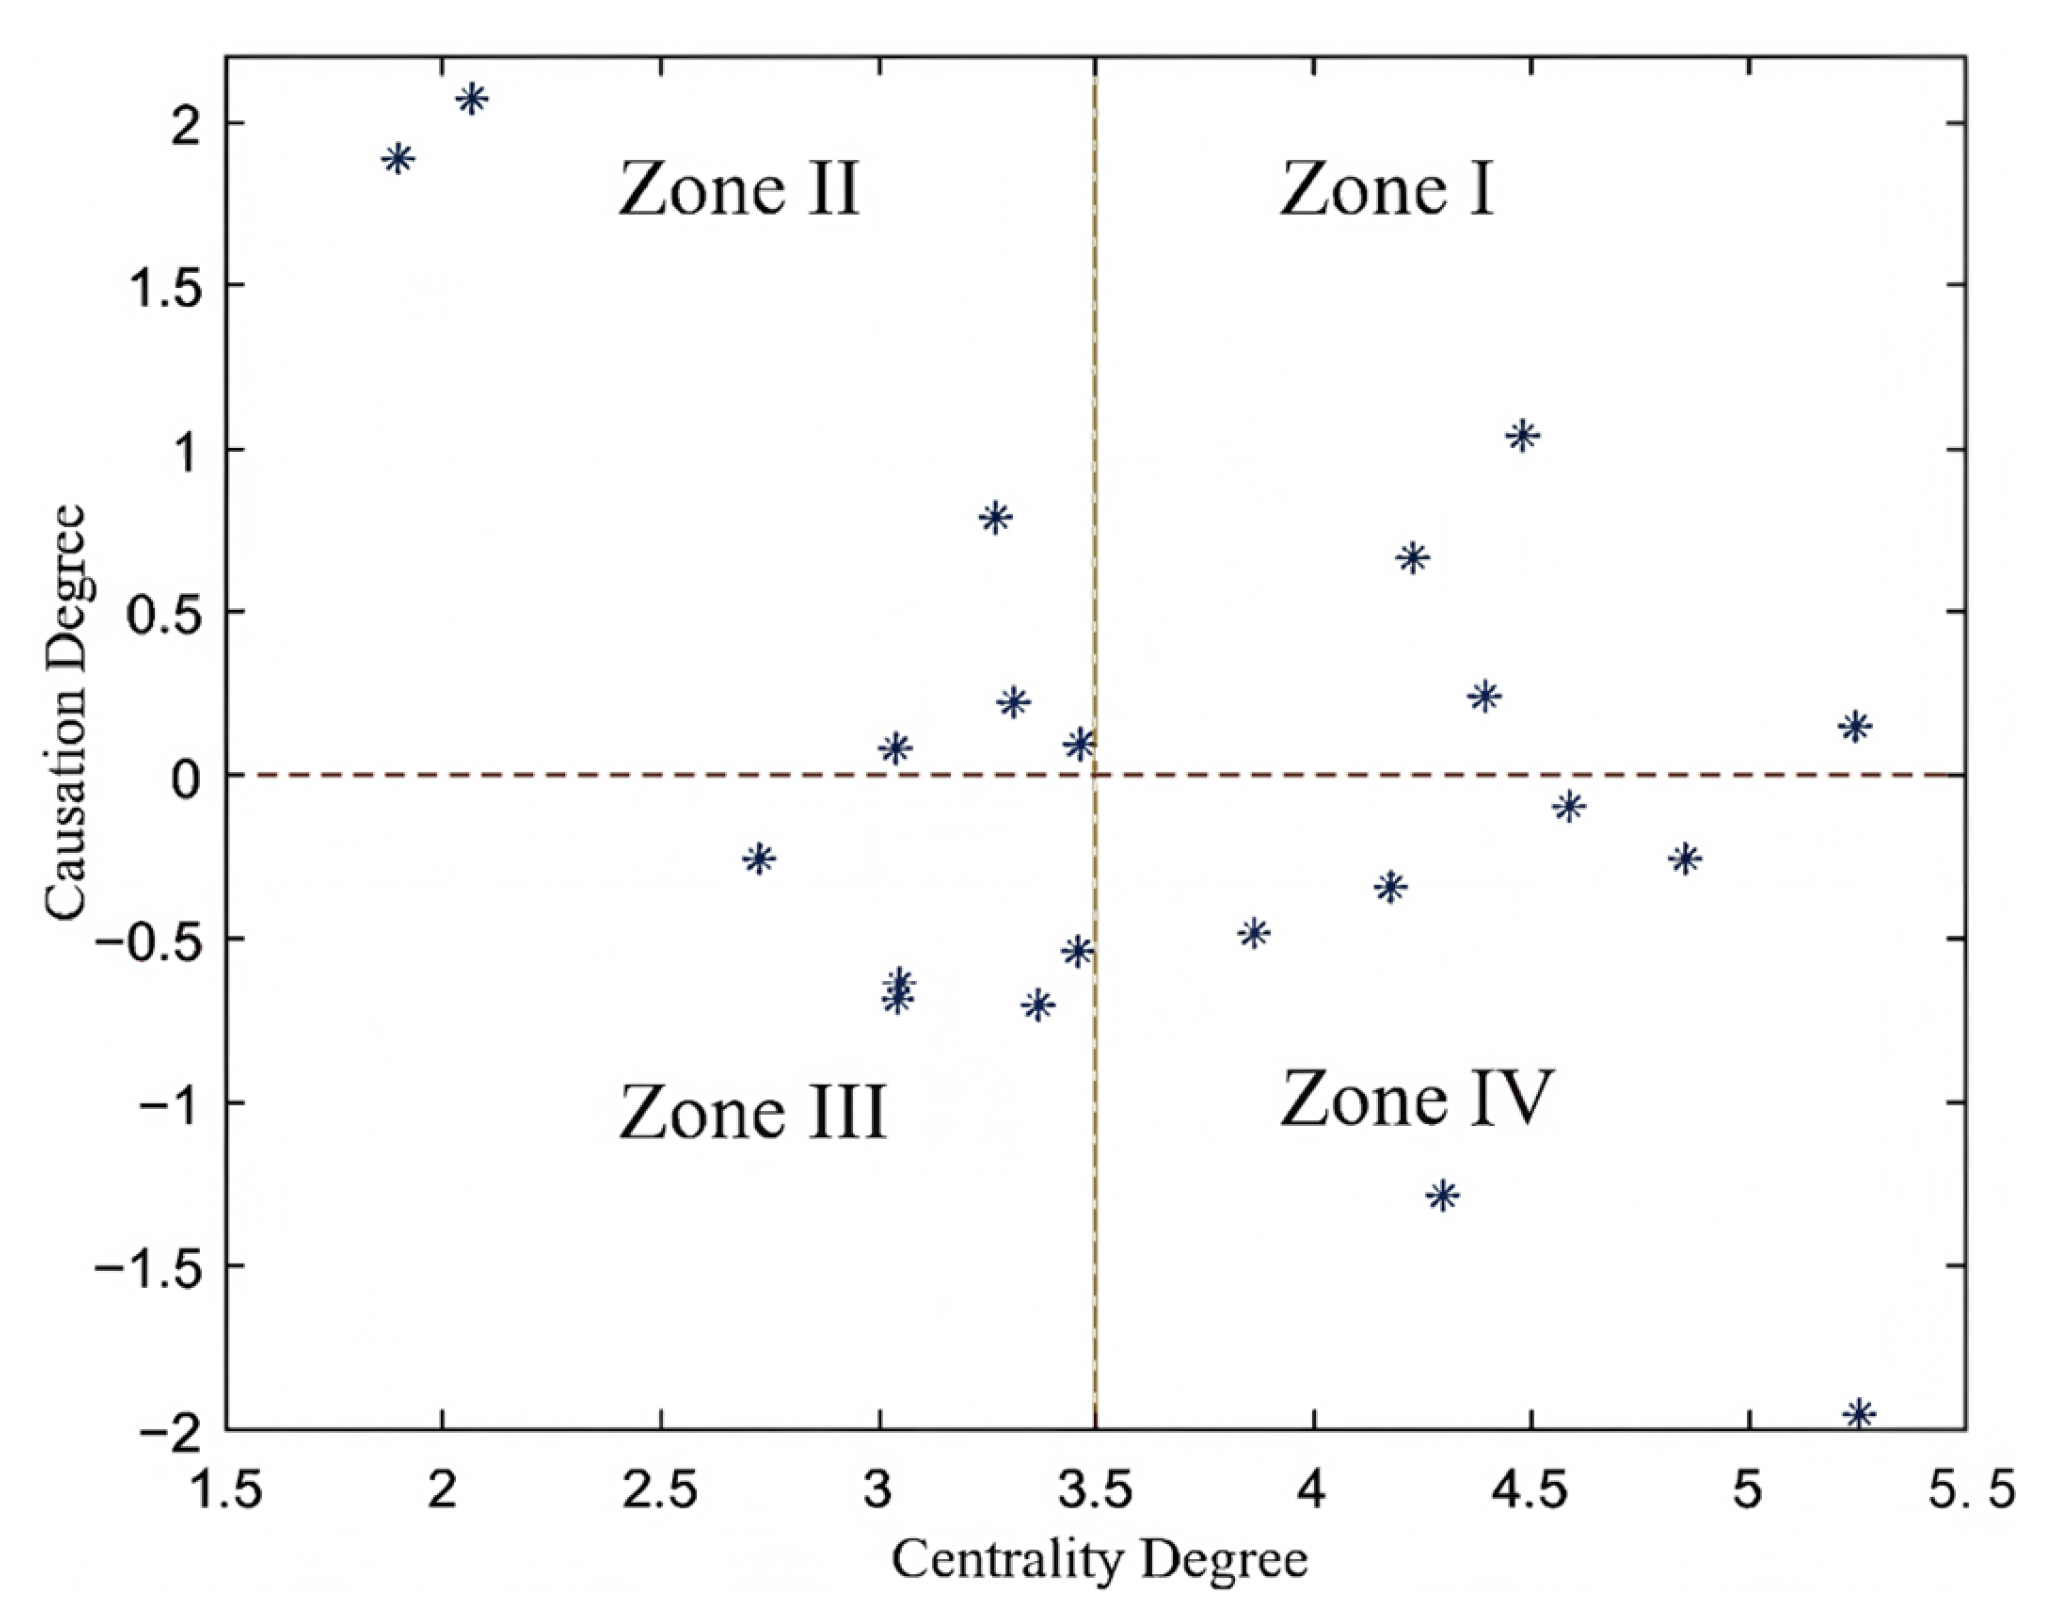
After obtaining the direct influence matrix, the matrix is normalized according to the procedure described in Section 3.3.1 to obtain the normalized direct influence matrix, and the comprehensive influence matrix is subsequently derived. From the comprehensive matrix, the influence degree, affected degree, centrality degree, and cause degree of each indicator are calculated, and the distribution diagram of centrality degree and cause degree is drawn, as shown in Figure 1. Finally, the subjective weight of each indicator is calculated. All the above calculations are completed by running MATLAB R2021a software. The calculation results of subjective weights of each indicator are shown in Table 5.
As can be seen from the centrality–cause degree distribution diagram in Figure 1, the resilience indicators of URII are clustered into four categories. The first category comprises the strong cause indicators (Zone I), which exert a very significant driving influence on URII resilience and have a considerable impact on other indicators. The second category consists of the weak cause indicators (Zone II), which also contribute to URII resilience and exert a moderate influence on other indicators. The third category includes the weak effect indicators (Zone III), which are primarily driven by other indicators and have a limited impact on URII resilience. The fourth category encompasses the strong effect indicators (Zone IV), which are likewise shaped by the combined influence of other indicators but play a particularly important role in determining URII resilience.
According to the results of the subjective weight calculation of the URII resilience indicator in Table 5, the top three of the subjective weight values are emergency management ability (A17), digital economy environment (A7) and mobile network construction (A11).

4.1.2. Objective Empowerment Results

In this study, the entropy weight method was used for objective empowerment, and then the objective weights of the resilience indicators of URII were calculated according to Formulas (1)–(3). The results were shown in Table 6, among which the four indicators with high weights were digital talent shortage (A6), emergency management ability (A17), natural risk early warning capability (A14), and training of practitioners (A21).

4.1.3. Combine Weighted Results

By combining the conceptual lattice-weighted cluster DEMATEL and the objective weighting results of the entropy weight method, Formula (8) is used for weighting calculation, and the combined weight results are obtained in Table 7. Among them, the digital talent shortage (A6), emergency management ability (A17), natural risk early warning capability (A14), and the training of practitioners (A21) are the top indicators. Among the three dimensions of pressure, state and response, the indicators with the highest combined weight are the digital talent shortage (A6), financial construction funds input (A9) and the emergency management ability (A17). Furthermore, to clarify the relative importance of indicators within their specific dimensions, the ‘intra-group weight’ was calculated by normalizing the combined weights within the respective pressure, state, and response categories.

4.2. Time Series Evolution Trend of Resilience Level

Through the above evaluation steps, taking Lijin County as an example, the group utility value S, individual regret value R, and comprehensive evaluation value Q of the resilience of URII in Lijin County from 2018 to 2022 are calculated. Finally, the resilience level of URII in Lijin County from 2018 to 2022 is calculated according to the resilience indicator calculation formula, and the results are shown in Table 8.
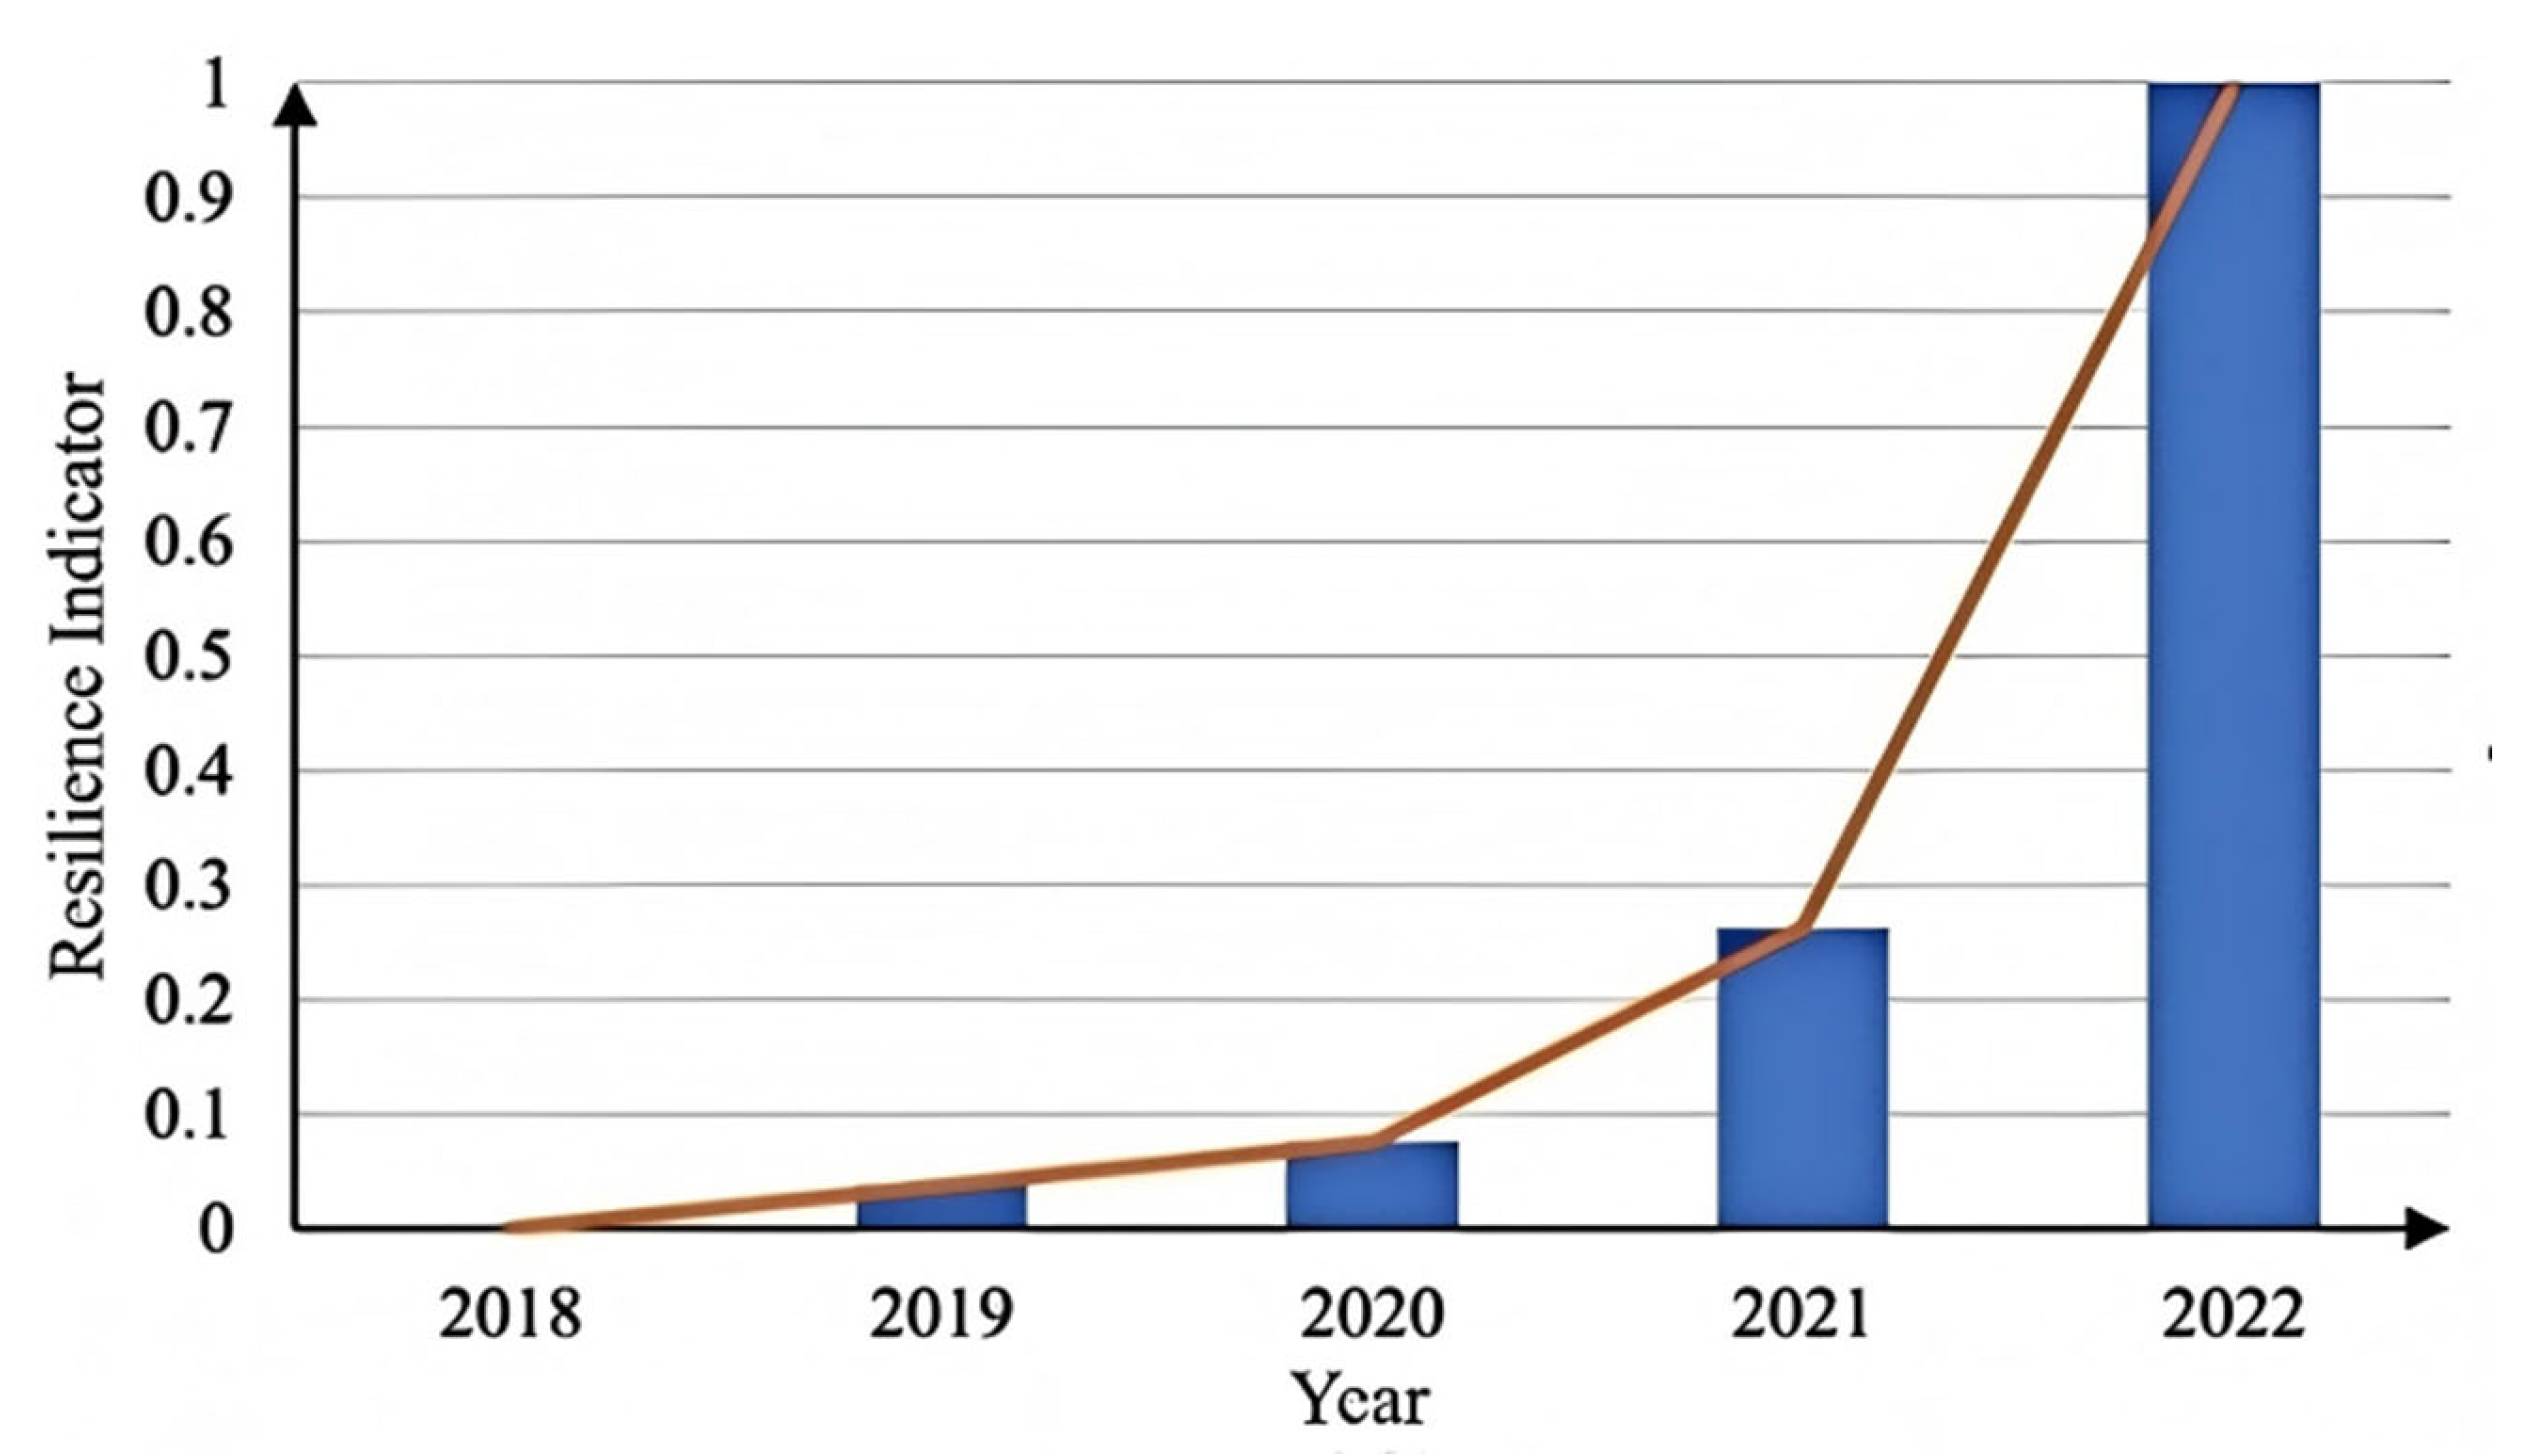
In order to more intuitively show the resilience level of URII in Lijin County from 2018 to 2022, this paper draws a change trend chart of the resilience level of URII in Lijin County from 2018 to 2022 according to the URII resilience indicator in Lijin County; see Figure 2.
Based on the calculation results, the URII resilience level in Lijin County exhibited a consistent year-on-year increase from 2018 to 2022, as shown in Figure 2, culminating in its highest score in 2022. Specifically, the resilience indicator for the 2018–2020 period was persistently low, ranging from 0 to 0.2000. During this phase, the “Digital Village” strategy was first introduced in the 2018 No. 1 Central Document, formally initiating relevant rural construction. By May 2019, with the promulgation of the Outline of Digital Village Development Strategy, the concept was clearly defined, emphasizing the accelerated construction of URII and the rural digital economy. Consequently, this period marked a transition from an exploratory embryonic stage to a clearly defined conceptual framework. In practice, URII remained in a preliminary phase of development, which is accurately reflected by the low resilience scores.
In 2021, the calculated URII resilience indicator for Lijin County rose to between 0.2000 and 0.4000. While still at a relatively low level, this represented a marginal improvement. During this stage, the central government prioritized digital village construction and issued the Digital Village Construction Guide 1.0, which provided systematic guidance for local planning and implementation. As URII construction began to deepen, the systemic resilience capacity improved accordingly compared to the previous stage.
In 2022, the URII resilience indicator experienced a significant leap, reaching between 0.8000 and 1.0000, and indicating a very high resilience level. At this stage, digital village construction entered a phase of rapid and comprehensive deepening. The Guidelines for the Construction of the Digital Village Standard System was issued that year, signaling that the initiative had matured into a period of standardized construction and development. The issuance of these national standards temporally aligned with the peak of Lijin County’s URII resilience performance.
It is important to emphasize, however, that the current observational evaluation design does not permit any definitive causal claims regarding these policy impacts. The observed temporal alignment should therefore be interpreted as a concurrent developmental trend rather than strict evidence of a causal relationship. Future research employing quasi-experimental methods, such as difference-in-differences, is required to rigorously isolate and quantify the specific effects of these macro-policies on local infrastructure resilience.

4.3. Dimensional Comparison of Resilience Level

The pressure resilience, state resilience and response resilience indicators of URII in Lijin County from 2018 to 2022 were calculated through the above evaluation steps, and the calculation results are shown in Table 9.
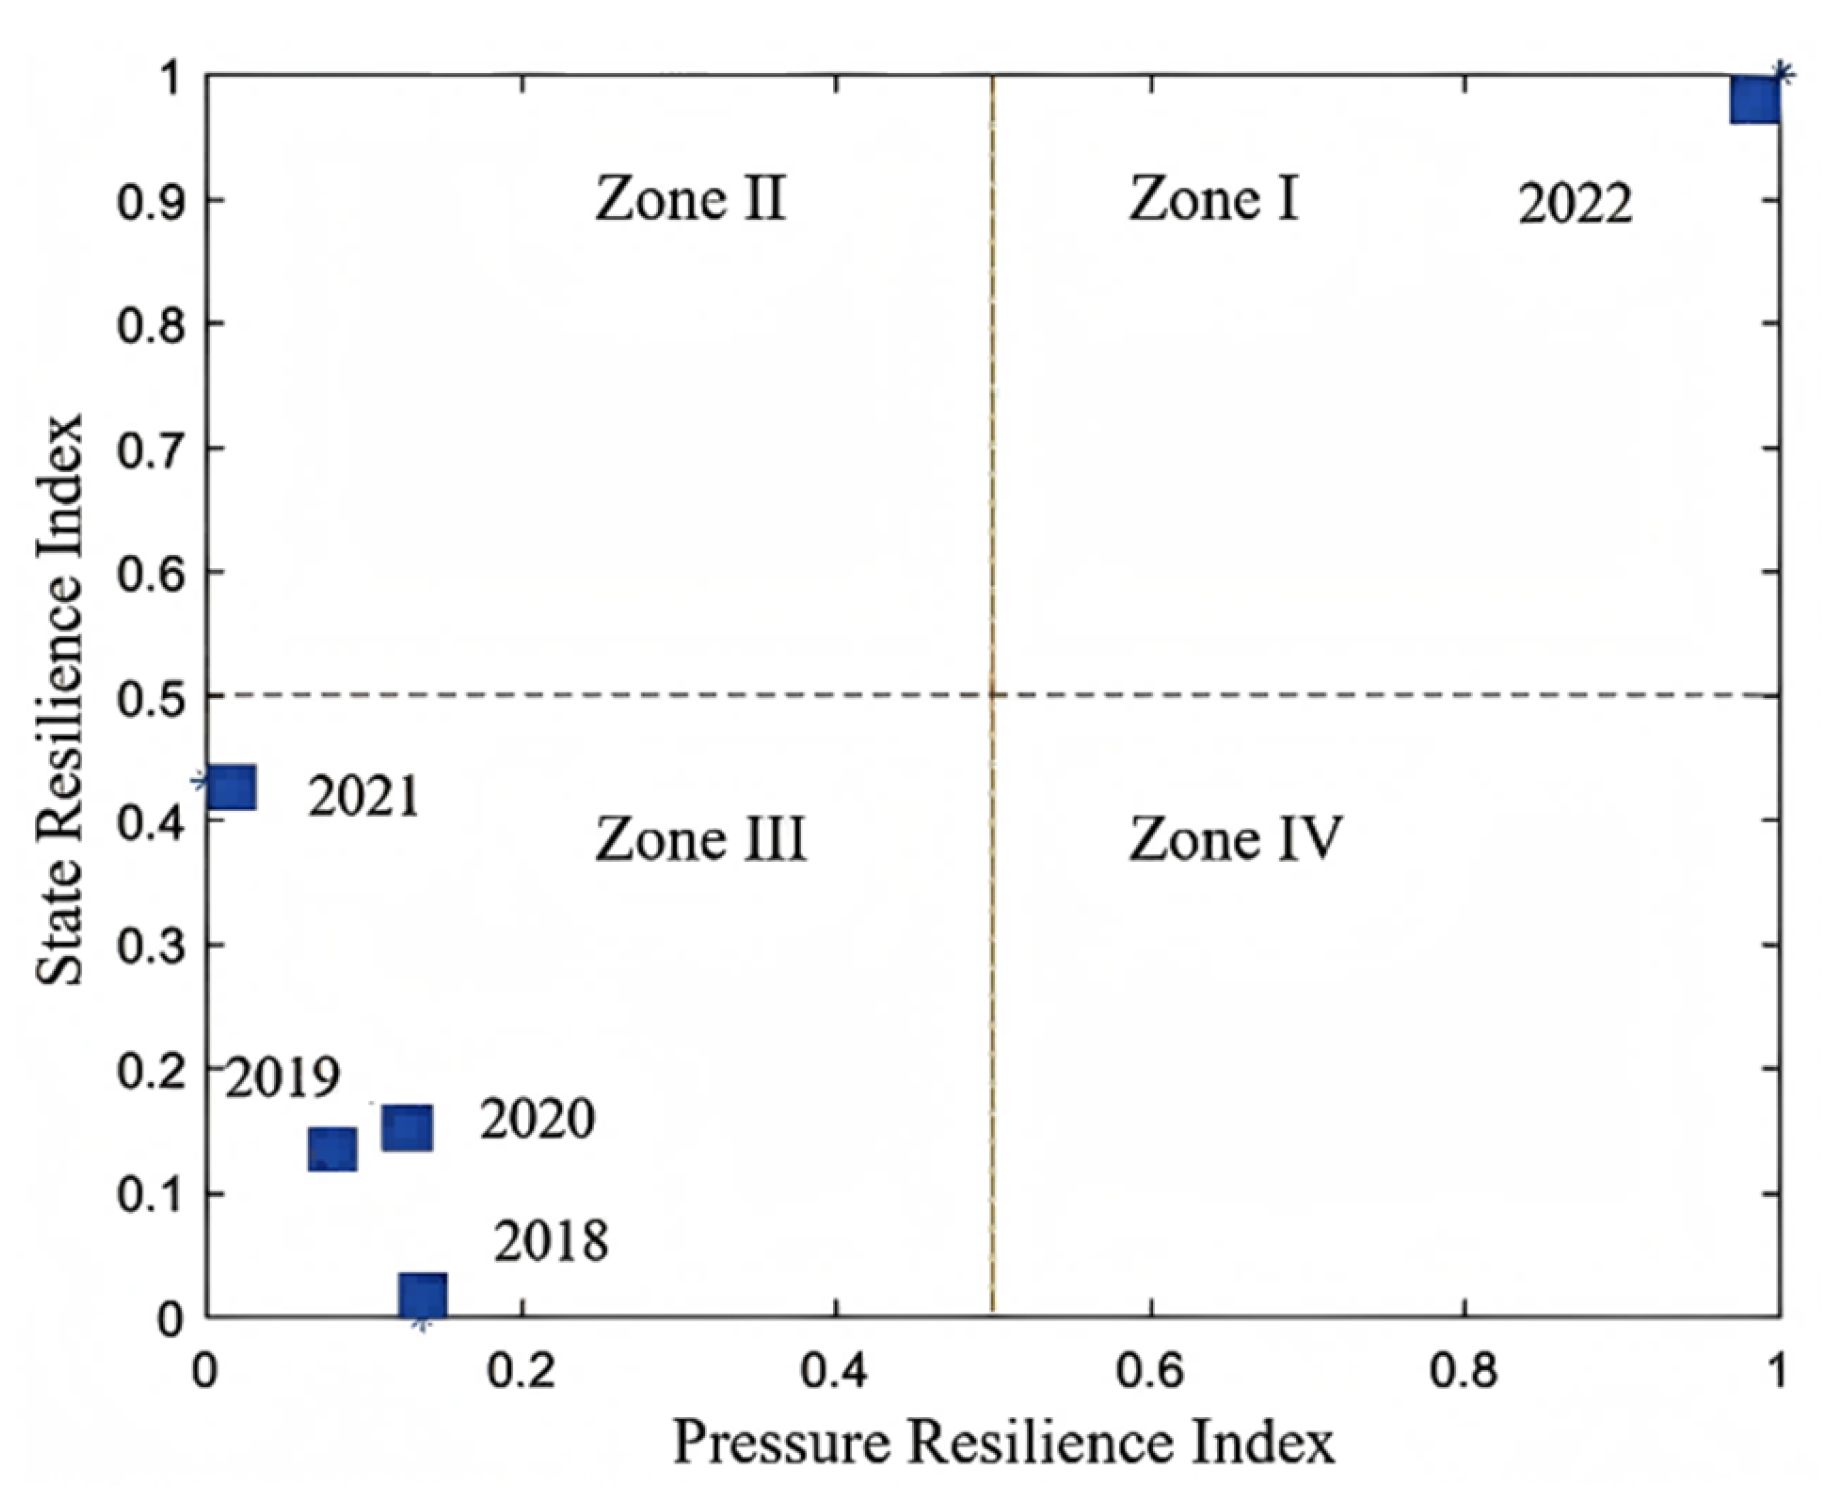
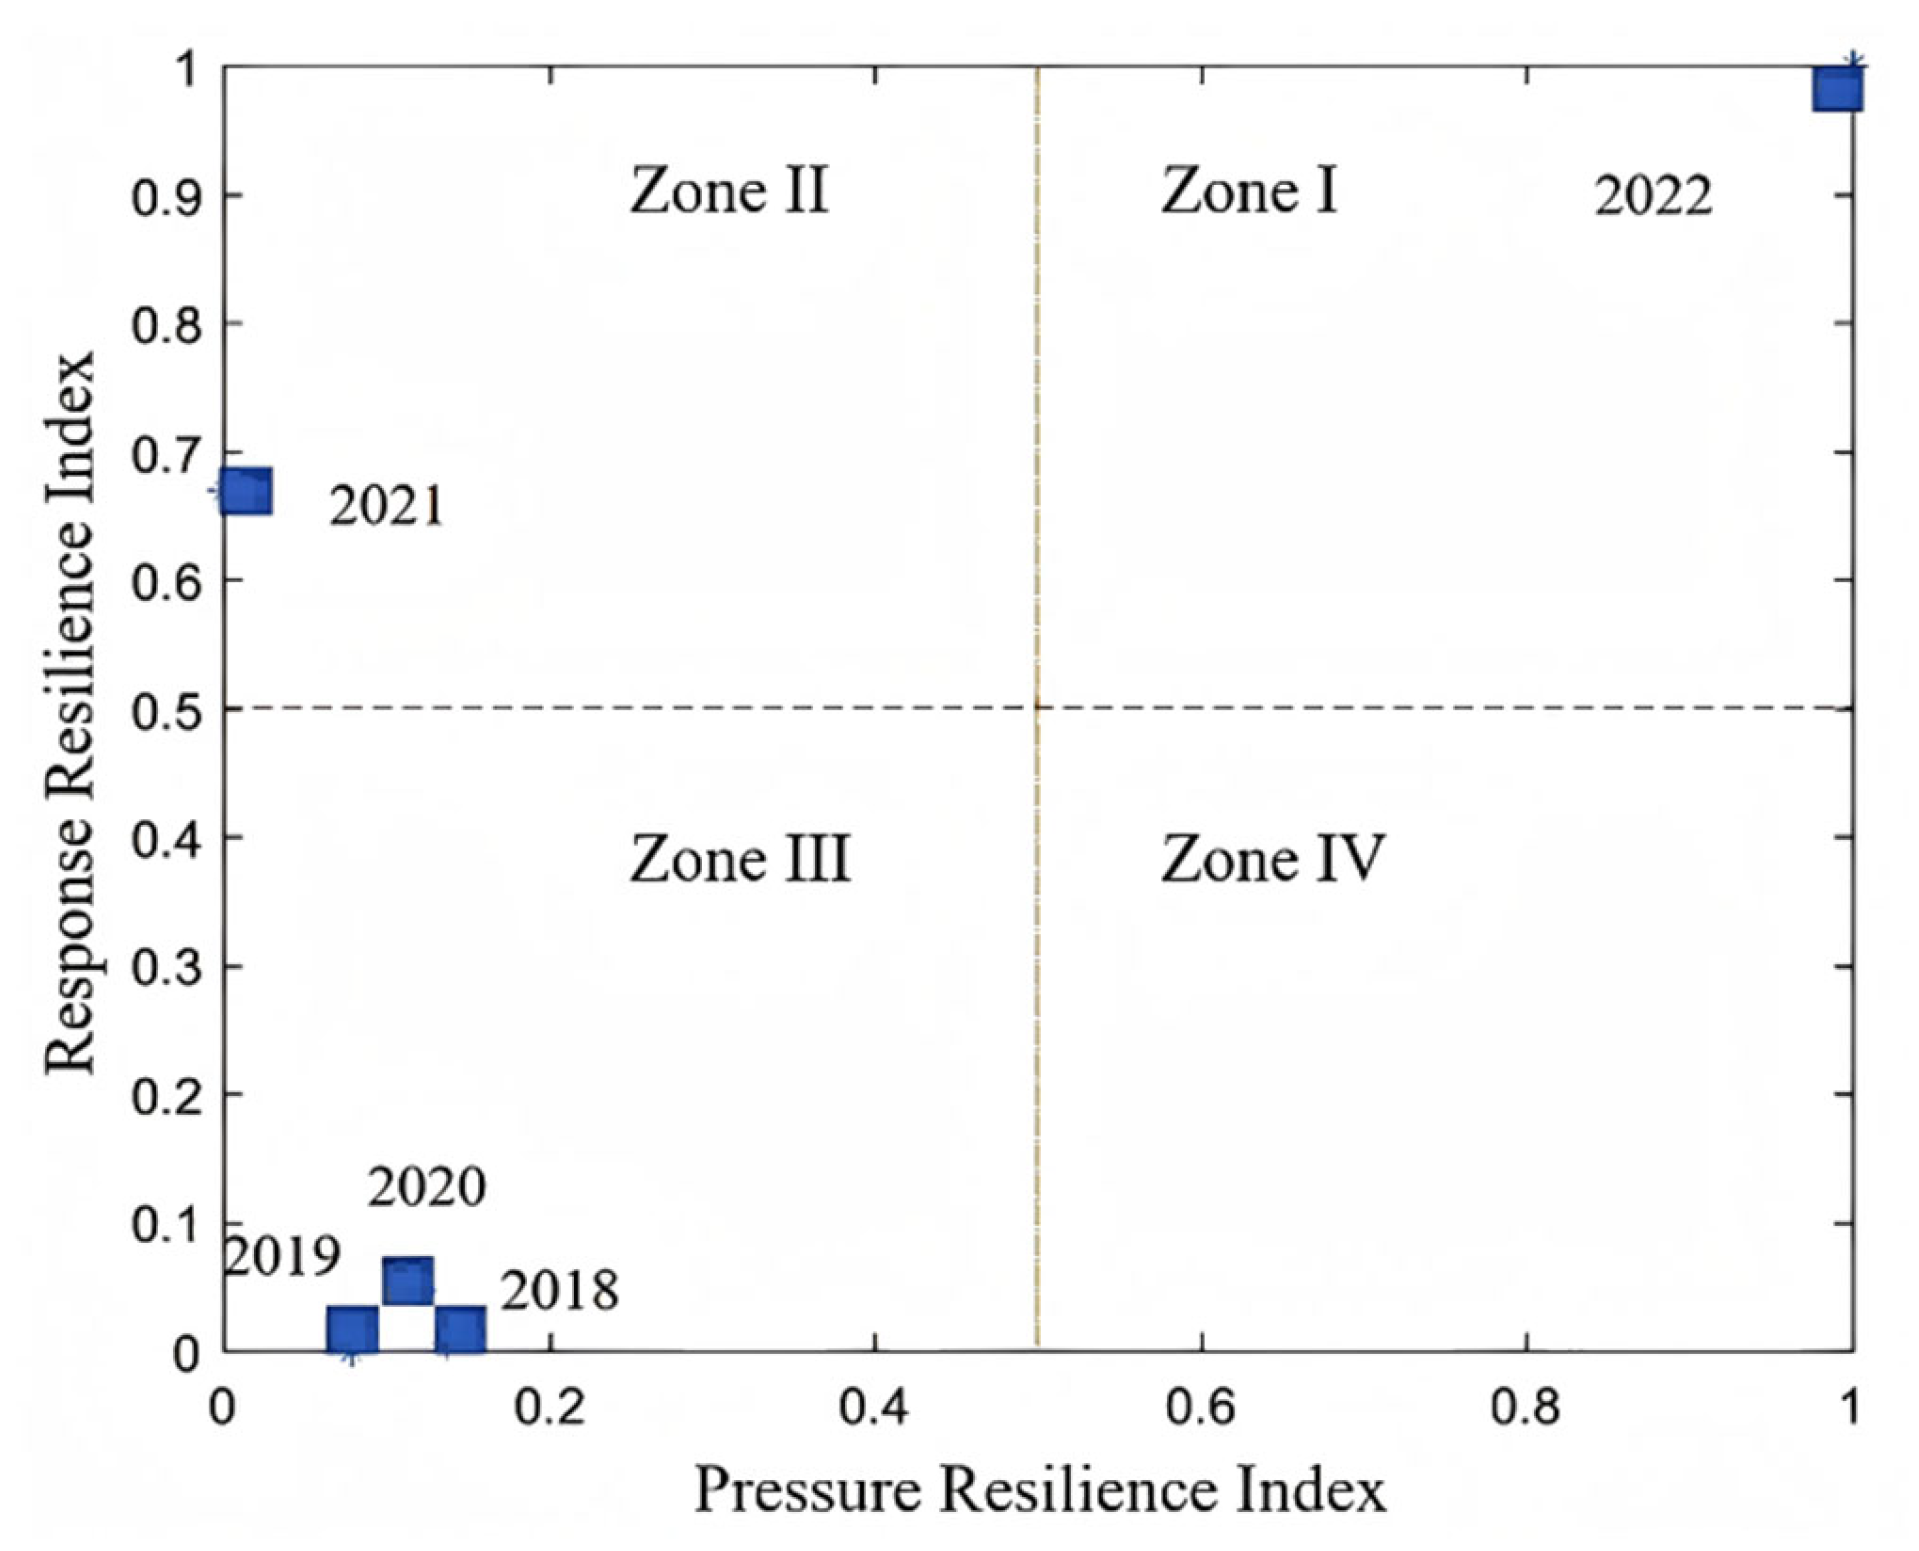
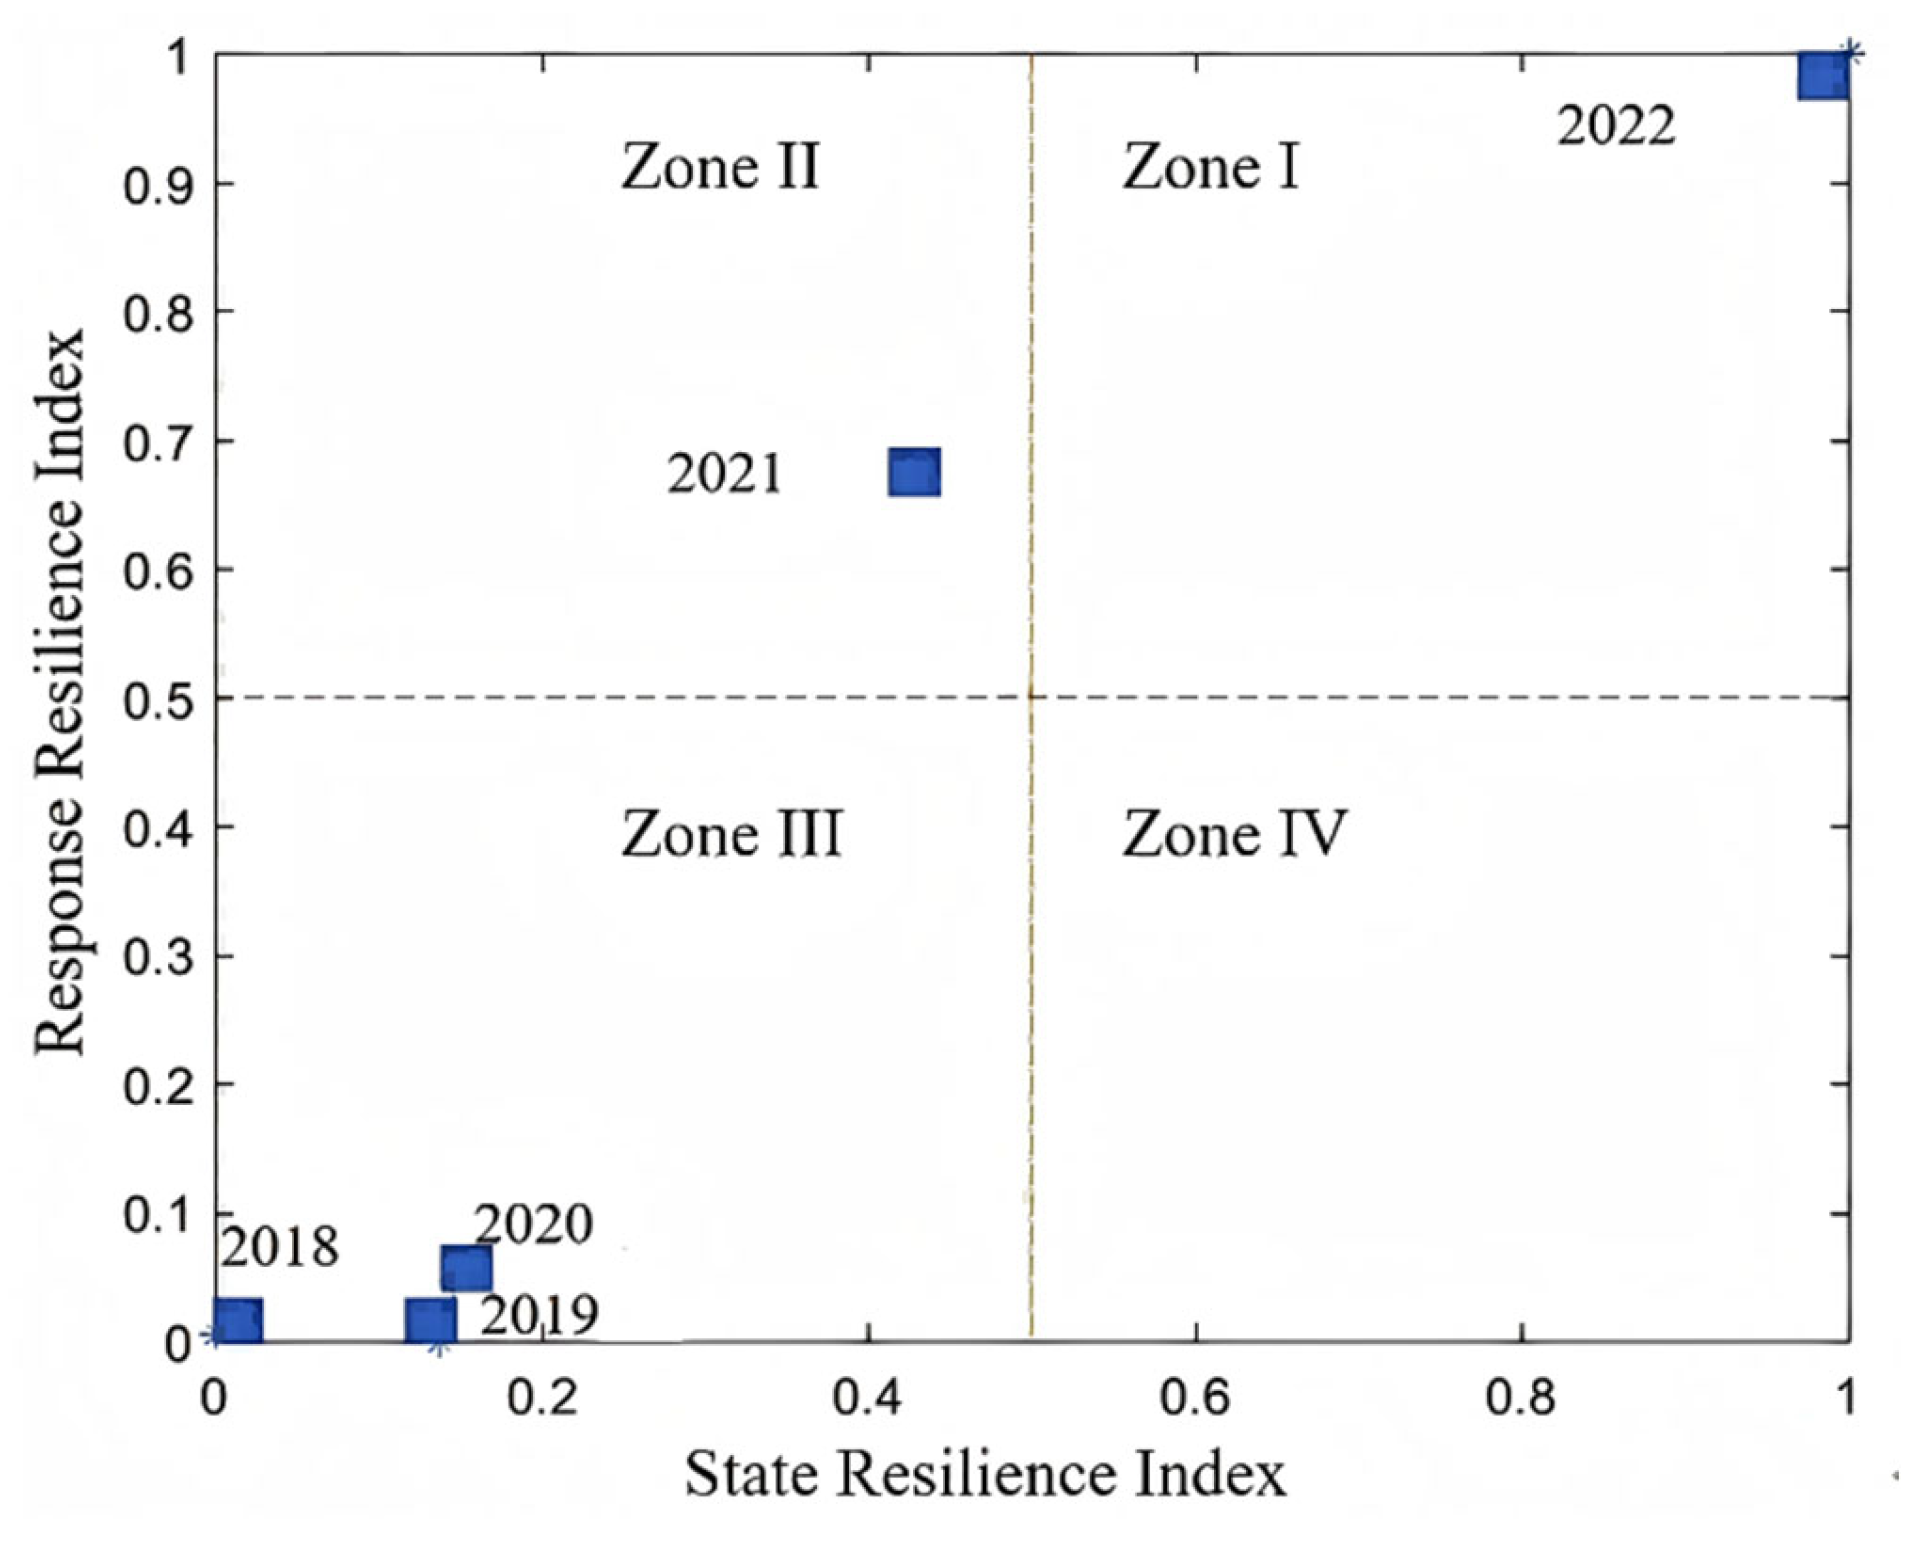
Based on the above calculation results, the pressure resilience, state resilience and response resilience indicators were compared pairwise, and the quadrant analysis diagram of the pairwise two-dimensional comparison of resilience level of URII in Lijin County was drawn.
The quadrant analysis divides each scatter plot into four regions using the median resilience value of 0.5 as the reference threshold. Zone I (upper-right) represents years where both dimensions exceed 0.5, indicating dual strengths. Zone II (upper-left) and Zone IV (lower-right) represent years where one dimension exceeds 0.5 while the other falls below, highlighting the dimension with the lower score as a priority for improvement. Zone III (lower-left) indicates years where both dimensions fall below 0.5, signifying dual weaknesses that require comprehensive attention.
The three quadrant diagrams are: the pressure–state resilience comparison (Figure 3), the pressure–response resilience comparison (Figure 4), and the state–response resilience comparison (Figure 5).
(1)
Pressure resilience–state resilience quadrant analysis
As shown in Figure 3, from 2018 to 2022, the pressure–state resilience of URII in Lijin County can be divided into two clusters, clustered in Zone I and Zone III, respectively. Zone I includes 2022, indicating that the pressure resilience and state resilience are at a higher level than other years. Zone III includes four years, 2018, 2019, 2020 and 2021, indicating that both pressure resilience and state resilience are at a low level. Specifically, in Zone III, 2021 is slightly different from the other three years. Although the year is at a low level of pressure and state resilience, its state resilience is notably higher than that of pressure resilience. Therefore, the resilience level of URII in Lijin County should continue to be improved in the future, and the improvement priority is pressure resilience over state resilience.
(2)
Pressure resilience–response resilience quadrant analysis
Figure 4 illustrates that from 2018 to 2022, the pressure–response resilience of URII in Lijin County can be divided into three clusters, which are clustered in Zones I, II, and III, respectively. The year included in Zone I is 2022, and the levels of pressure resilience and response resilience in this year are higher than those in the other four years. The year included in Zone II is 2021, which is in the stage of high response resilience but low pressure resilience, and measures should focus on improving pressure resilience. Zone III includes 2018, 2019, and 2020. This region belongs to the low pressure resilience and low response resilience level, and should focus on improving the pressure resilience in terms of natural and anthropogenic pressures, as well as improving the response resilience level in terms of early warning capacity, recovery capability, and learning capacity. Throughout the pressure–response resilience quadrant analysis chart of URII in Lijin County, the results indicate that the pressure resilience is generally inferior to the response resilience. In order to continue to improve the resilience of URII in Lijin County in the future, the improvement priority is pressure resilience over response resilience.
(3)
State resilience–response resilience quadrant analysis
It can be seen from Figure 5 that from 2018 to 2022, the state–response resilience of URII in Lijin County can be divided into three clusters, located in Zones I, II, and III, respectively. Zone I contains only 2022, in which both state resilience and response resilience are substantially higher than in the other four years. Zone II contains 2021, characterized by high response resilience but low state resilience; accordingly, measures should prioritize the improvement of state resilience. Zone III includes 2018, 2019, and 2020, all exhibiting low state resilience and low response resilience. For these years, attention should be directed toward strengthening state resilience in terms of socio-economic conditions and information infrastructure, while simultaneously enhancing response resilience with respect to early warning capacity, recovery capability, and learning capacity.
(4)
Overall analysis of pressure–state–response resilience of URII in Lijin County
A review of the state–response resilience quadrant for URII in Lijin County shows that state resilience consistently lags behind response resilience. At the same time, the DEMATEL results identify pressure as the primary causal driver in the system. Indicators such as population density (A4) and intensive e-commerce employment activities (A5) exert persistent stress on the infrastructure, which in turn shapes the system state and triggers response actions. In this causal chain, pressure is the starting point, while state and response are downstream outcomes.
A closer look at the state and response dimensions reveals a further point. Although the response indicator “emergency management ability (A17)” received the highest intra-group weight within its dimension in the earlier weighting procedure, the empirical results in Figure 5 show that response resilience in Lijin County already performs relatively well across all years. This means that the response system is already functioning at a reasonably robust level. Allocating limited resources exclusively to response would not lead to much additional improvement. By contrast, high-weight indicators within the state dimension—such as “digital economy environment (A7)” and “mobile network construction (A11)”—currently score much lower, representing clear systemic weaknesses.
Based on the pairwise comparisons of pressure, state, and response resilience for URII in Lijin County, the urgency of future improvement efforts follows the order: pressure > state > response. Subsequent strategies for enhancing URII resilience should therefore be formulated accordingly.

4.4. Sensitivity Analysis

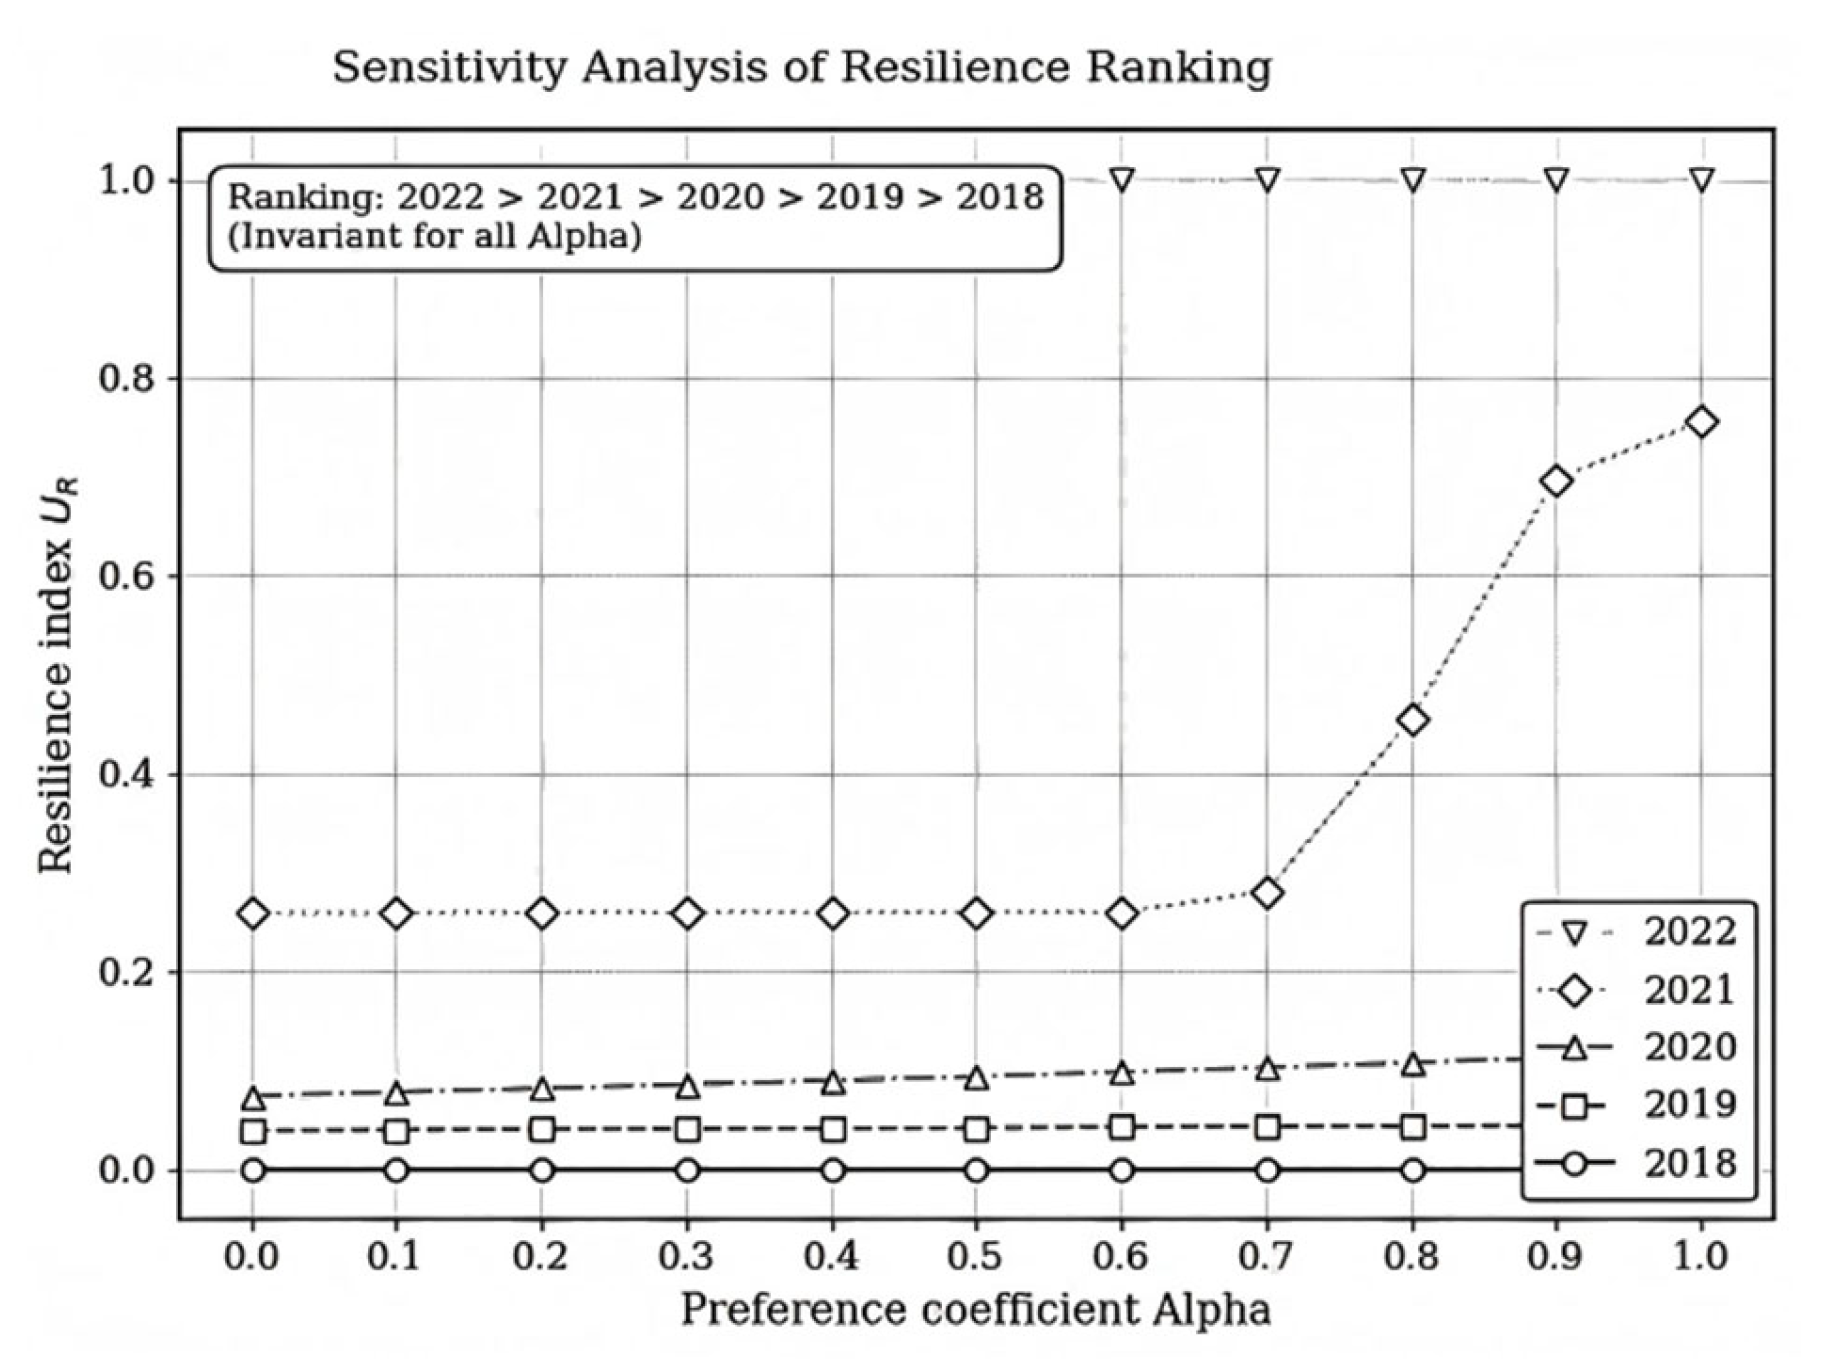
To verify the robustness of the evaluation results with respect to the trade-off between subjective and objective weights, a sensitivity analysis was performed. A preference coefficient α was introduced to construct an additive weighting framework: ω i * = α ω i s + ( 1 α ) ω i o , where α ranges from 0 to 1 .
As shown in Figure 6, the resilience index U R for Lijin County (2018–2022) was recalculated for 11 scenarios ( α = 0,0.1 , , 1.0 ). The numerical values of U R for 2019, 2020, and 2021 increase monotonically with α (e.g., for 2021, from 0.2586 at α = 0 to 0.7551 at α = 1 ), while the indices for 2018 and 2022 remain fixed at 0 and 1, respectively. Despite these variations, the relative order of the years is strictly invariant across all scenarios: 2022 > 2021 > 2020 > 2019 > 2018.
This confirms that the proposed hybrid weighting method and the resulting resilience evaluation are highly robust and reliable, unaffected by the specific choice of weight preferences.

5. Discussion

5.1. Implication

In the context of the “Digital Village” strategy and rural revitalization, URII serves as both a digital cornerstone and a critical enabler of development. However, rural environments are highly susceptible to frequent natural disasters and human capital constraints. These challenges are further exacerbated by the persistent digital divide and income disparity [58,59]. It is therefore imperative to ensure that this infrastructure possesses sufficient resilience to resist external shocks, recover rapidly, and adapt continuously. This aligns with global standards for resilient asset management [28].
To address the challenges imposed by the persistent urban–rural dual structure [60], this study adopted a hybrid assessment model to systematically analyze the connotations and unique characteristics of URII resilience. The application of this framework to Lijin County (2018–2022) revealed a robust upward trajectory in overall resilience. At the same time, dimensional analysis identified pressure resilience as the critical weak point, prompting targeted optimization strategies that prioritize pressure mitigation tailored to specific rural contexts. While the mathematical models employed (DEMATEL, VIKOR, concept lattice) are established, their targeted integration addresses a practical gap. This methodological combination bridges the distance between theoretical resilience concepts and the need for operational, quantitative assessment tools in resource-constrained rural environments.
(1)
Theoretical Nexus: Infrastructure as the Enabling Substrate
This study elucidates the intrinsic link between URII, the evolution of the “Digital Village,” and the imperative of rural revitalization. The analysis confirms that such infrastructure acts as a critical carrier for digital governance, intelligent emergency management, and industrial transformation in rural areas [61]. By facilitating essential public services such as online administrative processing and precision agriculture monitoring, it provides a fundamental basis for digital village construction while serving as a pivotal mechanism that leverages digital resources to empower comprehensive rural revitalization [62].
(2)
Methodological Framework: A Problem-Driven Integration
Guided by the theoretical underpinnings of resilience, this study utilized the PSR model to construct a multidimensional evaluation framework comprising 21 specific indicators [39]. While the mathematical models employed (DEMATEL, VIKOR, concept lattice) are established, their targeted integration bridges the distance between theoretical resilience concepts and the pressing need for operational, quantitative assessment tools in resource-constrained rural environments. This combination addresses the ambiguity and conflicting criteria inherent in complex infrastructure assessments, establishing a rigorous basis for quantitative evaluation [45,63].
(3)
Theoretical Reflections on Empirical Findings
It reveals a fundamental dynamic imbalance: pressure > state > response. Traditional PSR-based assessments [39] emphasize physical capacity (state) and recovery (response). In contrast, this study finds that exogenous and endogenous pressures are the primary drivers in rural contexts. It arises because digital consumption spreads much faster than hardware redundancy upgrades. It therefore implies that rural resilience frameworks must shift from static capacity building to dynamic stress governance.
It further shows that intensive e-commerce employment (A5) carries a high pressure weight and significantly undermines system resilience. The existing literature evaluates e-commerce from an economic perspective and acknowledges its economic benefits [55,64]. However, it generates massive data traffic and network load, while rural hardware upgrades severely lag behind this growth. It consequently causes high-frequency digital activities to directly trigger network congestion. It thus suggests that when infrastructure does not keep pace, the very driver of development paradoxically becomes a source of systemic stress.
It also indicates that digital talent shortage (A6) ranks high among pressure factors. Rural resilience requires attention not only to physical network redundancy and equipment status [2,26], but also to socio-technical vulnerabilities. It arises because urban economies pull skilled labor away, causing systemic “brain drain” in rural areas. It therefore implies that the fragility of rural information infrastructure is fundamentally socio-technical. A chronic shortage of human capital prevents adaptive learning and self-organization, trapping rural systems in high structural dependency.
(4)
Strategic Implications
Based on the PSR framework, this study outlines a systematic pathway for resilience enhancement. It proposes integrated strategies focusing on early warning mechanisms, digital talent cultivation, digital economy advancement, and infrastructure robustness. These recommendations facilitate a shift from static construction to dynamic “learning and adaptation” [65]. Ultimately, this study contributes descriptive empirical evidence and temporal benchmarks for developing resilient information infrastructure and promoting rural revitalization in developing regions.

5.2. Limitations

Resilience theory is an inherently complex and interdisciplinary construct. Although this study aims to bolster the digital foundation of rural areas, several limitations regarding data availability and research scope warrant mention:
(1)
Dynamic Evolution: The development of the “Digital Village” is a continuous, evolving process. Consequently, URII will inevitably acquire new functional requirements and characteristics over time. Since the resilience indicator system constructed in this study relies primarily on the current literature and case studies, it may not fully capture future complexities or emergent system properties. Therefore, the current framework may possess a degree of temporal incompleteness.
(2)
Data Constraints and Geospatial Granularity: The scarcity of high-resolution statistical data at the rural level presents a multifaceted challenge. First, regarding data quality, imputation methods were employed to address missing values, which may marginally affect the precision; additionally, the inclusion of certain qualitative indicators inevitably introduces an element of subjectivity. Second, regarding spatial resolution, data availability constraints at the township or village level necessitated the aggregation of resilience indicators at the county level. While this macroscopic approach successfully captures overall developmental trends, it may mask intra-county spatial heterogeneity. It has been demonstrated that geospatial contexts significantly shape network infrastructure resilience. Such contexts include spatial disparities in access flexibility, disruption risk, and vulnerability [66]. Future research should strive to disaggregate data to finer spatial scales to capture these geospatial variations, thereby enabling more targeted micro-level resilience enhancement strategies.
(3)
Causal Inference Limitations: The hybrid evaluation model employed in this study is fundamentally designed to assess capabilities and rank resilience states over time. While the observed upward trajectory in resilience aligns chronologically with the rollout of “Digital Village” policies, the research design remains observational. Therefore, the findings demonstrate temporal associations and contextual alignments rather than direct, measurable causal impacts of specific policies. Future research could employ quasi-experimental econometric methods, such as difference-in-differences (DID), to robustly isolate and quantify these causal mechanisms.

6. Conclusions and Suggestions

6.1. Research Conclusions

This study evaluated the resilience of URII in Lijin County from 2018 to 2022 using the PSR framework and a hybrid assessment model that integrates concept lattice-weighted DEMATEL with VIKOR. The main findings are presented below, each followed by a brief discussion.
(1)
The resilience level of URII in Lijin County increased steadily year by year from 2018 to 2022, following a rapid upward trajectory.
This upward trend coincides temporally with the rollout of China’s “Digital Village” initiative, formally launched in 2018, and the subsequent implementation of related rural digital infrastructure policies during the study period. It demonstrates that macro-policy orientation and sustained infrastructure investment are temporally associated with positive resilience outcomes at the county level.
(2)
The pairwise comparison of the three dimensions reveals an enhancement priority of pressure > state > response, reflecting a fundamental structural lag where anthropogenic stressors outpace the evolution of infrastructure redundancy.
This ordering suggests that a development model reliant on post-disaster response or physical expansion may prove increasingly constrained. Future governance frameworks could benefit from a shift toward intelligent, data-driven management. Policymakers may explore the use of Big Data and AI-assisted tools for dynamic load balancing, predictive risk mapping, and automated early warning systems, moving from managing crises to anticipating them.
(3)
The combined weight analysis identifies anthropogenic factors—population density (A4) and intensive e-commerce employment activities (A5)—as persistent sources of stress, while emergency management ability (A17), digital economy environment (A7), and mobile network construction (A11) are closely associated with recovery capacity. The prominence of digital talent shortage (A6) as a primary pressure factor further indicates that the next frontier of resilience is fundamentally human-centric.
These patterns imply that resilience building could benefit from a broader range of measures beyond physical infrastructure alone. Future rural development initiatives may find it useful to link digital infrastructure rollout with local digital literacy and talent retention programs, cultivating self-sustaining socio-technical systems capable of continuous learning.

6.2. Countermeasures and Suggestions

(1)
Strategies for Enhancing Pressure Resilience
Linked to indicators population density (A4) and intensive e-commerce employment activities (A5).
Rationale: As the empirical results indicate that anthropogenic factors constitute persistent sources of stress on rural network stability, interventions may focus on mitigating the operational burden associated with human activities and commercial data traffic.
First, implement dynamic network load management tailored to demographic and commercial hotspots. Since regional population density (A4) and intensive e-commerce employment activities (A5) dictate the supply and demand dynamics of URII, uniform network allocation is inefficient. Local governments and telecom operators should establish targeted bandwidth scheduling mechanisms. For instance, in densely populated e-commerce hubs, such as “Taobao villages”, edge computing nodes and temporary bandwidth expansion mechanisms should be deployed during peak commercial periods, such as agricultural harvest seasons or online shopping festivals. This proactive traffic distribution prevents human-induced network congestion and cascading functional degradation, directly mitigating the most severe stressor on the system.
Second, establish a pre-disaster risk mapping mechanism for vulnerable information nodes. While anthropogenic pressures are primary, baseline structural vulnerabilities still exacerbate stress. Therefore, systematic investigations into historical hazards should be conducted to catalog hazard-prone environments. By developing a dynamic database, risk zones can be classified [67]. Crucially, this hazard map must be precisely overlaid with the distribution of critical information nodes, for example, base stations, optical distribution frames, and server rooms in high-density areas. This approach enables the targeted pre-disaster fortification of specific infrastructural bottlenecks, addressing pressure at its geographic source before shocks occur.
(2)
Strategies for Enhancing State Resilience
Linked to indicators digital economy environment (A7) and mobile network construction (A11).
Rationale: These indicators carry the highest weights within the state dimension; therefore, targeted capital investments and physical network expansions in these areas will yield substantial marginal gains in overall structural robustness.
First, optimize the government investment structure and enhance capital efficiency. Investment should be strategically prioritized towards the field of URII. Adhering to the principle that “resources follow projects,” these projects should be integrated into comprehensive annual plans with simplified approval processes to ensure priority access to funds and essential factors. Crucially, a performance-based management system must be strengthened to enforce accountability throughout the entire lifecycle of fund application, allocation, and expenditure [68]. This facilitates a paradigm shift from “allocation-centric” to “performance-centric” governance, ensuring that financial resources are utilized effectively at the strategic forefront of URII construction.
Second, expand network coverage and quality. Telecom operators and tower companies should be encouraged to optimize 5G deployment in rural areas. Through infrastructure sharing models, including co-locating towers, pipelines, and 5G base stations, universal 5G coverage can be achieved [69]. Additionally, the carrying capacity of optical fiber networks should be augmented by promoting the large-scale deployment and application of IPv6-based next-generation Internet. These initiatives aim to optimize existing network performance and deepen coverage, thereby completely eliminating “network dead zones.”
(3)
Strategies for Enhancing Response Resilience
Linked to emergency management ability (A17).
Rationale: Although the response dimension ranks lowest in structural urgency, emergency management ability (A17) remains the single highest-weighted indicator in the entire system. Maintaining an agile and integrated emergency capability serves as a critical anchor for systemic stability.
First, enhance the emergency management framework through digital integration. The command platform for comprehensive emergency response should be optimized to strengthen the overall command system. This improvement facilitates seamless synergy between county and township administrations. Furthermore, it ensures robust vertical communication across all governance levels. By integrating data from public security, fire services, and transportation into a unified platform, the system can support specialized subsystems [70]. These include online emergency drills, resource allocation, and intelligent management. Centered on a “digital map-based command” model, this infrastructure enables real-time incident localization and coordinated dispatching. Ultimately, it provides the technical foundation for the efficient resolution of regional emergencies.
Second, foster a digital innovation ecosystem. This mechanism should integrate government, industry, academia, research, and application. Supporting original innovative breakthroughs requires a dual focus on both technological advancement and industrial application. Therefore, it is imperative to leverage the expertise of academicians and research institutions in basic scientific research. These institutions should be encouraged to apply their findings to URII [71]. Simultaneously, enterprises must be incentivized to participate in the commercialization of these achievements. Such multi-party collaboration will catalyze the development of digital technologies. These efforts will significantly enhance the resilience and reliability of critical information infrastructure.

Author Contributions

Conceptualization, L.Z. and R.Z.; methodology, L.Z. and R.Z.; software, R.Z.; validation, L.Z., R.Z. and Y.Z.; resources, L.Z.; writing—original draft preparation, L.Z. and R.Z.; writing—review and editing, L.Z., R.Z. and Y.Z.; funding acquisition, L.Z. All authors have read and agreed to the published version of the manuscript.

Funding

This research was funded by the Human Resources and Social Security of Shandong Federation of Social Science (grant number 24BGL061), the Natural Science Foundation of Shandong Province (grant number ZR2021MG050), and the Shandong Jianzhu University Doctoral Foundation Project (grant number X19009S).

Institutional Review Board Statement

The study did not involve the collection of any personally identifiable information, biological samples, or sensitive data, nor did it involve any intervention or interaction with human subjects. According to Article 2 of the Measures for Ethical Review of Biomedical Research Involving Human Subjects (2016) of China, the regulation applies to research that “uses modern physics, chemistry, biology, medicine, or other methods to intervene or observe human physiological, psychological, or social status.” The present study does not fall within this scope; therefore, ethical approval from an Institutional Review Board was not required.

Informed Consent Statement

Informed consent was obtained from all subjects involved in the study.

Data Availability Statement

The authors confirm that all data generated or analyzed during this study are included in this published article.

Acknowledgments

The authors thank the experts who participated in the evaluation panel and provided valuable scoring data for this study. The authors also thank the editors and the anonymous reviewers for their valuable and constructive suggestions for improving this study.

Conflicts of Interest

The authors declare no conflicts of interest.

References

  1. Duanmu, X.; Yu, J.; Yuan, X.; Zhang, X. How does digital infrastructure mitigate urban–rural disparities? Sustainability 2025, 17, 1561. [Google Scholar] [CrossRef]
  2. Panteli, M.; Mancarella, P. Modeling and evaluating the resilience of critical electrical power infrastructure to extreme weather events. IEEE Syst. J. 2015, 11, 1733–1742. [Google Scholar] [CrossRef]
  3. Agusta, Y. Managing the development of a sustainable digital village. Sustainability 2023, 15, 7575. [Google Scholar] [CrossRef]
  4. Fuseini, M.N. Rural infrastructure and livelihoods enhancement: The case of community-based rural development program in Ghana. Heliyon 2024, 10, e33659. [Google Scholar] [CrossRef] [PubMed]
  5. Li, X.; Singh Chandel, R.B.; Xia, X. Analysis on regional differences and spatial convergence of digital village development level: Theory and evidence from China. Agriculture 2022, 12, 164. [Google Scholar] [CrossRef]
  6. Maxwell, L.A. Expanding rural broadband in America: Challenges, opportunities, and policy implications. EPRA Int. J. Agric. RURAL Econ. Res. Учредители EPRA J. 2025, 13, 26–32. [Google Scholar]
  7. Schmidt, D.; Power, S.A. Offline world: The internet as social infrastructure among the unconnected in quasi-rural Illinois. Integr. Psychol. Behav. Sci. 2021, 55, 371–385. [Google Scholar] [CrossRef]
  8. Liu, L.; Ma, X.; Li, Y. Does new infrastructure promote the development of rural industries? a nonlinear analysis based on provincial panel data from china. Land 2025, 14, 986. [Google Scholar] [CrossRef]
  9. Ma, L.; Liu, S.; Fang, F.; Che, X.; Chen, M. Evaluation of urban-rural difference and integration based on quality of life. Sustain. Cities Soc. 2020, 54, 101877. [Google Scholar] [CrossRef]
  10. Lu, H.; Zheng, J.; Ou, H.; Liu, Y.; Li, X. Impact of natural disaster shocks on farm household poverty vulnerability—A threshold effect based on livelihood resilience. Front. Ecol. Evol. 2022, 10, 860745. [Google Scholar] [CrossRef]
  11. Bai, L.; Wang, C.; Sun, Y.; Xie, X.; Tang, T.; Xie, Q. Project portfolio network risk propagation modeling: A risk perception perspective. IEEE Trans. Eng. Manag. 2024, 71, 14608–14620. [Google Scholar] [CrossRef]
  12. Council, E. Europe and the Global Information Society: Recommendations to the European Council; The Council: Washington, DC, USA, 1994; Volume 2. [Google Scholar]
  13. Deja, M.; Rak, D.; Bell, B. Digital transformation readiness: Perspectives on academia and library outcomes in information literacy. J. Acad. Librariansh. 2021, 47, 102403. [Google Scholar] [CrossRef]
  14. Hanseth, O.; Monteiro, E. Understanding Information Infrastructure. 1998. Available online: https://www.researchgate.net/profile/Eric-Monteiro-2/publication/225070201_Actor-Network_Theory/links/5b3220344585150d23d4af6e/Actor-Network-Theory.pdf (accessed on 1 May 2026).
  15. Pribadi, K.S.; Abduh, M.; Wirahadikusumah, R.D.; Hanifa, N.R.; Irsyam, M.; Kusumaningrum, P.; Puri, E. Learning from past earthquake disasters: The need for knowledge management system to enhance infrastructure resilience in Indonesia. Int. J. Disaster Risk Reduct. 2021, 64, 102424. [Google Scholar] [CrossRef]
  16. Dasso, R.; Fernandez, F.; Ñopo, H. Electrification and Educational Outcomes in Rural Peru; IZA Discussion Papers: Bonn, Germany, 2015. [Google Scholar]
  17. Koima, J. School electrification and academic outcomes in rural Kenya. J. Dev. Econ. 2024, 166, 103178. [Google Scholar] [CrossRef]
  18. Lyu, Y.; Ji, Z.; Liang, H.; Wang, T.; Zheng, Y. Has information infrastructure reduced carbon emissions?—Evidence from panel data analysis of Chinese cities. Buildings 2022, 12, 619. [Google Scholar] [CrossRef]
  19. Tushar, M.F.E. Untold Challenges in Mega Infrastructure Projects in Bangladesh. Int. J. Multidiscip. Res. 2023, 5. [Google Scholar] [CrossRef]
  20. Bush, J.; Doyon, A. Building urban resilience with nature-based solutions: How can urban planning contribute? Cities 2019, 95, 102483. [Google Scholar] [CrossRef]
  21. Chelleri, L.; Waters, J.J.; Olazabal, M.; Minucci, G. Resilience trade-offs: Addressing multiple scales and temporal aspects of urban resilience. Environ. Urban. 2015, 27, 181–198. [Google Scholar] [CrossRef]
  22. Ribeiro, P.J.G.; Gonçalves, L.A.P.J. Urban resilience: A conceptual framework. Sustain. Cities Soc. 2019, 50, 101625. [Google Scholar] [CrossRef]
  23. Chen, M.; Zhang, Q.; Jiang, Y.; Wang, J.; Zhu, S. Evaluating the coupling coordination levels and critical obstacle indicators of urban infrastructure resilience: A case study in China. Buildings 2025, 15, 495. [Google Scholar] [CrossRef]
  24. Dahmen, P. Organizational resilience as a key property of enterprise risk management in response to novel and severe crisis events. Risk Manag. Insur. Rev. 2023, 26, 203–245. [Google Scholar] [CrossRef]
  25. Rodríguez-Sánchez, A.; Guinot, J.; Chiva, R.; López-Cabrales, Á. How to emerge stronger: Antecedents and consequences of organizational resilience. J. Manag. Organ. 2021, 27, 442–459. [Google Scholar] [CrossRef]
  26. Hafeznia, H.; Stojadinović, B. ResQ-IOS: An iterative optimization-based simulation framework for quantifying the resilience of interdependent critical infrastructure systems to natural hazards. Appl. Energy 2023, 349, 121558. [Google Scholar] [CrossRef]
  27. Mazur, C.; Hoegerle, Y.; Brucoli, M.; van Dam, K.; Guo, M.; Markides, C.N.; Shah, N. A holistic resilience framework development for rural power systems in emerging economies. Appl. Energy 2019, 235, 219–232. [Google Scholar] [CrossRef]
  28. Rehak, D.; Senovsky, P.; Hromada, M.; Lovecek, T. Complex approach to assessing resilience of critical infrastructure elements. Int. J. Crit. Infrastruct. Prot. 2019, 25, 125–138. [Google Scholar] [CrossRef]
  29. Hussain, S.; Maqbool, R.; Hussain, A.; Ashfaq, S. Assessing the socio-economic impacts of rural infrastructure projects on community development. Buildings 2022, 12, 947. [Google Scholar] [CrossRef]
  30. Kazlauskienė, I.; Atkočiūnienė, V. Application of information and communication technologies for public services management in smart villages. Businesses 2025, 5, 31. [Google Scholar] [CrossRef]
  31. Alabdali, S.A.; Pileggi, S.F.; Cetindamar, D. Influential factors, enablers, and barriers to adopting smart technology in rural regions: A literature review. Sustainability 2023, 15, 7908. [Google Scholar] [CrossRef]
  32. Liu, M.; Liu, H. The influence and mechanism of digital village construction on the urban–rural income gap under the goal of common prosperity. Agriculture 2024, 14, 775. [Google Scholar] [CrossRef]
  33. Ren, J.; Chen, X.; Gao, T.; Chen, H.; Shi, L.; Shi, M. New digital infrastructure’s impact on agricultural eco-efficiency improvement: Influence mechanism and empirical test—Evidence from China. Int. J. Environ. Res. Public Health 2023, 20, 3552. [Google Scholar] [CrossRef]
  34. Yang, J.; Hou, H.; Hu, H. Exploring the intelligent emergency management mode of rural natural disasters in the era of digital technology. Sustainability 2024, 16, 2366. [Google Scholar] [CrossRef]
  35. Arneson, E.; Deniz, D.; Javernick-Will, A.; Liel, A.; Dashti, S. Information deficits and community disaster resilience. Nat. Hazards Rev. 2017, 18, 4017010. [Google Scholar] [CrossRef]
  36. Firdhous, M.; Karuratane, P. A model for enhancing the role of information and communication technologies for improving the resilience of rural communities to disasters. Procedia Eng. 2018, 212, 707–714. [Google Scholar] [CrossRef]
  37. Cutter, S.L.; Ash, K.D.; Emrich, C.T. The geographies of community disaster resilience. Glob. Environ. Change 2014, 29, 65–77. [Google Scholar] [CrossRef]
  38. Bruneau, M.; Chang, S.E.; Eguchi, R.T.; Lee, G.C.; O’Rourke, T.D.; Reinhorn, A.M.; Shinozuka, M.; Tierney, K.; Wallace, W.A.; Von Winterfeldt, D. A framework to quantitatively assess and enhance the seismic resilience of communities. Earthq. Spectra 2003, 19, 733–752. [Google Scholar] [CrossRef]
  39. Chen, M.; Jiang, Y.; Wang, E.; Wang, Y.; Zhang, J. Measuring urban infrastructure resilience via pressure-state-response framework in four Chinese municipalities. Appl. Sci. 2022, 12, 2819. [Google Scholar] [CrossRef]
  40. Ntounis, N.; Parker, C.; Skinner, H.; Steadman, C.; Warnaby, G. Tourism and Hospitality industry resilience during the COVID-19 pandemic: Evidence from England. Curr. Issues Tour. 2022, 25, 46–59. [Google Scholar] [CrossRef]
  41. Zheng, J.; Huang, G. Towards flood risk reduction: Commonalities and differences between urban flood resilience and risk based on a case study in the Pearl River Delta. Int. J. Disaster Risk Reduct. 2023, 86, 103568. [Google Scholar] [CrossRef]
  42. Yang, C.-L.; Huang, C.-Y.; Kao, Y.-S.; Tasi, Y.-L. Disaster recovery site evaluations and selections for information systems of academic big data. Eurasia J. Math. Sci. Technol. Educ. 2017, 13, 4553–4589. [Google Scholar] [CrossRef]
  43. Si, S.-L.; You, X.-Y.; Liu, H.-C.; Zhang, P. DEMATEL technique: A systematic review of the state-of-the-art literature on methodologies and applications. Math. Probl. Eng. 2018, 2018, 3696457. [Google Scholar] [CrossRef]
  44. Yazdi, M.; Khan, F.; Abbassi, R.; Rusli, R. Improved DEMATEL methodology for effective safety management decision-making. Saf. Sci. 2020, 127, 104705. [Google Scholar] [CrossRef]
  45. Guo, X.; Liu, A.; Li, X.; Xiao, Y. Research on the intelligent fault diagnosis of medical devices based on a dematel-fuzzy concept lattice. Int. J. Fuzzy Syst. 2020, 22, 2369–2384. [Google Scholar] [CrossRef]
  46. Gou, X.; Xu, Z.; Liao, H.; Herrera, F. Probabilistic double hierarchy linguistic term set and its use in designing an improved VIKOR method: The application in smart healthcare. J. Oper. Res. Soc. 2021, 72, 2611–2630. [Google Scholar] [CrossRef]
  47. Denzin, N. Triangulation 2.0. J. Mix. Methods Res. 2012, 6, 80–88. [Google Scholar]
  48. Seddik, G.H.; Sovacool, B.K. Climate policy, Least Developed Countries, and the Sustainable Development Goals: A critical review of SDG13 and infrastructural, institutional, and informational resilience. Environ. Sci. Policy 2025, 170, 104129. [Google Scholar] [CrossRef]
  49. Shang, Q.; Guo, X.; Li, Q.; Xu, Z.; Xie, L.; Liu, C.; Li, J.; Wang, T. A benchmark city for seismic resilience assessment. Earthq. Eng. Eng. Vib. 2020, 19, 811–826. [Google Scholar] [CrossRef]
  50. Hromada, M.; Rehak, D.; Skobiej, B.; Bajer, M. Converged security and information management system as a tool for smart city infrastructure resilience assessment. Smart Cities 2023, 6, 2221–2244. [Google Scholar] [CrossRef]
  51. Osman, T. A framework for cities and environmental resilience assessment of local governments. Cities 2021, 118, 103372. [Google Scholar] [CrossRef]
  52. Cheng, Y.; He, W.; Yang, M. Beyond the digital divide: Unlocking urban economic resilience through integrated digital infrastructure and finance. Int. Rev. Econ. Financ. 2025, 104, 104784. [Google Scholar] [CrossRef]
  53. Jiang, W.; Jiang, N.; Yu, D. Network infrastructure construction and digital innovation resilience: Evidence from Broadband China policy. Inf. Process. Manag. 2026, 63, 104758. [Google Scholar] [CrossRef]
  54. Ashmore, F.H.; Farrington, J.H.; Skerratt, S. Community-led broadband in rural digital infrastructure development: Implications for resilience. J. Rural Stud. 2017, 54, 408–425. [Google Scholar] [CrossRef]
  55. Zhao, Y.; Li, R. Coupling and coordination analysis of digital rural construction from the perspective of rural revitalization: A case study from Zhejiang province of China. Sustainability 2022, 14, 3638. [Google Scholar] [CrossRef]
  56. Yang, Z.; Barroca, B.; Laffréchine, K.; Weppe, A.; Bony-Dandrieux, A.; Daclin, N. A multi-criteria framework for critical infrastructure systems resilience. Int. J. Crit. Infrastruct. Prot. 2023, 42, 100616. [Google Scholar] [CrossRef]
  57. Hosseini, S.; Barker, K.; Ramirez-Marquez, J.E. A review of definitions and measures of system resilience. Reliab. Eng. Syst. Saf. 2016, 145, 47–61. [Google Scholar] [CrossRef]
  58. Huang, T.; Quan, Y. Narrowing the digital divide: The growth and distributional effect of internet use on income in rural China. China Econ. Rev. 2025, 91, 102387. [Google Scholar] [CrossRef]
  59. Huang, T.; Quan, Y.; Li, N. Reallocate to the right place: The heterogeneous effect of internet use on factor allocation of rural households in China. Econ. Anal. Policy 2024, 84, 1328–1346. [Google Scholar] [CrossRef]
  60. Li, Y.; Jia, L.; Wu, W.; Yan, J.; Liu, Y. Urbanization for rural sustainability–Rethinking China’s urbanization strategy. J. Clean. Prod. 2018, 178, 580–586. [Google Scholar] [CrossRef]
  61. Wang, T.; Wang, D.; Zeng, Z. Research on the construction and measurement of digital governance level system of County rural areas in China—Empirical analysis based on entropy weight TOPSIS model. Sustainability 2024, 16, 4374. [Google Scholar] [CrossRef]
  62. Liu, J.; Li, F. Rural revitalization driven by digital infrastructure: Mechanisms and empirical verification. J. Digit. Econ. 2024, 3, 103–116. [Google Scholar] [CrossRef]
  63. Jamali, A.; Robati, M.; Nikoomaram, H.; Farsad, F.; Aghamohammadi, H. Urban resilience assessment using hybrid MCDM model based on DEMATEL-ANP method (DANP). J. Indian Soc. Remote Sens. 2023, 51, 893–915. [Google Scholar] [CrossRef]
  64. Zhou, Y.; Cai, Z.; Wang, J. Digital rural construction and rural household entrepreneurship: Evidence from China. Sustainability 2023, 15, 14219. [Google Scholar] [CrossRef]
  65. Raetze, S.; Duchek, S.; Maynard, M.T.; Kirkman, B.L. Resilience in organizations: An integrative multilevel review and editorial introduction. Group Organ. Manag. 2021, 46, 607–656. [Google Scholar] [CrossRef]
  66. Haces-Garcia, F.; Glennie, C.L.; Rifai, H.S. Sustainability of Network Infrastructure in a Geospatial Resilience Context. Sustainability 2022, 14, 11415. [Google Scholar] [CrossRef]
  67. Wang, X.; Peng, W.; Xiong, H. Spatial-temporal evolution and driving factors of rural resilience in the urban agglomerations in the middle reaches of the Yangtze River, China. Environ. Sci. Pollut. Res. 2024, 31, 25076–25095. [Google Scholar] [CrossRef] [PubMed]
  68. Liu, H.J.; Love, P.E.; Sing, M.C.; Niu, B.; Zhao, J. Conceptual framework of life-cycle performance measurement: Ensuring the resilience of transport infrastructure assets. Transp. Res. Part D Transp. Environ. 2019, 77, 615–626. [Google Scholar] [CrossRef]
  69. Koratagere Anantha Kumar, S.; Oughton, E.J. Techno-economic assessment of 5G infrastructure sharing business models in rural areas. Front. Comput. Sci. 2023, 5, 1191853. [Google Scholar] [CrossRef]
  70. Johnson, I.G.; Vlachokyriakos, V. Socio-digital rural resilience: An exploration of information infrastructures within and across rural villages during COVID-19. Proc. ACM Hum. Comput. Interact. 2024, 8, 1–30. [Google Scholar] [CrossRef]
  71. Ye, X.; Du, J.; Han, Y.; Newman, G.; Retchless, D.; Zou, L.; Ham, Y.; Cai, Z. Developing human-centered urban digital twins for community infrastructure resilience: A research agenda. J. Plan. Lit. 2023, 38, 187–199. [Google Scholar] [CrossRef]
Figure 1. Distribution of centrality and cause degree of resilience indicators of URII.
Buildings 16 01905 g001
Figure 2. Change trend of resilience level of URII in Lijin County from 2018 to 2022.
Buildings 16 01905 g002
Figure 3. Pressure–state resilience quadrant analysis of URII in Lijin County.
Buildings 16 01905 g003
Figure 4. Pressure–response resilience quadrant analysis of URII in Lijin County.
Buildings 16 01905 g004
Figure 5. State–response resilience quadrantal analysis of URII in Lijin County.
Buildings 16 01905 g005
Figure 6. Sensitivity analysis of the resilience index under different preference coefficients.
Buildings 16 01905 g006
Table 1. List of relevant texts on the resilience of URII.
Serial NumberTimeTypeName
12015.10Policy PapersA guideline of The General Office of the State Council on promoting the accelerated development of rural e-commerce
22015.10LiteratureVision of information infrastructure construction in the context of “Internet Plus”
32015.12Policy PapersImplementation opinions of the Ministry of Agriculture on promoting the development of big data in Agriculture and rural areas
432022.07Survey
Reports
How to transition and upgrade the digital village
442022.08Typical CaseDigital Yonglian, Smart village
452022.08Policy PapersGuidelines for the construction of digital village standard system
842023.02Literature
Information
On rural digitization and rural spatial transformation
852023.02Typical CaseThe cloud revolution speeds up rural revitalization and digital
platforms help with epidemic prevention and control
1512024.04Literature
Information
From “data” to “digital governance”: the logic of technology and
policy in rural digital transformation
1522024.06Survey reportsChina Academy of Information and Communications Technology: Digital Village Development Practice White Paper
1682025.12Survey
Reports
Cheng Yu: Empowering Rural Economic Resilience Construction with Systematic Thinking
Note: Due to space limitations, only representative texts are listed.
Table 2. Profile of the invited experts.
CategoryInstitutional AffiliationExperienceProfessional TitleNumber
Academic ResearchUniversities/Research Institutes>10 YearsProfessor/Associate Professor4
Public AdministrationGov. Housing/Emergency Management Depts.>10 YearsSenior Administrator3
Industry PracticeTelecom/Infrastructure Enterprises>10 YearsSenior Engineer/Manager3
Table 3. Resilience evaluation indicator system of URII.
DimensionsElementsIndicator LayerIndicator PropertiesInstructionsSource
Stress (P)Natural
stress (p)
Number of weather warning signals issued (A1)NegativeReflects the comprehensive occurrence of multiple meteorological disasters such as heavy rain, blizzard and cold wave[48]
Number of
earthquakes (A2)
NegativeReflects the risk of earthquake disaster[49]
Artificial pressureCyber security
incidents (A3)
NegativeRural areas suffering from cyber security incidents will affect the normal operation of information infrastructure[50]
Population
density (A4)
NegativeIt affects the population density and the supply and demand of
information infrastructure in the region, and reflects external
environmental pressure
[51]
Intensive e-commerce employment activities (A5)NegativeEngaging in e-commerce network activities will cause the
functional decline of the information infrastructure system, network congestion and service interruption to a certain extent
[52]
Digital talent
shortage (A6)
NegativeThe lack of digital talent restricts the construction and operation of information infrastructure[53]
State (S)Economic and social statusDigital economy
environment (A7)
PositiveReflect the digital environment in rural areas[32]
Good innovation ecology (A8)PositiveReflect the local digital innovation environmentTypical Case, [52]
Financial
construction funds input (A9)
PositiveThe degree of government investment in rural information
infrastructure construction
[54]
Per capita
disposable income of rural residents (A10)
PositiveReflect the rural economic environment in which the information infrastructure is located[55]
Facility
status
Mobile network
construction (A11)
PositiveReflect the coverage breadth of the high-speed communication networksurvey
report a
Information
service
infrastructure
construction (A12)
PositiveRefers to the sites and facilities that use information technology to provide rural residents with information services in the fields of government affairs, production and life[33]
Construction of smart agriculture facilities (A13)PositiveThe level of digital transformation of agricultural infrastructure[33]
Response (R)Early
warning
capability
Natural risk
early warning
capability (A14)
PositiveThrough the analysis and prediction of climate, environment and other data, the possible natural disasters can be controlled and prevented in advance to reduce the loss after information
infrastructure disasters
[48]
Security Management guarantee system (A15)PositiveReflect the development, implementation and supervision of the network security management systempolicy
paper b
Disaster
communication
capability (A16)
PositiveThe ability to receive and transmit information during disasters is represented by the proportion of mobile phone users and
users with broadband Internet access, reflecting the
responsiveness of communication infrastructure
[50]
ResilienceEmergency management ability (A17)PositiveThe management and disposal capabilities of the government and relevant departments to prevent, respond to, deal with and recover from emergencies encountered in information
infrastructure
policy
paper c
Fund input for
disaster reduction (A18)
PositiveGovernment investment in disaster prevention and emergency
management
[54]
Learning
capacity for change
Digital technology
innovation ability (A19)
PositiveReflect the local ability to use digital technology for creativity and researchpolicy
paper d
Digital literacy for grassroots cadres (A20)PositiveReflect the ability of local grassroots cadres to use digital technology to provide government services and help the massessurvey
report e
Training of
practitioners (A21)
PositiveWhether to conduct regular training for employees such as network security education, technical training and skill assessment[56]
a. Survey Report 1: China Digital Village Development Report (2024); b. Survey Report 2: Survey and Analysis Report on Digital Literacy in Rural China under the Background of the Rural Revitalization Strategy; c. Policy Paper 3: Guidelines for Digital Village Construction; d. Policy Paper 4: Guidelines for Digital Village Standard System Construction; e. Policy Paper 5: Outline of the Digital Village Development Strategy.
Table 4. Classification of resilience levels of URII.
Level of ResilienceResilience Indicator Value Range
Very high resilience0.8000 < U R ≤ 1.0000
High resilience0.6000 < U R ≤ 0.8000
Medium resilience0.4000 < U R ≤ 0.6000
Low resilience0.2000 < U R ≤ 0.4000
Very low resilience0.0000 ≤ U R ≤ 0.2000
Table 5. Subjective weights of resilience indicators of URII.
FactorsInfluence
Degree
Affected
Degree
Centrality
Degree
Centrality
Degree
Ranking
Cause
Degree
Cause Degree RankingSubjective WeightSubjective Weight Ranking
A11.89100.00931.9003211.881720.033021
A22.07010.00072.0708202.069310.036119
A31.76931.54453.3139140.224870.041115
A42.76101.72304.484051.038030.05694
A51.92102.26074.181790.3396140.05199
A62.02791.24433.2722150.783740.041614
A72.69862.55065.249220.147980.06492
A82.24622.34474.590940.0984110.05685
A91.20671.84513.0518160.6383170.038517
A102.44921.78214.231280.667150.05298
A112.30042.55744.857730.2570130.06013
A121.17971.86443.0441170.6847180.038616
A131.50632.79224.298571.2859200.05556
A141.33462.03603.3706130.7014190.042613
A151.46182.00093.4627120.5392160.043311
A161.69232.17593.8682100.4836150.048210
A171.65323.60585.259011.9527210.06931
A181.78201.68543.4674110.096590.042912
A192.31832.07604.394460.242360.05447
A201.23541.49052.7259190.2551120.033820
A211.56361.47913.0426180.0845100.037618
Table 6. Objective weights of resilience indicators of URII.
IndicatorsA1A2A3A4A5A6A7
Weights0.02990.02020.02020.02050.02550.14550.0378
Rank1220211815111
IndicatorsA8A9A10A11A12A13A14
Weights0.04020.07770.02960.04870.02030.04050.0830
Rank1051371993
IndicatorsA15A16A17A18A19A20A21
Weights0.04630.02050.08490.02810.02420.07340.0830
Rank8172141664
Table 7. Combined weights of resilience indicators of URII.
IndicatorsObjective WeightsSubjective WeightsCombined WeightsIndicator Weights RankIntra-Group WeightIntra-Group Rank
A10.02990.03300.0211170.08924
A20.02020.03610.0156210.06596
A30.02020.04110.0177190.07485
A40.02050.05690.0249160.10523
A50.02550.05190.0282130.11922
A60.14550.04160.129110.54571
A70.03780.06490.052380.16093
A80.04020.05680.048690.14944
A90.07770.03850.063850.19621
A100.02960.05290.0334120.10286
A110.04870.06010.062460.19192
A120.02030.03860.0167200.05147
A130.04050.05550.0479100.14745
A140.08300.04260.075330.17182
A150.04630.04330.0428110.09775
A160.02050.04820.0211180.04818
A170.08490.06930.125520.28631
A180.02810.04290.0258150.05897
A190.02420.05440.0282140.06436
A200.07340.03380.053070.12094
A210.08300.03760.066640.15203
Table 8. URII resilience indicator in Lijin County.
YearGroup Utility Value (S)Individual
Regret Value (R)
Comprehensive Evaluation Value (Q)Resilience
Indicator (U)
Rank
20220.05360.02820.00001.00001
20210.44180.12910.73750.26252
20200.74730.12910.92440.07563
20190.80970.12910.96260.03744
20180.87090.12911.00000.00005
Table 9. Three-dimensional URII resilience indicator in Lijin County.
YearPressure Resilience IndicatorState Resilience
Indicator
Response Resilience Indicator
20221.00001.00001.0000
20210.00000.43180.6696
20200.12180.14630.0454
20190.07930.13740.0000
20180.13750.00000.0051
Disclaimer/Publisher’s Note: The statements, opinions and data contained in all publications are solely those of the individual author(s) and contributor(s) and not of MDPI and/or the editor(s). MDPI and/or the editor(s) disclaim responsibility for any injury to people or property resulting from any ideas, methods, instructions or products referred to in the content.