Article

Study on the Effect of Chloride Ions on the Durability of Reinforced Pozzolanic Concrete Members in Coastal Environments

1
School of Architectural Arts, Jiangsu Urban and Rural Construction Vocational College, No. 1, Heyu Road, Yin-Village Vocational Education Park, Zhonglou District, Changzhou 213147, China
2
Jiangsu Province Engineering Research Center of Low-Carbon Building Materials and Urban and Rural Ecological, Changzhou 213147, China
3
School of Management Engineering, Jiangsu Urban and Rural Construction College, Changzhou 213147, China
*
Author to whom correspondence should be addressed.
Buildings 2026, 16(10), 1858; https://doi.org/10.3390/buildings16101858
Submission received: 3 March 2026 / Revised: 13 April 2026 / Accepted: 20 April 2026 / Published: 7 May 2026
(This article belongs to the Section Building Materials, and Repair & Renovation)

Abstract

Steel reinforcement corrosion induced by chloride ingress in coastal environments is the dominant factor leading to the durability degradation of concrete structures. In this study, Ordinary Portland Cement (OPC) concrete beams and Portland Pozzolana Cement (PPC) concrete beams were used as test specimens, subjected to sustained loads to induce cracks, and exposed to accelerated reinforcement corrosion through 10 wet–dry cycles using a 3% NaCl solution. Testing methods including half-cell potential, corrosion current, and acoustic emission signals were employed to quantify the likelihood and progression of reinforcement corrosion. The results show that the half-cell potential of the loaded PPC beams remained below −350 mV, with a corrosion current density exceeding 0.5 μA/cm2, indicating a significantly higher corrosion risk than that of the OPC beams; under unloaded conditions, the half-cell potential of the PPC beams remained consistently above −200 mV, with a corrosion current density below 0.2 μA/cm2, exhibiting superior corrosion resistance. The event counts in the acoustic emission tests additionally revealed the progression of chloride ions gradually penetrating and corroding the steel reinforcement. Although PPC beams exhibit lower early-stage crack resistance under loading conditions and are prone to forming more cracks, their advantage in resisting chloride ingress becomes significant after appropriate mitigation measures are implemented to reduce early crack formation, making them remain a preferred material for reinforced concrete members in coastal environments.

1. Introduction

Reinforced concrete structures in coastal environments are exposed to extremely harsh marine atmospheric conditions, which are characterized by high humidity, high salinity, and intense ultraviolet radiation. Among various durability threats, reinforcement corrosion induced by chloride ions is the primary factor leading to the performance degradation, loss of load-bearing capacity, and premature failure of concrete structures [1]. When the chloride ion content in concrete exceeds approximately 0.15% of the cement mass, the risk of reinforcement corrosion increases significantly, potentially shortening the design service life from 100 years to 30 to 40 years, with subsequent maintenance costs accounting for 20% to 40% of the initial construction costs. Chloride ions penetrate into the concrete through pores and cracks, causing the depassivation of the steel surface and triggering electrochemical corrosion, thereby leading to concrete cracking, spalling, and structural damage [2,3].
Pozzolanic materials, such as fly ash, silica fume, and ground granulated blast-furnace slag, have been widely used to improve the durability of concrete. W. Aperador, A. Delgado, and J. Bautista-Ruiz [4] investigated the corrosion resistance of ternary concrete composed of Portland cement, fly ash, and ground granulated blast-furnace slag (GGBS), pointing out that fly ash and blast-furnace slag greatly reduced the chloride ion permeability of the concrete and improved corrosion resistance in both short-term and long-term evaluations. Pozzolanic materials contain reactive silica, which can react with the calcium hydroxide generated during the cement hydration process to form additional cementitious compounds, thereby refining the pore structure and reducing permeability. Longzhen Wang et al. [5] explored the quantitative evaluation of the inhibitor’s effect by introducing reduction coefficients for surface chloride concentration and diffusion coefficient, pointing out that composite concrete reduced the chloride diffusion coefficient by 31.3% and the surface chloride concentration by 22.67%. The incorporation of pozzolans can significantly reduce the chloride diffusion coefficient of uncracked concrete, especially under lower water–binder ratio conditions. However, most current studies have focused on uncracked or unloaded conditions, where the concrete remains intact, and chloride transport is primarily governed by diffusion within the pore network [6].
In reality, reinforced concrete structures inevitably develop cracks during service due to mechanical loads, shrinkage, or temperature variations. In particular, cracks wider than 0.1 mm provide direct pathways for chlorides, oxygen, and moisture [7]. Xubing Xu et al. [8] studied the diffusion behavior of chloride ions in damaged concrete under fatigue loading, pointing out that wider and deeper cracks facilitate chloride transport. Under sustained loading, cracks may propagate and interconnect, thereby further accelerating corrosion. Hesong Jin et al. [9] investigated the resistance to chloride ingress in concrete exposed to chloride environments to reduce the impact of chloride ingress on the design of coastal reinforced concrete, showing that chloride ingress is caused by a combination of multiple factors. For PPC, the situation is more complex. Although its late-age microstructure becomes dense and capable of resisting chloride ingress, its early-age mechanical properties (such as tensile strength and elastic modulus) are often lower than those of OPC. This leads to a higher probability of early cracking under loading, which may offset the long-term benefits brought by pore refinement. In recent years, researchers have improved the early crack resistance and durability of concrete by adding nanomaterials or fibers. Farhan Ahmad et al. [10] incorporated nano-graphite platelets (NGPs) into cementitious composites and found that when the NGP dosage was 5%, the compressive strength of the concrete increased by 38.5% and water absorption decreased by 73.9%. By filling nanoscale pores and refining the microstructure, NGPs significantly reduced the penetration pathways for aggressive media such as chloride ions. Zeeshan Ahmad et al. [11] studied the effect of macro-synthetic fibers (MSF) on the properties of concrete containing e-waste aggregates; incorporating 0.75% MSF increased the splitting tensile strength by 152% and the flexural strength by 98%. The “bridging effect” formed by the three-dimensional random distribution of fibers can effectively inhibit crack propagation and reduce the intrusion pathways of corrosive media.
Under the combined action of mechanical loading and chloride exposure, the trade-off relationship between PPC’s susceptibility to early cracking and its late-age corrosion resistance remains insufficiently understood. To bridge this gap, this study investigated the durability performance of PPC beams under sustained mechanical loading (which induces service-level cracks). Natural exposure and accelerated wet–dry cycles using a 3% sodium chloride solution were adopted to simulate coastal chloride attack. The experiment monitored ten wet–dry cycle processes, utilizing half-cell potential, corrosion current density, and acoustic emission signal tests to quantify reinforcement corrosion. The research objectives include: (1) comparing the corrosion behavior of PPC beams and OPC beams under loaded and unloaded conditions; (2) quantifying the effect of cracks induced by sustained loading on chloride-induced corrosion in pozzolanic concrete; (3) proposing practical mitigation measures for the early cracking of pozzolanic concrete in coastal applications. The findings are expected to provide a theoretical basis and practical guidance for improving the durability of pozzolanic concrete structures in coastal environments.

2. Material

2.1. Cementitious Materials

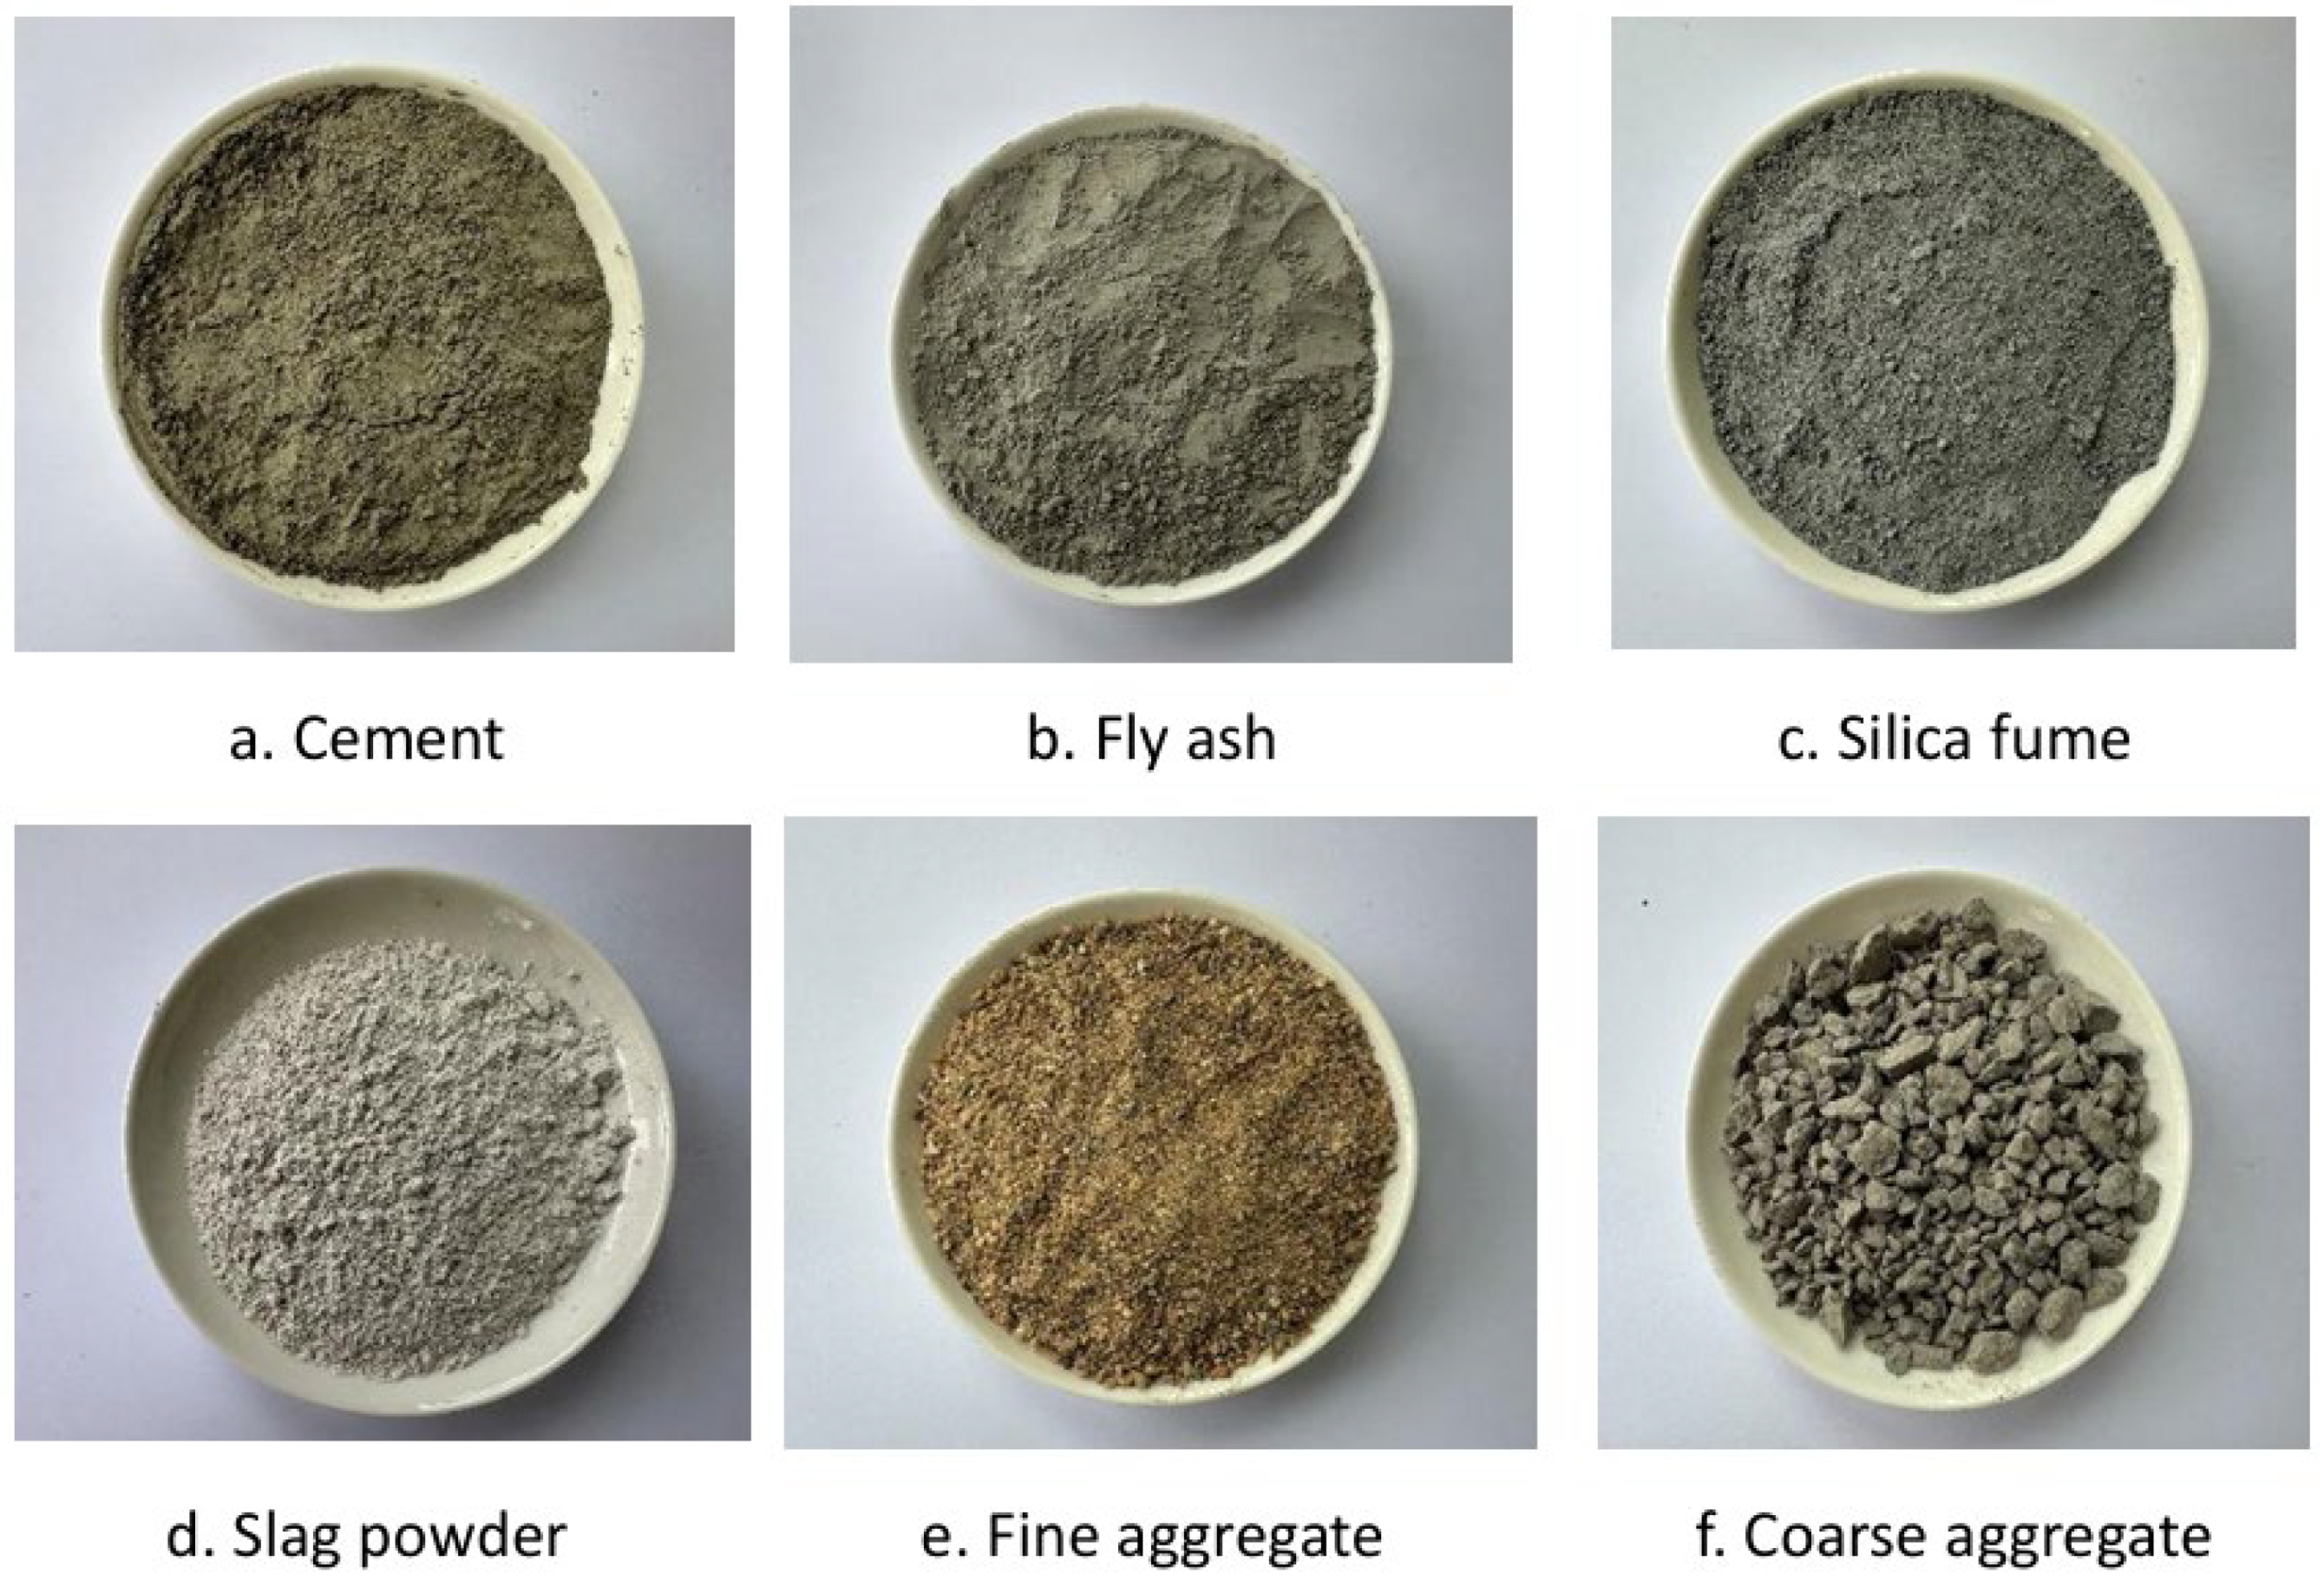
The cementitious materials used in this study mainly include P·O 42.5 ordinary Portland cement from Guangzhou Cement Co., Ltd. (Guangzhou, China), fly ash, silica fume, and slag powder, as shown in Figure 1.
The chemical compositions and physical properties of the cementitious materials are shown in Table 1 and Table 2.

2.2. Aggregates

The fine aggregate used was medium sand with a fineness modulus of 2.8; the coarse aggregate was crushed limestone with a particle size of 5–16 mm, as shown in Figure 1. The water reducer was a polycarboxylate superplasticizer. The physical properties of the coarse and fine aggregates are shown in Table 3.

2.3. Steel Reinforcement

The main load-bearing reinforcement selected for the beams was HRB400 steel bars with a diameter of 16 mm, and the stirrups selected were HRB400 steel bars with a diameter of 10 mm from Guangdong Weilan Steel Bar Co., Ltd. (Foshan, China). The mechanical properties of the steel reinforcement are shown in Table 4.

2.4. Mix Proportions

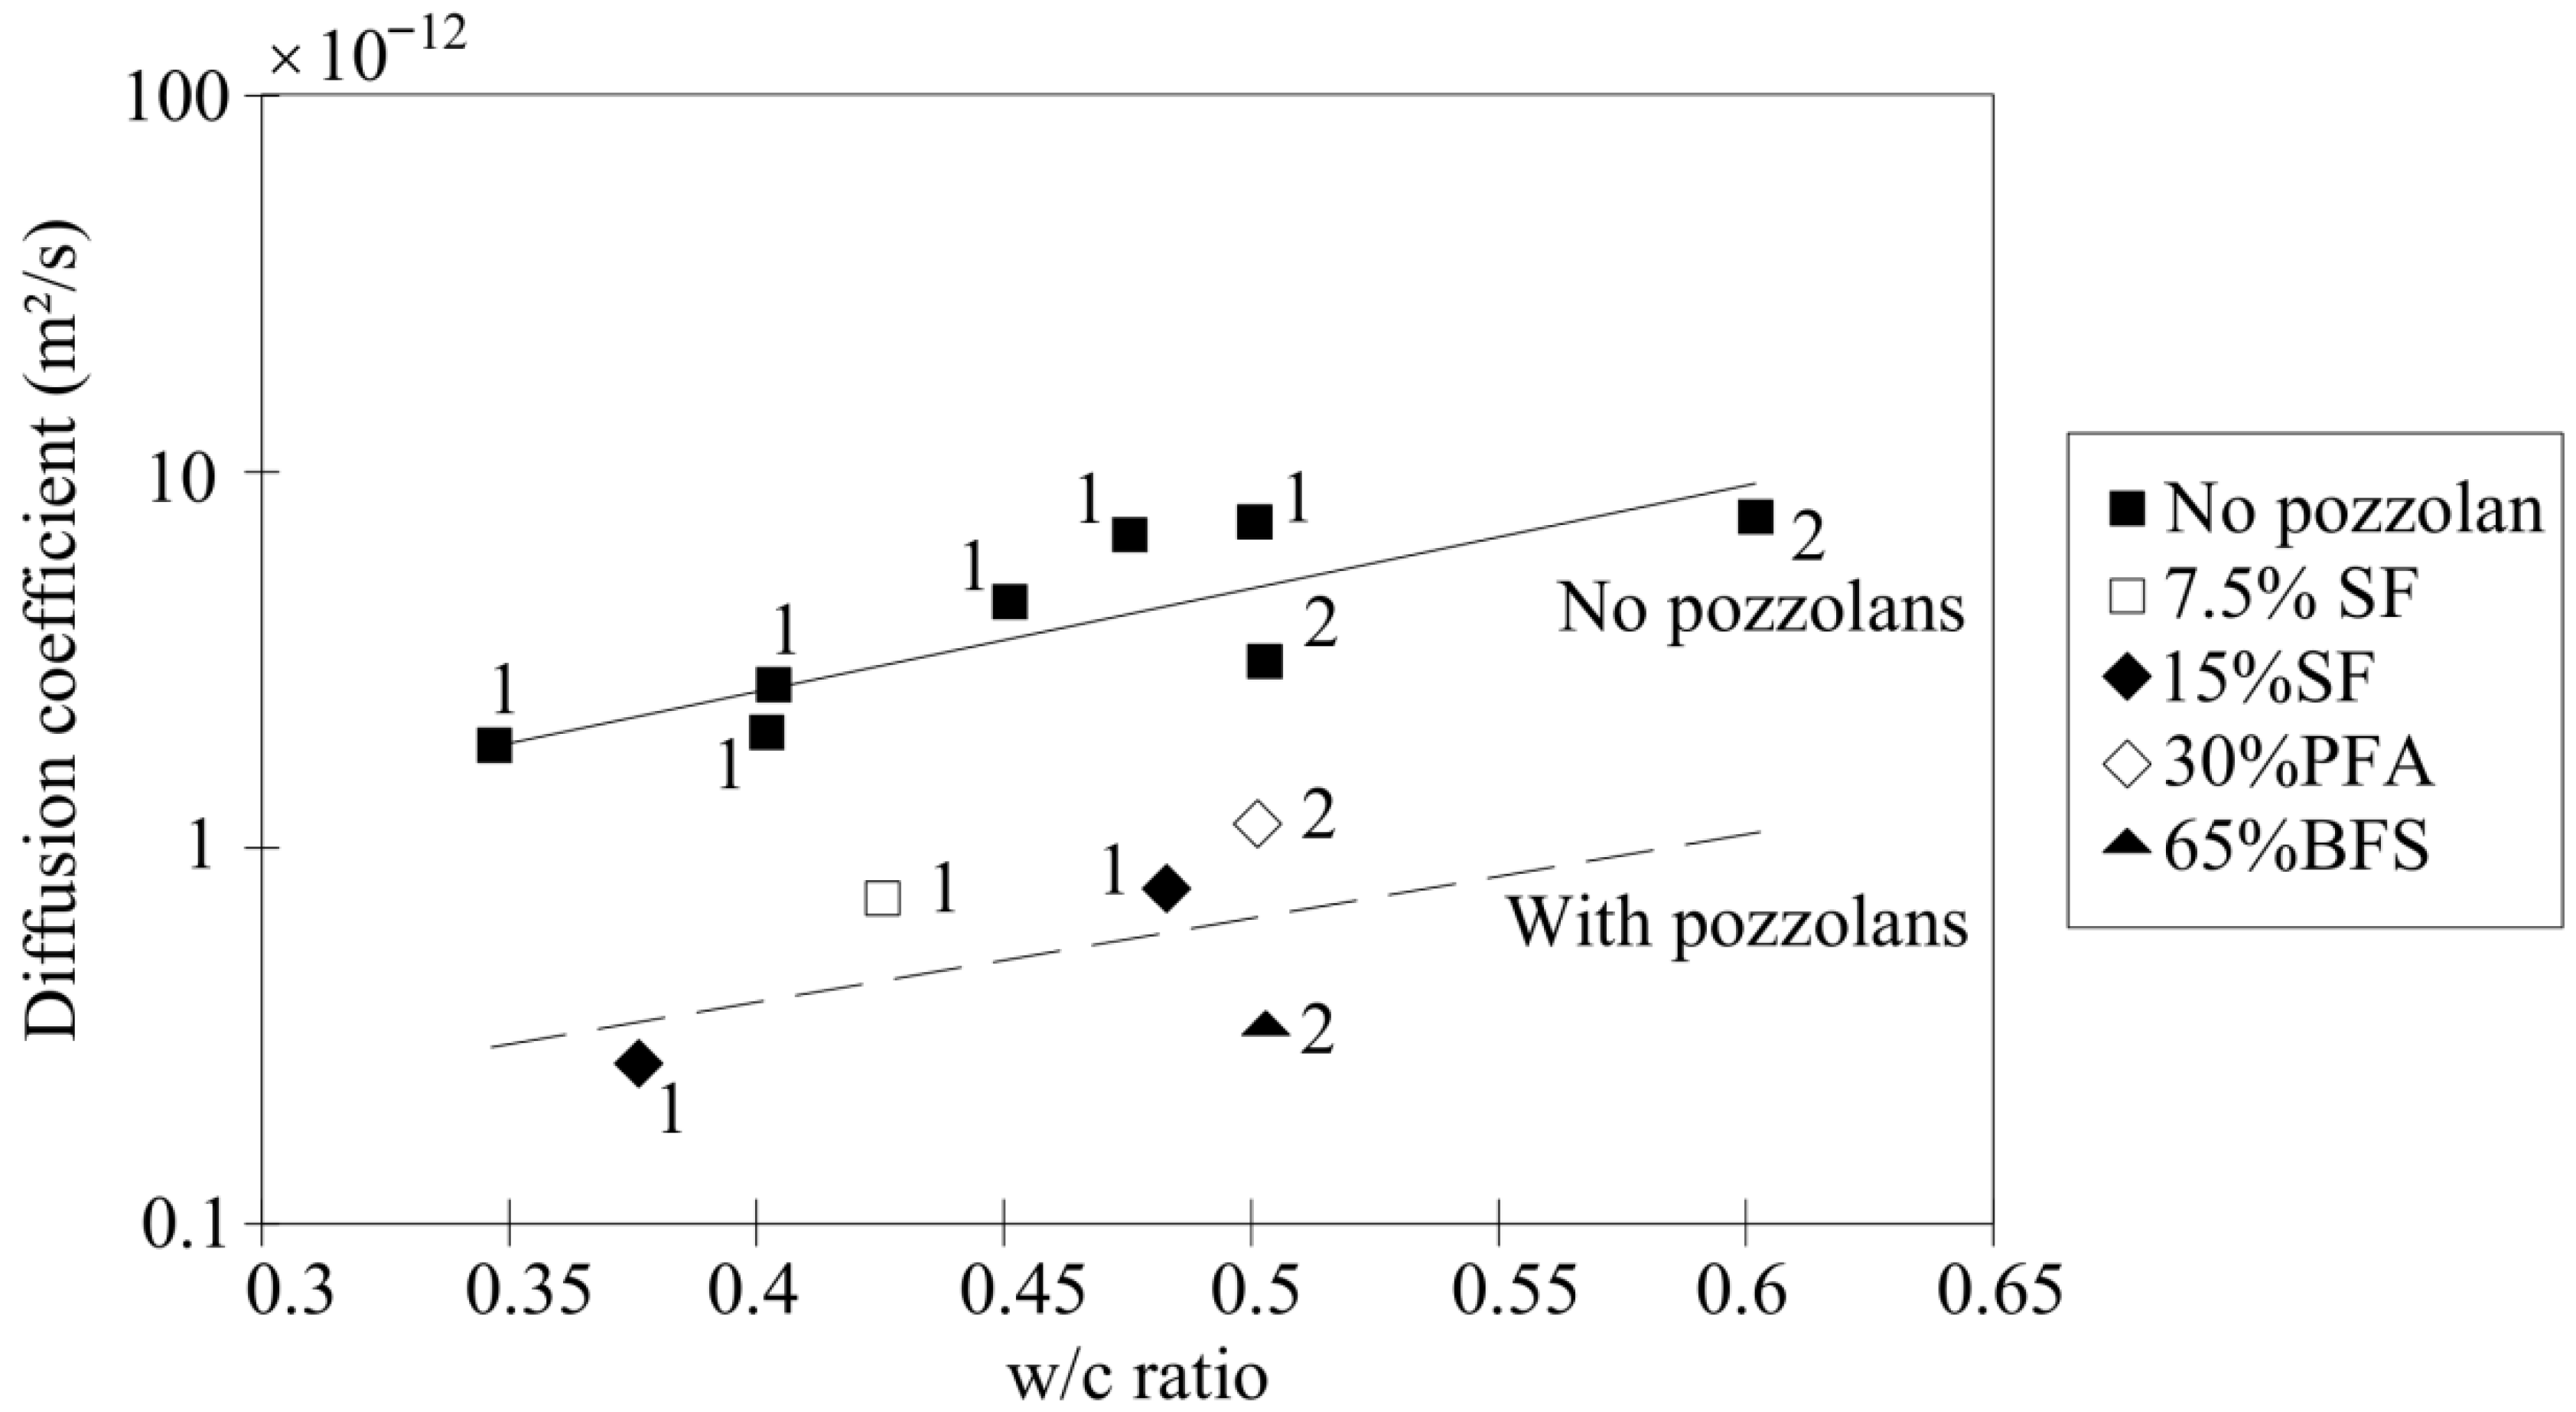
Fly ash and slag are two common pozzolans. The diffusion coefficient of chloride ions decreases as the water–cement ratio decreases, and when pozzolans are added, the diffusion coefficient is further reduced [12,13]. The addition of fly ash and slag reduces the internal porosity of the concrete; fly ash can replace 10% of the cement, while slag can replace 90% of the cement. Although reducing the cement content may reduce or modify the chloride binding capacity, the incorporation of fly ash and slag generally refines the pore structure, thereby decreasing chloride diffusivity and improving resistance to chloride-induced corrosion [14,15]. Figure 2 shows the relationship between the chloride diffusion coefficient and the addition of different proportions of fly ash, pozzolans, and silica fume under different water–cement ratios. Based on this proportional relationship, diffusion coefficient, and strength grade, the mix proportions for preparing Ordinary Portland Concrete (OPC) and Portland Pozzolana Concrete (PPC) in this experiment were determined, as shown in Table 5.

3. Experimental Design

The experimental method of this study involves fabricating OPC beams and PPC beams, applying sustained loads to induce cracks, and accelerating reinforcement corrosion through 10 wet–dry cycles using a 3% NaCl solution, while monitoring changes in the half-cell potential of the steel reinforcement, changes in the reinforcement corrosion current, and the distribution of acoustic emission detection points. Specifically, 2 types of concrete beam members were prepared, with 3 groups for each type and 3 beams per group, which were used for strength testing, loaded corrosion testing, and unloaded corrosion testing. First, ultimate strength tests were conducted on the beams to establish a reference load for the subsequent wet–dry corrosion cycles. Second, while the half-cell potential indicates the probability of active corrosion, corrosion current measurements were additionally employed to quantify the actual corrosion rate. The event counts in the acoustic emission test reflects the process of chloride ions gradually penetrating and corroding the steel reinforcement, while simultaneously verifying the accuracy of the half-cell potential and reinforcement corrosion current tests.

3.1. Beam Fabrication

A total of 2 concrete mixtures were prepared in this study. The mix ratio adopted for OPC was 1:1.93:2.90, and the water–cement ratio was maintained at 0.45. The dosage of cementitious materials for PPC was 384 kg/m3 (including cement, silica fume, fly ash, and slag powder), the mix ratio adopted for PPC was 1:1.77:3.01, and the water–cement ratio was maintained at 0.45. The water reducer was a polycarboxylate superplasticizer with a water reduction rate of 35% (mass fraction). A vertical mixer was used when preparing the concrete mixtures, operating at a speed of 48 rpm. Before mixing the pozzolanic concrete, the mixer was pre-wetted by idling, and residual debris and standing water in the drum were cleaned out to ensure a clean inner mixing wall. In the first step, the coarse aggregate was added and dry-mixed for 20 s, followed by the fine aggregate, which was dry-mixed for 30 s to blend uniformly with the coarse aggregate. Then, fly ash, slag powder, silica fume, and cement were added sequentially and dry-mixed again with the previous aggregates for a dry-mixing time of 60 s. In the second step, the mixing water was added in stages: first, 70% of the total mixing water was added and mixed for 1 min, then the remaining clean water was added slowly and mixed for another 1 min. The polycarboxylate water reducer, pre-diluted and dissolved in water, was poured evenly into the mixture and mixed for 3 min. In the third step, the fresh concrete was poured into molds containing steel reinforcement and vibrated for 1 min. After the concrete was fully compacted, the beam members were cured in a natural indoor environment for 28 days. In this experiment, OPC beam and PPC beam members were selected for subsequent testing. Three groups of OPC beam members were fabricated, with 3 beams in each group, used for strength testing, loaded corrosion testing, and unloaded corrosion testing. Similarly, three groups of PPC beam members were fabricated, with 3 beams in each group, used for strength testing, loaded corrosion testing, and unloaded corrosion testing.
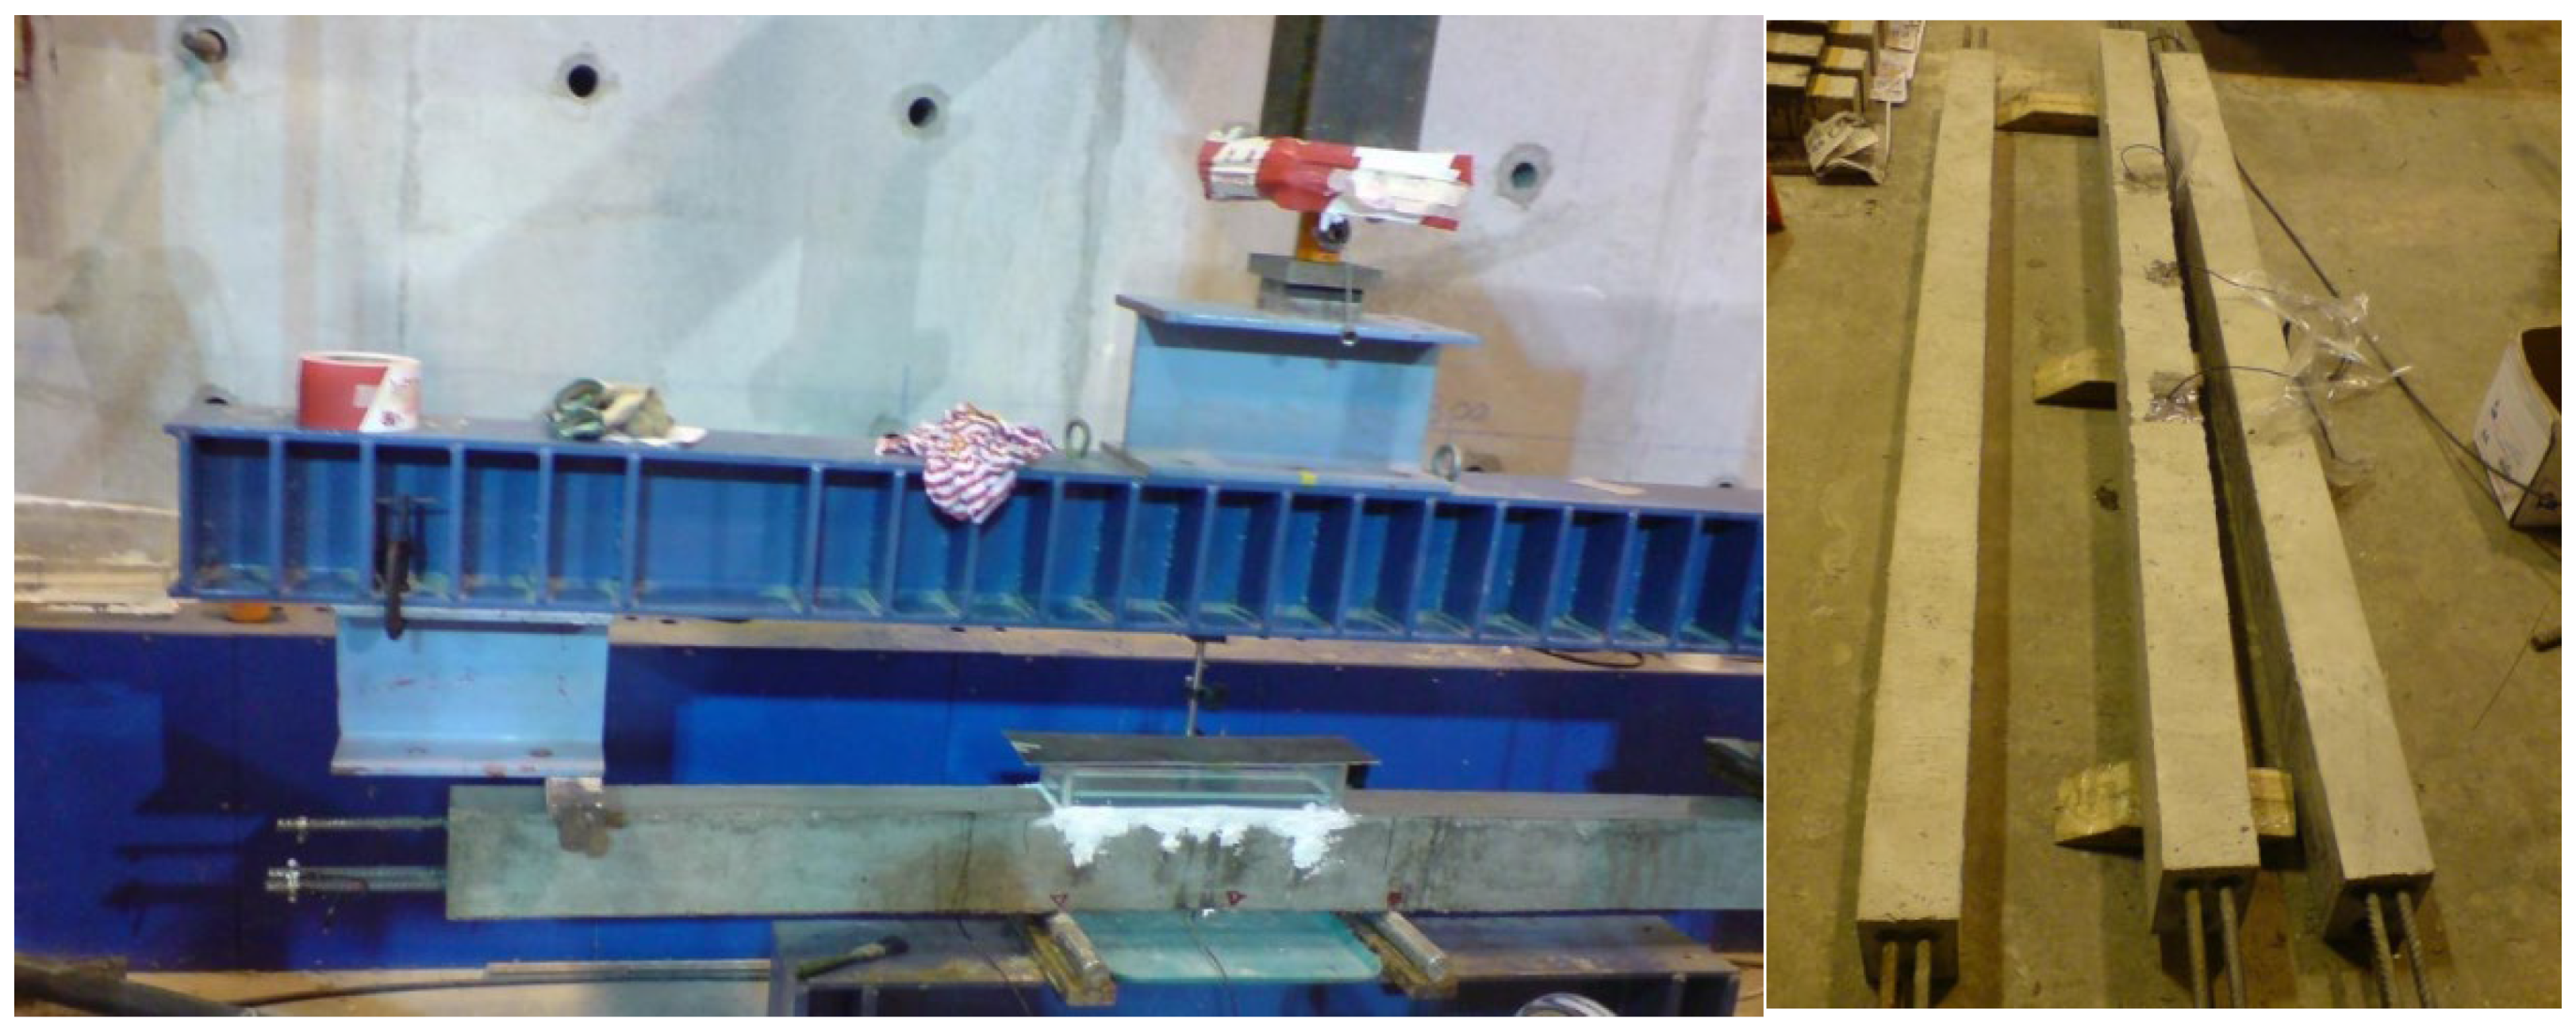
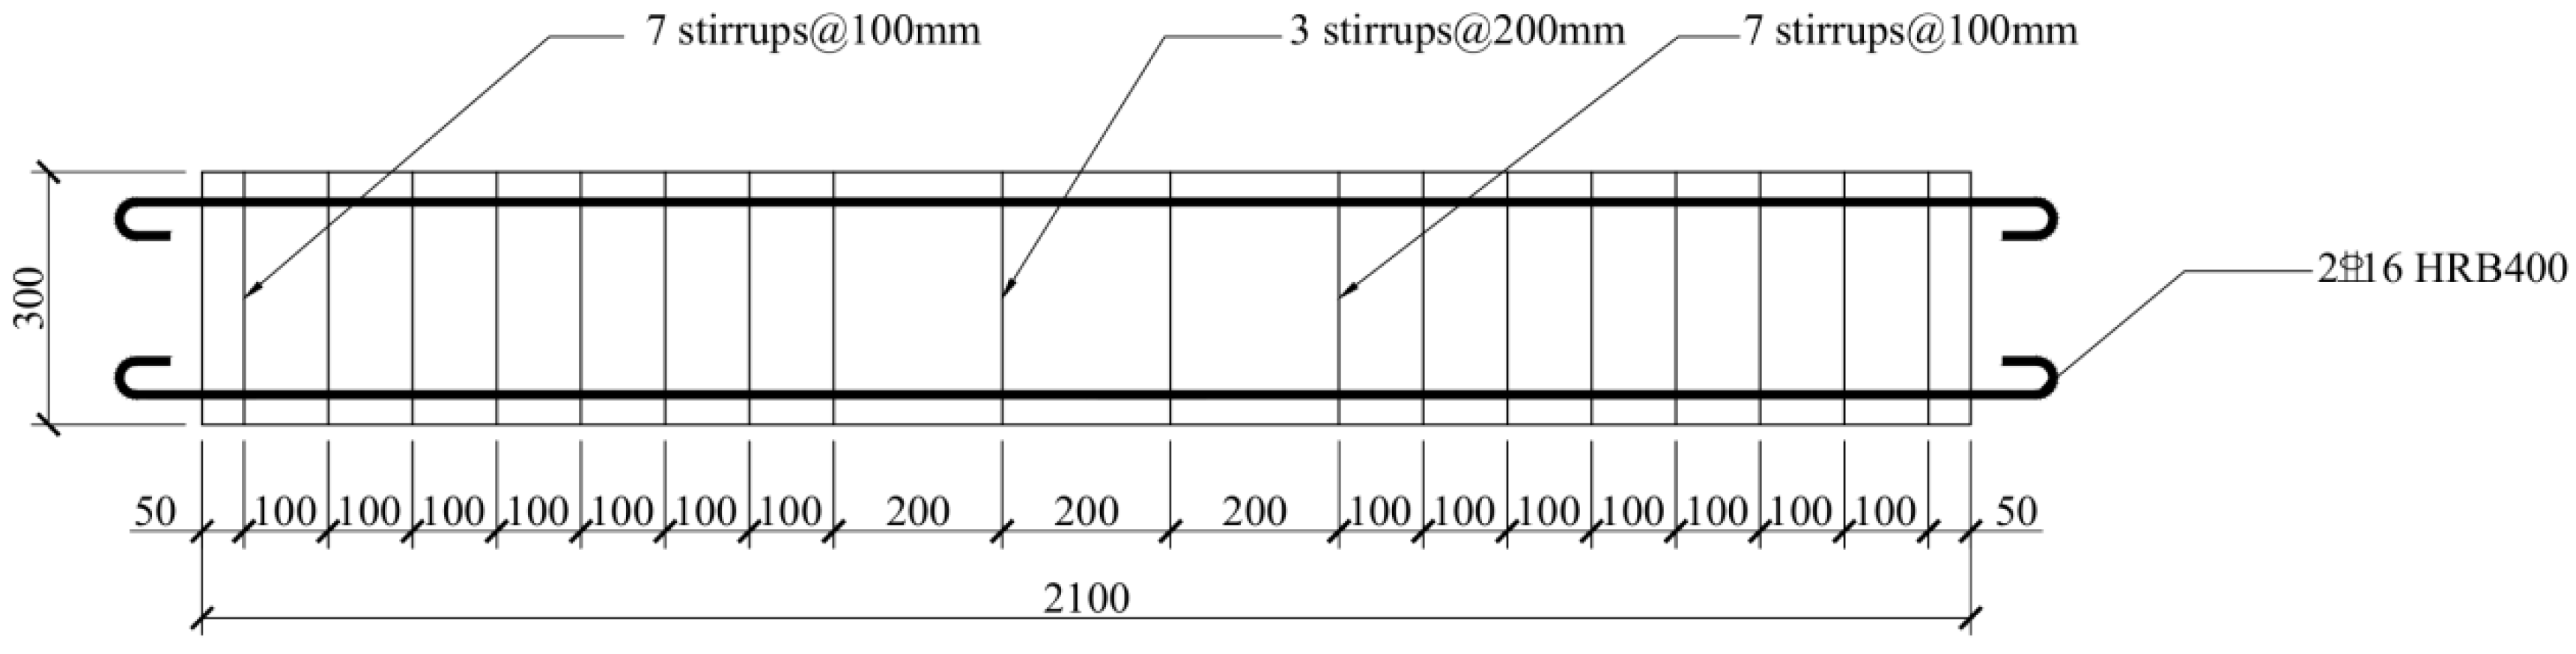
The stress in different sections of reinforced concrete beams leads to different types of cracks. There are 3 main forms of cracking failure in beams, which are mainly related to the value of the shear span-to-depth ratio (the shear span ratio (λ = a/h0) is the ratio of the shear span a (distance from concentrated load to support) to the effective cross-sectional height h0) [16,17], as shown in Table 6. Most beams in daily use are designed as 1 ≤ λ ≤ 3. During the cross-sectional reinforcement design of a beam, an appropriate amount of stirrups is configured through calculations so that the beam has sufficient safety reserves when shear-compression failure occurs; this is the most economical and reasonable failure state [18,19]. The selection of steel reinforcement, the cross-sectional reinforcement of the beam specimens, and the loading method in this experiment were all designed taking the above conditions into account. The cross-sectional dimensions of the specimen beams were 200 mm × 300 mm × 2100 mm, and the reinforcement diagram of the beams is shown in Figure 3.
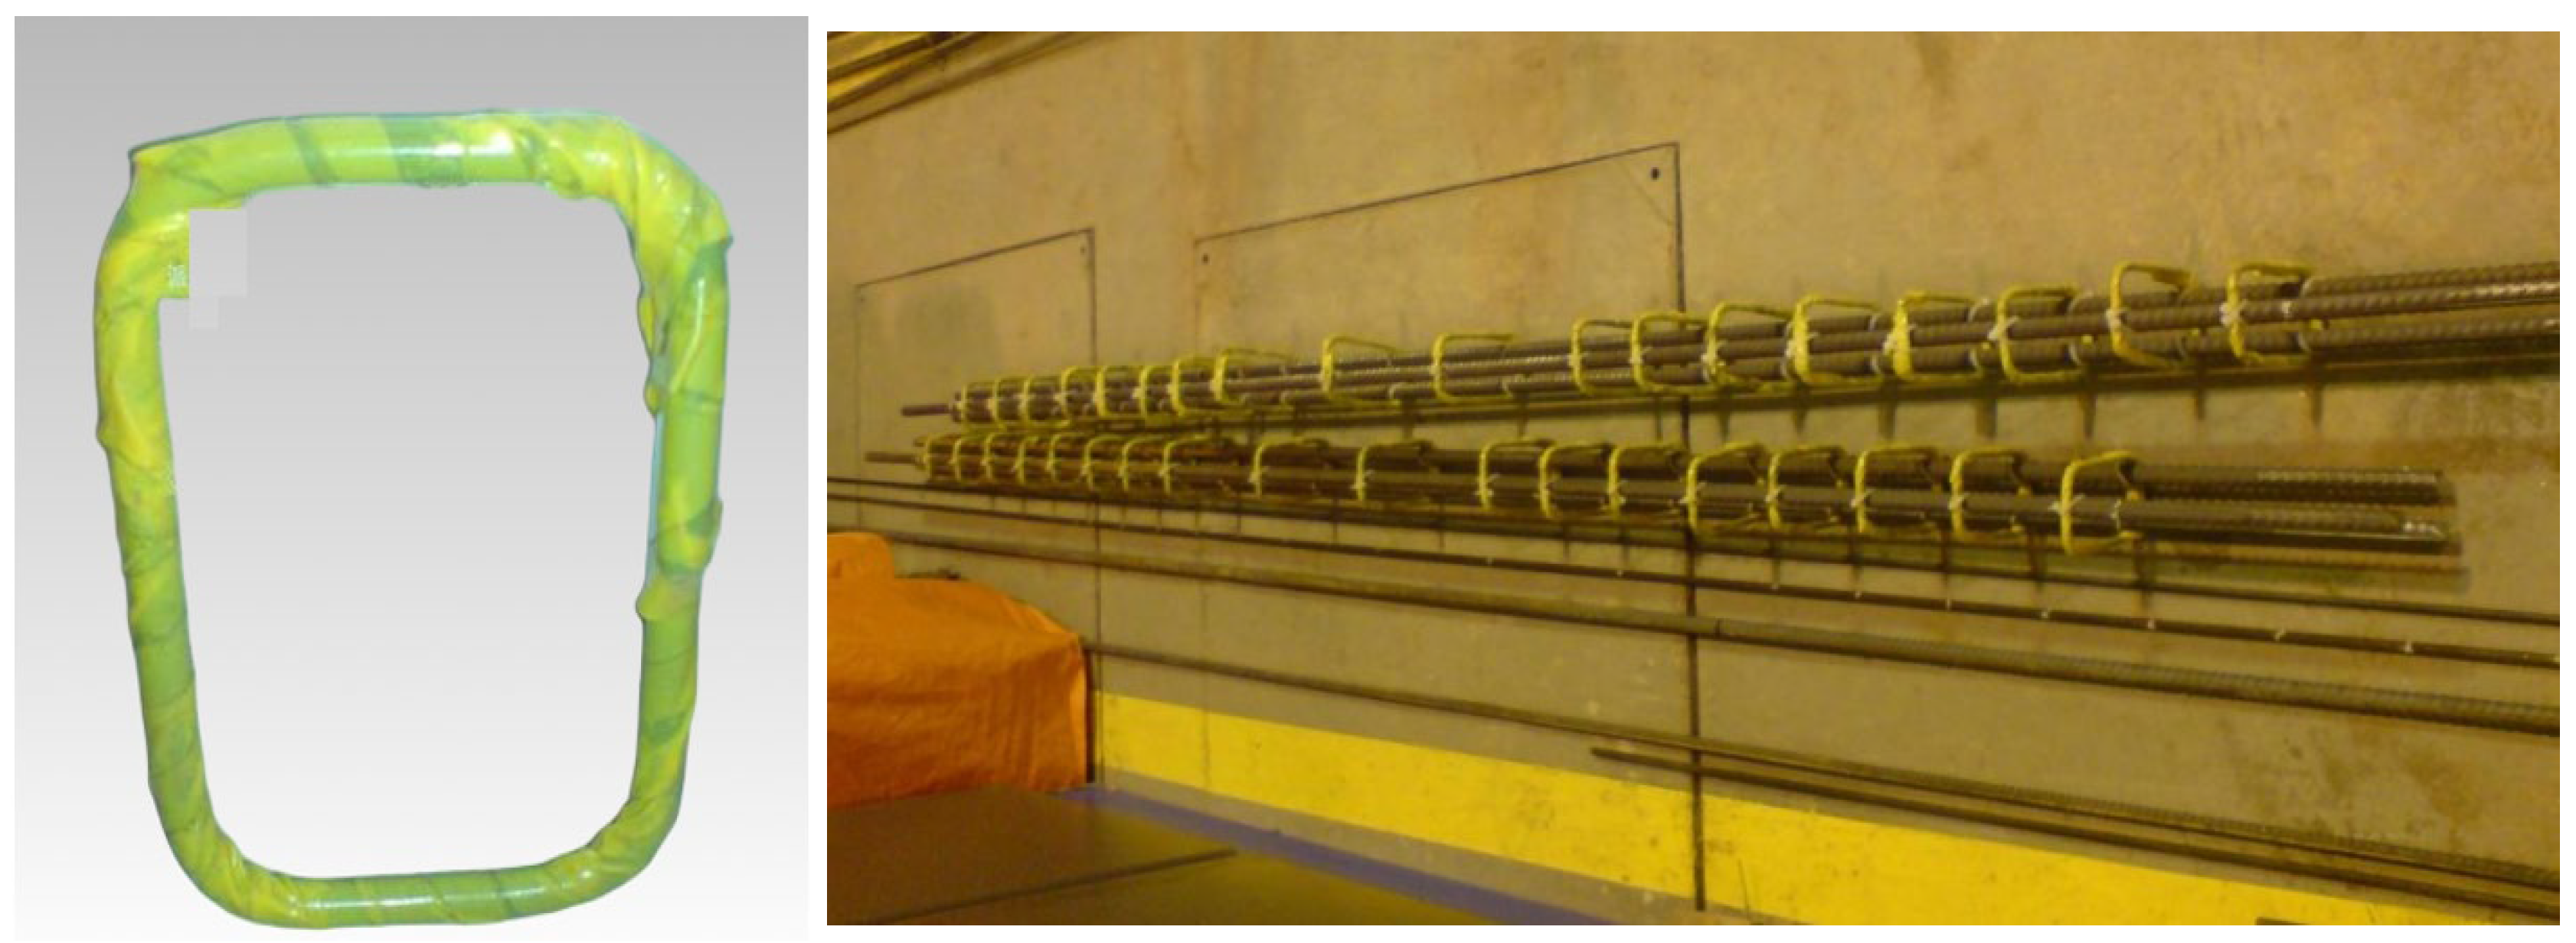
Insulation and tying preparation of stirrups: the perimeter of the stirrups was wrapped with insulating tape, and the connections between the stirrups and the main reinforcement were fixed with plastic cable ties, as shown in Figure 4. This insulation prevented electrical short circuits between the steel bars, ensuring the accuracy of subsequent electrochemical measurements (both half-cell potential and corrosion current).

3.2. Strength Testing

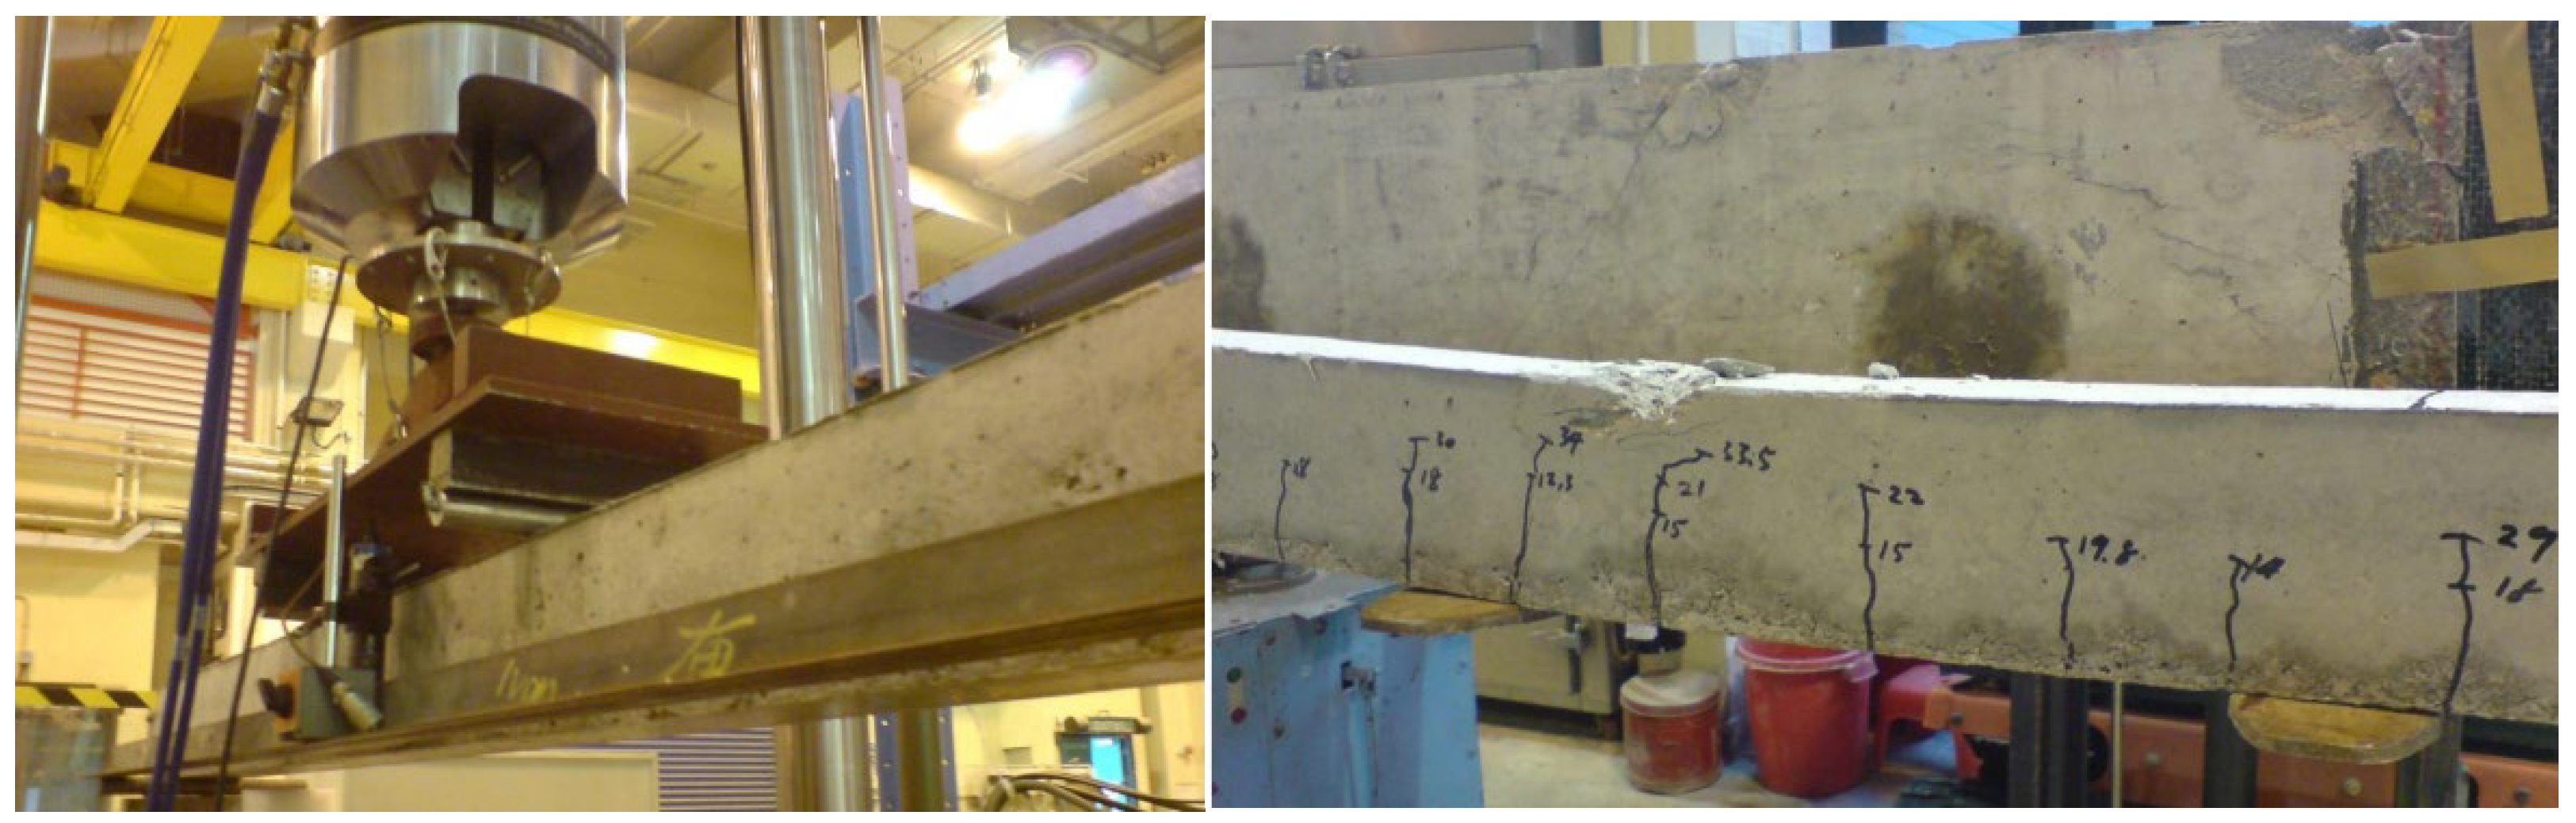
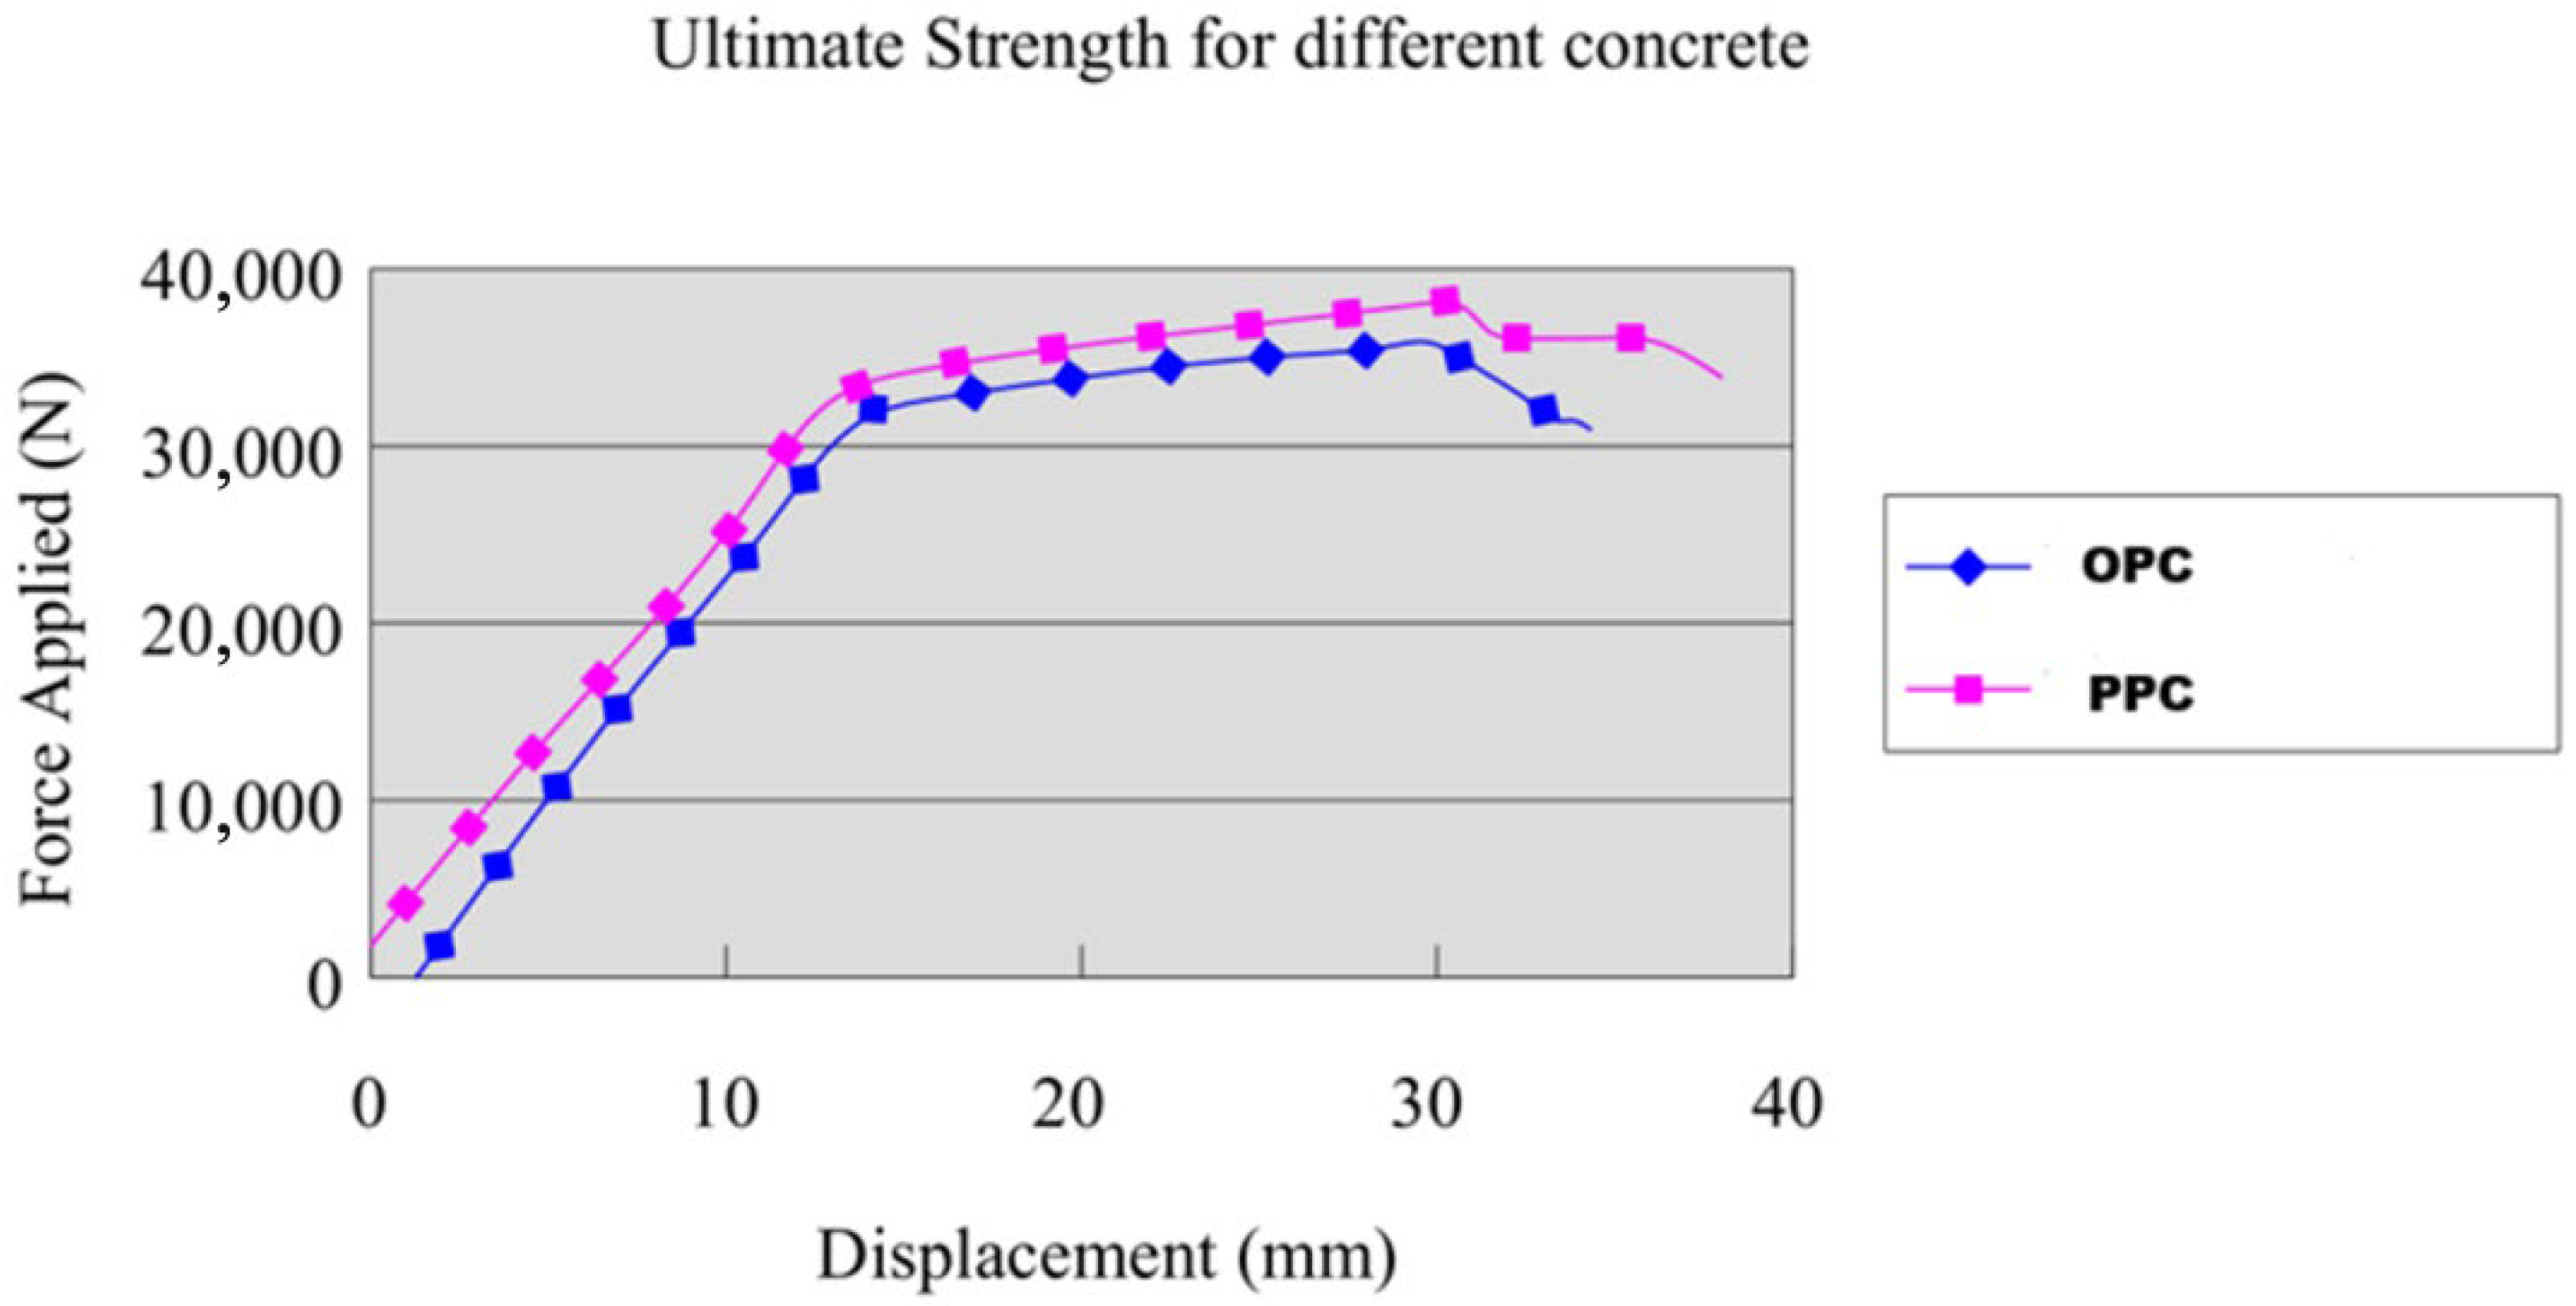
Before the start of the cyclic corrosion experiment, ultimate strength tests were performed on the OPC beams and PPC beams after 28 days of identical curing. First, an LVDT sensor was fixed in the middle of the beam to monitor deflection. The load–displacement curve for each beam specimen was plotted, and the peak load value before a sudden drop in load capacity was defined as the ultimate strength, while the corresponding displacement was recorded. Finally, the crack patterns of the ordinary concrete beams and the pozzolanic concrete beams were compared. As seen in Figure 5, the strength curves of the ordinary concrete beams and the pozzolanic concrete beams in the stress–strain curves of the beams are very close. The ultimate strength value for both was around 36 kN, and the maximum strain value at the mid-span of the beams was about 35 mm. After the strength experiment of the beams was completed, crack locations were marked (black lines) on the beam bodies to provide crack-related data for subsequent research. The analysis of strength and deformation data, as well as the distribution of cracks on the beams, are shown in Figure 5. The load-bearing capacity calculation of the concrete beams, the limitations of the structural loading equipment setup, and the safety and stability of the loading platform, were comprehensively analyzed. Subsequently, a sustained load of 18 kN (50% of the ultimate strength) was applied to induce service-level cracks. This accelerated the ingress of corrosive media without causing structural failure, thereby facilitating effective corrosion monitoring [20,21,22].

3.3. Cyclic Corrosion Experimental Setup

To simulate the shear-compression failure deformation state of concrete beams during normal service and to accelerate beam crack generation, a concentrated load of 18 kN was applied to the concrete beams. The blue steel components and the upper loading device in Figure 6 provided a concentrated load of 9 kN to each end of the concrete beam. Meanwhile, to accelerate the occurrence of chloride ion erosion reactions in the beams, a bottomless water tank was added to the middle of the beam. The four sides of the water tank were made of acrylic material baffles. The water tank was tightly connected to the upper surface of the beam and sealed with waterproof glue to ensure no leakage from the tank. The corrosion experiment lasted for 10 cycles; in each week, the water tank was in a dry state for 4 days, and a 3% sodium chloride solution was added to the tank for 3 days. Thus, the wet–dry cycles of the beam corrosion experiment lasted for 10 cycles (10 cycles corresponds to 10 cycles; the process of steel corrosion will be uniformly represented by the cycle). During the wet cycle, a 3% sodium chloride solution was added; at this time, the sodium chloride solution was in direct contact with the beam, and the sodium chloride solution began to penetrate very slowly into the beam [23,24].

3.4. Half-Cell Potential Testing

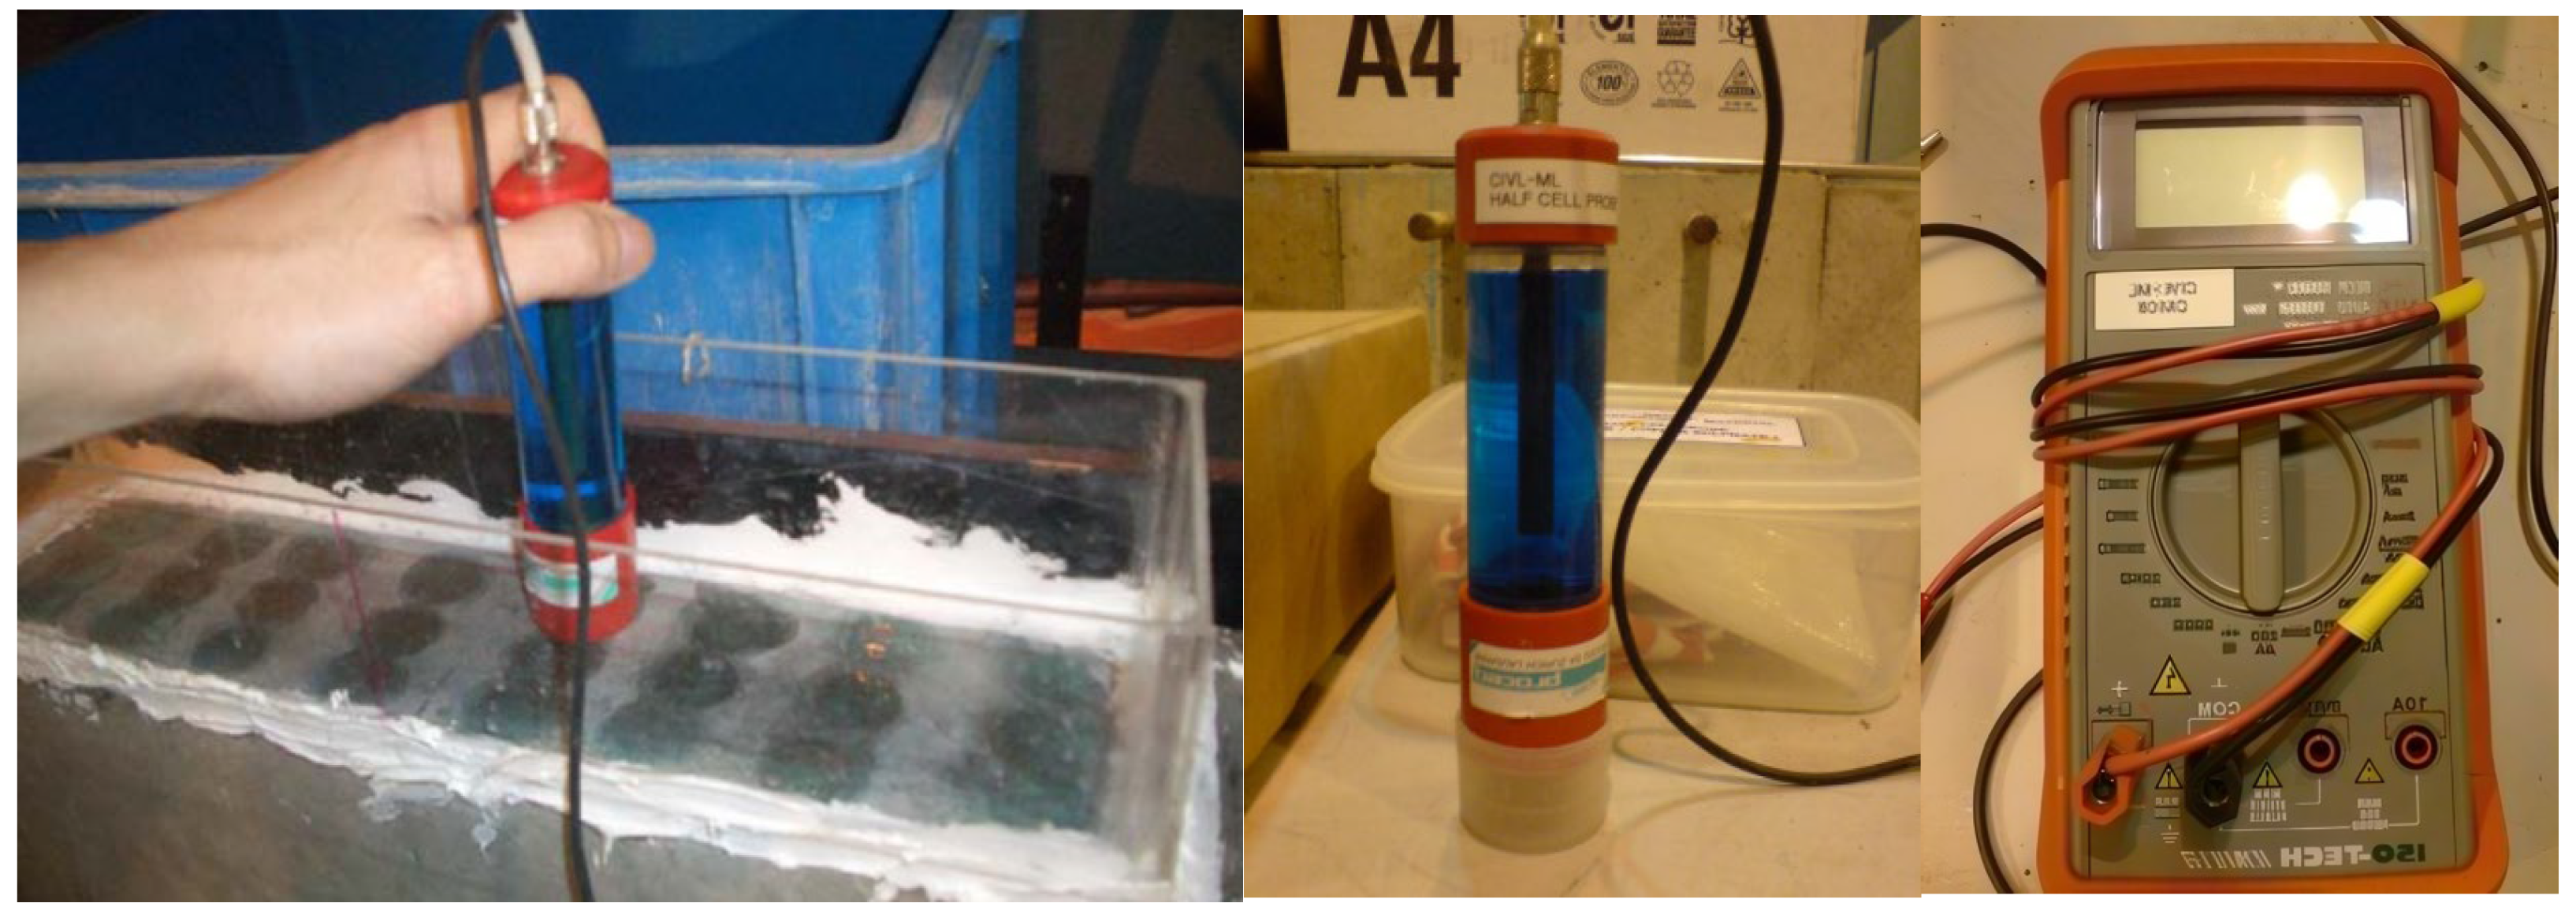
The half-cell potential testing method is an electrochemical detection method that can determine the probability of steel reinforcement corrosion in concrete physical structures by testing and analyzing detection data. Reinforcement corrosion in concrete physical structures or members is generally caused by natural electrochemical corrosion; therefore, the reinforcement corrosion status can be judged by measuring electrochemical parameters [25]. The instrument used in this study adopted a copper and copper sulfate half-cell, and the concrete along with the steel reinforcement inside it can be considered to be the other half-cell. During measurement, the copper and copper sulfate half-cell is connected to the reinforced concrete to detect the potential of the steel reinforcement, and the corrosion status of the steel reinforcement is judged based on accumulated research experience. This method has the advantage of being applicable to detecting the corrosion potential of steel reinforcement in hardened concrete, without being restricted by the size of the concrete members and the thickness of the concrete cover [26]. In this experimental method, the entire corrosion circuit requires two half-cells (anode and cathode) to be formed. An external, stable-potential reference electrode (such as a copper/copper sulfate electrode, CSE) is used to replace the cathodic half-cell in the corrosion cell, and it is connected to the steel reinforcement (as the other half-cell) to form a complete measurement circuit, as shown in Figure 7. According to the ASTM C876 [27] standard, when the potential reading (relative to CSE) is greater than −200 mV, it indicates a 90% probability that no active corrosion of the reinforcement is occurring; when the potential reading is between −200 mV and −350 mV, it indicates that the reinforcement corrosion activity is uncertain; when the potential reading (relative to CSE) is less than −350 mV, it indicates a 90% probability that active corrosion of the reinforcement is occurring.

3.5. Corrosion Current Testing

According to the ASTM G102-23 [28] standard, the half-cell potential testing method qualitatively judges the probability of reinforcement corrosion by measuring the potential (voltage) of the steel reinforcement relative to a reference electrode, but it cannot directly measure the corrosion rate or the amount of corrosion of the steel reinforcement. In contrast, reinforcement corrosion current testing is a quantitative detection technology that directly assesses the corrosion rate of steel reinforcement by measuring the corrosion current value at the steel–concrete interface, thereby determining the durability risk of the structure [29]. This method is mainly used for rapid, non-destructive, on-site determination of the instantaneous corrosion rate of steel reinforcement. The steel reinforcement current test, also known as the linear polarization method, applies a small overpotential (ΔE) near the free corrosion potential (Ecorr) (usually ±10 to 20 mV) to the electrode of a corroding steel bar, which elicits a small current response (ΔI). The Stern–Geary equation is employed:
I corr   =   B R p
  • Icorr: Corrosion current (unit: µA), a key indicator measuring the corrosion rate;
  • Rp: Polarization resistance  Δ E (unit: Ω·cm2). The ratio of the applied Δ I overpotential (ΔE) to the resulting change in current (ΔI);
  • It reflects the resistance to the corrosion reaction on the steel surface; the larger the value, the more difficult it is for corrosion to occur;    R p = Δ E / Δ i
  • B : Stern-Geary constant (unit: mV);
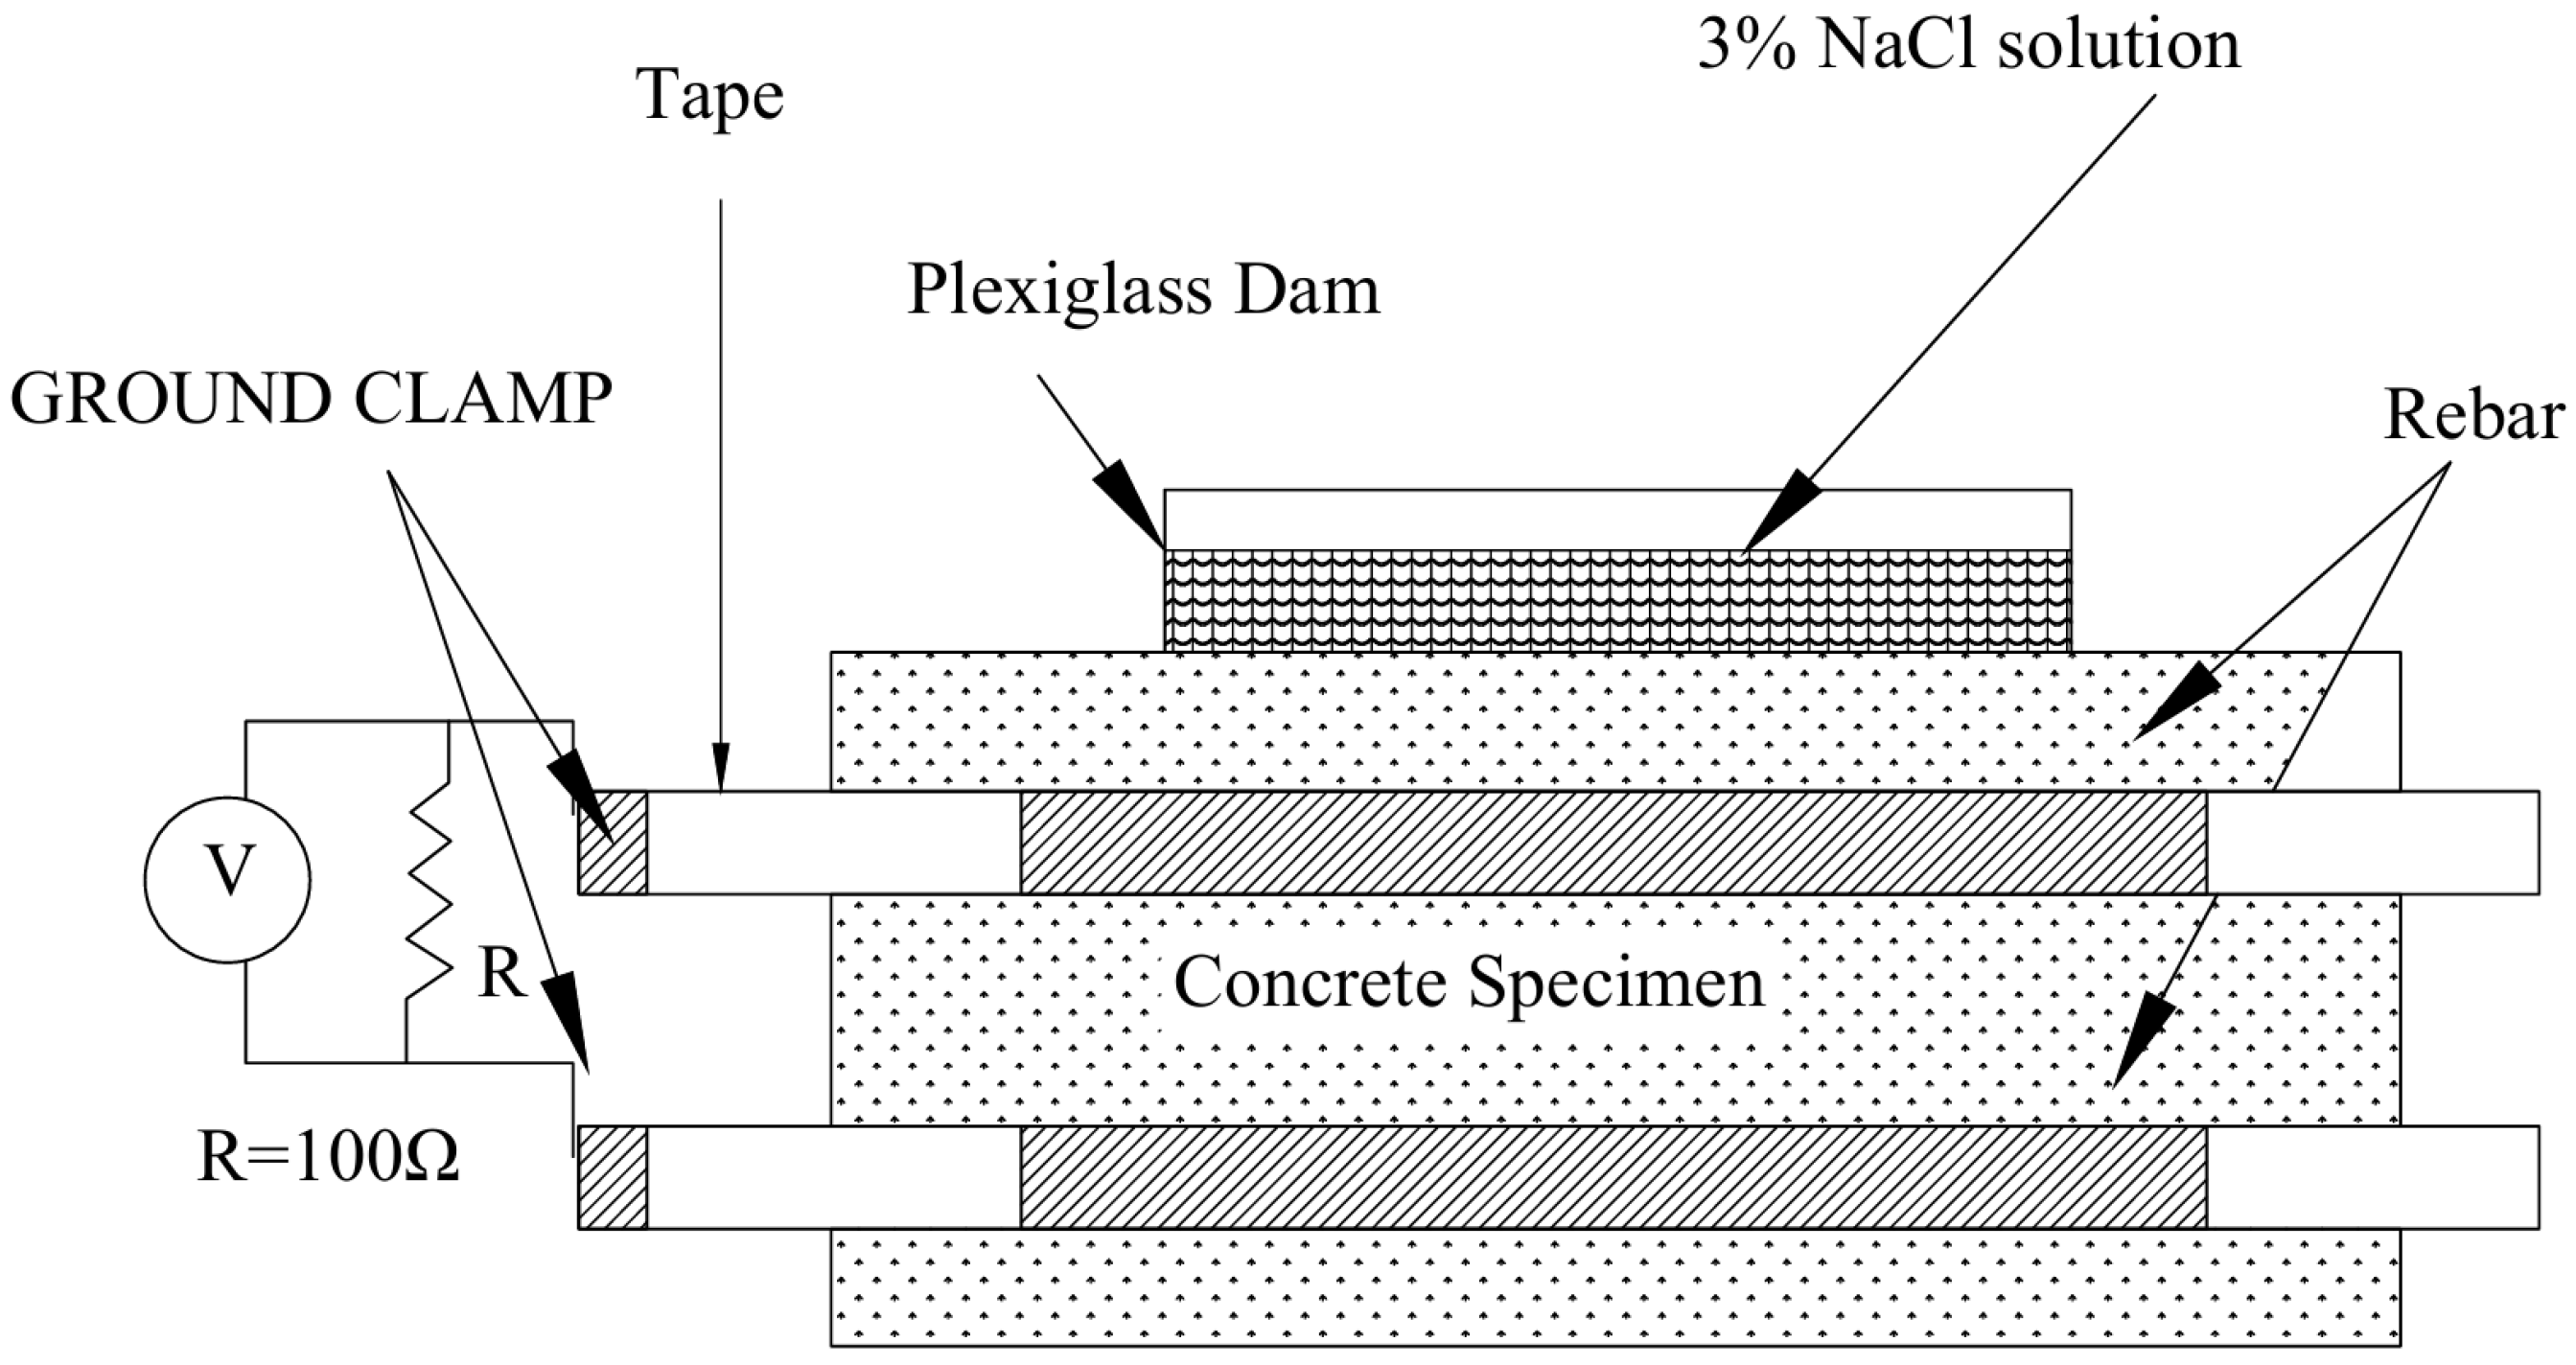
Based on the Stern–Geary equation, the previously fabricated concrete beams were used to establish an experimental model, as shown in Figure 8. The bottom and top steel reinforcements of the beam were connected and a micro-voltage was applied, analyzing the corrosion rate of the steel reinforcement by measuring the change in current. When chloride ions penetrate through cracks and reach the reinforcement, local depassivation occurs, creating a potential difference (macro-cell) that drives electron transfer between the top (anode) and bottom (cathode) reinforcement. The top reinforcement acts as the anode, while the bottom reinforcement acts as the cathode. This process generates a current, and the voltage can be measured by connecting a resistor between the steel bars. Then, the value of the corrosion current is calculated through formulas, and based on the calculated corrosion current, the corrosion state of the steel reinforcement can be classified [30], as shown in Table 7.

3.6. Acoustic Emission (AE) Testing

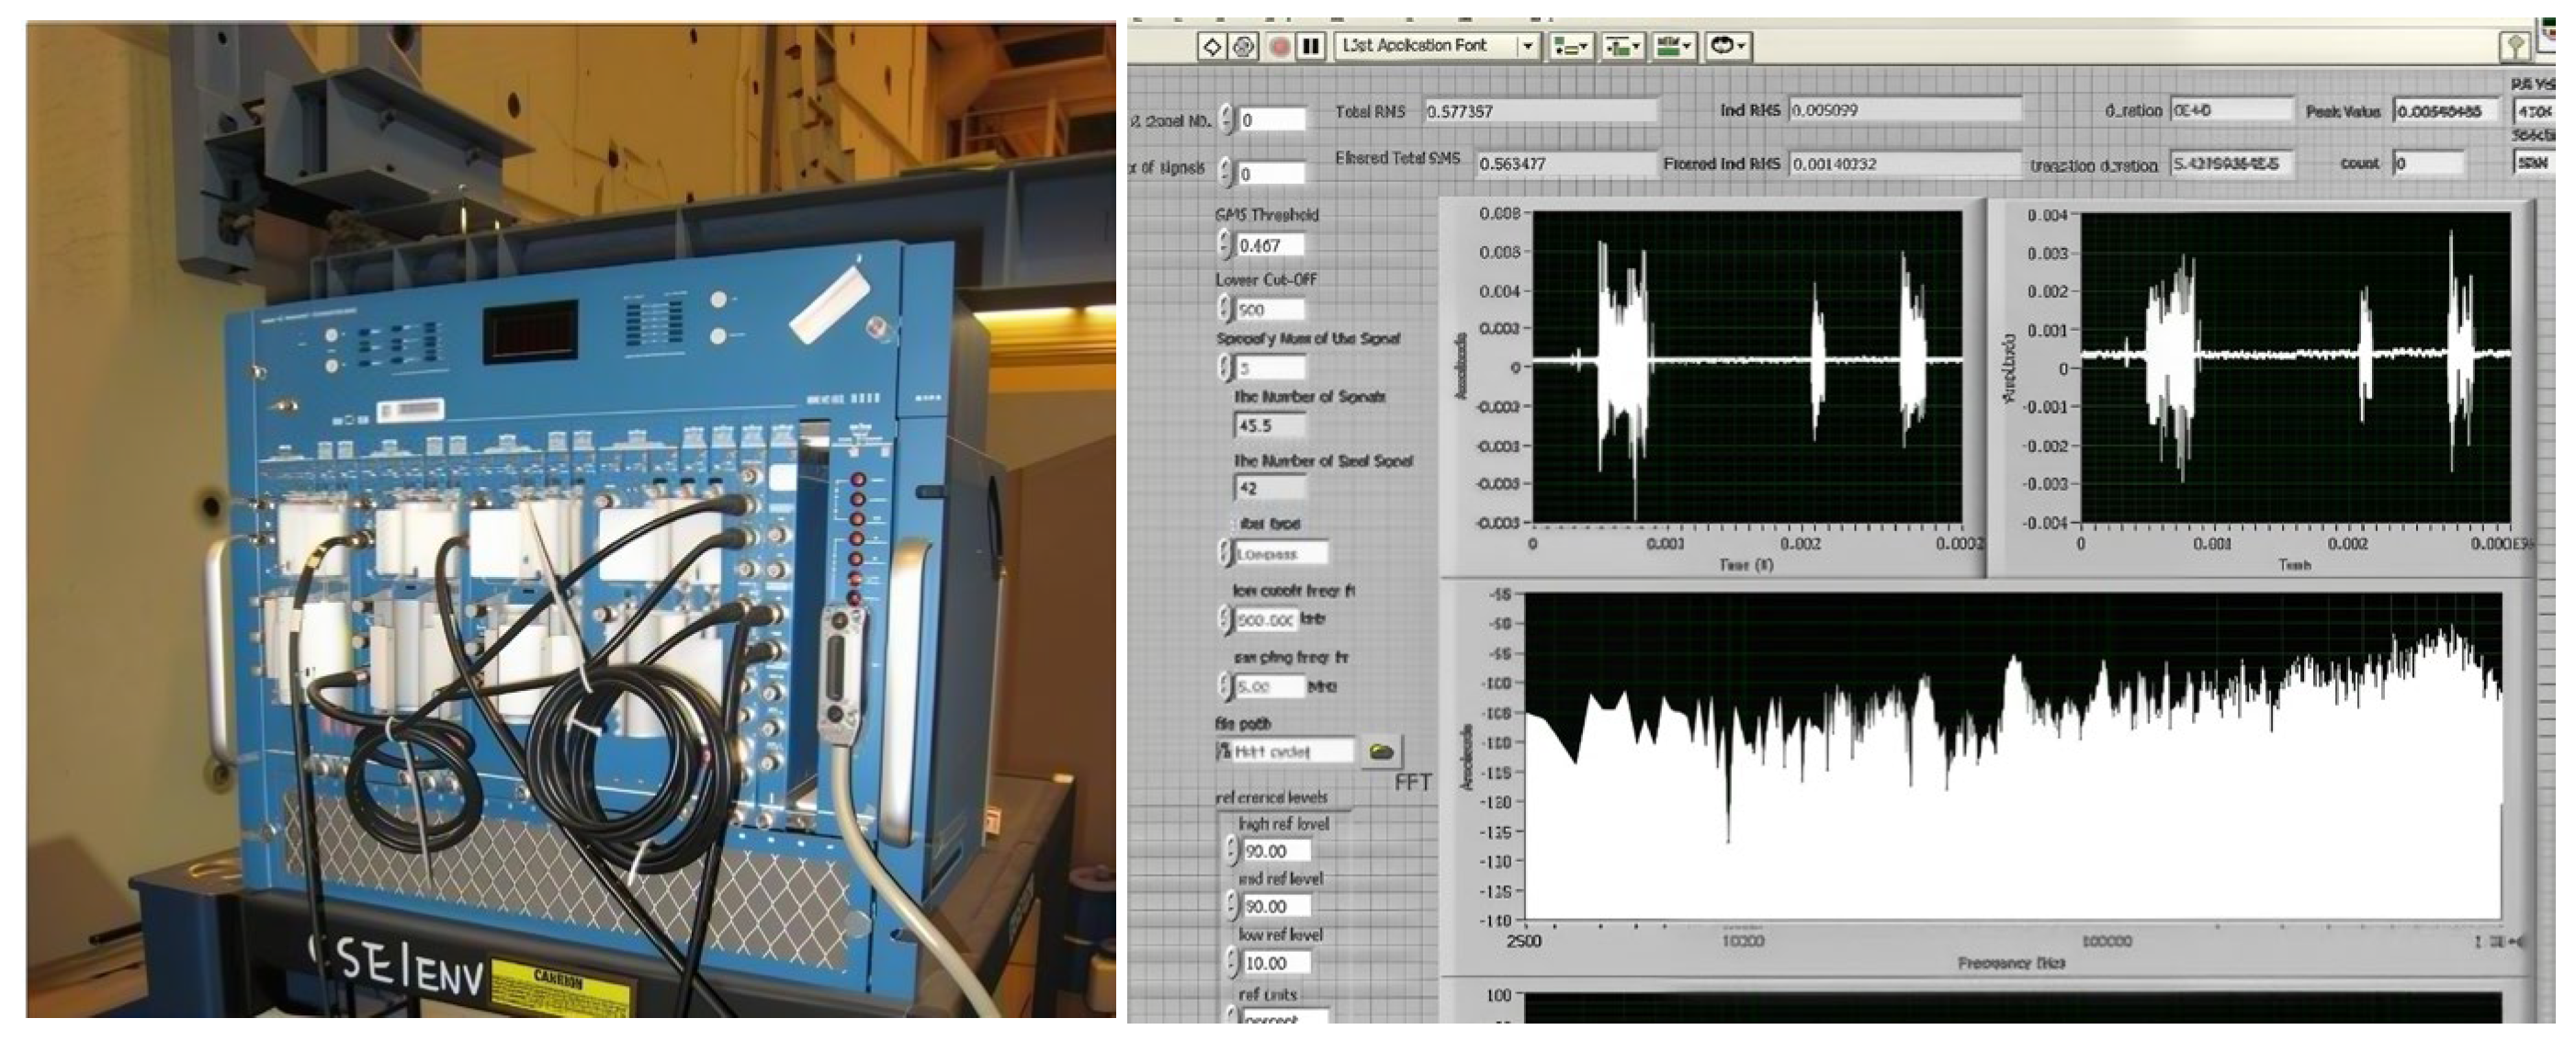
Acoustic Emission (AE) measurement is a passive Non-Destructive Evaluation (NDE) technology whose core feature is evaluating structural health by capturing transient elastic waves generated by internal damage or deformation within a material. The essence of acoustic emission measurement is to passively receive stress waves generated by internal damage within the material [31]. This experiment was primarily conducted using the LeCroy acoustic emission test machine in the concrete laboratory, as shown in Figure 9. The system of this device mainly consists of: (1) amplifier and trigger modules, (2) fan-out modules, (3) multiple TR digitizer modules, and (4) GPIB interface modules. During the experimental testing process, as corrosion products gradually form on the steel reinforcement, they push outwards against the surrounding concrete, leading to the release of high-frequency acoustic energy. At this time, the transient elastic waves generated are produced during the rapid release of energy from localized sources within the material. Upon reinforcement corrosion, the volume of the resulting corrosion products can expand up to six times that of the original steel, inducing tensile stresses that cause the surrounding concrete to crack [32]. The system receives sound signals through sensors attached to the beam specimens, and all collected data are in binary form. The acoustic emission signals are continuously recorded via sensors attached to the surface of the beams. The acquisition system (LeCroy) is set with a sampling rate of 1 MHz, a threshold of 40 dB, multiple pre-trigger samples, a peak definition time of 50 µs, a hit definition time of 100 µs, and a hit lockout time of 300 µs; the recorded AE hit signals are processed through a 100~300 kHz band-pass filter to remove background noise. The cumulative number of events (AEN) and the root-mean-square (RMS) signal energy are calculated for each wet–dry cycle period. The locations of AE events are determined by linear location based on the arrival time difference between sensors, and finally, the spatial distribution of the events (red dots) is plotted on the geometric model of the beam to identify active corrosion areas.

4. Results and Discussion

4.1. Ultimate Strength Test Results of Concrete Beams

The ultimate strength test of concrete beams is a key performance indicator for evaluating their load-bearing capacity and structural safety, which is crucial for studying their crack generation and the corrosion resistance of the members under loading conditions. Figure 10 shows the Force Applied–displacement curves beams after 28 days of curing. When the load is less than 30 kN, the Force Applied–displacement curves of the two types of beams are almost identical and develop linearly; under the same load, the deformation value of the PPC beam is about 10% smaller than that of the OPC beam. When the deformation exceeds 14 mm, the compressive capacity of the PPC beam is about 8% higher than that of the OPC beam, demonstrating stronger load-bearing resistance. Yijie Huang et al. [33] also reported a similar strength development trend for pozzolanic concrete; the reason for this result primarily stems from the reactive components in pozzolanic materials. In the early stage of concrete hardening, cement hydration generates a large amount of CH crystals, while pozzolanic particles gradually disintegrate in the alkaline environment, releasing reactive SiO2 and Al2O3. As the curing age extends, these reactive substances undergo a pozzolanic reaction with CH, generating stable products such as low-calcium calcium silicate hydrate (C-S-H cementitious material) and ettringite, which refines the pore structure, reduces total porosity, and significantly enhances the compactness and impermeability of the concrete [34,35]. The research report by Abdullah F. Al Asmari et al. [36] also showed that after pozzolans replace cement, the density of concrete increases significantly. This is attributed to their pozzolanic reactivity and micro-filling materials; the pozzolanic reaction and the micro-filling of wollastonite jointly enhance the density characteristics of the concrete.

4.2. Half-Cell Potential Test Results

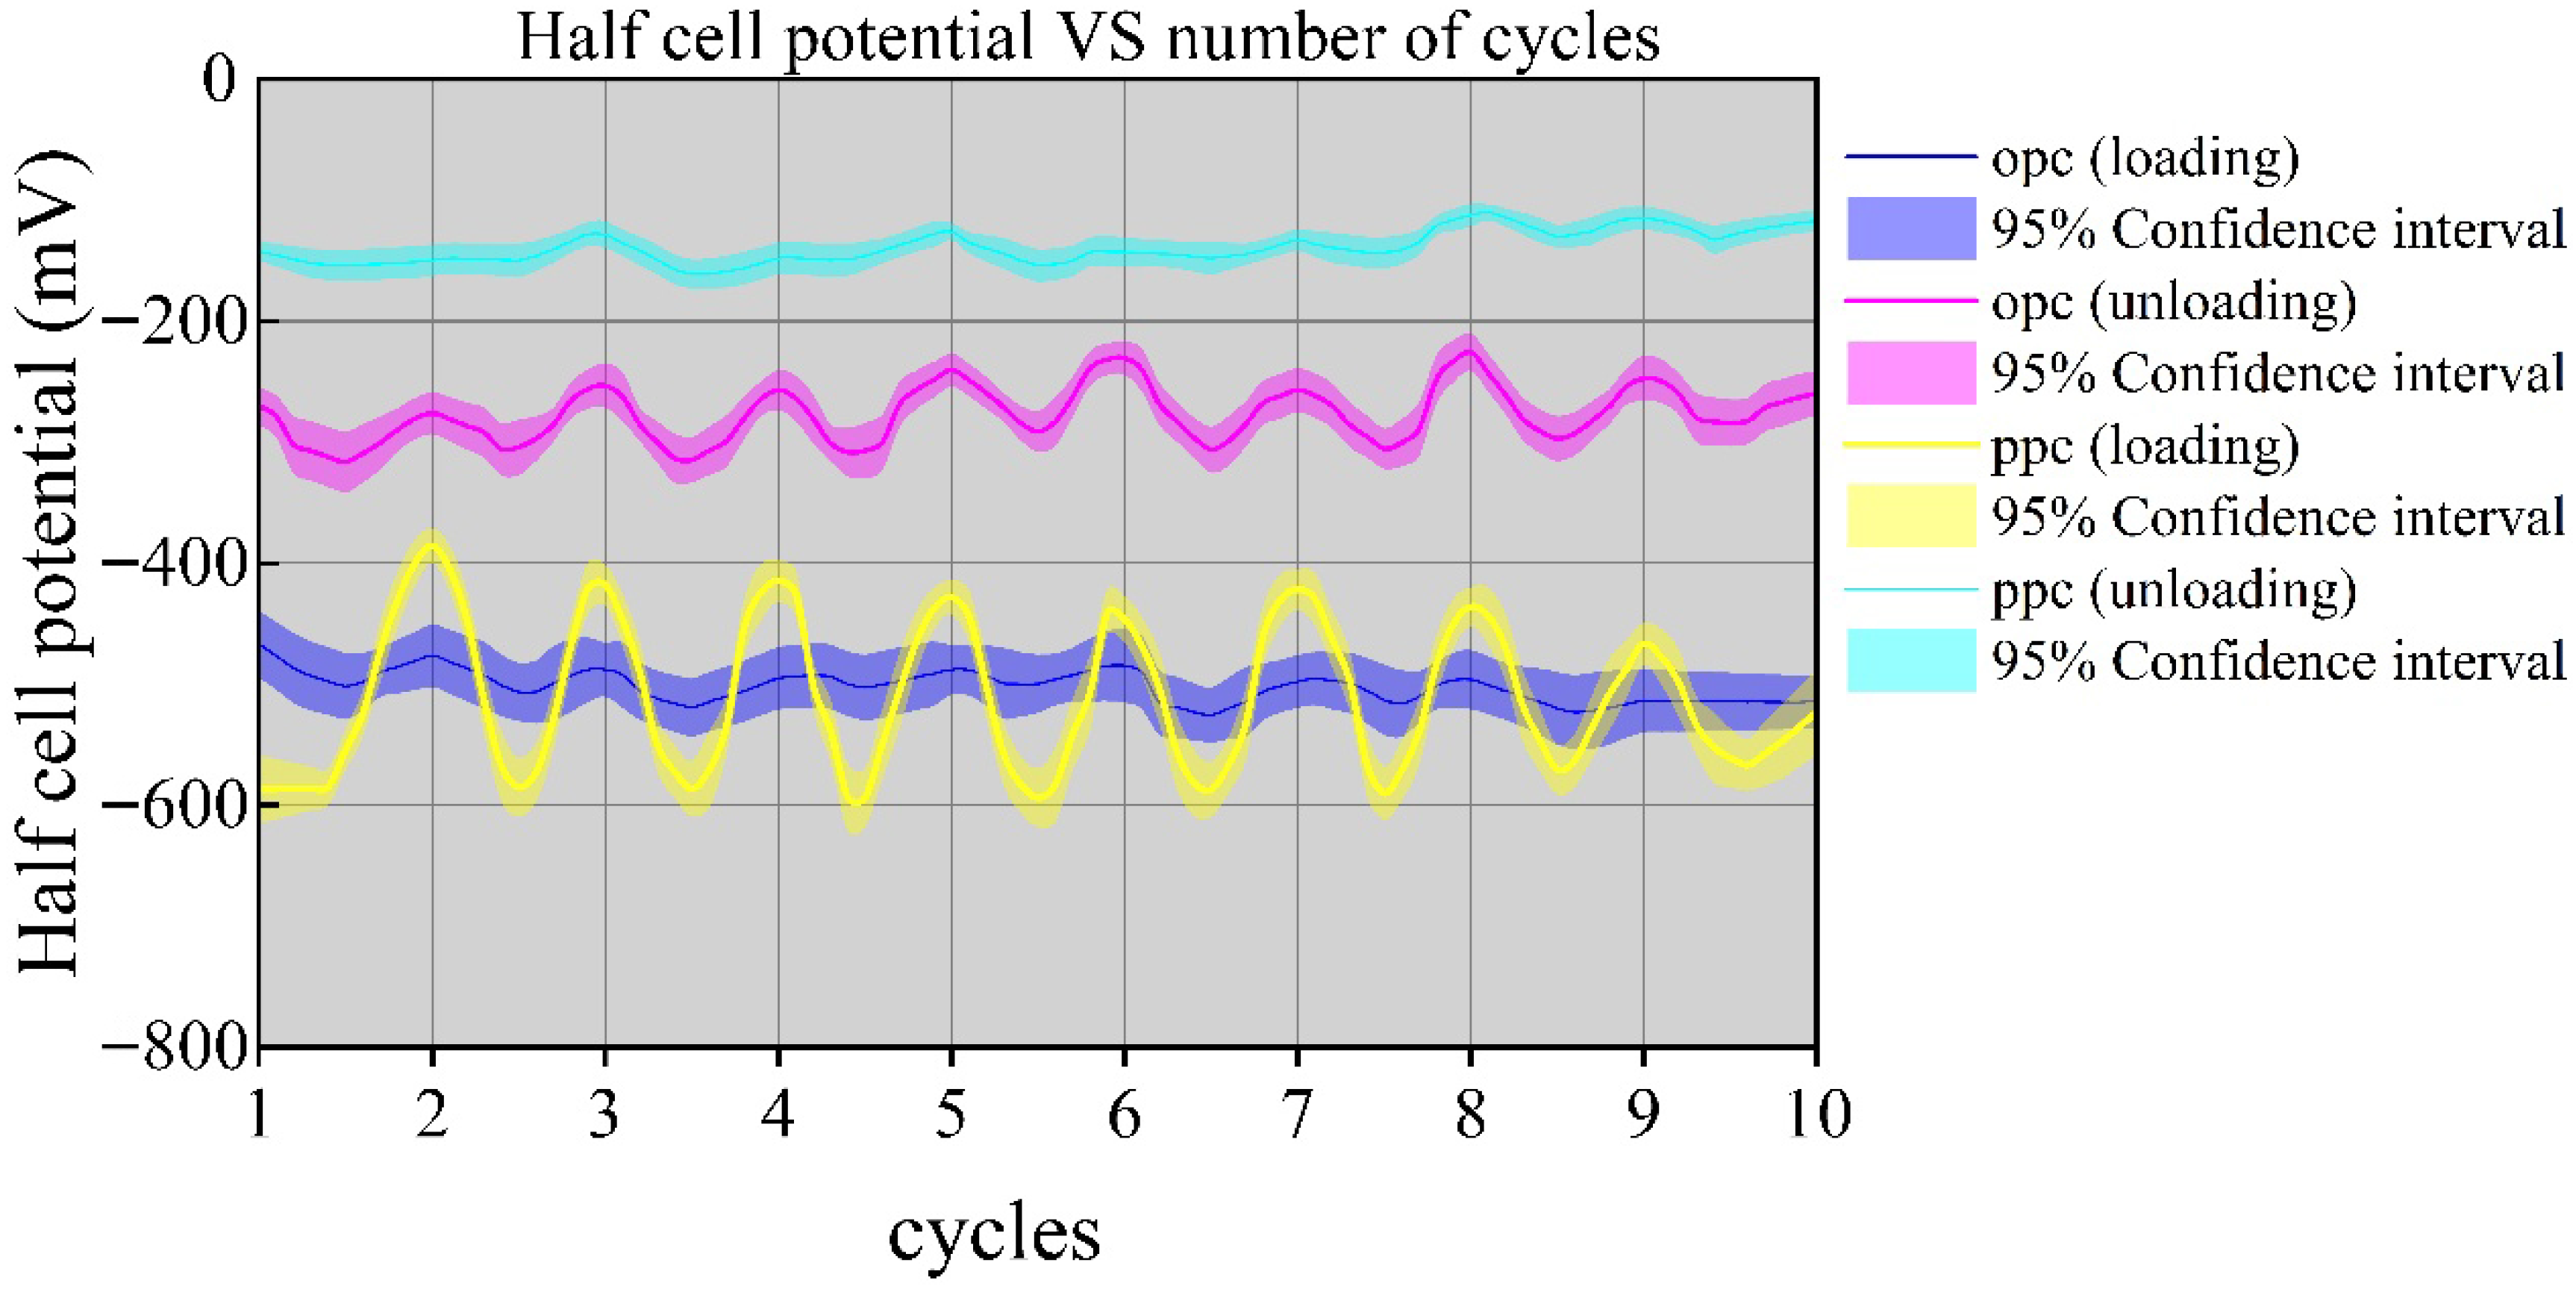
Under loaded and unloaded conditions, the half-cell potential values of OPC beams and PPC beams were measured during the process of undergoing 10 wet–dry corrosion cycles. The overall trend of the four half-cell potential curves shown in Figure 11 is periodic up-and-down fluctuation. During the ascending phase of the curves, the tested beams are in a dry state, the corrosion rate of the steel reinforcement in the beams slows down, and the potential values rise. During the descending phase of the curves, the beams are in a wet state. This moisture accelerates the corrosion rate, causing the measured half-cell potential to shift towards more negative values. The study by Romain Rodrigues et al. [37] also reported similar results.
According to the ASTM C876 [27] standard, for a copper sulfate half-cell, if the potential is more negative than −350 mV, it means there is a 90% probability that the reinforcement is undergoing corrosion. It can be clearly seen from Figure 11 that all potentials of the two loaded beams less than −350 mV, indicating that the steel reinforcement in both the OPC beams and PPC beams has corroded. Under loading conditions, the potential of the PPC beams fluctuates between −600 mV and −400 mV, while the potential of the OPC beams fluctuates between −520 mV and −450 mV. The fluctuation range of the PPC beams is larger, and the potential value at the trough is 15% lower than that of the OPC beams; this situation reflects that the corrosion of the pozzolanic concrete beams is more severe than that of the ordinary concrete beams. The study by Lukasz Sadowski [38] indicated that when the half-cell potential value is less than −400 mV, it indicates a 95% probability of corrosion. According to the observation of cracks in the PPC beams, in the early stages, the PPC beams produced more cracks under loading conditions than the OPC beams. This is attributed to the lower early-age hydration degree of PPC, which results in a relatively loose cementitious matrix and weaker interfacial bond strength with aggregates, and the bond strength at the interface between aggregates and cement stone is not as good as that of ordinary concrete, making it prone to generating gaps at the interface when subjected to stress. The cracks allow saltwater to penetrate the beams more easily, increasing the probability of reinforcement corrosion. When the potential value of the PPC beam is higher than −200 mV (less negative), its probability of corrosion is less than 10%. Under unloaded conditions, it can be observed from Figure 11 that the minimum potential value of the PPC beams is −180 mV, and all are higher than the potential values of the OPC beams, meaning that the PPC beams possess greater corrosion resistance under unloaded conditions. In the early stage (the first 3 cycles), the PPC beams had additional corrosion resistance. According to the observation of cracks in the PPC beams, fewer cracks were generated under unloaded conditions in the early stages compared to the OPC beams. This is attributed to the fact that pozzolans undergo a secondary reaction with the calcium hydroxide produced by cement hydration to generate more dense calcium silicate hydrate cementitious material. This cementitious material can fill the internal voids and enhance the overall compactness of the concrete. Without external loads, internal stresses are more gradual, and the probability of crack generation is significantly lower than that of ordinary concrete. Fewer cracks prevent the penetration of the sodium chloride solution, reducing the probability of reinforcement corrosion. The study by Jawad Ahmad et al. [39] found that the pozzolanic reaction produced a large amount of dense C-S-H cementitious material, thereby forming a dense pore structure.
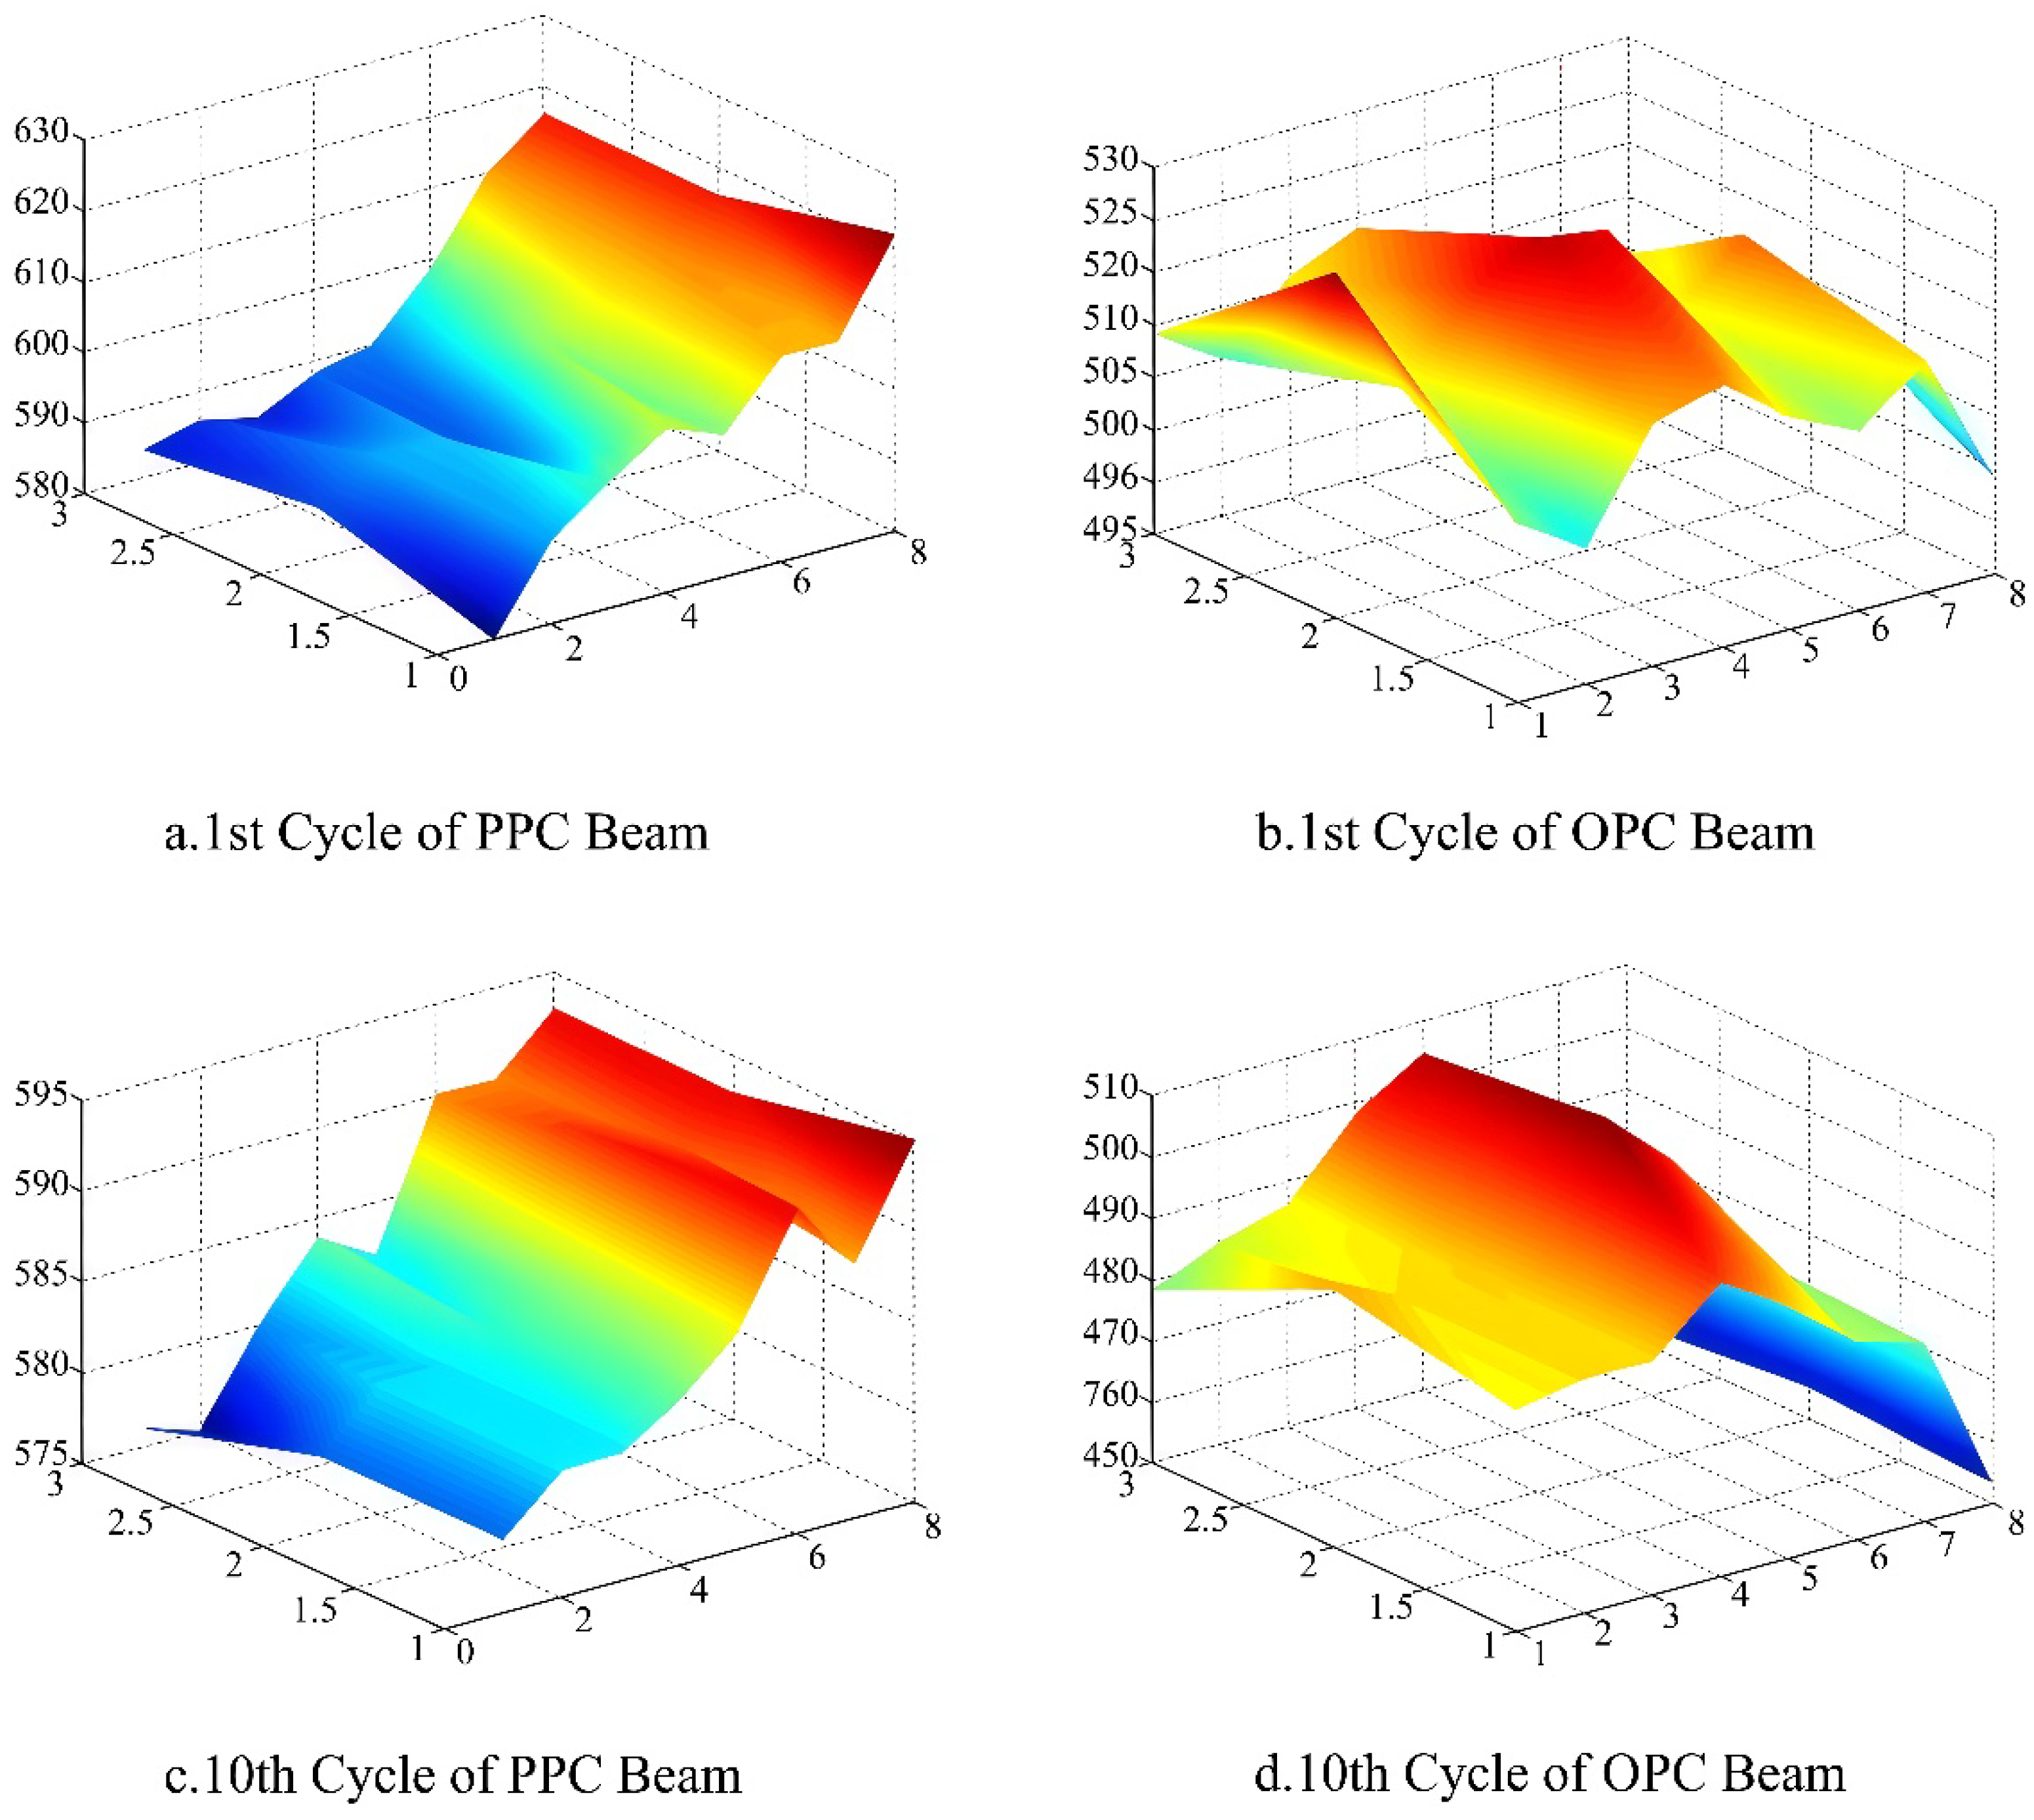
Under loaded conditions, potential contour maps of the reinforcement corrosion trends for the OPC beams and PPC beams after the 1st and 10th wet–dry cycle periods were plotted, as shown in Figure 12. From the comparison in the figure, the corrosion trends of the two types of beams at the same time can be clearly observed. After the 1st cycle period, the absolute values of the potential contours for PPC are generally greater than those for OPC; this indicates that, under loaded conditions, the PPC beams have a higher risk of corrosion in the early stage of the corrosion experiment. After the 10th cycle period, the absolute values of the potential contours for PPC are still greater than those for OPC, but the absolute values of the potential contours are decreasing and tending to level off. This indicates that, under loaded conditions, in the later stage of the corrosion experiment, the corrosion risk of the PPC beams is higher than that of the OPC beams, but the corrosion risk value is gradually decreasing. This may benefit from the continuously ongoing pozzolanic reaction, which generates high-quality cementitious material (C-S-H) to refine pores, reduce pore connectivity, and reduce the pathways for chloride ions to enter the steel reinforcement layer. This analytical result is also consistent with the half-cell potential test results.

4.3. Steel Corrosion Current Test Results

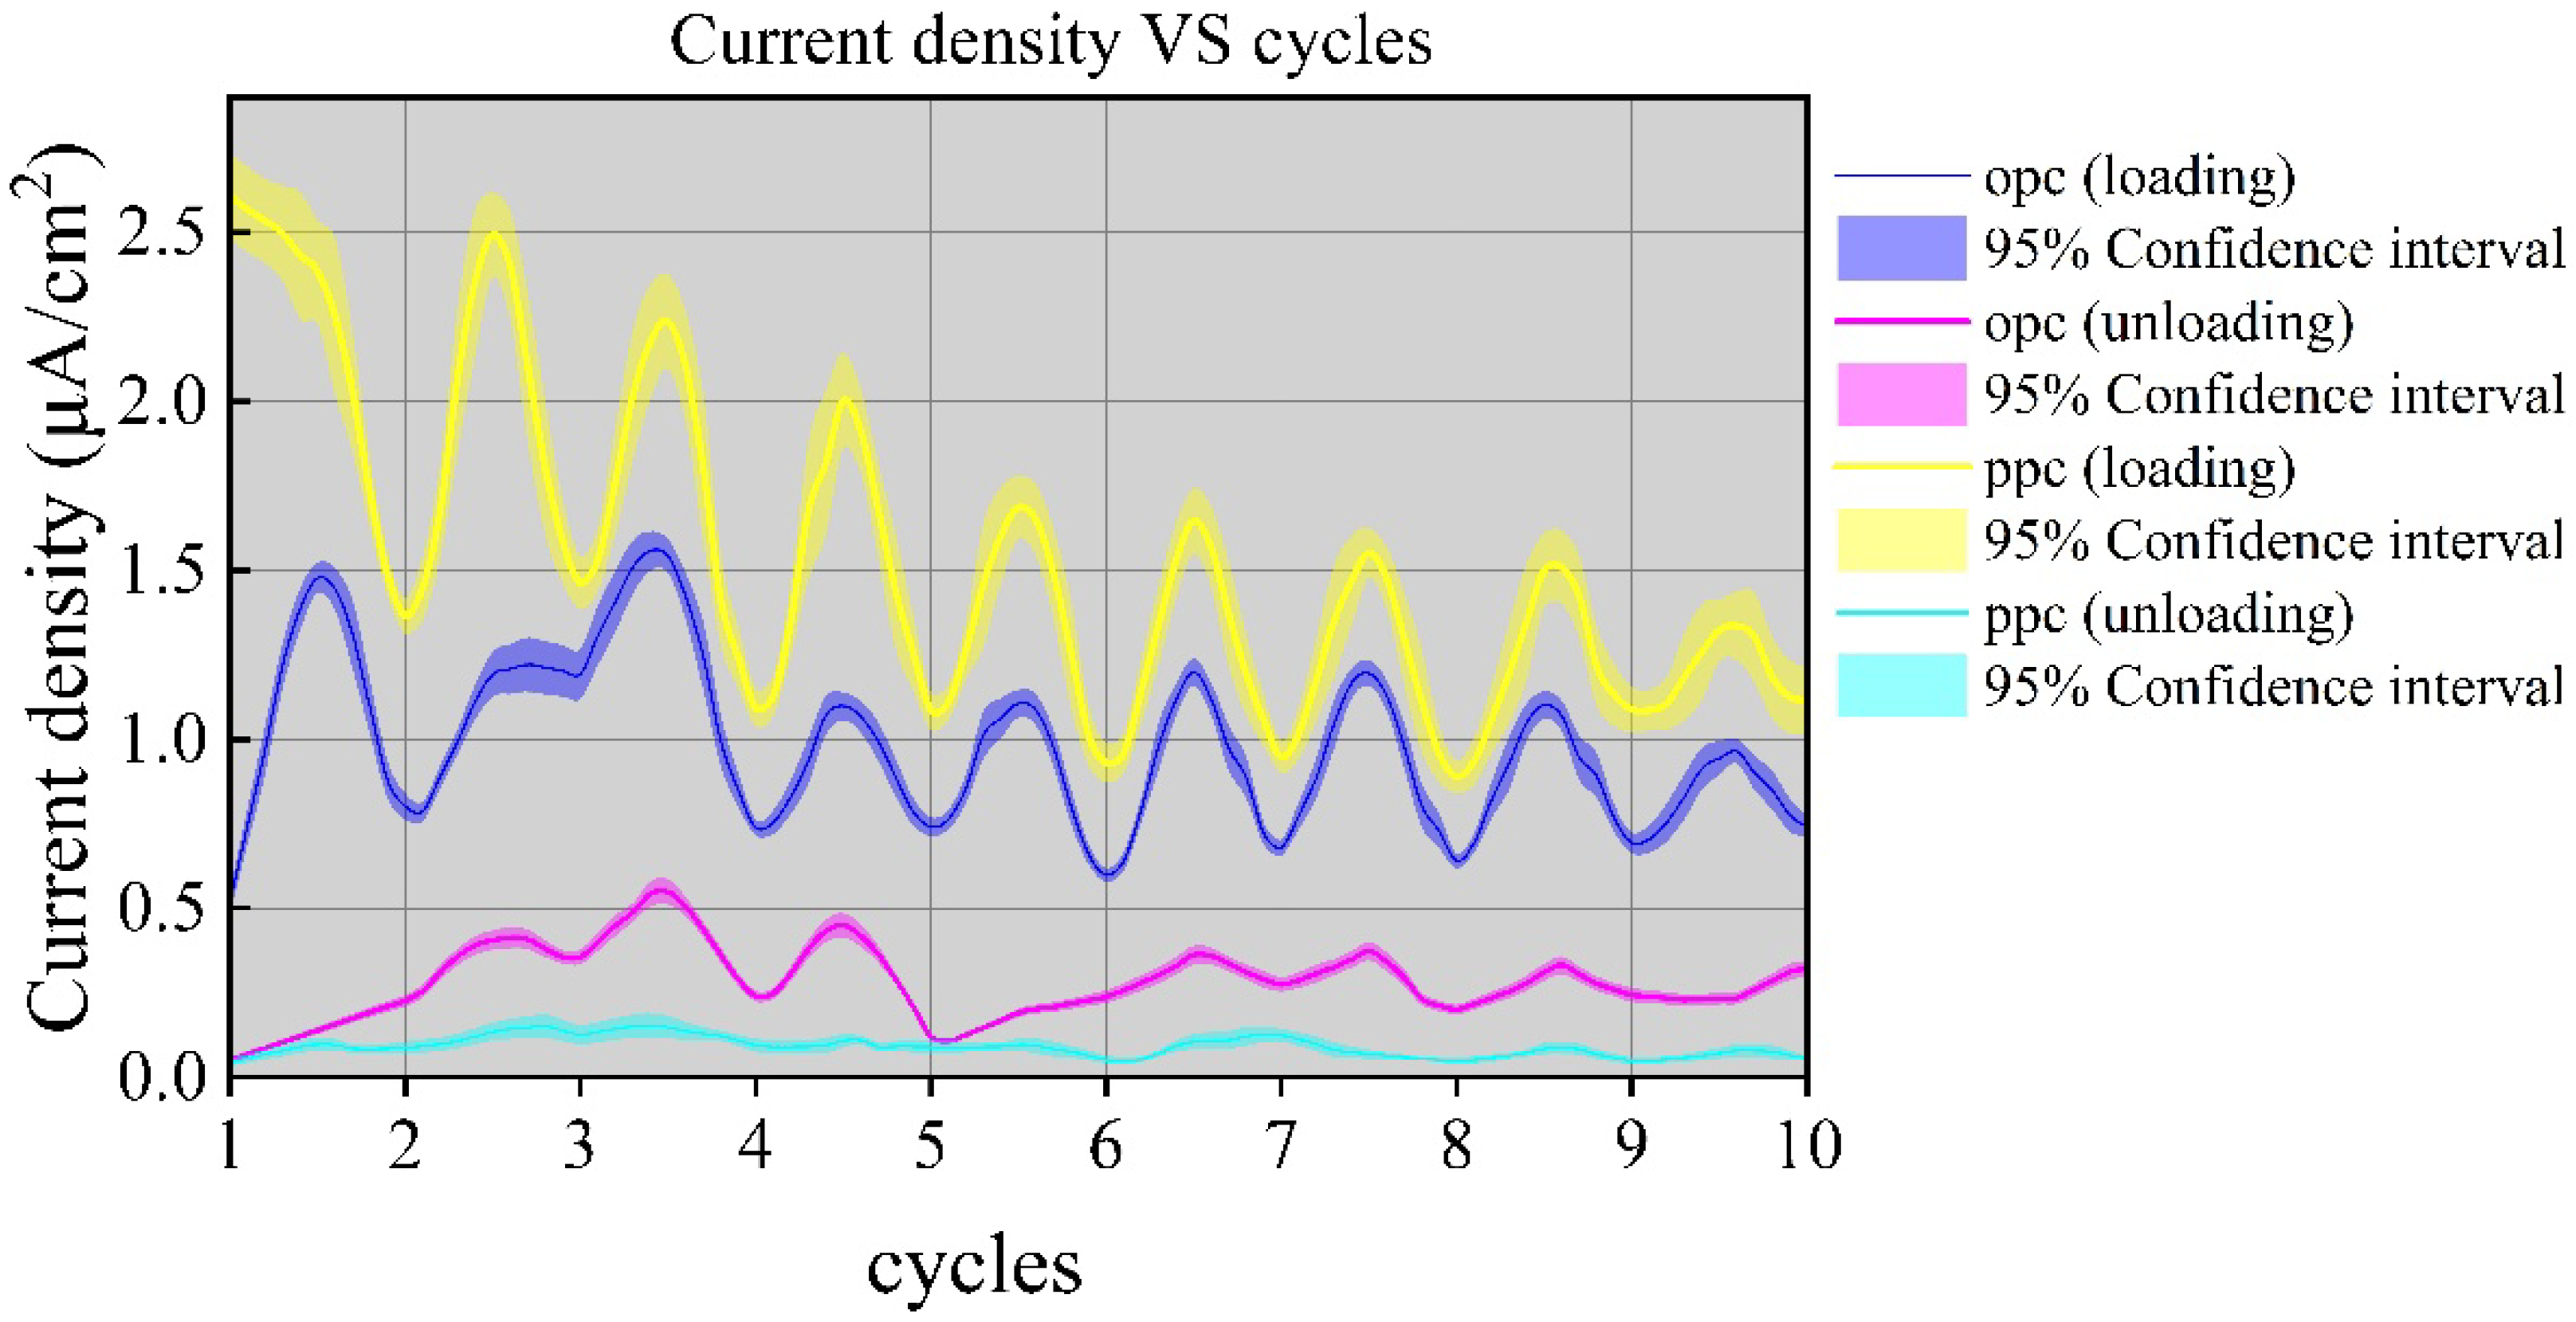
Under loaded and unloaded conditions, the corrosion current density values of the steel reinforcement in the OPC beams and PPC beams during the 10 wet–dry corrosion cycles were measured, as shown in Figure 13. It can be seen that the trends of the reinforcement corrosion current density values under the 4 different conditions are very similar to the trends of the half-cell potential. Due to the alternating wet and dry cycles, both sets of results rise and fall periodically. Under loaded conditions, the corrosion current density of the PPC beams reached a maximum value of 2.5 µA/cm2 during the first cycle, and basically remained above 1.0 µA/cm2 in the subsequent cycles. According to ASTM G102-23 [28], this indicates that the corrosion rate of the PPC beams was at a high level during the cyclic periods. The corrosion current values of the OPC beams ranged from 0.5 to 1.6 µA/cm2, indicating that the corrosion rate of the OPC beams was at a moderate level during the cyclic periods. The study by Perla Rodulfo et al. [40] showed that electrical conductivity reflects the ability of cement-based repair materials to resist chloride ion penetration; the higher the conductivity, the higher the corrosion rate, and there is a linear relationship between electrical conductivity and corrosion current density. As discussed previously in Section 3.2, PPC is prone to more cracks in the early stages of loading. These cracks become pathways for corrosive media such as external moisture, oxygen, and chloride ions, accelerating their penetration to the surface of the steel reinforcement. The stress generated by loading causes the internal micro-cracks in the concrete to propagate. Therefore, once the cracks introduced by loading are formed, they continuously provide pathways for corrosive media, leading to a more active electrochemical process of reinforcement corrosion. Consequently, the late-age microstructural benefits of PPC are insufficient to offset its susceptibility to early-age cracking, ultimately resulting in higher corrosion currents [41].
Under unloaded conditions, as seen in Figure 13, the corrosion current density values of the PPC beams consistently remained around 0.1 µA/cm2, indicating that the corrosion rate of the PPC beams was at a negligible level during the cyclic periods. The corrosion current values of the OPC beams ranged from 0.1 to 0.5 µA/cm2, indicating that the corrosion rate of the OPC beams was at a low level during the cyclic periods. Khandaker M. A. Hossain et al. [42] found that the secondary hydration reaction of pozzolans produces denser concrete and reduces the free chloride ion content. The above situations are attributed to the fact that, under unloaded conditions, the protection of concrete for steel reinforcement mainly relies on a dense internal structure and a stable passive film, and the characteristics of pozzolans precisely strengthen these two points. Pozzolanic particles are fine and reactive; they undergo secondary reactions with cement hydration products to generate more dense calcium silicate hydrate cementitious material. These cementitious materials can fill the capillary pores inside the concrete, reduce the chances of aggressive media reaching the surface of the steel reinforcement, and slow down the destruction rate of the passive film, thereby making the electrochemical process of reinforcement corrosion much slower, manifesting as a smaller corrosion current density. It is worth noting that in the curves of the reinforcement corrosion current, as the wet–dry cycles progress, the current values at the peaks become increasingly smaller and tend towards a stable value. The possible reason is that as time goes by, the corrosion degrees of the top and bottom steel reinforcements in the beam become closer to each other, thus the potential difference becomes smaller.

4.4. Acoustic Emission Test Results

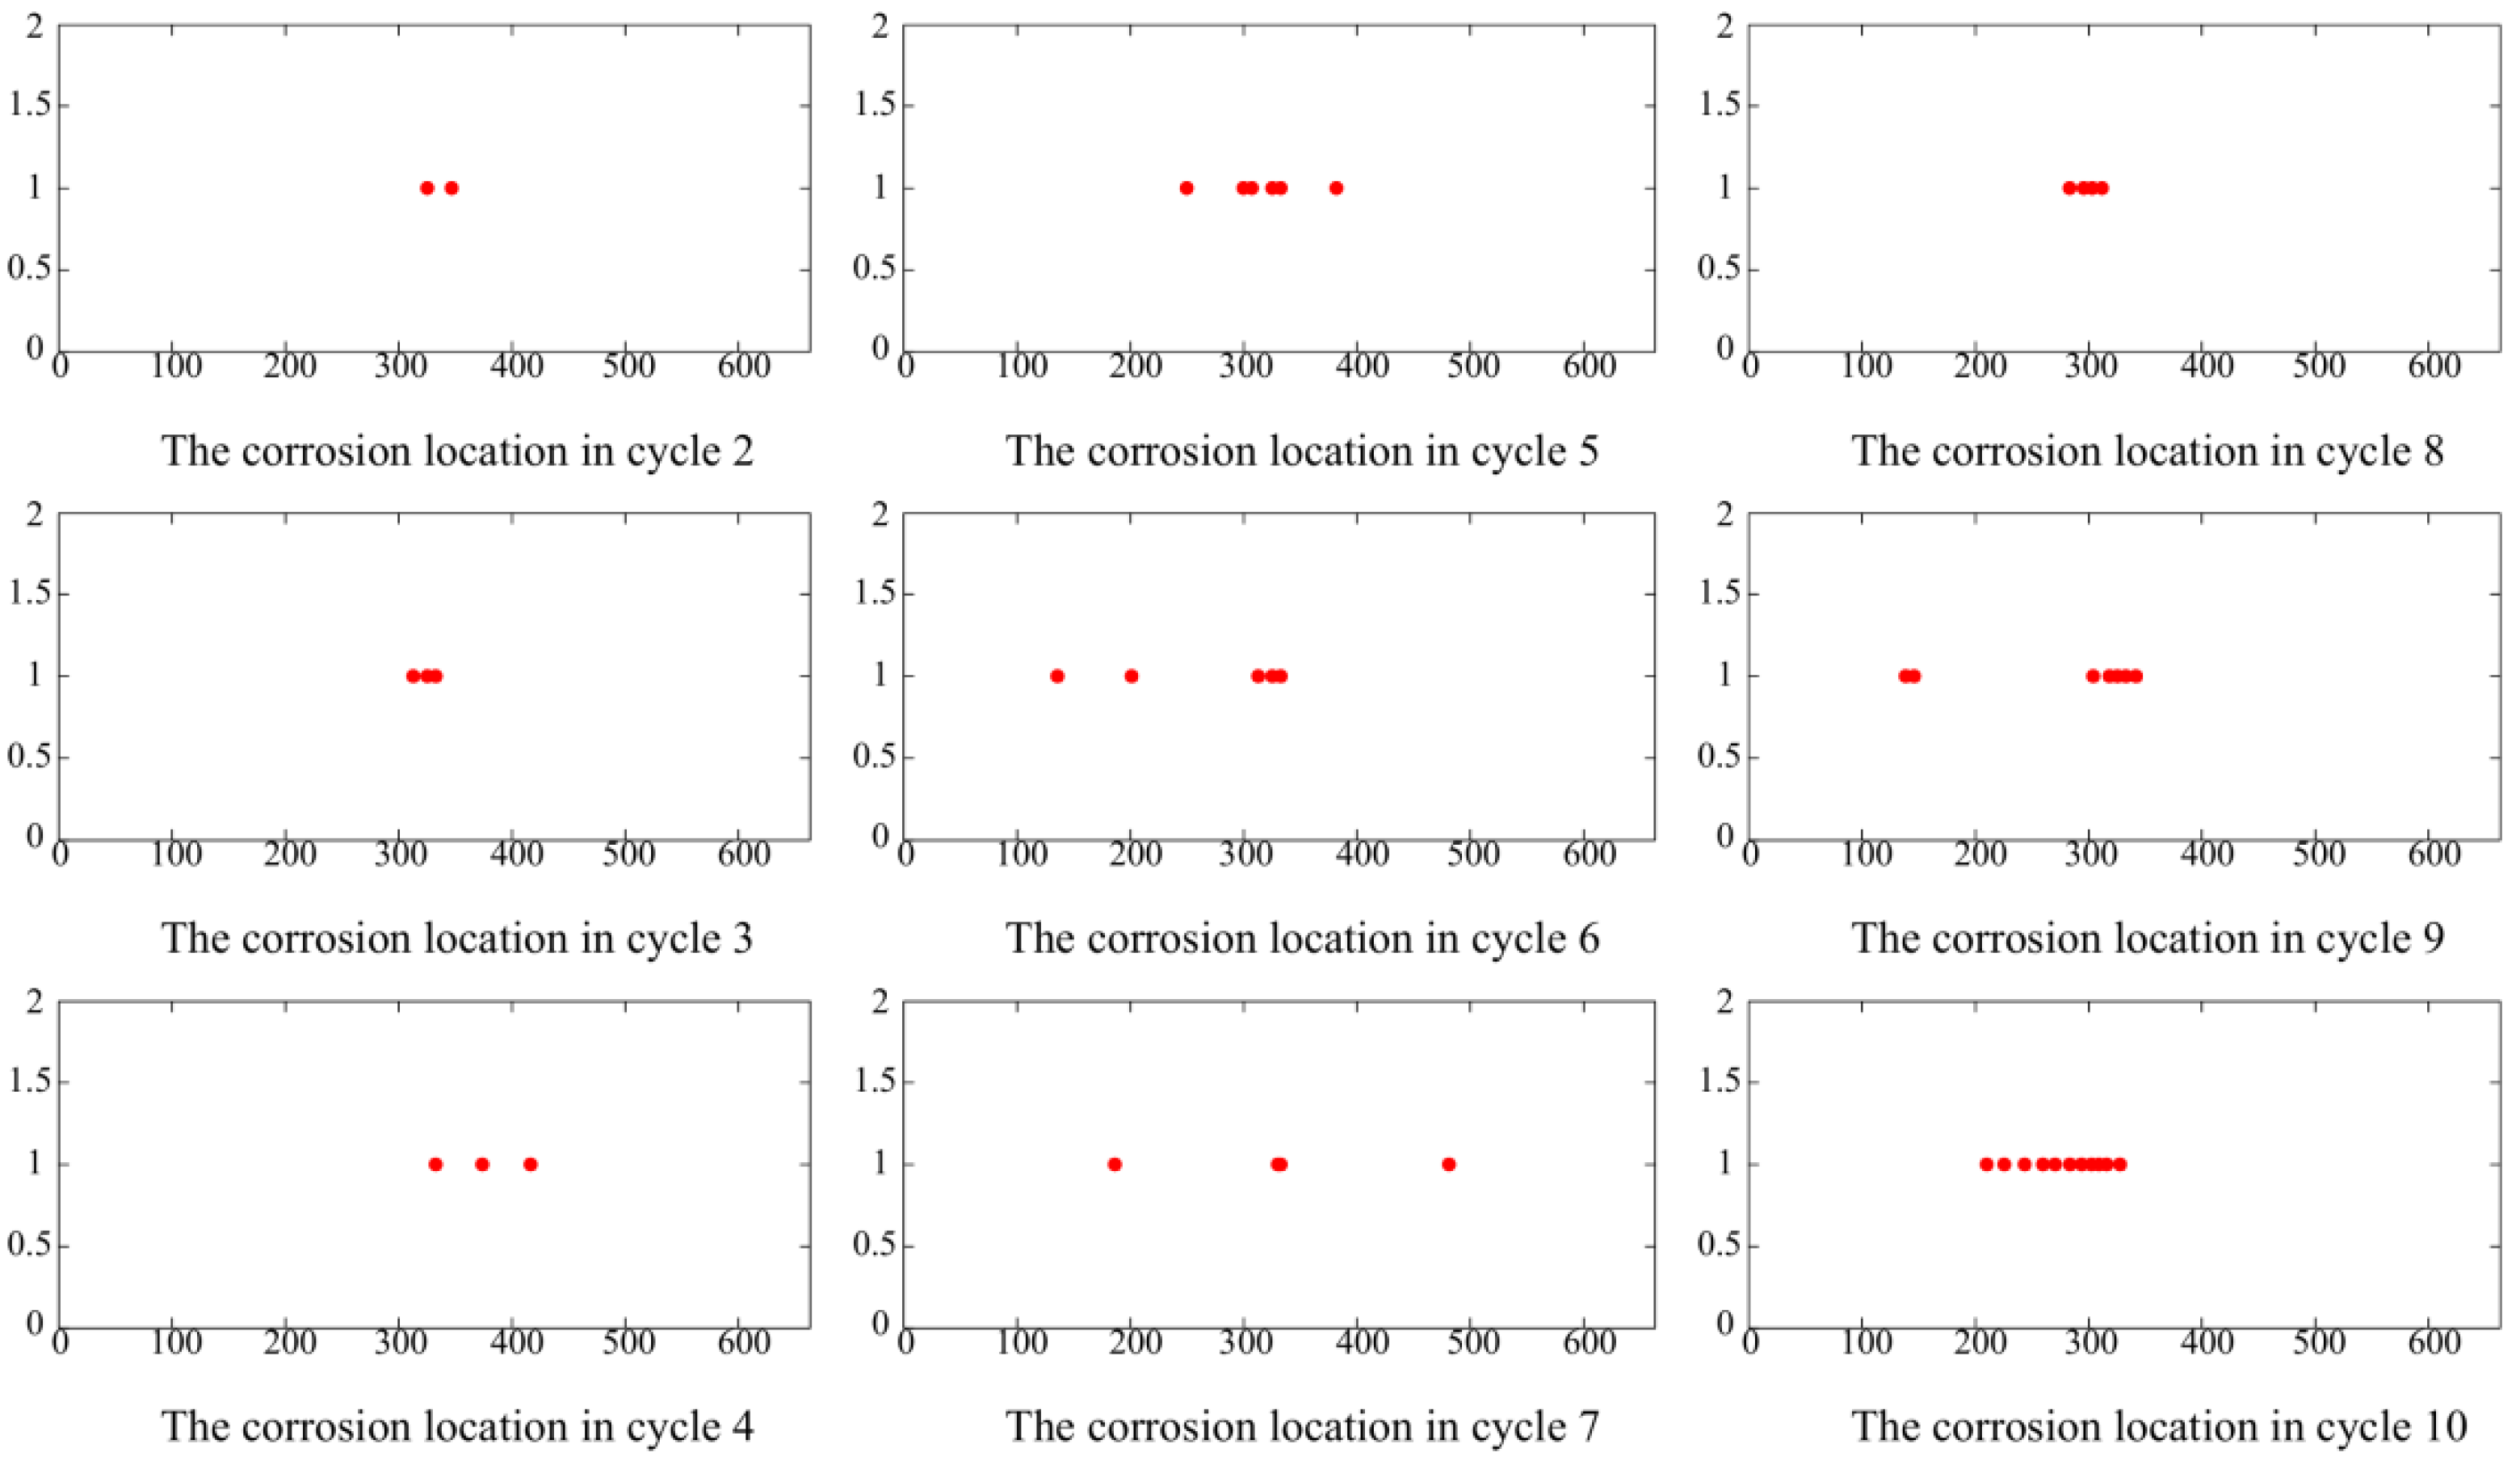
Acoustic emission testing quantitatively evaluates the degree of steel reinforcement corrosion through acoustic emission signal characteristics. As shown in Figure 14, it displays the acoustic emission locations of reinforcement corrosion for the PPC beams during cycles 2–10 of the wet–dry cycles. Each dot in the figure represents an acoustic emission event, each rectangle represents the dimensions (mm) of the acoustic emission wave location array for the steel reinforcement, and the positions of the red dots represent the corrosion locations of the steel reinforcement in the beam. The red dots are mainly concentrated in the middle of the beam because the sensors are mainly arranged in the middle of the beam. In cycle 1 of the cycle, there were no red dots, which means that the corrosion level in the beam was low or corrosion had not yet started. From cycle 2 to cycle 10, the corrosion process can be observed from the acoustic emission diagrams of these 9 cycles. Starting from the 2nd cycle, red dots appeared, and the acoustic emission events (dots) became more widespread over the subsequent cycles. The increasing number of acoustic emission events serves as a direct indicator of active reinforcement corrosion. The accuracy of this test can be verified by breaking open the concrete cover of the beams after the experiment to directly observe the degree of steel reinforcement corrosion. The study by Eline Vandecruys et al. [43] showed that the acoustic emission measurement technique is a highly efficient and accurate condition assessment method; the estimated corrosion loss rate showed strong agreement with the steel mass loss, with an average absolute error of 1.53%.
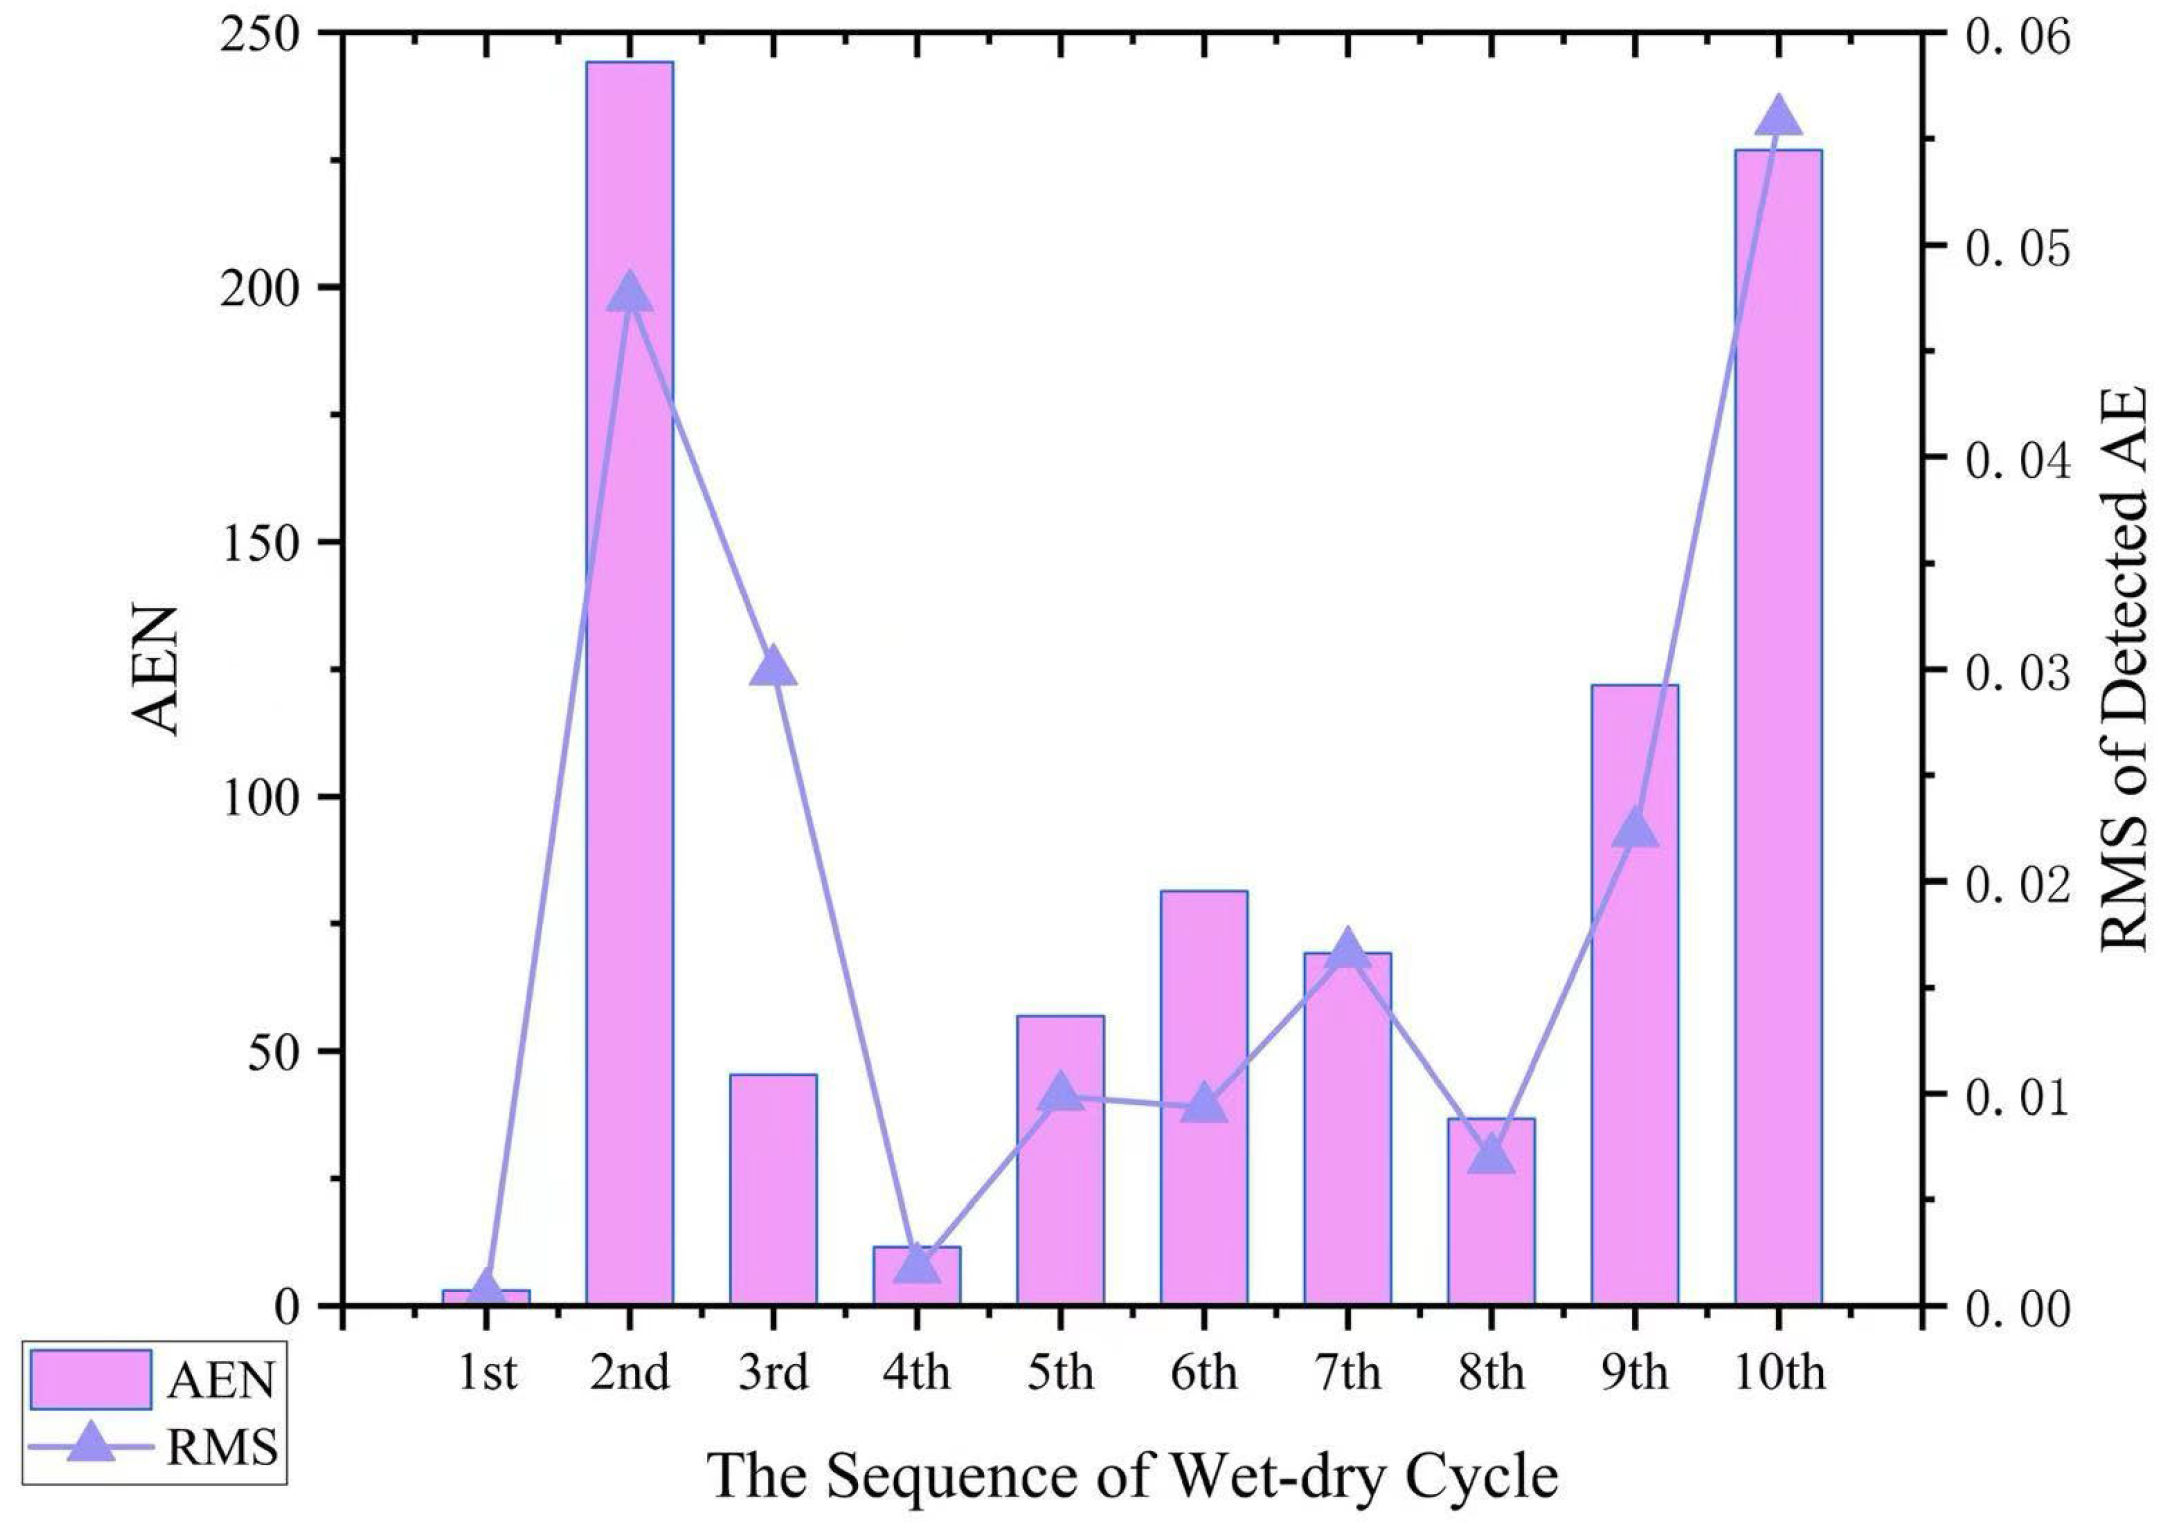
To analyze the data more intuitively, first, the number of acoustic emissions collected from the PPC beams during cycles 2–10 of the wet–dry cycles was accumulated and plotted into histograms of cumulative event number and RMS signal energy, as shown in Figure 15. AEN (red bars) represents the cumulative emission events occurring in the beam, which is the corrosion process within the beam; the greater the number of emission events, the faster the corrosion rate. Therefore, it can be observed that from cycle 1 to cycle 2, the corrosion rate increased sharply, and then in the last 3 cycles, the corrosion rate slowed down and then accelerated again. RMS represents the root mean square of the signal energy. This energy is released during the corrosion process. Similarly to AEN, a higher RMS value means a faster corrosion process [44,45]. The research results of Ai-Ping Yu et al. [46] showed that in accelerated reinforcement corrosion tests, a significant correlation was found between the corrosion rate and AE event counts, and the measured AE energy distribution was also consistent with images showing the distribution of corrosion damage on the steel reinforcement. The results shown in Figure 15 are also relatively consistent with the previous analysis. At the end of cycle 1, chloride ions penetrated the concrete and reached the steel reinforcement. The surface of the steel reinforcement began to react with the ions, and corrosion occurred. This is why AEN and RMS increased significantly in the 2nd cycle. Initially, the accumulated corrosion products act as a physical barrier, temporarily hindering the further ingress of chloride ions and slowing the corrosion rate. Therefore, both AEN and RMS dropped significantly and remained stable in the subsequent cycles. However, starting from the 8th cycle, chloride ions penetrated into the corroded areas and continued to further corrode the steel reinforcement. Therefore, AEN and RMS increased in the 8th, 9th, and 10th cycles.

4.5. Actual Reinforcement Corrosion Condition

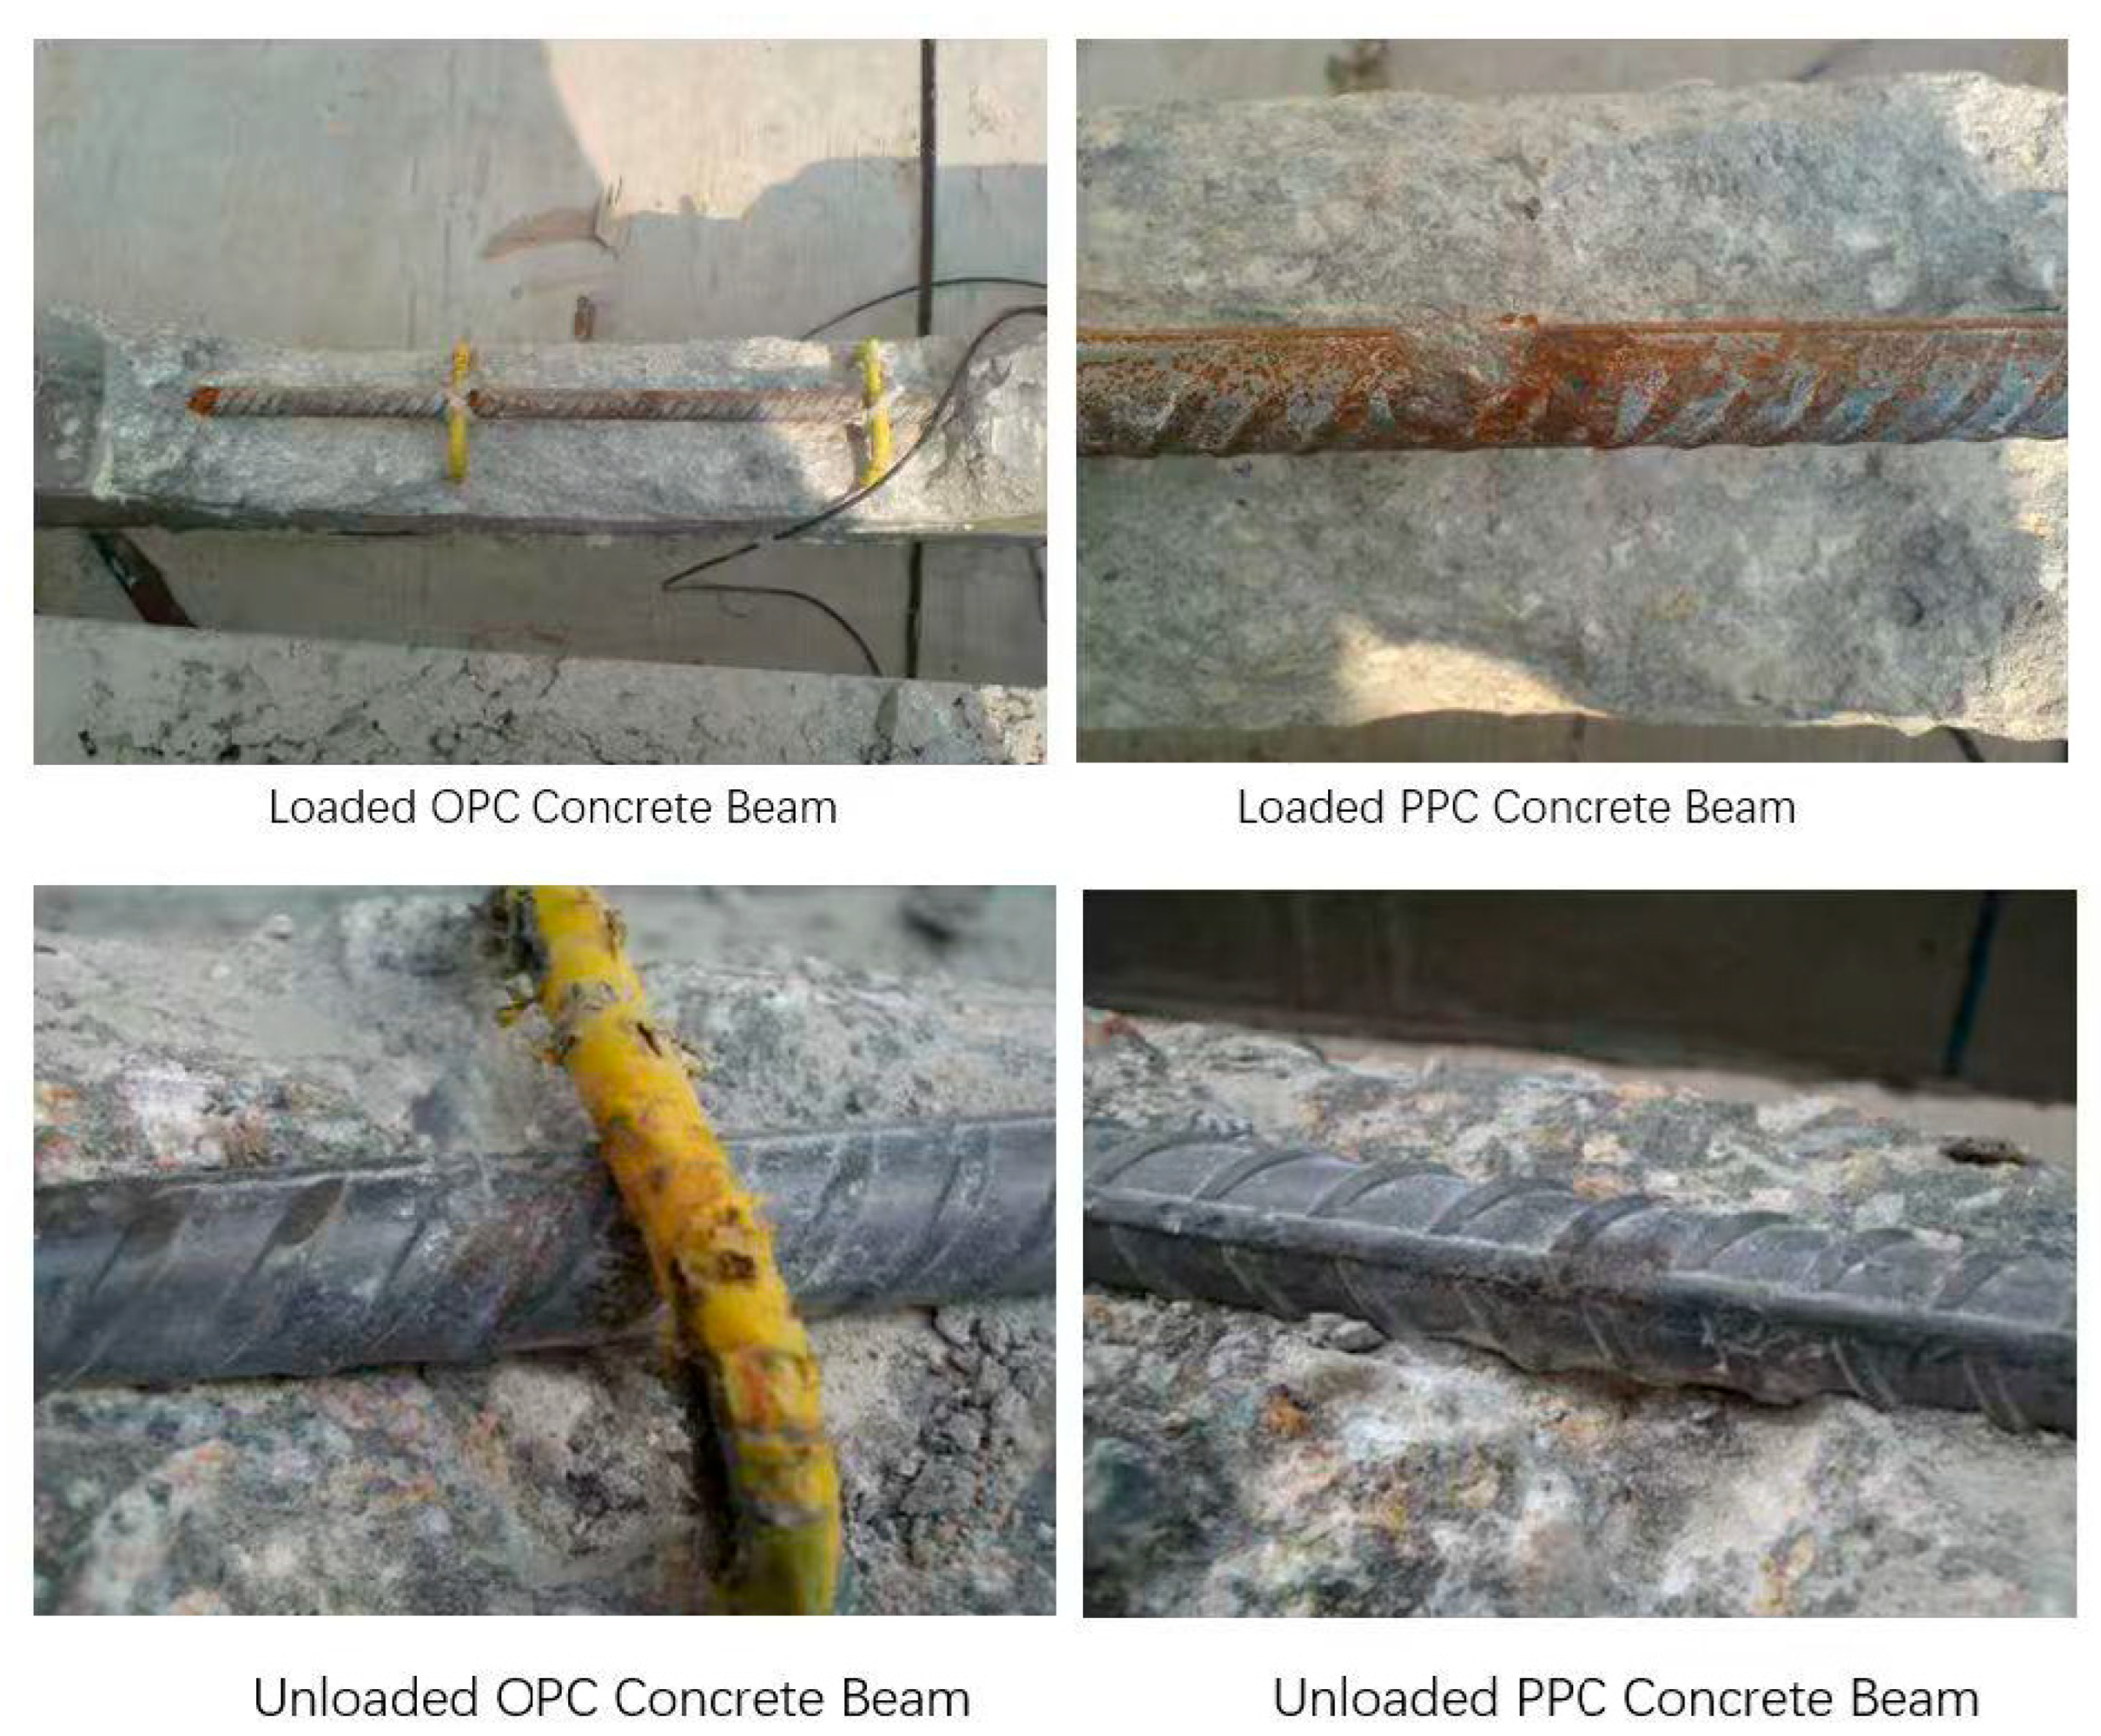
To verify the accuracy of the half-cell potential, reinforcement corrosion current, and acoustic emission tests, after all experiments were completed, the concrete cover of the beams was broken open to observe the actual corrosion condition of the steel reinforcement inside. As shown in Figure 16, under loaded conditions, the corrosion of the steel reinforcement in the PPC beams was more severe than that in the OPC beams; under unloaded conditions, the steel reinforcement in both OPC and PPC beams showed slight corrosion, but the concrete cover of the steel reinforcement in the pozzolanic concrete beams was still intact, indicating better corrosion resistance.

5. Conclusions

In this study, OPC beams and PPC beams were fabricated, subjected to sustained loads to induce cracks, and exposed to accelerated reinforcement corrosion through 10 wet–dry cycles using a 3% NaCl solution. By monitoring changes in the half-cell potential of the steel reinforcement, changes in the reinforcement corrosion current, and the spatial distribution of acoustic emission detection points, the probability and extent of reinforcement corrosion were quantified.
  • The half-cell potential experiments showed the following: under loaded conditions, the steel reinforcement in both OPC and PPC beams underwent corrosion. The half-cell potential test indicated that the potential value of the PPC beams was 15% lower than that of the OPC beams, reflecting that the probability of reinforcement corrosion in the PPC beams was greater than that in the OPC beams. The loaded PPC beams generated more cracks than the OPC beams; the cracks allowed saltwater to penetrate the beams more easily, increasing the probability of steel reinforcement corrosion. However, under unloaded conditions, the PPC beams exhibited better corrosion resistance. Pozzolans underwent a secondary reaction with the calcium hydroxide produced by cement hydration, generating more dense calcium silicate hydrate cementitious material, which could fill the internal voids and reduce crack generation.
  • The corrosion current experiments showed the following: under loaded conditions, the corrosion rate of the PPC beams was at a high level, while that of the OPC beams was at a moderate level. However, under unloaded conditions, the corrosion rate of the PPC beams was at a negligible level, while that of the OPC beams was at a low level. PPC beams are prone to generating more cracks in the early stages of loading; once cracks are formed, they continuously provide pathways for corrosive media, leading to a more active electrochemical process of reinforcement corrosion. That is, the corrosion resistance advantage developed in the later stages is not enough to compensate for the corrosion disadvantage caused by the early-stage cracks, ultimately manifesting as a larger corrosion current.
  • Provided that early-age cracking is properly mitigated, pozzolanic concrete remains a superior material choice for ensuring the durability of structures in coastal environments. By adopting a series of targeted measures such as extending wet curing, optimizing mix proportions, and refining construction practices, the generation of early-stage cracks can be effectively reduced. This includes adjusting the water–binder ratio (controlling it below 0.45), using high-performance water reducers to improve workability and reduce mixing water consumption, and, when necessary, adding a small amount of high-quality expansive agents or fibers (such as polypropylene fibers) to compensate for shrinkage and inhibit crack generation.
  • Through cross-sectional design and reinforcement detailing of the beams to control the development of early-stage cracks in pozzolanic concrete beams, longitudinal structural reinforcement can be placed at the mid-depth of the beam webs to prevent vertical cracks caused by shrinkage and temperature changes in the beam web. Because pozzolanic concrete has a relatively low early shear strength and is prone to diagonal cracks, it is necessary to control this by optimizing stirrup configuration and adding web reinforcement.

Author Contributions

Conceptualization, X.L.; Methodology, X.L. and G.L.; Validation, X.L., G.L. and Z.J.; Formal analysis, X.L. and D.L.; Investigation, X.L., D.L. and Z.J.; Resources, X.L. and Z.J.; Data curation, X.L.; Writing—original draft, X.L. and Z.J.; Writing—review & editing, R.X.; Visualization, X.L. All authors have read and agreed to the published version of the manuscript.

Funding

This research received no external funding.

Data Availability Statement

Data could be available on reasonable request.

Conflicts of Interest

The authors declare no conflict of interest.

References

  1. Gao, Q.; Wang, T.; Zhao, T.; Zhang, Y.; Yue, X.; Guo, T.; Wu, S.; Ma, J. Macro-scale analysis of chloride penetration and durability in coastal concrete. J. Build. Eng. 2025, 113, 113953. [Google Scholar] [CrossRef]
  2. Liu, T.; Qin, S.; Zou, D.; Song, W. Experimental investigation on the durability performances of concrete using cathode ray tube glass as fine aggregate under chloride ion penetration or sulfate attack. Constr. Build. Mater. 2018, 163, 634–642. [Google Scholar] [CrossRef]
  3. Song, Z.; Li, S.; Yu, Q. Chloride induced mechanical degradation of ultra-high performance fiber-reinforced concrete: Insights from corrosion evolution paths. Constr. Build. Mater. 2023, 395, 132329. [Google Scholar] [CrossRef]
  4. Aperador, W.; Delgado, A.; Bautista-Ruiz, J. Effect of durability and chloride ion permeability in ternary cementitious concrete with additions of fly ash and blast furnace slag. Int. J. Electrochem. Sci. 2016, 11, 2297–2305. [Google Scholar] [CrossRef]
  5. Wang, L.; Zhao, Q.; Miao, C.; Liu, C.; Wang, H. Quantifying the protective efficacy of GN anti-chloride admixture on durable performance of concrete in chloride ion erosion environments. Meas. Sens. 2024, 33, 101239. [Google Scholar]
  6. Ji, Y.; Wang, Z.; Inose, S.; Tsuchiya, S.; Yamamoto, T.; Ishida, T.; Maekawa, K. Numerical study of macro-cell corrosion on reinforced concrete induced by chloride attack. Cem. Concr. Compos. 2025, 164, 106263. [Google Scholar] [CrossRef]
  7. Xu, X.; Zheng, Y.; Pan, J.; Lan, X.; Hou, C.; Zhang, Z. Research on the influence of concrete damage in wharf structures under fatigue loads on chloride ion diffusion. Results Eng. 2025, 25, 103754. [Google Scholar]
  8. Xu, X.; Zheng, Y.; Hou, C.; Lan, X.; Pan, T.; Zhang, Z. Investigation of chloride ion diffusion mechanism and durability analysis of offshore concrete structures under fatigue loading. Eng. Fract. Mech. 2025, 317, 110942. [Google Scholar] [CrossRef]
  9. Jin, H.; Li, Z.; Zhang, W.; Liu, J.; Xie, R.; Tang, L.; Zhu, J. Iodide and chloride ions diffusivity, pore characterization and microstructures of concrete incorporating ground granulated blast furnace slag. J. Mater. Res. Technol. 2022, 16, 302–321. [Google Scholar] [CrossRef]
  10. Ahmad, F.; Jamal, A.; Iqbal, M.; Alqurashi, M.; Almoshaogeh, M.; Al-Ahmadi, H.M.; Hussein, E. Performance evaluation of cementitious composites incorporating nano graphite platelets as additive carbon material. Materials 2021, 15, 290. [Google Scholar] [CrossRef] [PubMed]
  11. Ahmad, Z.; Qureshi, M.I.; Ahmad, F.; El Ouni, M.H.; Asghar, M.Z.; Ghazouani, N. Effect of macro synthetic fiber (MSF) on the behavior of conventional concrete and the concrete containing e-waste aggregates. Mater. Struct. 2025, 58, 234. [Google Scholar] [CrossRef]
  12. Luo, D.; Du, K.; Niu, D. Prediction of chloride concentration in concrete under multi-salt environment: Optimization of integrated algorithm based on MSCPO and interpretability analysis. Mater. Des. 2025, 251, 113682. [Google Scholar] [CrossRef]
  13. Gao, S.; Guo, J.; Gong, Y.; Ban, S.; Liu, A. Study on the penetration and diffusion of chloride ions in interface transition zone of recycled concrete prepared by modified recycled coarse aggregates. Case Stud. Constr. Mater. 2022, 16, e01034. [Google Scholar] [CrossRef]
  14. Ahmad, J.; Alattyih, W.; Jebur, Y.M.; Rahmawati, C. Mechanical properties of sustainable concrete made with partially substitution of volcanic ash: A review (part I). Innov. Infrastruct. Solut. 2024, 9, 370. [Google Scholar]
  15. Fu, Q.; Zhao, Y.; Niu, D. corrosion development of steel bars in concrete under the combined effect of chloride salt attack and carbonation. J. Mater. Sci. 2025, 60, 8384–8408. [Google Scholar] [CrossRef]
  16. Fan, X.; Liu, S.; Wei, D.; Gu, Z.; Li, Z. Study on the shear performance of R-UHTCC reinforced recycled concrete composite beams. Structures 2025, 81, 110219. [Google Scholar] [CrossRef]
  17. Wang, Z.; Liang, X.; Wan, S.; Zhang, C.; Weng, S.; Wu, K. Shear failure analysis of ultra-high performance concrete (UHPC) beams: A theoretical method considering various shear mechanisms. Eng. Fail. Anal. 2025, 181, 109925. [Google Scholar] [CrossRef]
  18. Li, S.; Chen, X.; Casas, J.R.; Sun, Y. Characterization of failure modes and shear behavior of reinforced concrete beams without stirrups based on combined non-destructive testing. Dev. Built Environ. 2025, 22, 100673. [Google Scholar] [CrossRef]
  19. Wang, X.; Liu, Z.; Xue, J.; Zhang, F.; Wang, J.; Yue, R. Experimental study on the shear response of high-strength steel reinforced ultra-high performance concrete beams and calculation of shear capacity. Structures 2025, 81, 110372. [Google Scholar] [CrossRef]
  20. Di, B.; Zheng, Y.; Liao, J.; Fang, J.T.; Zeng, J.J.; Zhuge, Y. Ultimate shear capacity of FRP-reinforced concrete beams: Test database and an improved design model. Structures 2025, 80, 109677. [Google Scholar] [CrossRef]
  21. Zha, S.; Liu, D.; Song, Q.; Zhang, J.; Deng, W.; Gu, J. Cracking behavior and crack width prediction in steel-concrete composite beams under negative bending moment: A comparative study of web and deck configurations. Eng. Struct. 2025, 345, 121554. [Google Scholar] [CrossRef]
  22. Hamada, H.M.; Abed, F.; Beddu, S.; Humada, A.; Majdi, A. Effect of Volcanic Ash and Natural Pozzolana on mechanical properties of sustainable cement concrete: A comprehensive review. Case Stud. Constr. Mater. 2023, 19, e02425. [Google Scholar] [CrossRef]
  23. He, J.; Liu, J.; Li, N.; Li, J.; Fu, B. Shear behavior of concrete beams reinforced with GFRP-steel hybrid stirrups. Constr. Build. Mater. 2025, 472, 140882. [Google Scholar] [CrossRef]
  24. Vu, B.T.; Tran, T.T.; Nguyen, H.C. Phase-field method of fracture for experimental validation to simulate damage caused by reinforcement corrosion in clam-shell concrete beams. Constr. Build. Mater. 2024, 454, 139065. [Google Scholar] [CrossRef]
  25. Villarreal-Centurión, L.E.; Soriano, L.; Payá, J.; Borrachero, M.V.; Monzó, J.M.; Gimenez-Carbó, E. Effect of volcanic ash and a CSH nano-additive on the manufacture of cementitious systems. Constr. Build. Mater. 2025, 489, 142191. [Google Scholar] [CrossRef]
  26. Capasso, M.; Carusi, V.; Forte, A.; Lavorato, D.; Raoli, G.; Santini, S. A probabilistic interpretation of corrosion state through half-cell potential and electrical resistivity measures: The Flaminio Bridge in Rome. Case Stud. Constr. Mater. 2024, 20, e03197. [Google Scholar] [CrossRef]
  27. ASTM C876-09; Standard Test Method for Corrosion Potentials of Uncoated Reinforcing Steel in Concrete. ASTM International: West Conshohocken, PA, USA, 2015.
  28. ASTM G102-23; Standard Practice for Calculation of Corrosion Rates and Related Information from Electrochemical Measurements. ASTM International: West Conshohocken, PA, USA, 2004.
  29. Hu, J.; Liu, Y.; Dong, Z.; Zhang, S. A novel method to measure the actual corrosion resistance/rate of steel reinforcement during impressed-current accelerated corrosion test. Constr. Build. Mater. 2024, 426, 136060. [Google Scholar] [CrossRef]
  30. Chen, L.; Su, R.K.L. On the corrosion rate measurement of reinforcing steel in chloride induced macrocell corrosion. Cem. Concr. Compos. 2022, 134, 104775. [Google Scholar] [CrossRef]
  31. Zhang, F.; Yang, Y.; Hendriks, M.A. Acoustic emission-based indicators of shear failure of reinforced concrete beams without shear reinforcement. Eng. Struct. 2025, 330, 119929. [Google Scholar] [CrossRef]
  32. Radhika, V.; Kishen, J.C. A comparative study of crack growth mechanisms in concrete through acoustic emission analysis: Monotonic versus fatigue loading. Constr. Build. Mater. 2024, 432, 136568. [Google Scholar] [CrossRef]
  33. Huang, Y.; Cheng, Z.; Nie, R.; Wang, Q.; Li, P. Studies on the mechanical properties of volcanic ash-based geopolymer coral concrete. Constr. Build. Mater. 2025, 492, 143017. [Google Scholar] [CrossRef]
  34. Gambo, S.; Sanda, U.M.; Ibrahim, A.G.; Usman, J.; Mohammad, U.H. Strength properties of ordinary Portland cement concrete containing high volume recycled coarse aggregate and volcanic ash. Mater. Today Proc. 2023, 86, 140–144. [Google Scholar] [CrossRef]
  35. Fodil, D.; Mohamed, M. Compressive strength and corrosion evaluation of concretes containing pozzolana and perlite immersed in aggressive environments. Constr. Build. Mater. 2018, 179, 25–34. [Google Scholar] [CrossRef]
  36. Al Asmari, A.F.; Bashir, M.I.; Farooq, F.; Asif, U. Investigating the effect of locally available volcanic ash on mechanical and microstructure properties of concrete. Rev. Adv. Mater. Sci. 2025, 64, 20240085. [Google Scholar] [CrossRef]
  37. Rodrigues, R.; Gaboreau, S.; Gance, J.; Ignatiadis, I.; Betelu, S. Reinforced concrete structures: A review of corrosion mechanisms and advances in electrical methods for corrosion monitoring. Constr. Build. Mater. 2021, 269, 121240. [Google Scholar] [CrossRef]
  38. Sadowski, L. Methodology for assessing the probability of corrosion in concrete structures on the basis of half-cell potential and concrete resistivity measurements. Sci. World J. 2013, 2013, 714501. [Google Scholar] [CrossRef]
  39. Ahmad, J.; Althoey, F.; Abuhussain, M.A.; Deifalla, A.F.; Özkılıç, Y.O.; Rahmawati, C. Durability and microstructure analysis of concrete made with volcanic ash: A review (Part II). Sci. Eng. Compos. Mater. 2023, 30, 20220211. [Google Scholar] [CrossRef]
  40. Rodulfo, P.; Wang, B.; Gupta, R.; Sharma, L.; Mukhopadhyaya, P. Relationship between electrical Conductivity, Half cell Potential, Linear polarization resistance and Macrocell current of cementitious repair materials. Constr. Build. Mater. 2023, 401, 132733. [Google Scholar] [CrossRef]
  41. Hossain, K.M.; Lachemi, M. Development of volcanic ash concrete: Strength, durability, and microstructural investigations. ACI Mater. J. 2006, 103, 11–17. [Google Scholar] [CrossRef]
  42. Chen, L.; Su, R.K.L. Corrosion rate measurement by using polarization resistance method for microcell and macrocell corrosion: Theoretical analysis and experimental work with simulated concrete pore solution. Constr. Build. Mater. 2021, 267, 121003. [Google Scholar] [CrossRef]
  43. Vandecruys, E.; Martens, C.; Van Steen, C.; Lombaert, G.; Verstrynge, E. Corrosion level estimation in reinforced concrete beams by acoustic emission sensing and selective crack measurements. Struct. Concr. 2025, 26, 5578–5595. [Google Scholar] [CrossRef]
  44. Chen, C.; Chen, X. Experimental study of fracture damage characteristics in steel slag porous concrete based on acoustic emission technique. Constr. Build. Mater. 2024, 456, 139127. [Google Scholar] [CrossRef]
  45. Van Steen, C.; Pahlavan, L.; Verstrynge, E. Smart aggregates for acoustic emission monitoring of concrete cracking and reinforcement corrosion. Constr. Build. Mater. 2024, 443, 137644. [Google Scholar] [CrossRef]
  46. Yu, A.P.; Naqvi, M.W.; Hu, L.B.; Zhao, Y.L. An experimental study of corrosion damage distribution of steel bars in reinforced concrete using acoustic emission technique. Constr. Build. Mater. 2020, 254, 119256. [Google Scholar] [CrossRef]
Figure 1. Concrete cementitious materials and aggregates.
Buildings 16 01858 g001
Figure 2. Relationship of chloride diffusion coefficient with pozzolans: silica fume (SF), pulverized fuel ash (PFA), blast furnace slag (BFS).
Buildings 16 01858 g002
Figure 3. Schematic diagram of beam reinforcement.
Buildings 16 01858 g003
Figure 4. Actual photo of reinforcement insulation and tying.
Buildings 16 01858 g004
Figure 5. Beam strength test and crack marking.
Buildings 16 01858 g005
Figure 6. Cyclic corrosion experimental setup diagram.
Buildings 16 01858 g006
Figure 7. Schematic diagram of the half-cell potential test setup.
Buildings 16 01858 g007
Figure 8. Schematic diagram of the corrosion current experimental setup.
Buildings 16 01858 g008
Figure 9. Diagram of the acoustic emission experimental setup.
Buildings 16 01858 g009
Figure 10. Force Applied–displacement curves of OPC and PPC beams.
Buildings 16 01858 g010
Figure 11. Half-cell potential variation curves of different concrete beams.
Buildings 16 01858 g011
Figure 12. Potential contour maps of steel reinforcement corrosion trend.
Buildings 16 01858 g012
Figure 13. Corrosion current variation curves of steel reinforcement in different concrete beams.
Buildings 16 01858 g013
Figure 14. Acoustic emission locations of reinforcement corrosion in the pozzolanic concrete beams from cycles 2–10 of wet–dry cycles.
Buildings 16 01858 g014
Figure 15. Histograms of RMS and AEN.
Buildings 16 01858 g015
Figure 16. Photographs of actual steel reinforcement corrosion in different concrete beams.
Buildings 16 01858 g016
Table 1. Chemical compositions of cement and admixtures (%).
TypeCaOSiO2Al2O3Fe2O3MgOSO3Na2OK2OTiO2
Cement58.118.375.123.151.332.090.360.940.22
Fly ash14.545.126.86.921.461.25
Silica fume0.586.770.300.750.730.52
Slag powder39.2933.0611.221.216.781.90.37
Table 2. Physical properties of cement and admixtures.
TypeStandard
Consistency
Water Requirement/%
Setting Time/minCompressive Strength/MPaFlexural Strength/MPaSpecific Surface Area/
(cm2·g−1)
Density/
(g·cm−3)
Initial SettingFinal Setting3 Days28 Days3 Days28 Days
Cement28.627435227.950.35.5 8.4393 3.11
Fly ash1032.18
Silica fume1172512.11
Slag powder1164422.92
Table 3. Physical properties of aggregates.
PropertyCoarse AggregateFine Aggregate
Minimum nominal size (mm)5.00.078
Maximum nominal size (mm)164.65
SSD water absorption (%)1.021.0
Specific gravity2.832.58
Bulk density (kg/m3)15501500
Fineness modulusNone2.8
Table 4. Mechanical properties of steel reinforcement.
Reinforcement TypeDiameter/mmYield Strength/MPaTensile Strength/MPaElongation/%Elastic Modulus/GPa
Main reinforcement HRB4001642061522.0200
Stirrup HRB4001042061522.0200
Table 5. Concrete mix proportions (kg/m3).
TypeCementWaterSandCoarse AggregateSilica FumeFly AshSlagWater Reducer
OPC377.6169.9731.51096.21.81
PPC233.1160.4680.21158.821.872.736.43.66
Table 6. Relationship between beam failure characteristics and shear span ratio.
Failure FormOccurrence ConditionCrack CharacteristicsFailure
Nature
Stirrup
Utilization Rate
Diagonal compression failureλ < 1Web concrete crushed, multiple parallel diagonal cracksBrittleUnyielded
Shear-compression failure1 ≤ λ ≤ 3One main critical diagonal crack, concrete at the top crushedDuctileYielded
Diagonal tension failureλ > 3A sudden penetrating diagonal crack, beam is pulled apartVery brittleYielded but in insufficient quantity
Table 7. Relationship between reinforcement corrosion current and corrosion rate.
I corr   ( μ A / cm 2 ) Corrosion Rate LevelTypical Description
<0.1NegligibleSteel reinforcement is in a passive state, no corrosion risk.
0.1~0.5LowSteel reinforcement may begin to depassivate, corrosion rate is low.
0.5~1.0ModerateSteel reinforcement is in a state of active corrosion; structures exposed to the outside require attention.
>1.0HighSevere steel reinforcement corrosion, which may lead to severe structural damage in the short term.
Disclaimer/Publisher’s Note: The statements, opinions and data contained in all publications are solely those of the individual author(s) and contributor(s) and not of MDPI and/or the editor(s). MDPI and/or the editor(s) disclaim responsibility for any injury to people or property resulting from any ideas, methods, instructions or products referred to in the content.