Article

Identifying the Factors Hindering Stakeholder Management in Construction with Structural Equation Modeling

by
Gulden Gumusburun Ayalp
1,* and
Emine Yüksel Deniz
2
1
Department of Architecture, Gaziantep University, 27010 Gaziantep, Turkey
2
Department of Architecture, Hasan Kalyoncu University, 27010 Gaziantep, Turkey
*
Author to whom correspondence should be addressed.
Buildings 2026, 16(1), 15; https://doi.org/10.3390/buildings16010015
Submission received: 17 November 2025 / Revised: 13 December 2025 / Accepted: 16 December 2025 / Published: 19 December 2025
(This article belongs to the Section Construction Management, and Computers & Digitization)

Abstract

Effective stakeholder management is essential in construction projects, but numerous context-specific challenges often hinder its implementation. This study investigates the factors that limit stakeholder management in Türkiye’s construction industry through a structured, multi-stage analytical approach. A systematic literature review first identified 69 stakeholder management challenges (SMCs). A questionnaire administered to 164 construction professionals was then analyzed using the normalized mean value (NMV) approach, which identified 53 critical challenges (CCs). To reduce the dimensionality of the 53 CCs, exploratory factor analysis (EFA) was conducted, resulting in four overarching factors: (1) weak planning, coordination, and implementation deficiencies; (2) institutional and operational weaknesses; (3) communication problems; and (4) legal regulations, bureaucratic barriers, and ethical issues. Finally, structural equation modeling (SEM) was applied to highlight the effect sizes of these factors in stakeholder management, rather than to perform predictive modeling. The results show that institutional and operational weaknesses and communication problems exert the strongest negative influences. By clearly linking the 53 CCs with four higher-level factors, this study provides a coherent analytical structure and a robust methodological basis for understanding the barriers to effective stakeholder management. The findings offer actionable insights for construction practitioners and policymakers seeking to enhance coordination, communication, and governance mechanisms in complex project environments.

1. Introduction

A stakeholder is any individual, group, or institution that can influence, or is influenced by, a project’s goals, processes, or outcomes [1]. Stakeholder management is the systematic process of engaging stakeholders to identify, negotiate, and achieve social, environmental, and economic objectives through active participation [2]. As Bryson [3] notes, this involves strategically managing relationships by analyzing needs and expectations, establishing communication channels, and aligning interactions with the organization’s mission.
The foundations of stakeholder management are commonly linked to Freeman’s [4] seminal work, “Strategic Management: A Stakeholder Approach”. At its core, stakeholder management focuses on the complex relationships between organizations and the various groups that can influence—or be influenced by—a project. These interactions may create both opportunities and challenges for the project and the parties involved. Consequently, the purpose of stakeholder management is to help organizations recognize, assess, interpret, and appropriately engage with their stakeholders [5]. Although originally rooted in business management, stakeholder theory has been increasingly adopted in other disciplines, including construction management. However, because construction projects have distinctive characteristics and operational processes, there is a need to establish principles tailored specifically to managing stakeholders in the construction context.
Stakeholder theory suggests that organizations ought to consider the interests and expectations of all stakeholder groups, rather than focusing solely on shareholders. Adopting this perspective encourages a more comprehensive understanding of project outcomes and helps project teams manage the multifaceted dynamics that arise in stakeholder relationships [6]. When executed effectively, stakeholder management minimizes risks, builds a competitive advantage, and supports long-term growth [7]. This is particularly relevant in the construction industry, where projects are complex, involve multiple parties, and are subject to uncertainty [8]. Construction significantly contributes to the global economy through a diverse range of projects [9]. However, with large budgets, extended timelines, and multiple stakeholders, projects remain highly dynamic [8]. Despite stakeholders recognizing the importance, ineffective management remains a common issue [10]. Neglecting stakeholder needs can lead to cost overruns, delays, disputes, and social tensions [11].
Research indicates that poor communication, weak information exchange, and inadequate conflict or stakeholder management significantly contribute to project failure [12]. Diverging interests often intensify conflicts [11,13]. According to PMBOK, managing expectations is essential for ongoing progress. Identifying barriers is, therefore, key to success. Effective engagement enhances efficiency and promotes sustainable, resilient practices across the industry [14]
Scholars have extensively studied stakeholder management; however, research indicates that conditions in developing countries are particularly challenging. Notable differences are evident between developed and developing regions, driven by variations in research focus, methodologies, challenges, and practices.
In developed countries, research indicates the use of structured, formal approaches supported by empirical evidence. Yang et al. [15] emphasize the importance of systematic frameworks for stakeholder engagement, while Taimu et al. [16] note that robust practices are key to driving project success.
In contrast, developing countries apply weaker principles. Ola-awo et al. [17] highlight recurring time and cost overruns, disputes, and distrust. Eyiah-Botwe et al. [18] found that critical success factors in Ghana remain unaddressed. Kululanga [19] notes limited research on capacity building in Sub-Saharan Africa, while Onososen et al. [20] show barriers to adopting digital technologies that complicate interactions. Socio-cultural issues and fragmented projects add further complexity, which is notably absent in developed contexts.
Identifying critical factors is especially important for developing countries, where construction plays a significant role in driving economic growth [21]. The relationship between the construction sector’s share in Gross Domestic Product (GDP) and a country’s level of economic development has been widely discussed by Bon [22]. Bon [22] indicated that in low-income economies, the construction sector initially represents a relatively small share of GDP but expands rapidly during periods of industrialization and infrastructure development. As countries transition to higher-income stages, this share gradually stabilizes and eventually declines, reflecting a shift toward service-oriented and technology-driven economic structures. This non-linear pattern highlights the evolving role of construction activity across different stages of economic development.
In Turkey, construction plays a vital role, particularly in large-scale infrastructure such as airports, highways, bridges, dams, and power systems [23]. It can contribute up to 30% of GDP [24], making it a cornerstone of growth. However, persistent challenges, such as weak coordination, fragmented communication, bureaucratic inefficiencies, and gaps in professional competence, continue to obstruct effective stakeholder collaboration. Therefore, identifying barriers to sustainable construction is crucial. Although numerous studies [25,26,27] have discussed individual stakeholder-related challenges, no prior research has systematically integrated evidence from the literature with practitioner-based prioritization conducting normalized mean value analysis (NMV) and multistep factor–analytic validation performing exploratory factor analysis (EFA), confirmatory factor analysis (CFA) and structural equation modeling (SEM) to develop an empirically supported model of critical stakeholder management factors in the Turkish construction context.
Stakeholder management is essential to the success of construction projects, where multiple actors with diverse expectations must collaborate amid high uncertainty and complexity. When not managed effectively, stakeholder-related issues contribute to delays, cost overruns, disputes, coordination failures, and reduced project performance. Although the broader topic of stakeholder management has been widely examined, there is limited understanding of the barriers to stakeholder engagement—particularly in developing countries, where institutional, operational, and regulatory constraints are more pronounced.
This gap raises several vital research questions (RQs). First, although numerous issues affecting stakeholder management have been discussed in the literature, it is unclear which potential barriers are most relevant in the Turkish context (RQ1). Second, even when multiple challenges are identified, not all exert the same level of influence, making it necessary to determine which barriers are truly critical (RQ2). Third, the literature rarely consolidates these challenges into a meaningful set of underlying dimensions, leaving open the question of which critical factors structurally hinder effective stakeholder management (RQ3). Finally, while analytical tools such as structural equation modeling (SEM) are used descriptively, little is known about the relative effect sizes of these critical factors on stakeholder management performance (RQ4).
Accordingly, this study seeks to address these gaps by integrating evidence from a systematic literature review, a nationwide survey, NMV, EFA, CFA, and SEM. The following research questions guide the investigation:
RQ1: What are the potential barriers to effective stakeholder management?
RQ2: What are the critical barriers to stakeholder management?
RQ3: What are the critical factors hindering effective stakeholder management?
RQ4: What are the effect sizes of the critical factors influencing stakeholder management?
In this study, “critical factors” refer to the stakeholder management challenges that have the strongest and most consistent influence on project outcomes. These factors are identified through a two-stage process. First, all challenges are evaluated using the NMV analysis, and only those scoring above NMV > 0.5 are retained. This cutoff is widely used in construction-management and perception-based studies [28,29] because NMVs greater than 0.5 indicate that respondents rated an item above the neutral/average level of influence. Several prior studies have applied the same criterion when filtering perception-based variables before factorial analyses or modeling—e.g., Zhao et al. [28] and Liao and Teo [29]—all of whom classified items with NMV > 0.5 as high-priority issues. Following these established precedents ensures methodological consistency and allows the exclusion of low-impact items that introduce statistical noise into subsequent EFA, CFA, and SEM.
Second, the retained items are grouped and validated through exploratory and confirmatory factor analysis, which reveal the underlying dimensions that consistently shape stakeholder management performance. The factors emerging from this combined statistical- and perception-based process are therefore classified as “critical” because they represent the most significant and empirically supported barriers within the dataset.
By answering these questions, this study provides a comprehensive, empirically grounded understanding of the obstacles to stakeholder management in Türkiye’s construction industry. The findings of this study may be generalized to several developing countries and offer practical guidance for improving coordination, communication, and organizational effectiveness, while also contributing conceptual clarity to the broader stakeholder management literature.

2. Existing Studies on Stakeholder Management in the Construction Industry and Literature Gaps

A significant amount of research has explored stakeholder management in the construction industry. Yang et al. [15] conducted a systematic review and provided suggestions for future research, while Xia et al. [30] combined risk and stakeholder management using a similar approach. Yang et al. [31] identified gaps in earlier studies using literature reviews and interviews. Mok et al. [32] focused on mega-projects, and Oppong et al. [1] examined performance attributes. Prebanić & Vukomanović [33] connected stakeholder management with digital transformation. Yang and Shen [34] created a framework based on interviews.
Beyond reviews, Frempong-Jnr et al. [35] studied the impact of stakeholder management on construction waste management through a questionnaire and quantitative analysis. Yang et al. [36] and Mashali et al. [37] examined critical success factors in Hong Kong and Qatar, respectively, using surveys and descriptive analyses.
The stakeholder management challenges within the construction industry in developing countries have been analyzed in recent literature, revealing common themes that underscore the complexity and uniqueness of these environments. A predominant challenge is the low maturity level of stakeholder management practices, particularly within small and medium-sized enterprises (SMEs). Klaus-Rosińska and Iwko [38] highlight that many small construction firms lack well-developed approaches to stakeholder management, including stakeholder identification and analysis, thereby severely impacting project outcomes. This deficiency is surprising given the recognized importance of stakeholder management for achieving sustainable project success. Moreover, the construction industry is characterized by a high degree of stakeholder diversity, which complicates management. This challenge is well documented in literature; for example, Yang et al. [15] note that inadequate stakeholder engagement—exacerbated by a lack of clear objectives and communication—hinders project delivery. The difficulty in identifying and relating to “invisible” stakeholders is particularly problematic, contributing to disconnection and alienation among key participants. Sohu et al. [39] further illustrate this issue in the context of Pakistan, where complex stakeholder relationships lead to high cost and time overruns, underscoring the critical need for effective stakeholder engagement strategies. Another important finding concerns the need for enhanced communication and collaboration throughout the project life cycle. Research by Charan and Vaardini [40] highlights that a systematic approach, including stakeholder mapping and feedback systems, is essential for anticipating and understanding the dynamic requirements of various stakeholders. Furthermore, inadequate collaboration can lead to conflicts and misunderstandings among partners, as noted by Mashali and Eltantawy [41]. Such discord not only jeopardizes project success but can also foster an adversarial culture within the construction ecosystem. Additionally, environmental and institutional factors in developing countries further complicate stakeholder management. The work of Ebekozien et al. [42,43] underscores the necessity for construction projects to engage stakeholders meaningfully to meet development goals sustainably. Furthermore, Ali et al. [43] emphasize that while construction plays a critical role in national economic growth, the industry continues to grapple with challenges, including project delays and stakeholder interests. Effective management practices and institutional support are crucial in overcoming these barriers.
Although these studies provide insights, the literature remains limited in identifying critical factors that hinder effective stakeholder management. Recognizing these factors is vital for developing strategies that enhance project success.
Upon examining the existing literature in depth, it was found that Yang et al. [36] identified the critical success factors for stakeholder management in the Hong Kong context. Yang et al. [36] focused on identifying the critical success factors for effective stakeholder management and proposed a framework based on practices that help projects perform well. Compared with Yang et al. [36], who focused on success factors enabling effective stakeholder management, this study introduces a different and more comprehensive perspective by examining the barriers and structural constraints that hinder stakeholder engagement, particularly in a developing-country setting. The novelty of this research lies in its multi-stage analytical design, combining a systematic literature review (SLR), a national survey, normalized mean value analysis, exploratory factor analysis, and structural equation modeling. This integrated approach not only identifies 69 challenges and condenses them into four core factors, but also quantifies their effect sizes, offering empirical evidence on which obstacles exert the most significant negative influence. By shifting the focus from “what makes stakeholder management succeed” to “why it fails and what structurally blocks it,” this study provides fresh insights that extend and advance Yang’s framework.
Unlike earlier work, this research employs multiple methods to provide a comprehensive view. While it also uses an online questionnaire, its questions are grounded in an SLR, enhancing objectivity. Moreover, it uniquely assesses the importance of factors that hinder effective management, thereby marking a clear departure from previous studies.

3. Methodology

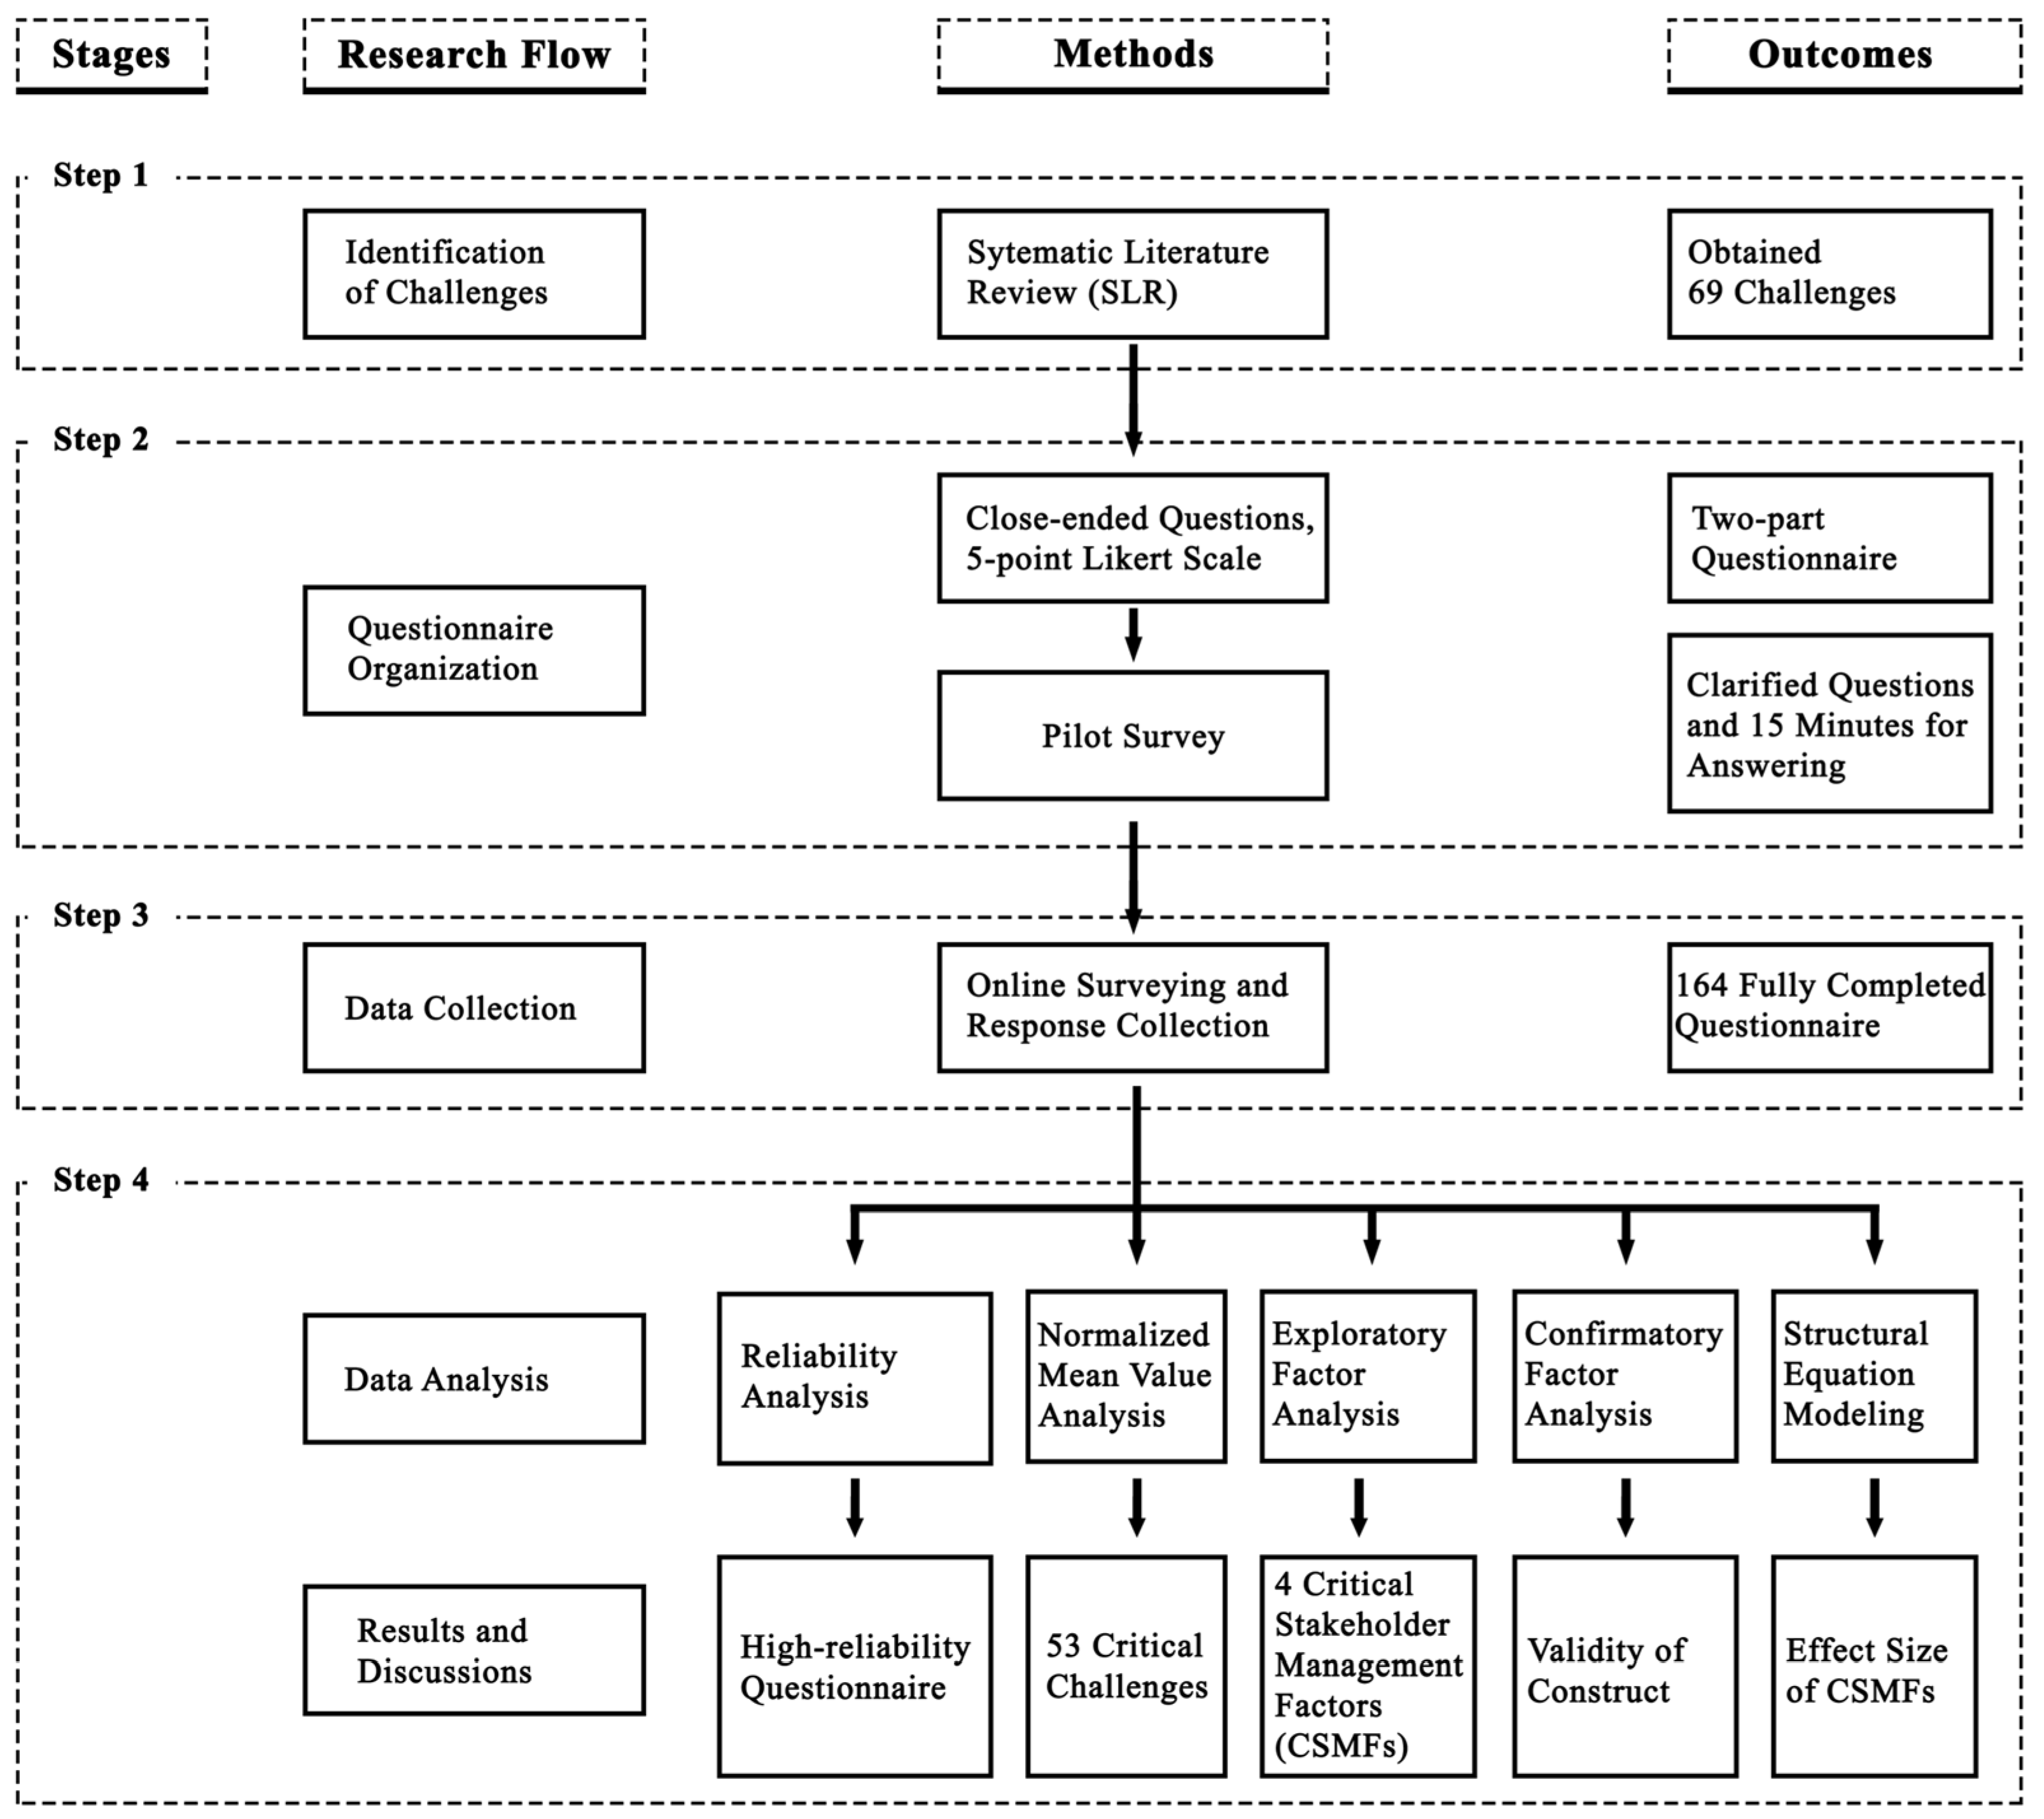
This research adopts a mixed-methods design that integrates both qualitative and quantitative approaches. The qualitative component is based on a systematic literature review (SLR), whereas the quantitative aspect involves statistical analyses. The methodology is structured into four main phases: conducting the literature review, designing a survey instrument based on the review findings, distributing the survey to the selected sample, performing statistical analysis on the responses, and finally, interpreting the outcomes (Figure 1).

3.1. Identifying the Potential Challenges with Systematic Literature Review

An SLR is a methodical research process that involves a detailed analysis of existing studies on a specific topic, using predefined inclusion and exclusion criteria to assess their findings [44]. This approach allows researchers to systematically identify prior work, thoroughly analyze it, and generate valuable insights. SLRs are especially useful in ensuring reliability and validity, as they offer a transparent, unbiased, and reproducible process for data collection and critical evaluation of literature [45].
A review of scholarship in the construction field indicates that, since 2010, a substantial share of published literature reviews have incorporated SLR methodologies. In addition, a notable rise in the adoption of the Preferred Reporting Items for Systematic Reviews and Meta-Analyses (PRISMA) guidelines has been observed since 2018 [46]. PRISMA offers a structured and transparent protocol for systematically locating, screening, appraising, and synthesizing relevant studies [47]. Consistent with current expectations for methodological rigor, the present investigation applies the PRISMA framework to conduct a systematic review of research on the factors hindering stakeholder management in the construction industry, following a three-phase review process [48].

3.1.1. Stage I: Planning the Review

Establishing a suitable search strategy is a critical component of the initial phase of an SLR, as it defines the breadth and boundaries of the review. Developing such a strategy requires identifying precise keywords and selecting appropriate databases to ensure comprehensive coverage of the most relevant studies [49]. In this study, the literature search was conducted using Web of Science (WOS).
The WoS is widely recognized as a leading resource for literature reviews, owing to its comprehensive global indexing of influential publications [50]. Moreover, WoS employs sophisticated citation-matching algorithms that are generally considered superior to those used by Scopus [51], supporting its designation as the primary database for the present study [52].
The authors developed a search protocol that combined terms drawn from titles, abstracts, and commonly used synonyms in related scholarship. The aim was to construct a search query broad enough to capture all potentially relevant publications while remaining adequately specific to the study’s scope.
The keywords were grouped into three thematic categories:
(1) Stakeholder Management-related terms, such as “stakeholder management” and “stakeholder”;
(2) Sector-related terms, including “construction industry” and “construction sector”;
(3) Terms describing barriers, such as “challenges,” “obstacles,” “barriers,” and “hindrances.”
To initiate the search process, relevant keywords were generated using the “building blocks” technique [53], whereby the research problem is decomposed into key concepts and linked through using Boolean operators such as “AND” and “OR.” Articles were screened based on the presence of these keywords in their titles and abstracts, which served as the principal filtering criteria. These categories were integrated into the following search expression: (“stakeholder management” OR “stakeholder”) AND (“construction industry” OR “construction sector”) AND (“challenges” OR “obstacles” OR “barriers” OR “hindrances”). A structured search was conducted in May 2025. Consistent with the guidance provided by Stekelorum [54], the search omitted books, book chapters, calls for papers, and Special Issue introductions, restricting the dataset to peer-reviewed journal articles to ensure greater rigor and reliability.
Having established the search protocol and selection criteria in this stage, the process proceeded to Stage II, “conducting the review”, during which these parameters were implemented to retrieve, screen, and filter studies in accordance with the PRISMA framework.

3.1.2. Stage II: Conducting the Review

The search for relevant literature was conducted from 2000 to 2024.
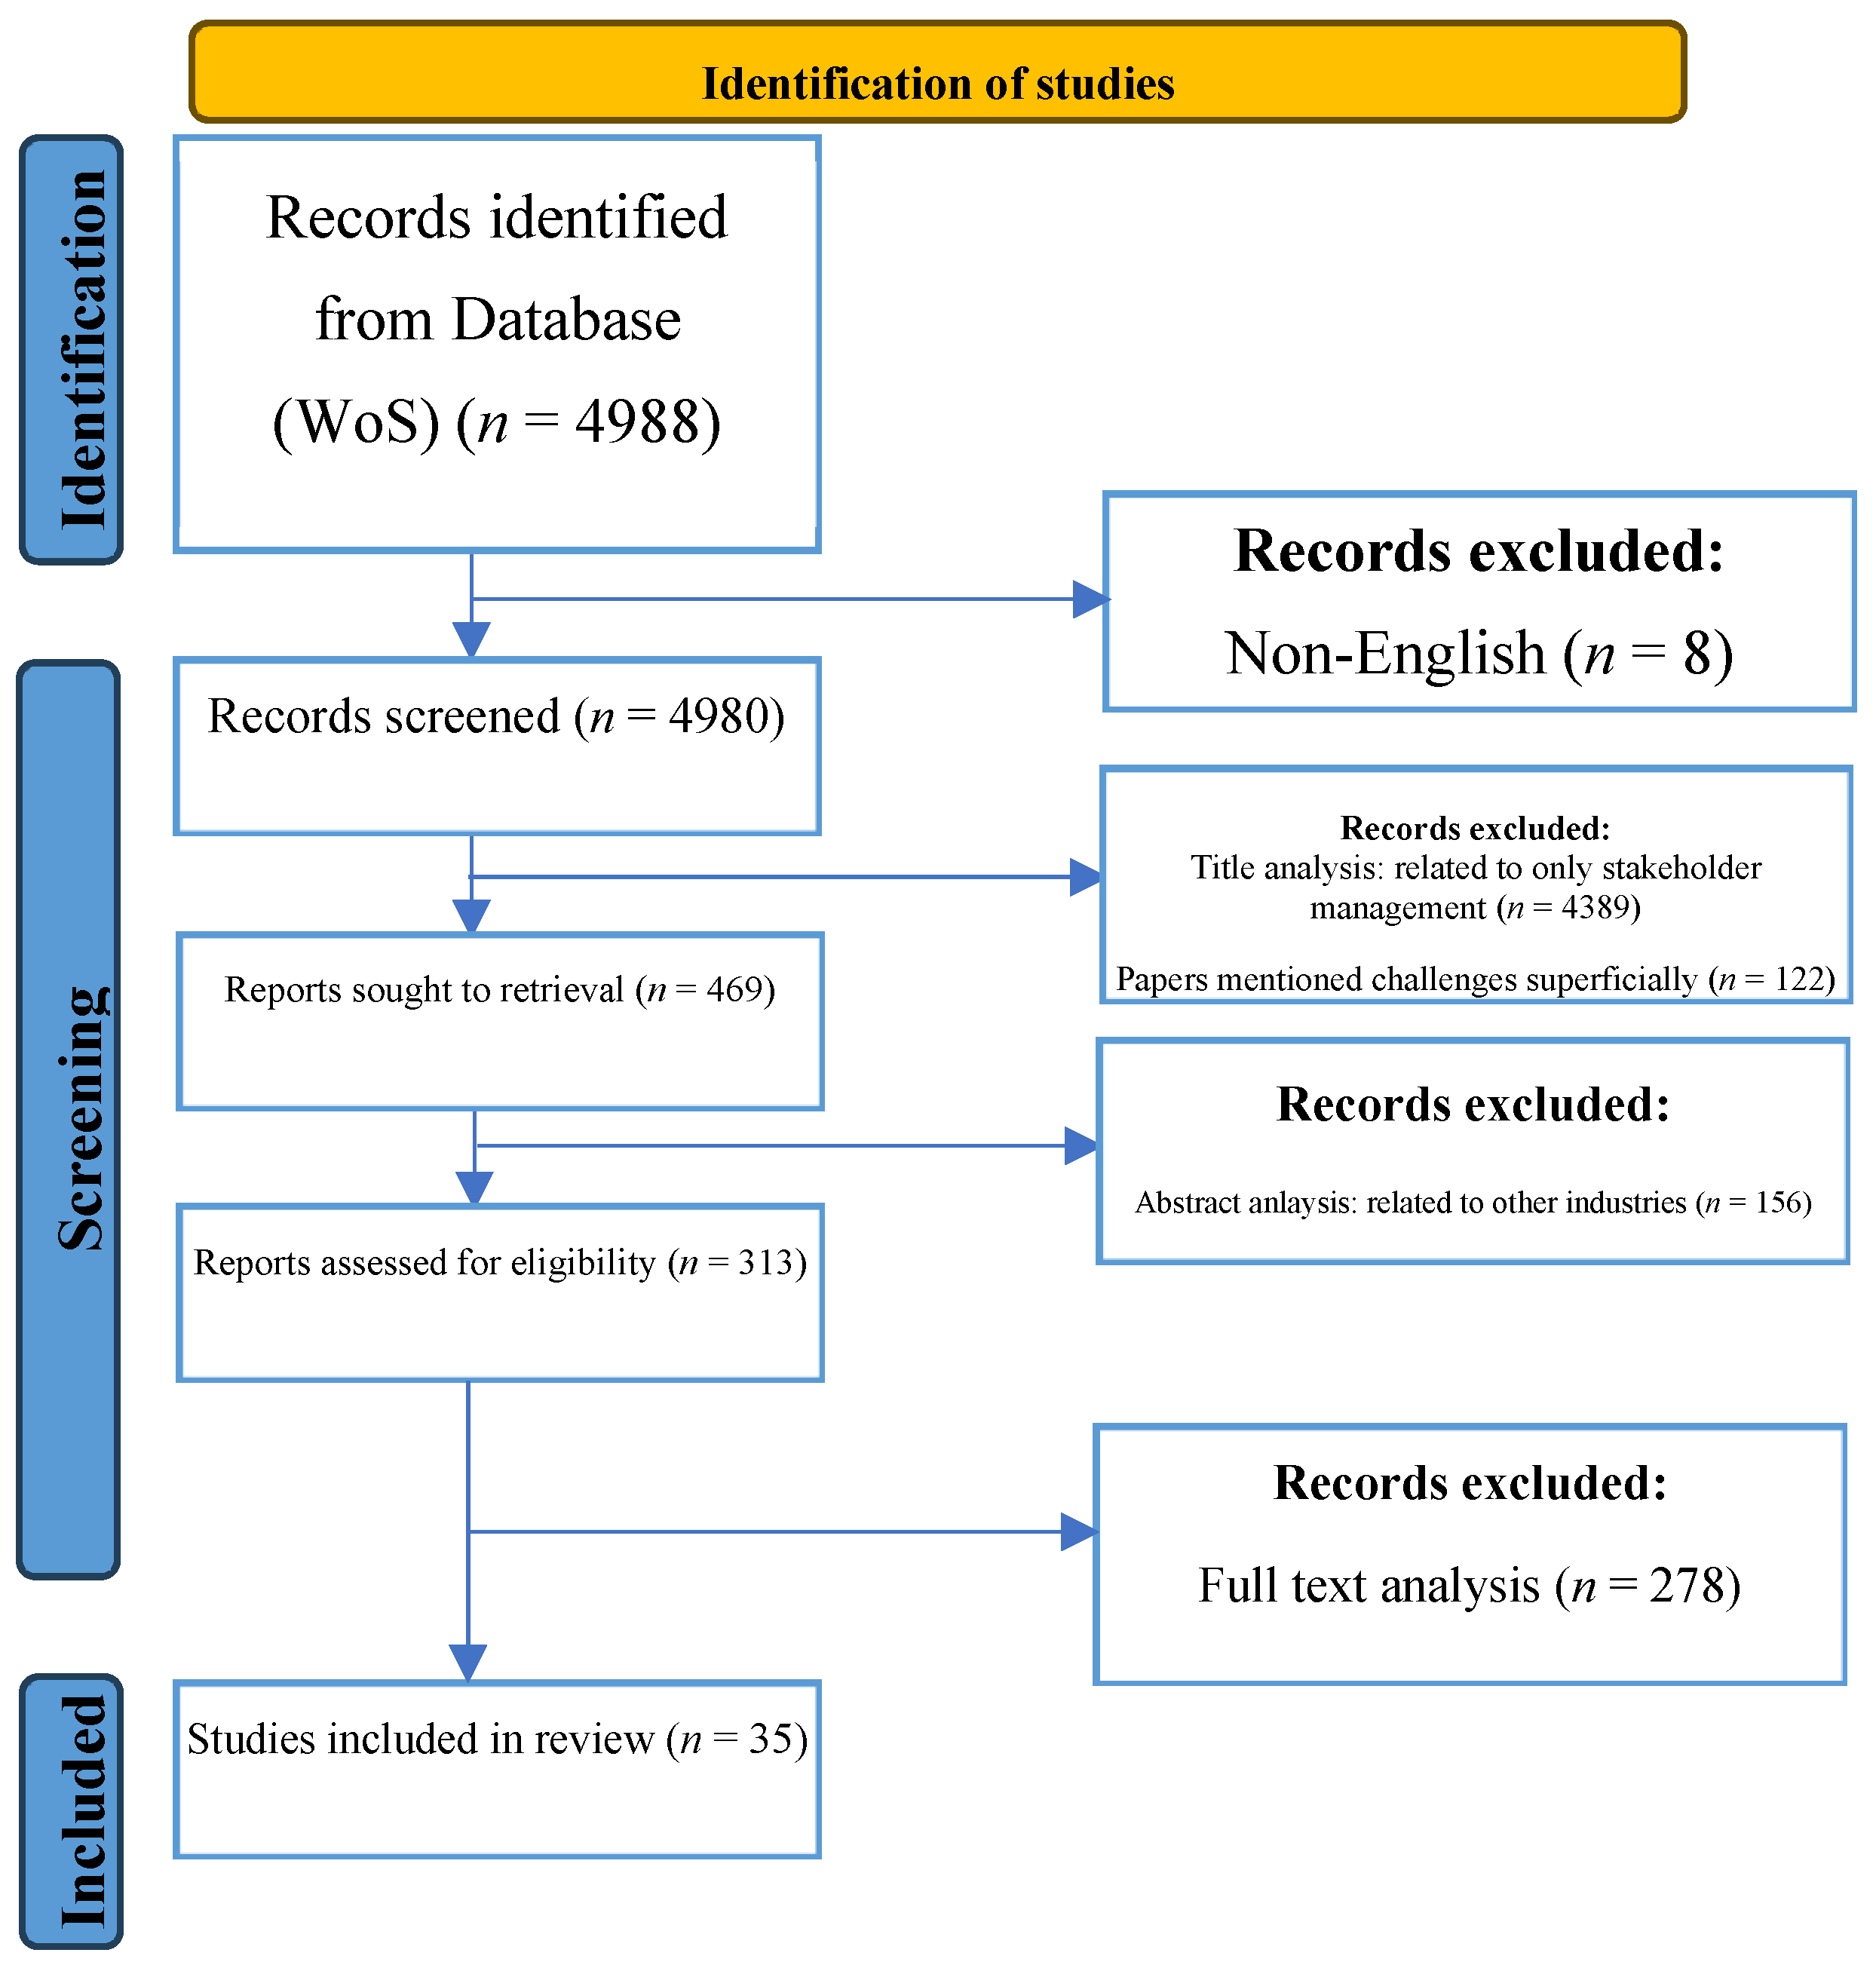
Using the protocol described above, the SLR initially yielded 4988 publications. To maintain the quality and relevance of the dataset, explicit inclusion and exclusion criteria were applied. These criteria were designed to ensure that only studies aligned with the research objectives and questions were retained. The inclusion criteria were (1) studies that directly investigate challenges or constraints related to effective stakeholder management within the construction industry and (2) articles published in peer-reviewed scholarly journals. Prioritizing peer-reviewed sources is widely recognized as a means of ensuring rigorous and credible evidence, as highlighted by Shi et al. [55].
The exclusion criteria comprised (1) publications written in languages other than English, (2) studies focused primarily on general stakeholder management and studies related to other industries, and (3) documents for which full-text versions were not accessible. Based on these criteria, eight non-English articles were removed from the dataset. In addition, 156 articles were removed because they were relevant to other industries. Subsequently, the remaining abstracts were screened, and only those that offered substantial discussion of barriers to effective stakeholder management were retained. Papers that mentioned challenges only superficially (i.e., with one to three brief references) were excluded. This step resulted in the removal of 4511 articles, leaving 313 papers for detailed assessment.
In the final phase, full-text evaluations were conducted to determine each paper’s relevance to the research aims, particularly regarding barriers to stakeholder management in the construction industry. This review process produced a final sample of 35 articles. Figure 2 illustrates the complete screening procedure.
To ensure transparency and replicability, the final set of 35 studies included in the SLR is summarized in Table 1. The table presents each study’s author(s), publication year, country/region, research method or sample characteristics, and key findings related to stakeholder management barriers.
With the eligible studies summarized in Table 1 identified through the multi-step screening in the existing stage, Stage III, “reporting the review” focused on extracting, consolidating, and reporting the stakeholder management challenges derived from the final pool of publications.

3.1.3. Stage III: Reporting the Review

To develop the list of 69 stakeholder management challenges (SMCs), all 35 articles included in the final SLR stage were examined in full. Each paper was reviewed line by line, and every statement referring to a difficulty, barrier, obstacle, or constraint related to stakeholder management in construction was extracted. During this process, the authors recorded the original wording in each study, along with the surrounding context, to ensure accurate interpretation.
Because different scholars often used varied terms to describe similar problems, an iterative coding and consolidation process was applied. First, all extracted items were grouped based on semantic similarity. Then, challenges that referred to the same underlying issue—such as “poor communication,” “ineffective information exchange,” or “lack of communication channels”—were merged into a single, more representative challenge label: “Ineffective communication between stakeholders.” When two expressions appeared related but not identical, both authors reviewed the texts jointly and agreed on whether to combine them or retain them separately. This constant-comparison technique prevented duplication and ensured that no distinct challenge was lost.
Through this systematic synthesis, 69 unique and clearly defined SMCs were identified. Each challenge in Table 2, therefore, reflects a consolidated description that captures the common meaning across multiple sources while eliminating redundancies arising from different terminology used in the literature.
The list of 69 distinct challenges associated with SMCs is presented in Table 2.

3.2. Organizing Questionnaire and Data Collection

The questionnaire was structured into three parts. The first measured participants’ knowledge of stakeholder management. The second assessed 69 SMCs identified through the SLR using a 5-point Likert scale. The final part included eight demographic questions on gender, age, education, profession, organization type, field of work, job position, years of experience, and tenure in the current organization.
Before conducting the main survey, a pilot study was conducted to assess the clarity of the questions, remove ambiguous statements, and estimate the time needed to complete the questionnaire. The draft survey was reviewed by five experts from the construction sector—five architects, five civil engineers, five contractors, and five supplier representatives—each with more than 10 years of professional experience. Their feedback was used to make the necessary revisions and produce the final version of the questionnaire.
The research population comprised architects, civil engineers, contractors, and suppliers, representing key stakeholder groups in Türkiye’s construction sector. A non-probability purposive sampling approach was used to collect data from construction professionals with direct experience in stakeholder management. This method was selected to ensure respondents had the practical knowledge needed to evaluate the identified challenges. The survey link was shared with 20 regional branches of the Turkish Chamber of Architects, 26 branches of the Chamber of Civil Engineers, 30 procurement firms, 21 members of the Contractors Association, and 30 contracting companies, for a total of 500 construction professionals. Participation was voluntary.
Data collection was conducted from 23 August to 22 November 2024, and a total of 170 construction professionals submitted questionnaires. However, 6 were excluded due to missing data, leaving 164 valid responses, for a response rate of 32.8%, which is acceptable for survey-based studies on construction management, where response rates commonly range from 20% to 35% [82]. In the context of construction management studies, determining an acceptable response rate for questionnaires is crucial as it influences the reliability and generalizability of research findings. The literature suggests that response rates of at least 20% to 30% are often considered acceptable for producing credible results in this field [83].
The minimum sample size was calculated using Gamil et al.’s [84] formula (Equation (1)):
S S = Z 2   × P ( 1 P ) C 2      
where
SS = sample size;
Z = z-score (1.96 at a 95% confidence level);
P = the proportion of the population expected to choose an option (0.5 assumed);
C = margin of error (9%).
By applying the formula,
S S = 1.96 2   × 0.5 ( 1 0.5 ) 0.09 2 = 118.57 119   ( a s   t h e   m i n i m u m   s a m p l e   s i z e )
A 9% margin of error was used in determining the minimum required sample size. This value was selected to balance statistical precision with the practical challenges of obtaining survey responses from construction industry professionals, who often have limited availability [85,86]. While a smaller margin of error (e.g., 5%) would require a substantially larger sample, a 9% margin still provides a reliable representation of perceptions within the target population, especially when combined with robust analytical techniques such as EFA, CFA, and SEM. Sensitivity checks indicated that the primary factor structure and statistical relationships remained stable, suggesting that the chosen margin of error did not materially influence the study’s findings.
Thus, at least 119 responses were required. To further assess sampling adequacy, the marginal error was calculated using the formula outlined by Enshassi and AlSwaity [87]. For a 95% confidence level, the maximum error was 1.96 S S = 1.96 119 = 0.18 > 0.09 . The margin is considered acceptable, with a minimum size requirement of 119.
Previous studies indicate that for SEM analyses, an adequate sample size typically ranges from 100 to 400 participants [86]. Determining an appropriate sample size is crucial, as it directly affects the reliability of estimated parameters [88]. Iacobucci [89] also notes that, in some cases, sample sizes as small as 50 or as large as 100 may be sufficient. Furthermore, in exploratory factor analysis, researchers often recommend a minimum sample size of 100 participants; however, the literature frequently recommends a sample size of 125–200 to achieve a valid factor structure and maintain statistical power [90]. In the context of this study, a sample size of 164 is considered modest but adequate.
Table 3 presents the demographic distribution of the 164 valid participants included in the analysis.
The demographic profile of the respondents aligns with the structure of Türkiye’s construction industry. National labor statistics indicate that the sector remains heavily male-dominated, which explains the gender imbalance observed in the dataset. Likewise, most participants were employed by private firms, reflecting the private sector’s prominent role in project delivery across the country. These characteristics do not undermine the study but rather mirror the current workforce composition. Nevertheless, the findings should be interpreted with this context in mind, and future studies involving more balanced and diverse samples across multiple regions would help enhance the generalizability of the results.

3.3. Data Analysis

The quantitative analysis followed a structured, step-by-step workflow to ensure that each technique built logically on the previous stage. First, descriptive statistics and reliability tests were conducted to confirm that the 69 SMCs were internally consistent and suitable for further analysis. The survey instrument’s reliability was assessed using Cronbach’s alpha, with values above 0.70 indicating acceptable internal consistency [91].
Next, descriptive statistical analyses were conducted. Testing data normality is essential in quantitative research; thus, skewness and kurtosis were calculated. Based on this, mean and standard deviation values were computed for the 69 SMCs.
After this validation, the NMV analysis was applied to identify which challenges respondents perceived as most influential. NMV reduced the complete list to a smaller set of critical challenges, thereby focusing subsequent analyses on the items with the highest practical importance. An NMV analysis was then applied to identify the most critical challenges (Equation (3)):
N o r m a l i z e d   m e a n   v a l u e = ( m e a n   o f   S M C     l o w e s t   r a n k e d   m e a n ) ( h i g h e s t   r a n k e d   m e a n     l o w e s t   r a n k e d   m e a n )  
The NMV for each SMC was computed using Equation (3). SMCs with an NMV greater than 0.5 were classified as critical challenges (CCs), consistent with the approach adopted by Xu et al. [92], Zhao et al. [69], and Liao and Teo [29]. To reinforce identification of these CCs, the average score for each SMC was also compared with the overall mean of all SMCs. If an SMC’s mean value was higher than the overall mean, it was likewise categorized as a critical challenge. This supplementary assessment technique was previously applied by Won et al. [29,93] and again by Liao and Teo [29].
Once the critical challenges were identified, an EFA was performed to uncover the underlying structure among these items. EFA grouped critical challenges into broader latent dimensions, termed critical stakeholder management factors (CSMFs), thereby reducing data complexity and revealing how individual challenges clustered conceptually.
EFA involves four main stages: data preparation, factor extraction, rotation, and interpretation. Dataset suitability is typically tested using the Kaiser–Meyer–Olkin (KMO) measure and Bartlett’s Test of Sphericity. A KMO above 0.5 and a significant Bartlett’s Test confirm appropriateness [94]. Once suitability is confirmed, factor extraction methods such as Principal Component Analysis (PCA) are applied to determine the optimal number of factors [95].
In this study, the CSMFs identified through EFA were further examined using CFA in LISREL to test their validity. Validity refers to the extent to which a test accurately measures the construct it intends to capture. Survey items with higher validity are more effective in reflecting the targeted characteristics. Model adequacy was evaluated through several indices, including the comparative fit index (CFI), the root mean square error of approximation (RMSEA), and the chi-square (χ2) statistic. Within CFA, path coefficients represent the strength of associations among variables; coefficients below 0.1 denote weak effects, those near 0.3 indicate moderate effects, and values of 0.5 or above suggest strong influences [96]. At the 99% confidence level, coefficients of at least 0.5, combined with t-values above 2.58, were considered statistically significant.
In the final stage, SEM was applied to measure the effect sizes of CSMFs that hinder effective stakeholder management. SEM was preferred because it can represent latent variables, offering a more precise assessment of CSMFs than conventional multivariate regression. Unlike regression analysis, SEM simultaneously estimates both measurement and structural models, providing a broader view of the factors hindering stakeholder management. It also provides model fit evaluation using indices such as CFI, RMSEA, and goodness-of-fit index (GFI), thereby strengthening the robustness of the findings. Beyond this, SEM captures complex interdependencies among multiple dependent and independent variables, enabling the quantification of each CSMF’s relative effect. It further examines how measurement paths align with latent constructs. While there is debate regarding the threshold for acceptable path coefficients, a minimum of 0.2 is commonly recommended [97]. For this study, at the 99% confidence level, path coefficients of 0.5 or greater and t-values exceeding 2.58 were considered statistically significant [98]. Additionally, SEM can address measurement errors and multicollinearity, thereby enhancing the reliability and validity of the outcomes, making it the most appropriate method for this analysis.
Together, these sequential steps—NMV → EFA → CFA → SEM—formed an integrated analysis workflow that progressively narrowed, structured, validated, and modeled the critical challenges identified in the study.

4. Results

4.1. Reliability Analysis

In this study, a reliability test was conducted to assess the internal consistency of 69 perception-based SMCs, measured on a 5-point Likert scale. Cronbach’s alpha (α) was employed as the reliability coefficient, and the analysis produced a value of 0.979. Since values above 0.90 are considered to demonstrate excellent internal consistency, the results confirm that the dataset is highly reliable [99].

4.2. Normality Analysis

The survey items were measured using five-point Likert scales, which are technically ordinal. Therefore, the analysis does not assume strict normality. Skewness and kurtosis were examined to detect severe deviations from symmetry that might affect estimation, rather than to claim that the data were normally distributed. In line with common practice in SEM applications in social science and construction management research, the Likert items were treated as approximately continuous because no extreme non-normality was observed. This enabled maximum likelihood-based estimation while maintaining acceptable model robustness. Values ranging between −3 and +3 are generally considered acceptable indicators of normality [100]. As shown in Table 4, the skewness and kurtosis values for all variables fell within this range, confirming that the dataset meets the assumption of a normal distribution.

4.3. Defining and Ordering the Critical Stakeholder Management Challenges

The means, standard deviations, and normalized mean values of 69 SMCs are represented in Table 4.
The NMV analysis revealed that 16 of the 69 identified SMCs (SMC25, SMC26, SMC27, SMC28, SMC31, SMC32, SMC34, SMC35, SMC39, SMC44, SMC46, SMC47, SMC48, SMC66, SMC67, and SMC68) scored below the 0.5 threshold and were therefore excluded from further consideration. In the NMV analysis, SMCs with NMV < 0.5 were excluded because this threshold indicates that respondents rated these items as less influential than the average challenge across the dataset. The 16 excluded SMCs received consistently low scores, meaning that practitioners do not experience these issues as frequent or impactful barriers in practice. Prior studies using NMV similarly apply the 0.5 threshold to filter out low-priority items before conducting factor analysis [28,29]. Removing low-priority items before EFA is recommended [28] to reduce statistical noise, improve factor clarity, and ensure that only challenges perceived as substantively relevant by the industry are used in the subsequent analyses.
Because these challenges are not consistently experienced across projects, they were assigned lower NMVs. Excluding them prior to EFA improved the clarity of the factor structure by reducing noise and allowing the analysis to focus on the most widely recognized and impactful barriers.
The remaining 53 SMCs, with NMVs exceeding 0.5, were classified as critical challenges (Table 4). When two or more SMCs had the same normalized mean score, ranking was determined by the lower standard deviation (SD), as a smaller SD indicates less variability in responses and a more stable mean [101]. Among the results, SMC7, SMC8, and SMC11 achieved the maximum NMV score of 1.000. The most critical challenge was identified as the inappropriate selection of contractors and subcontractors (SMC11) with the smallest SD within the three SMC. Closely following were the lack of experience and competence among contractors and subcontractors (SMC7) and the insufficient skills and qualifications of workers (SMC8), both of which represent major challenges to effective stakeholder management.

4.4. Unveiling the Critical Factors with Exploratory Factor Analysis

An EFA was conducted to identify the underlying structures of the 53 CCs and determine the CSMFs in the Turkish construction industry (Table 5).
Before the EFA, dataset suitability was assessed using the KMO measure and Bartlett’s Test of Sphericity. The KMO value was 0.917, well above the 0.5 threshold, confirming sampling adequacy [101]. Bartlett’s Test was significant (p < 0.001), showing the correlation matrix differed from an identity matrix and was suitable for factor extraction.
The PCA was then applied, retaining components with eigenvalues greater than 1 to ensure each factor explained more variance than a single variable. The analysis produced four factors, accounting for 58.897% of the total variance, which were categorized as CSMFs. In social, behavioral, and management sciences, where constructs are often latent, multi-dimensional, and subject to high measurement error (e.g., perception-based survey data), the standard requirement is typically lower than in the physical sciences. This leads methodologists to suggest that an explained cumulative variance of 50% to 60% is generally considered robust and acceptable. Specifically, Field [102] acknowledges that in many instances of psychological and social data, 50% is sufficient due to the inherent complexity and irreducible measurement error associated with these constructs.
Therefore, an explained variance of 58.897%, as observed in this study, is statistically strong and falls well within the academically recognized benchmark for research involving human perceptions and complex organizational dynamics.
To improve interpretability, Varimax rotation was used, as it maximizes variance among loadings and clarifies groupings. Factor loadings above 0.40 were considered significant, and all critical challenges exceeded this threshold (Table 5). The four extracted CSMFs and their corresponding labels are as follows:
Factor 1: Weak Planning, Coordination, and Implementation Deficiencies (WPCID);
Factor 2: Institutional and Operational Weaknesses (IOW);
Factor 3: Communication Problems (CP);
Factor 4: Legal Regulations, Bureaucratic Barriers, and Ethical Issues (LRBE).

4.5. Confirmatory Factor Analysis (CFA)

Table 5 presents the CFA outcomes, indicating that all factor loadings exceed the 0.5 threshold. The model achieved a χ2/df ratio of 2.122, a comparative fit index (CFI) of 0.97, a root mean square error of approximation (RMSEA) of 0.043, and a goodness-of-fit index (GFI) of 0.91, all of which meet the recommended model-fit criteria. Taken together, these statistics confirm that the CFA model demonstrates strong fit and is suitable for evaluating the reliability of the measurement scales.
Building on the satisfactory model-fit results reported above, Table 6 presents the composite reliability (CR) and average variance extracted (AVE) for each latent variable to assess convergent and discriminant validity further. All CR values range between 0.88 and 0.98, with a recommended threshold of 0.70, indicating strong internal consistency across the measurement items [103]. The AVE values range from 0.50 to 0.64, meeting the minimum criterion of 0.50 suggested by Fornell and Larcker [104]. Overall, the CR and AVE values in Table 6 demonstrate that the measurement model is both reliable and conceptually distinct, providing a strong foundation for subsequent SEM analysis.

4.6. Evaluating the Measurement Model

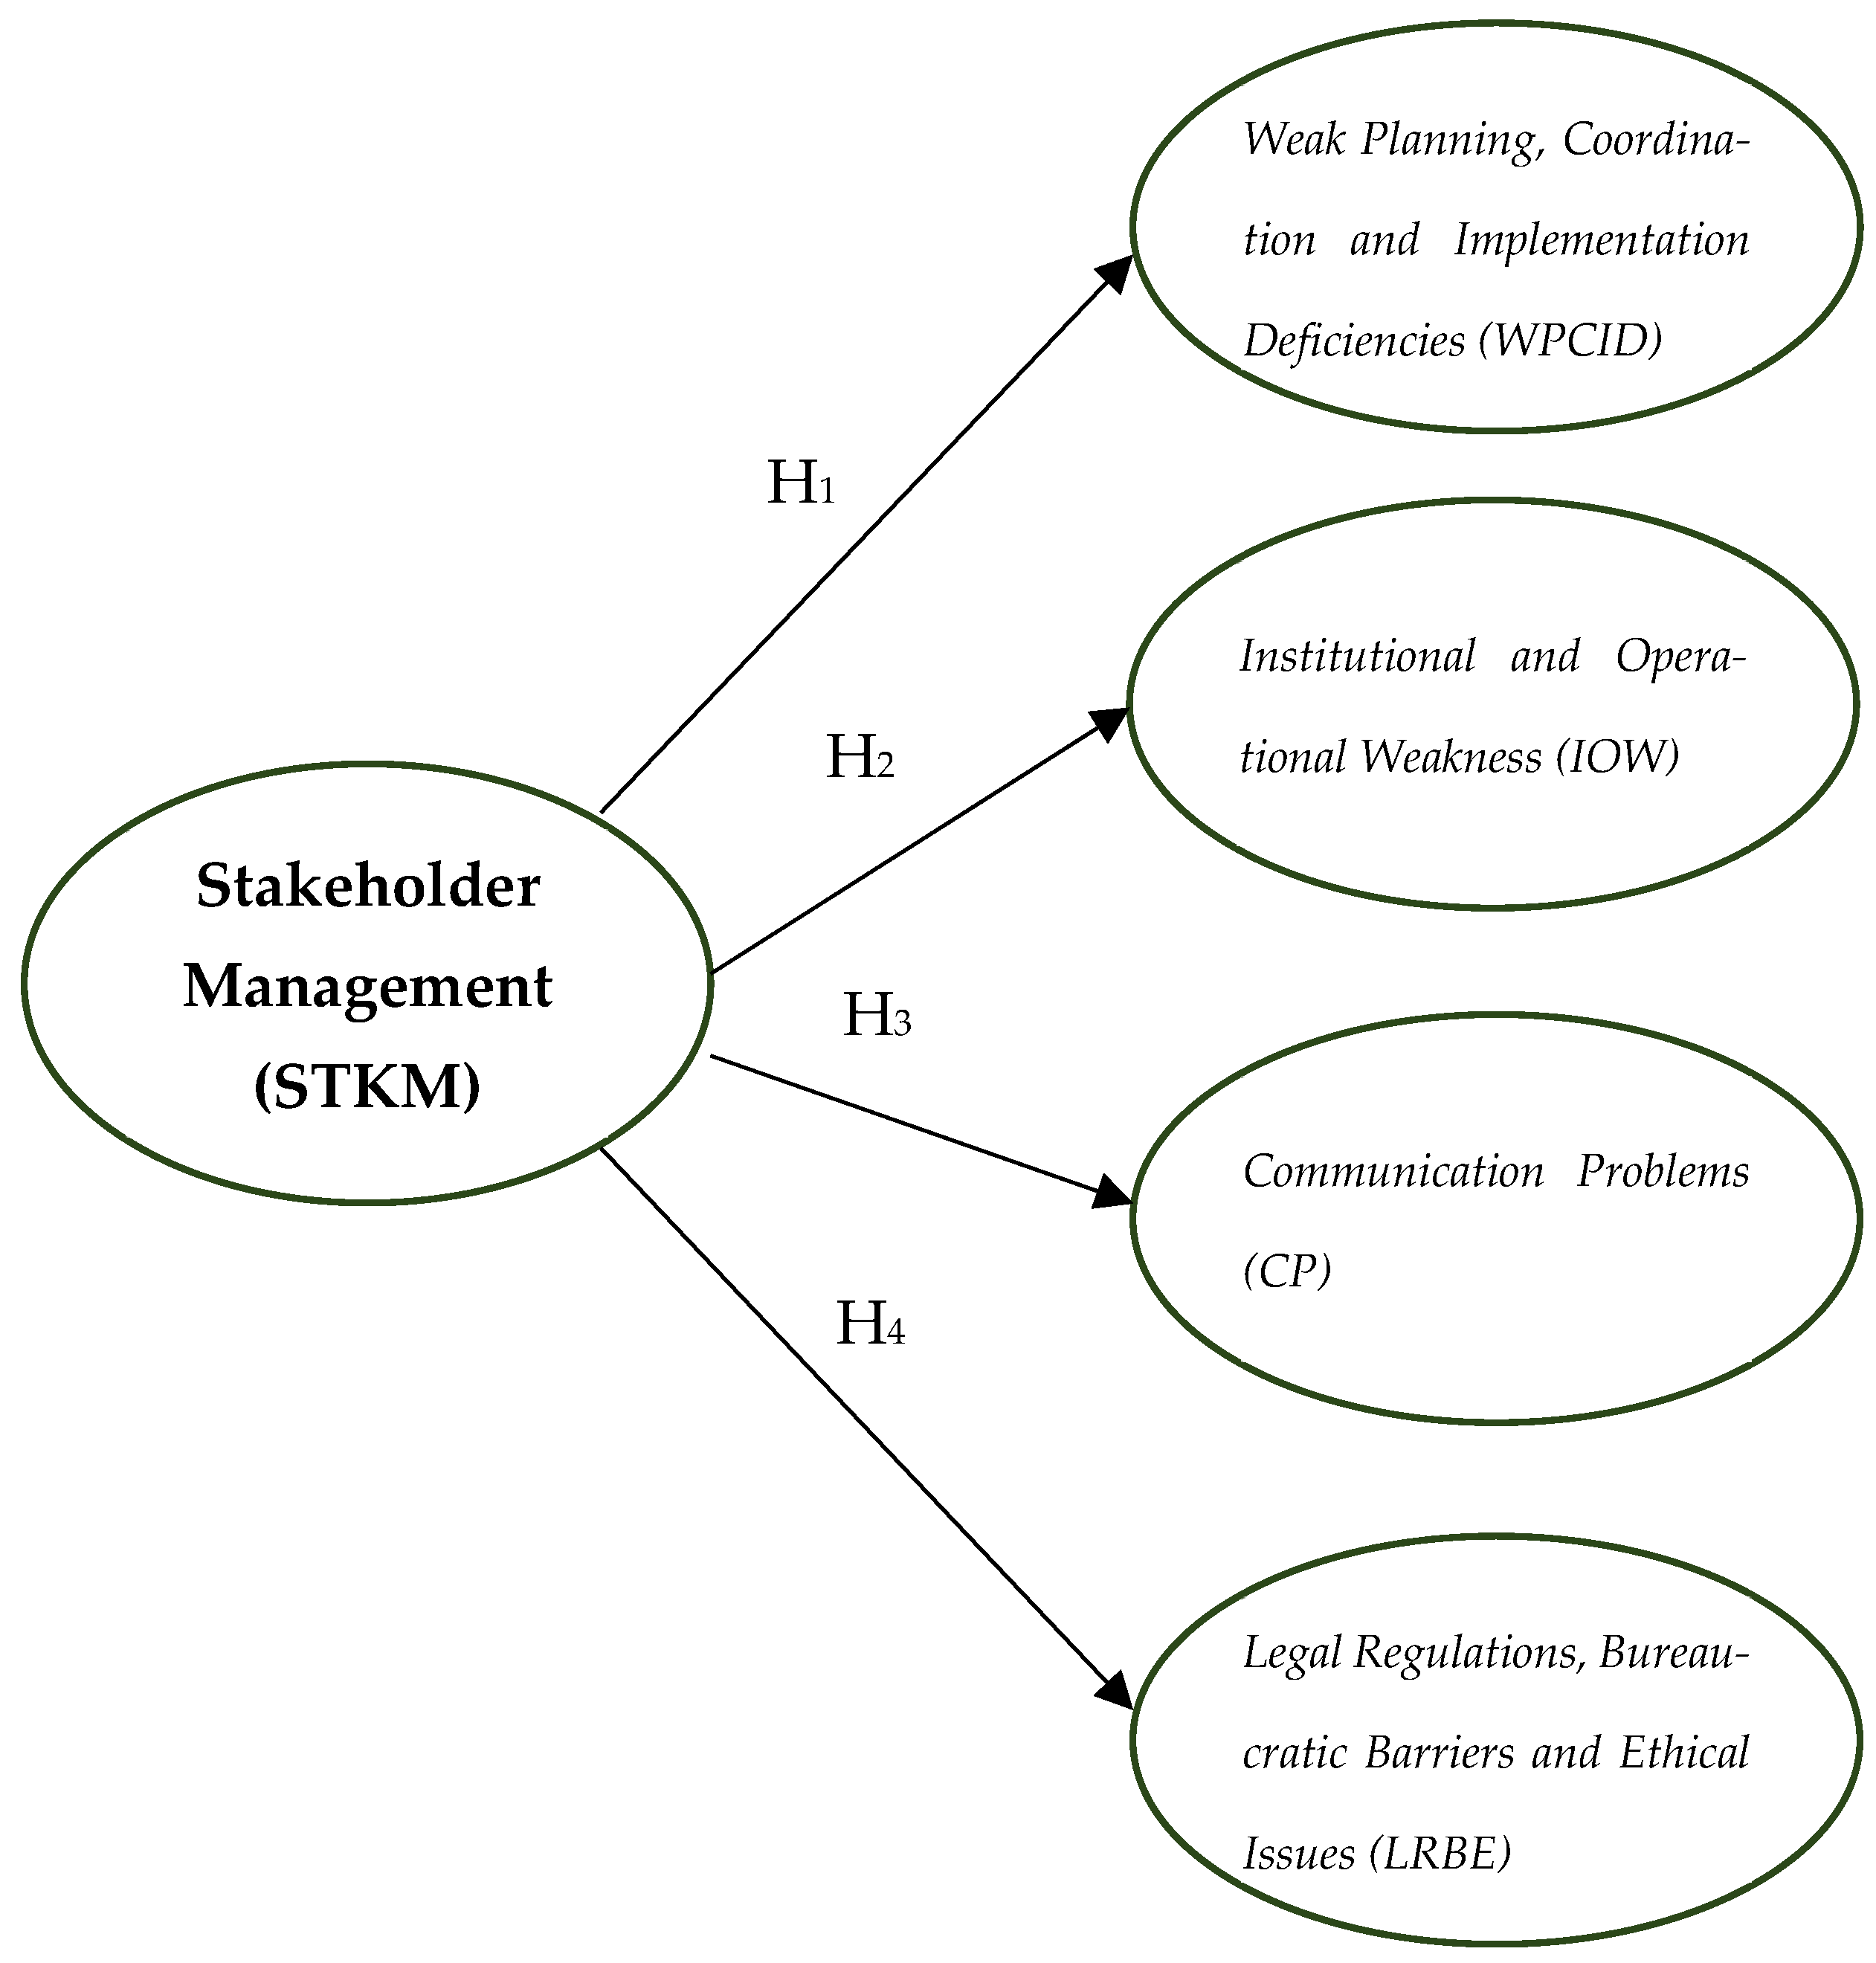
SEM was employed to examine how the four CSMFs affect stakeholder management. Figure 3 depicts the proposed structural framework, illustrating the hypothesized causal pathways supported by the CFA and reliability analyses. After establishing the validity of the measurement model through CFA, a conceptual SEM was formulated, generating four hypotheses (H1–H4). The model incorporates four latent constructs, each reflecting a key contributor to stakeholder management, and specifies their direct effects on the dependent variable, “Effective stakeholder management.” Each path in Figure 3 represents a theoretical link between two constructs and corresponds to one of the stated hypotheses.
Considering the four latent factors as critical stakeholder management factors, hypotheses were formulated as follows, and paths are shown in Figure 3:
H1: 
WPCID impacts on stakeholder management.
H2: 
IOW impacts on stakeholder management.
H3: 
CP impacts on stakeholder management.
H4: 
LRBE impacts on stakeholder management.

4.7. Reliability and Validity of the Model

To assess the consistency and validity of the latent constructs, Cronbach’s alpha (CA) (α) and composite reliability (CR) were calculated. All constructs achieved CR values between 0.96 and 0.88—well above the recommended benchmark of 0.70. Cronbach’s alpha values ranged from 0.88 to 0.96, likewise exceeding the minimum acceptable level. Internal consistency was further confirmed using the average variance extracted (AVE), with permissible values equal to or above 0.50 [104]. As summarized in Table 7, AVE values ranged from 0.50 to 0.64, supporting the adequacy of all components. Building on these results, a final SEM was estimated (Figure 3), and its goodness-of-fit indices and t-statistics—presented in Table 7 and Table 8—validated the robustness of the structural relationships.
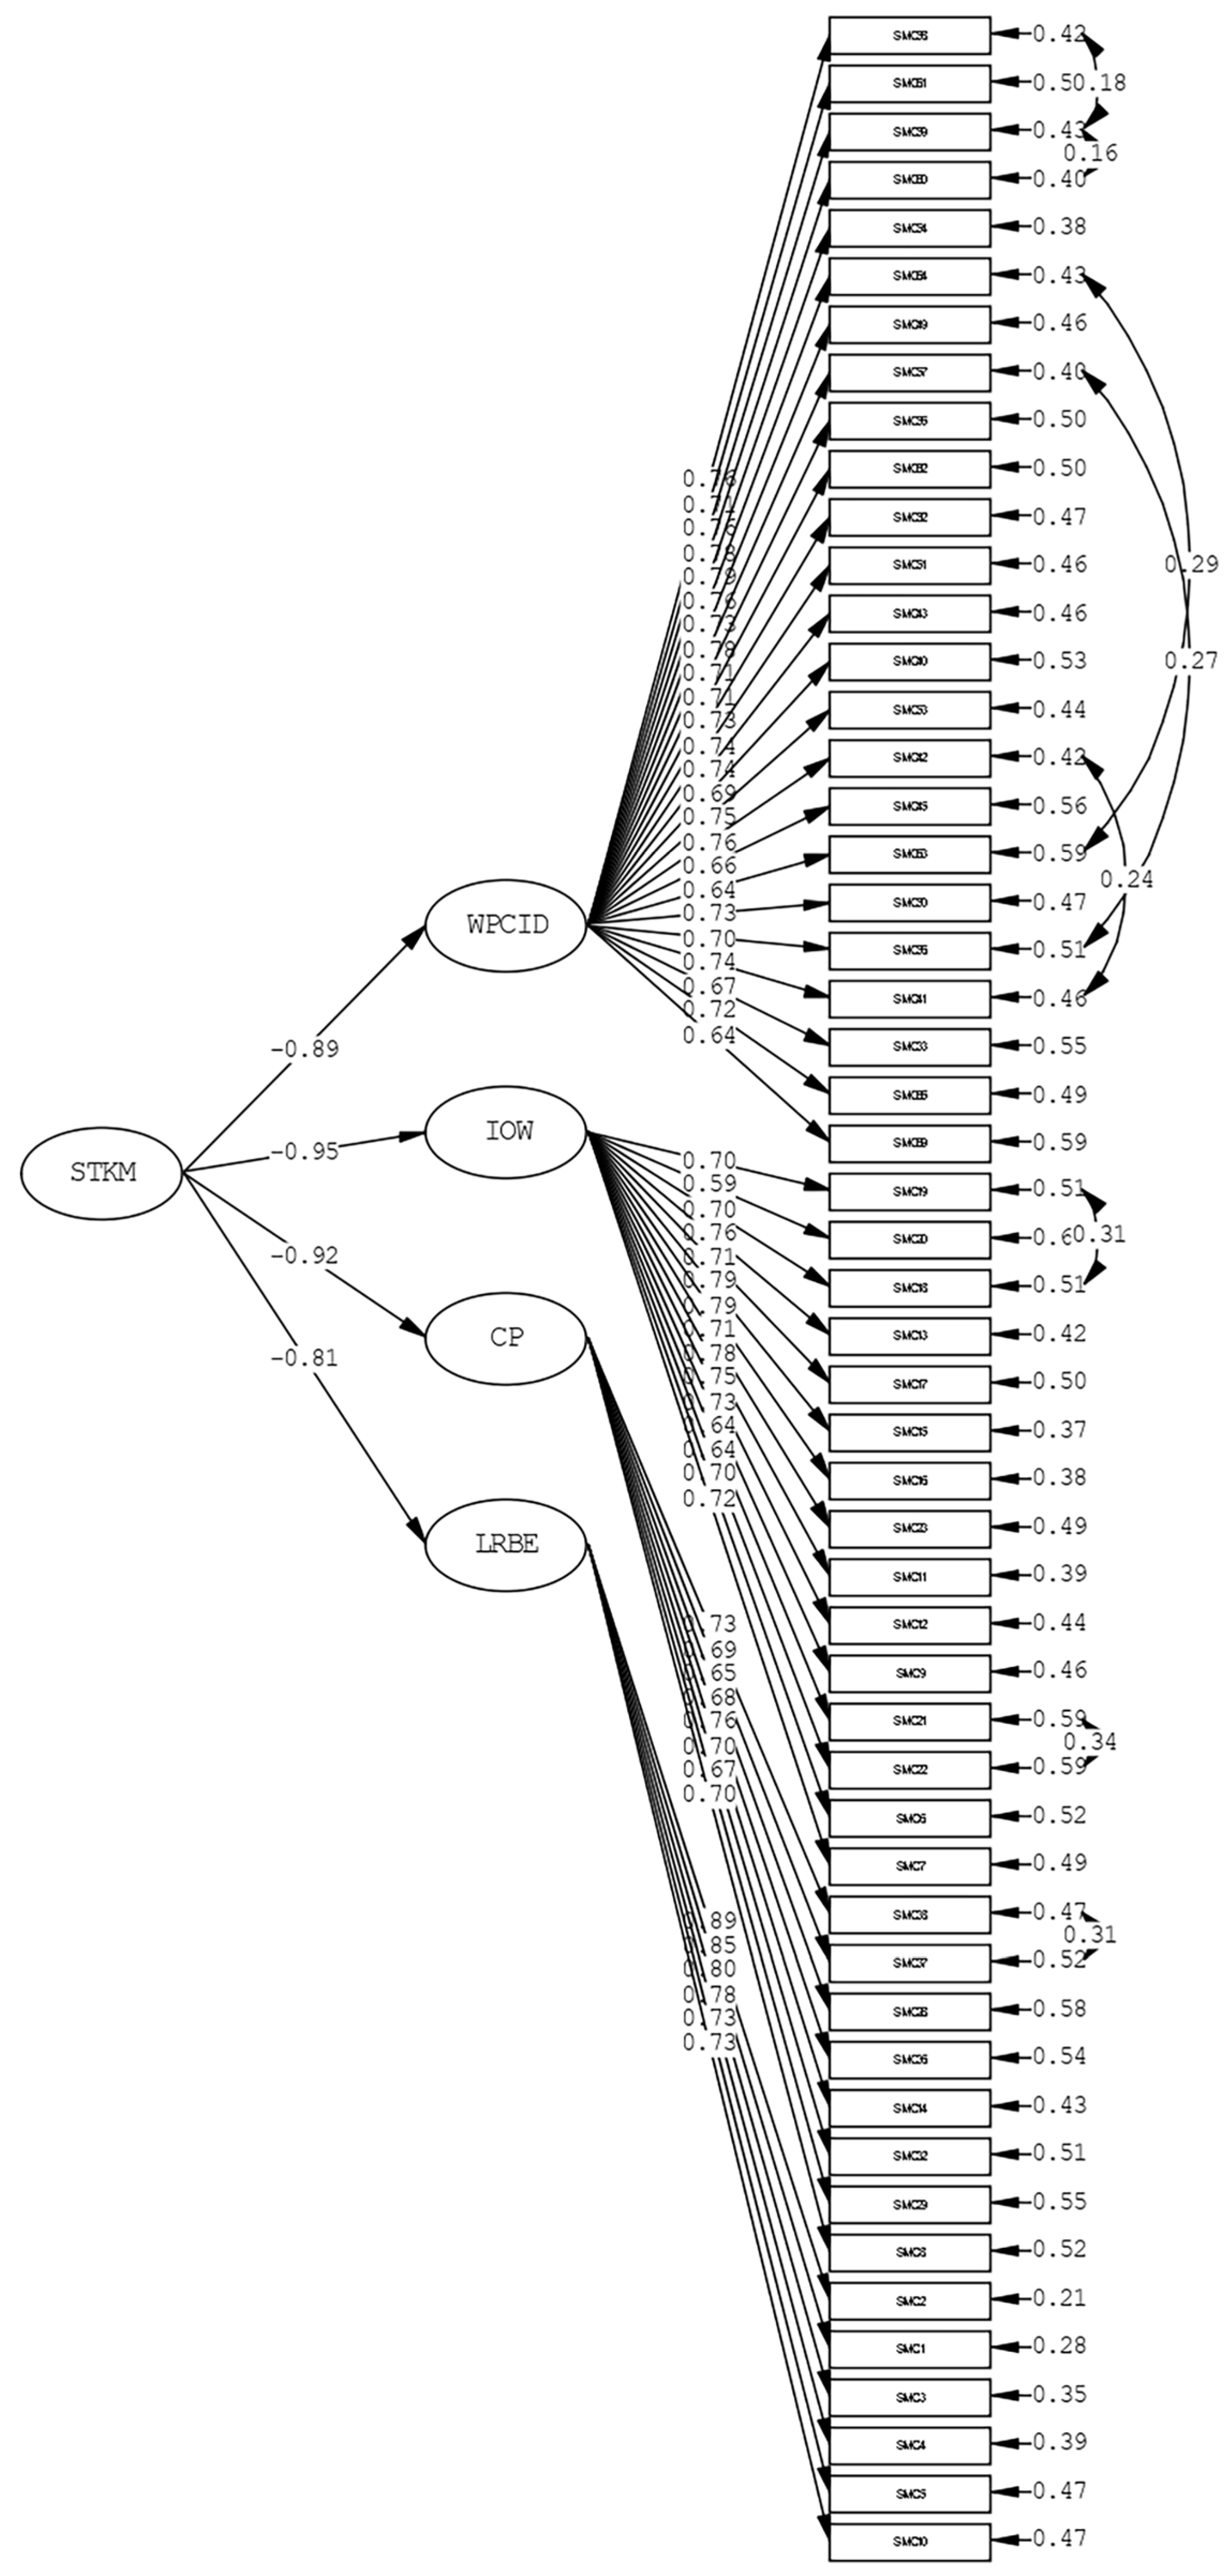
Building on the framework in Figure 3, the finalized SEM is presented in Figure 4, while the validation results—comprising GOF indices and t-values—are reported in Table 8 and Table 9.
As shown in Table 8 the finalized SEM achieves an acceptable level of fit, meeting the standard GOF benchmarks. The proposed pathways, along with their R2 values and effect sizes, are reported in Table 9.
At the 0.01 significance level, all hypotheses surpassed the critical one-tailed t-value of 2.58 (Table 9). The results further reveal that IOW (−0.95) and CP (−0.92) exert the most significant influence on stakeholder management, followed by WPCID (−0.89) and LRBE (−0.81).
The standardized path coefficients in Table 9 are relatively high and negative, ranging from −0.81 to −0.95. These values reflect the strong structural relationships between the four CSMFs and the dependent variable, effective stakeholder management.
First, the measurement model demonstrates excellent reliability and validity, with CR values ranging from 0.88 to 0.96 and AVE values ranging from 0.50 to 0.64, confirming that each construct is measured consistently and without excessive error. The strong internal consistency reduces noise, producing more precise parameter estimates.
Second, all model-fit indices fall within the recommended thresholds (e.g., χ2/df = 2.09, CFI = 0.97, RMSEA = 0.04), indicating that the SEM provides a good representation of the observed data and is not overfitted to sample-specific patterns.
Third, the negative coefficients are conceptually consistent with how the constructs were defined: each CSMF represents a challenge, meaning higher scores indicate more severe barriers. Therefore, a more substantial presence of these barriers naturally results in lower stakeholder management effectiveness, producing stable, strongly negative coefficients.
Finally, the high magnitudes are supported by the large explained variance (R2 = 0.66–0.90), showing that the factors collectively account for a substantial proportion of the variance in stakeholder management. This reflects the central role of structural deficiencies, coordination problems, information weaknesses, and regulatory/ethical hurdles in shaping performance.

5. Discussion

Stakeholder management is vital in construction projects due to complexity, diverse interests, and high risks. Multiple stakeholders with varying expectations make effective management essential for aligning interests, mitigating conflicts, and fostering collaboration. Identifying challenges improves efficiency, enhances performance, and supports construction’s social and economic sustainability.
In this study, SEM supported all four hypotheses. Figure 4 and Table 9 illustrate noticeable variations in the path coefficient values across the proposed hypotheses. Coefficients close to 1 typically reflect a very strong linkage, while those approaching 0 suggest a weak connection [103]. Based on these values, the influence of the key factors limiting stakeholder management can be grouped into two categories: coefficients between 1 and 0.81 indicate the most influential group, with a very strong impact, whereas coefficients ranging from 0.60 to 0.40 indicate a more moderate influence. In this study, all path coefficients were 0.81 or higher. The four critical stakeholder management factors are revealed below.

5.1. Institutional and Operational Weaknesses

Institutional and operational shortcomings are another key factor, stemming from structural issues, weak management, and low productivity [8]. Inadequate institutional capacity leads to stakeholder incompatibilities and delays [105], while poor governance limits long-term strategies and sustainable growth [106]. In developing contexts, these weaknesses intensify coordination problems [107].
According to this study’s findings, ICW is the most significant factor hindering stakeholder management, with a path coefficient of −0.95, which aligns closely with longstanding structural issues in Türkiye’s construction industry. The sector is characterized by uneven institutional capacity, frequent organizational restructuring, and varying levels of professional competence across firms [108]. In many projects—especially public or large-scale infrastructure works—bureaucratic fragmentation and overlapping responsibilities between agencies lead to delays in decisions, unclear authority, and inconsistent oversight. At the company level, operational systems such as quality management, documentation practices, and internal communication procedures are often not standardized, particularly among medium-sized contractors and subcontractors who dominate the market. These institutional gaps create uncertainty, slow responses to emerging problems, and hinder coordinated action among stakeholders. Because such weaknesses permeate both the regulatory environment and day-to-day project operations, practitioners in Türkiye experience them as the most influential barrier to effective stakeholder management.

5.2. Communication Problems

Stakeholder management is vital in construction projects, yet the large number of actors complicates coordination and often hinders communication [12]. CP has emerged as the second most influential factor, with a −0.92 path coefficient, which is consistent with common dynamics in Türkiye’s construction sector. Projects frequently involve multiple contractors, subcontractors, and suppliers working simultaneously, yet communication channels among these parties are often informal or fragmented [109]. Many firms—especially small and medium-sized ones—still rely on verbal instructions, informal communication tools such as WhatsApp messages, or undocumented agreements instead of standardized information systems. This creates inconsistencies in the transfer of design updates, site decisions, and stakeholder expectations. In large public or infrastructure projects, communication is further complicated by hierarchical structures and long reporting chains, which slow information flow and increase the likelihood of misunderstandings. Additionally, rapid project timelines and frequent scope changes can make maintaining timely, transparent communication difficult. These conditions explain why practitioners view communication-related issues as a significant barrier: they directly contribute to coordination failures, disputes, and misaligned expectations among stakeholders in Türkiye’s construction environment.

5.3. Weak Planning, Coordination, and Implementation Deficiencies

Weaknesses in planning and coordination affect all project stages, causing delays, cost overruns, and quality issues [107,110]. These problems are especially severe in developing countries with limited resources and flawed time management. Poor project management erodes trust, fuels conflicts, and increases the risk of failure [57,111]. Coordination problems also trigger design errors and rework, compounding delays [112].
Based on this study’s results, WPCID is the third most influential critical factor hindering stakeholder management, with a path coefficient of −0.89. Although this factor ranks third in terms of influence, its importance is closely linked to the structural features of Türkiye’s construction industry. Many projects operate under accelerated timelines driven by competitive tendering, political visibility, and rapid urban development pressures [113]. These conditions often reduce the time allocated for detailed planning and limit opportunities for early stakeholder engagement. In addition, the sector relies heavily on multilayered subcontracting, which can disrupt workflow coordination and create gaps in responsibility during implementation. Public sector projects frequently involve complex approval steps and mid-project scope adjustments, further weakening coordination efforts. As a result, even though other factors exert a more substantial overall influence, deficiencies in planning, coordination, and implementation remain a significant barrier in Türkiye because they amplify misunderstandings between stakeholders and contribute to avoidable delays and rework.
Effective planning and coordination are, therefore, essential. In large-scale projects, modern approaches such as Integrated Project Delivery (IPD) help mitigate these challenges [114].

5.4. Legal Regulations, Bureaucratic Barriers, and Ethical Issues

Another significant challenge in construction stakeholder management involves complex, frequently changing legal regulations, bureaucratic hurdles, and ethical concerns. LRBE is the fourth significant factor, yet it remains a notable challenge due to the regulatory landscape of Türkiye’s construction industry. Construction projects often require approvals from multiple public agencies, each with its own procedures, timelines, and documentation standards. This creates lengthy administrative cycles and uncertainty for project teams. Frequent changes to regulations—especially those related to zoning, safety, environmental requirements, and procurement—can also disrupt planning and require sudden adjustments [113]. In addition, issues such as inconsistent enforcement, varying interpretations of regulations across municipalities, and occasional ethical concerns in tendering or inspection processes further complicate stakeholder interactions. These systemic inefficiencies slow decision-making, limit transparency, and hinder trust between project participants. As a result, while this factor ranks lower than the others, it remains a meaningful constraint in Türkiye’s construction environment, influencing how smoothly stakeholders can collaborate and comply with project requirements.

6. Conclusions

This study employed a comprehensive methodological framework to identify the critical factors hindering effective stakeholder management. An SLR yielded 69 SMCs, which informed the development of a questionnaire. Data collected from 164 respondents were analyzed using the NMV approach, which highlighted 53 SMCs as critical challenges. Subsequently, EFA grouped these into four overarching CSMFs, namely, weak planning, coordination, and implementation deficiencies (WPCID); institutional and operational weaknesses (IOW); communication problems (CP); and legal regulations, bureaucratic barriers, and ethical issues (LRBE).
SEM was utilized to examine the effects of these CSMFs. The results indicated that the most influential CSMFs were IOW and CP, with path coefficients of −0.95 and −0.92, respectively. Additionally, WPCID and LRBE emerged as significant contributors, with path coefficients of −0.89 and −0.81, respectively.
Based on the SEM findings, the four factors were ranked by their impact on stakeholder management performance. Institutional and operational weaknesses emerged as the most influential factor, followed by communication problems, planning/coordination deficiencies, and finally legal and bureaucratic/ethical issues. This ranking guided the prioritization of intervention measures.

6.1. Practical, Conceptual, and Empirical Implications

This study identifies four critical factors in Türkiye’s construction industry—weak planning and coordination; institutional and operational weaknesses; communication problems; and legal, bureaucratic, and ethical challenges—with implications for practitioners, policymakers, and researchers. Addressing them requires practical interventions, institutional reforms, and theoretical advances.
Institutional and operational weaknesses in the construction sector: implications for practitioners and policymakers
Given its significant negative impact on stakeholder management, improving institutional and operational mechanisms should be the priority. Practitioners may establish stakeholder-management protocols (stakeholder mapping, engagement plans, responsibility charts) to ensure that all critical stakeholders are identified early and integrated systematically throughout the project lifecycle. Furthermore, practitioners may create cross-departmental stakeholder coordination units or assign stakeholder coordinators to align design, site, and management teams with stakeholder expectations. On the other hand, policymakers should mandate standardized stakeholder management frameworks (e.g., templates for stakeholder analysis, engagement logs, and conflict-resolution protocols) to ensure consistency across firms. In addition, they should introduce certification or compliance requirements for organizational systems that enhance stakeholder coordination and transparency.
Communication problems in construction projects: implications for practitioners and policymakers
Since communication problems are the second most influential factor, construction organizations should address them. Within this scope, practitioners may implement structured communication pathways for all stakeholder interactions, including formal procedures for reporting design changes, documenting client decisions, and sharing updates with contractors/subcontractors. Additionally, practitioners may use digital platforms that track stakeholder actions—such as issue-tracking tools, approval workflows, and real-time collaboration environments—to ensure no stakeholder input is lost or misinterpreted. Developing minimum communication standards that require firms to maintain traceable stakeholder communication records, including meeting minutes, change requests, and formal approvals. Additionally, policymakers may encourage or require the adoption of common data environments (CDEs) to support transparent, multi-stakeholder information sharing.
Weak planning, coordination, and implementation deficiencies in the construction process: implications for practitioners and policymakers
To minimize deficiencies in planning, coordination, and implementation in the construction process, practitioners may integrate stakeholders into early planning stages through co-design workshops, risk-planning sessions, and joint scheduling meetings to avoid downstream misunderstandings. Furthermore, practitioners use BIM-supported stakeholder coordination models (e.g., 4D simulations, design reviews) to visualize impacts of stakeholder decisions and reduce interface conflicts. On the other hand, policymakers should require stakeholder-inclusive planning guidelines that define how public agencies, clients, contractors, and communities must be consulted and engaged during primary project stages. Additionally, they should develop evaluation criteria that assess how well firms incorporate stakeholder feedback into planning, risk assessment, and coordination processes.
Legal regulations, bureaucratic barriers, and ethical issues in the construction sector: implications for practitioners and policymakers
Although ranked fourth, legal regulations, bureaucratic barriers, and ethical issues require attention due to their systemic impact. To minimize this issue, practitioners should use standardized and transparent contract clauses that clearly define stakeholder roles, communication responsibilities, escalation procedures, and dispute-resolution mechanisms. Furthermore, they may implement ethical stakeholder-engagement policies—including transparent reporting, anti-bribery measures, and fair consultation practices—to reduce conflict and maintain trust. When the issue is considered within the scope of policymakers, they should streamline approval processes involving multiple stakeholders (municipalities, utilities, regulatory bodies) to reduce delays and improve coordination. Finally, policymakers should develop legal guidelines for stakeholder engagement that clarify authority, establish documentation standards, and specify expected timelines for stakeholder approvals.

6.2. Educational Implications

This study’s findings have several implications for construction education and professional development. Critical barriers such as inappropriate contractor selection, workforce qualification gaps, and subcontractor competence highlight the need to integrate stakeholder management into architecture, engineering, and construction (AEC) curricula. Courses on procurement, contract administration, conflict resolution, and collaborative project delivery, along with case-based learning and simulations, can prepare students for complex stakeholder environments.
Continuous professional development programs should target contractors, subcontractors, and consultants, focusing on enhancing their communication, negotiation, and collaboration skills. Stronger university–industry partnerships, where students engage in live projects, can bridge theory and practice. Curricula should also cover construction law, ethics, and governance to equip graduates with the policy literacy and ethical decision-making skills necessary for informed policy-making. While based in Türkiye, these insights are relevant to other developing economies with similar challenges.

6.3. Limitations and Future Research Directions

This study has some limitations. The SLR used only the WoS database; including Scopus or Google Scholar in future reviews could broaden coverage. Expanding stakeholder scope to include workers and related professions would provide a fuller perspective. Comparative studies across developing countries using standardized measures could enhance generalizability. While this study provides valuable insights into stakeholder-related challenges in Türkiye’s construction sector, several methodological considerations should be noted. First, the analysis is based on Likert-type items, which are ordinal; however, treating such data as approximately continuous is widely accepted in SEM applications when distributions do not show substantial deviations, as was the case here. Second, EFA, CFA, and SEM were conducted on the same dataset. Given the sample size, dividing the data into separate subsamples would have reduced statistical power and potentially produced unstable estimates. To address this, we conducted comprehensive reliability and validity assessments and obtained a strong model fit, which strengthens confidence in the findings. Future research with larger datasets could compare alternative models or test hierarchical or bifactor structures to further confirm and refine the framework. Third, non-probability purposive sampling was used to ensure participation from professionals with relevant experience. Another methodological consideration is that the study did not include additional sensitivity analyses, such as alternative model specifications or subsample validations. Conducting such procedures typically requires larger samples or multiple theoretically grounded model variations, which were beyond the scope of the present design. Instead, model robustness was supported through strong global fit indices and consistent reliability and validity evidence. Future research using larger or multi-site samples could incorporate sensitivity tests—such as split-sample validation, bootstrapping-based comparisons, or alternative structural models—to further assess the stability and generalizability of the framework. Finally, the initial SMC list was intentionally inclusive to reflect the diversity of concepts in prior studies; subsequent filtering and factor-analytic procedures substantially reduced overlap and improved construct clarity. These considerations do not undermine the results but offer context for interpreting the findings and identifying opportunities for future research.


Author Contributions

Conceptualization, G.G.A.; methodology, G.G.A.; software, G.G.A.; validation, G.G.A. and E.Y.D.; formal analysis, G.G.A.; investigation, E.Y.D.; resources, G.G.A. and E.Y.D.; data curation, G.G.A. and E.Y.D.; writing—original draft preparation, G.G.A.; writing—review and editing, G.G.A. and E.Y.D. visualization, G.G.A.; supervision, G.G.A.; funding acquisition, G.G.A. All authors have read and agreed to the published version of the manuscript.

Funding

This research received no external funding.

Data Availability Statement

The raw data supporting the conclusions of this article will be made available by the authors on request.

Conflicts of Interest

The authors declare no conflicts of interest.

Abbreviations

The following abbreviations are used in this manuscript:
SMCsStakeholder management challenges
CCsCritical challenges
NMVNormalized mean value analysis
EFAExploratory factor analysis
CFAConfirmatory factor analysis
GDPGross domestic product
RQResearch question
SLRSystematic literature review
CSMFsCritical stakeholder management factors
KMOKaiser–Meyer–Olkin
PCAPrincipal Component Analysis
CFIComparative fit index
RMSEARoot mean square error of approximation
GFIgoodness-of-fit index
CACronbach’s alpha
CRComposite reliability
AVEAverage variance extracted
AGFIAdjusted goodness-of-fit index
NFINormed fit index
STKMStakeholder management

References

  1. Oppong, G.D.; Chan, A.P.C.; Dansoh, A. A Review of Stakeholder Management Performance Attributes in Construction Projects. Int. J. Proj. Manag. 2017, 35, 1037–1051. [Google Scholar] [CrossRef] [Scilit]
  2. Pajunen, K. Stakeholder Influences in Organizational Survival. J. Manag. Stud. 2006, 43, 1261–1288. [Google Scholar] [CrossRef] [Scilit]
  3. Bryson, J.M. What to Do When Stakeholders Matter: Stakeholder Identificatixon and Analysis Techniques. Public Manag. Rev. 2004, 6, 21–53. [Google Scholar] [CrossRef] [Scilit]
  4. Freeman, R.E. Strategic Management: A Stakeholder Approach; Cambridge University Press: Cambridge, UK, 2010. [Google Scholar]
  5. Chinyio, E.; Olomolaiye, P.O. Introducing Stakeholder Management. In Construction Stakeholder Management; Chinyio, E., Olomolaiye, P.O., Eds.; Wiley-Blackwell: Hoboken, NJ, USA, 2010; p. 392. ISBN 9781405180986. [Google Scholar]
  6. Saad, A.; Zahid, S.M.; Muhammad, U. Bin Role of Awareness in Strengthening the Relationship between Stakeholder Management and Project Success in the Construction Industry of Pakistan. Int. J. Constr. Manag. 2022, 22, 1884–1893. [Google Scholar] [CrossRef] [Scilit]
  7. Carroll, A.B.; Shabana, K.M. The Business Case for Corporate Social Responsibility: A Review of Concepts, Research and Practice. Int. J. Manag. Rev. 2010, 12, 85–105. [Google Scholar] [CrossRef] [Scilit]
  8. Winch, G. Megaproject Stakeholder Management. In The Oxford Handbook of Megaproject; Flvbjerg, B., Ed.; Oxford University Press: Oxford, UK, 2017. [Google Scholar]
  9. Chan, A.P.C.; Chan, A.P.L. Key Performance Indicators for Measuring Construction Success. Benchmarking 2004, 11, 203–221. [Google Scholar] [CrossRef] [Scilit]
  10. Olander, S. Stakeholder Impact Analysis in Construction Project Management. Constr. Manag. Econ. 2007, 25, 277–287. [Google Scholar] [CrossRef] [Scilit]
  11. Olander, S.; Landin, A. Evaluation of Stakeholder Influence in the Implementation of Construction Projects. Int. J. Proj. Manag. 2005, 23, 321–328. [Google Scholar] [CrossRef] [Scilit]
  12. Bourne, L.; Walker, D.H.T. Project Relationship Management and the Stakeholder CircleTM. Int. J. Manag. Proj. Bus. 2008, 1, 125–130. [Google Scholar] [CrossRef] [Scilit]
  13. Bourne, L.; Walker, D.H.T. Visualising and Mapping Stakeholder Influence. Manag. Decis. 2005, 43, 649–660. [Google Scholar] [CrossRef] [Scilit]
  14. Project Management Institute. A Guide to the Project Management Body of Knowledge PMBOK GUIDE, 7th ed.; PMI Standard: Newtown Square, PA, USA, 2021. [Google Scholar]
  15. Yang, J.; Shen, Q.; Ho, M. An Overview of Previous Studies in Stakeholder Management and Its Implications for the Construction Industry. J. Facil. Manag. 2009, 7, 159–175. [Google Scholar] [CrossRef] [Scilit]
  16. Taimu, M.; Awuzie, B.; Ngowi, A. Success Factors for Effective Contractor-Led Stakeholder Relationship Management: Perspectives from the Botswana Construction Industry. MATEC Web Conf. 2020, 312, 02014. [Google Scholar] [CrossRef] [Scilit]
  17. Ola-awo, W.A.; Alayande, A.; Bashir, G.O.; Oyewobi, L.O. Critical Success Factors for Effective Internal Construction Stakeholder Management in Nigeria. Acta Structilia 2021, 28, 1–31. [Google Scholar] [CrossRef] [Scilit]
  18. Eyiah-Botwe, E.; Aigbavboa, C.; Thwala, W.D. Mega Construction Projects: Using Stakeholder Management for Enhanced Sustainable Construction. Am. J. Eng. Res. 2016, 5, 80–86. [Google Scholar]
  19. Kululanga, G. Capacity Building of Construction Industries in Sub-Saharan Developing Countries: A Case for Malawi. Eng. Constr. Archit. Manag. 2012, 19, 86–100. [Google Scholar] [CrossRef] [Scilit]
  20. Onososen, A.O.; Musonda, I.; Moyo, T.; Muzioreva, H. Digital Twin Technology in Health, Safety, and Wellbeing Management in the Built Environment. In Smart and Resilient Infrastructure for Emerging Economies: Perspectives on Building Better; CRC Press: Boca Raton, FL, USA, 2023; pp. 109–115. [Google Scholar]
  21. Asante, L.A.; Mills, R.O. Exploring the Socio-Economic Impact of COVID-19 Pandemic in Marketplaces in Urban Ghana Asante and Mills. Afr. Spectr. 2020, 55, 170–181. [Google Scholar] [CrossRef] [Scilit]
  22. Bon, R. The Future of International Construction Secular Patterns of Growth and Decline. Habitat Intl 1992, 16, 119–128. [Google Scholar] [CrossRef] [Scilit]
  23. Sertyeşilişik, B. Global Trends in the Construction Industry: Challenges of Employment. In Handbook of Research on Unemployment and Labor Market Sustainability in the Era of Globalization; IGI Global: Hershey, PA, USA, 2017; pp. 255–274. ISBN 9781522520092. [Google Scholar]
  24. Gurcanli, G.E.; Bilir Mahcicek, S.; Serpel, E.; Attia, S. Factors Affecting Productivity of Technical Personnel in Turkish Construction Industry: A Field Study. Arab. J. Sci. Eng. 2021, 46, 11339–11353. [Google Scholar] [CrossRef] [Scilit]
  25. Ali, H.H.; Alkayed, A.A. Constrains and Barriers of Implementing Sustainability into Architectural Professional Practice in Jordan. Alex. Eng. J. 2019, 58, 1011–1023. [Google Scholar] [CrossRef] [Scilit]
  26. Darko, A.; Zhang, C.; Chan, A.P.C. Drivers for Green Building: A Review of Empirical Studies. Habitat Int. 2017, 60, 34–49. [Google Scholar] [CrossRef] [Scilit]
  27. Karji, A.; Namian, M.; Tafazzoli, M. Identifying the Key Barriers to Promote Sustainable Construction in the United States: A Principal Component Analysis. Sustainability 2020, 12, 5088. [Google Scholar] [CrossRef] [Scilit]
  28. Zhao, X.; Hwang, B.G.; Low, S.P. Critical Success Factors for Enterprise Risk Management in Chinese Construction Companies. Constr. Manag. Econ. 2013, 31, 1199–1214. [Google Scholar] [CrossRef] [Scilit]
  29. Liao, L.; Teo, E.A.L. Critical Success Factors for Enhancing the Building Information Modelling Implementation in Building Projects in Singapore. J. Civ. Eng. Manag. 2017, 23, 1029–1044. [Google Scholar] [CrossRef] [Scilit]
  30. Xia, N.; Zou, P.X.W.; Griffin, M.A.; Wang, X.; Zhong, R. Towards Integrating Construction Risk Management and Stakeholder Management: A Systematic Literature Review and Future Research Agendas. Int. J. Proj. Manag. 2018, 36, 701–715. [Google Scholar] [CrossRef] [Scilit]
  31. Yang, J.; Shen, G.Q.; Ho, M.; Drew, D.S.; Xue, X. Stakeholder Management in Construction: An Empirical Study to Address Research Gaps in Previous Studies. Int. J. Proj. Manag. 2011, 29, 900–910. [Google Scholar] [CrossRef] [Scilit]
  32. Mok, K.Y.; Shen, G.Q.; Yang, J. Stakeholder Management Studies in Mega Construction Projects: A Review and Future Directions. Int. J. Proj. Manag. 2015, 33, 446–457. [Google Scholar] [CrossRef] [Scilit]
  33. Prebanić, K.R.; Vukomanović, M. Realizing the Need for Digital Transformation of Stakeholder Management: A Systematic Review in the Construction Industry. Sustainability 2021, 13, 12690. [Google Scholar] [CrossRef] [Scilit]
  34. Yang, R.J.; Shen, G.Q.P. Framework for Stakeholder Management in Construction Projects. J. Manag. Eng. 2015, 31, 04014064. [Google Scholar] [CrossRef] [Scilit]
  35. Frempong-Jnr, E.Y.; Ametepey, S.O.; Cobbina, J.E. Impact of Stakeholder Management on Efficient Construction Waste Management. Smart Sustain. Built Environ. 2023, 12, 607–634. [Google Scholar] [CrossRef] [Scilit]
  36. Yang, J.; Shen, G.Q.; Drew, D.S.; Ho, M. Critical Success Factors for Stakeholder Management: Construction Practitioners’ Perspectives. J. Constr. Eng. Manag. 2010, 136, 778–787. [Google Scholar] [CrossRef] [Scilit]
  37. Mashali, A.; Elbeltagi, E.; Motawa, I.; Elshikh, M. Stakeholder Management Challenges in Mega Construction Projects: Critical Success Factors. J. Eng. Des. Technol. 2023, 21, 358–375. [Google Scholar] [CrossRef] [Scilit]
  38. Klaus-Rosińska, A.; Iwko, J. Stakeholder Management—One of the Clues of Sustainable Project Management—As an Underestimated Factor of Project Success in Small Construction Companies. Sustainability 2021, 13, 9877. [Google Scholar] [CrossRef] [Scilit]
  39. Sohu, S.; Jhatial, A.A.; Jamali, Q.B.; Buller, A.H.; Bhatti, I.A. Critical Cost Overrun Factors and Its Controlling Measures in Construction Sector of Pakistan. Quaid-E-Awam Univ. Res. J. Eng. Sci. Technol. 2021, 19, 70–76. [Google Scholar] [CrossRef] [Scilit]
  40. Charan, V.; Sindhu Vaardini, U. Investigation of Current Practices and Challenges of Stakeholder Management Process in Construction Projects. Int. J. Sci. Res. Eng. Manag. 2024, 8, 1–7. [Google Scholar] [CrossRef] [Scilit]
  41. Mashali, A.; Eltantawy, A. Practical Approach for Analysing and Engaging Stakeholders in Construction Megaprojects. Build. Eng. 2024, 2, 509. [Google Scholar] [CrossRef] [Scilit]
  42. Ebekozien, A.; Aigbavboa, C.O.; Ramotshela, M. A Qualitative Approach to Investigate Stakeholders’ Engagement in Construction Projects. Benchmarking 2024, 31, 866–883. [Google Scholar] [CrossRef] [Scilit]
  43. Ali, M.; Ur Rehman, S.; Qadeer, A. Fulfilling Stakeholder Needs and Concerns: A Path to Satisfaction in Construction Projects. Constr. Technol. Archit. 2025, 17, 73–80. [Google Scholar]
  44. Tranfield, D.; Denyer, D.; Smart, P. Towards a Methodology for Developing Evidence-Informed Management Knowledge by Means of Systematic Review. Br. J. Manag. 2003, 14, 207–222. [Google Scholar] [CrossRef] [Scilit]
  45. Liberati, A.; Altman, D.G.; Tetzlaff, J.; Mulrow, C.; Gøtzsche, P.C.; Ioannidis, J.P.A.; Clarke, M.; Devereaux, P.J.; Kleijnen, J.; Moher, D. The PRISMA Statement for Reporting Systematic Reviews and Meta-Analyses of Studies That Evaluate Health Care Interventions: Explanation and Elaboration. PLoS Med. 2009, 6, e1000100. [Google Scholar] [CrossRef] [Scilit]
  46. Bhagwat, K.; Delhi, V.S.K. A Systematic Review of Construction Safety Research: Quantitative and Qualitative Content Analysis Approach. Built Environ. Proj. Asset Manag. 2022, 12, 243–261. [Google Scholar] [CrossRef] [Scilit]
  47. Musarat, M.A.; Sadiq, A.; Alaloul, W.S.; Abdul Wahab, M.M. A Systematic Review on Enhancement in Quality of Life through Digitalization in the Construction Industry. Sustainability 2023, 15, 202. [Google Scholar] [CrossRef] [Scilit]
  48. Xia, N.; Ding, S.; Ling, T.; Tang, Y. Safety Climate in Construction: A Systematic Literature Review. Eng. Constr. Archit. Manag. 2024, 31, 3973–4000. [Google Scholar] [CrossRef] [Scilit]
  49. Kuhrmann, M.; Fernández, D.M.; Daneva, M. On the Pragmatic Design of Literature Studies in Software Engineering: An Experience-Based Guideline. Empir. Softw. Eng. 2017, 22, 2852–2891. [Google Scholar] [CrossRef] [Scilit]
  50. Yadav, N.; Luthra, S.; Garg, D. Blockchain Technology for Sustainable Supply Chains: A Network Cluster Analysis and Future Research Propositions. Environ. Sci. Pollut. Res. 2023, 30, 64779–64799. [Google Scholar] [CrossRef] [Scilit]
  51. Valderrama-Zurián, J.C.; Aguilar-Moya, R.; Melero-Fuentes, D.; Aleixandre-Benavent, R. A Systematic Analysis of Duplicate Records in Scopus. J. Inf. 2015, 9, 570–576. [Google Scholar] [CrossRef] [Scilit]
  52. Song, J.; Zhang, H.; Dong, W. A Review of Emerging Trends in Global PPP Research: Analysis and Visualization. Scientometrics 2016, 107, 1111–1147. [Google Scholar] [CrossRef] [Scilit]
  53. de Araújo, M.C.B.; Alencar, L.H.; de Miranda Mota, C.M. Project Procurement Management: A Structured Literature Review. Int. J. Proj. Manag. 2017, 35, 353–377. [Google Scholar] [CrossRef] [Scilit]
  54. Stekelorum, R. The Roles of SMEs in Implementing CSR in Supply Chains: A Systematic Literature Review. Int. J. Logist. Res. Appl. 2020, 23, 228–253. [Google Scholar] [CrossRef] [Scilit]
  55. Shi, J.; Duan, K.; Wu, G.; Zhang, R.; Feng, X. Comprehensive Metrological and Content Analysis of the Public–Private Partnerships (PPPs) Research Field: A New Bibliometric Journey. Scientometrics 2020, 124, 2145–2184. [Google Scholar] [CrossRef] [Scilit]
  56. Wang, Y.; Yao, Y.; Zhang, Y.; Xiang, L. A Framework of Stakeholder Relationship Analysis for an Urban Regeneration Project Based on Social Network Analysis: A Dynamic Perspective. J. Urban Plan. Dev. 2022, 148, 04022035. [Google Scholar] [CrossRef] [Scilit]
  57. Doloi, H. Assessing Stakeholders’ Influence on Social Performance of Infrastructure Projects. Facilities 2012, 30, 531–550. [Google Scholar] [CrossRef] [Scilit]
  58. Nguyen, P.V.; Bui, T.D.; Do, H.S.T. The Relationship Between Project Management Performance and Stakeholder Satisfaction in Vietnam: Perspectives from the Construction Industry. Int. J. Innov. Creat. Chang. 2020, 11, 331–352. [Google Scholar]
  59. Zhang, L.; El-Gohary, N.M.; Asce, A.M. Discovering Stakeholder Values for Axiology-Based Value Analysis of Building Projects. J. Constr. Eng. Manag. 2015, 142, 04015095. [Google Scholar] [CrossRef] [Scilit]
  60. AL-Fadhali, N. An AMOS-SEM Approach to Evaluating Stakeholders’ Influence on Construction Project Delivery Performance. Eng. Constr. Archit. Manag. 2024, 31, 638–661. [Google Scholar] [CrossRef] [Scilit]
  61. Sanda, Y.N.; Anigbogu, N.A.; Izam, Y.D.; Nuhu, L.Y. Managing Stakeholder Opportunism in Public-Private Partnership (PPP) Housing Projects. J. Constr. Dev. Ctries. 2022, 27, 213–228. [Google Scholar] [CrossRef] [Scilit]
  62. Karlsen, J.T.; Græe, K.; Massaoud, M.J. Building Trust in Project-Stakeholder Relationships. Balt. J. Manag. 2008, 3, 7–22. [Google Scholar] [CrossRef] [Scilit]
  63. Lewicki, R.J.; McAllister, D.J.; Bies, R.J. Trust and Distrust: New Relationships and Realities. Acad. Manag. Rev. 1998, 23, 438–458. [Google Scholar] [CrossRef] [Scilit]
  64. Atkin, B.; Skitmore, M. Editorial: Stakeholder Management in Construction. Constr. Manag. Econ. 2008, 26, 549–552. [Google Scholar] [CrossRef] [Scilit]
  65. Li, H.; Zhang, X.; Ng, S.T.; Skitmore, M. Quantifying Stakeholder Influence in Decision/Evaluations Relating to Sustainable Construction in China—A Delphi Approach. J. Clean. Prod. 2018, 173, 160–170. [Google Scholar] [CrossRef] [Scilit]
  66. Mok, K.Y.; Shen, G.Q.; Yang, R.J.; Li, C.Z. Investigating Key Challenges in Major Public Engineering Projects by a Network-Theory Based Analysis of Stakeholder Concerns: A Case Study. Int. J. Proj. Manag. 2017, 35, 78–94. [Google Scholar] [CrossRef] [Scilit]
  67. Zwikael, O.; Smyrk, J.R. Stakeholder Management. In Project Management; Springer: Cham, Switzerland, 2019; ISBN 9783030031732. [Google Scholar]
  68. Bal, M.; Bryde, D.; Fearon, D.; Ochieng, E. Stakeholder Engagement: Achieving Sustainability in the Construction Sector. Sustainability 2013, 5, 695–710. [Google Scholar] [CrossRef] [Scilit]
  69. Zhao, X.; Hwang, B.G.; Low, S.P. Enterprise Risk Management in International Construction Firms: Drivers and Hindrances. Eng. Constr. Archit. Manag. 2015, 22, 347–366. [Google Scholar] [CrossRef] [Scilit]
  70. Xue, J.; Shen, G.Q.; Yang, R.J.; Zafar, I.; Ekanayake, E.M.A.C.; Lin, X.; Darko, A. Influence of Formal and Informal Stakeholder Relationship on Megaproject Performance: A Case of China. Eng. Constr. Archit. Manag. 2020, 27, 1505–1531. [Google Scholar] [CrossRef] [Scilit]
  71. Mok, K.Y.; Shen, G.Q.; Yang, R. Stakeholder Complexity in Large Scale Green Building Projects. Eng. Constr. Archit. Manag. 2018, 25, 1454–1474. [Google Scholar] [CrossRef] [Scilit]
  72. Zhang, Y.; Liu, Y.; Yu, R.; Zuo, J.; Dong, N. Managing the High Capital Cost of Prefabricated Construction through Stakeholder Collaboration: A Two-Mode Network Analysis. Eng. Constr. Archit. Manag. 2025, 32, 556–577. [Google Scholar] [CrossRef] [Scilit]
  73. Ebekozien, A.; Aigbavboa, C.O.; Aigbedion, M.; Ogbaini, I.F.; Aginah, I.L. Integrated Project Delivery in the Nigerian Construction Sector: An Unexplored Approach from the Stakeholders’ Perspective. Eng. Constr. Archit. Manag. 2023, 30, 1519–1535. [Google Scholar] [CrossRef] [Scilit]
  74. Yang, R.J.; Zou, P.X.W. Stakeholder-Associated Risks and Their Interactions in Complex Green Building Projects: A Social Network Model. Build. Env. 2014, 73, 208–222. [Google Scholar] [CrossRef] [Scilit]
  75. Nguyen, T.H.D.; Chileshe, N.; Rameezdeen, R.; Wood, A. Stakeholder Influence Strategies in Construction Projects. Int. J. Manag. Proj. Bus. 2019, 13, 47–65. [Google Scholar] [CrossRef] [Scilit]
  76. Ali, F.; Haapasalo, H. Development Levels of Stakeholder Relationships in Collaborative Projects: Challenges and Preconditions. Int. J. Manag. Proj. Bus. 2023, 16, 58–76. [Google Scholar] [CrossRef] [Scilit]
  77. Rafeh, A.; Qureshi, M.U.; Hameed, A.; Rasool, A.M. Ranking and Grouping of Critical Success Factors for Stakeholder Management in Construction Projects. J. Asian Archit. Build. Eng. 2023, 22, 3569–3582. [Google Scholar] [CrossRef] [Scilit]
  78. Safapour, E.; Kermanshachi, S.; Kamalirad, S.; Tran, D. Identifying Effective Project-Based Communication Indicators within Primary and Secondary Stakeholders in Construction Projects. J. Leg. Aff. Disput. Resolut. Eng. Constr. 2019, 11, 04519028. [Google Scholar] [CrossRef] [Scilit]
  79. Yu, T.; Man, Q.; Wang, Y.; Shen, G.Q.; Hong, J.; Zhang, J.; Zhong, J. Evaluating Different Stakeholder Impacts on the Occurrence of Quality Defects in Offsite Construction Projects: A Bayesian-Network-Based Model. J. Clean. Prod. 2019, 241, 118390. [Google Scholar] [CrossRef] [Scilit]
  80. Ekung, S.B.; Okonkwo, E.; Odesola, I. Factors Influencing Construction Stakeholders’ Engagement Outcome in Nigeria. Int. Lett. Nat. Sci. 2014, 15, 101–114. [Google Scholar] [CrossRef] [Scilit]
  81. El-Sawalhi, N.I.; Hammad, S. Factors Affecting Stakeholder Management in Construction Projects in the Gaza Strip. Int. J. Constr. Manag. 2015, 15, 157–169. [Google Scholar] [CrossRef] [Scilit]
  82. Enshassi, A.; Al-Swaity, E.; Abdul Aziz, A.R.; Choudhry, R. Coping Behaviors to Deal with Stress and Stressor Consequences among Construction Professionals: A Case Study at the Gaza Strip, Palestine. J. Financ. Manag. Prop. Constr. 2018, 23, 40–56. [Google Scholar] [CrossRef] [Scilit]
  83. Zhao, Z.Y.; Chen, Y.L. Critical Factors Affecting the Development of Renewable Energy Power Generation: Evidence from China. J. Clean. Prod. 2018, 184, 466–480. [Google Scholar] [CrossRef] [Scilit]
  84. Gamil, Y.; Abdullah, A.M.; Abd Rahman, I.; Asad, M.M. Internet of Things in Construction Industry Revolution 4.0: Recent Trends and Challenges in the Malaysian Context. J. Eng. Des. Technol. 2020, 18, 1091–1102. [Google Scholar] [CrossRef] [Scilit]
  85. Kyriazos, T.A. Applied Psychometrics: Sample Size and Sample Power Considerations in Factor Analysis (EFA, CFA) and SEM in General. Psychology 2018, 9, 2207–2230. [Google Scholar] [CrossRef]
  86. Molwus, J.J.; Erdogan, B.; Ogunlana, S.O. Sample Size and Model Fit Indices for Structural Equation Modelling (SEM): The Case of Construction Management Research. In Proceedings of the 2013 International Conference on Construction and Real Estate Management, Karlsruhe, Germany, 10–11 October 2013; pp. 338–347. [Google Scholar]
  87. Enshassi, A.; AlSwaity, E. Key Stressors Leading to Construction Professionals’ Stress in the Gaza Strip, Palestine. J. Constr. Dev. Ctries. 2015, 20, 53–79. [Google Scholar]
  88. Schreiber, J.B.; Stage, F.K.; King, J.; Nora, A.; Barlow, E.A. Reporting Structural Equation Modeling and Confirmatory Factor Analysis Results: A Review. J. Educ. Res. 2006, 99, 323–338. [Google Scholar] [CrossRef] [Scilit]
  89. Iacobucci, D. Structural Equations Modeling: Fit Indices, Sample Size, and Advanced Topics. J. Consum. Psychol. 2010, 20, 90–98. [Google Scholar] [CrossRef] [Scilit]
  90. Wei, Z.; Hassan, N.C.; Hassan, S.A.; Ismail, N.; Gu, X.; Dong, J. Psychometric Validation of Young’s Internet Addiction Test among Chinese Undergraduate Students. PLoS ONE 2025, 20, e0320641. [Google Scholar] [CrossRef] [Scilit] [PubMed]
  91. Cronbach, L.J. Coefficient Alpha and the Internal Structure of Tests. Psychometrika 1951, 16, 297–334. [Google Scholar] [CrossRef] [Scilit]
  92. Xu, Y.; Yeung, J.F.Y.; Chan, A.P.C.; Chan, D.W.M.; Wang, S.Q.; Ke, Y. Developing a Risk Assessment Model for PPP Projects in China-A Fuzzy Synthetic Evaluation Approach. Autom. Constr. 2010, 19, 929–943. [Google Scholar] [CrossRef] [Scilit]
  93. Won, J.; Lee, G.; Dossick, C.; Asce, M.; Messner, J. Where to Focus for Successful Adoption of Building Information Modeling within Organization. J. Constr. Eng. Manag. 2013, 139, 04013014. [Google Scholar] [CrossRef] [Scilit]
  94. Zulkipli, F.; Jamian, N.H. Correlation and Exploratory Factor Analysis on Awareness of Solid Waste Management in Malaysia. Int. J. Acad. Res. Bus. Soc. Sci. 2021, 11, 1151–1164. [Google Scholar] [CrossRef] [Scilit]
  95. Natesan, P.; Hadid, D.; Harb, Y.A.; Hitti, E. Comparing Patients and Families Perceptions of Satisfaction and Predictors of Overall Satisfaction in the Emergency Department. PLoS ONE 2019, 14, e0221087. [Google Scholar] [CrossRef] [Scilit]
  96. Lohmöller, J.-B. Predictive vs. Structural Modeling: PLS vs. ML. In Latent Variable Path Modeling with Partial Least Squares; Physica-Verlag HD: Heidelberg, Germany, 1989; pp. 199–226. [Google Scholar]
  97. Chin, W.W. The Partial Least Squares Approach to Structural Equation Modeling. In Modern Methods for Business Research; Marcoulide, G.A., Ed.; Psychology Press: New York, NY, USA, 1998; p. 295. [Google Scholar]
  98. Jöreskog, K.; Sörbom, D. LISREL 8: Structural Equation Modeling with the SIMPLIS Command Language; Lawrence Erlbaum Associates: Mahwah, NJ, USA, 1993. [Google Scholar]
  99. Tavakol, M.; Dennick, R. Making Sense of Cronbach’s Alpha. Int. J. Med. Educ. 2011, 2, 53–55. [Google Scholar] [CrossRef] [Scilit]
  100. Hatem, G.; Zeidan, J.; Goossens, M.; Moreira, C. Normality Testing Methods and the Importance of Skewness and Kurtosis in Statistical Analysis. BAU J.—Sci. Technol. 2022, 3, 7. [Google Scholar] [CrossRef] [Scilit]
  101. Pallant, J. SPSS Survival Manual: A Step by Step Guide to Data Analysis Using SPSS for Windows; Open University Press: Berkshire, UK, 2011; ISBN 0335223664. [Google Scholar]
  102. Field, A. Discovering Statistics Using IBM SPSS Statistics, 5th ed.; Sage Publications: Thousand Oaks, CA, USA, 2018. [Google Scholar]
  103. Hair, J.F.; Ringle, C.M.; Gudergan, S.P.; Fischer, A.; Nitzl, C.; Menictas, C. Partial Least Squares Structural Equation Modeling-Based Discrete Choice Modeling: An Illustration in Modeling Retailer Choice. Bus. Res. 2019, 12, 115–142. [Google Scholar] [CrossRef] [Scilit]
  104. Fornell, C.; Larcker, D.F. Evaluating Structural Equation Models with Unobservable Variables and Measurement Error. J. Mark. Res. 1981, 18, 39–50. [Google Scholar] [CrossRef] [Scilit]
  105. Kale, S.; Arditi, D. General Contractors’ Relationships with Subcontractors: A Strategic Asset. Constr. Manag. Econ. 2001, 19, 541–549. [Google Scholar] [CrossRef] [PubMed]
  106. Horta, I.M.; Camanho, A.S.; Johnes, J.; Johnes, G. Performance Trends in the Construction Industry Worldwide: An Overview of the Turn of the Century. J. Product. Anal. 2013, 39, 89–99. [Google Scholar] [CrossRef] [Scilit]
  107. Toor, S.U.R.; Ogunlana, S. Problems Causing Delays in Major Construction Projects in Thailand. Constr. Manag. Econ. 2008, 26, 395–408. [Google Scholar] [CrossRef] [Scilit]
  108. Başar, O.; Başar, P. Challenges in Construction Industry. PressAcad. Procedia 2023, 17, 196–197. [Google Scholar]
  109. Osman Can Ürel, B. The Evaluation of Construction Projects Realized with Public Private Partnership Model in Turkey. Master’s Thesis, Middle East Technical University, Ankara, Turkey, 2015. [Google Scholar]
  110. Flyvbjerg, B.; Skamris holm, M.K.; Buhl, S.L. How Common and How Large Are Cost Overruns in Transport Infrastructure Projects? Transp. Rev. 2003, 23, 71–88. [Google Scholar] [CrossRef] [Scilit]
  111. Love, P.E.D.; Edwards, D.J.; Smith, J. Systemic Life Cycle Design Error Reduction Model for Construction and Engineering Projects. Struct. Infrastruct. Eng. 2013, 9, 689–701. [Google Scholar] [CrossRef] [Scilit]
  112. Love, P.E.D.; Irani, Z. A Project Management Quality Cost Information System for the Construction Industry. Inf. Manag. 2003, 40, 649–661. [Google Scholar] [CrossRef] [Scilit]
  113. Gunduz, M.; Önder, O. Corruption and Internal Fraud in the Turkish Construction Industry. Sci. Eng. Ethics 2013, 19, 505–528. [Google Scholar] [CrossRef] [Scilit]
  114. El Asmar, M.; Assainar, R. Breaking with Tradition: Quantifying the Performance Impact of Nontraditional Stakeholder Involvement. J. Leg. Aff. Disput. Resolut. Eng. Constr. 2017, 9, 04517001. [Google Scholar] [CrossRef] [Scilit]
Figure 1. The methodology framework.
Buildings 16 00015 g001
Figure 2. SLR and PRISMA protocol flowchart.
Buildings 16 00015 g002
Figure 3. The hypothetical model.
Buildings 16 00015 g003
Figure 4. The final SEM of CSMFs.
Buildings 16 00015 g004
Table 1. Summary of the included studies.
OrderAuthor(s) and the PaperYearCountrySample/MethodKey Findings
1Olander and Landin [11] 2005Sweden2/Case studyThey identified that stakeholders influence changes across project phases, and mismanaged stakeholder power/interest leads to appeals, cost overruns, and long-term delays.
2Yang et al. [15]2009Not applicable due to literature review159/Literature reviewFew tools exist to identify all stakeholders; limited research addresses changes in stakeholder influence; and current methods rarely capture the full stakeholder relationship network.
3Xia et al. [30] 2018Not applicable due to literature review79/Content analysisFour risk–stakeholder linkage modes were determined: (1) management of risk based on stakeholder identification, (2) internal stakeholders’ responsibility and ability in the RM process, (3) management of stakeholder differences concerning risk, and (4) interrelatedness between RM and SM and effect on project performance.
4Yang et al. [31]2011Not applicable due to literature review68/Content analysisIdentified four major research gaps in construction stakeholder management and addressed them by developing a ranked list of 15 critical success factors.
5Mok et al. [32]2015Not applicable due to literature review85/Content analysisFour topics have been identified as the key research themes of Stakeholder management studies in relation to mega construction projects, namely (1) stakeholder interests and influences, (2) stakeholder management process, (3) stakeholder analysis methods, and (4) stakeholder engagement
6Yang et al. [36]2010Hong Kong183/Quantitative analysis with Spearman’s Rank CorrelationIdentified and ranked 15 factors
7Mashali et al. [37]2023Qatar235/Quantitative analysis with Relative importance indexCommunication, early stakeholder engagement, and transparent evaluation are the most influential for improving stakeholder management
8Ebekozien et al. [42]2024South Africa25/Qualitative analysis with thematic analysisThree groups ((individual perceived hindrances, organizational perceived hindrances and government-related) perceived hindrances identified.
9Wang et al. [56]2022China18/Case study with Social Network Analysis (SNA)Dynamic stakeholder relationship analysis via SNA reveals evolving stakeholder roles and interactions in a Chinese urban regeneration project, offering guidance to enhance stakeholder management.
10Doloi [57]2012Australia25/Social network analysisThey identified stakeholder influence and integrated stakeholders’ perceptions to evaluate social performance, resulting in a Social Performance Index that highlights the importance of cultural and political stakeholders in project decision-making.
11Nguyen et al. [58]2020Vietnam157/SEMThey found the project manager leadership competency and project integration management are associated with project management performance.
12Zhang et al. [59]2015ChinaAxiology-based value analysisIt proposes an axiology-based analytical framework to quantify and integrate diverse stakeholder value perceptions in building projects
13Al-Fadhali [60]2024Yemen283/SEMInternal stakeholders such as designers, owners, suppliers, and subcontractors have a significant positive influence on construction project delivery performance.
14Sanda et al. [61]2022Nigeria61/Quantitative analysis with descriptive statistics and relative indexConflict of interest and lack of trust among stakeholders are the main drivers of opportunistic behavior in Public–Private Partnership housing projects
15Karlsen et al. [62]2008NorwayQualitative case studyTrust in project-stakeholder relationships is built through improved communication, reliable and competent behavior, sincerity, integrity, commitment, and shared goals.
16Lewicki et al. [63]1998USA and SingaporeNot applicable due to theoretical rather than empiricalTrust and distrust are distinct but co-existing dimensions in relationships, and develops a multidimensional theoretical framework
17Atkin and Skitmore [64]2008Not applicable due to not being an empirical searchNot applicable due to review and conceptual analysisImportance of stakeholder management in construction and frames its evolution toward integrating risk, ethics, and sustainability in practice
18Li et al. [65]2018China22/Delphi ApproachGovernment bodies are the most influential stakeholders in sustainable construction decision-making in China, with end-users also having high potential influence, and it highlighted the need for more inclusive, transparent participation processes
19Mok et al. [66]2017China1/Interviews and case analysisLimited stakeholder involvement, unclear roles, and poor communication are major challenges in major public engineering projects, and that using network-based stakeholder analysis can improve understanding of stakeholder influence
20Zwikael et al. [67] 2023Australia27/Qualitative analysis with interviewsFive project management concepts (project benefits, the iron triangle, critical path, uncertainty, and project leadership) are difficult for stakeholders to understand
21Bal et al. [68]2013UKQualitative interviewsThe study proposes a six-step stakeholder engagement process and highlights that understanding stakeholder sustainability agendas and measuring their performance are essential to achieving sustainability in construction.
22Zhao et al. [69]2015Singapore35/Quantitative analysis with Spearman rank correlationThe study found that improved decision-making drives ERM adoption while insufficient resources are the main barrier in Singapore-based Chinese construction firms, with 13 drivers and 22 hindrances identified.
23Xue et al. [70]2020China108/PLS-SEMFormal stakeholder relationships dominate cost, quality, safety, and coordination outcomes, whereas informal relationships enhance communication and transparency in Chinese megaproject performance.
24Mok et al. [71]2018Hong KongMixed approach with interviews and surveys. Stakeholder complexity in Hong Kong green building projects can be analysed holistically using interviews, surveys, and social network analysis, revealing key concerns that influence project success.
25Zhang et al. [72]2025ChinaTwo-mode social network analysisCollaboration networks among key stakeholders (contractors, designers, manufacturers) are crucial to managing and reducing the high capital cost of prefabricated construction in China through coordinated action on core cost factors.
26Ebekozien et al. [73]2023Nigeria20/Qualitative analysis with thematic analysisNigerian stakeholders know about integrated project delivery, its implementation is limited due to technological, legal, financial, and cultural hindrances.
27Yang and Zou [74]2014ChinaTheoretical and analytical stakeholder-associated risk analysis model.It develops a model showing that interconnected stakeholder-associated risks significantly influence green building project outcomes, highlighting the need to manage stakeholder interactions to mitigate risk.
28Nguyen et al. [75] 2019VietnamQualitative multi-case study approachStakeholders use seven distinct influence strategies, such as withholding inputs, coalition building, and communication, to affect project outcomes in Vietnam
29Ali and Haapasalo [76]2023FinlandQualitative case study and content analysisCollaborative stakeholder relationships develop through stages of cooperation, control, and coordination, and that shared understanding and certain preconditions are critical for successful collaboration in Finnish hospital construction.
30Rafeh et al. [77]2023Pakistan89/Quantitative analysis with factor analysis18 critical success factors for stakeholder management in Pakistani construction projects were identified, highlighting mission formulation, communication, and stakeholder identification as most important and grouping them into four thematic categories.
31Safapour et al. [78]2019Multiple regions40/Case studiesClear project goals, effective stakeholder management, and resource-related communication indicators strongly influence internal communication quality among primary and secondary stakeholders across 40 global construction projects.
32Yu et al. [79]2019ChinaBayesian network modelThe study shows contractors most strongly influence quality defects, driven by component defects, worker misoperations, and weak inspection.
33Ekung et al. [80]2014Nigeria186/Mix approach with semi-structured interviews and questionnaire surveyRegulatory gaps, project location, cumulative development effects, poverty, and poor information disclosure are key factors negatively impacting stakeholder engagement outcomes in Nigerian construction projects.
34Saad et al. [6]2022Pakistan300/SEMBetter stakeholder management leads to greater project success, and this effect is amplified when project teams have higher awareness of stakeholder management practices.
35El-Sawalhi and Hammad [81]2015Gaza Strip67/Quantitative methods with relative importance indexEffective stakeholder management is driven by project manager competence, transparent evaluation, communication, shared goals, and understanding stakeholder needs.
Table 2. The challenges of effective stakeholder management.
Codes of Challenges (SMCs)ChallengesReferencesSource Count (n)
SMC1Lack of trust among stakeholders[30,32,56,57,58,59,60,61,62,63,64,65,66]13
SMC2Ineffective communication between stakeholders[11,15,30,31,32,56,57,58,59,60,63,65,66,67,68,69,70,71]18
SMC3Poor coordination among project participants[11,30,31,36,42,56,58,59,61,63,65,66,68,69,71,72]16
SMC4Conflicts of interest between key stakeholders[11,31,32,58,59,61,65,66,73,74,75]11
SMC5Disputes between project stakeholders[11,15,30,31,32,58,59,60,61,63,65,66,68,71,75]15
SMC6Lack of commitment by project stakeholders[32,36,58,61,66,73]6
SMC7Lack of experience and competence among contractors and subcontractors[56,58,59,60,61,62,76]7
SMC8Insufficient skills and qualifications of workers[58,59,61]3
SMC9Insufficient professional knowledge and ability among consultants[56,62,76]3
SMC10Poor organizational structure and management competence of project teams[11,30,36,56,58,59,60,61]8
SMC11Inappropriate selection of contractors and subcontractors[56,62,76]3
SMC12Lack of qualified professionals and managers[60,61,76]3
SMC13Ineffective decision-making processes and slow decision-making[15,30,31,56,57,58,59,60,66,75,77,78]12
SMC14Delays in approval and handover processes[11,57,58,60,66,75,77,78]8
SMC15Uncertainty and lack of responsibility in problem-solving[11,30,56,58,59,60,78]7
SMC16Lack of professional responsibility[56,58,60]3
SMC17Delays of owners in solving problems[56,58,60,67]4
SMC18Constant change of subcontractors[56,60,76]3
SMC19Lack of alternative subcontractors[56,57,60]3
SMC20Lack of long-term relationships with suppliers[57,60,76]3
SMC21Bureaucracy in the organization of the owner[60,62,67,76,79]5
SMC22Poor business integration between owner, consultant, and contractor[60,62,67,76,78]5
SMC23Lack of an on-site quality management system[62,65,76,79]4
SMC24Lack of stakeholder participation in the formulation of business policies[6,11,36,42,66,71,74,80,81]9
SMC25Issues with the choice of stakeholder leadership[6,11,32,36,65,66,68,70,80,81]10
SMC26Lack of awareness, interest, and motivation[11,60,62,66,74,76,80]7
SMC27Lack of support and commitment from management and owners[62,76,80]3
SMC28Resistance to change and conservative attitudes[11,36,60,62,66,76]6
SMC29Lack of responsive and ethical behavior[11,60,62,63,71,80]6
SMC30Changes made by the customer and high demands from customers[58,59,80]3
SMC31Privacy policies of project stakeholders[11,32,58,59,64,66,70,80]8
SMC32High demands on the environment, safety, and time by the owner[58,61,64]3
SMC33Transfer of uncertain or unready construction sites to contractors[58,76,80]3
SMC34Stakeholder fatigue and engagement style (active and proactive)[30,32,36,42,58,66,68,70,71,74,75,76,80]13
SMC35Political/social instability[56,57,58,60,61,66,72]7
SMC36New regulations by local governments (taxes, labor, safety, waste, environment)[11,56,58,61,66,72]6
SMC37Bureaucratic and complex procedures[11,57,58,60,66]5
SMC38Excessive approval procedures[11,58,61,66,72]5
SMC39Workers’ strikes[58,60,61,72]4
SMC40Contract disputes and terminations[56,57,60,61,64]5
SMC41Incomplete or unclear contract terms[57,61,64,72]4
SMC42Poor contract management[56,58,60,64]4
SMC43Construction process that violates local laws and regulations[37,56,61]3
SMC44Ecological damage[37,56,61]3
SMC 45Poor data accuracy and unwillingness to save data[15,37,56,61,70]5
SMC46Customers’ impact on data (privacy concerns)[15,37,56,61]4
SMC47Poor data sharing and storage mechanisms[15,37,56,61,70]5
SMC48Vague descriptions of information and documents[15,56,58,60,70]5
SMC49Delays in document approval by consultants or owner-representatives[58,60,75,78,80]5
SMC50The owner’s unclear stance on the project scope, specifications, cost, and schedule[56,59,61,78]4
SMC51Unnecessary variation orders in project design and specifications[56,59,61,64]4
SMC52Different uses and purposes of data by customers and contractors[37,56,60]3
SMC53Low-quality goods and services from suppliers and subcontractors[56,57,60,76]4
SMC54Supply deficiencies in the transportation and delivery of materials, equipment, and labor[56,57,76]3
SMC55Material shortages and inadequate suppliers[56,60,76]3
SMC56Quality defects in building materials[56,60,61]3
SMC57Inefficiencies in material use and resource management[60,61,76]3
SMC58Design changes in the project[56,57,58,60,61,77,78]7
SMC59Inconsistent scale of the project[57,58,60,77,78]5
SMC60Frequent design changes and mistakes made by designers[56,58,60,61]4
SMC61Lack of clear definition of terms such as construction cost[37,56,59,60,77]5
SMC62Local financing and payment problems, lack of available funding[37,56,60,77]4
SMC63Lack of fiscal incentives, regulations, and government support[57,58,76]3
SMC64Lack of technological resources, skills, and knowledge of the supplier or subcontractor[37,60,77]3
SMC65Shortage of technical staff[37,60,77]3
SMC66Language barriers and translation issues[11,34,57,62]4
SMC67Cultural differences and misunderstanding of personal values and beliefs[11,34,57,62]4
SMC68Defective monitoring and control systems for quality, cost, and time[56,57,61,70]4
SMC69Wrong attitudes of workers on quality, cost, environment, safety, etc.[56,57,61,64]4
Table 3. The percentage and frequency distributions of the sample group’s demographic characteristics.
Demographic VariablesFrequency (f)Percent (%)
GenderFemale5634.1
Male10865.9
Age20–306439.0
31–385634.1
39–462414.6
47–54127.3
55 and over84.9
Educational BackgroundPrimary/Secondary Education148.5
High school2515.2
Undergraduate/University9557.9
Master2817.1
Ph.D.21.2
ProfessionArchitect6137.2
Civil Engineer4426.8
Contractor2917.7
Supplier3018.3
Type of companyPublic Institution127.3
Private Company15292.7
Work SiteOffice3420.7
Site137.9
Office + Construction Site11771.3
Position in the companyAdministrator10966.5
Employee5533.5
Working time in the construction industry1–5 years5131.1
6–10 years5231.7
11–15 years2515.2
16–20 years169.8
21 years and older2012.2
Table 4. Definition and ordering of SMCs (n = 164).
Codes of ChallengesSkewnessKurtosisMeanStandard DeviationNMVRank
SMC1−0.6360.1483.800.9780.730 *28
SMC2−0.7150.4543.880.9230.802 *13
SMC3−0.7750.2423.940.9700.856 *9
SMC4−0.673−0.0753.851.0260.775 *18
SMC5−0.551−0.3753.831.0250.757 *22
SMC6−0.8410.2093.861.0420.784 *15
SMC7−1.2831.3864.101.0251.000 *2
SMC8−1.1050.7424.101.0381.000 *3
SMC9−1.0850.9154.031.0090.937 *5
SMC10−0.9890.5493.991.0330.901 *7
SMC11−1.1041.0784.100.9671.000 *1
SMC12−0.9150.3934.030.9560.937 *4
SMC13−0.523−0.3443.761.0400.694 *31
SMC14−0.435−0.4303.731.0110.667 *36
SMC15−0.761−0.1543.941.0380.856 *10
SMC16−1.0960.6044.031.0590.937 *6
SMC17−0.9610.4703.961.0150.874 *8
SMC18−0.9120.1263.861.1450.784 *17
SMC19−0.8120.1663.811.0940.523 *52
SMC20−0.491−0.4213.571.0910.604 *49
SMC21−0.342−0.6043.661.0320.766 *20
SMC22−0.8000.1403.841.0830.685 *33
SMC23−0.8940.3593.751.0990.649 *41
SMC24−0.7170.0623.711.0390.45956
SMC25−0.503−0.4183.501.1080.45958
SMC26−0.574−0.5073.501.1570.36961
SMC27−0.471−0.3483.401.0940.47754
SMC28−0.582−0.1803.521.0560.631 *44
SMC29−0.693−0.2313.691.1410.766 *21
SMC30−0.725−0.0463.841.0330.29764
SMC31−0.296−0.6213.321.1390.45959
SMC32−0.551−0.3133.501.1410.667 *37
SMC33−0.741−0.1743.731.1460.667 *38
SMC34−0.454−0.3633.401.0830.36960
SMC35−0.365−0.6713.391.1860.36062
SMC36−0.693−0.4113.751.1710.685 *34
SMC37−0.848−0.2063.761.2220.694 *32
SMC38−0.9080.1973.901.1030.820 *11
SMC39−0.102−1.0063.121.2550.11767
SMC40−0.680−0.2653.711.1320.649 *42
SMC41−0.8240.1403.851.0690.775 *19
SMC42−0.8290.2723.811.0630.739 *26
SMC43−0.753−0.0833.781.1230.712 *29
SMC44−0.273−0.7433.281.1650.26165
SMC45−0.450−0.4273.581.0480.532 *51
SMC46−0.340−0.7593.351.1730.32463
SMC47−0.322−0.5283.261.1160.24366
SMC48−0.563−0.2343.501.0960.45957
SMC49−0.7320.2433.661.0610.604 *48
SMC50−0.659−0.0203.691.0200.631 *43
SMC51−0.7750.1203.691.1070.631 *45
SMC52−0.406−0.4843.551.0950.505 *53
SMC53−0.9780.5293.821.0880.748 *24
SMC54−0.623−0.2423.731.0830.667 *39
SMC55−0.692−0.2223.861.0590.784 *16
SMC56−0.7850.0783.811.0860.739 *27
SMC57−0.8920.4093.891.0240.811 *12
SMC58−0.8100.0713.771.1030.703 *30
SMC59−0.502−0.5323.731.0750.667 *40
SMC60−0.7190.1763.811.0160.739 *25
SMC61−0.664−0.3263.691.1360.631 *46
SMC62−0.853−0.1633.831.1670.757 *23
SMC63−0.708−0.4473.651.2450.595 *50
SMC64−0.9030.2143.741.1480.676 *35
SMC65−0.9400.3813.871.0950.793 *14
SMC66−0.004−0.9683.011.2370.01868
SMC670.012−1.0322.991.2550.00069
SMC68−0.401−0.5513.521.1190.47755
SMC69−0.386−0.5673.691.0600.631 *47
* Refers to critical challenges (CCs).
Table 5. The results of exploratory and confirmatory factor analysis.
FactorsCode of SMCsEFACFA
EigenvalueLoads of SMCs% of VarianceStandardized Coefficients
Factor 1SMC5810.0250.69718.9150.76
SMC610.6830.71
SMC590.6720.76
SMC600.6660.78
SMC540.6530.79
SMC640.6340.76
SMC490.6140.73
SMC570.6050.78
SMC550.5880.71
SMC620.5760.71
SMC520.5740.73
SMC510.5600.74
SMC430.5550.74
SMC400.5550.69
SMC530.5550.74
SMC420.5510.76
SMC450.5330.66
SMC630.5300.64
SMC500.5260.73
SMC560.5210.70
SMC410.5180.74
SMC330.5150.67
SMC690.4790.71
SMC650.4680.64
Factor 2SMC198.3170.75115.6920.70
SMC200.6560.59
SMC180.6530.70
SMC130.6380.76
SMC170.6070.71
SMC150.6050.79
SMC160.5870.71
SMC230.5760.78
SMC110.5690.75
SMC120.5670.73
SMC90.5300.64
SMC210.5270.64
SMC220.4940.70
SMC60.4890.72
SMC70.4850.73
Factor 3SMC386.7280.71912.6940.73
SMC370.7130.69
SMC280.6490.65
SMC360.6010.68
SMC140.5850.76
SMC320.5410.70
SMC290.5410.67
SMC80.4300.69
Factor 4SMC26.1460.77611.5960.89
SMC10.7520.85
SMC30.7170.80
SMC40.6500.78
SMC50.5510.73
SMC100.5210.73
Total Explained Variance58.897χ2/df2.122
Kaiser-Meyer-Olkin (KMO) value0.917RMSEA0.043
Bartlett’s test of sphericityApprox. Chi-square6865.468CFI0.970
degree of freedom (df)1378GFI0.910
p<0.001
Table 6. The results of the convergent and discriminant validity of CFA.
FactorsCRAVE
WPCID0.980.56
IOW0.930.51
CP0.880.50
LRBE0.910.64
Table 7. The results of reliability and validity tests.
Latent VariablesCRCAAVE
WPCID0.960.960.53
IOW0.940.940.51
CP0.880.880.50
LRBE0.910.910.64
Table 8. Model statistics.
Fit IndexSuggested ValuesStructural Equation ResultsEvaluation
X2/df0 ≤ X2/df ≤ 32.09Good Fit
X2-2853.55-
GFI0. 95 ≤ GFI ≤ 1.000.95Good Fit
AGFI0. 95 ≤ AGFI ≤ 1.000.96Good Fit
RMSEA0 ≤ RMSEA ≤ 0.050.04Good Fit
RMSEA 90% CI<0.060.038–0.052Good Fit
CFI0. 95 ≤ CFI ≤ 1.000.97Good Fit
TLI>0.900.96Good Fit
SRMR<0.080.04Good Fit
NFI0. 95 ≤ NFI ≤ 1.000.95Good Fit
Table 9. Estimates of the structural equation model’s path coefficients.
Hypothetical Paths and Expected InfluencesPath Coefficient *t-Value
(1-Tail)
InterpretationR2
H1: WPCID → STKM−0.89−10.18Supported0.80
H2: IOW → STKM−0.95−9.67Supported0.90
H3: CP → STKM−0.92−9.77Supported0.86
H4: LRBE → STKM−0.81−10.73Supported0.66
Note: * All standardized path coefficient estimates are expected to be significant at p < 0.01.
Disclaimer/Publisher’s Note: The statements, opinions and data contained in all publications are solely those of the individual author(s) and contributor(s) and not of MDPI and/or the editor(s). MDPI and/or the editor(s) disclaim responsibility for any injury to people or property resulting from any ideas, methods, instructions or products referred to in the content.