
Experimental and Numerical Investigation of Constant-Amplitude Fatigue Performance in Welded Joints of Steel Tubular Flange Connections for Steel Structures


Abstract
1. Introduction
2. Materials and Methods
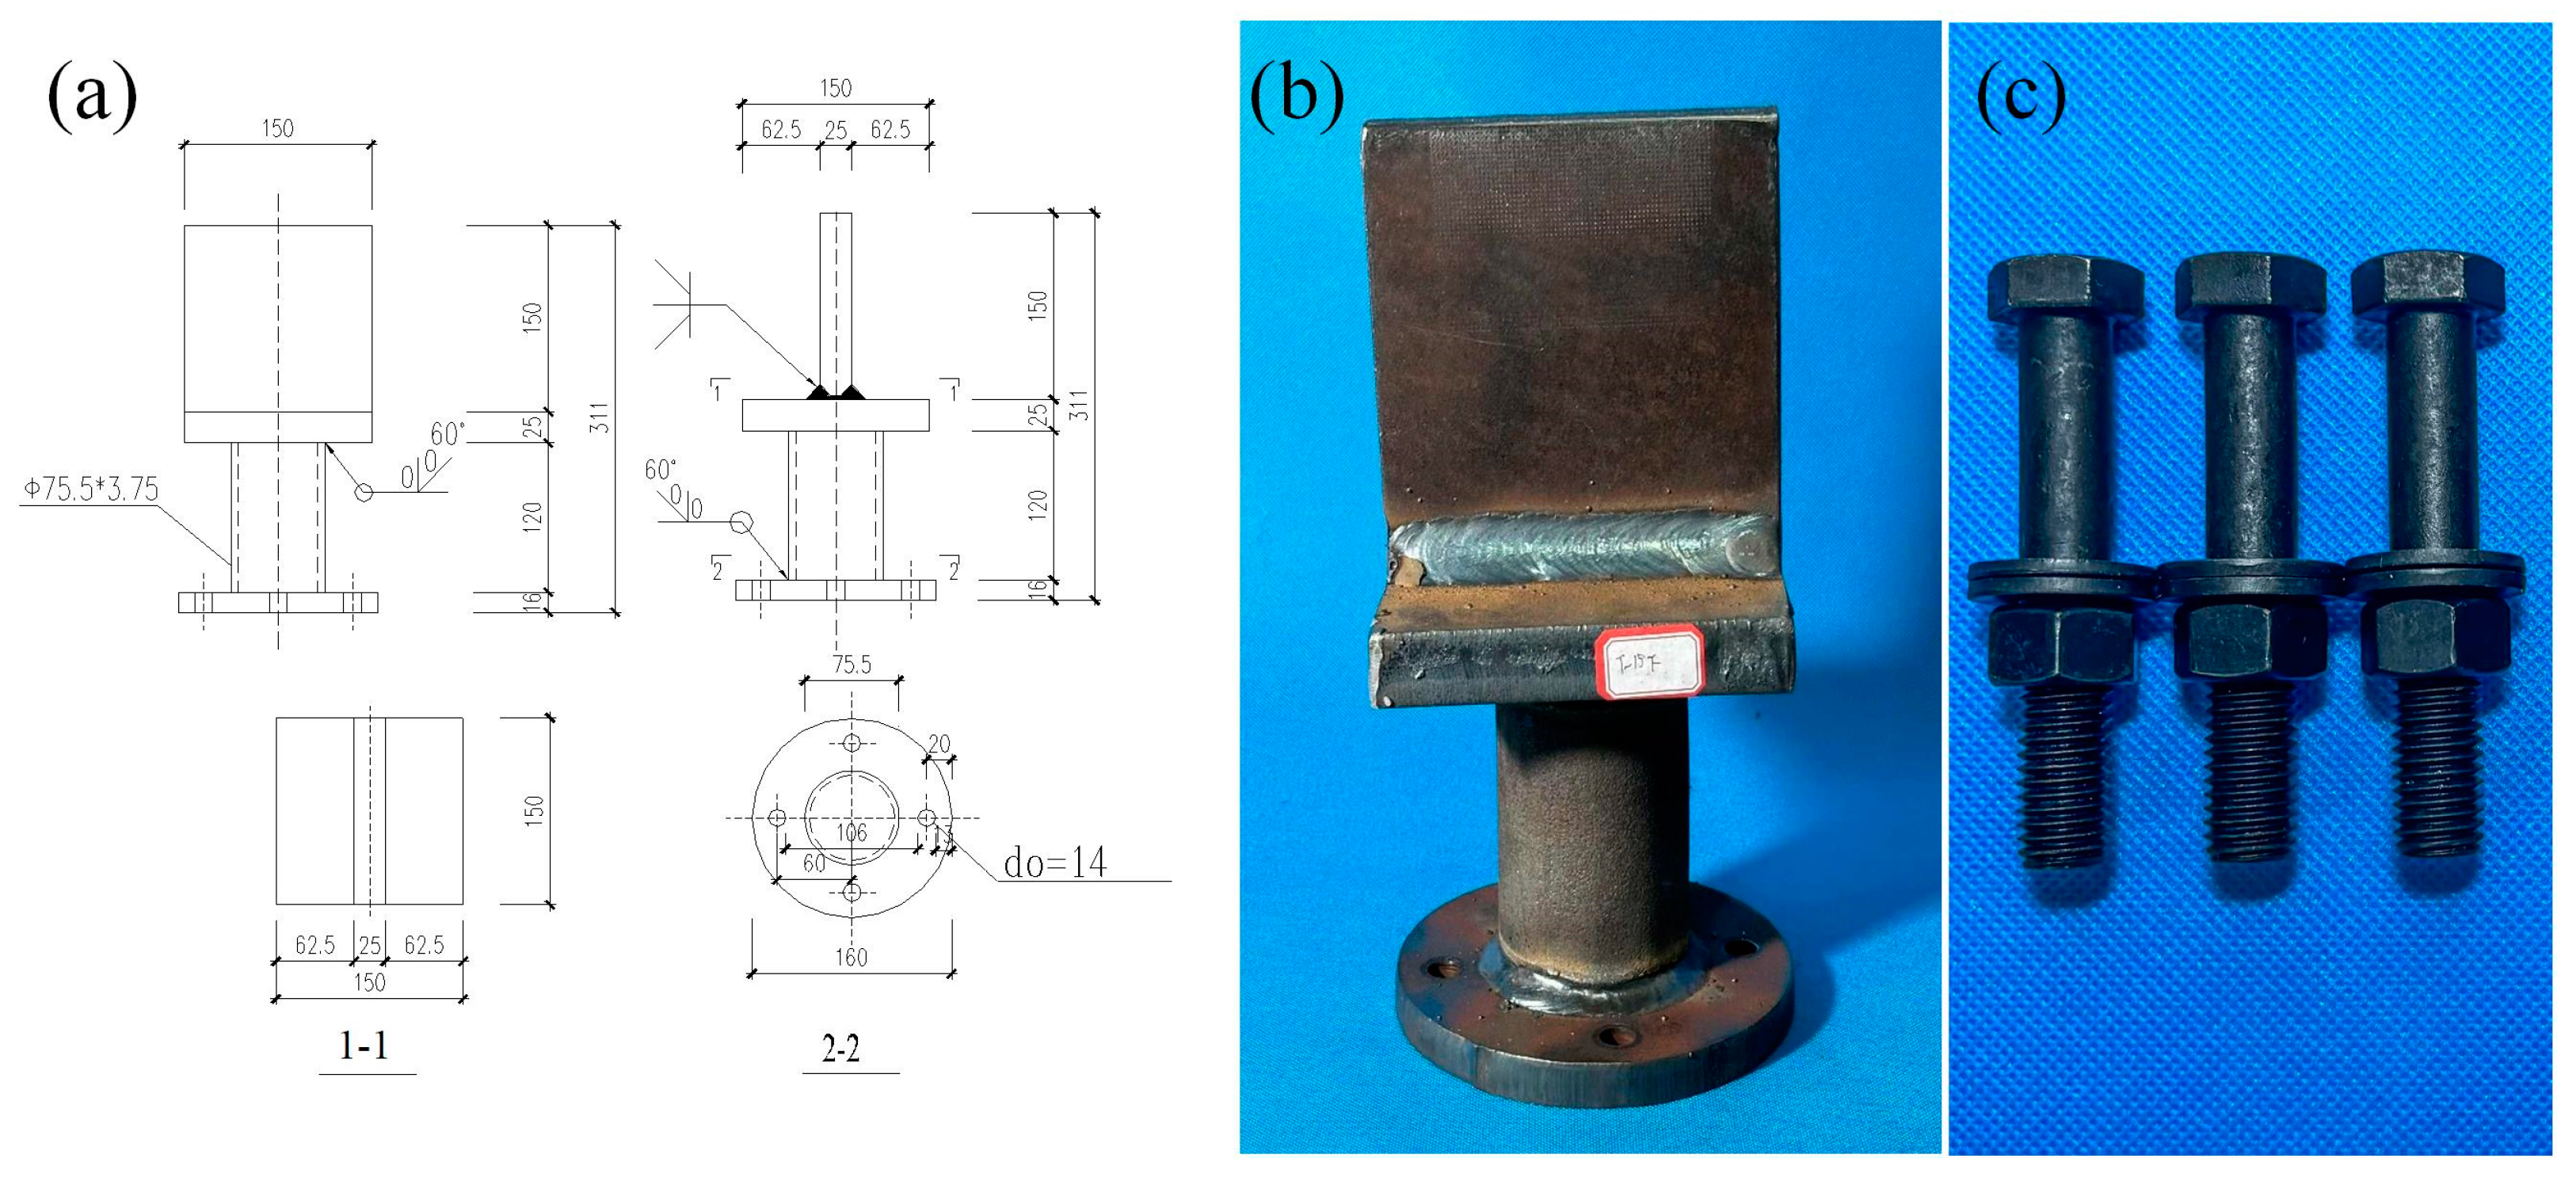
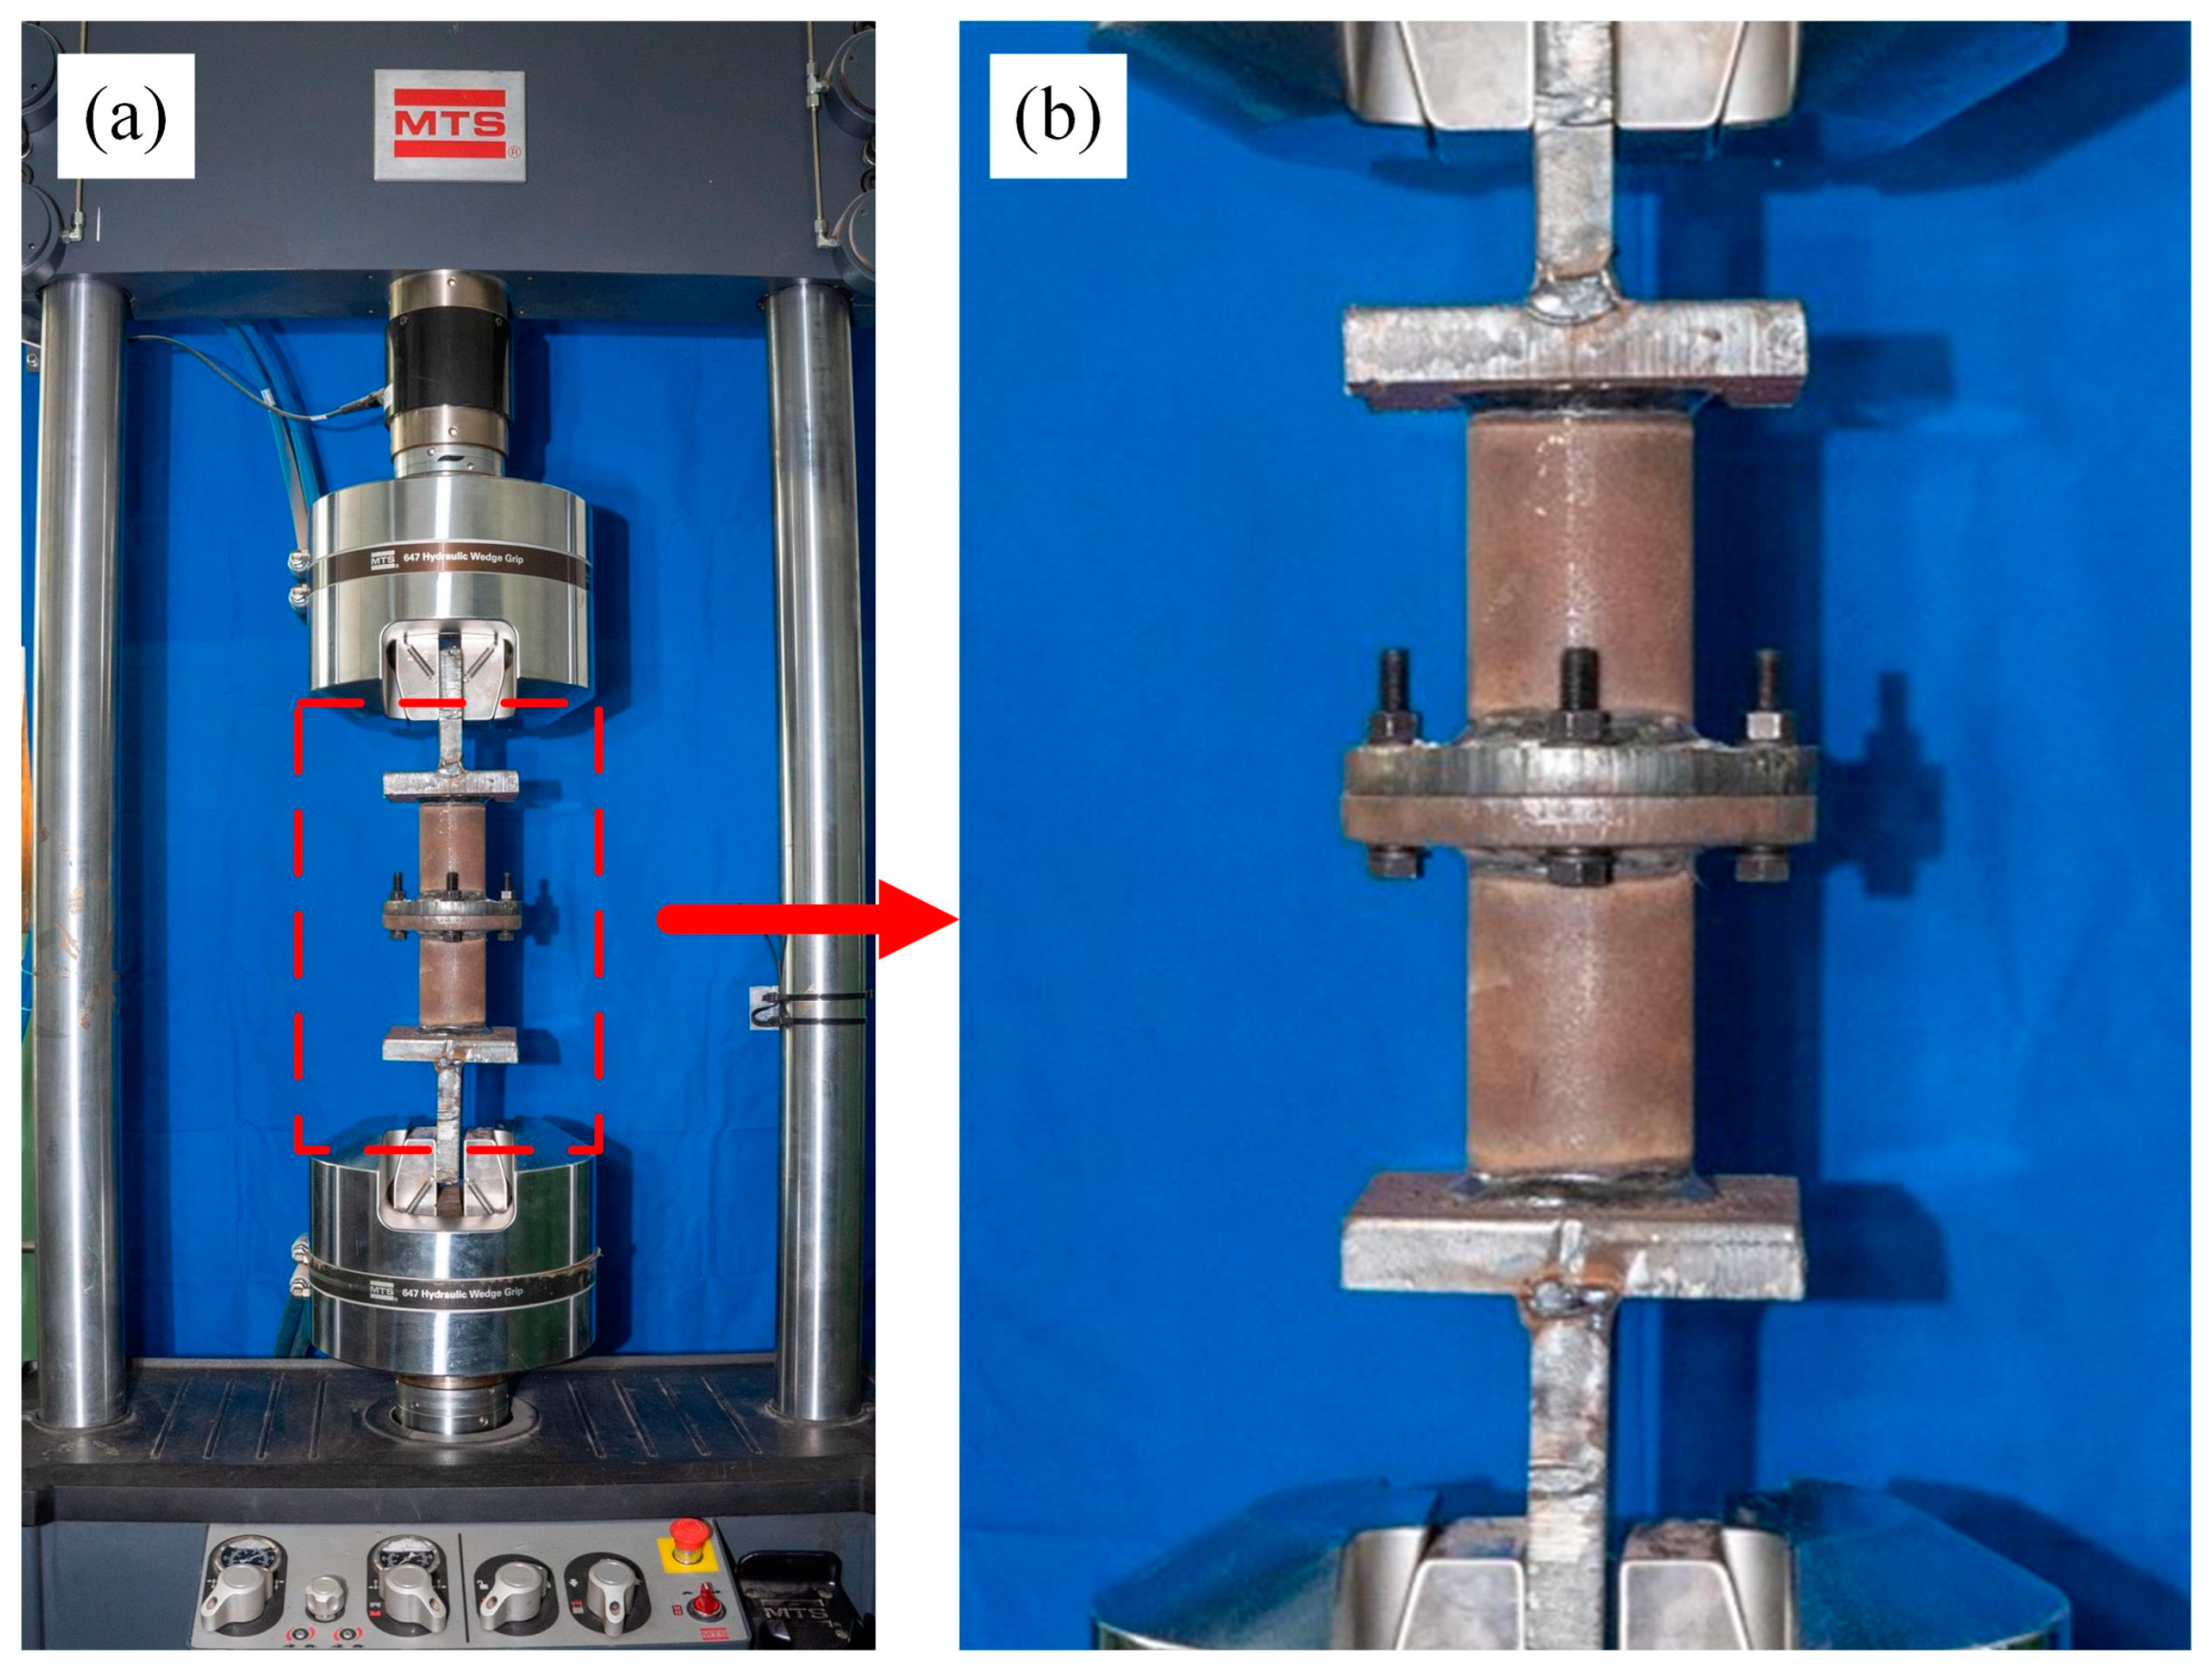
2.1. Test Specimen
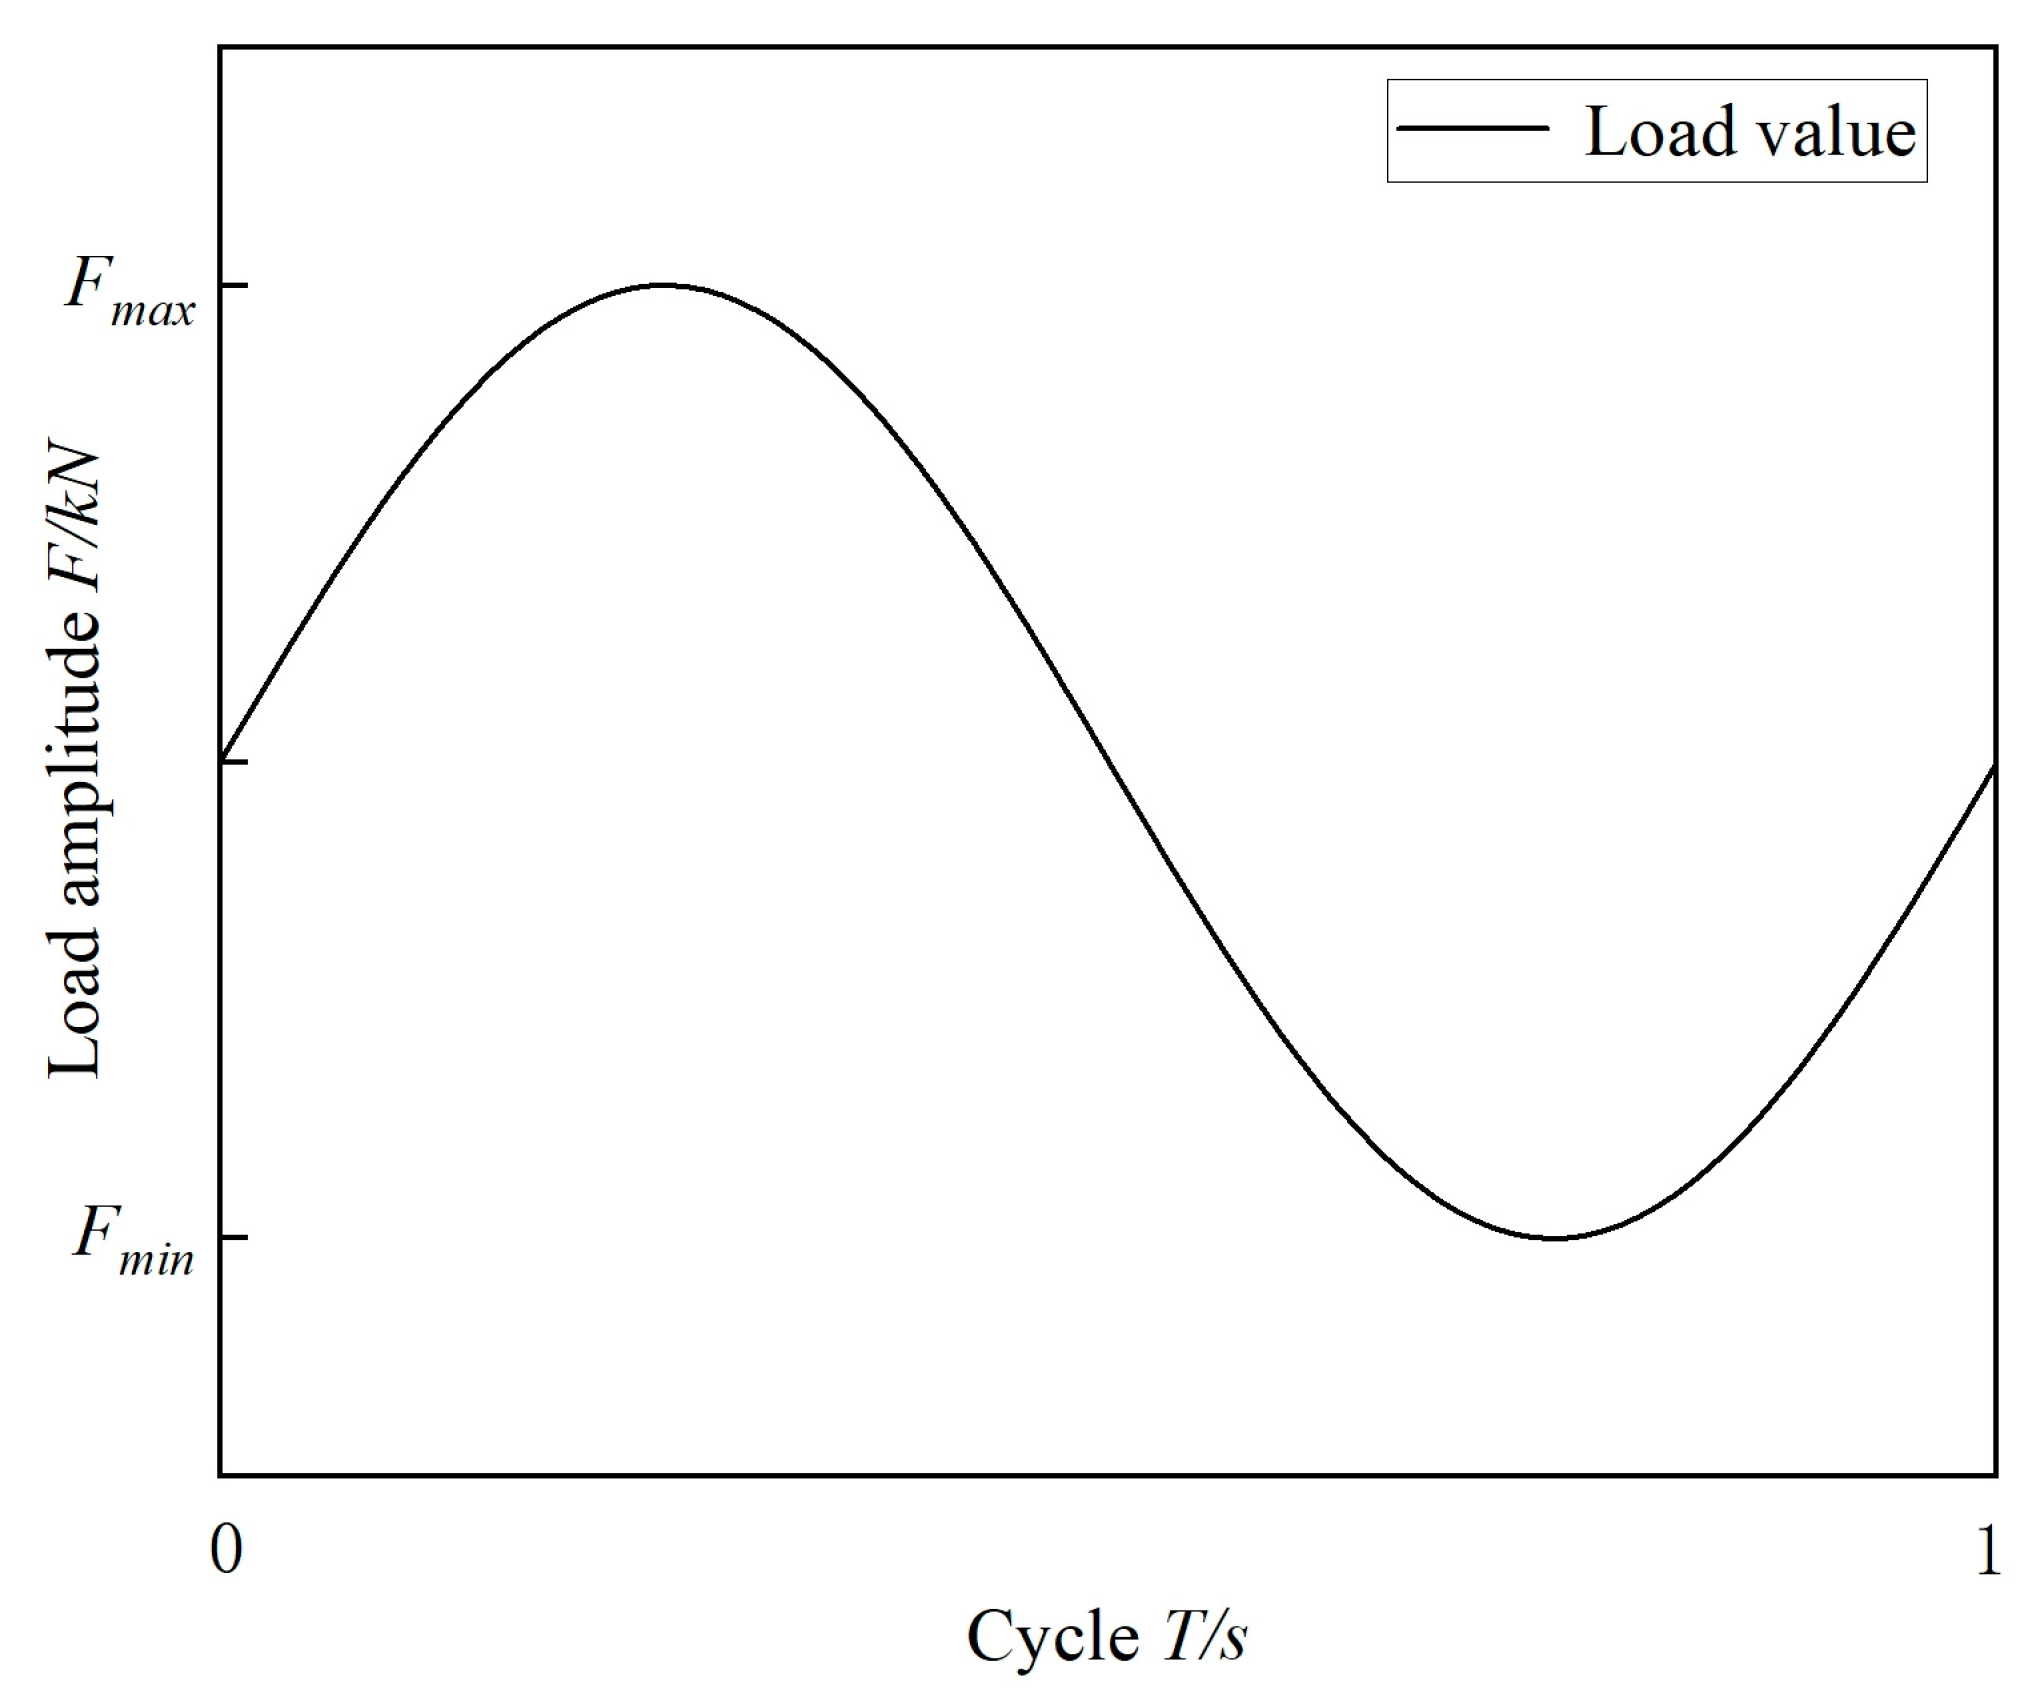
2.2. Loading Scheme
2.3. Fatigue Test Program
3. Results
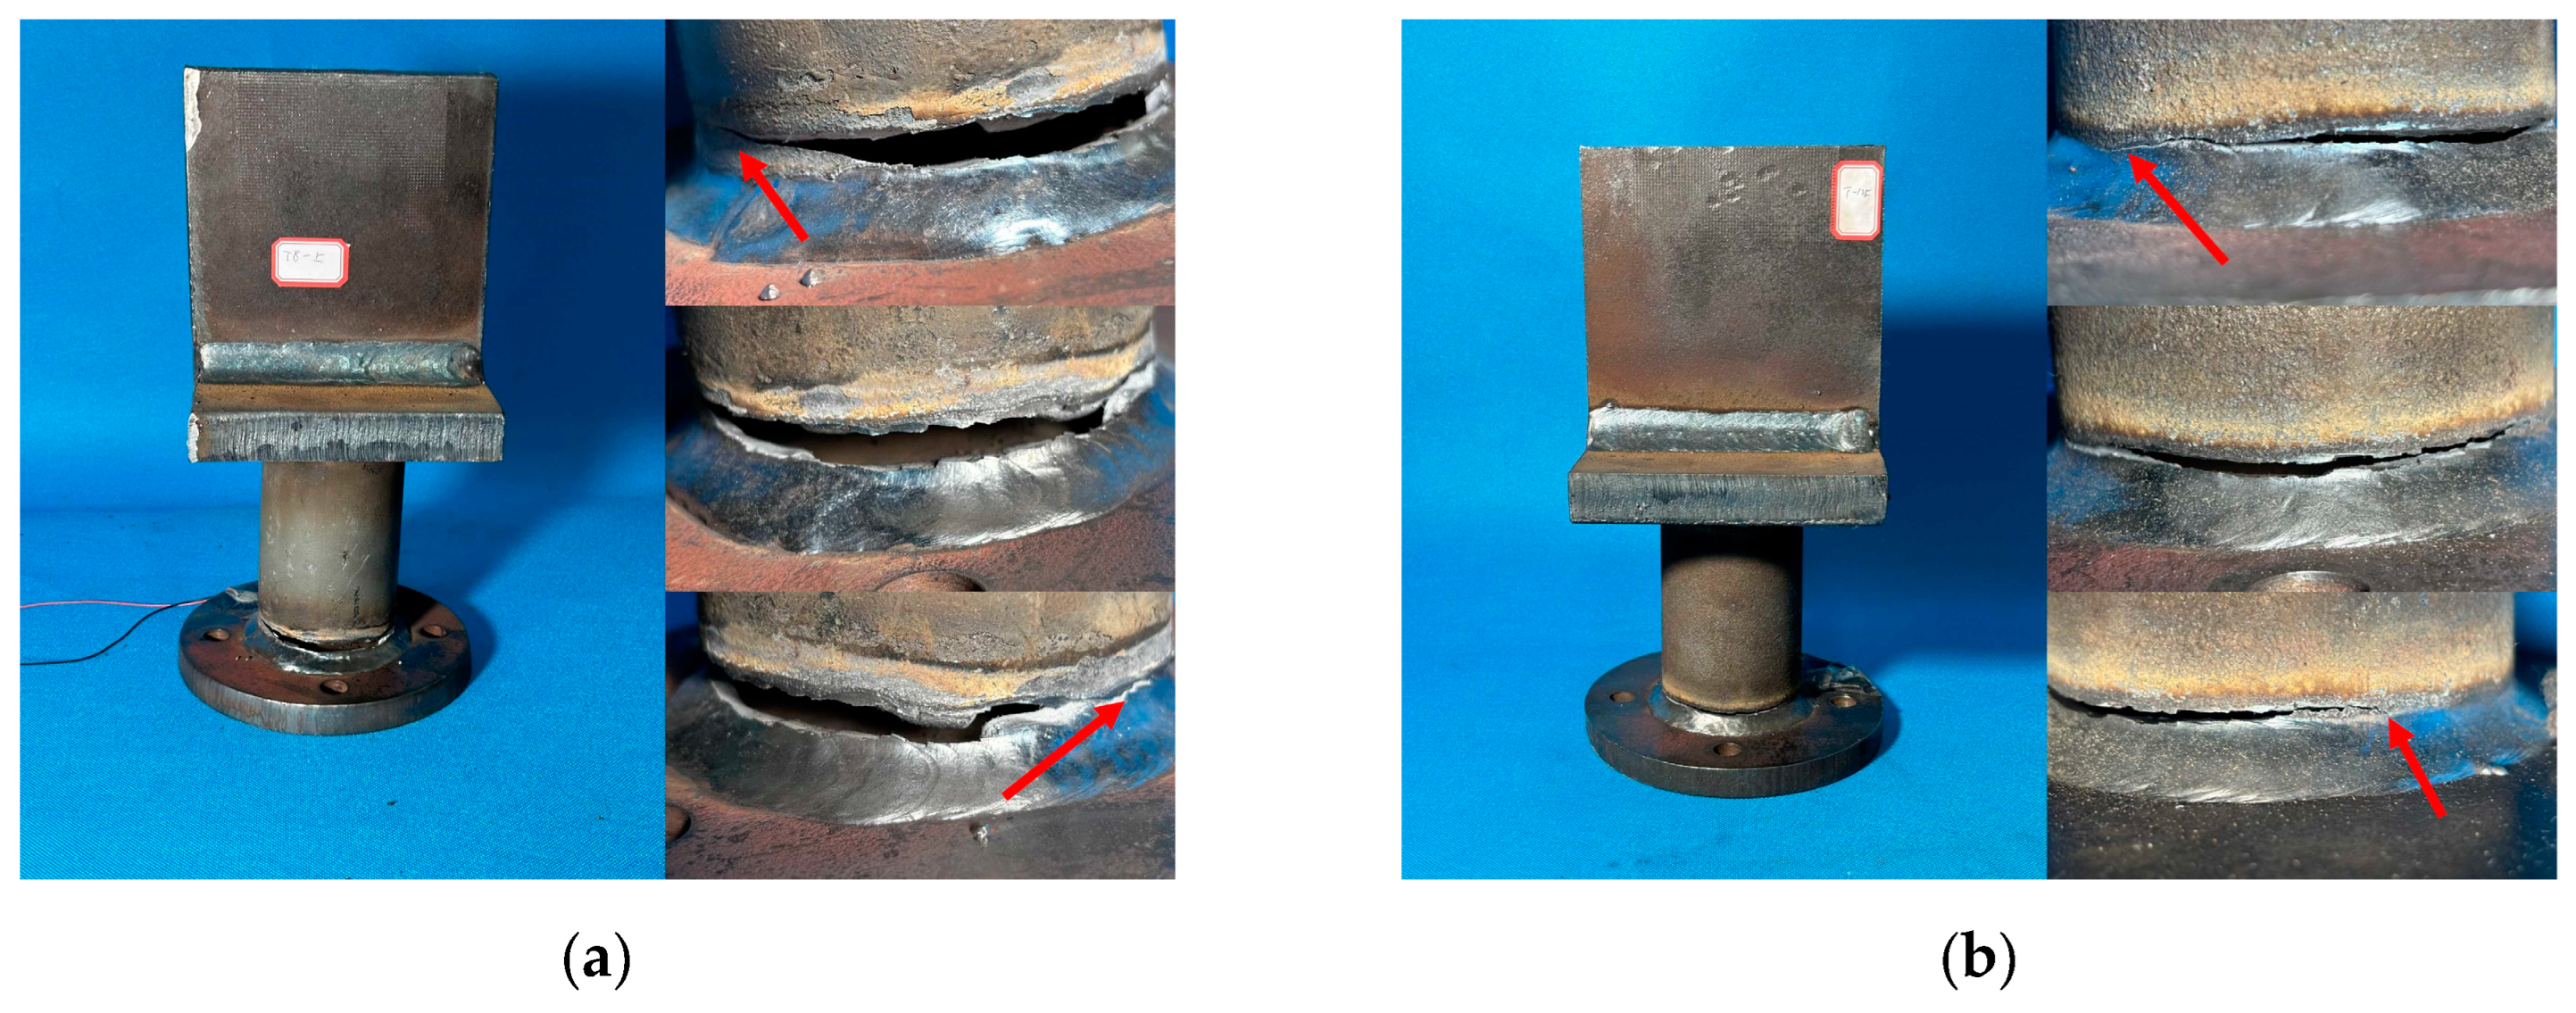
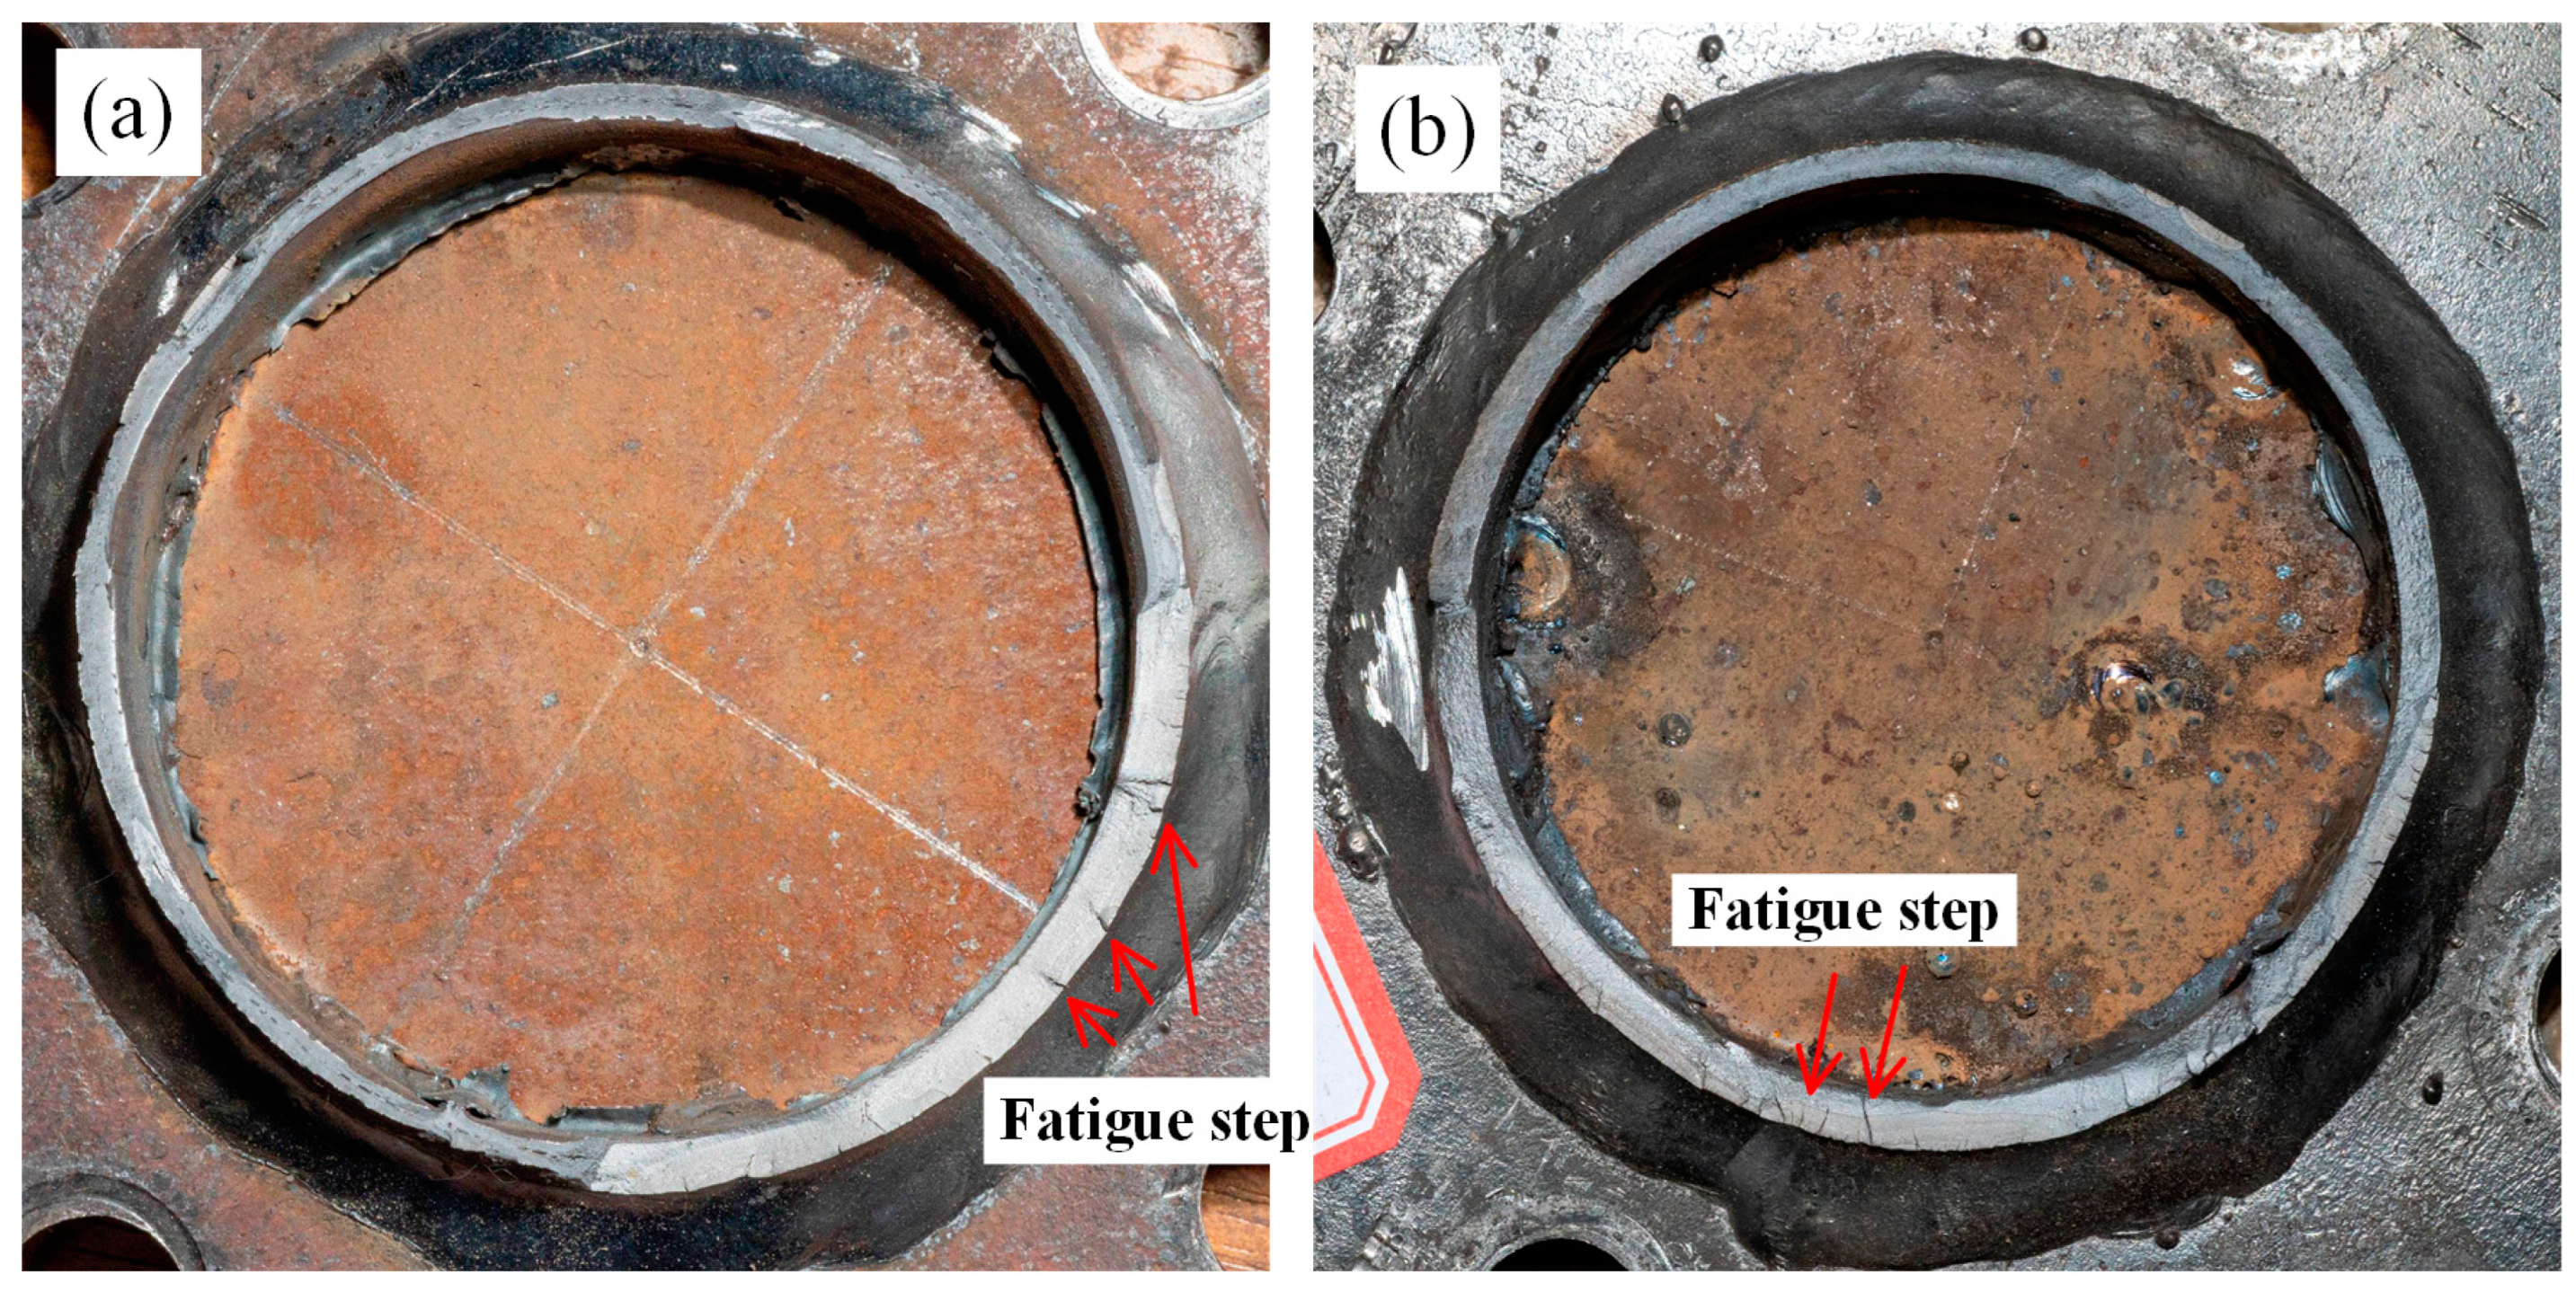
3.1. Fractured Specimens
3.2. Fatigue Failure Process
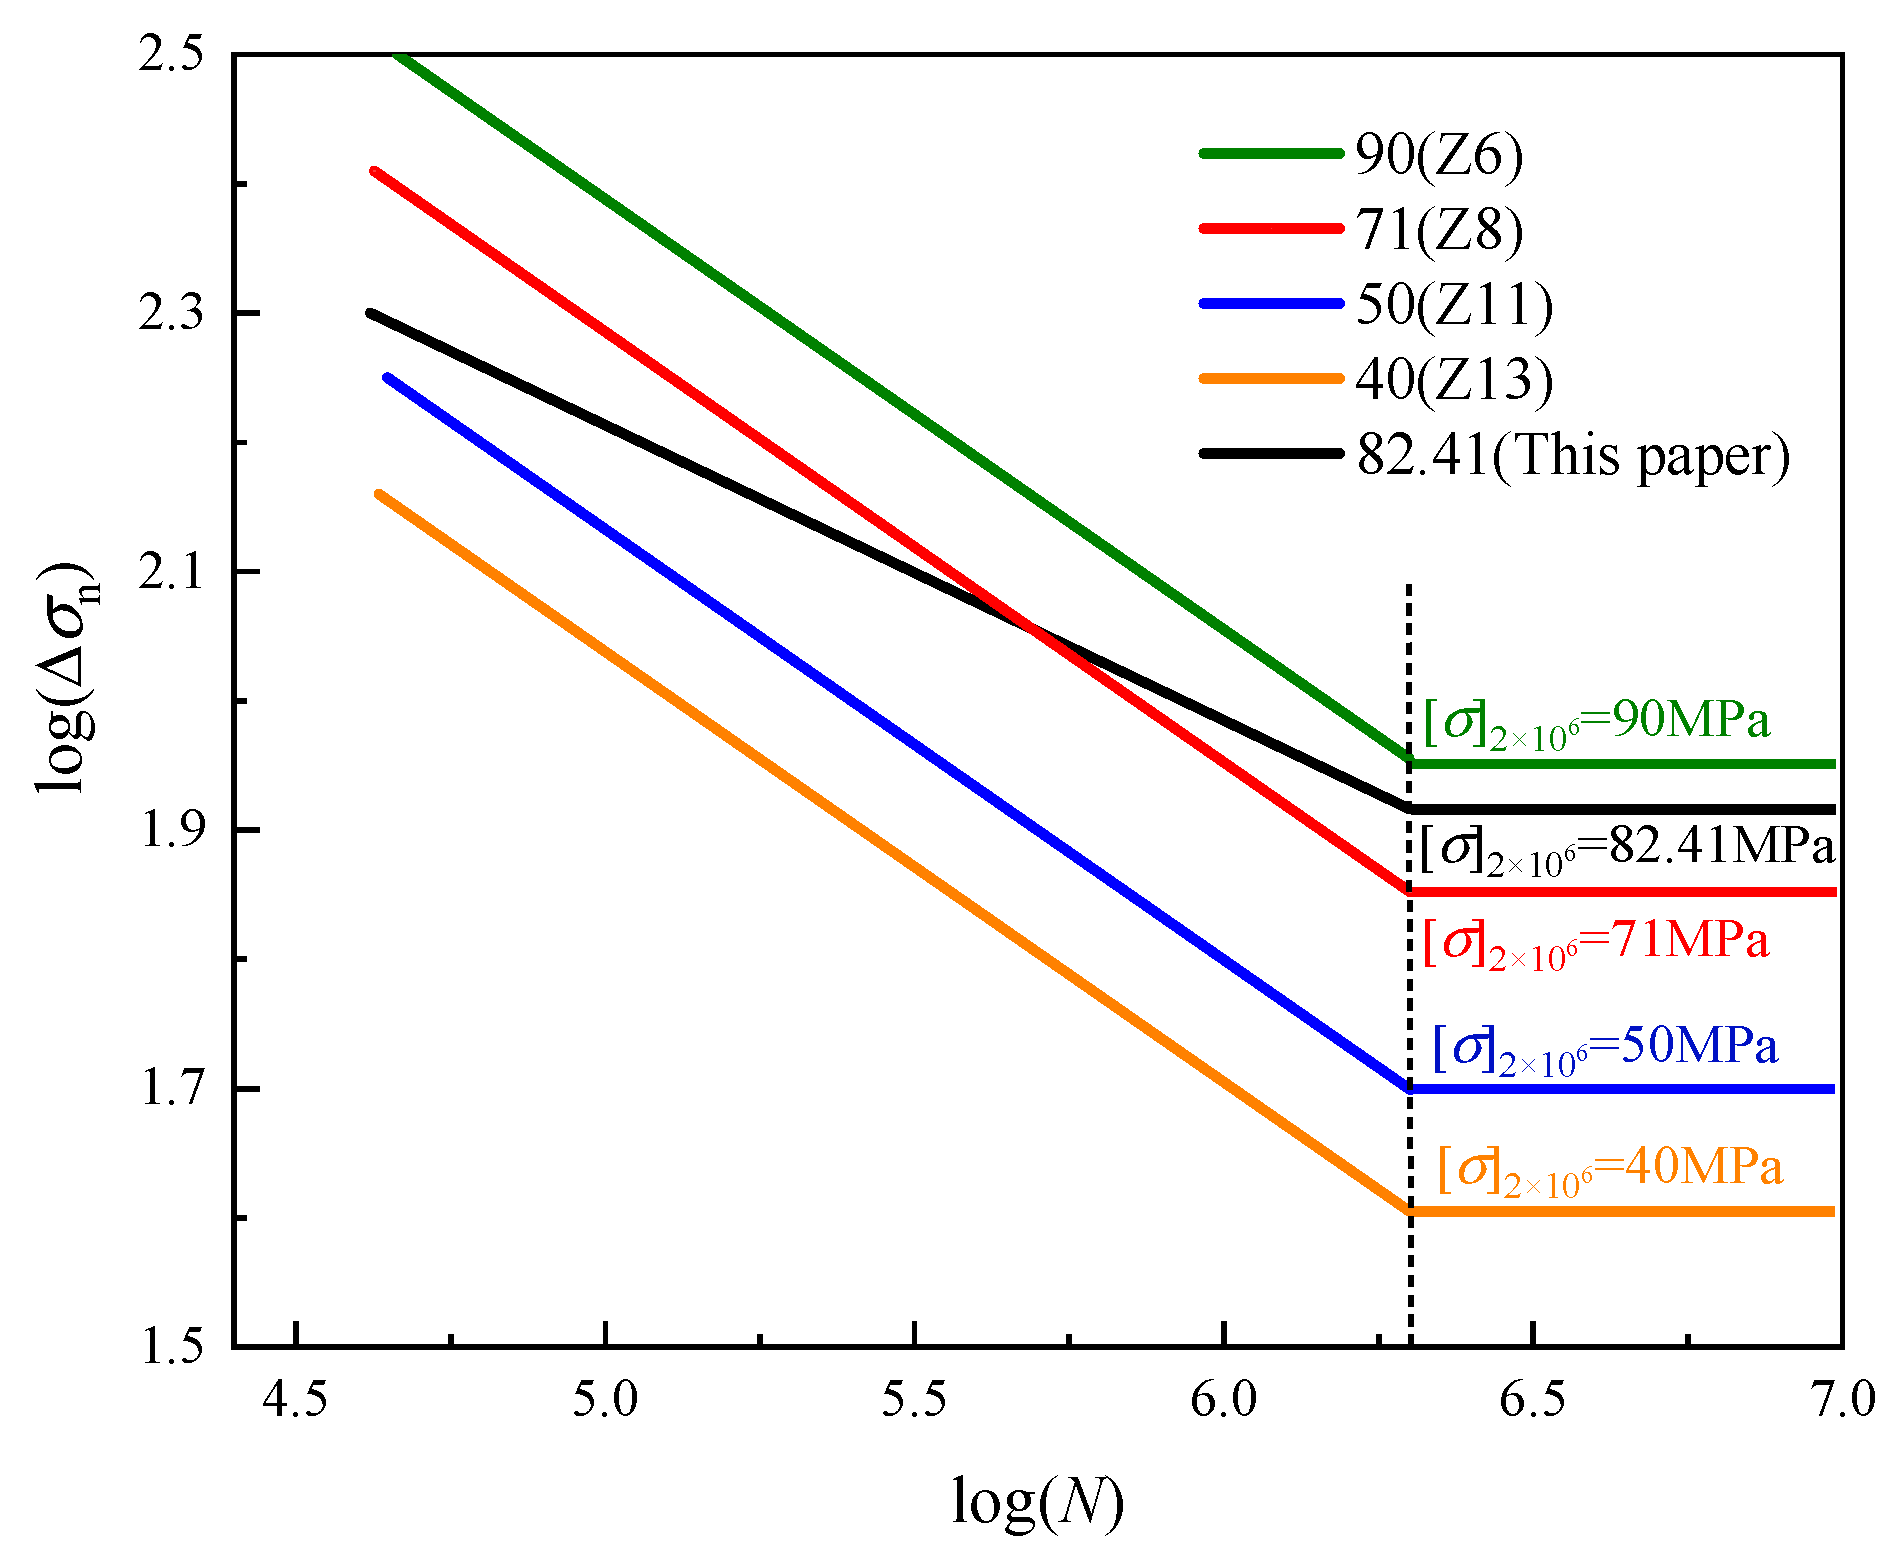
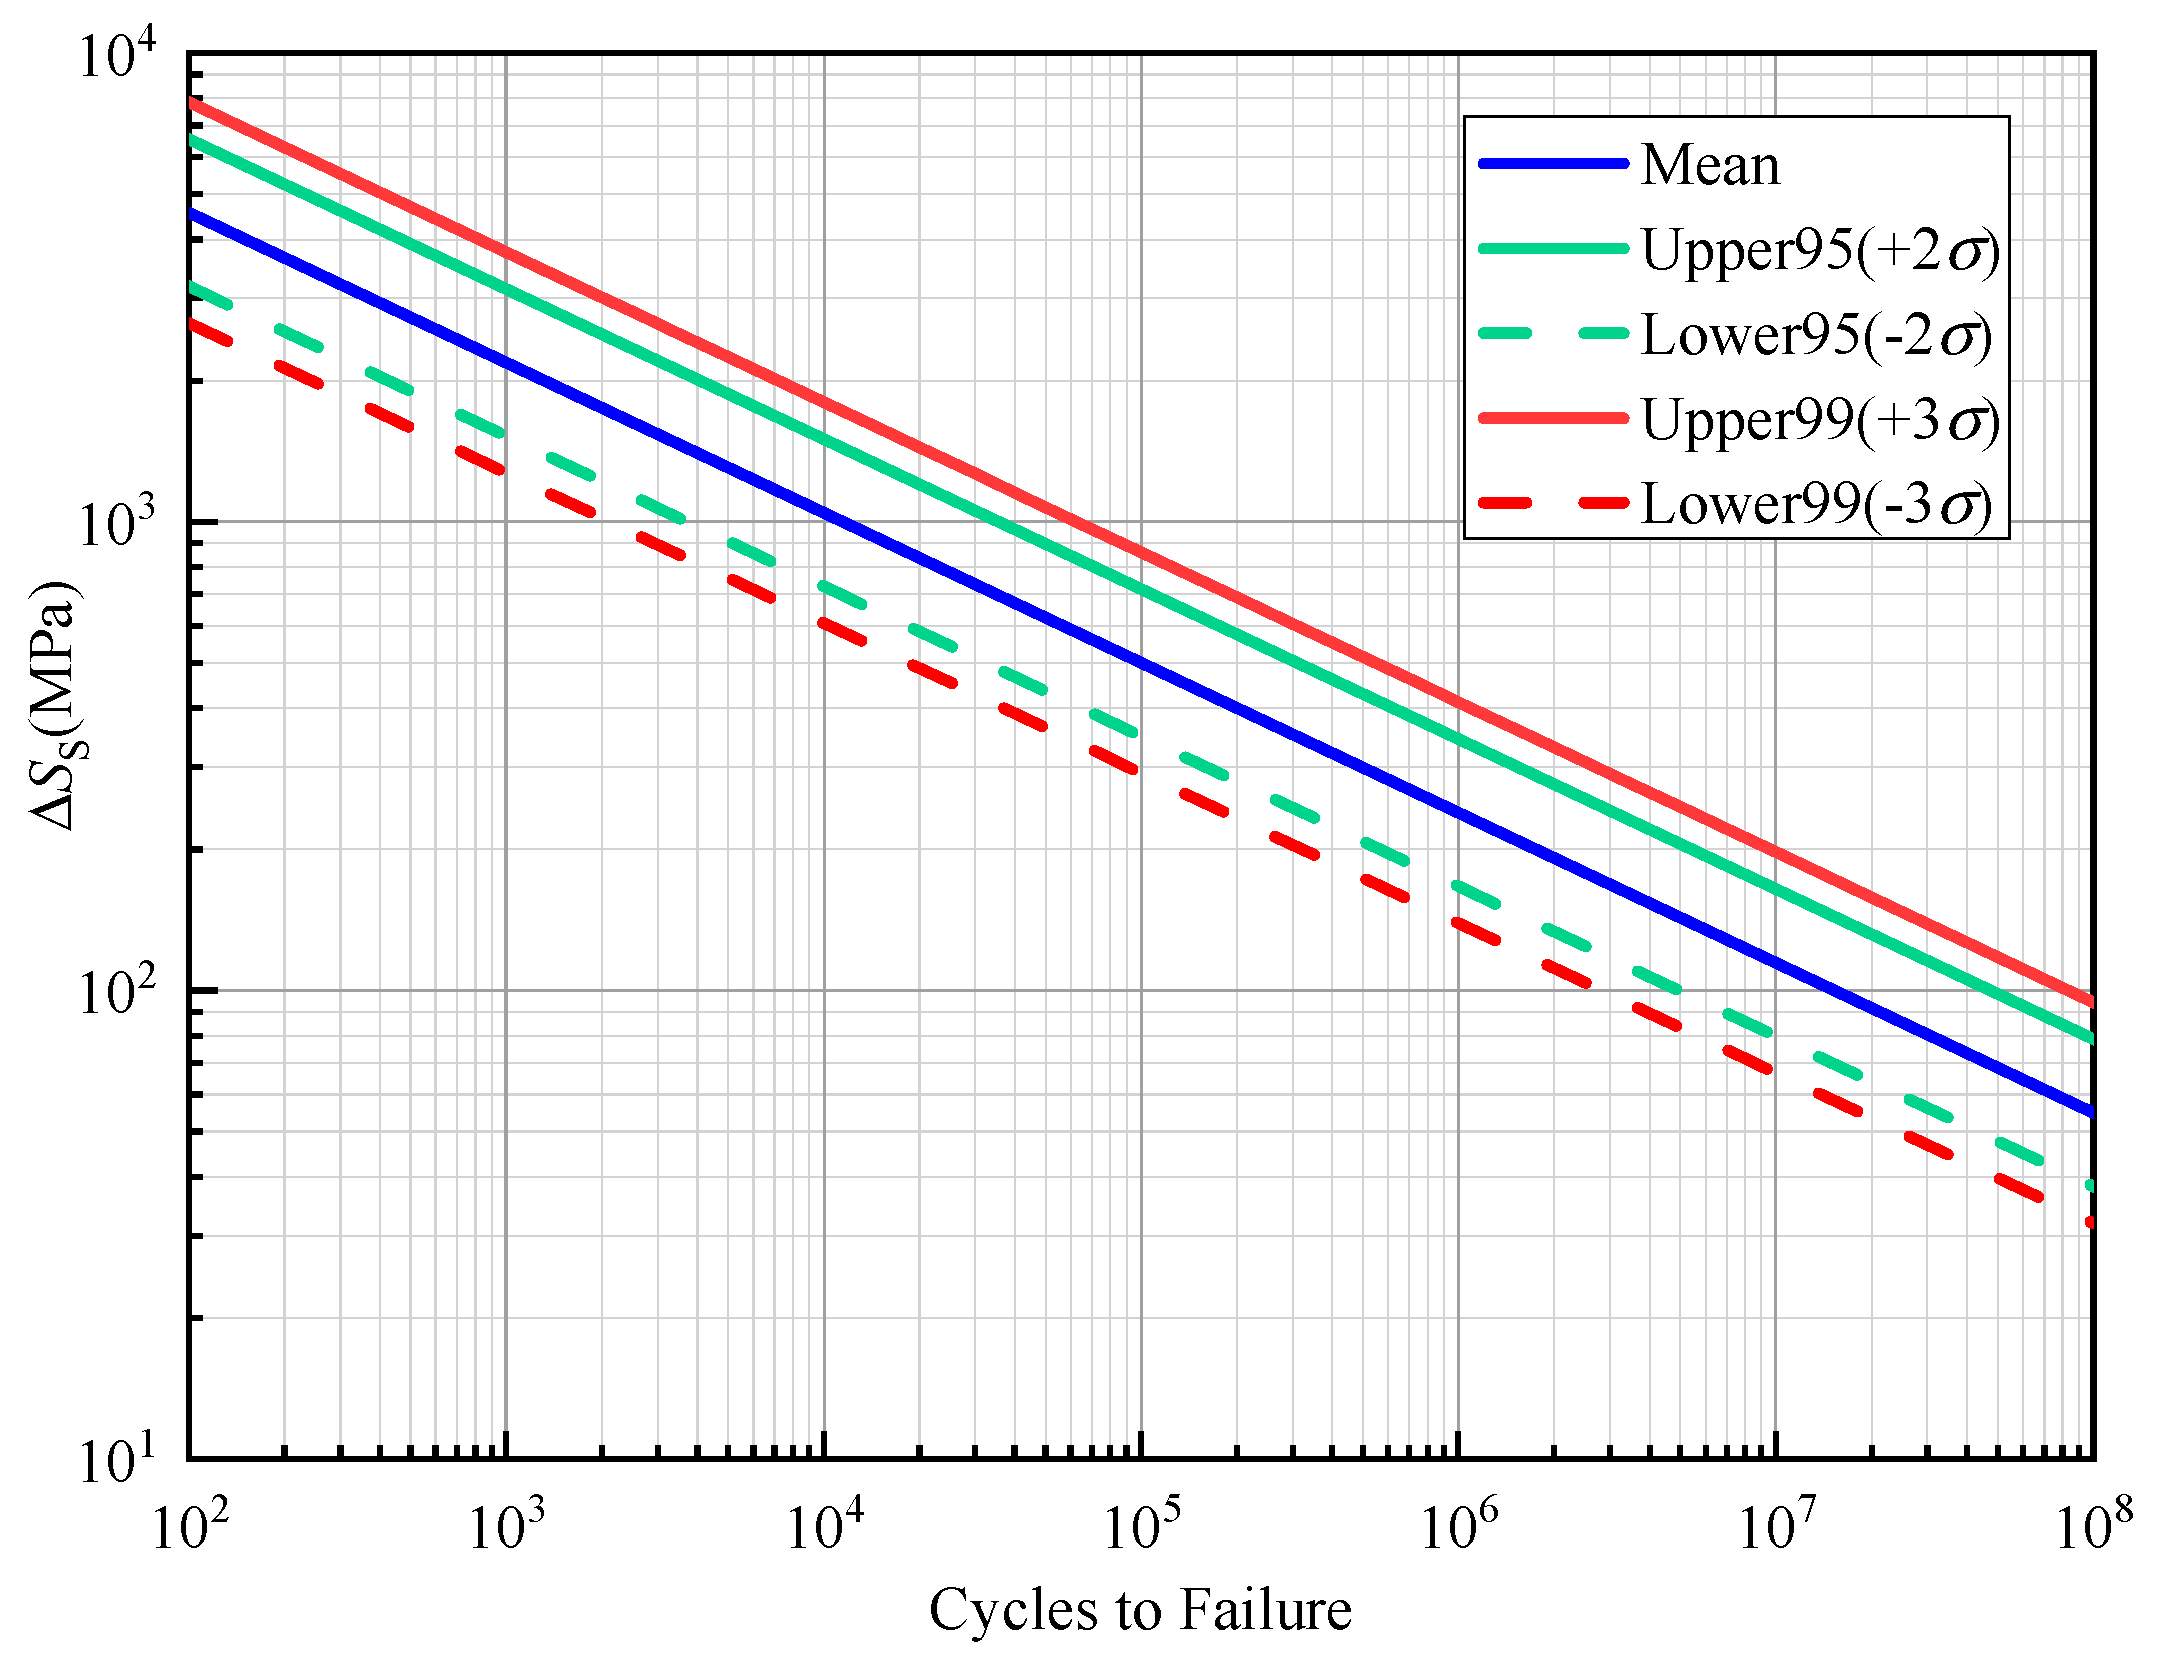
3.3. S-N Curve and Fatigue Design Method
4. Discussion
4.1. Comparison with the Current Codes and Standards
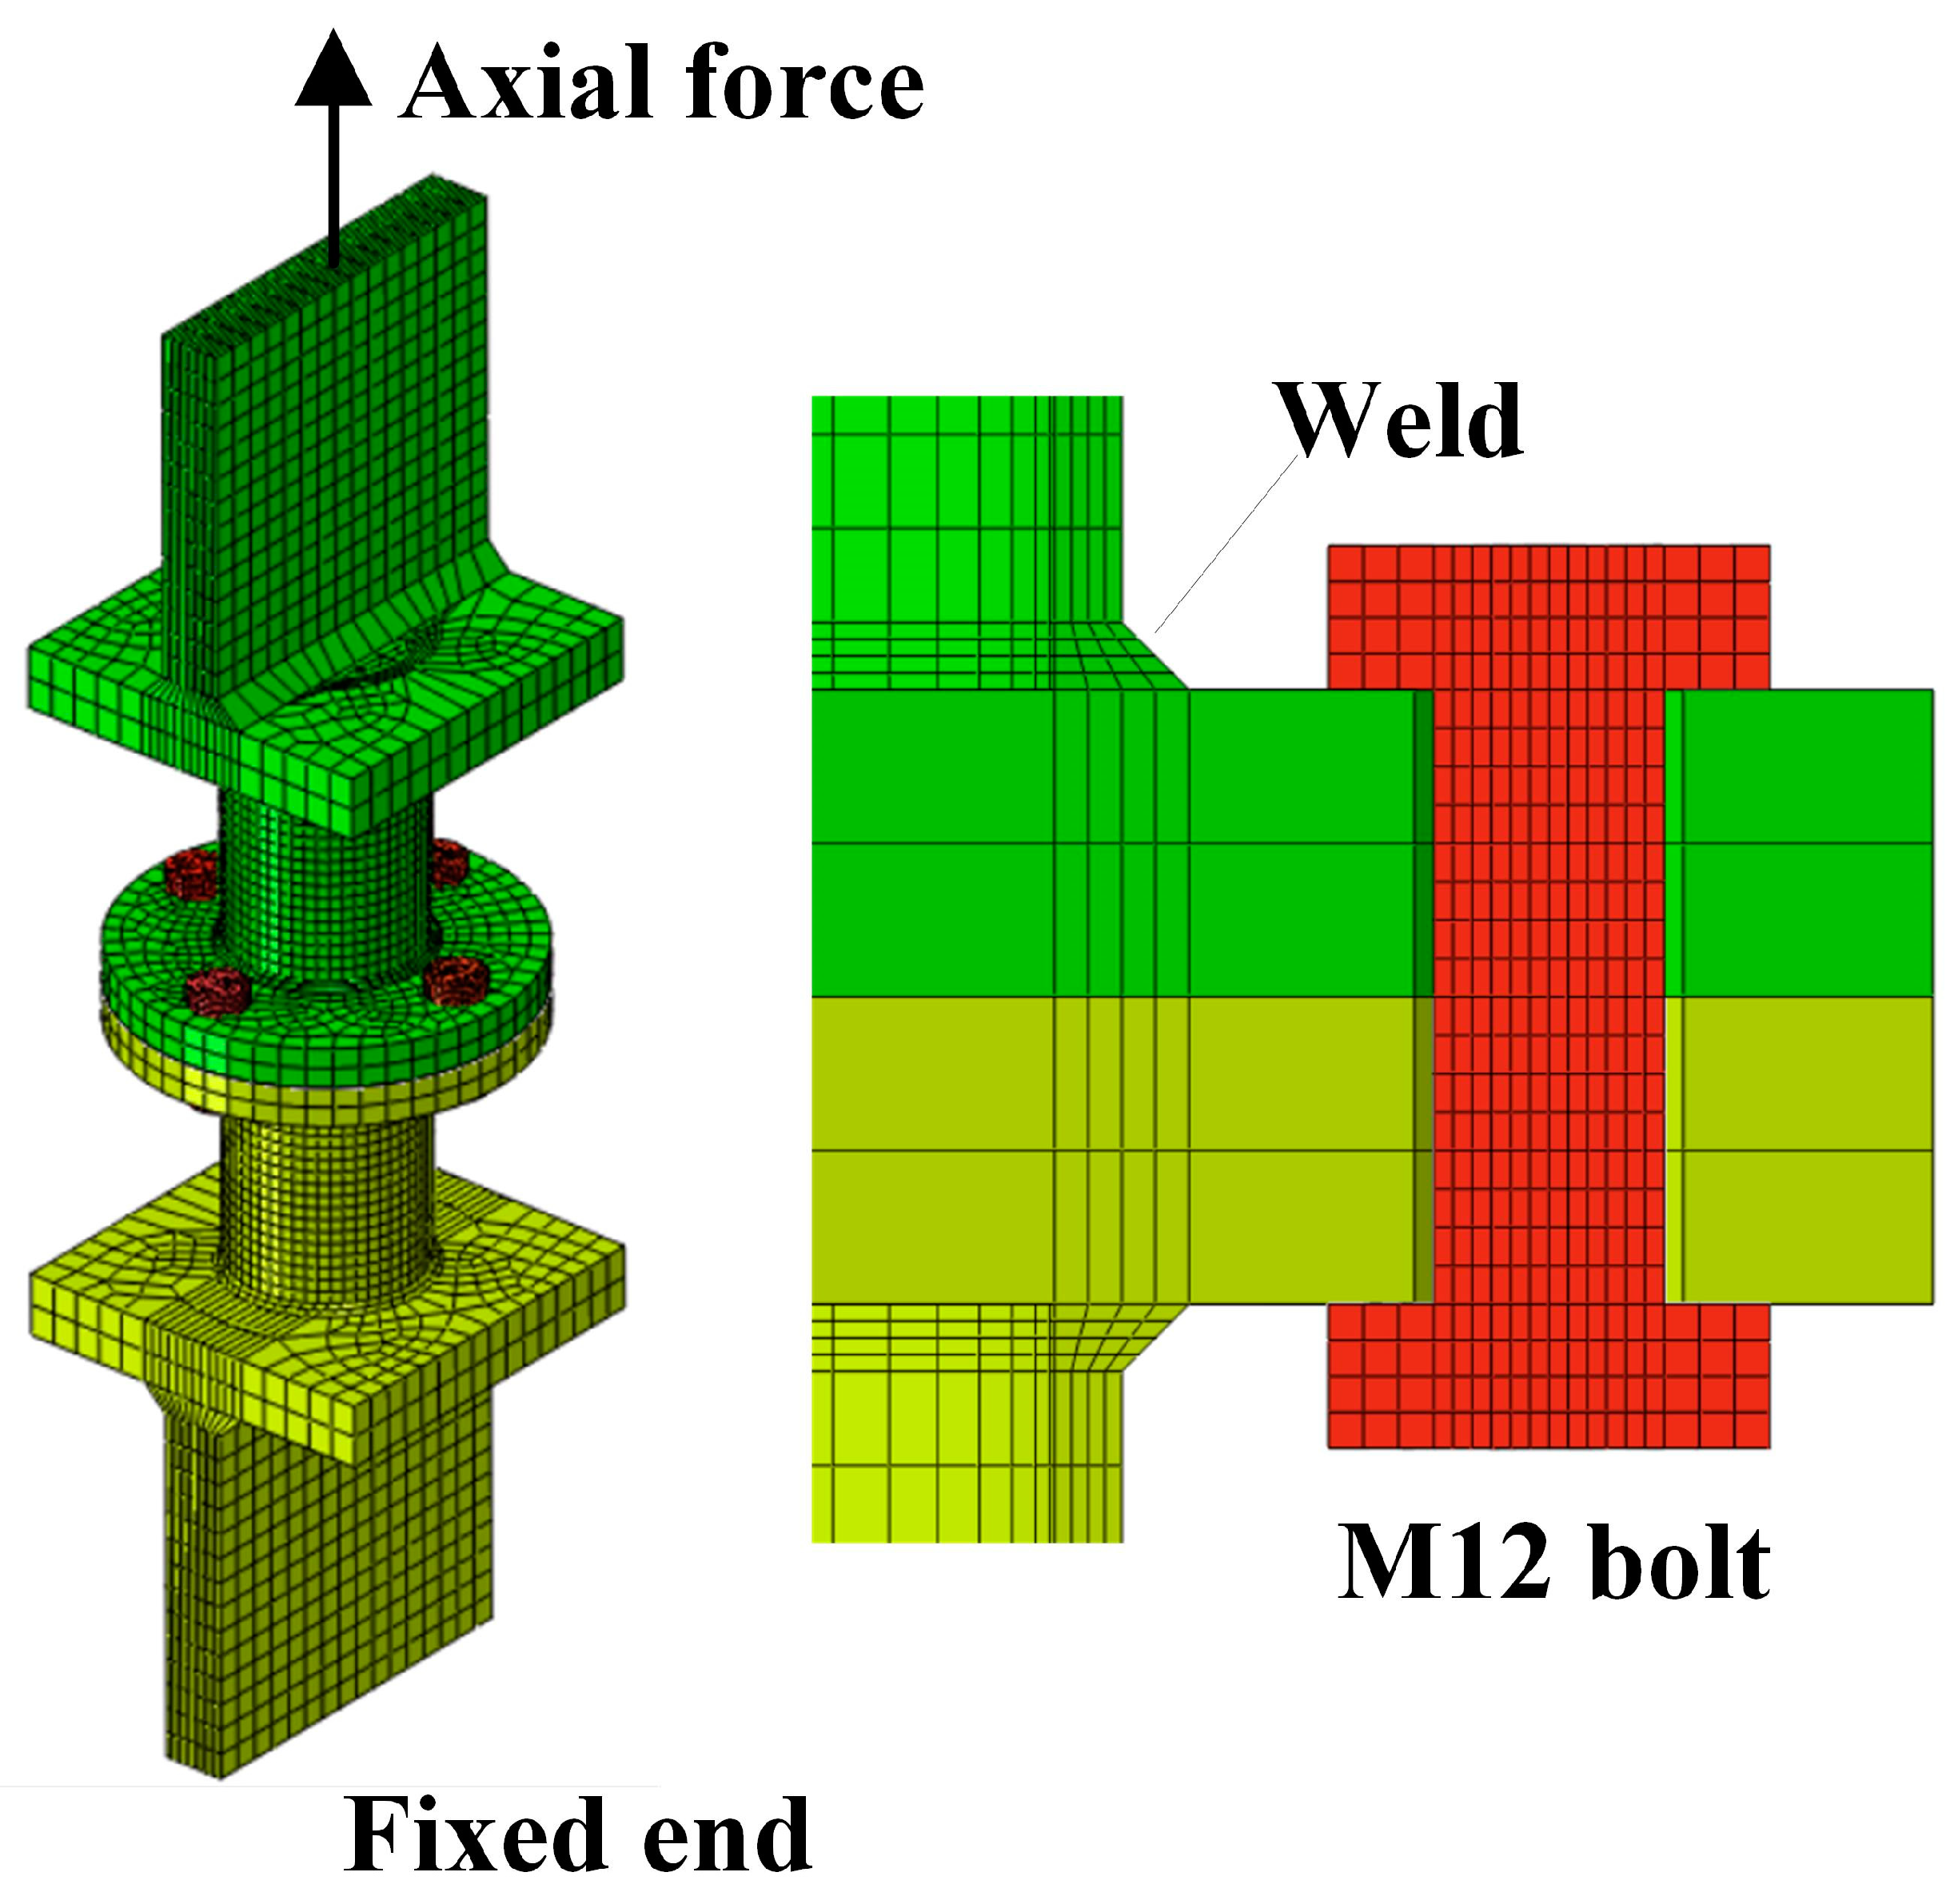
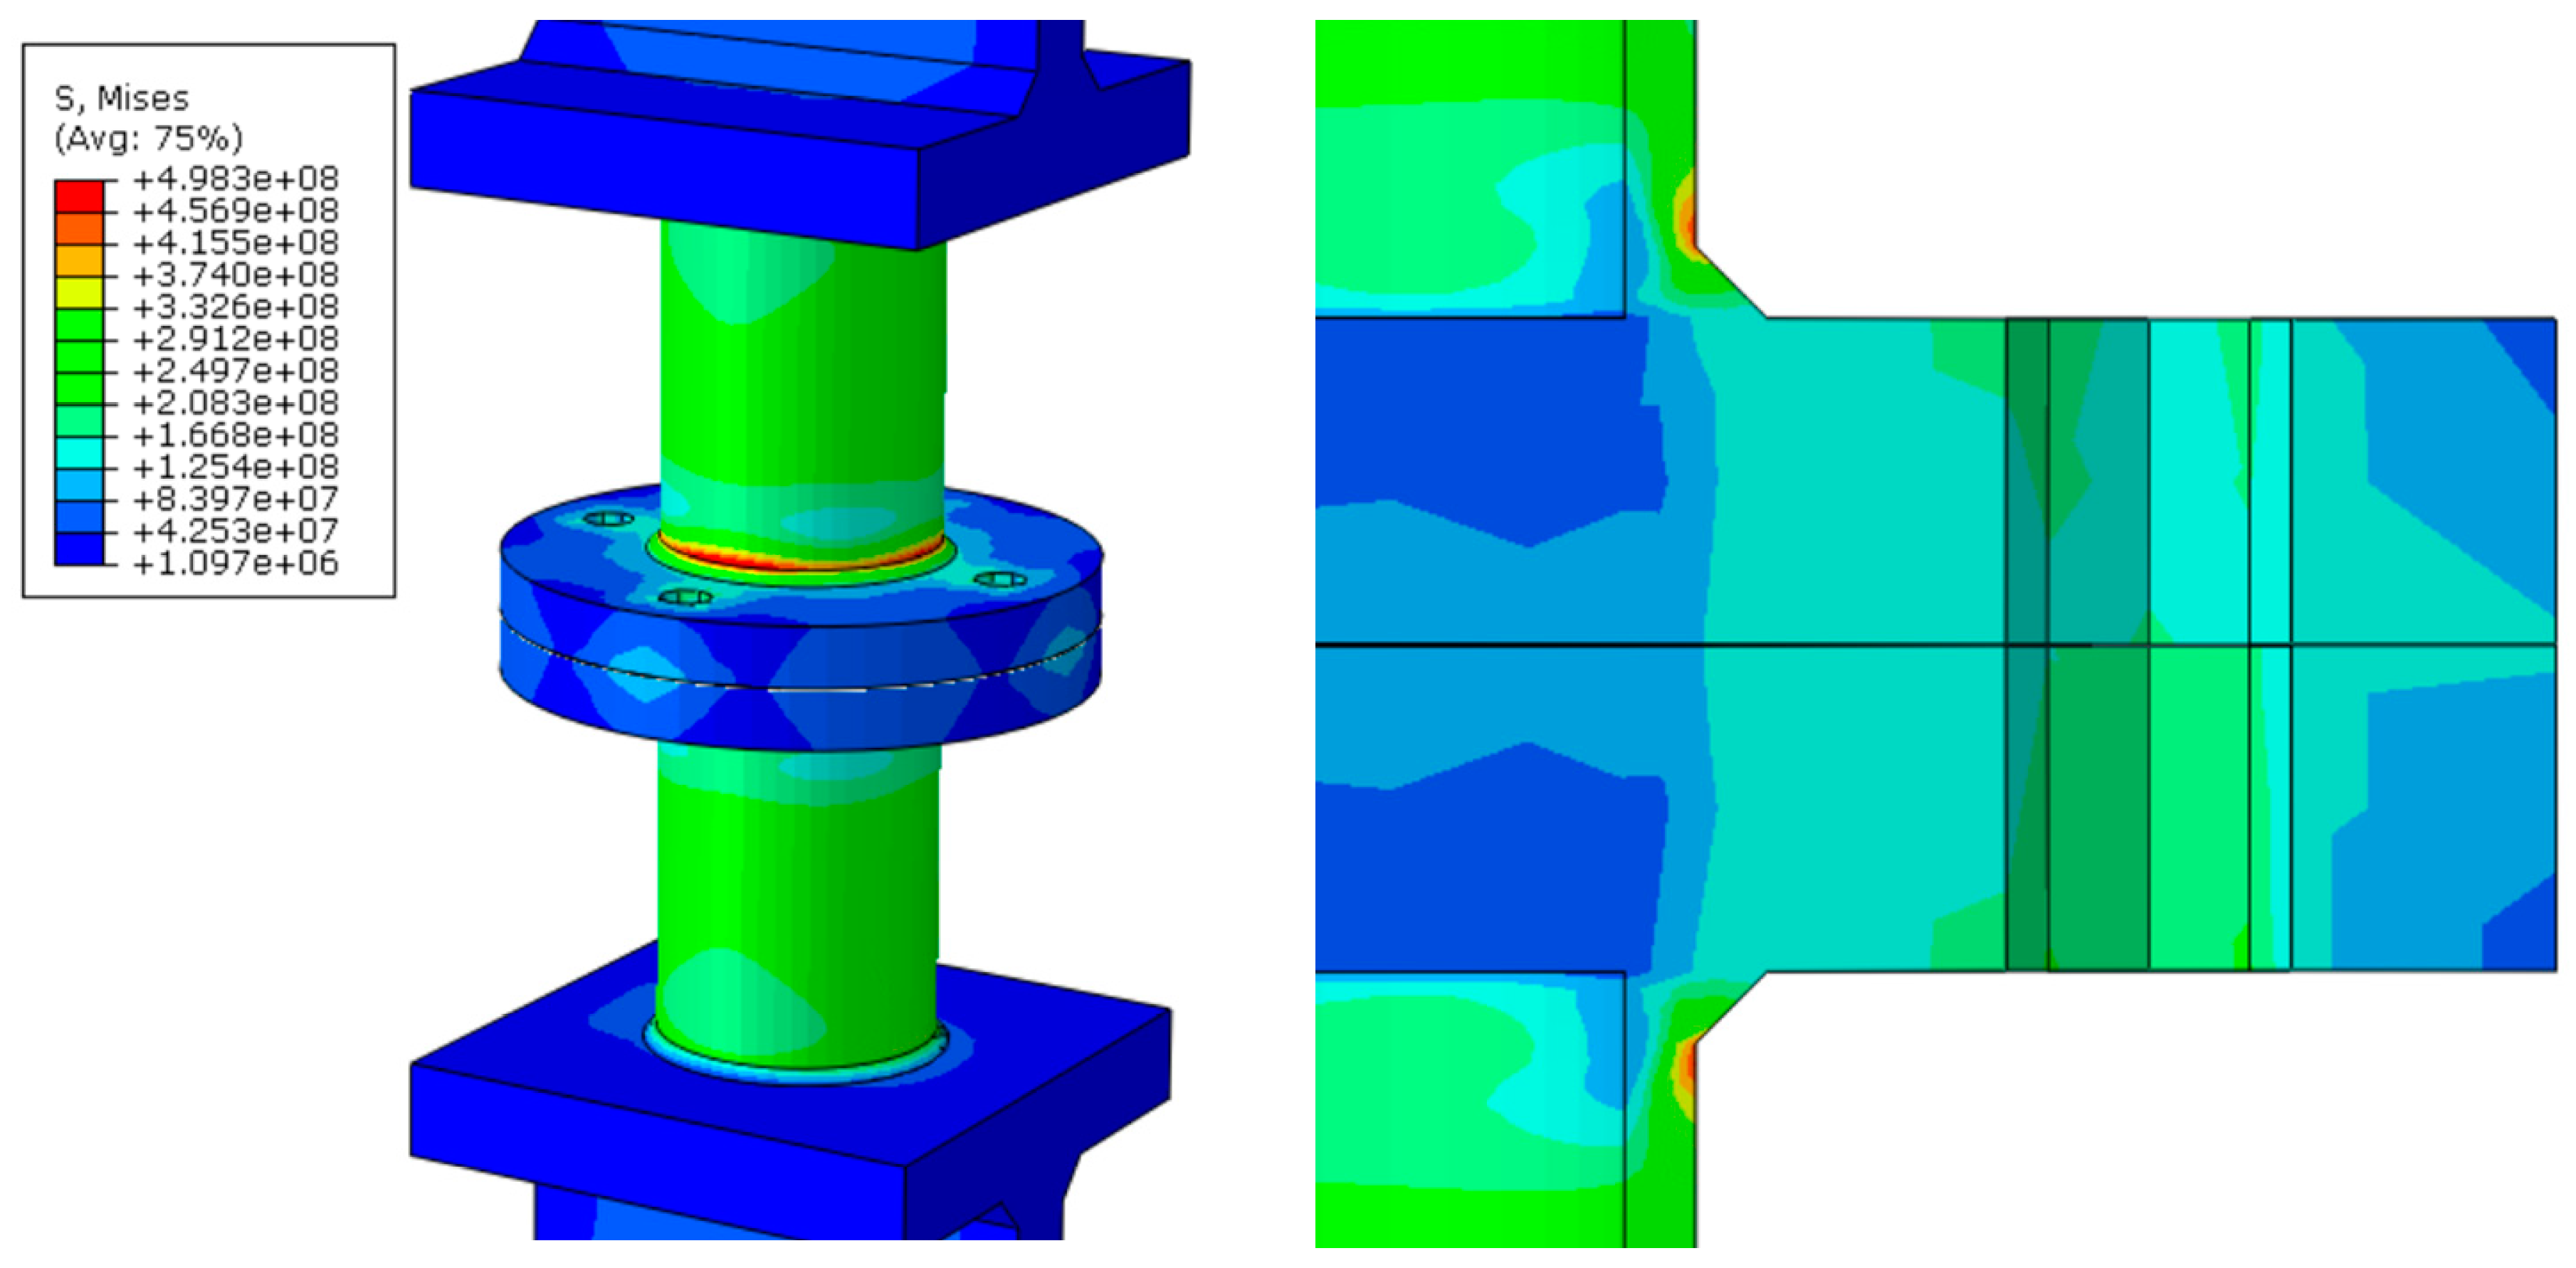
4.2. Numerical Simulation
4.2.1. Modeling Process
4.2.2. Calculation Results
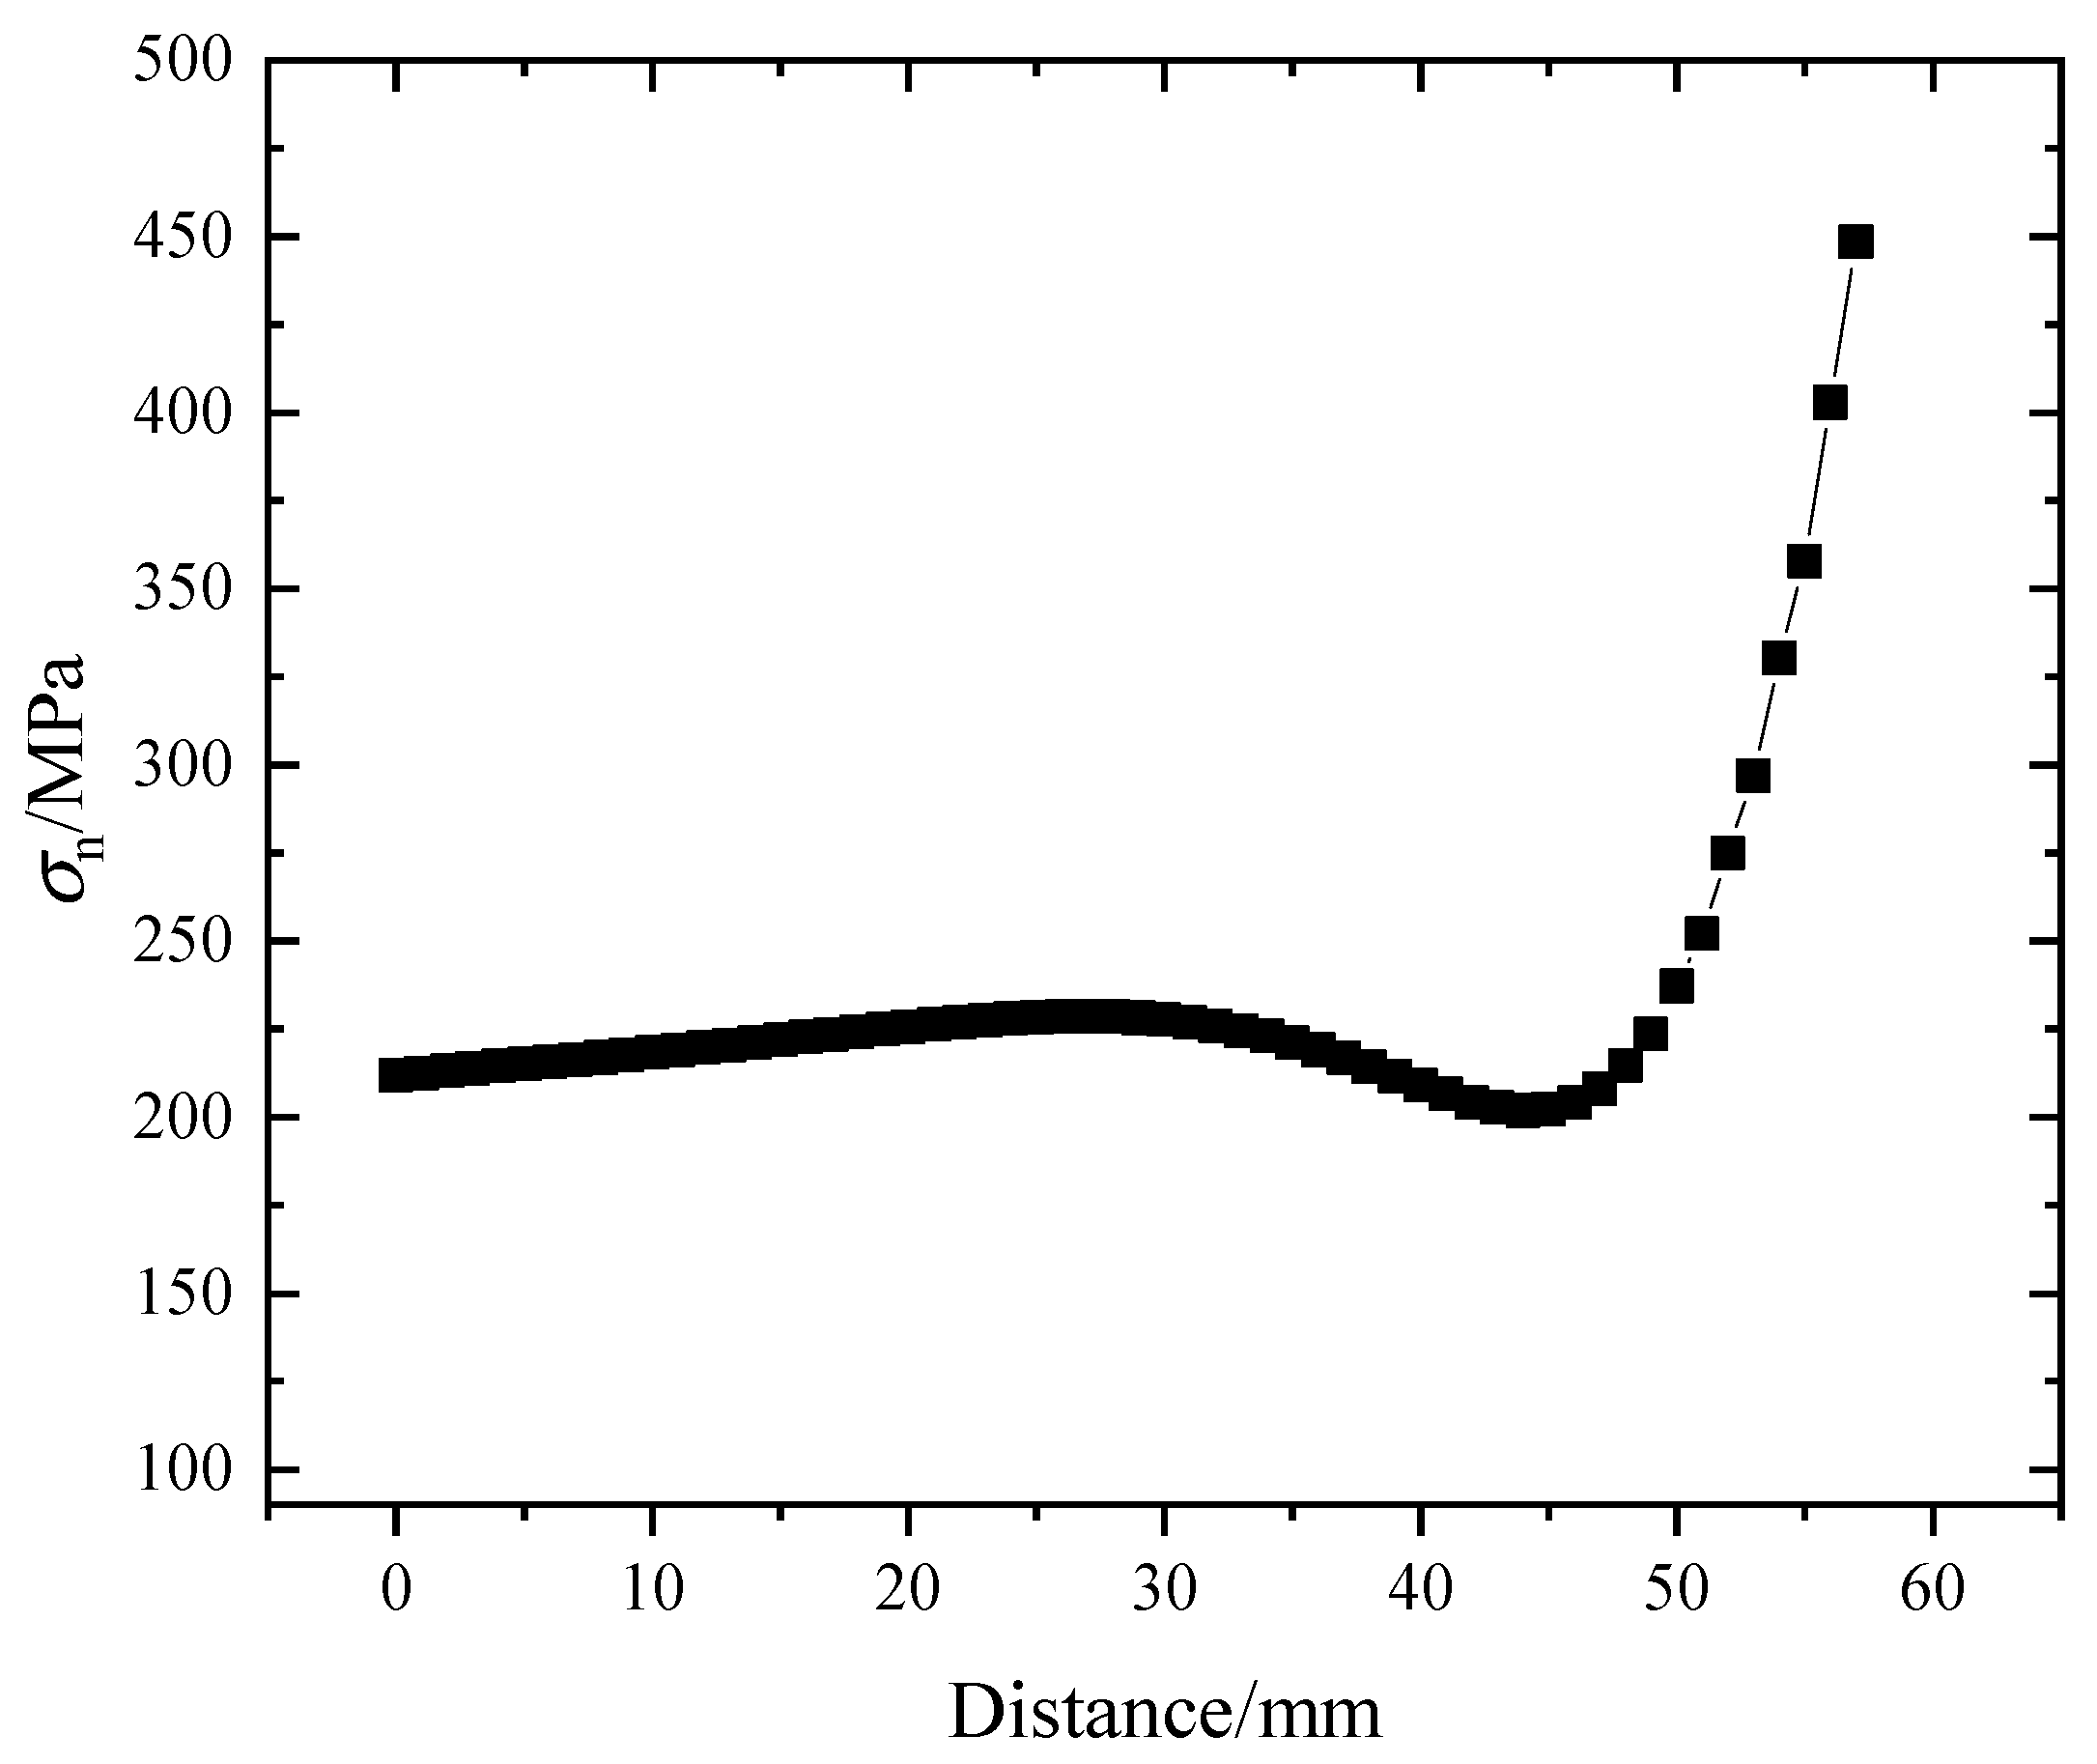
4.3. Structural Stress Method Analysis
4.3.1. Theoretical Basis
4.3.2. Structural Stress Distribution
4.3.3. Fatigue Life Estimation
4.4. Fracture Morphology Analysis
4.4.1. Macro Image Analysis
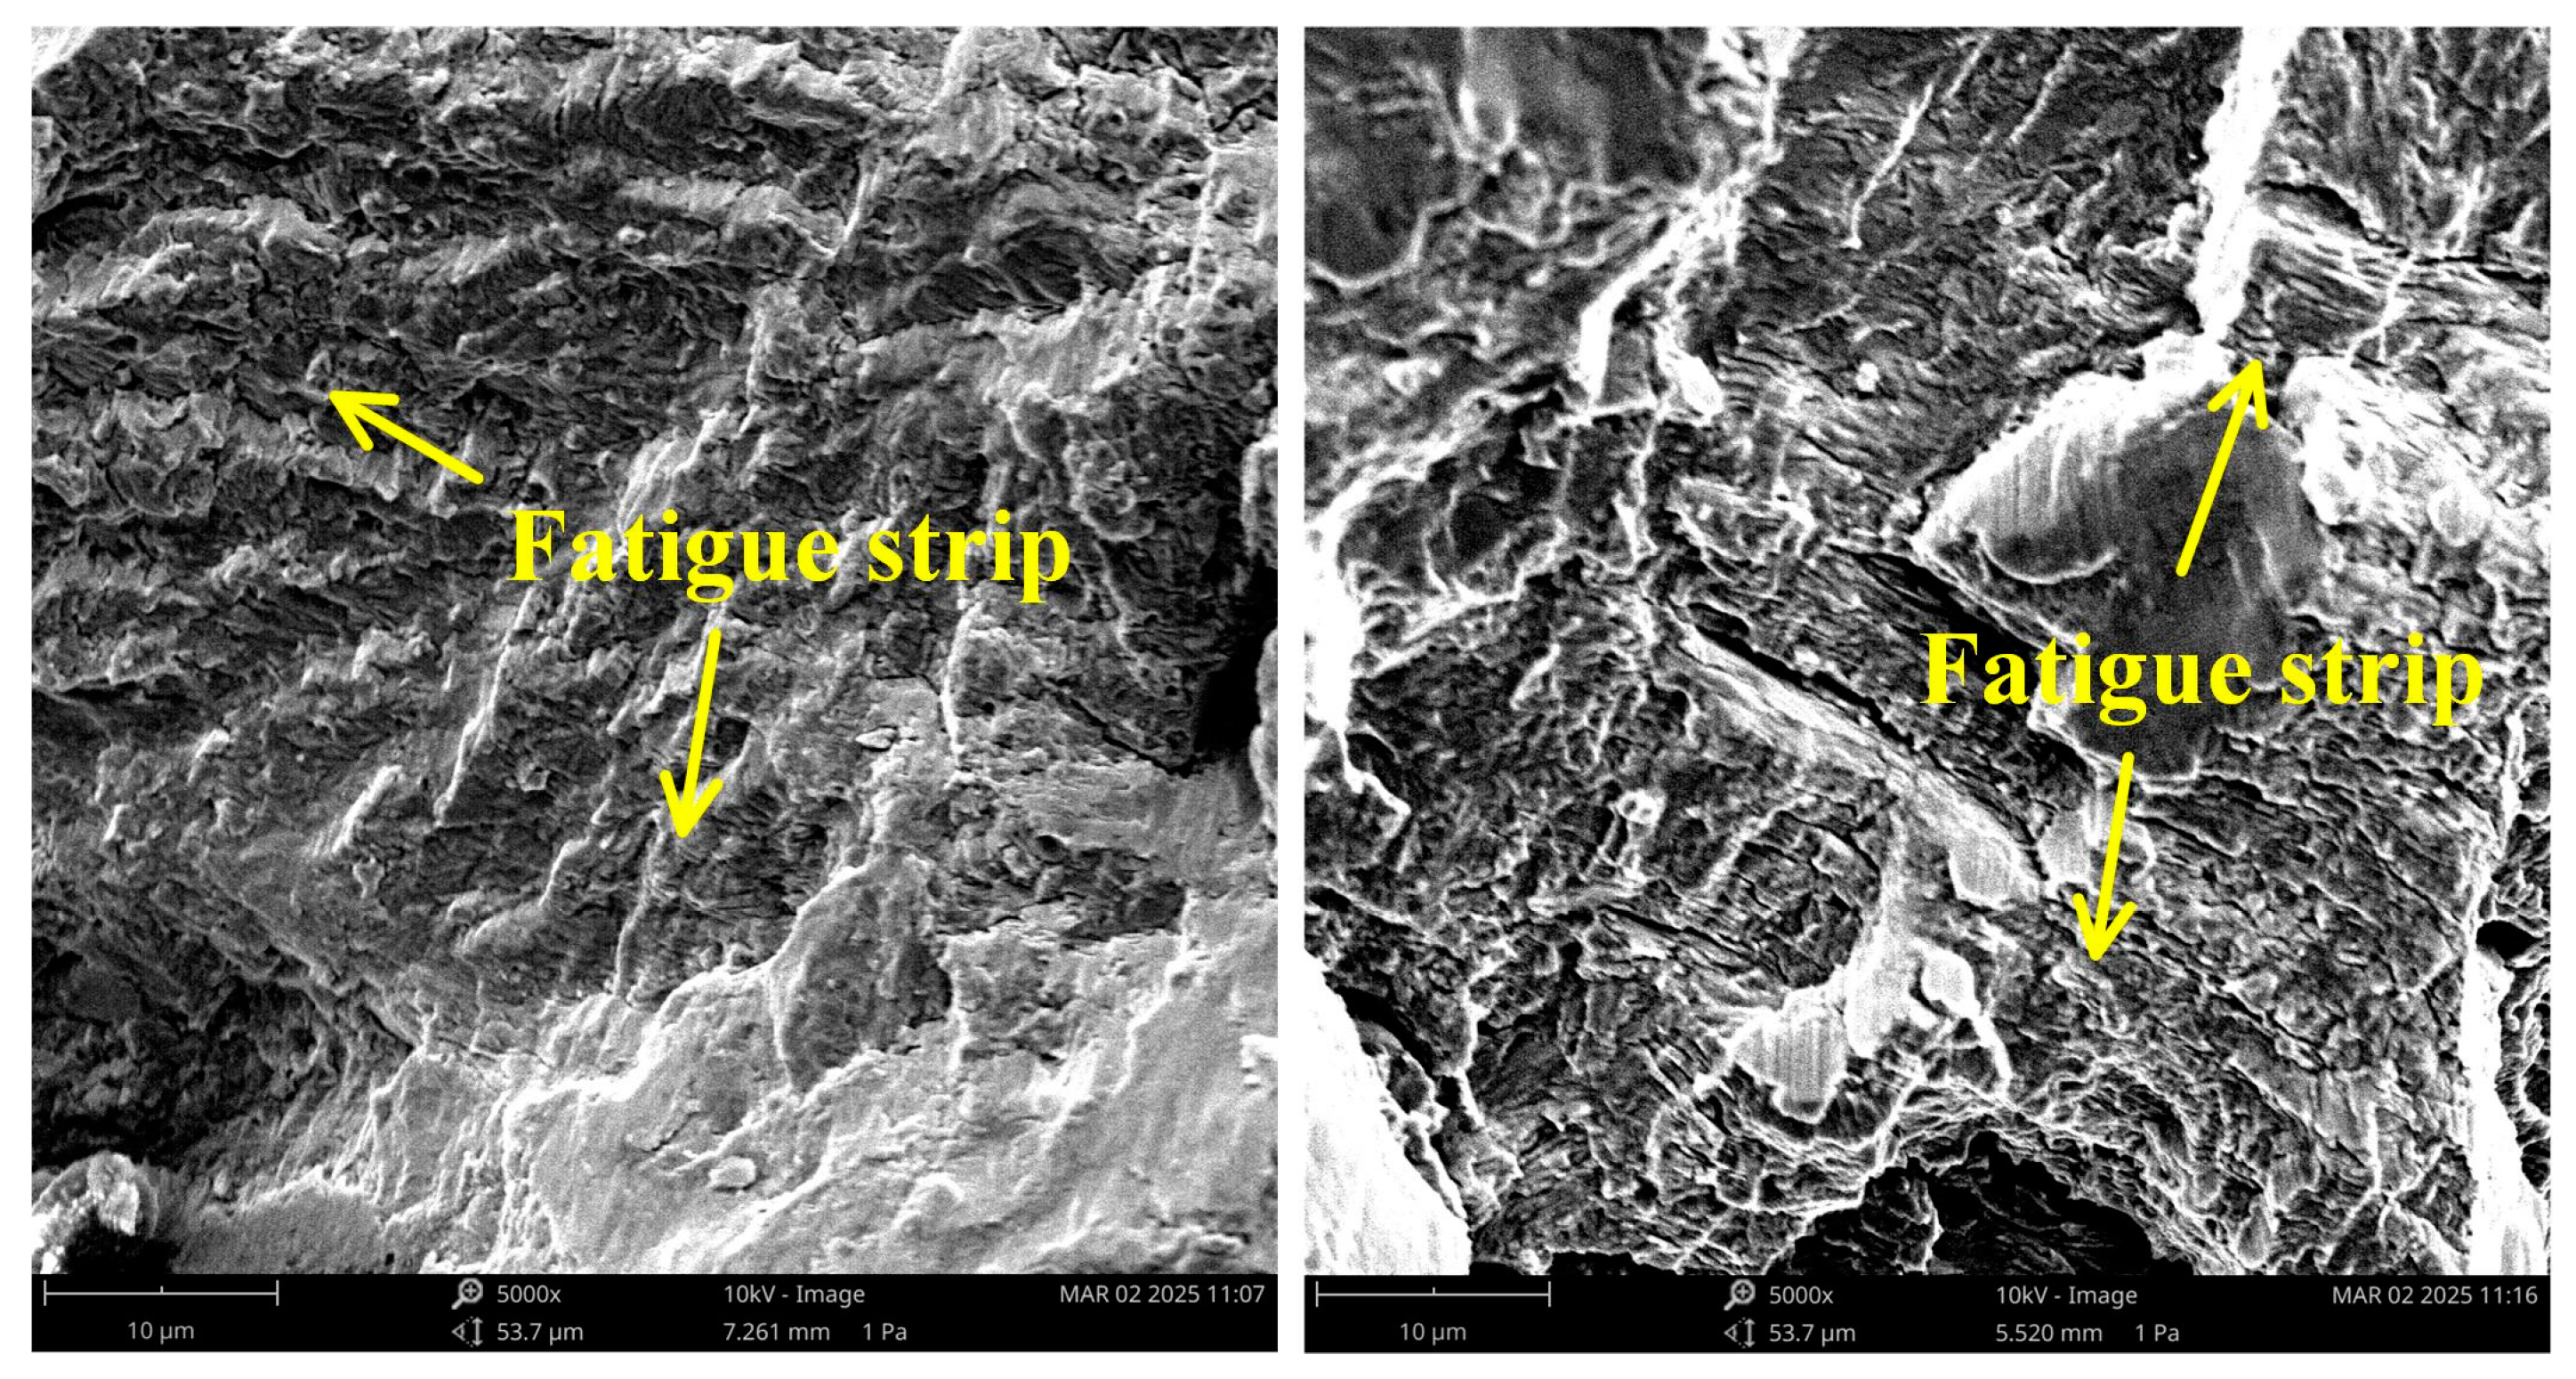
4.4.2. Microscopic Image Analysis
5. Conclusions
- The fatigue cracks of the high-strength bolts always nucleate at the weld toe where the flange plate meets the steel pipe, close to the high-strength bolts. Subsequently, these fatigue cracks spread along the weld toe direction under cyclic loading.
- Finite element analysis shows considerable stress concentration at the weld toe of the steel tube–flange weld near the high-strength bolts. The non-uniform stress distribution in the circumferential direction of the weld makes this location more prone to fatigue failure. The finite element analysis results align with the experimental observations in this study, thereby validating the accuracy of the finite element model’s analysis results and the reliability of the explained mechanical mechanisms.
- The allowable stress amplitude for 2 million cycles of the steel tube–flange weld is 82.41 MPa, which is greater than the fatigue strength of the relevant category in the current codes and standards. This indicates that the steel tube–flange weld has better constant-amplitude fatigue performance compared with the flange connections specified in the codes. This advantage is due to the fact that the specimens in this paper adopt the groove welding method for welding, which has better fatigue performance than fillet welds. Therefore, in practical engineering designs, for steel tube–flange welds that need to withstand cyclic loads, groove welding can be preferentially used for connection.
- The fracture analysis shows that there are obvious fatigue crack initiation regions and crack propagation regions in the fracture of the steel tube–flange welds. A large number of fatigue steps are generated in the fatigue source region, indicating the existence of multiple fatigue sources. Large numbers of river-like stripes and fatigue bands in the crack propagation region are typical characteristics of fatigue failure.
Author Contributions
Funding
Data Availability Statement
Conflicts of Interest
References
- Kawecki, J.; Żurański, J.A. Cross-Wind Vibrations of Steel Chimneys—A New Case History. J. Wind Eng. Ind. Aerodyn. 2007, 95, 1166–1175. [Google Scholar] [CrossRef]
- Liang, Y.; Wang, Y.; Wei, T.; Liu, J. Fatigue strength analysis of high-strength bolts for tower flange of wind turbine. J. Lanzhou Univ. Technol. 2023, 49, 65–69. [Google Scholar]
- Shakeri, I.; Danielsen, H.K.; Tribhou, A.; Fæster, S.; Mishin, O.V.; Eder, M.A. Effect of Manufacturing Defects on Fatigue Life of High Strength Steel Bolts for Wind Turbines. Eng. Fail. Anal. 2022, 141, 106630. [Google Scholar] [CrossRef]
- Oman, S.; Klemenc, J.; Nagode, M.; Okorn, I. Analysis of Additional Load and Fatigue Life of Preloaded Bolts in a Flange Joint Considering a Bolt Bending Load. Met.-Open Access Metall. J. 2021, 11, 449. [Google Scholar] [CrossRef]
- Ni, H.; Zhang, S.; Lei, H. Experimental Study on Variable Amplitude Fatigue Performance of High-Strength Bolts in Steel Structure Flange Connections. Buildings 2024, 14, 3736. [Google Scholar] [CrossRef]
- Yang, R. Effect of bolt pretension on fatigue damage for flange connected communication monopole. Build. Struct. 2018, 48, 26–30. [Google Scholar] [CrossRef]
- Cao, B.; Yang, B.; Li, A.; Deng, Y.; Ding, Y. Wind-Induced Fatigue Study of Bolted Flange Joints of Self-Standing Steel Chimneys. Ind. Constr. 2025, 55, 75–85. [Google Scholar]
- Okorn, I.; Nagode, M.; Klemenc, J.; Oman, S. Influence of Geometric Imperfections of Flange Joints on the Fatigue Load of Preloaded Bolts. Int. J. Press. Vessels Pip. 2024, 210, 105237. [Google Scholar] [CrossRef]
- Kikuchi, Y.; Ishihara, T. Fatigue Prediction of Wind Turbine Tower Considering the Effect of High-Tension Bolt Failure. Eng. Fail. Anal. 2025, 174, 109494. [Google Scholar] [CrossRef]
- Hu, Y.; Yan, R.; Shen, W.; Berto, F.; Li, C. A Novel Semi-Analytical Method for Notch Stress and Fatigue Strength Analysis of Tube-Flange Welded Joints. Int. J. Fatigue 2020, 141, 105860. [Google Scholar] [CrossRef]
- Van-Long, H.; Jean-Pierre, J.; Jean-François, D. Behaviour of Bolted Flange Joints in Tubular Structures under Monotonic, Repeated and Fatigue Loadings I: Experimental Tests. J. Constr. Steel Res. 2013, 85, 1–11. [Google Scholar] [CrossRef]
- Visentin, A.; Campagnolo, A.; Babini, V.; Meneghetti, G. Fatigue Assessment of Steel Tube-to-Flange Welded Joints with Reinforcement Ribs Subjected to Multiaxial Loads According to the Peak Stress Method. Procedia Struct. Integr. 2024, 57, 810–816. [Google Scholar] [CrossRef]
- Oh, G.; Akiniwa, Y. Residual and Assembling Stress Analyses on Fillet Welded Joints of Flange Pipes and the Fatigue Strength Prediction. Thin-Walled Struct. 2019, 136, 138–149. [Google Scholar] [CrossRef]
- GB50661-2011; Code for Welding Steel Structures. Standards Press of China: Beijing, China, 2011.
- GB/T 1228-2006; High Strength Bolts with Large Hexagon Head for Steel Structures. Standards Press of China: Beijing, China, 2006.
- GB/T 13682-92; Axial Load Fatigue Testing for Threaded Fasteners. Standards Press of China: Beijing, China, 1992.
- Zhang, J.; Lei, H.; Jin, S. Experimental Study on Constant-Amplitude Fatigue Performance of Weld Toe in Steel Tube of Welded Hollow Spherical Joints in Grid Structures. Adv. Mater. Sci. Eng. 2019, 2019, 6204302. [Google Scholar] [CrossRef]
- Guo, Q.; Xing, Y.; Lei, H.; Jiao, J.; Chen, Q. Fatigue Performance and Life Prediction Methods Research on Steel Tube-Welded Hollow Spherical Joint. Steel Compos. Struct. 2020, 36, 75–86. [Google Scholar] [CrossRef]
- Guo, S.; Liu, H.; Liu, X.; Wang, G.; Lei, H. Unified Method for Predicting the Fatigue Life of Pipe–Sphere Joints in Grid Structures. Thin-Walled Struct. 2024, 203, 112209. [Google Scholar] [CrossRef]
- Hobbacher, A.F. Recommendations for Fatigue Design of Welded Joints and Components; Springer International Publishing: Cham, Switzerland, 2016. [Google Scholar] [CrossRef]
- European Committee for Standardization. Eurocode 3: Design of Steel Structures-Part 1-9: Fatigue, EN 1993-1-9; European Committee for Standardization: Brussels, Belgium, 2005. [Google Scholar]
- GB50017-2017; Standard for Design of Steel Structures. China Architecture and Building Press: Beijing, China, 2017.
- Raebel, C.; DeSimone, R.; Meier, A. Effects of Bolt Spacing On Prying Forces in WT Connections; American Society of Civil Engineers: New York, NY, USA, 2013; p. 754. ISBN 978-0-7844-1290-9. [Google Scholar]
- Khani, R.; Hosseinzadeh, Y.; Hoseinzadeh Asl, M. Investigating the Prying Force Magnitude and Location in the T-Stub Connection Based on the Energy Method. Eng. Struct. 2023, 280, 115655. [Google Scholar] [CrossRef]
- Jiao, J.; Liu, Z.; Guo, Q.; Liu, Y.; Lei, H. Constant-Amplitude Fatigue Behavior of M24 High-Strength Bolt of End-Plate Flange Connection. Structures 2021, 34, 2041–2053. [Google Scholar] [CrossRef]
- Dong, P. A Structural Stress Definition and Numerical Implementation for Fatigue Analysis of Welded Joints. Int. J. Fatigue 2001, 23, 865–876. [Google Scholar] [CrossRef]
- Dong, P.; Hong, J.K.; Osage, D.; Prager, M. Assessment of Asme’s Fsrf Rules for Vessel and Piping Welds Using a New Structural Stress Method. Weld. World 2003, 47, 31–43. [Google Scholar] [CrossRef]
- Qiu, B.; Lin, J.; Yang, X.; Lei, H. Experimental Research on the Fatigue Properties of the M30 High-strength under False Twisting. Sci. Technol. Eng. 2017, 17, 20–25. [Google Scholar]


| Number | Load | Stress Amplitude | Stress Ratio | |
|---|---|---|---|---|
| Fmax | Fmin | Δσn | ρ | |
| TF-1 | 185.46 | 18.546 | 184.48 | 0.1 |
| TF-2 | 168.60 | 16.860 | 167.70 | 0.1 |
| TF-3 | 168.60 | 16.860 | 167.70 | 0.1 |
| TF-4 | 151.74 | 15.174 | 150.93 | 0.1 |
| TF-5 | 151.74 | 15.174 | 150.93 | 0.1 |
| TF-6 | 134.88 | 13.488 | 134.17 | 0.1 |
| TF-7 | 101.16 | 10.116 | 100.62 | 0.1 |
| Number | Reference Category | Illustration | Fatigue Strength Corresponding to 2 Million Cycles (MPa) | |
|---|---|---|---|---|
| 1 | IIW: 913 category |  | 50 | |
| 2 | IIW: 921 category |  | K-butt weld, toe ground | 90 |
| Fillet weld, toe ground | 90 | |||
| Fillet welds, as welded | 71 | |||
| 3 | Euro 3: Class 71Steel structure design standards: Z8 category |  | 71 | |
| 4 | Euro 3: Class 40Steel structure design standards: Z11 category | 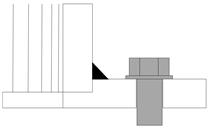 | 40 | |
| 5 | This paper | 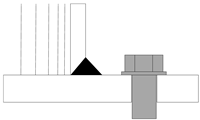 | 82.41 | |
| Npre (×104) | Ntest | log(Ntest)/log(Npre) | ||
|---|---|---|---|---|
| 197.46 | 662 | 8.20 | 5.05 | 0.96 |
| 179.51 | 598 | 10.89 | 16.18 | 1.03 |
| 179.51 | 598 | 11.26 | 18.91 | 1.04 |
| 161.56 | 534 | 15.51 | 21.77 | 1.03 |
| 161.56 | 534 | 16.18 | 25.63 | 1.04 |
| 143.61 | 470 | 24.27 | 47.00 | 1.05 |
| 107.71 | 343 | 70.00 | 101.63 | 1.03 |
Disclaimer/Publisher’s Note: The statements, opinions and data contained in all publications are solely those of the individual author(s) and contributor(s) and not of MDPI and/or the editor(s). MDPI and/or the editor(s) disclaim responsibility for any injury to people or property resulting from any ideas, methods, instructions or products referred to in the content. |
© 2025 by the authors. Licensee MDPI, Basel, Switzerland. This article is an open access article distributed under the terms and conditions of the Creative Commons Attribution (CC BY) license (https://creativecommons.org/licenses/by/4.0/).
Share and Cite
Ni, H.; Guo, S.; Zhang, S.; Lei, H. Experimental and Numerical Investigation of Constant-Amplitude Fatigue Performance in Welded Joints of Steel Tubular Flange Connections for Steel Structures. Buildings 2025, 15, 1574. https://doi.org/10.3390/buildings15091574
Ni H, Guo S, Zhang S, Lei H. Experimental and Numerical Investigation of Constant-Amplitude Fatigue Performance in Welded Joints of Steel Tubular Flange Connections for Steel Structures. Buildings. 2025; 15(9):1574. https://doi.org/10.3390/buildings15091574
Chicago/Turabian StyleNi, Huaguang, Saicong Guo, Shujia Zhang, and Honggang Lei. 2025. "Experimental and Numerical Investigation of Constant-Amplitude Fatigue Performance in Welded Joints of Steel Tubular Flange Connections for Steel Structures" Buildings 15, no. 9: 1574. https://doi.org/10.3390/buildings15091574
APA StyleNi, H., Guo, S., Zhang, S., & Lei, H. (2025). Experimental and Numerical Investigation of Constant-Amplitude Fatigue Performance in Welded Joints of Steel Tubular Flange Connections for Steel Structures. Buildings, 15(9), 1574. https://doi.org/10.3390/buildings15091574