1. Introduction
Global climate change and the urban heat island effect pose a significant threat to human thermal comfort in urban areas. Research shows a rising trend in the intensity, duration, and frequency of heat waves in Los Angeles, which is attributed to ongoing global climate change [
1]. For this reason, architects and urban designers have the responsibility of prioritizing measures to mitigate the urban heat island (UHI) effect in their project designs.
Urban heat islands are urban areas that experience significantly higher temperatures than their rural surroundings, primarily due to the lack of vegetation and the dominance of impervious surfaces. Limited tree canopy reduces shading and evaporative cooling, while materials like asphalt and concrete absorb and retain heat, releasing it slowly at night. Together, these factors trap heat and intensify urban temperatures [
2,
3,
4].
Previous studies, such as those by Ruiz-Avilles and Hoffman, have emphasized the importance of green infrastructure in mitigating UHI effects. Urban forestry, green roofs, and water features have been identified as key strategies for reducing urban temperatures by increasing surface reflectance and providing natural cooling through evapotranspiration. Integrating these cooling features into urban designs reduces the land surface temperature (LST) and creates a more comfortable microclimate for residents [
5,
6]. Ruiz-Avilles’ research specifically highlights the role of constructed wetlands and water features in cooling traditionally dry urban environments, while Hoffman’s research draws attention to the lack of green spaces and tree canopy in historically disadvantaged communities, resulting in hotter urban conditions.
However, as recent research suggests, there is no single solution to mitigating UHI. A combination of strategies is needed to effectively tackle the problem across different urban contexts. Regression models, as demonstrated by Lewis et al., allow for a better understanding of how multiple variables, such as vegetation, canopies, impervious surfaces, and water features, interact to influence LST [
7]. This multidisciplinary approach provides valuable insights into how urban planning decisions can be optimized to achieve maximum cooling impact in various parts of a city.
The economic consequences of poor UHI mitigation are also notable. The rising temperatures due to UHI lead to increased discomfort and health risks and result in higher energy demands for cooling, straining both the power grid and residents’ finances. Studies have quantified the financial costs associated with inadequate UHI mitigation, estimating the increased energy consumption due to excessive use of air conditioning in urban areas experiencing UHI [
8]. This highlights the need for architects and urban designers to incorporate energy-efficient, cooling-focused designs into urban development projects for environmental sustainability and economic resilience.
This study innovatively combines microclimate simulations with Universal Thermal Climate Index (UTCI) analysis to assess the cooling potential of integrated green infrastructure strategies—including tree canopies, green roofs, and horizontal green surfaces—in two climatically distinct cities. By utilizing UTCI as the primary metric and comparing intervention scenarios to a base case representing typical hot day conditions, this study systematically quantifies the effectiveness of different green infrastructure combinations in mitigating outdoor thermal stress. The findings provide actionable guidelines for urban planners and policymakers, supporting the development of more sustainable, climate-resilient, and thermally comfortable urban environments.
Impact of Green Surfaces and Tree Canopy on Outdoor Comfort
Urban environments exacerbate extreme heat conditions by virtue of the disproportionate presence of low-lying constructed surfaces compared with natural, non-manmade landscapes [
9,
10]. Previous research demonstrates that neighborhoods with historical redlining tend to have higher temperatures, which are primarily attributed to their limited access to green spaces and mature tree canopies, which results in inadequate shade [
6].
The lack of vegetation and canopies in these areas intensifies heat stress. Another study shows that the combination of green infrastructure or green spaces in established urban areas has the potential to alleviate the UHI effect [
11]. Urban green spaces provide a nature-based remedy for thermal stress, with vegetated areas capable of reducing temperatures in urban environments [
12,
13]. Salata et al. stated that in Rome, Italy, street trees and parks reduced air temperatures by up to 1.34 °C, while Yan et al. mentioned that in Beijing, China, they achieved a cooling effect of 2.8 °C. Thorsson et al. found even more substantial results in Chiba, Japan, where the cooling effect was as high as 3.0 °C [
14,
15,
16]. Another study demonstrates that the vegetation in the canopy layer can improve thermal comfort by blocking direct solar gains and providing some evaporative cooling [
17].
Research also demonstrates the benefits of green roofs in reducing the building cooling load [
17,
18]. Green roofs, when integrated into urban design, not only reduce surface temperatures but also provide insulation that decreases energy consumption, contributing to both environmental and economic benefits. Further research into green roofs, canopies, and greened surfaces could help establish their roles in mitigating urban heat stress and creating more thermally comfortable cities.
2. Materials and Methods
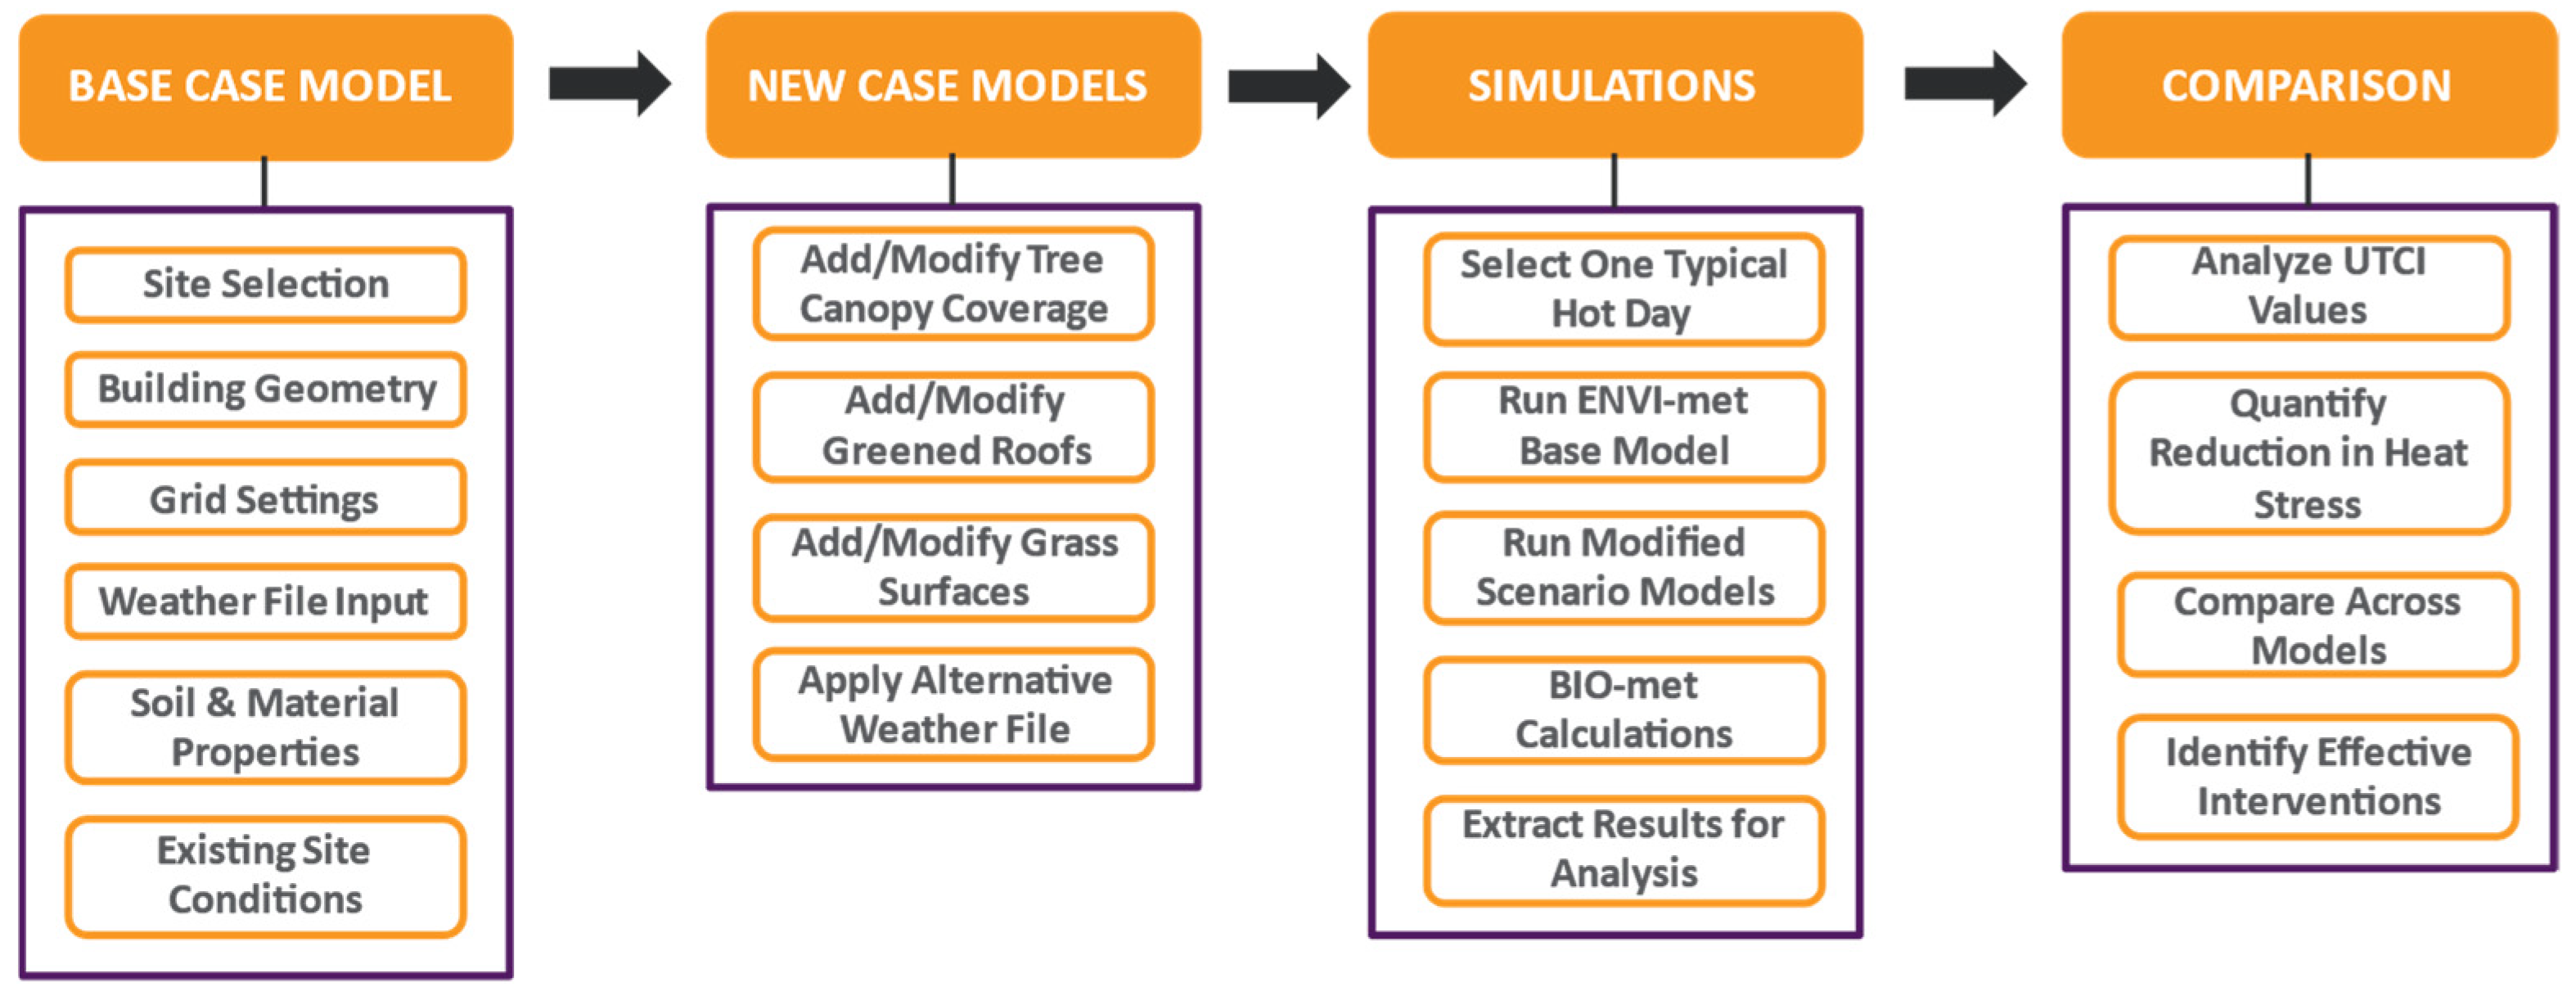
The methodology implemented in this research encompasses study area selection, data collection, ENVI-met modeling, BIO-met calculation, intervention implementation, thermal index comparison, and data analysis (
Figure 1).
The first step involved the selection of the study area, Inglewood, Los Angeles, a location with significant urban infrastructure and areas affected by the UHI effect. This area was chosen due to its diverse mix of urban development and vegetation and its potential for green infrastructure interventions. Moreover, previous studies, including Lewis’s research, have shown that Inglewood has higher land surface temperatures compared with its neighboring areas, indicating the need for targeted UHI mitigation strategies, which makes it an ideal candidate for exploring the effectiveness of various green infrastructure interventions (
Figure 2) [
7].
Using ENVI-met, the researchers constructed a base model that accurately represents the site’s geometry. This base model encompasses building geometry and existing site features (roads, canopies, and green surfaces), as well as material and soil settings. Data were collected from diverse sources, including geographical information system (GIS) data, satellite imagery, and aerial photographs. These data sources provided the necessary inputs for an accurate representation of the site’s physical characteristics, including its surface reflectance, land cover type, and vegetation distribution, ensuring that the model reflected the on-the-ground conditions of Inglewood.
The second step involved targeted intervention in the base model by modifying the canopies, green surfaces, and weather file to create new case models. Phoenix was selected due to its hyper-arid desert climate, providing a contrasting context to assess the effectiveness of green infrastructure interventions under extreme heat conditions; the Phoenix weather file was applied in the simulation. This intervention aimed to explore the potential impacts of modifying these components on outdoor thermal conditions.
In the third step, simulations were conducted using both the base model and the modified scenario models. BIO-met facilitated a comprehensive simulation process, allowing for the calculation of the UTCI.
In the fourth step, the results from the base model and the modified scenario model simulations were analyzed and compared. This comparative assessment provided insights into the relative effectiveness of each intervention in reducing outdoor thermal stress. Changes in canopies density and green surface coverage and their combined effects on reducing surface and ambient temperatures were assessed through a detailed analysis of UTCI values.
The final stage of analysis involved comparing the results from the modified models to a base case scenario (representing Inglewood’s current state) and evaluating each intervention’s impact. Quantitative data were extracted from the simulations, including the percentage reduction in heat stress for the different scenarios. This comparative assessment supports conclusions about the interventions’ effectiveness and their implications for outdoor microclimate conditions.
2.1. Simulation Model and Parameters
ENVI-met is a microclimate simulation software that is used for urban planning [
19]. ENVI-met version 5.5.1 was used in the study. The modeling processes were conducted in space. The existing site, including its trees, roads, and buildings, was accurately modeled within the software to create the baseline scenario, which served as the model base for subsequent simulations (
Table 1).
Table 2 summarizes the key input parameters for the simulated tree, grass, and building insulation materials used in ENVI-met. These parameters include vegetation structural properties, thermal characteristics, and seasonal adjustments to accurately represent microclimate interactions in the study area.
2.2. Simulation Index
The UTCI describes the environmental temperature equivalent determined with a reference environment. This index is defined as the reference environment’s air temperature that results in an identical strain index value when compared to the response of the reference individual in the actual environment. UTCI is widely acknowledged as one of the most comprehensive metrics for assessing heat stress in outdoor thermal comfort. This index was formulated to establish a standardized criterion for evaluating heat stress within the context of human meteorology. UTCI is classified into 10 categories, ranging from extreme cold stress to extreme heat stress (
Table 3) [
20,
21].
The BIO-met within the ENVI-met was used to calculate the UTCI by integrating detailed climate data and simulating the human thermal environment (
Table 4).
ENVI-met uses localized data, such as building geometry, vegetation, and surface materials, to create models and simulate microclimates, and BIO-met provides an objective measure of thermal comfort within these simulated environments. By accounting for microclimate differences, BIO-met provides a practical tool for urban planners and researchers to evaluate the thermal effects of green infrastructure interventions.
2.3. Case Studies
Los Angeles has a Mediterranean climate with mild, wet winters and warm-to-hot dry summers featuring moderate temperature variations. Meanwhile, in the Sonoran Desert, Phoenix experiences a hot desert climate with extreme summer heat, mild winters, low humidity, and minimal precipitation. Despite these differences in climate classification, both cities grapple with the formidable challenge of urban heat stress, which is exacerbated by the scorching temperatures they encounter. By choosing these two cities, this study aims to explore how green infrastructure interventions can address the shared issue of extreme heat and enhance outdoor thermal comfort, offering insights that can be applied to these cities and other hot desert climate regions worldwide.
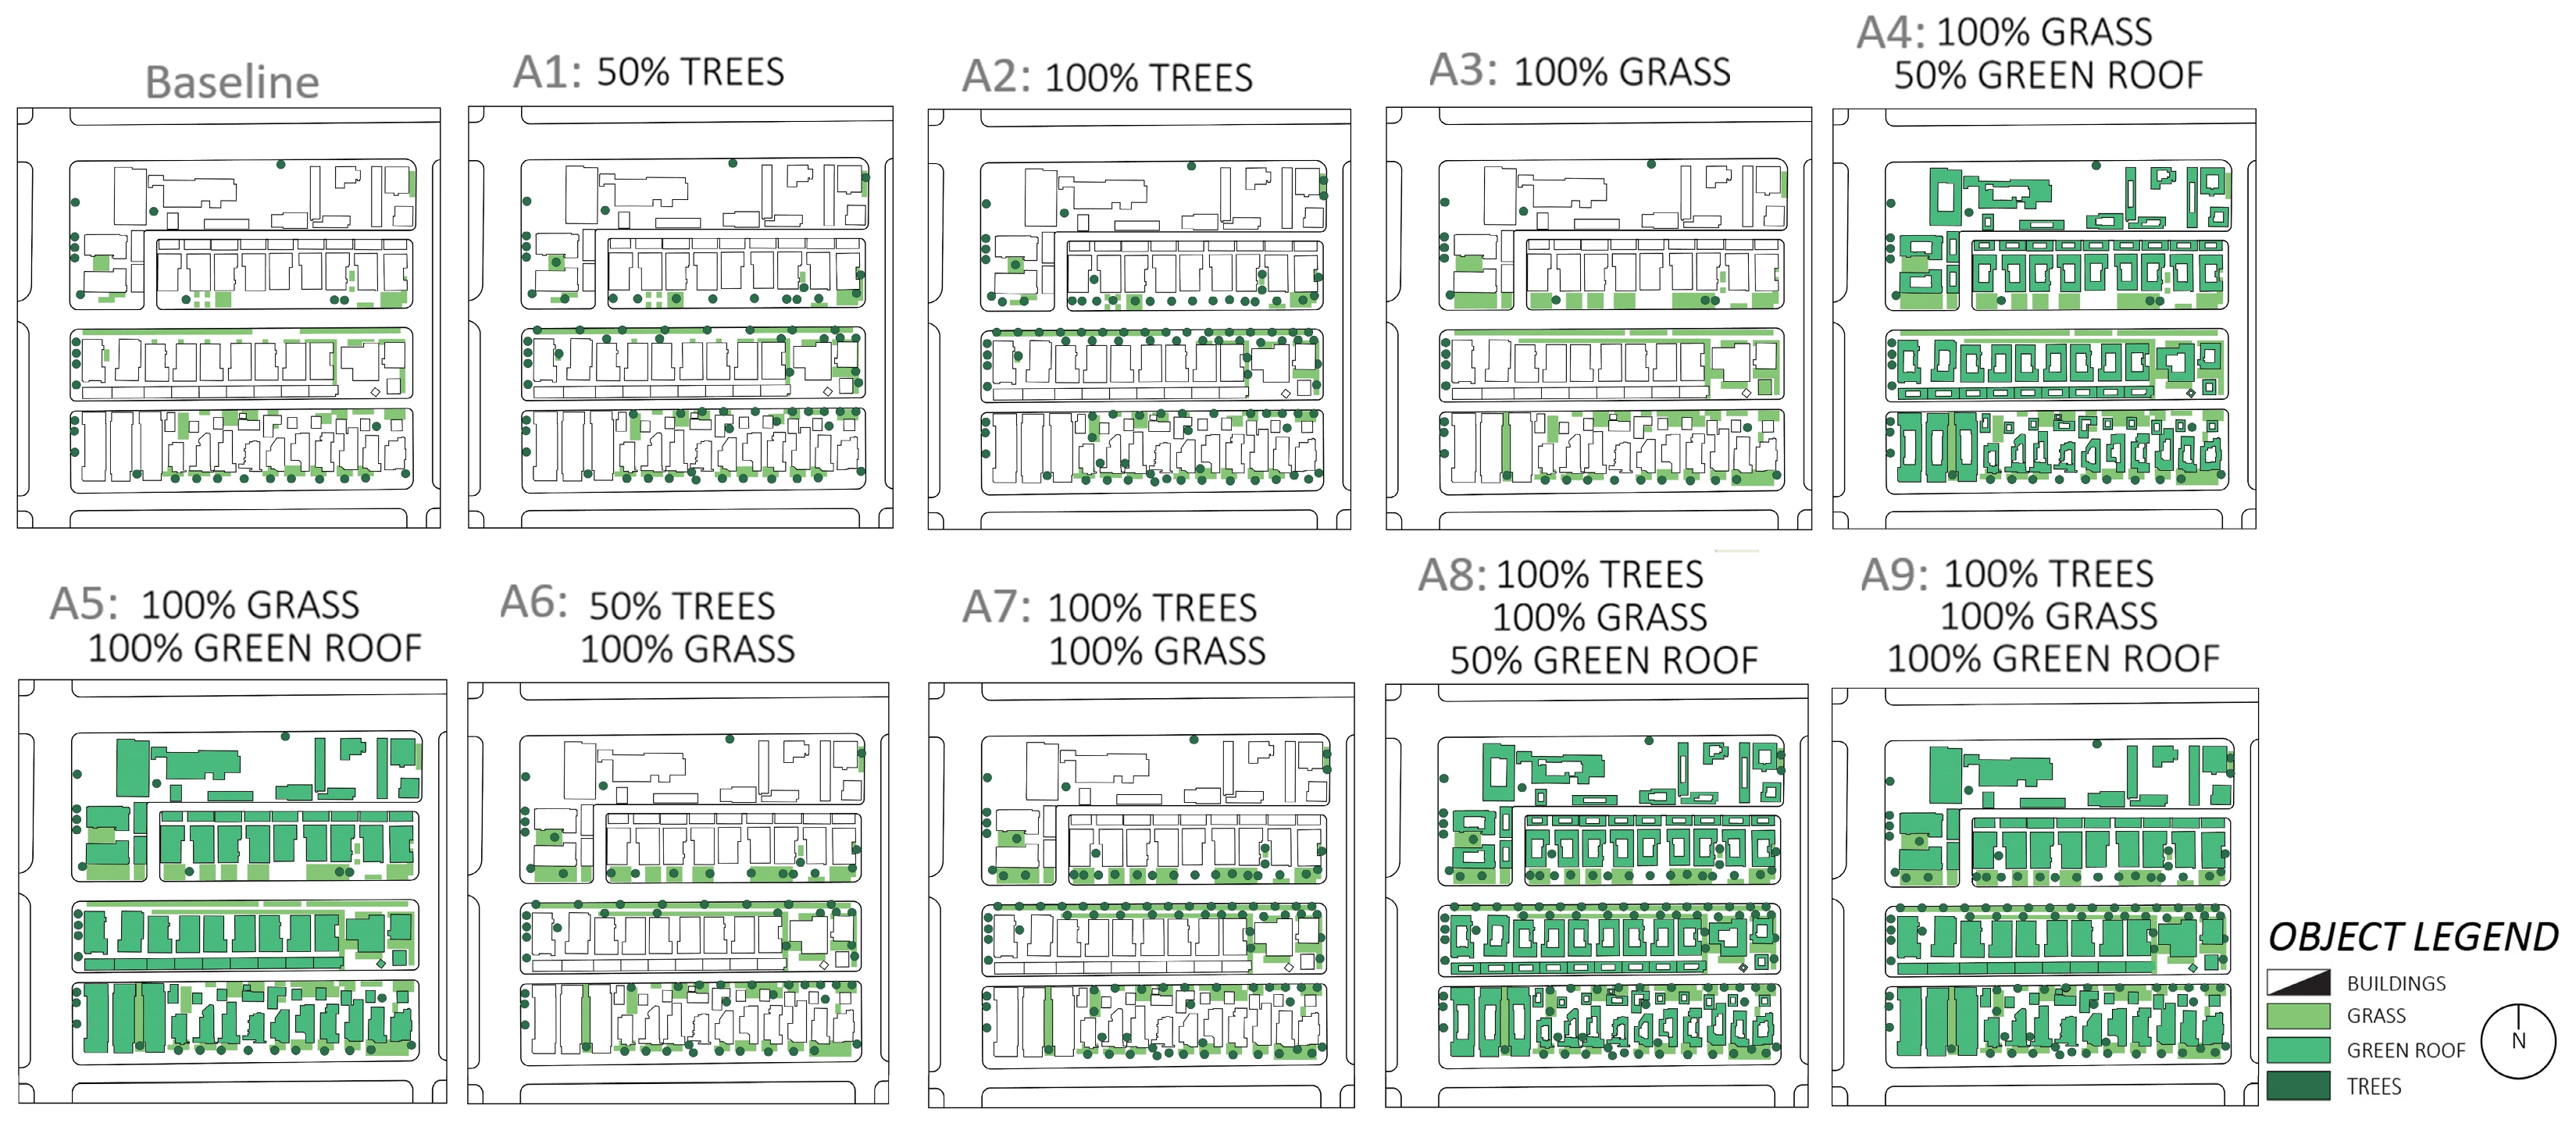
With the consideration of the integration of trees, grass, and green roofs within the plannable urban areas, the first segment of the study utilizes the Inglewood weather file in conjunction with nine distinct model configurations, each with varying levels of green surface and tree canopies combinations (
Figure 3). The second segment of the research uses the Phoenix weather file and employs an existing model as the baseline alongside a single modified model that incorporates maximum tree canopy, maximum grass coverage, and maximum green roof implementation.
The UTCI is calculated for both the baseline scenario and the scenarios with interventions. These models represent an array of urban design configurations, including differing levels of tree canopy, grass cover, and living roofs. Model A1 features a 50% tree canopy, while Model A2 pushes the boundaries with maximum tree canopy coverage. Models A3 and A4 introduce maximum grass coverage and a combination of maximum grass and a 50% living roof, respectively. As the options progress through the models, they become increasingly complex, culminating in Model A9, which incorporates maximum grass, maximum tree canopy, and maximum living roof coverage.
The simulation date and time (15 October, noon) were selected based on the Hawthorne TMYx (2007–2021) weather file, in which the dry bulb temperature profile indicates typical fall conditions and peak daytime heat. The simulation height was set at 1.5 m to represent the average human body level where thermal conditions are typically experienced. A comparative analysis was then conducted to assess the level of thermal stress mitigation achieved by the interventions. The results were evaluated and analyzed using data mining and visual representations to make comparisons.
3. Results
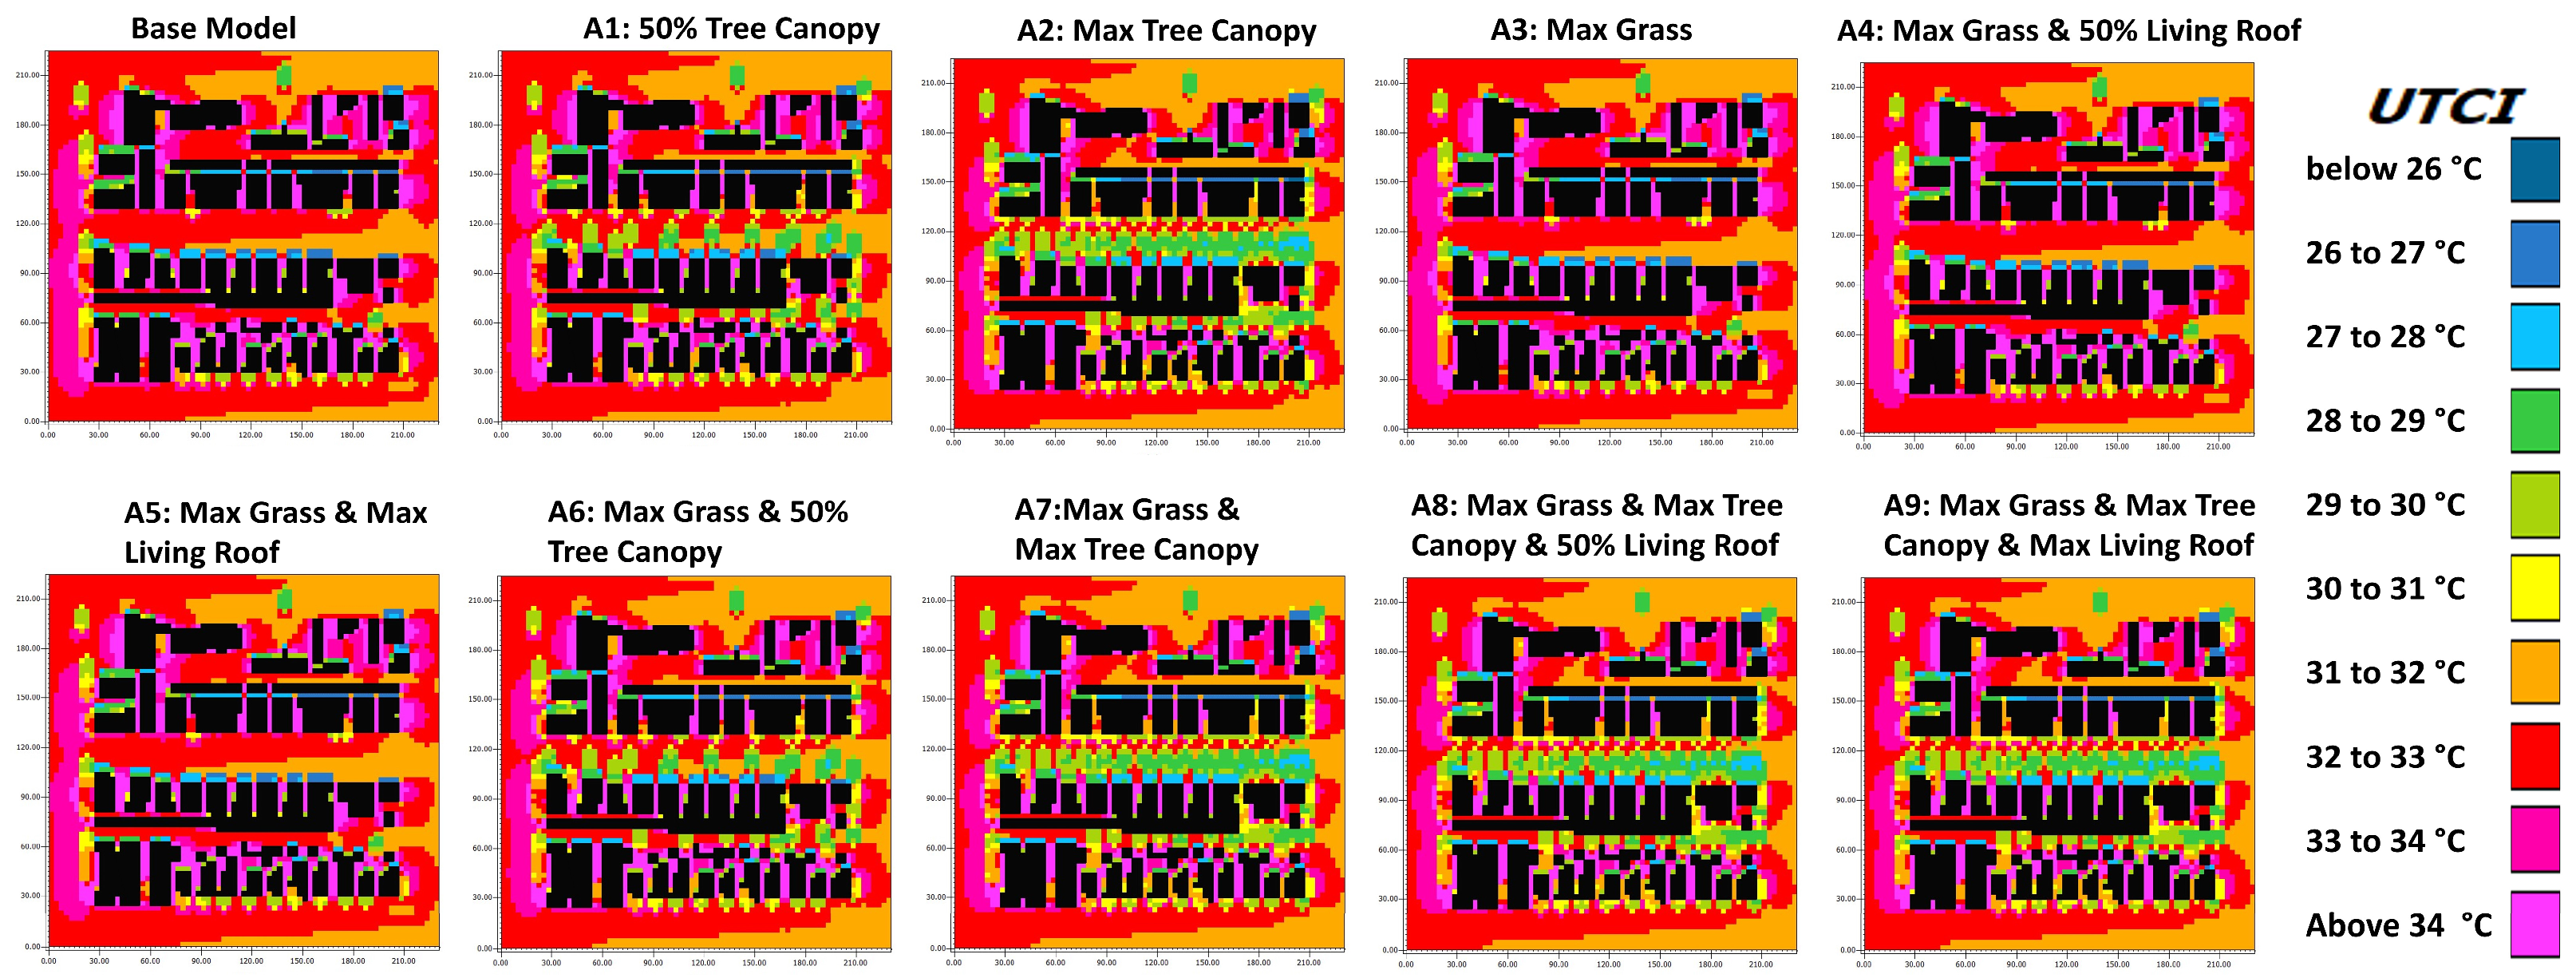
To assess the impact of implementing horizontal green surfaces and increasing tree canopy on outdoor thermal stress mitigation, UTCI is calculated for 10 different models, including the base model and nine new models with different combinations and levels of intervention of horizontal green surfaces and tree canopies. The calculated UTCI values enable the quantification of the percentage of strong heat stress, moderate heat stress, and no heat stress within the study area, comparing these percentages with those obtained from the base model. The results show the effectiveness of these interventions in reducing heat stress levels and improving thermal comfort in the study area (
Table 5 and
Figure 4).
The microclimate study of outdoor thermal comfort in Inglewood shows that the introduction of green infrastructure elements, such as tree canopies, grass coverage, and greened roofs, can have a substantial mitigating effect on heat stress in urban areas. Specifically, the adoption of a 50% tree canopy model (Model A1) and the maximum tree canopy model (Model A2) show significant reductions in strong heat stress levels, achieving reductions of 10.68% and 18.48% when compared with the base model, respectively.
Moreover, the data illustrate the critical role of tree canopies in moderating urban heat. The significant decrease in strong heat stress in both Models A1 and A2 can be attributed to the combination of shading and evapotranspiration provided by the canopies. These effects reduce surface temperatures and provide cooling benefits throughout the day, particularly during peak heat hours.
Furthermore, the incorporation of green roofs in Models A4 and Model A5 exhibit promising reductions in strong heat stress of 1.02% and 1.32%, respectively. Although these reductions are modest compared with canopy interventions, the addition of green roofs shows their potential for contributing to the overall cooling effect, especially in areas with limited space for tree planting. When these greened roofs are combined with maximum grass coverage, the reduction is even more pronounced, with Model A8 and Model A9 showing reductions of 18.78% and 18.92%, respectively.
The combined interventions in Models A8 and A9 highlight the synergistic effect of multiple green infrastructure strategies. The additions of grass and green roofs to a dense canopy provide a layered cooling effect, which is likely due to a more extensive reduction in both surface and ambient temperatures.
It is worth noting that the slight negative values in the “None” heat stress category for Models A2, A7, A8, and A9 (−0.07% to −0.09%) suggest a minimal increase in areas with no heat stress. This could be due to the strong reduction in heat stress in certain parts of the site, which results in a more distinct separation between areas with moderate or strong stress. However, this shift is minimal and does not detract from the overall effectiveness of the interventions in reducing thermal stress across the study area.
The results also indicate that these green infrastructure interventions have the potential to significantly reduce moderate heat stress, with reductions mirroring those observed for strong heat stress. This is particularly evident in Models A2 and A9, in which the maximum tree canopy combined with grass and green roofs achieve substantial reductions. These results suggest that, while green roofs and horizontal surfaces contribute to the mitigation of moderate heat stress, their effectiveness is greatly amplified when used in conjunction with substantial canopies coverage.
The analysis further supports the prioritization of tree canopies in urban heat mitigation strategies, particularly in urban environments like Inglewood, where space constraints may limit the extent of other green infrastructure interventions. Maximizing canopy coverage should be the primary focus, with grass and green roofs serving as complementary strategies that enhance the overall cooling effect.
In the context of the microclimate study on outdoor thermal comfort in Phoenix, the introduction of horizontal green surfaces and an increase in canopies, as demonstrated by Model B1 (Maximum Grass, Maximum Tree Canopy, and Maximum Green Roof Model), demonstrates that the horizontal greened surfaces and an increase in tree canopy, as exemplified by Model B1, can mitigate outdoor thermal stress, particularly in the category of Very Strong Heat Stress (
Table 6 and
Figure 5).
This intervention results in a measurable reduction in UTCI across the study area, underscoring the potential of green infrastructure strategies to enhance thermal comfort for individuals exposed to high heat stress conditions. However, it is important to recognize that the intervention offers limited relief in areas already experiencing Extreme and Strong Heat Stress. In these categories, the changes are modest, with a slight increase in the percentage of Extreme Heat Stress (from 4.24% to 6.08%) and a small reduction in Very Strong Heat Stress (from 95.76% to 93.9%). The unexpected rise in extreme heat stress may be attributed to localized microclimate dynamics or the diminished cooling efficiency of vegetation under severe heat conditions. Likewise, a minimal shift in the proportion of strong heat stress (from 0% to 0.02%) is observed, likely reflecting local surface effects rather than a broad trend. Nevertheless, these slight variations do not detract from the overall mitigation achieved.
When considering the study area as a whole, the integration of horizontal green surfaces and expanded tree canopy coverage demonstrated a clear positive impact. This is reflected in the slight decrease in average UTCI, from 42.936 °C in the base model to 42.896 °C in Model B1. Although this change appears marginal, it reinforces the effectiveness of green infrastructure in improving outdoor thermal conditions, particularly in areas classified under Very Strong Heat Stress. While the intervention alone may not be sufficient to fully alleviate extreme heat stress, the broader reduction in thermal stress highlights its value as a core strategy. These findings emphasize the importance of adopting a layered approach—combining green infrastructure with complementary measures such as artificial shading and enhanced irrigation—to more effectively address the challenges posed by extreme urban heat.
The slight increase in the percentage of Extreme Heat Stress observed in Model B1 can be attributed to a combination of factors. First, localized hotspots may have persisted or even intensified due to complex microclimate interactions, such as heat storage in impervious surfaces or limited ventilation in specific urban pockets. Second, the performance of vegetation under desert climate conditions may decline during extreme heat events, as plants experience reduced transpiration efficiency, thereby diminishing their cooling capacity. Third, the inherent limitations of the simulation models, including the assumptions regarding vegetation health, soil moisture, and irrigation levels, may not fully capture the stressed physiological responses of plants during peak heat periods. Together, these factors could explain the minor but notable increase in extreme heat stress despite the overall benefits achieved through green infrastructure interventions.
4. Discussion
The microclimate study shows the potential of integrating horizontal green surfaces and increasing tree canopy coverage to mitigate outdoor thermal stress. Across various models, maximizing a combination of different green infrastructure elements significantly reduces both strong and moderate heat stress levels.
In Inglewood, the most effective single strategy is tree canopy; the model with maximum canopy achieves an 18.48% reduction. Combining maximum grass and maximum living roof surfaces leads to increased reductions of 18.92%. The potential of these interventions is also evident in the reduction in moderate heat stress. Similarly, the microclimate study in Phoenix demonstrates that the combination of maximum grass, canopies, and green roof mitigates Very Strong Heat Stress, showing its potential for enhancing outdoor thermal comfort.
However, it is important to note the relatively small reduction in UTCI in Phoenix as compared with Inglewood, particularly in Extreme Heat Stress zones. This discrepancy can be attributed to altered transpiration patterns of vegetation during extreme heat, as highlighted in recent studies. In desert-like climates such as Phoenix, trees and vegetation may experience reduced transpiration efficiency during heatwaves, limiting their abilities to cool the surrounding air. Research shows that many trees exhibit a “negative response pattern” during heat extremes, where their transpiration and cooling efficiency are significantly lower than in moderate climates [
22,
23]. This physiological stress leads to a smaller reduction in UTCI despite the increased green infrastructure.
Gao and Santamouris [
24] stated that the cooling benefits of tree planting may be significantly reduced during extreme heat conditions, with previous models overestimating peak-hour cooling efficiency by up to 60%. This finding further supports the need to refine green infrastructure strategies to account for reduced transpiration efficiency during heatwaves. The results suggest that while tree canopy and green surfaces are effective in mitigating moderate heat stress, additional strategies, such as artificial shading or increased irrigation, may be required to combat extreme heat stress in regions like Phoenix.
The findings show the substantial impact of green infrastructure strategies, including tree canopy, grass, and green roofs, in reducing urban heat stress. Among the strategies tested, increasing canopy coverage proved to be the most effective, particularly in reducing strong and moderate heat stress levels. This can be attributed to the capacity of tree canopies to provide shade and enhance evapotranspiration, which directly lowers the surface and ambient air temperatures. In comparison, horizontal green surfaces, such as grass and green roofs, while beneficial, showed a more limited effect, particularly in conditions of extreme heat. These results suggest that prioritizing canopy expansion in outdoor thermal mitigation strategies offers greater benefits, with horizontal green surfaces serving as a supplementary measure where applicable.
5. Conclusions
This study demonstrates that green infrastructure interventions—especially increasing tree canopy—can significantly reduce urban heat stress and improve outdoor thermal comfort. In Inglewood, combining maximum canopy with horizontal green surfaces resulted in up to an 18.92% reduction in strong heat stress, highlighting the value of layered green strategies.
In Phoenix, despite the hyper-arid conditions, the integration of grass, green roofs, and canopies showed measurable mitigation of Very Strong Heat Stress. However, the limited reduction in the average UTCI and minimal improvement in Extreme Heat Stress zones underline the need to adapt strategies for desert climates. Vegetation under heatwaves may experience physiological stress, reducing its transpiration efficiency and cooling potential. These results suggest that while green infrastructure remains essential, it may need to be supported by artificial shading and advanced irrigation systems in extreme climates.
Future research should address the limitations of single-day simulations by incorporating seasonal variability and further investigate plant species performance under high-heat conditions. Additionally, cost-benefit analyses can guide the integration of natural and technological solutions, supporting the design of resilient, sustainable, and thermally comfortable urban environments.


