Article

Identification of Spatial Influencing Factors and Enhancement Strategies for Cultural Tourism Experience in Huizhou Historic Districts

School of Architecture and Urban Planning, Anhui Jianzhu University, Hefei 230601, China
*
Author to whom correspondence should be addressed.
Buildings 2025, 15(9), 1568; https://doi.org/10.3390/buildings15091568
Submission received: 10 April 2025 / Revised: 28 April 2025 / Accepted: 5 May 2025 / Published: 6 May 2025

Abstract

Historical blocks are a vital component of urban cultural heritage, serving as a link for regional cultural inheritance and a carrier for showcasing urban charm. Enhancing the quality of cultural tourism experiences in these areas can activate the endogenous momentum of cultural tourism industries and foster a virtuous cycle of cultural heritage conservation and utilization. Currently, research on the relationship between historical block spaces and cultural tourism experiences remains deep, and related theoretical gaps also constrain sustainable revitalization practices. Therefore, in this study, 20 representative historic districts with distinct regional cultural characteristics and well-developed cultural tourism in the Huizhou area were selected as research objects. By integrating multi-source data such as geographic information and Dianping reviews and applying the Partial Least Squares Regression (PLSR) statistical method, this study measures the correlation between the spatial morphology of Huizhou historic districts and cultural tourism experience indicators, identifying spatial influencing factors affecting cultural tourism experiences. The results show a significant correlation between the spatial form characteristics of historic districts and the quality of tourists’ cultural tourism experiences. Specifically, the regression coefficients of architectural space, transportation space, landscape space, and facility space in relation to the quality of cultural tourism experiences are significant at the p < 0.01 level. This paper innovatively conducts research from the perspective of urban design, employing a combined quantitative and qualitative analytical approach. The study fills existing gaps in quantitative analysis and empirical research on the spatial forms of historic districts and cultural tourism experiences and breaks through the limitations of qualitative research on traditional cultural tourism. It provides practical references for the organic protection of historical district buildings in the context of sustainable urban renewal.

1. Introduction

Culture, as the soul of a nation, embodies the unique historical memory and regional characteristics of a city. With the acceleration of globalization, the protection of cultural heritage and the integration of culture and tourism have become crucial for sustainable urban development [1,2]. Since the 18th National Congress of the Communist Party of China proposed the strategic objective of building a strong socialist culture, the core role of culture in China’s economic and social development has become increasingly prominent. As one of the three major regional cultures in China, Huizhou culture encompasses art, literature, and philosophy, continuously injecting vitality into urban development. The historic districts of Huizhou, serving as important spatial carriers for the inheritance of Huizhou culture, are characterized by unique architectural styles, rich historical relics, and profound cultural heritage [3], making them significant objects for research on the integrated development of culture and tourism [4]. However, with the advancement of urbanization, historic districts face multiple challenges, including the deterioration of the physical environment, the loss of cultural value, and the conflict between preservation and development [5,6]. Striking a balance between preservation and utilization has thus become an urgent issue that needs to be addressed.
The concept of protecting historic districts dates back to the 1933 Athens Charter, which advocated for the appropriate preservation of buildings and areas of historical value [7]. To maintain urban diversity and vitality, it is essential to preserve historic districts with varied functions and appropriate scales [8,9]. In the 1970s, Italy pioneered the concept of “overall protection”, emphasizing the need to preserve not only historical buildings but also the associated lifestyles and cultural traditions [10]. In China, the protection of historic districts has gradually gained attention since the 1980s. In recent years, research has primarily focused on three aspects: the spatial form of historic districts, tourism development, and cultural tourism experiences.
Since 2000, scholars from home and abroad have conducted in-depth research on the spatial form of historic districts. Currently, three key dimensions have been established in the literature, and within each dimension, there are significant theoretical dialogs and differences in viewpoints. In the field of spatial vitality research, although scholars generally agree that the interaction between the physical environment and social activities is the foundation of vitality, there are methodological divergences in identifying dominant factors: Quantitative research led by Zhang Fang [11] emphasizes the objective identification of vitality-influencing factors through multi-source data modeling, while Yu Bing [12] starts from the mediating role of the spatial carrier and constructs a quantitative measurement framework for assessing the vitality of historical street blocks. Research on spatial relations exhibits methodological disparities in technical approaches. Wen Liang [13] employed spatial syntax to reveal the implicit constraints of the block’s topological structure on functional organization, while Zhou Xuewen [14] emphasized the explicit coordination between historical relics and environmental elements using coupling theory. Wen Liang and Zhou Xuewen expanded the theoretical paradigm of spatial relations from the dimensions of connectivity and adaptability, respectively. At the level of spatial types, the landscape classification system established by Zhao Yang [10] based on visual features and the historical district landscape space planning by Zhu Xiaoyang [15] from the perspective of local attachment complement each other in the objective form and subjective perception. Although these studies have deepened our understanding of the spatial form’s value, current research mostly focuses primarily on analyzing the form itself, failing to establish a direct link between the spatial form of historic districts and cultural tourism experiences, and lacking further quantitative research. This theoretical gap is what precisely hinders the sustainable revitalization practice of historic districts.
From the perspective of tourism development in historic districts, many cities actively promote tourism and organize diverse cultural activities to revitalize these areas, thereby enhancing urban cultural ambiance and economic vitality [16]. Paul M. Fotsch highlighted that global competition in tourism development would significantly impact historic districts [17], laying the groundwork for subsequent research on the tourism development of such districts. Nicholas Falk argued that tourism development could diversify the functions of districts [18], while Philip Kotler, from the perspective of global tourism research, conducted an in-depth study of tourism marketing theory and applied it to the development of historic districts, offering insights into tourism development from a marketing perspective [19] and enriching the research dimensions of district tourism development. Isabelle Frochot explored the enhancement of tourism service management quality [20], and Xu Yabing proposed a heritage tourism development model for historic districts, using Wuzhen in Zhejiang Province as a case study [21], providing theoretical support for the sustainable development of these districts. Although these studies adopt different perspectives, they share a common focus on the goal of sustainable tourism development. Additionally, Feng Liang emphasized the importance of cultural and tourism cooperation, as well as various elements (culture, land, capital, and labor), for the sustainable development of historic districts [22], contributing to the research on tourism development of historic districts from multiple angles, alongside previous scholars. However, most existing studies focus on case analyses of individual historic districts from a tourism perspective, lacking an in-depth exploration of the commonalities and differences among different historic districts.
As the contribution of tourism to urban development continues to grow [23], scholars have increasingly recognized the value of historic districts in tourism development, subsequently extending their focus to the exploration of cultural tourism experiences. In practical applications, to enhance the attractiveness and competitiveness of historic districts, regions both domestically and internationally have begun to pursue innovative development from the perspective of cultural tourism experiences, thereby promoting continuous and in-depth research in this field. Regarding the evaluation system for cultural tourism experiences, Gu Siming used the ancient city of Nantou in Shenzhen as a case study [24], while Apostolos Skotis examined three historic districts in Europe [25] to assess tourist satisfaction in historic districts. Siamak Seyfi identified six key factors influencing cultural tourism experiences at destinations (previously perceived meaning, authenticity, participation, cultural exchange, food appeal, and service quality) [26], and Zatori demonstrated that cultural tourism experiences encompass four dimensions (emotional, psychological, flow, and social experience participation) [27]. These studies have laid the foundation for subsequent research on cultural tourism experience indicators in historic districts. In terms of the relationship between cultural tourism experiences and commercialization, Zhang Tonghao employed Partial Least Squares Structural Equation Modeling to study the commercial operation of cultural heritage from the perspective of tourism experiences [28]. Tang Chengcai focused on the coordinated development of tourism experiences and commercialization in historic districts, aiming to explore their sustainable development [29]. Overall, previous studies on cultural tourism experiences in historic districts have primarily focused on evaluation systems [30,31] and commercialization [32]. However, research on the relationship between the spatial characteristics of historic districts and cultural tourism experiences remains insufficiently explored, lacking quantitative analysis and empirical studies.
Although previous studies have separately explored the spatial form and cultural tourism, there is still a lack of direct and in-depth analysis of the correlation between the spatial form and cultural tourism experience. Additionally, these studies have obvious limitations: (1) most studies start from the perspectives of historical preservation, tourism management or single spatial analysis, lacking research that combines multiple spatial forms to explore the improvement of cultural tourism experience from the perspectives of urban renewal and urban design; (2) most studies adopt qualitative analysis, lacking systematic quantitative research that integrates multiple disciplines; (3) most studies focus on a single case, lacking research that conducts classified comparisons of multiple cases to draw universal conclusions.
This study innovatively adopts an approach from the urban design perspective, employs a mixed-methods analysis integrating quantitative and qualitative approaches, conducts a systematic investigation of multiple typical cases, fills the gap in quantitative analysis and empirical research on the relationship between historical block spaces and cultural tourism experiences, and breaks through the limitations of qualitative research in traditional cultural tourism studies. This is of importance because historic districts face numerous challenges in protection and tourism development amid rapid urbanization. This study not only provides innovative solutions to this complex issue but also addresses the practical needs of historical district conservation and utilization. Moreover, it offers theoretical support for national strategies of building a cultural powerhouse and integrating culture with tourism, providing references for the protective revitalization and sustainable development of historic districts in the future.

2. Study Objects, Data, and Methods

2.1. Study Objects

Twenty representative historic districts with distinctive Huizhou regional cultural characteristics, located within the Huizhou region and under the influence of Huizhou culture in Anhui Province, were selected for this study (Figure 1 and Table 1). These districts are primarily situated in 12 cities, including Hefei, Wuhu, and Huangshan, and are characterized by their unique commercial, leisure, or cultural functions. The scale of these districts ranges from 2.15 hectares to 34.87 hectares. These historic districts have played a significant role in showcasing and preserving rich historical culture. They retain numerous ancient buildings and valuable cultural heritage, providing tourists with a platform to gain an in-depth understanding of local history and culture, as well as diverse cultural experiences. Through continuous innovation and development, these districts not only incorporate modern commercial elements but also highlight the profound connotations of Huizhou culture, serving as an important model for the integration of urban renewal and cultural tourism development.

2.2. Data Source

2.2.1. Historic District Geographic Spatial Information Data

The geospatial information data used in this study primarily refer to various types of geographic information related to the physical spatial form of Huizhou historic districts, including building outlines, traffic networks, land use, and facility distribution. On the one hand, the data were sourced from vector CAD planning drawings and graphic images made publicly available by local planning departments and the internet. On the other hand, they were supplemented by technical methods such as 3D laser scanning, street photography, and drone aerial photography, with first-hand data and information obtained through field research and objective observation of the physical spaces of Huizhou historic districts. After data collection, a total of 20 representative geospatial datasets for Huizhou historic districts were obtained. These datasets support the analysis of 11 indicators across four dimensions—architectural space, traffic space, landscape space, and facility space—which are closely related to the spatial form. Based on these indicators, a spatial form index system for Huizhou historic districts was constructed (Table 2).
This study builds upon previous research and incorporates the exploration of cultural attributes across each dimension. The study selects 11 indicators, including building density [33], functional mix degree [34], facade material category [35], transportation accessibility [12], road network density [36], natural landscapes [15], public services and infrastructure [37], types of cultural elements, number of cultural scenic spots, and quantity of cultural facilities. These indicators can be used to analyze the spatial morphological characteristics of historic districts influenced by Huizhou culture and serve as independent variables for correlation analysis.

2.2.2. Historic District Cultural Tourism Experience Evaluation Data

The evaluation data of cultural tourism experience used in this study mainly refer to tourists’ online comments and personal travel notes on their visit experience of the Huizhou historical block. Considering the quality and quantity of online texts, this paper intercepts the online reviews and travelog data published from Dianping App between 1 January 2023 and 30 November 2024. During the data processing, the following steps were taken. First, the Pandas library in Python (v.3.11) was used to filter out duplicate or similar comments based on user IDs, comment times, and text similarity. Second, keyword and semantic analysis were employed to eliminate advertisements, spam, and irrelevant content. Finally, manual verification was carried out to exclude machine-generated fake comments, ensuring that the data reflected real user feedback. In the end, 7512 pieces of valid text data were obtained. All the data were categorized according to the six major tourism elements of eating, living, traveling, touring, shopping, and entertainment to support the analysis of 12 indicators in six aspects related to the cultural tourism experience—dining experience, lodging experience, transportation experience, sightseeing experience, shopping experience, and entertainment experience—and to construct the evaluation system of the cultural tourism experience in the Huizhou historic block (Table 3).
This study initially took full account of the specificities during the data collection period. Before 2023, due to the impact of the pandemic, tourism and public activities exhibited atypical characteristics. However, the data involved in this study for the most recent two years already cover a period when social activities gradually returned to normal. The research spans two complete natural years, including the four seasons of spring, summer, autumn, and winter, as well as important holidays such as the Spring Festival and National Day. This helps balance the potential impacts of single-season or short-term cultural events to a certain extent.

2.3. Study Methods

The spatial form of the historical blocks in Huizhou and its influence on the cultural tourism experience were analyzed by using the Partial Least Squares Regression (PLSR) method, whose flow chart is shown in Figure 2.
Partial Least Squares Regression (PLSR), proposed by S. Wold and C. Albano in 1983, is a multivariate linear regression analysis method used for modeling relationships between multiple dependent and independent variables [38]. PLSR addresses the issue of multicollinearity, simultaneously analyzes multiple dependent variables (Y), and is particularly suitable for small sample studies. Unlike traditional least squares regression, PLSR constructs models by synthesizing and selecting information, performing regression analysis after extracting components with high explanatory power. In principle, PLSR combines principal component analysis, canonical correlation analysis, and multiple linear regression analysis. By analyzing the relationship of principal components, it investigates the connection between X and Y [39,40].
In this study, Partial Least Squares Regression, a multivariate statistical method, was selected due to its suitability for regression modeling involving multiple dependent and independent variables, addressing multicollinearity, and accommodating small sample sizes.
Based on the standardized program of SPSS software (v.26), the specific analysis steps are as follows:
Assume that p-dependent variables Y, …, YP and m-independent variables X, …, Xm are standardized variables. The n-standardized observation data matrices of the dependent variable group and the independent variable group are expressed as Formula (1):
Y 0 n × p =   y 11 y 1 p   y 21 y 2 p             y n 1 y np , X 0 n × p =   x 11 x 1 m   x 21 x 2 m             x n 1 x nm
Firstly: The number of principal components can be determined via cross–validity analysis and an examination of the VIP (Variable Importance in the Projection) value for projected importance. For the cross-validity analysis, the results of the analysis can be reflected by the value of Qh2 as follows:
Qh2 = 1 − PRESSh/SS(h−1)
In Equation (2), h denotes the number of principal components; SS denotes the sum of squares of errors; and PRESS denotes the sum of squares of prediction errors, where SS and PRESS are the intermediate process values for the cross-validity analysis. If Qh2 is less than 0.0975, this implies that augmenting the number of principal components further is ineffective. Consequently, the number of principal components associated with this location (or the previous one) is deemed the optimal number. For projected importance analysis (VIP value), if the increase in principal components is not significant for the change in VIP value, then the number of such principal components is the optimal number.
Secondly: Extract principal components and carry out precision assessment. Principal component U1 is obtained from independent variable X, and principal component V1 is sourced from dependent variable Y. To enhance the correlation between U1 and V1 to the greatest extent, U1 and V1 need to extract the maximum amount of information from their respective variable groups. The model’s performance can be analyzed through accuracy analysis, which focuses on the information extraction rate (variance interpretation rate) of the principal components for X or Y.
Thirdly: PLSR analysis. The regression analysis obtains the correlation between X and Y, including the regression influence relationship analysis between X and Y, the influence direction and significance, the R square value of the model, and the explanatory power of X to Y.
In the research on the correlation between the spatial form of historic districts and cultural tourism experiences, 11 spatial form indicators of historic districts, calculated based on multi-source data, were used as independent variables, while 12 cultural tourism experience indicators, derived from tourists’ online reviews and travelogs, were used as dependent variables. Partial Least Squares Regression analysis was employed to explore the influence of the spatial form of historic districts on cultural tourism experiences.

3. Results

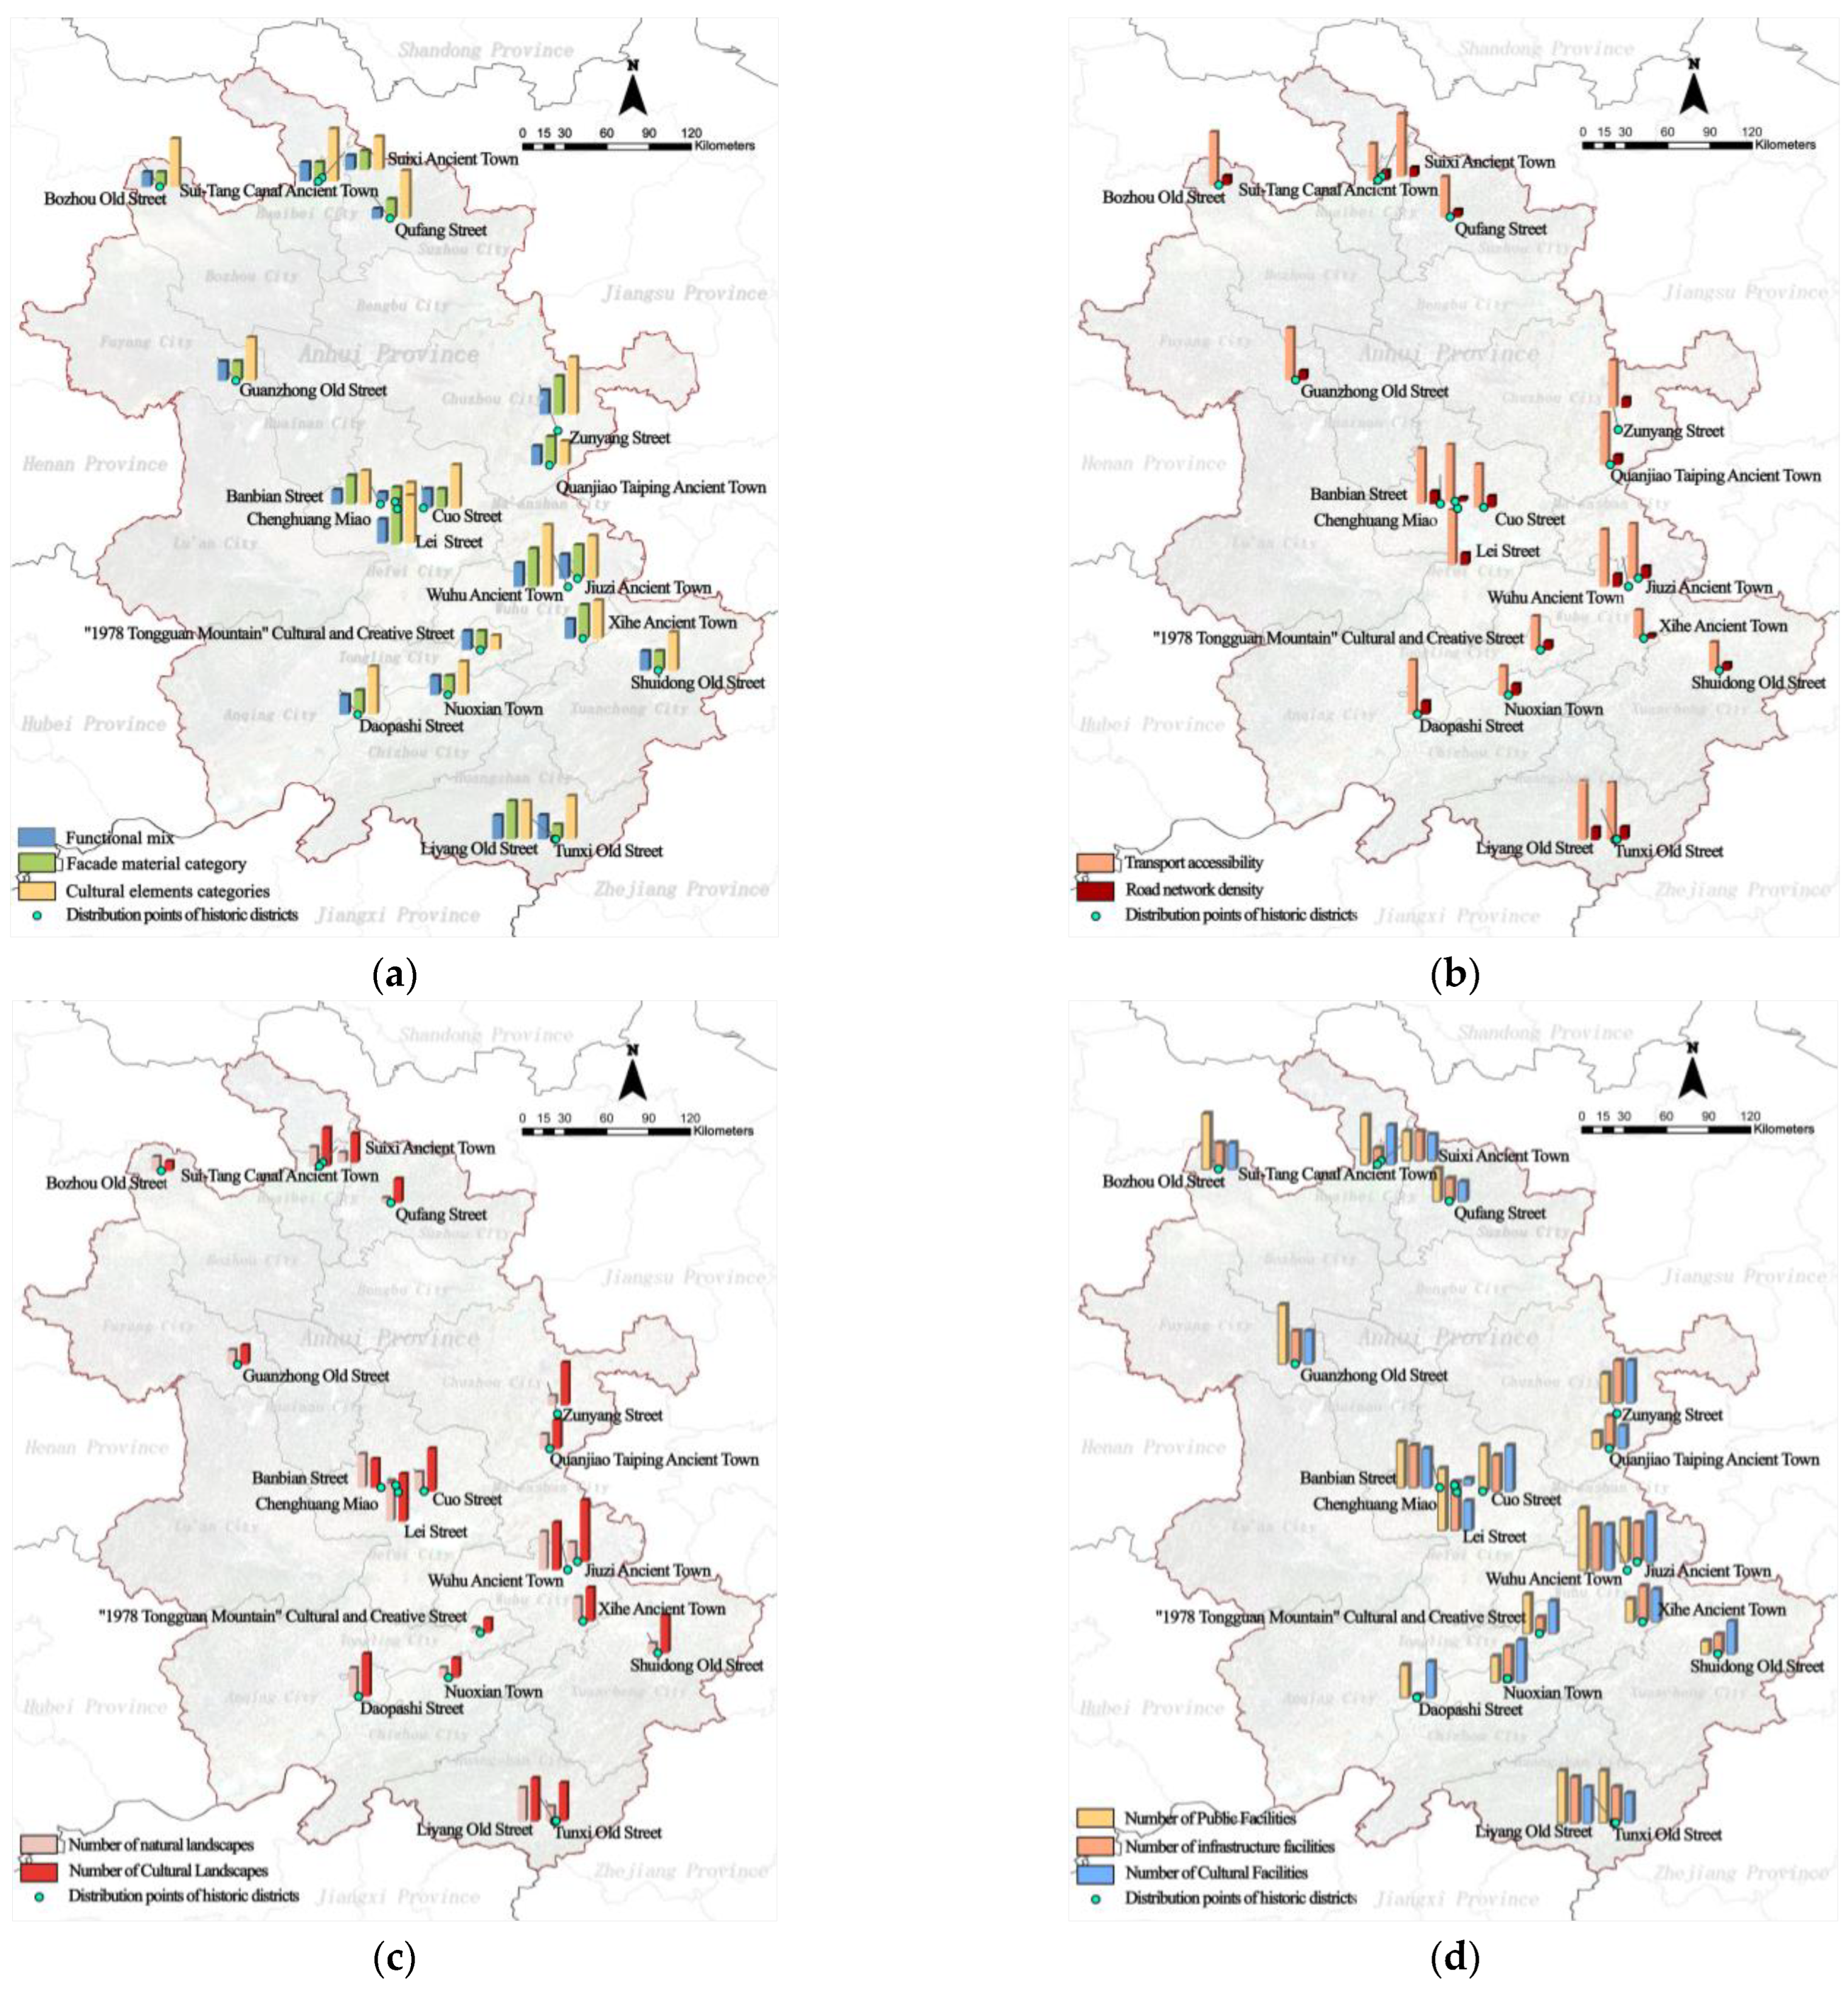
3.1. Historic District Spatial Form Indicator Analysis

This study uses ArcGIS tools to systematically organize and visually analyze the data obtained from field research, comparing the significant differences in the spatial form of different historic districts, specifically analyzing from four dimensions: architectural space, traffic space, landscape space, and facilities space (Figure 3).
In terms of architectural space, districts with a higher degree of functional mix have demonstrated a greater diversity of facade materials and cultural elements. Wuhu Ancient Town, Lei Street, and Zunyang Street are typical representatives. Their building facades not only adopt a variety of materials but also incorporate rich cultural elements. Compared with other districts, these features are particularly prominent, highlighting their unique architectural style and cultural heritage.
In terms of traffic space, although most districts show similarity in road network density, there are significant differences in accessibility of districts. The “1978 Tongguan Mountain” Cultural and Creative Park, Xihe Ancient Town, Nuoxian Town, and Shuidong Old Street may be affected by poor geographical location (being far from the city center, employment-intensive areas, and areas with high-quality public service facilities) as well as inconvenient public transportation (insufficient coverage of transportation facilities or unsmooth traffic connections) and limited options for self-driving routes, resulting in relatively low accessibility.
In terms of landscape space, the districts with a long history, such as Chenghuang Miao and Bozhou Old Street, tend to have more serious deficiencies in landscape elements than newer areas. In contrast, in Wuhu Ancient Town, Tunxi Old Street, Lei Street, and other districts, due to the high functional mix and the development path of both protection and redevelopment, their landscape space has been effectively preserved and improved, showing significant landscape advantages.
In terms of facility space, the gap between the districts is particularly obvious. Wuhu Ancient Town performs well in facility space by virtue of its large block space and reasonable facility layout. The Chenghuang Miao has limited block space, making it difficult to accommodate more facilities, resulting in a relative lack of facility space. This phenomenon also exists in the Daopashi district, whose narrow main street space limits the addition of facilities, and too many facilities may cause traffic congestion problems.

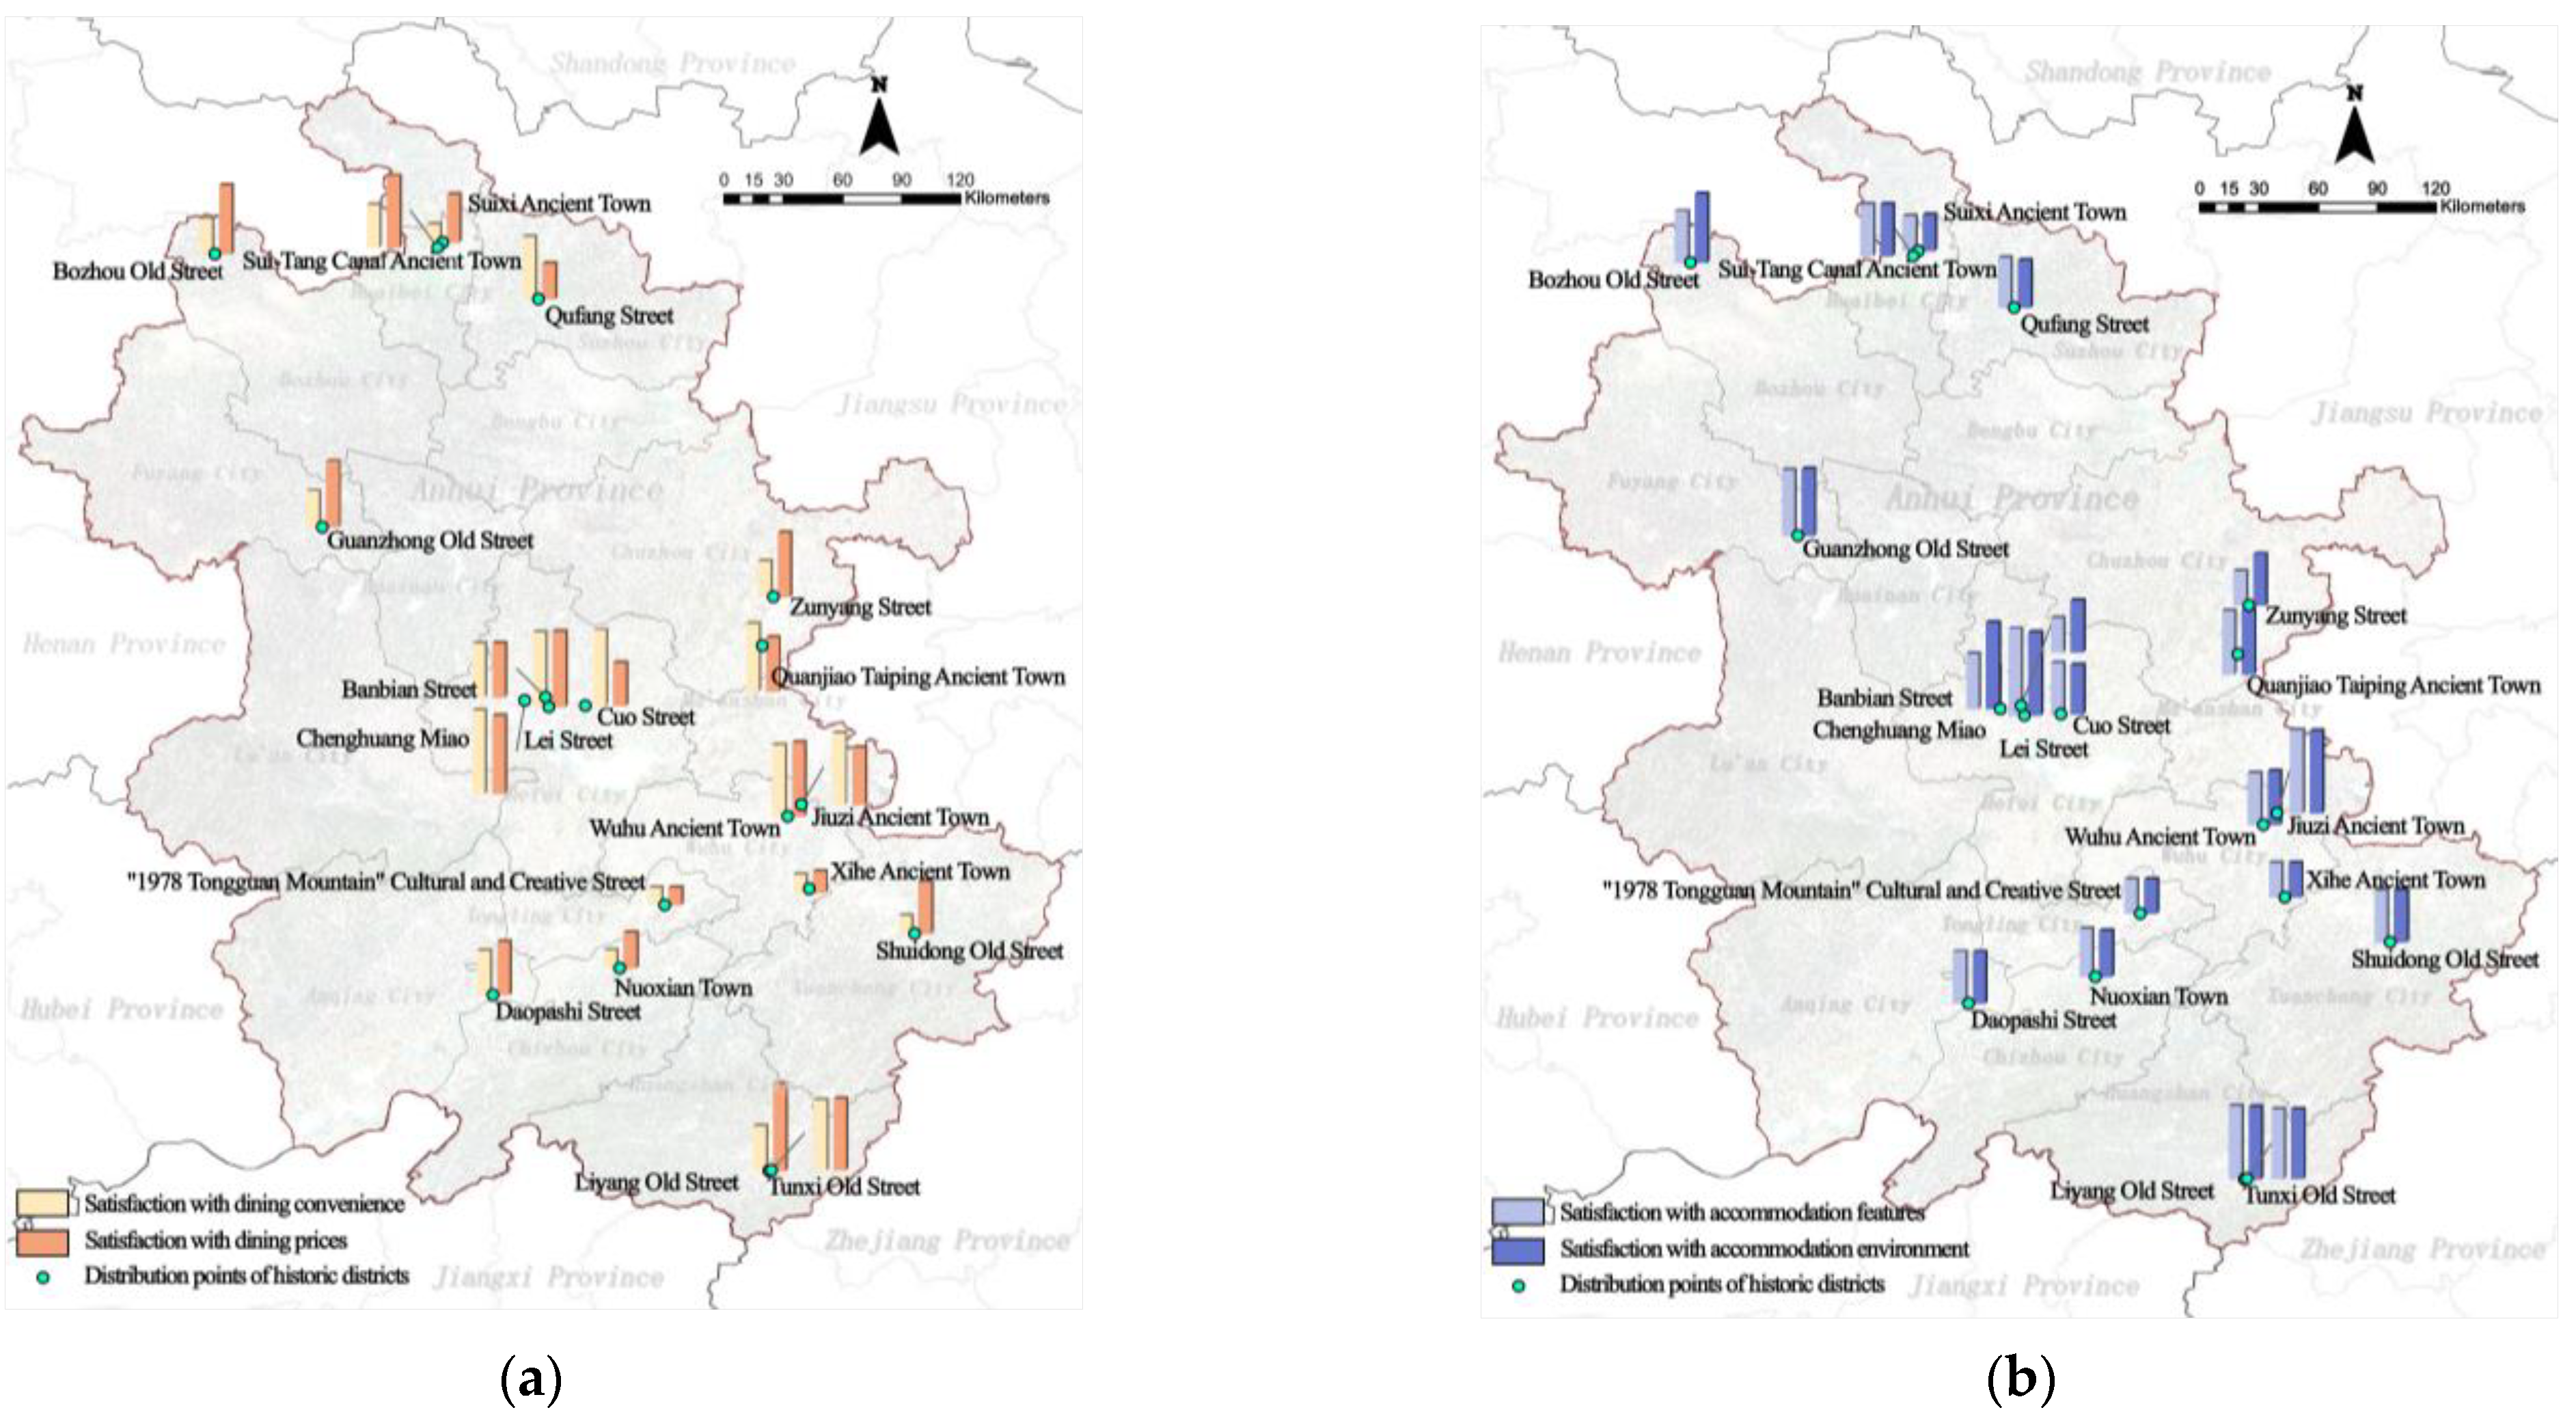
3.2. Analysis of Cultural Tourism Experience Indicators in Historic Districts

In this study, the 7512 collected data samples were categorized based on six dimensions of the cultural and tourism experience. These data were then rated using a five-point scale: dissatisfied (1 point), somewhat dissatisfied (2 points), neutral (3 points), somewhat satisfied (4 points), and satisfied (5 points). The resulting scores were used to generate the visualization data of different districts. Compare the differences in cultural travel experience in different historic districts (Figure 4).
Generally speaking, historic districts located in economically developed cities have good performance in terms of dining, lodging, and shopping experience, but the transportation experience, sightseeing experience, and entertainment experience may depend on the spatial and environmental characteristics of the districts themselves.
In terms of dining experience, Nuoxian Town, “Tongguanshan 1978” Cultural and Creative Park, and Xihe Ancient Town performed relatively poorly, with both key indicators failing to reach the average level. This might be due to the lack of adequate dining facilities in these areas or the unreasonable pricing, which led to low level of satisfaction among tourists. In contrast, Banbian Street received widespread praise from tourists, forming a sharp contrast with the other areas.
In terms of the accommodation experience, Lei Street and Jiuzi Ancient Town have shown obvious advantages. However, the accommodation experience in Qufang Street, Nuoxian Town, and Xihe Ancient Town needs to be improved. These areas may suffer from poor geographical locations and the development of homestays and hotels is still underdeveloped, which has caused difficulties for tourists in terms of accommodation.
In terms of transportation experience, Wuhu Ancient Town and Jiuzi Ancient Town have received high scores due to their vast areas and well-developed internal transportation. The performance of other districts is relatively similar, with no significant differences. This indicates that in terms of transportation convenience, most districts can meet the basic needs of tourists.
In terms of the visiting experience, Banbian Street, Lei Street, and Liyang Old Street have a considerable advantage and are all within the satisfactory range. These streets may offer rich visiting contents, good visiting environments, and convenient visiting facilities, thus winning high praise from tourists.
In terms of shopping experience, both Banbian Street and Lei Street scored above 4 points, performing well; however, the “Tongguanshan 1978” Cultural and Creative Park lags far behind. This might be attributed to the lack of a commercial atmosphere and a limited variety of products in “Tongguanshan 1978” Cultural and Creative Park, which results in a poor shopping experience for tourists.
In terms of entertainment experience, Banbian Street, Cuojie, Nuoxian Town, and Jiuzi Ancient Town have received more than 4 points of praise, and tourists have a better experience. These streets may offer a variety of entertainment projects, rich cultural activities, and comfortable entertainment environments, thus meeting the entertainment needs of tourists.

3.3. The Correlation Between the Spatial Form of Historic Districts and Cultural Tourism Experiences

In this study, the partial least squares method was used for multiple regression analysis. The 11 indicators reflecting the spatial form were used as independent variables, and the 12 indicators reflecting the cultural tourism experience were used as dependent variables to study the influence of the spatial form of historic districts on the cultural tourism experience.

3.3.1. Regression Analysis Steps

Step 1: The number of principal components was determined to be 1, based on cross-validity analysis (Qh2 value) and projected importance analysis (VIP value). When there is only 1 principal component, Qh2 = 1; when there are 2 principal components, Qh2 = −0.298, which is less than 0.0975 (Table 4). Moreover, for the projected importance analysis, the change of VIP value is not obvious when the principal component is 2 or more, compared with when the principal component is 1 (Table 5). From this, the optimal number of principal components can be determined as 1.
Step 2: Extract the principal components U1 and V1 and perform accuracy analysis.
Principal component U1 was retrieved from independent variable X, and principal component V1 was pulled out from independent variable Y. After that, an accuracy-related analysis was performed to measure the information extraction degree (variance interpretation rate) of the principal components of X and Y. The principal components U1 and V1 were expected to extract the maximum information content from their corresponding variable clusters. The comprehensive extraction rate of principal component U1 for the 11 independent variables was 0.466, meaning a variance interpretation rate of 46.6%, as presented in Table 6. And for the 12 dependent variables, principal component V1 had a comprehensive extraction rate of 0.535, indicating a variance interpretation rate of 53.5%, as shown in Table 7.
Step 3: Partial Least Squares Regression analysis
The relationship between X and Y, the direction and significance (p-value) of the effect, and the explanatory strength of different independent variables for the dependent variable were obtained by regression analysis.
This paper employs Partial Least Squares Regression (PLSR), a model that automatically calculates indicator weights through an algorithm, determining them based on the explanatory power of variables for the dependent variable (cultural tourism experience evaluation)—specifically via Variable Importance in the Projection (VIP) values. Additionally, a Pearson correlation coefficient analysis was conducted. The results show that no correlation coefficients with absolute values exceeding 0.8 exist in the indicator set (i.e., the collinearity issue is negligible) (Table 8). Therefore, it can be concluded that collinearity in the indicator set is insignificant, and the model estimation results are reliable.
This study further conducted perturbation tests with ±10% and ±20% variations on the independent variables to perform sensitivity analysis of input data changes, aiming to evaluate the stability of the correlation model between the spatial form characteristics of historic districts and cultural tourism experience evaluation. The analysis results show that even when the independent variables fluctuate within a large range, the coefficients of the correlation relationships in the model remain unchanged (Table 9). This result indicates that the correlation model can maintain consistent evaluation logic and quantitative relationships under different perturbation intensities, effectively excluding the interference of accidental fluctuations in independent variables on the model’s conclusions. This further demonstrates that the evaluation results of the correlation model between the spatial form characteristics of historic districts and cultural tourism experience evaluation possess high reliability.

3.3.2. Regression Analysis Results

In general, there is a correlation between the spatial form of Huizhou historic neighborhoods and the cultural tourism experience, but different indicators show different degrees of correlation. Among them, the road network density, the number of natural landscapes, and the number of public service facilities are the most significant indicators positively related to the cultural and tourism experience (Table 10).
For the four indicators of architectural space, including building density, functional mixing degree, façade material, and cultural elements, are positively correlated with the indicators of cultural tourism experience to different degrees, with the façade material having the strongest correlation with cultural tourism experience, and positively correlating with the five indicators reflecting the transportation experience, sightseeing experience, shopping experience, and entertainment experience. The category of cultural elements is positively correlated with the indicators of transportation experience, satisfaction with general atmosphere, and satisfaction with food and beverage prices. Functional mixing degree is only positively correlated with the indicators of transportation experience and satisfaction with lodging characteristics, and building density is significantly positively correlated with satisfaction with traditional street texture.
It can thus be inferred that the richness of architectural space exerts a remarkable positive influence on cultural and tourism experiences. Specifically, it encompasses the enhancement of accommodation experience, transportation experience, sightseeing experience, shopping experience, and entertainment experience. In particular, the more diverse and abundant the architectural space is, the more uniquely charming the layout of its internal street and alley texture tends to be.
For the two indicators reflecting transportation space, namely traffic accessibility and road network density, their correlations with cultural and tourism experience indicators vary. Road network density shows no correlation with the texture of traditional streets and alleys but is positively correlated with the other 11 indicators. Among them, it has a significant positive correlation with the satisfaction of dining convenience. In contrast, traffic accessibility is only positively correlated with four indicators reflecting dining and shopping experiences as well as the satisfaction with accommodation prices.
It can thus be inferred that the convenience of transportation space is conducive to enhancing tourists’ satisfaction with dining convenience, accommodation prices, and the characteristics of cultural and creative products. Specifically, an improvement in traffic accessibility can significantly increase tourists’ dining experience and satisfaction with the shopping environment. On the other hand, an increase in road network density has a positive impact on enhancing satisfaction with transportation information services, awareness of the cultural brand of the block, and the entertainment experience, providing tourists with a smoother and more enriching travel experience.
For the two indicators reflecting the landscape space, namely the quantity of natural landscapes and the quantity of cultural landscapes, the quantity of natural landscapes has a more significant correlation with cultural and tourism experiences. The quantity of natural landscapes is positively correlated with the other 12 indicators. The quantity of cultural landscapes is positively correlated with the satisfaction with the overall block atmosphere, the satisfaction with the characteristics of cultural and entertainment activities, and four indicators reflecting transportation and shopping experiences.
It can thus be inferred that the quantity of natural landscapes is crucial for enhancing tourists’ cultural and tourism experiences. The fact that natural landscapes and cultural landscapes have different impacts on cultural and tourism experiences indicates that when planning and enhancing cultural and tourism experiences, it is necessary to consider the coordination of different types of landscapes to meet the diverse needs of tourists.
For the three indicators reflecting the facility space, namely the quantity of public service facilities, the quantity of infrastructure, and the quantity of cultural facilities are all positively correlated with the satisfaction of convenient and fast transportation and the satisfaction of cultural and entertainment activities and show no correlation with the satisfaction of the shopping environment. The quantity of public service facilities has no correlation with the texture of traditional streets and alleys, the satisfaction of the cultural brand of the block, the satisfaction of the shopping environment, and the satisfaction of the characteristics of cultural and entertainment activities but is positively correlated with the other eight indicators of cultural and tourism experiences. Both the quantity of infrastructure and the quantity of cultural facilities are positively correlated with the four indicators reflecting transportation and entertainment experiences, yet the quantity of infrastructure has a stronger correlation than that of cultural facilities.
It can thus be inferred that the rational planning and design of the facility space can significantly enhance the quality of entertainment and transportation experiences but have an insignificant impact on the accommodation environment and dining experiences.

4. Discussion

Against the backdrop of increasing emphasis on cultural tourism and the preservation of historic districts in China, this study employs quantitative methods to investigate the impact of the spatial form of Huizhou historic districts on cultural tourism experiences. It addresses the gap in existing research, which lacks quantitative analysis and empirical studies on the spatial aspects of historic districts. Furthermore, the study proposes planning and design strategies from a spatial perspective, offering innovative approaches to enhance the relationship between historic districts and cultural tourism development.
Through a systematic analysis of 20 historic districts in Huizhou, this study reveals the diverse impacts of different spatial forms on cultural tourism experiences. Compared to previous studies, the innovation of this research lies in overcoming the limitations of single-space or single-case analyses [14,24], adopting a multi-dimensional and large-sample research approach. This not only enhances the reliability of the conclusions but also provides new theoretical perspectives and practical foundations for the protection and renewal of historic districts. The findings validate and expand upon previous studies from multiple perspectives. For instance, the significance of architectural functional hybridization and spatial layout flexibility for districts, as proposed by Wen Liang [13], and the driving role of traffic accessibility in the development of historic districts, as emphasized by Yu Bing [12], are further confirmed in this study. However, the innovation of this research extends beyond these aspects; it also systematically reveals, for the first time, the intrinsic connection between the quantity of landscape spaces and tourism experience indicators (such as transportation experience and sightseeing experience). The findings indicate that the richness of landscape spaces, particularly the integration of natural and cultural landscapes, can significantly enhance tourists’ visiting experiences and satisfaction. Additionally, this study validates the viewpoints of Zhao Yang [10] and Zhu Xiaoyang [15] regarding the importance of strengthening infrastructure construction. Furthermore, it highlights that the rational allocation of public service facilities and cultural facilities is equally crucial for improving cultural tourism experiences. For example, the addition of cultural facilities, such as cultural exhibition halls and intangible cultural heritage display centers, not only enhances the cultural appeal of the district but also provides tourists with a deeper cultural experience. Meanwhile, the optimized layout of public service facilities significantly improves tourists’ convenience and satisfaction. The research also indicates that the optimization of entertainment facilities has the most substantial positive impact on cultural tourism experiences. For instance, the introduction of immersive experience projects and night light shows, among other innovative forms, can effectively enhance tourists’ sense of participation and satisfaction. Drawing on these discoveries, this study presents the following proposals.
In the rational development and protection of architectural spaces in historic districts, materials, and styles characteristic of Huizhou culture should be adopted to enhance the historical and cultural ambiance of the district. Appropriately increasing the degree of functional mixing is an important strategy to enrich architectural spaces, particularly in accommodation and transportation, which can provide tourists with more convenient and comfortable travel experiences. The integration of cultural elements is also crucial for improving the quality of architectural spaces. It is recommended to incorporate more traditional cultural elements, such as traditional patterns and decorations, into the architectural design of the district to enhance tourists’ cultural identity and inject new vitality into the sustainable development of historic districts.
In terms of optimizing traffic spaces, in addition to improving the layout of the internal traffic network to ensure seamless connections between major scenic spots, dining areas, shopping areas, and accommodation areas within the district, efforts should also be made to enhance the district’s overall traffic accessibility. Real-time traffic information services, such as road condition updates and parking navigation, should be provided through media platforms to promote the district externally and help tourists quickly identify optimal travel routes. Simultaneously, clear signage and navigation systems should be installed to facilitate easy movement within the district.
Regarding the optimization of landscape spaces, the natural vegetation, water bodies, and topography within the district should be respected and preserved. The terrain and vegetation should be utilized to create rich landscape layers and visual effects. Given the positive correlation between the number of cultural landscapes and multiple satisfaction indicators, it is recommended to further explore and showcase the cultural characteristics of the district, such as by adding cultural exhibitions and organizing cultural festivals, to enhance the district’s popularity and appeal. Furthermore, by leveraging the popularity and influence of these cultural landscapes, unique cultural and creative products should be developed to enrich tourists’ cultural and tourism experiences.
In terms of optimizing facility spaces, it is essential to ensure that public facilities, such as signboards, rest areas, and sanitation facilities, are evenly distributed and sufficient in quantity to meet tourists’ needs. Particular attention should be paid to transportation information and dining experiences, providing greater convenience and more choices to enhance overall tourist satisfaction. During the planning and construction process, greater emphasis should be placed on the integration and complementarity of infrastructure and cultural facilities, ensuring they support each other functionally and coordinate stylistically. For example, cultural elements can be incorporated into infrastructure, or necessary infrastructure support can be provided for cultural facilities.
This study adopts the Partial Least Squares statistical method, whose core lies in establishing the relationship between spatial form characteristics and the evaluation of cultural tourism experience by extracting latent variables. This method has strong data inclusiveness. Whether they are geographic information data, Dianping data, or other types of data, as long as they can reflect the two key dimensions of “spatial form” and “cultural tourism experience”, they can all be included in the analysis. For instance, even if the data are replaced by data from professional tourism research institutions’ questionnaires or user-shared data on social media, as long as the data can accurately quantify the relevant indicators, the inherent logic of the method can enable the analysis to focus on the impact of the spatial form on cultural tourism experience. The basic direction of the conclusion (that is, spatial form characteristics affect the quality of cultural tourism experience) is likely to remain unchanged.

5. Conclusions

This study selects 20 representative historic districts in Huizhou, including Tunxi Ancient Street and Wuhu Ancient Town, as research objects. By analyzing the correlation between the spatial form of these historic districts and cultural tourism experiences, the study explores the spatial factors that influence the enhancement of cultural tourism experiences. Based on these findings, the paper proposes strategies to improve the cultural tourism experience in historic districts. This research resolves the issue between cultural inheritance and tourism development, enriches the theoretical findings of theories related to historic districts and cultural tourism experience, and provides references for other historic districts with unique regional cultural backgrounds in terms of cultural tourism development.
Through an in-depth analysis of the spatial form of the historic districts in Huizhou and its impact on cultural tourism experiences, this study has confirmed that: (1) There is a correlation between the spatial form of these historic districts in Huizhou and the cultural tourism experience. To a certain extent, the reasonable optimization and protection of the spatial form of historic districts can promote the improvement of cultural tourism experience. (2) The architectural space significantly impacts the development of cultural tourism experience. This is reflected in the optimization of façade materials, enhancement of functional diversity, the integration of cultural elements, and the maintenance of appropriate building density, which can significantly enhance tourists’ cultural tourism experiences. (3) The overall optimization of traffic space is conducive to enhancing the cultural and tourism experience. This is reflected in the positive correlation between the two important indicators—transportation accessibility and road network density—and multiple aspects of the cultural and tourism experience. (4) The improvement of landscape space is positively correlated with the enhancement of cultural and tourism experience. A reasonable increase in the number of landscapes can promote the improvement of cultural and tourism experience in the block. (5) The reasonable increase in facility space, as reflected in the quantity of different facilities, is beneficial to the improvement and development of cultural and tourism experience.
However, this study does present several constraints. Firstly, the data on the spatial form of historic districts collected during the field research stage may contain quantitative deviations. These deviations arise because the spatial forms of some districts are still undergoing continuous updates, renovations, and adjustments, which in turn affect the final collection of spatial form data. Additionally, when selecting cultural tourism experience indicators, the study primarily referred to previous research, relevant policies, and reports, and selected quantifiable indicators as analytical variables, which may influence the research results.
This study selects historical blocks in the Huizhou area that reflect regional cultural characteristics and have good potential for cultural tourism development as the research objects, exploring the impact of the spatial form of the blocks on cultural tourism experiences. Future research can build on this foundation by combining typical cases of different types of historic districts to conduct further qualitative analysis in terms of district types, scales, and distributions in order to verify research conclusions and summarize the cultural tourism development models of historic districts. In addition, future research should also conduct comparative analyses of historic districts from different regions both domestically and internationally to further expand research conclusions and provide more innovative solutions for the cultural tourism development of historic districts.

Author Contributions

Y.Y. was responsible for the conceptualization and methodology of the study as well as designing the research framework; S.D. processed the data, performed the calculations and analysis, and wrote the manuscript; Y.X. collected the data and provided suggestions on the data processing methods. All authors have read and agreed to the published version of the manuscript.

Funding

The National Natural Science Foundation of China (52408001); The Social Science Innovation and Development Research Project of Anhui (2023CX084); The Anhui Province Culture and Tourism Research Project (WL2023YB06); The Anhui Province Key Project of Natural Science Research in Universities (KJ2021A0615); The Anhui Province Outstanding Young Teachers Cultivation Project of the Middle-aged and Young Teachers Training Action (YQYB2024033); The Anhui Jianzhu University Project for Introduced Talents and Doctoral Start-up Fund (2022QDZ14).

Data Availability Statement

The original data supporting the conclusion of this paper will be provided by the authors as needed.

Conflicts of Interest

The authors declare no conflicts of interest.

References

  1. General Office of the State Council. Opinions of the General Office of the State Council on Further Stimulating the Consumption Potential of Culture and Tourism. Available online: https://www.gov.cn/zhengce/content/2019-08/23/content_5423809.htm (accessed on 1 March 2025).
  2. Guo, R.; He, Y.; Zhang, X.; He, L.; Zhou, Q.; He, G. Semantic Comparison of Online Texts for Historical and Newly Constructed Replica Ancient Towns from a Tourist Perception Perspective: A Case Study of Tongguan Kiln Ancient Town and Jinggang Ancient Town. Land 2024, 13, 2197. [Google Scholar] [CrossRef]
  3. Ren, K.; Xu, J. Formation Process and Spatial Representation of Tourist Destination Personality from the Perspective of Cultural Heritage: Application in Traditional Villages in Ancient Huizhou, China. Land 2024, 13, 423. [Google Scholar] [CrossRef]
  4. Zhang, S.; Yu, W. Canal Heritage Tourism Utilization Models: Experience and Inspirations from the Grand Canal (Beijing Section). Land 2024, 13, 860. [Google Scholar] [CrossRef]
  5. Li, M.; Liu, J.; Lin, Y.; Xiao, L.; Zhou, J. Revitalizing Historic Districts: Identifying Built Environment Predictors for Street Vibrancy Based on Urban Sensor Data. Cities 2021, 117, 103305. [Google Scholar] [CrossRef]
  6. Huang, J.; Hu, X.; Wang, J.; Lu, A. How Diversity and Accessibility Affect Street Vitality in Historic Districts? Land 2023, 12, 219. [Google Scholar] [CrossRef]
  7. CIAM. The Athens Charter. In Proceedings of the 4th Congress of Congress International Architecture Modern, Athens, Greece, 29–31 August 1933. [Google Scholar]
  8. Jacobs, J. The Death and Life of Great American Cities; Vintage Books: New York, NY, USA, 1992; pp. 187–199. [Google Scholar]
  9. Furlan, R.; Petruccioli, A.; Jamaleddin, M. The authenticity of place-making: Spaceand character of the regenerated historic district in Msheireb, Downtown Doha (state of Qatar). Archnet-IJAR Int. J. Archit. Res. 2019, 13, 151–168. [Google Scholar] [CrossRef]
  10. Zhao, Y.; Liu, J.; Zheng, Y. Preservation and Renewal: A Study on Visual Evaluation of Urban Historical and Cultural Street Landscape in Quanzhou. Sustainability 2022, 14, 8775. [Google Scholar] [CrossRef]
  11. Zhang, F.; Liu, Q.; Zhou, X. Vitality Evaluation of Public Spaces in Historical and Cultural Blocks Based on Multi-So-urce Data, a Case Study of Suzhou Changmen. Sustainability 2022, 14, 14040. [Google Scholar] [CrossRef]
  12. Yu, B.; Sun, J.; Wang, Z.; Jin, S. Influencing Factors of Street Vitality in Historic Districts Based on Multisource Data: Evidence from China. ISPRS Int. J. Geo-Inf. 2024, 13, 277. [Google Scholar] [CrossRef]
  13. Liang, W.; Ahmad, Y.; Mohidin, H.H.B. Spatial Form and Conservation Strategy of Sishengci Historic District in Che-ngdu, China. Heritage 2023, 6, 891–903. [Google Scholar] [CrossRef]
  14. Zhou, X.; Zhang, X.; Dai, Z.; Hermaputi, R.L.; Hua, C.; Li, Y. Spatial Layout and Coupling of Urban Cultural Relics: Analyzing Historical Sites and Commercial Facilities in District III of Shaoxing. Sustainability 2021, 13, 6877. [Google Scholar] [CrossRef]
  15. Zhu, X.; Chiou, S.-C. A Study on the Sustainable Development of Historic District Landscapes Based on Place Attachment among Tourists: A Case Study of Taiping Old Street, Taiwan. Sustainability 2022, 14, 11755. [Google Scholar] [CrossRef]
  16. Bosone, M.; Nocca, F.; Fusco Girard, L. The Circular City Implementation: Cultural Heritage and Digital Technology. In Culture and Computing. Interactive Cultural Heritage and Arts; Rauterberg, M., Ed.; Springer International Publishing: Cham, Switzerland, 2021; pp. 40–62. [Google Scholar] [CrossRef]
  17. Fotsch, P.M. Tourism’s uneven impact: History on Cannery Row. Ann. Tour. Res. 2004, 31, 779–800. [Google Scholar] [CrossRef]
  18. Falk, N. Baltimore and Lowell: Two American approaches. Built Environ. 1986, 12, 145–152. Available online: http://www.jstor.org/stable/23286695 (accessed on 5 March 2025).
  19. Kotler, P.; Baloglu, S.; Makens, J.; Bowen, J. Marketing for Hospitality and Tourism, 7th ed.; Pearson International: London, UK, 2016; pp. 507–549. [Google Scholar]
  20. Frochot, I.; Hughes, H. HISTOQUAL: The development of a Historic House Assessment Scale. Tour. Manag. 2000, 21, 157–167. [Google Scholar] [CrossRef]
  21. Xu, Y.; Rollo, J.; Jones, D.S.; Esteban, Y.; Tong, H.; Mu, Q. Towards Sustainable Heritage Tourism: A Space Syntax-Based Analysis Method to Improve Tourists’ Spatial Cognition in Chinese Historic Districts. Buildings 2020, 10, 29. [Google Scholar] [CrossRef]
  22. Liang, F.; Pan, Y.; Gu, M.; Liu, Y.; Lei, L. Research on the Paths and Strategies of the Integrated Development of Culture and Tourism Industry in Urban Historical Blocks. Front. Public Health 2022, 10, 1016801. [Google Scholar] [CrossRef] [PubMed]
  23. Jimura, T. Cultural Heritage and Tourism in Japan; Routledge: London, UK, 2021; pp. 274–290. [Google Scholar]
  24. Gu, S.; Li, J.; Wang, M.; Ma, H. Post-Renewal Evaluation of an Urbanized Village with Cultural Resources Based on Multi Public Satisfaction: A Case Study of Nantou Ancient City in Shenzhen. Land 2023, 12, 211. [Google Scholar] [CrossRef]
  25. Skotis, A.; Livas, C. A Data-Driven Analysis of Experience in Urban Historic Districts. Ann. Tour. Res. Empir. Insights 2022, 3, 100052. [Google Scholar] [CrossRef]
  26. Seyfi, S.; Hall, C.M.; Rasoolimanesh, S.M. Exploring the Nexus of Heritage Tourism and Sustainable Development: A Comprehensive Review. J. Herit. Tour. 2020, 15, 341–357. [Google Scholar] [CrossRef]
  27. Zatori, A.; Smith, M.K.; Puczko, L. Experience-Involvement, Memorability and Authenticity: The Service Provider’s Effect on Tourist Experience. Tour. Manag. 2018, 67, 111–126. [Google Scholar] [CrossRef]
  28. Zhang, T.; Yin, P.; Peng, Y. Effect of Commercialization on Tourists’ Perceived Authenticity and Satisfaction in the Cultural Heritage Tourism Context: Case Study of Langzhong Ancient City. Sustainability 2021, 13, 6847. [Google Scholar] [CrossRef]
  29. Tang, C.; Zheng, Q.; Ng, P. A Study on the Coordinative Green Development of Tourist Experience and Commercial-ization of Tourism at Cultural Heritage Sites. Sustainability 2019, 11, 4732. [Google Scholar] [CrossRef]
  30. Xiang, Q.; Qin, W. Evaluation of Authentic Perception of Urban Historical and Cultural Blocks under Global Tourism. J. Cent. South Univ. For. Technol. 2024, 44, 165–173. [Google Scholar] [CrossRef]
  31. Zhu, Z.; Liu, J.; Zhu, H.; Zhao, W. Evaluating Scientific Tourism of Geoheritage: An Empirical Study of Fangshan Global Geopark in Beijing. Land 2024, 13, 2119. [Google Scholar] [CrossRef]
  32. Gould, P.G.; Burtenshaw, P. Heritage Sites: Economic Incentives, Impacts, and Commercialization. In Encyclopedia of Global Archaeology; Smith, C., Ed.; Springer International Publishing: Cham, Switzerland, 2020; pp. 4989–4995. [Google Scholar] [CrossRef]
  33. Tu, W.; Zhu, T.; Xia, J.; Zhou, Y.; Lai, Y.; Jiang, J.; Li, Q. Portraying the Spatial Dynamics of Urban Vibrancy Using Multisource Urban Big Data. Comput. Environ. Urban Syst. 2020, 80, 101428. [Google Scholar] [CrossRef]
  34. Shang, W.; He, C.; Lv, S. Sustainable Renewal of Spontaneous Spatial Characteristics of a Historical–Cultural District: A Case Study of Tanhualin, Wuhan, China. Sustainability 2023, 15, 2038. [Google Scholar] [CrossRef]
  35. Zhang, R.; Martí Casanovas, M.; Bosch González, M.; Sun, S. Revitalizing Heritage: The Role of Urban Morphology in Creating Public Value in China’s Historic Districts. Land 2024, 13, 1919. [Google Scholar] [CrossRef]
  36. Chen, W.; Wu, A.N.; Biljecki, F. Classification of Urban Morphology with Deep Learning: Application on Urban Vitality. Comput. Environ. Urban Syst. 2021, 90, 101706. [Google Scholar] [CrossRef]
  37. Wen, Z.; Zhao, J.; Li, M. A Study on the Influencing Factors of the Vitality of Street Corner Spaces in Historic Districts: The Case of Shanghai Bund Historic District. Buildings 2024, 14, 2947. [Google Scholar] [CrossRef]
  38. Wold, S.; Albano, C.; Dunn, W.J. Pattern Regression Finding and Usingregularities in Multivariate Data; Analysis Applied Science Publication: London, UK, 1983; pp. 147–188. [Google Scholar]
  39. Huiwen, W.; Zaibin, W.; Jie, M. Partial Least Squares Regression—Linear and Nonlinear Methods; National Defense Industry Press: Beijing, China, 2006; pp. 138–149. [Google Scholar]
  40. Wentong, Z.; Wei, D. Advanced SPSS Statistical Analysis, 2nd ed.; Higher Education Press: Beijing, China, 2015; pp. 130–132. [Google Scholar]
Figure 1. Distribution of 20 representative historic districts in Anhui Province.
Buildings 15 01568 g001
Figure 2. Flowchart of the method.
Buildings 15 01568 g002
Figure 3. Histogram of the spatial morphology data of historic blocks: (a) architectural space; (b) traffic space; (c) landscape space; (d) facility space.
Buildings 15 01568 g003
Figure 4. Histogram of the cultural travel experiences data of historic blocks: (a) dining experience; (b) lodging experience; (c) transportation experience; (d) sightseeing experience (e) shopping experience; (f) entertainment experience.
Buildings 15 01568 g004aBuildings 15 01568 g004b
Table 1. Overview of 20 representative historic districts in Anhui Province.
NumberNameLocationArea
Occupied (hm2)
1Liyang Old StreetTunxi District, Huangshan City6
2Tunxi Old StreetTunxi District, Huangshan City13
3Nuoxian TownGuichi District, Chizhou City3.6
4Shuidong Old StreetXuanzhou District, Xuancheng City6
5Suixi Ancient TownSuixi County, Huaibei City9
6Jiuzi Ancient TownJiujiang District, Wuhu City2.15
7Wuhu Ancient TownJinghu District, Wuhu City30
8Sui-Tang Canal Ancient TownXiangshan District, Huaibei City34.87
9Quanjiao Taiping Ancient TownQuanjiao County, Chuzhou City12
10Xihe Ancient TownWanchai District, Wuhu City33.33
11Daopashi StreetYingjiang District, Anqing City2.24
12Guanzhong Old StreetYingshang County, Fuyang City7
13Bozhou Old StreetQiao Cheng District, Bozhou City9.6
14“1978 Tongguan Mountain” Cultural and Creative StreetTongguan District, Tongling City3.26
15Lei StreetBaohe District, Hefei City2.2
16Cuo StreetFeidong County, Hefei City6.2
17Zunyang StreetLangya District, Chuzhou City5.8
18Qufang StreetYongqiao District, Suzhou City1.7
19Banbian StreetShushan District, Hefei City3.47
20Chenghuang MiaoLuyang District, Hefei City10
Table 2. Spatial form index of Huizhou historic districts.
ClassificationIndependent VariableIndicatorExplanation
Architectural spaceX1Building densityNumber of buildings within a district per unit area
X2Functional
mixing degree
Diversity of functions in the district
Architectural spaceX3Façade
material category
Number of material categories for building facades within the district
X4Cultural
elements categories
Number of categories of expressions of cultural elements such as Horse-head Walls and antique doorways in the district
Traffic spaceX5Transport accessibilityEase of access to the district for tourists
X6Road network densityIntra-neighborhood traffic network density
Landscape spaceX7Number of
natural landscapes
Number of natural landscape vignettes in the district
X8Number of
Cultural landscapes
Number of cultural landscape features within the district
Facility spaceX9Number of
Public facilities
Number of public service facilities such as tourist service centers, guide maps, and street offices within the district area.
X10Number of
infrastructure facilities
Number of basic facilities such as streetlights, traffic signs,
and leisure seats within the district
X11Number of
cultural facilities
Number of cultural facilities such as cultural signboards, cultural sketches and publicity boards within the street area
Table 3. Evaluation index of cultural tourism experience in Huizhou historic districts.
ClassificationIndependent VariableIndicatorExplanation
Dining
experience
Y1Satisfaction with
dining convenience
Tourists’ evaluation of the distribution of meals and the waiting situation before dining
Y2Satisfaction with
dining prices
Tourists’ evaluation of overall price of meals
Y3Satisfaction with
accommodation environment
Tourists’ evaluation of the hygiene and safety of the accommodation environment
Y4Satisfaction with
accommodation features
Tourists’ evaluation of the unique features and services of the accommodation
Lodging
experience
Y5Satisfaction with
traffic information service
Tourists’ evaluation of the richness of the transportation information services provided
Y6Satisfaction with
traditional street texture
Tourists’ evaluation of the preservation and continuation of traditional spatial forms in streets and alleys
Transportation experienceY7Satisfaction with
the overall atmosphere of the district
Tourists’ evaluation of the cultural atmosphere embodied in the block’s spaces and landscapes
Y8Satisfaction with
the cultural branding of the district
Tourists’ evaluation of the construction of block culture brand
Sightseeing
experience
Y9Satisfaction with
shopping environment
Tourists’ evaluation of commodity prices in the shopping environment, professional quality of practitioners, and service attitude of managers
Y10Satisfaction with
the characteristics of cultural and creative products
Tourists’ evaluation of the richness of cultural activity types
Shopping
experience
Y11Satisfaction with
the characteristics of cultural and recreational activities
Tourists’ evaluation of the compatibility of the content and historical features of cultural activities and the quality of the activities
Y12Satisfaction with
types of cultural and entertainment activities
Tourists’ evaluation of the richness of cultural activity types
Table 4. Cross-validity analysis.
Number of Principal Components (h)SSPRESSQh2
1142.615184.5841
2121.04185.048−0.298
3111.61198.045−0.636
4102.542220.749−0.978
596.4269.496−1.628
691.463301.51−2.128
783.209330.299−2.611
875.992327.358−2.934
973.557342.886−3.512
1069.939456.834−5.211
1168.718534.491−6.642
Table 5. Projection importance analysis.
1 Principal Component2 Principal Components3 Principal Components4 Principal Components6 Principal Components7 Principal Components8 Principal Components9 Principal Components10 Principal Components11 Principal Components
Building density0.1620.630.7740.7840.7790.8360.8410.8350.8290.83
Functional mixing
degree
0.9751.0130.9731.0211.0411.0271.0041.011.0131.01
Facade material
category
1.0020.920.9020.9130.9580.950.9510.9440.9630.961
Cultural elements
categories
0.8260.780.8851.0160.9790.9930.9710.9670.9710.968
Transport
accessibility
0.7311.0471.0561.0361.0130.9860.990.9930.9820.983
Road network
density
1.1931.1381.0891.0961.0531.0311.0311.0271.0161.032
Number of natural landscapes1.3361.241.1941.1451.1621.1521.131.131.1431.138
Number of cultural landscapes1.1341.0551.0130.9850.9720.9981.0611.0561.0491.048
Number of public
facilities
1.1151.0571.0340.9870.9990.9750.9530.9690.9880.986
Number of
infrastructure
facilities
1.1641.0571.0951.0521.0581.0651.0991.0941.0821.078
Number of cultural facilities0.8440.9210.9130.9150.9410.9570.9360.9420.9310.934
Table 6. Principal component U and study item X precision analysis.
XIndependent VariablePrincipal Component U1
X1Building density0.048
X2Functional mixing degree0.606
X3Facade material category0.536
X4Cultural elements categories0.405
X5Transport accessibility0.148
X6Road network density0.599
X7Number of natural landscapes0.652
X8Number of cultural landscapes0.621
X9Number of public facilities0.475
X10Number of infrastructure facilities0.531
X11Number of cultural facilities0.504
Comprehensive0.466
Table 7. Principal component U and study item Y precision analysis.
YDependent VariablePrincipal Component V1
Y1Satisfaction with dining convenience0.561
Y2Satisfaction with dining prices0.513
Y3Satisfaction with accommodation environment0.64
Y4Satisfaction with accommodation features0.618
Y5Satisfaction with traffic information service0.527
Y6Satisfaction with traditional street texture0.466
Y7Satisfaction with the overall atmosphere of the district0.537
Y8Satisfaction with the cultural branding of the district0.623
Y9Satisfaction with shopping environment0.222
Y10Satisfaction with the characteristics of cultural and creative products0.67
Y11Satisfaction with the characteristics of cultural and recreational activities0.496
Y12Satisfaction with types of cultural and entertainment activities0.552
Comprehensive0.535
Table 8. Pearson correlation coefficients.
Average ValueStandard DeviationBuilding DensityFunctional Mix DegreeFacade
Material
Category
Cultural
Elements
Categories
Transport
Accessibility
Road
Network Density
Number of Natural
Landscapes
Number of Cultural
Landscapes
Number of Public
Facilities
Number of
Infrastructure
Facilities
Number of Cultural
Facilities
Building
density
41.85020.5511
Functional mix degree3.9500.9450.2871
Facade material category5.2501.9430.0840.609 ***1
Cultural
elements
categories
8.4502.5020.385 *0.389 *0.3551
Transport
accessibility
1.6010.379−0.0410.0610.2110.1301
Road network density0.3200.089−0.1430.555 **0.3110.385 *0.440 *1
Number of
natural
landscapes
3.8002.3080.0590.478 **0.692 ***0.427 *0.3670.572 ***1
Number of
cultural
landscapes
6.9002.9360.3550.719 ***0.650 ***0.551 **0.1800.531 **0.572 ***1
Number of
public facilities
11.9504.8830.0930.410 *0.2400.515 **0.403 *0.617 ***0.574 ***0.2571
Number of
infrastructure
facilities
9.2503.9590.1960.567 ***0.641 ***0.3390.1960.444 *0.478 **0.441 *0.453 **1
Number of
cultural
facilities
10.2003.1050.2090.668 ***0.410 *0.476 **−0.1610.627 ***0.424 *0.637 ***0.383 *0.522 **1
* p < 0.1 ** p < 0.05 *** p < 0.01.
Table 9. Perturbation coefficients.
Y1Y2Y3Y4Y5Y6Y7Y8Y9Y10Y11Y12
X1Perturbation
coefficient
−0.0570.034−0.0910.0370.30.5160.1190.028−0.091−0.1070.109−0.196
X2Perturbation
coefficient
0.1150.3330.2810.5010.6620.7540.2280.3180.3070.3530.4760.345
X3Perturbation
coefficient
0.280.3260.340.3620.3290.5440.4250.3160.3840.4940.5910.426
X4Perturbation
coefficient
0.2410.4650.1850.2390.4750.4700.6460.1950.180.3530.2890.086
X5Perturbation
coefficient
0.5260.6550.5430.3750.2610.0290.2050.0940.4830.5110.2490.212
X6Perturbation
coefficient
0.4930.5360.5470.5830.5620.3590.4050.4110.4040.6380.5850.567
X7Perturbation
coefficient
0.4760.5650.5060.5040.4930.5020.5770.4620.4780.7130.8590.509
X8Perturbation
coefficient
0.4100.3390.3160.5150.5520.7560.4830.3240.4200.5240.5360.327
X9Perturbation
coefficient
0.4060.5770.5040.5380.5320.350.6170.3550.3420.5090.5310.342
X10Perturbation
coefficient
0.320.3650.4310.4240.5170.6140.4220.6220.3420.4240.5460.625
X11Perturbation
coefficient
0.0910.140.1340.2210.4990.5810.3470.4050.2690.3510.5850.476
Table 10. Regression coefficients 1 and p-value 2 of Partial Least Squares Regression (PLSR).
Y1Y2Y3Y4Y5Y6
Satisfaction
with Dining
Convenience
Satisfaction
with Dining
Prices
Satisfaction with Accommodation
Environment
Satisfaction
with
Accommodation
Features
Satisfaction
of Traffic
Information
Service
Satisfaction of
Traditional
Street
Texture
Architectural space
X1 Building
density
coefficient−0.0570.034−0.0910.0370.30.516
p **
X2 Functional mixing degreecoefficient0.1150.3330.2810.5010.6620.754
p ********
X3 Facade material categorycoefficient0.280.3260.340.3620.3290.544
p **
X4 Cultural elements categoriescoefficient0.2410.4650.1850.2390.4750.470
p ** ****
Traffic space
X5 Transport accessibilitycoefficient0.5260.6550.5430.3750.2610.029
p********
X6 Road network
density
coefficient0.4930.5360.5470.5830.5620.359
p************
Landscape space
X7 Number of natural landscapescoefficient0.4760.5650.5060.5040.4930.502
p*************
X8 Number of Cultural Landscapescoefficient0.4100.3390.3160.5150.5520.756
p* *******
Facility space
X9 Number of Public Facilitiescoefficient0.4060.5770.5040.5380.5320.35
p**********
X10 Number of infrastructure facilitiescoefficient0.320.3650.4310.4240.5170.614
p *******
X11 Number of Cultural Facilitiescoefficient0.0910.140.1340.2210.4990.581
p *****
R-Square 3 0.2290.3630.290.3750.4840.511
Y7Y8Y9Y10Y11Y12
Satisfaction with the
Overall
Atmosphere of the
District
Satisfaction with the
Cultural
Branding of
the District
Satisfaction with Shopping
Environment
Satisfaction
with the
Characteristics
of Cultural
and
Creativeproduct
Satisfaction
with the
Characteristics of Cultural
and
Recreational
Activities
Satisfaction
with Types of
Cultural and
Entertainment Activities
Architectural space
X1 Building
density
coefficient0.1190.028−0.091−0.1070.109−0.196
p
X2 Functional mixing degreecoefficient0.2280.3180.3070.3530.4760.345
p **
X3 Facade material categorycoefficient0.4250.3160.3840.4940.5910.426
p* *******
X4 Cultural elements categoriescoefficient0.6460.1950.180.3530.2890.086
p***
Traffic space
X5 Transport accessibilitycoefficient0.2050.0940.4830.5110.2490.212
p ****
X6 Road network
density
coefficient0.4050.4110.4040.6380.5850.567
p************
Landscape space
X7 Number of natural landscapescoefficient0.5770.4620.4780.7130.8590.509
p***************
X8 Number of cultural landscapescoefficient0.4830.3240.4200.5240.5360.327
p** *****
Facility space
X9 Number of public facilitiescoefficient0.6170.3550.3420.5090.5310.342
p*** ****
X10 Number of infrastructure facilitiescoefficient0.4220.6220.3420.424 *0.5460.625
p**** ******
X11 Number of cultural facilitiescoefficient0.3470.4050.2690.3510.5850.476
p * *****
R-Square 3 0.3860.260.1580.4790.580.317
1 The regression coefficient represents the impact of the independent variable X on the dependent variable Y; the larger the regression coefficient, the greater the impact of X on Y; a positive regression coefficient indicates that Y increases with the increase in X; a negative regression coefficient indicates that Y decreases with the increase in X. 2 The p-value is the probability of obtaining results at least as extreme as the actual observed results, assuming the null hypothesis is true. The smaller the p-value, the more significant the result (*** p = 0.01 significant, indicating significance at the 0.01 level; ** p = 0.05 significant, indicating significance at the 0.05 level; * p = 0.1 significant, indicating significance at the 0.1 level). 3 R-squared represents the goodness of fit. It measures how well the regression equation fits the dependent variable, with values ranging from 0 to 1. The closer the R value is to 1, the better the fit of the regression equation.
Disclaimer/Publisher’s Note: The statements, opinions and data contained in all publications are solely those of the individual author(s) and contributor(s) and not of MDPI and/or the editor(s). MDPI and/or the editor(s) disclaim responsibility for any injury to people or property resulting from any ideas, methods, instructions or products referred to in the content.

