Article

Condensation Risk Under Different Window-Opening Behaviours in a Residential Building in Changsha During Plum Rains Season

1
School of Energy and Power Engineering, Changsha University of Science and Technology, Changsha 410114, China
2
GREE Electric Appliances Inc., Zhuhai 519070, China
*
Author to whom correspondence should be addressed.
Buildings 2025, 15(9), 1536; https://doi.org/10.3390/buildings15091536
Submission received: 7 April 2025 / Revised: 23 April 2025 / Accepted: 28 April 2025 / Published: 2 May 2025
(This article belongs to the Special Issue Research on Ventilation and Airflow Distribution of Building Systems)

Abstract

Condensation assessment of a residential building in Changsha, China-located in the hot summer and cold winter climate zone-was conducted during the Plum Rain Season (PRS) using Energy Plus simulations and field measurements. Window-opening behaviour significantly influences indoor air quality and thermal comfort. This study specifically examines how window-opening patterns, including opening duration and opening degree, affect interior surface condensation risk in a rural residential building during PRS. Results indicate that window operational status (open/closed) exerts a dominant influence on condensation risk, while varying window opening degrees during identical opening duration showed negligible differential impacts. Critical temporal patterns emerged: morning window openings during PRS should be avoided, whereas afternoon (15:00–18:00) and nighttime (18:00–06:00) ventilation proves advantageous. Optimisation analysis revealed that implementing combined afternoon and nighttime ventilation windows (15:00–18:00 + 18:00–06:00) achieved the lowest condensation risk of 0.112 among evaluated scenarios. Furthermore, monthly-adjusted window operation strategies yielded eight recommended ventilation modes, maintaining condensation risks below 0.11 and providing occupant-tailored solutions for Changsha’s PRS conditions. These findings establish evidence-based guidelines for moisture control through optimised window operation in climate-responsive building management.

1. Introduction

Building environment is crucial for human health and the work efficiency of residents. To some extent, most of the rural buildings in Hunan, China, are affected by personal preferences and local customs in the design and construction process; therefore, there are many unfavourable factors for a healthy and comfortable indoor environment. Changsha is located in the hot summer and cold winter region; at the end of spring and the beginning of summer every year, there will be a unique climate phenomenon in this region, which is named Plum Rains Season (PRS). During this period, high air temperature fluctuations and high humidity result in a high risk of condensation on the building envelope. Condensation in a building encourages microbial growth, which could have an adverse effect on the health of occupants [1,2,3]. Furthermore, it induces the deterioration of the building envelope. Moulds produced by moisture condensation would cause building materials to soften and deteriorate, reducing the performance of insulation materials and would also degrade indoor air quality, which in turn could cause a detrimental impact on health [4].
The condensation on the inner surfaces occurs when the surface temperature is lower than the dew point temperature of the air near the envelopes. Therefore, the key to preventing condensation on the inner surface is to reduce the room’s dew point temperature or to increase the temperature of the inner surfaces. Chen et al. [5] introduced sepiolite composite humidity-conditioning coating (SCHCC) with a good humidity control ability in a high relative humidity environment. Gong et al. [6,7] investigated how the condensation rate varies with differences in moisture content and heat flux and derived a first-order linear regression equation of temperature differences. Fang et al. [8] investigated the effects of the thickness of the air interlayer, the gas types and the relative air humidity in the air interlayer on the anti-condensation characteristics.
A large amount of literature has investigated indoor air quality [9,10,11] and human thermal comfort [12,13,14] when taking proactive measures such as building structural improvements and new building materials. Nevertheless, developing passive solutions dominated by natural ventilation has energy-saving potential. The control of windows can meet the demand for ventilation and could also achieve the purpose of regulating temperature and humidity. Therefore, analysing the characteristics of residents’ window opening behaviours could have an important role in creating a good indoor environment and building energy consumption. Wang P et al. [15] proposed an adaptive ventilation and sunlight regulation wall of adaptive building envelopes to reduce building energy. Liu et al. [16] quantitatively analysed the effect of the degree of the window openings on the infiltration airflow of a building and the indoor air temperature and humidity under this airflow. Liao et al. [17] examined the effects of window opening on sleep quality. Gu et al. [18] concluded that window opening behaviour has a stronger correlation with indoor PM 2.5 concentration and indoor air temperature, and a new dummy variable algorithm based on binary logic was developed. Li et al. [19] introduced a multi-factor optimisation method for the energy performance of buildings with natural ventilation to maximize the utilization of natural ventilation. Abdullah HK et al. [20] presented a method of open-plan office design for an improved natural ventilation potential, and the design variables, i.e., window orientation and a fraction of opening, were studied. Kitagawa et al. [21] investigated optimal window opening control to maximize year-round thermal comfort using ventilation cooling (i.e., night ventilation and comfort ventilation) in a naturally ventilated building using phase change materials (PCM). The results of a field study in Denmark by Tan et al. [22] found that opening windows had a positive effect on sleep quality when CO2 levels were reduced while opening internal doors did not. Yazarlou T et al. [23] investigated the impact of the louvres’ opening positions and slat angles by CFD simulations of cross-ventilation in a generic isolated building. Yu C et al. [24] found that comfort-based air conditioner modes and schedule-based window modes yielded the lowest cooling load. Kocik S et al. [25] evaluated air through the entire building (cross-ventilation) when the doors and windows were all open.
Most anti-condensation measures focus on changes in the envelope, anti-condensation performance of new materials or active dehumidification means, while fewer studies have been conducted on the impact of indoor occupant behaviour on the indoor humid environment. Qian et al. [26] found the effect of thermal insulation to avoid ground condensation in rural buildings in Chongqing, and the insulation layer thickness of 50 mm could withstand the ground condensation. Zhang et al. [27] used the numerical simulation method of Ansys Fluent to study the effect of different water supply parameters on the concrete radiant roof’s heat transfer performance and anti-condensation temperature control strategy. Zhang et al. [28] found long-term condensation with a probability of 45.4% detrimentally affected the practical application of the exhaust air insulation glazing system (EAIG) in severe cold climates. And reducing indoor humidity and adding a low-e coating could effectively reduce condensation probability. Wu et al. [29] analysed the reason for the anti-condensation wetting theory about superhydrophobic surfaces, which could solve some condensation problems of equipment used in HVAC systems. Wan et al. [30] imitated the backside surface of bamboo leaf; an anti-condensation on the aluminium alloy surface was achieved by laser processing and sol-gel method-hydrothermal method. Liu et al. [31] studied the effects of the surface wettability of the radiant plate and indoor environmental parameters on the condensation nucleation rate by building the condensation model.
Most of the current condensation protection measures are focused on active measures, mostly before the building is constructed or requires external assistance and are more costly and difficult to implement in practice. Research is still needed to reduce the condensation in buildings that have already been built, in order to reduce the cost of condensation protection and to make it easier to implement. Controlled window openings could reasonably save energy by utilizing outdoor low-temperature cooling sources in summer and could also improve indoor air quality [32,33,34,35]. However, due to large temperature and humidity variations of the outdoor air, irrational window opening behaviour may adversely affect the indoor humid environment and exacerbate the risk of indoor surface condensation during PRS. Therefore, in this study, the risk of condensation under different window opening scenarios was investigated to reduce the condensation risk during PRS. The hypothesis is that the opening of windows at certain specific periods could be desirable and would require optimisation. The findings of this study should provide a guide for optimising the opening and closing of windows to reduce indoor condensation risk in rural buildings in Changsha during PRS.

2. Materials and Methods

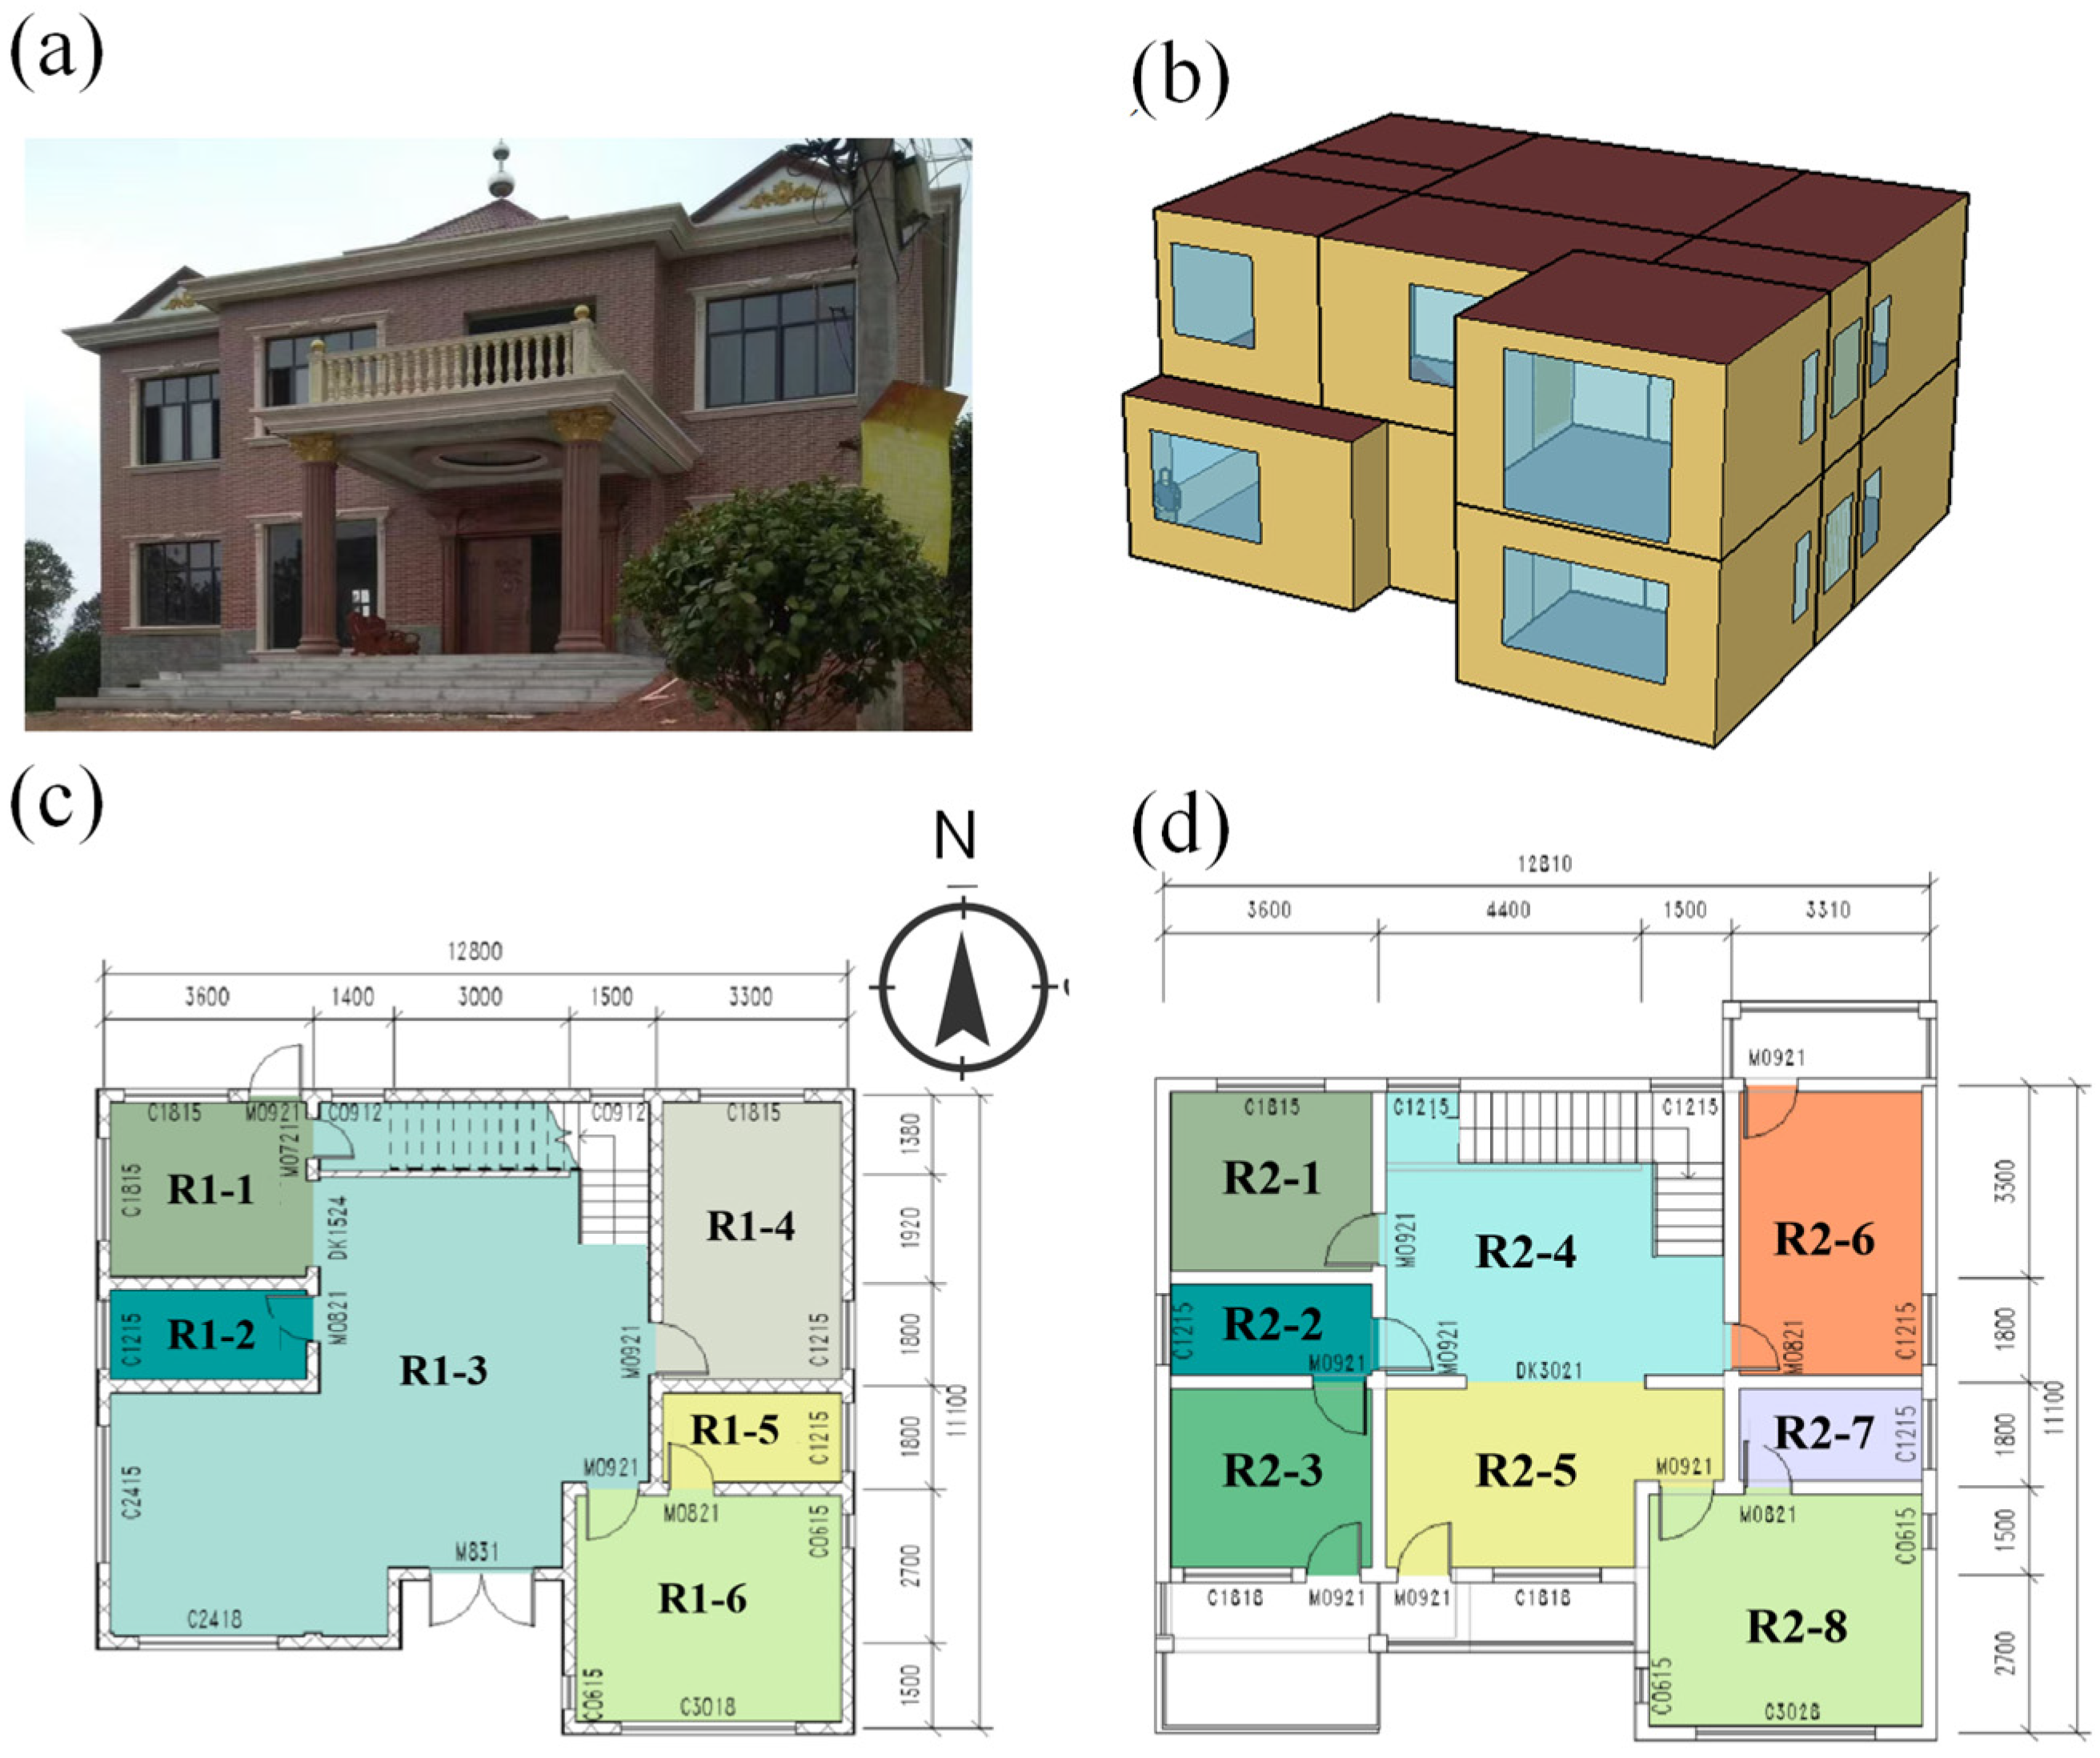
2.1. Experimental Building
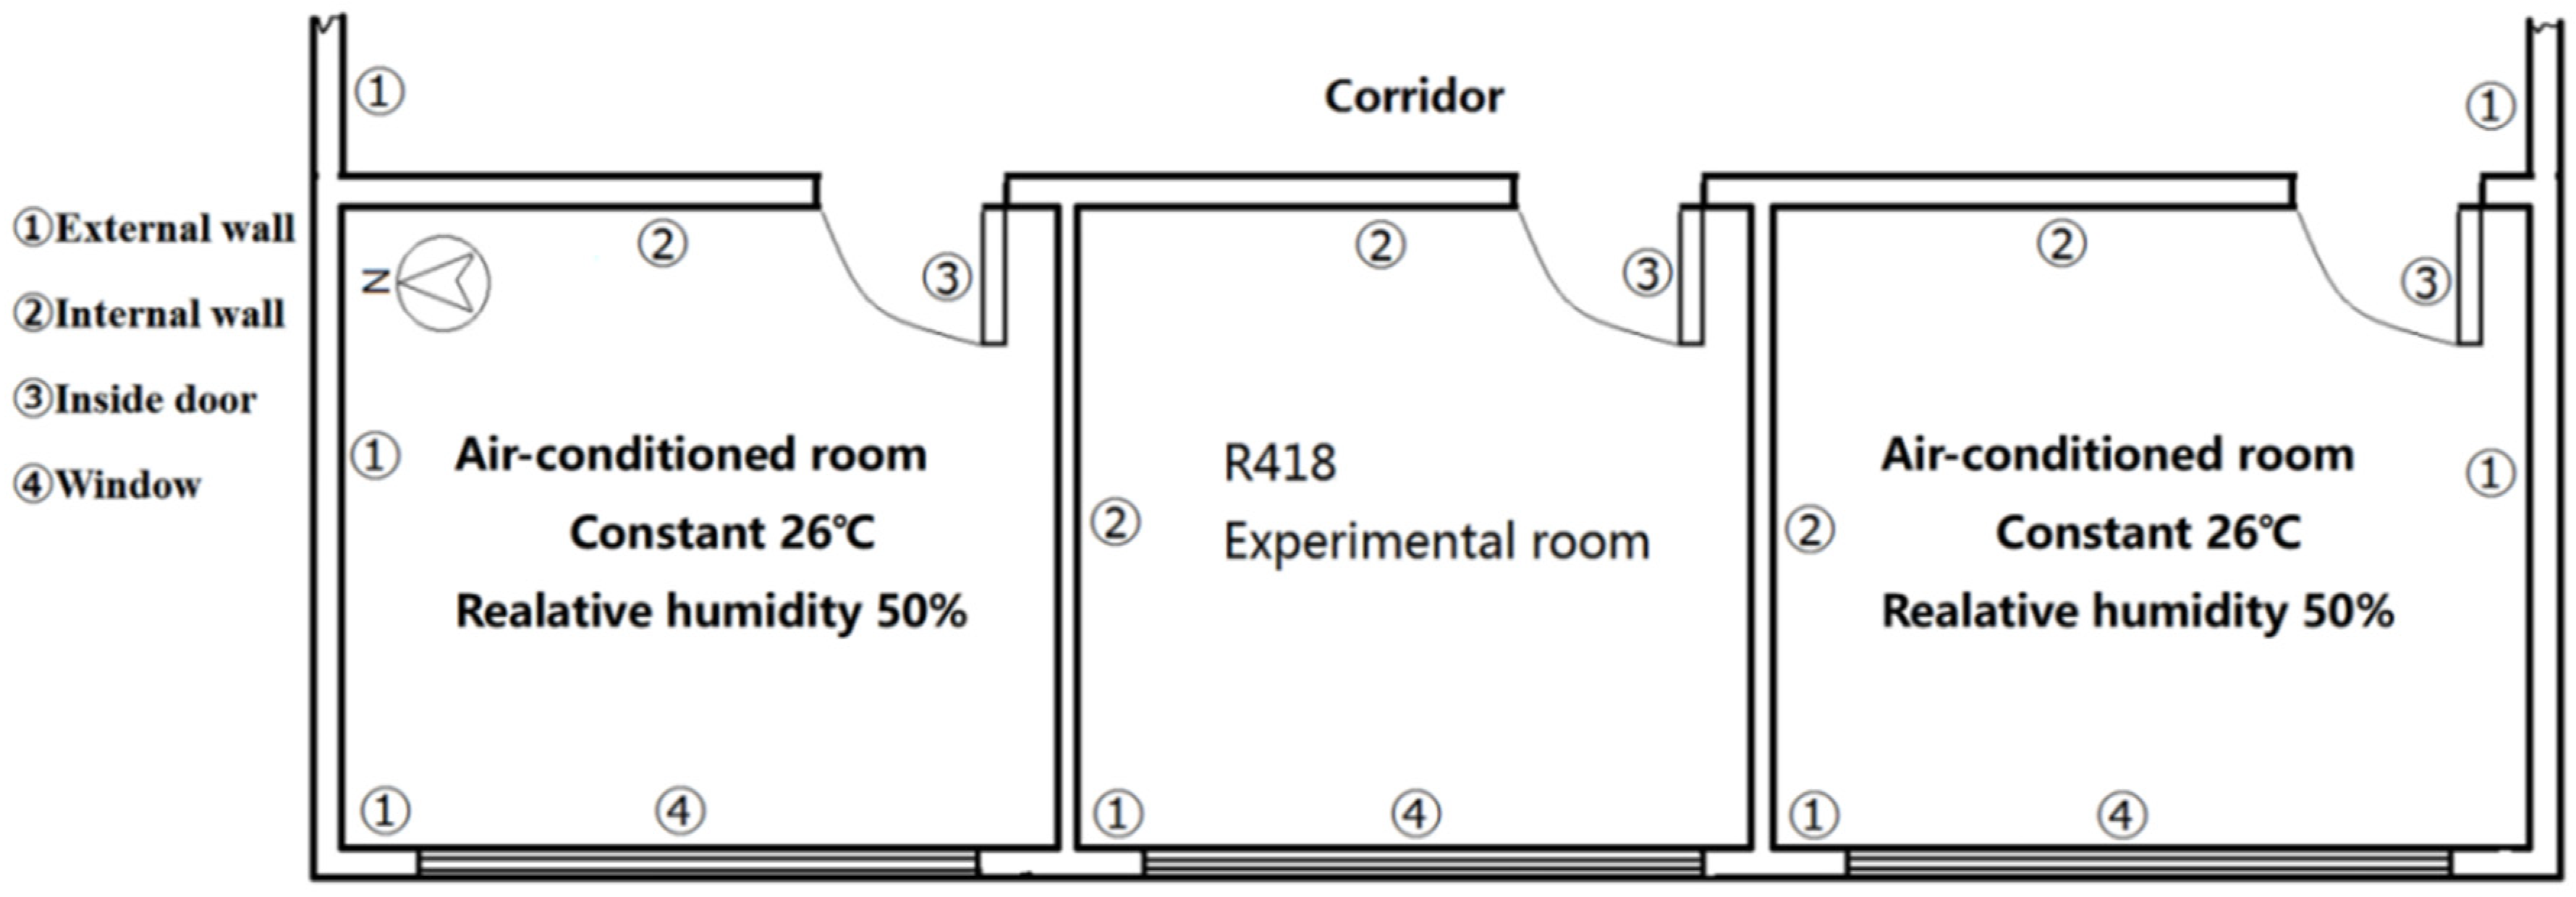
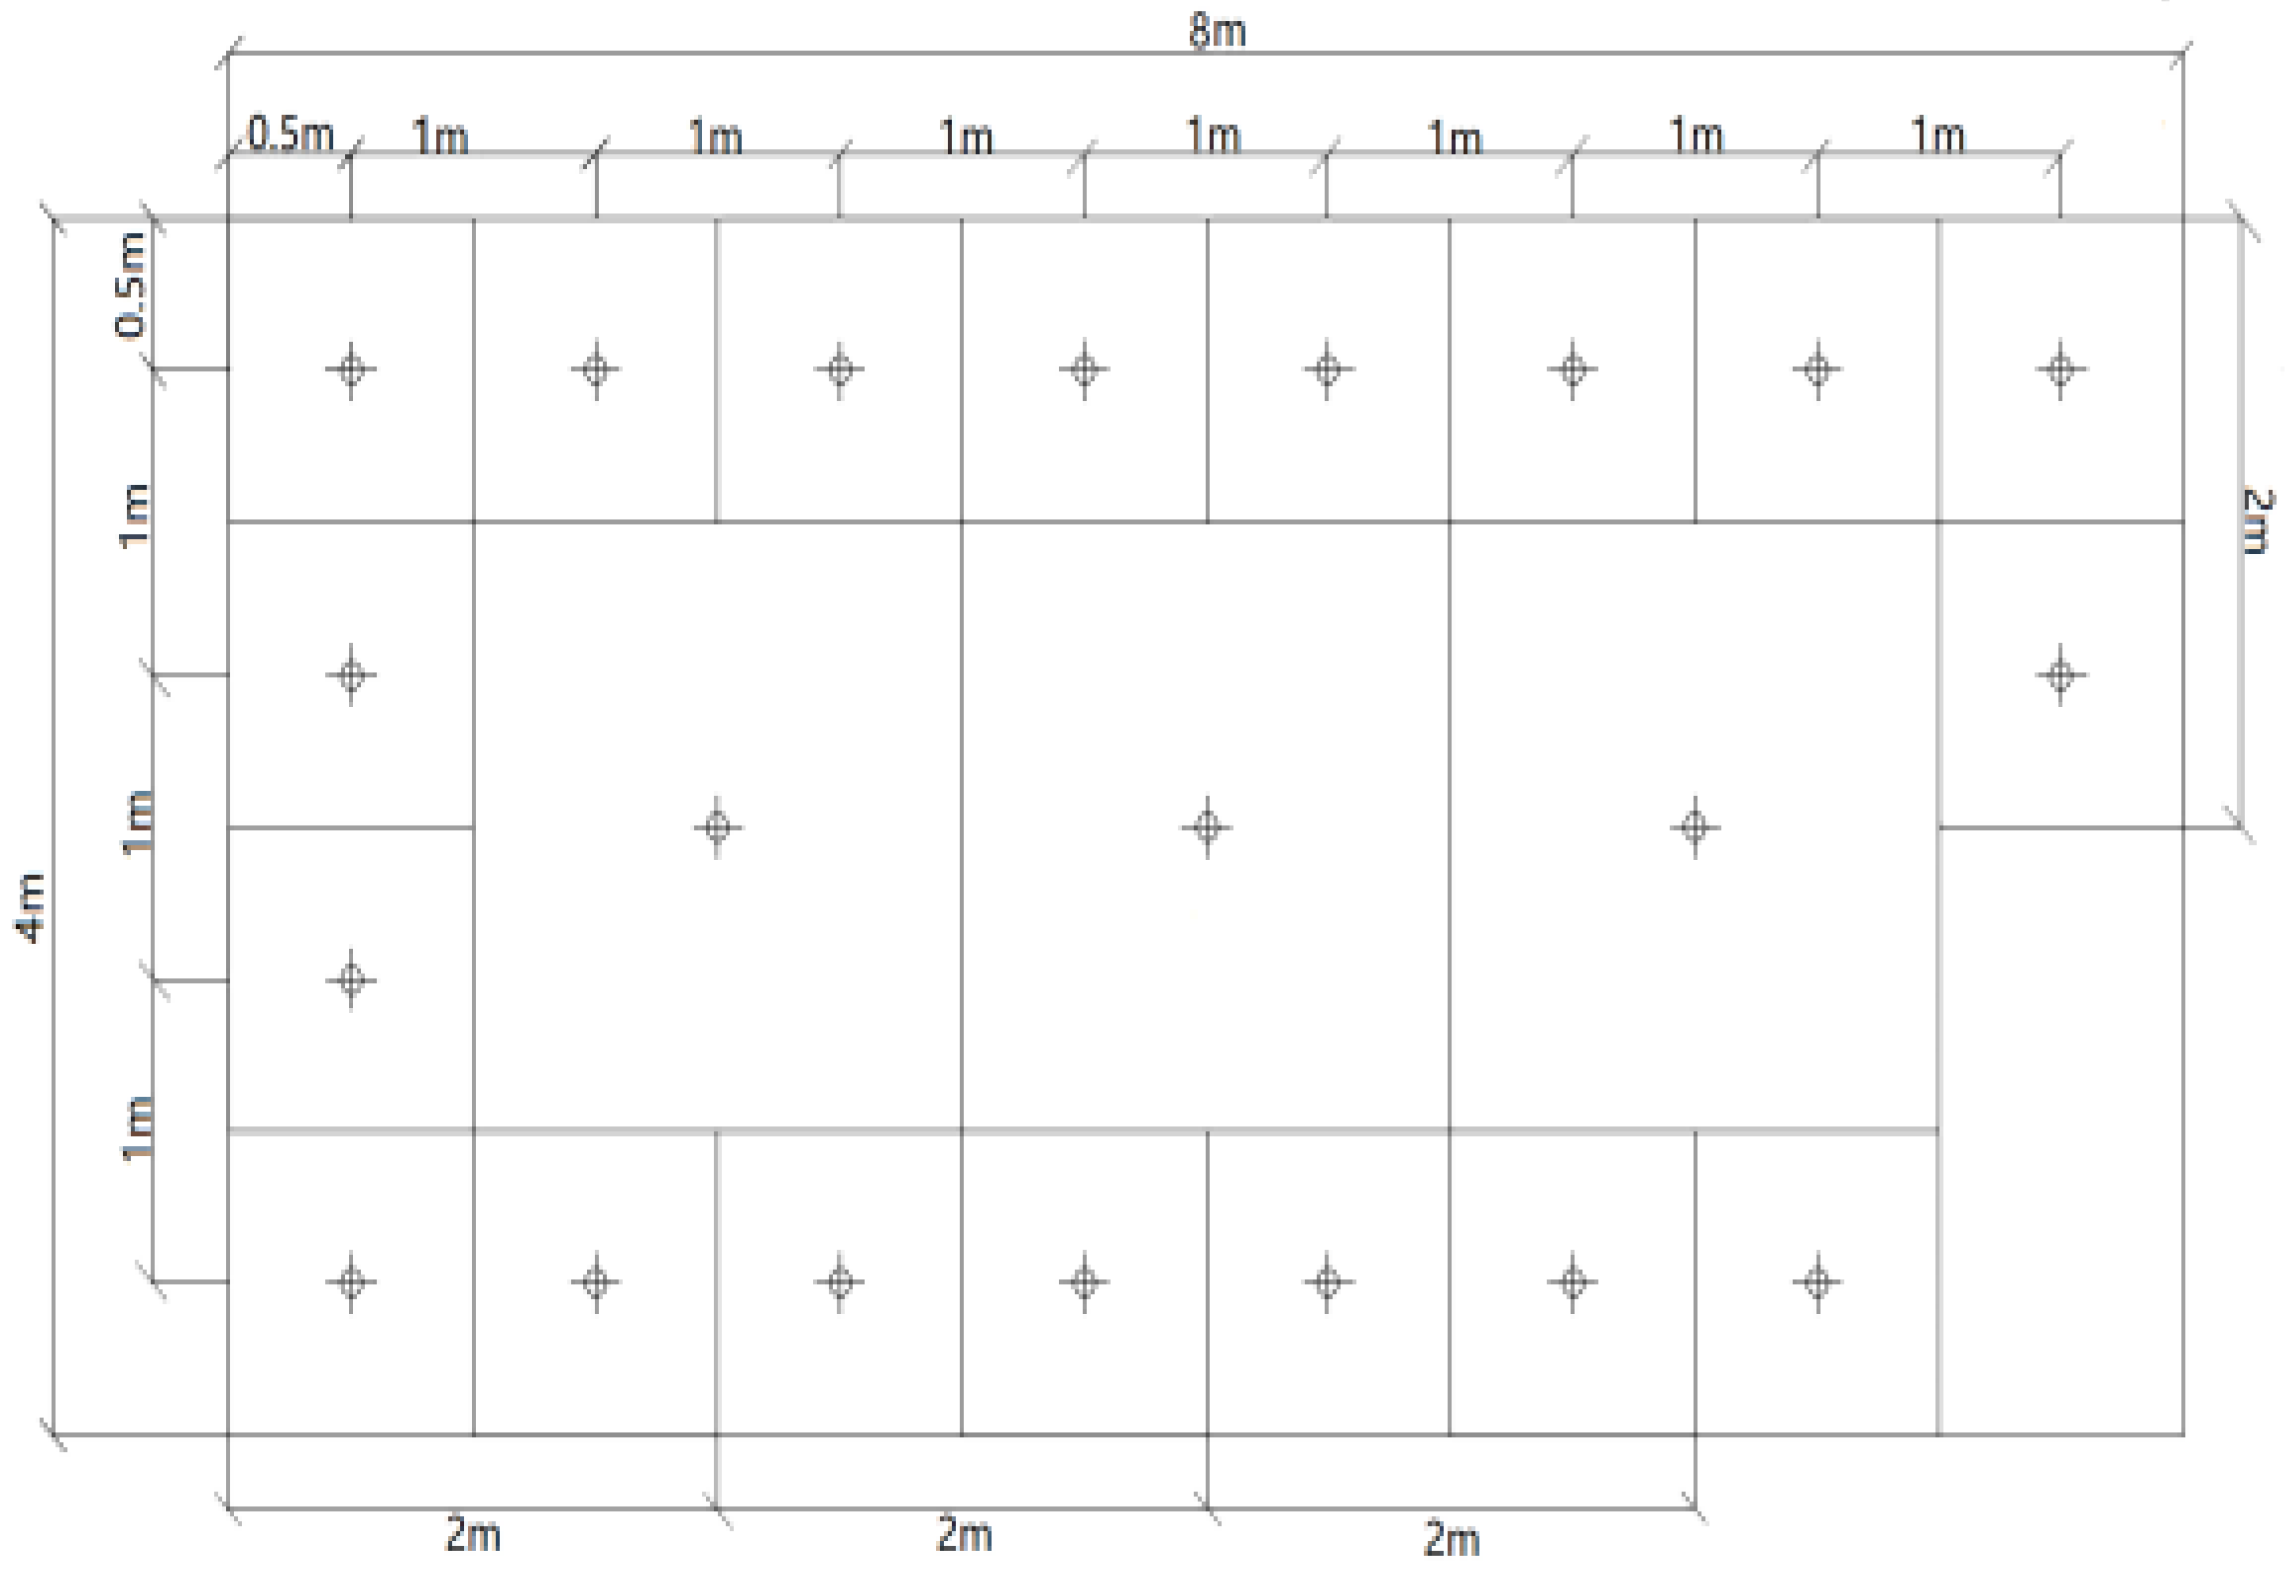
The effectiveness of the research simulation is verified by the field measurement of a university office on R418 of Changsha University of Science and Technology (Figure 1). The dimensions of the experimental room are 6 m long × 8 m wide × 4 m high. The adjacent room is set up as an air-conditioned room, with a set temperature of 26 °C and relative humidity of 50%.
According to the actual situation of the building, the parameters of the building envelope are shown in Table 1. Energy Plus was used to establish a model according to actual rooms to simulate the indoor air temperature, indoor air moisture and temperature of interior surfaces. The specific parameter settings in Energy Plus are given in Table 2.

2.2. Measurement

Indoor air temperature, indoor air humidity ratio, and internal surface temperatures of east, south, west, and north walls, ceiling, and floor in the R418 room were acquired by field measurement. The experiment was conducted from 1–30 May 2021 by continuous monitoring one-hour measurement interval. Experimental instruments for measurement are shown in Table 3.
The measuring instruments were arranged as follows:
1.
Measurement of indoor air temperature
In the R418 room, three mercury thermometers were hung at 1.5 m from the ground, 3 m from the west wall, and 2 m, 4 m and 6 m from the north wall, respectively, to measure the indoor air temperature at every hour. The average of the three mercury thermometers was taken as the indoor air temperature.
2.
Measurement of indoor air moisture content
An automatic temperature and humidity recorder was placed in the middle of the floor to measure the hourly temperature and relative humidity of indoor air. The indoor air moisture content was obtained in the psychrometric chart according to the measured dry bulb temperature and relative humidity of the indoor air.
3.
Measurement of the internal surface temperature of individual walls
Use a non-contact infrared thermometer to measure the hourly temperature of each measurement point. In the measurement of the internal surface temperature of the walls, considering the influence of thermal bridges on the arrangement of measurement points, on the surface of the wall near the beams and columns, the measurement points are densely arranged and slightly sparser in the centre. Taking the east wall as an example, a layout of the measurement points on the east wall (with the door on the east wall in the bottom right corner) is shown in Figure 2. The eastern interior wall area is 32 m2. Measurements were made at 21 measurement positions in the centre of each square marked on the east inner wall. The arrangement of measurement points for other internal surfaces of the test room were like those for the east internal wall.

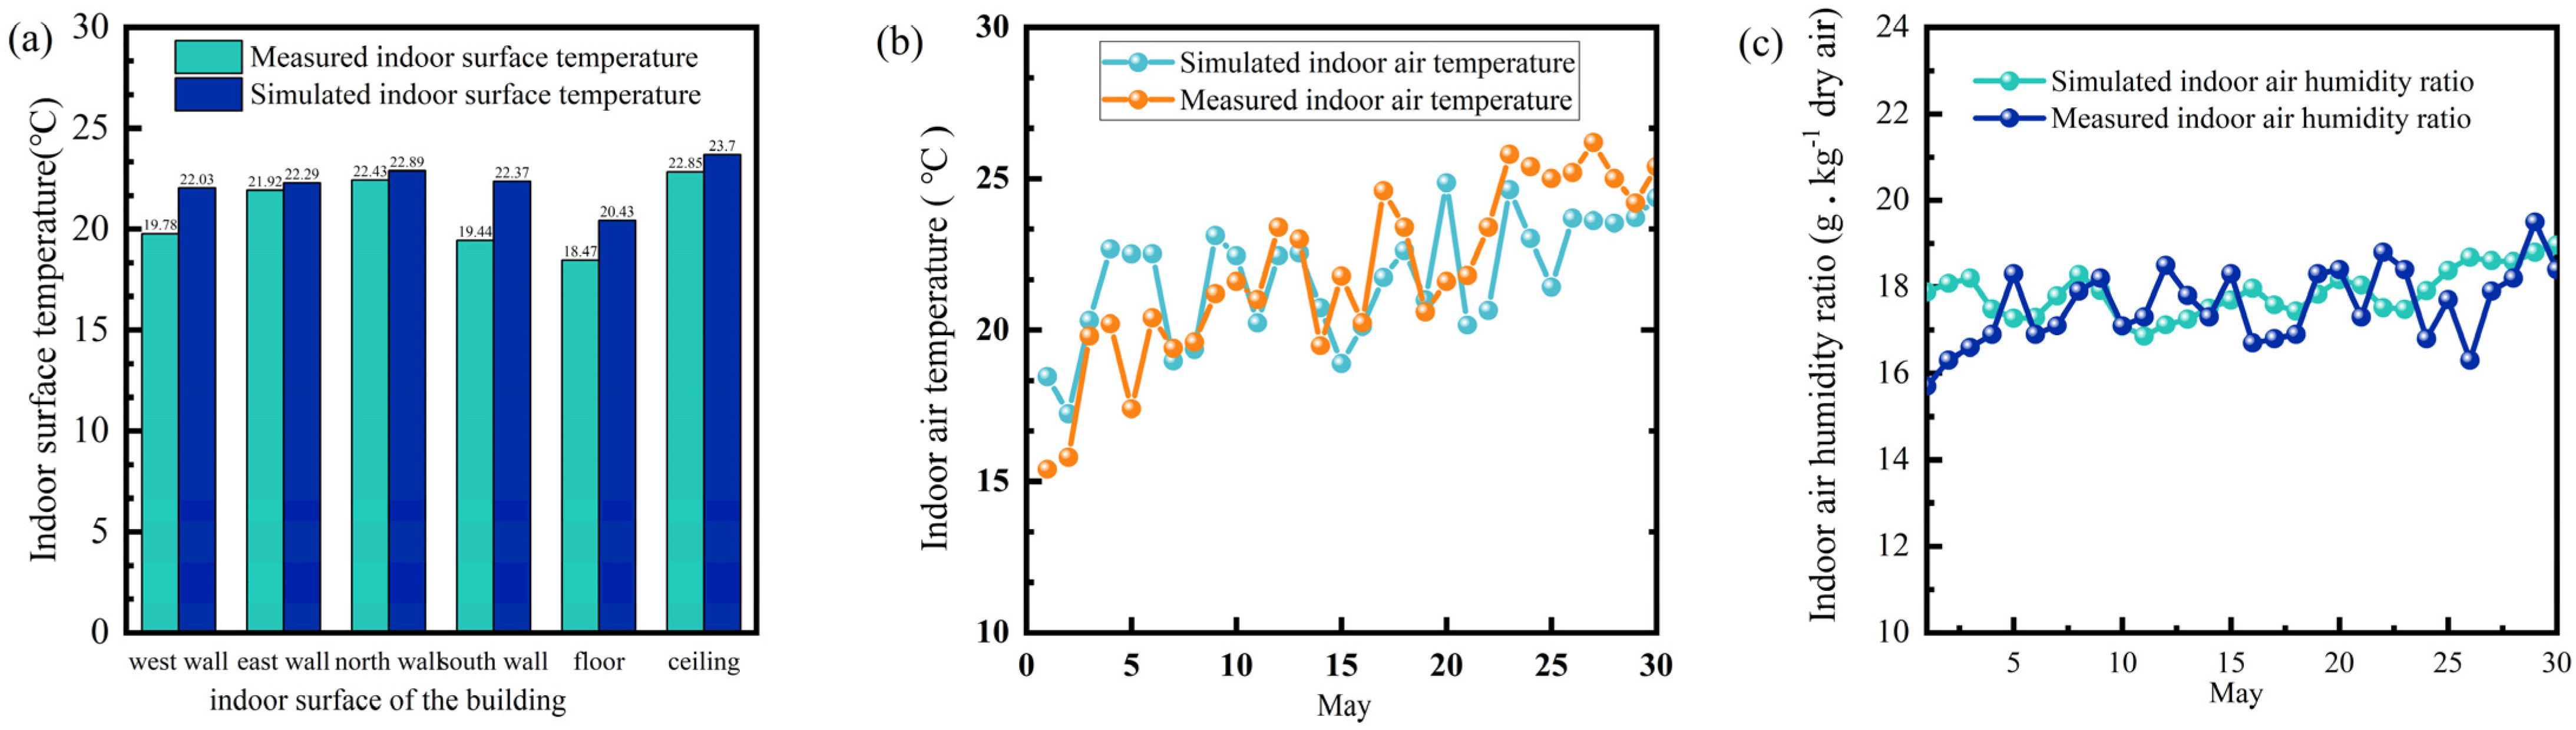
2.3. Comparison of Measurement and Simulation Results

Energy Plus was used to establish a model to simulate the indoor air temperature, indoor air humidity ratio and temperature of interior surfaces. Simulated parameters obtained from Energy Plus were quantitatively compared to the data experimentally measured to determine analytical errors, which are shown in Figure 3.
By calculating the relative error of the above data, we found that the relative error of the indoor air temperature is between 0.30% and 6.86%, and the error of interior surface temperature is between 1.05% and 3.97%. The error range of the indoor air humidity ratio was between 1.10% and 6.25%. A limited number of measurement positions or improper measurement operation may be the source of error. The small error proves that the simulation method used in this study is feasible.

2.4. Rural Residential Building Model

Taking full consideration of the characteristics of a typical residential building, referring to the spatial layout of a rural house in Changsha City, the SketchUp software (2017) was utilized to establish a model, as shown in Figure 4. The building is oriented to the south, with a floor height of 3.3 m and a total of 14 rooms. The effects of the rooms with typical humidity sources on condensation were excluded in this paper. Therefore, the bathroom was outside the scope of this study due to the large number of wet sources. A total of 72 internal surfaces in the wall behind the 2 bathrooms were excluded, with a total internal surface area of 1161.42 m2.
The external meteorological data used in this paper are the hourly meteorological data provided in the Energy Plus meteorological files for the whole year. As shown in Figure 5, the outdoor air temperatures varied between 15 °C and 35 °C throughout PRS, with maximum and minimum outdoor air temperatures of 37.6 °C and 25.2 °C, respectively. The mean outdoor air temperature was below 30 °C for two-thirds of the time, with half of the time below 25 °C, while the temperature was lower in May and rose gradually in July.

2.5. Building Model Parameter Settings

The relevant parameters of the enclosure are shown in Table 4, and all thermal resistance calculations met the applicable provisions of the GB 50176-2016 standard in the hot summer and cold winter regions [36].
The internal parameters of the building were set as follows. The number of occupants in the building and their activities are shown in Table 5. Lighting conditions and power densities in Energy Plus are given in Table 6. The per average calorie, moisture production and lighting power density were obtained from a review of the literature [37].

2.6. Indicators for Evaluating Condensation Conditions

Condensation can occur on the surface when the internal surface temperature is lower than the dew point temperature. The surface temperature of the interior wall and indoor dew point temperature will be obtained through numerical simulation in Energy Plus. In this study, we used three indicators, condensation frequency (CFn), condensation risk (CR) and condensation intensity, for evaluation [38].
The condensation frequency (CFn) is an indicator that expresses the ratio of the total hours when condensation has occurred to the 2208 h (May–July) for the wall surface n in the building and has six values (east wall, south wall, west wall, north wall, ceiling, floor) for each time step. When studying the condensation on the inner surface of the wall, the C F n can be used to intuitively see the condensation on the inner surfaces of the room, which is conducive to judging which inner surface of the wall is more serious. The condensation frequency C F n for wall surface n was defined using Equation (1).
C F n = t = 0 2208 I C n , t 2208
where ICn,t is the occurrence of condensation (judgment = 1) or the absence of condensation (judgment = 0) on interior surfaces (n = 1,2……72) during PRS (t = 0,1,2…2208 h).
CR is defined by Equation (2). It is an indicator calculated based on the CFn of all walls in a building, which can be used to assess the condensation situation of a whole building when studying the indoor humidity environment.
C R = n = 1 72 C F n A n n = 1 72 A n
where An is the total area of the interior surfaces (n = 1, 2,……, 72). As indicated above and in Figure 5, due to the large number of wet sources, the bathroom was outside the scope of this study. The total area of the 72 surfaces of a simulation model was 1161.42 m2.
Both condensation frequency (CFn) and condensation risk (CR) are ratios of magnitude between 0 and 1. The larger it is, the more serious would be the condensation phenomenon in the building. The difference between them is that the CFn evaluates condensation on individual surfaces, while the latter judges condensation on the whole building.
When condensation occurs, the indicator of dew point temperature above the temperature of the interior surface is the condensation intensity; the more significant the temperature difference, the more serious would be the condensation situation. The condensation intensity will be divided into four levels, which are as follows: 0 °C < Δ t ≤ 1 °C, 1 °C < Δ t ≤ 2 °C, 2 °C < Δ t ≤ 3 °C, Δ t > 3 °C [39]. The ratio of the number of hours of each condensation intensity to the number of hours of condensation in each month was obtained, which was used for evaluating the distribution of the condensation intensity on the internal surfaces.

2.7. Simulation Procedures

Experiments were conducted to analyse the effects of different window opening patterns on the condensation on the inner surfaces of the envelope during PRS in Changsha (May, June and July), with degrees of window opening subdivided into 0, 0.25, 0.5, 0.75 and 1, and the window opening duration covering the whole day. The window types studied in this paper are casement windows. The schematic diagram of the window is shown in Figure 6. In terms of the definition of window opening degrees, When the opening angle of the sliding window reaches 22.5°, we consider that the opening degree is 0.25, and the subsequent opening angle increases by 22.5°, the definition of the opening degree increases by 0.25 (Figure 6).
The overall flowchart of this study is shown in Figure 7.

3. Results and Discussion

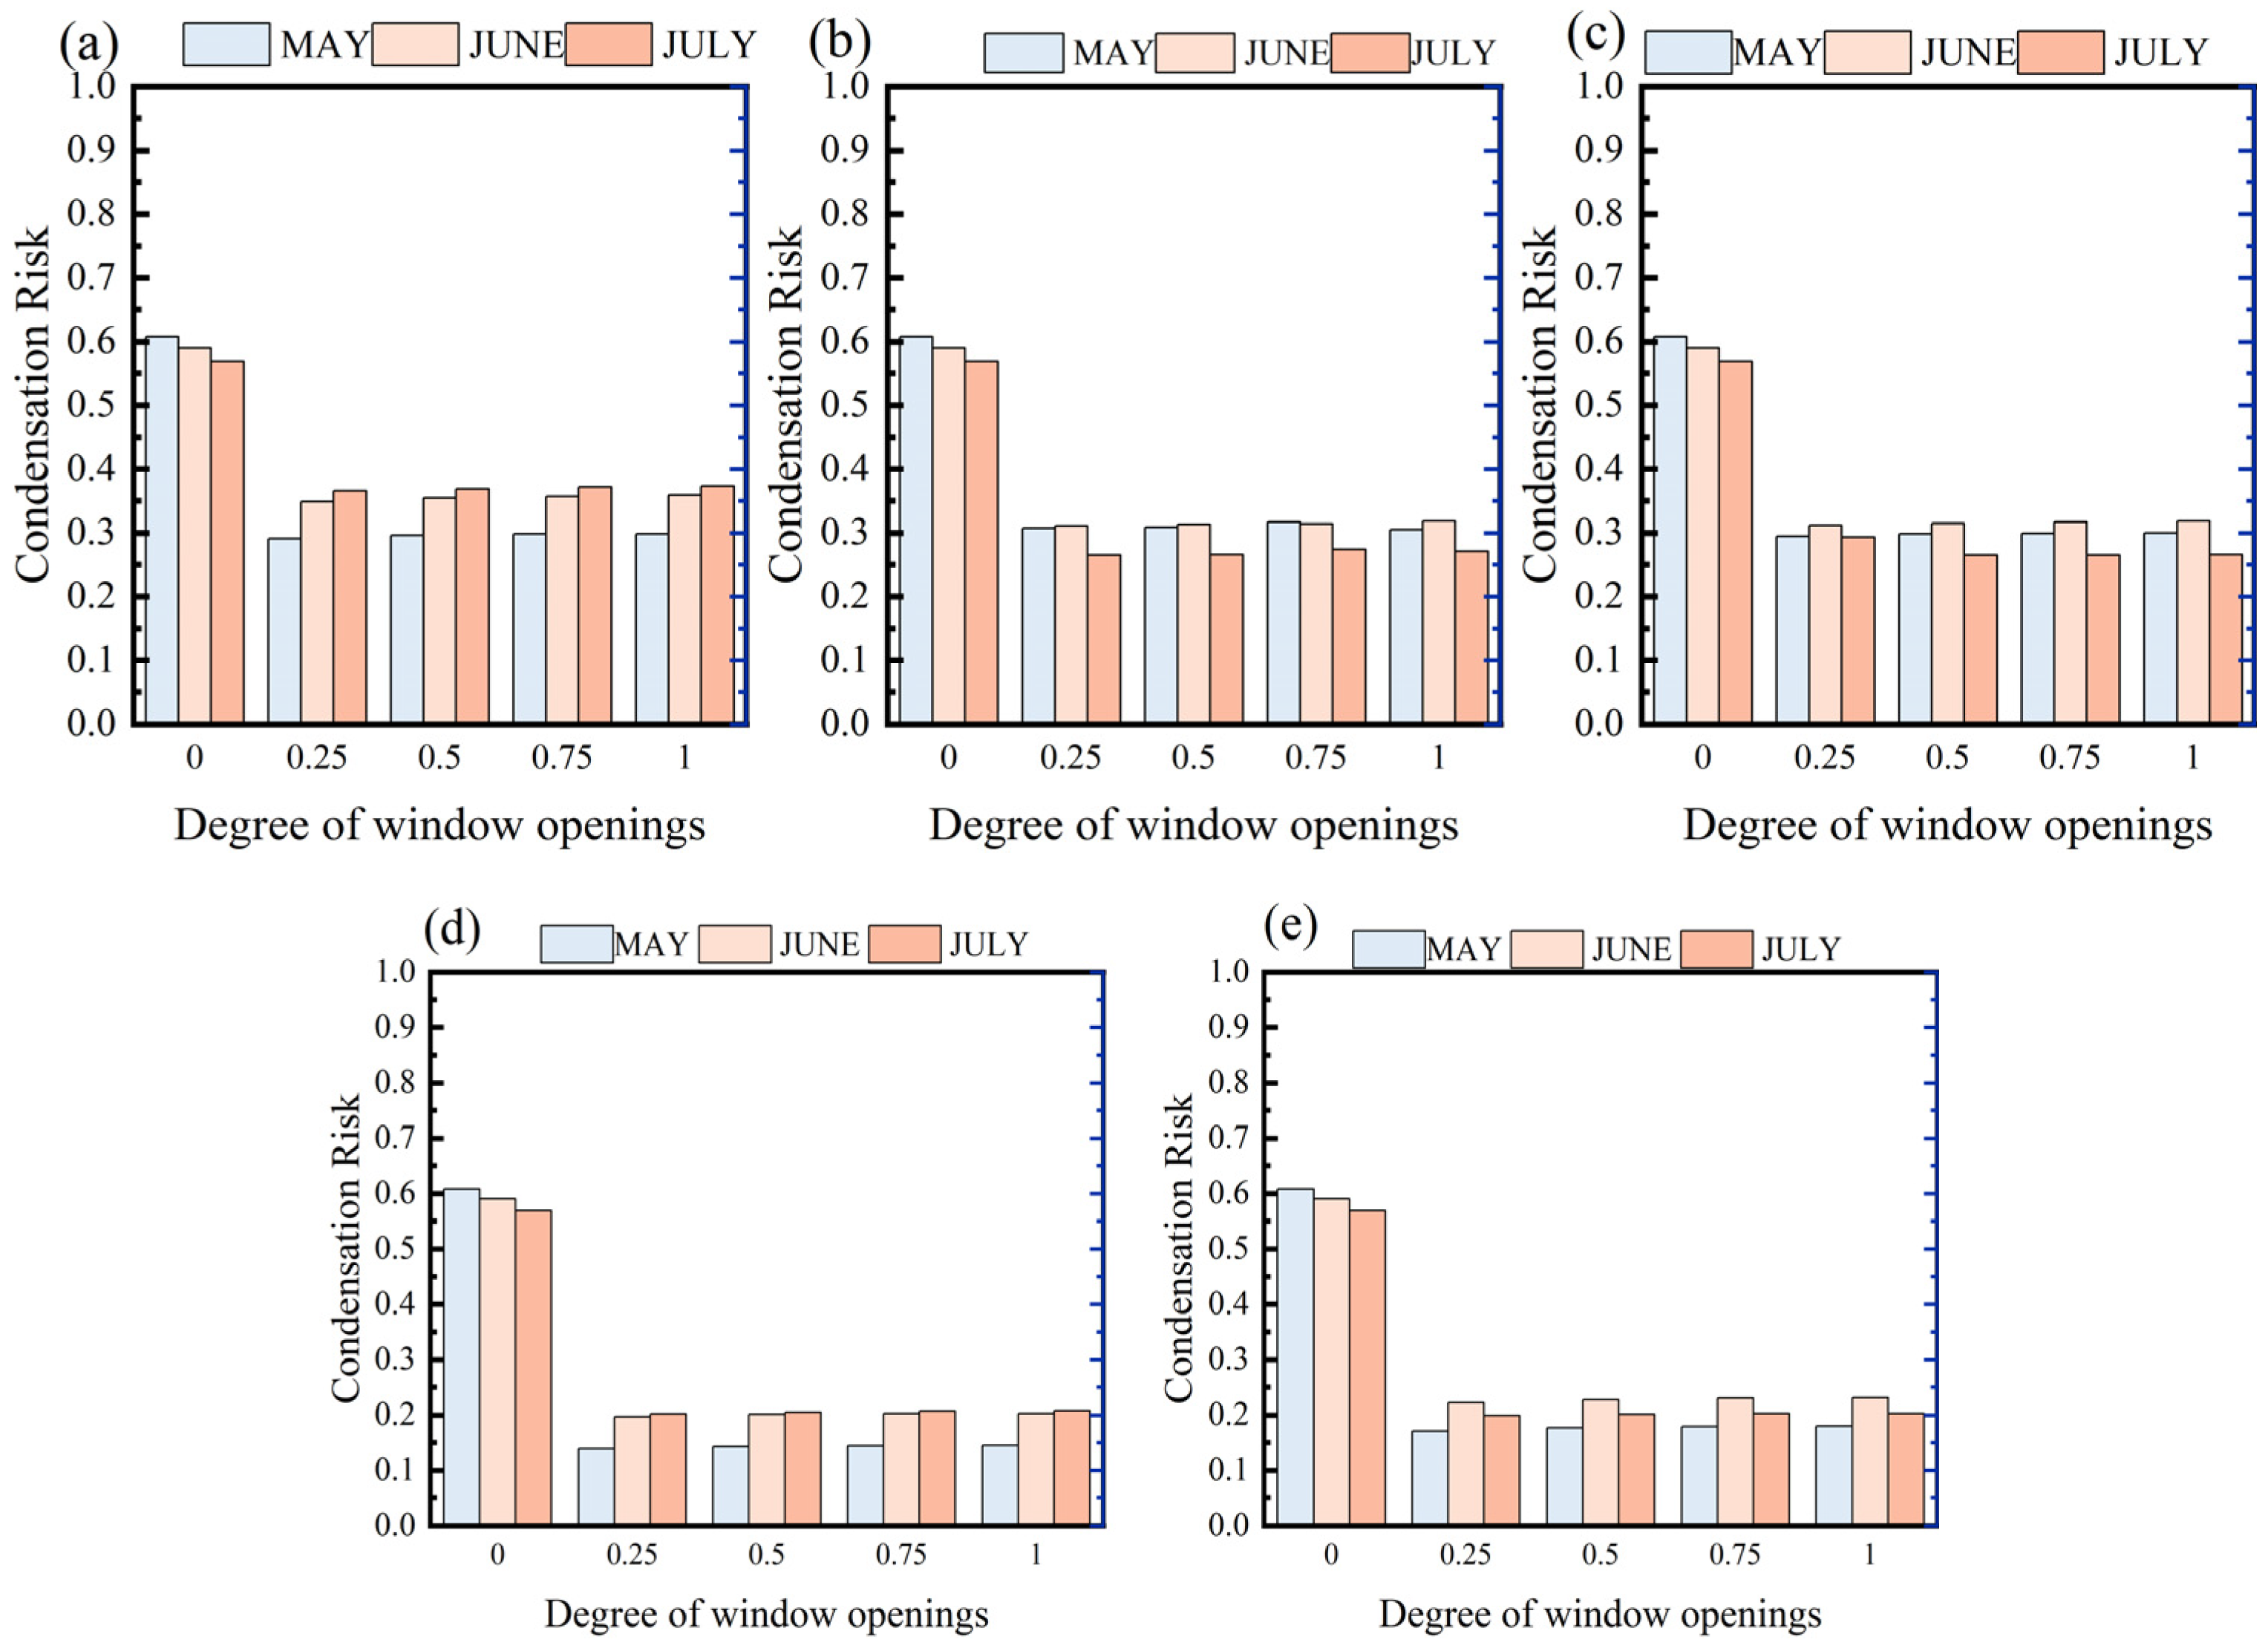
3.1. Effect of Windows Opening Degree on Indoor Humidity Environment

Figure 8a shows the CFn of each wall with different degrees of window openings when the window is open during 15:00–18:00. The CFn of each surface with an opening of 0 was the highest, in which the CFn of the floor was 0.985, which means that condensation occurred almost all day long. The CFn of the ceiling was 0.680, which occurred more than half of the time. The CFn of the southern wall, western wall, eastern wall and northern wall were less than 0.50. When the degrees of window openings were 0.25, 0.5, and 0.75, respectively, the variation in CFn was not significant. The CFn of the floor was higher than 0.30, while the CFn of other surfaces were lower than 0.10, which was considered not serious.
Figure 8b shows the CR in May, June and July with different degrees of window openings when the windows are open during 15:00–18:00. We found that when the openings were 0, the CR of every month was higher than 0.500. When the windows are open, the CR was highest in July and lowest in May with the same degree of opening.
The variation trend in the CR with different window opening degrees was not apparent when the window was open, which means the main factor that affected the CR was whether the window was open in this model. The above findings were also found under the other window opening periods, as shown in Figure 9.
Also, we obtained the CRs of the whole building when the window was opening at different opening degrees and different opening durations during PRS (Table 7).
It is clear from the data mentioned above in Table 7 that the overall condensation risk of the whole building throughout the PRS varied very little between opening degrees but varied significantly between opening duration, which is another valid proof of the conclusion that the main difference in CR was caused by window opening duration, and the effect of different degrees of window openings was much weaker.

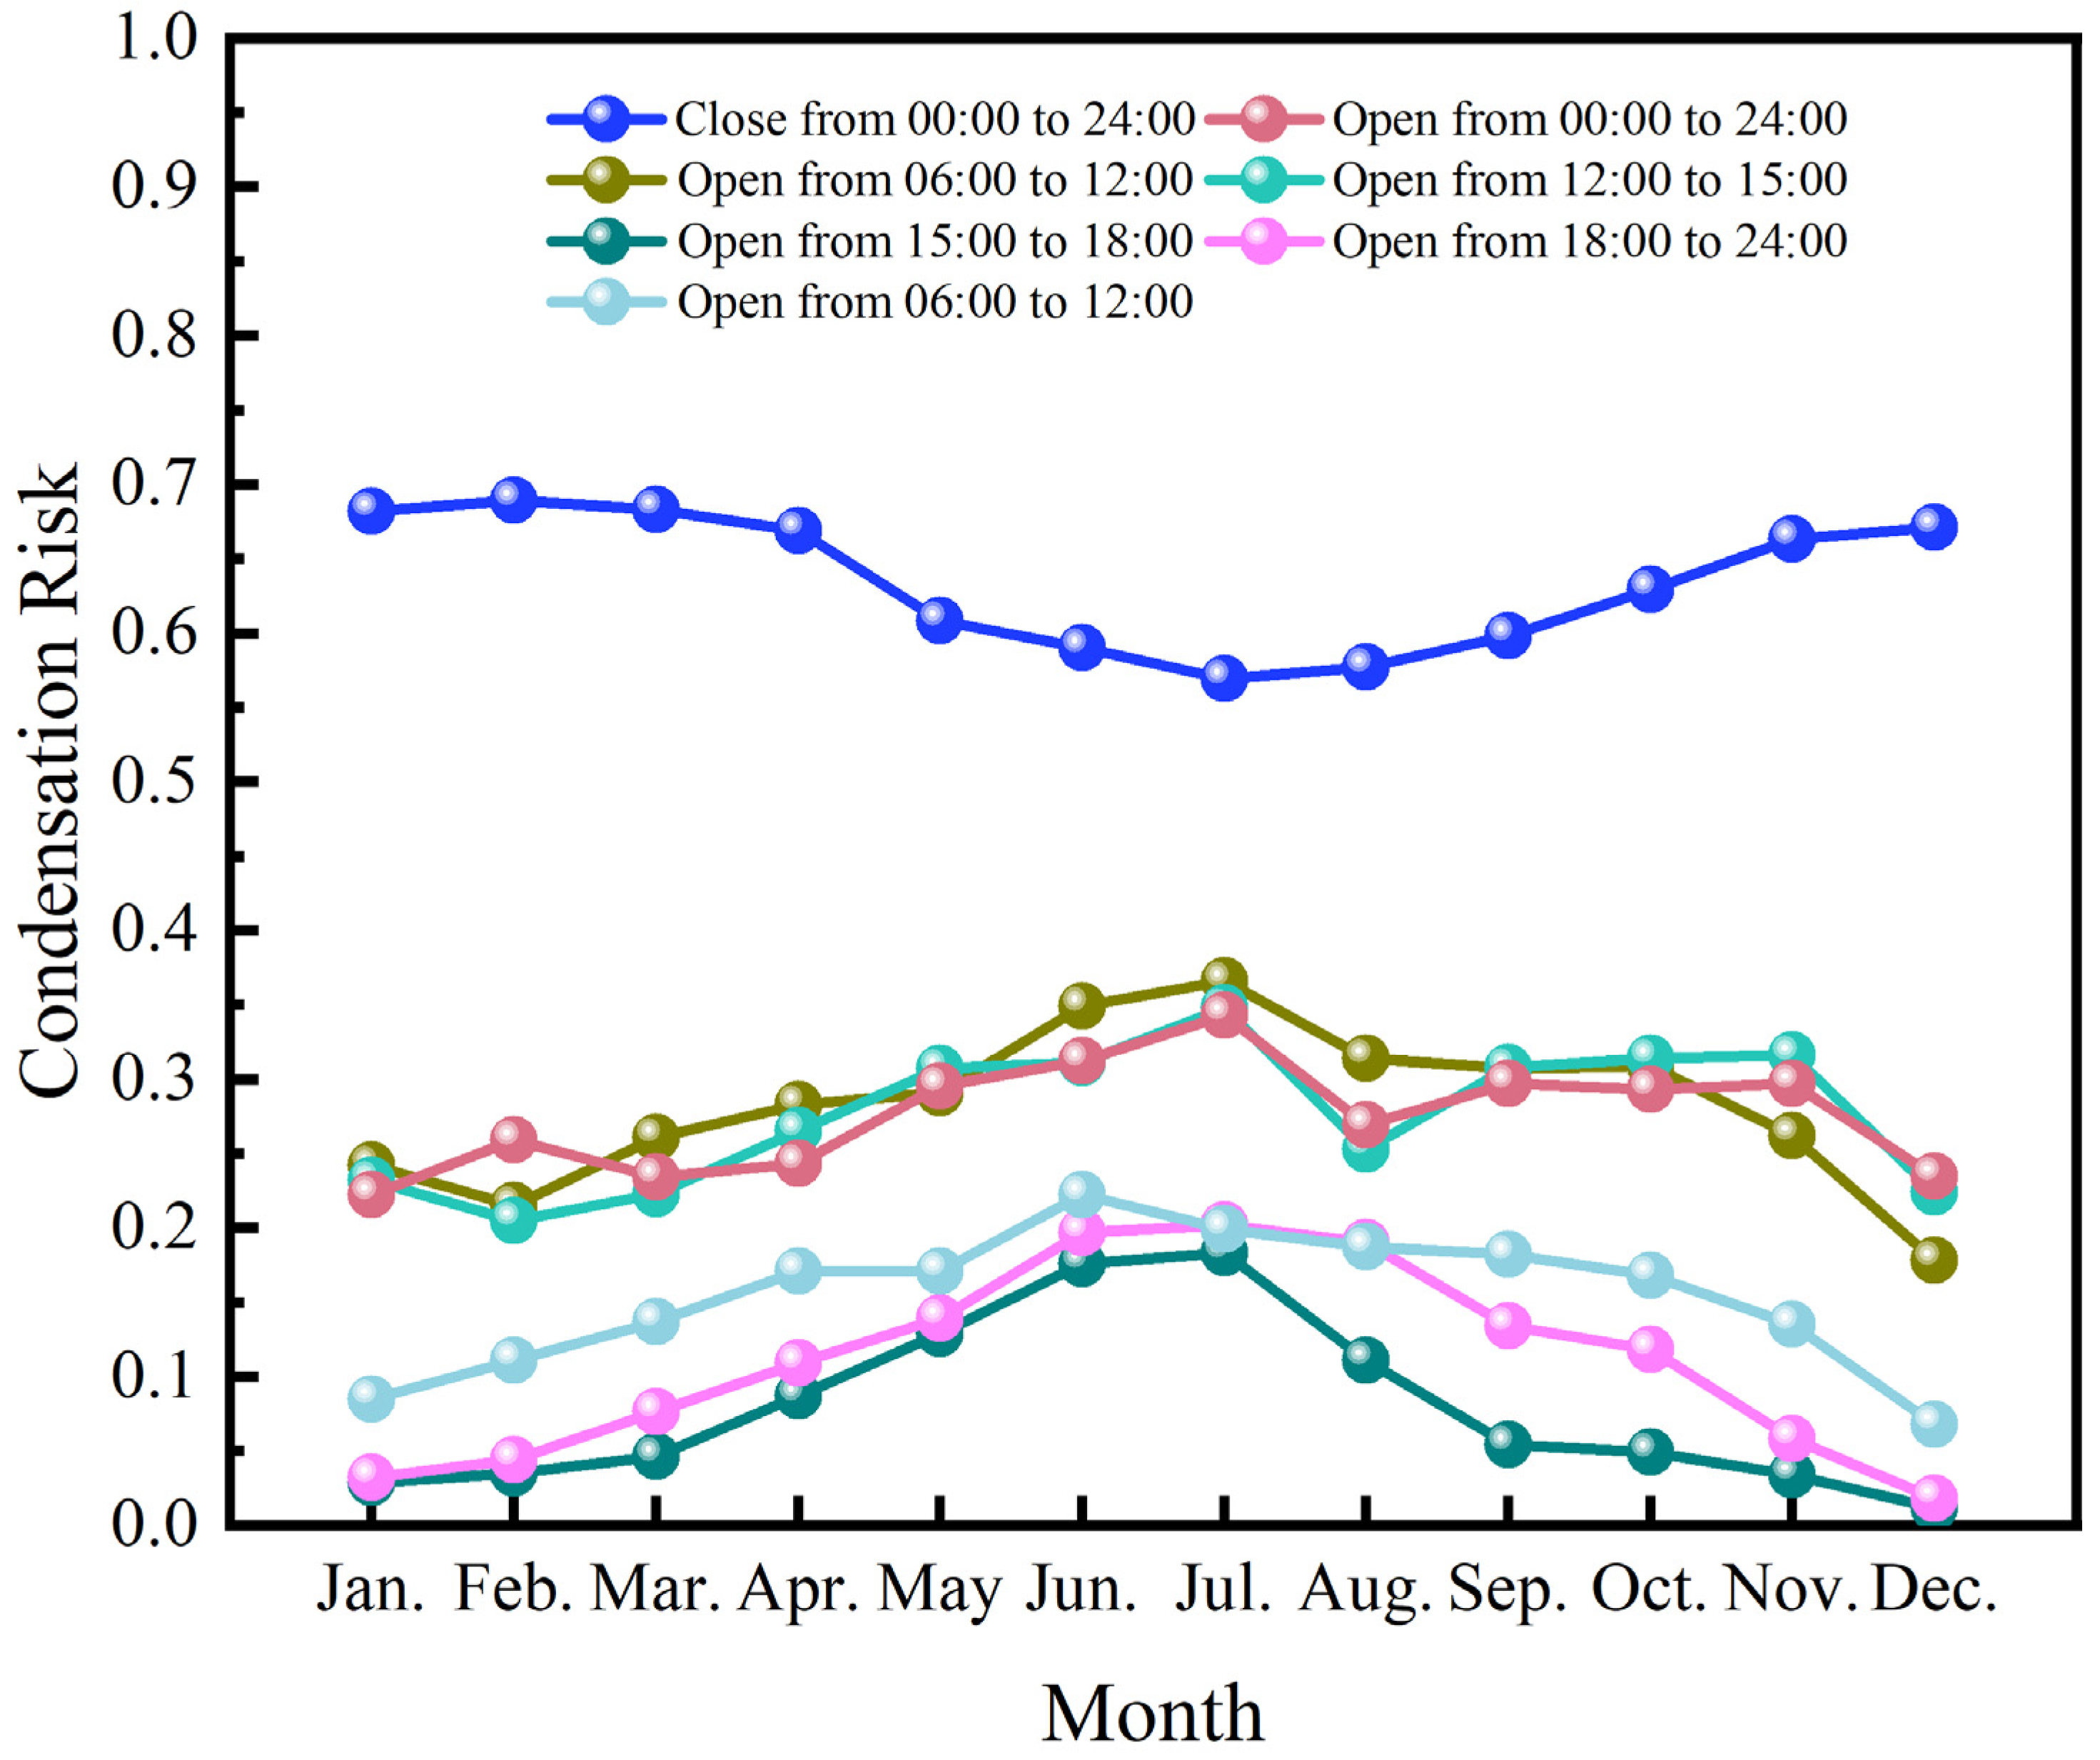
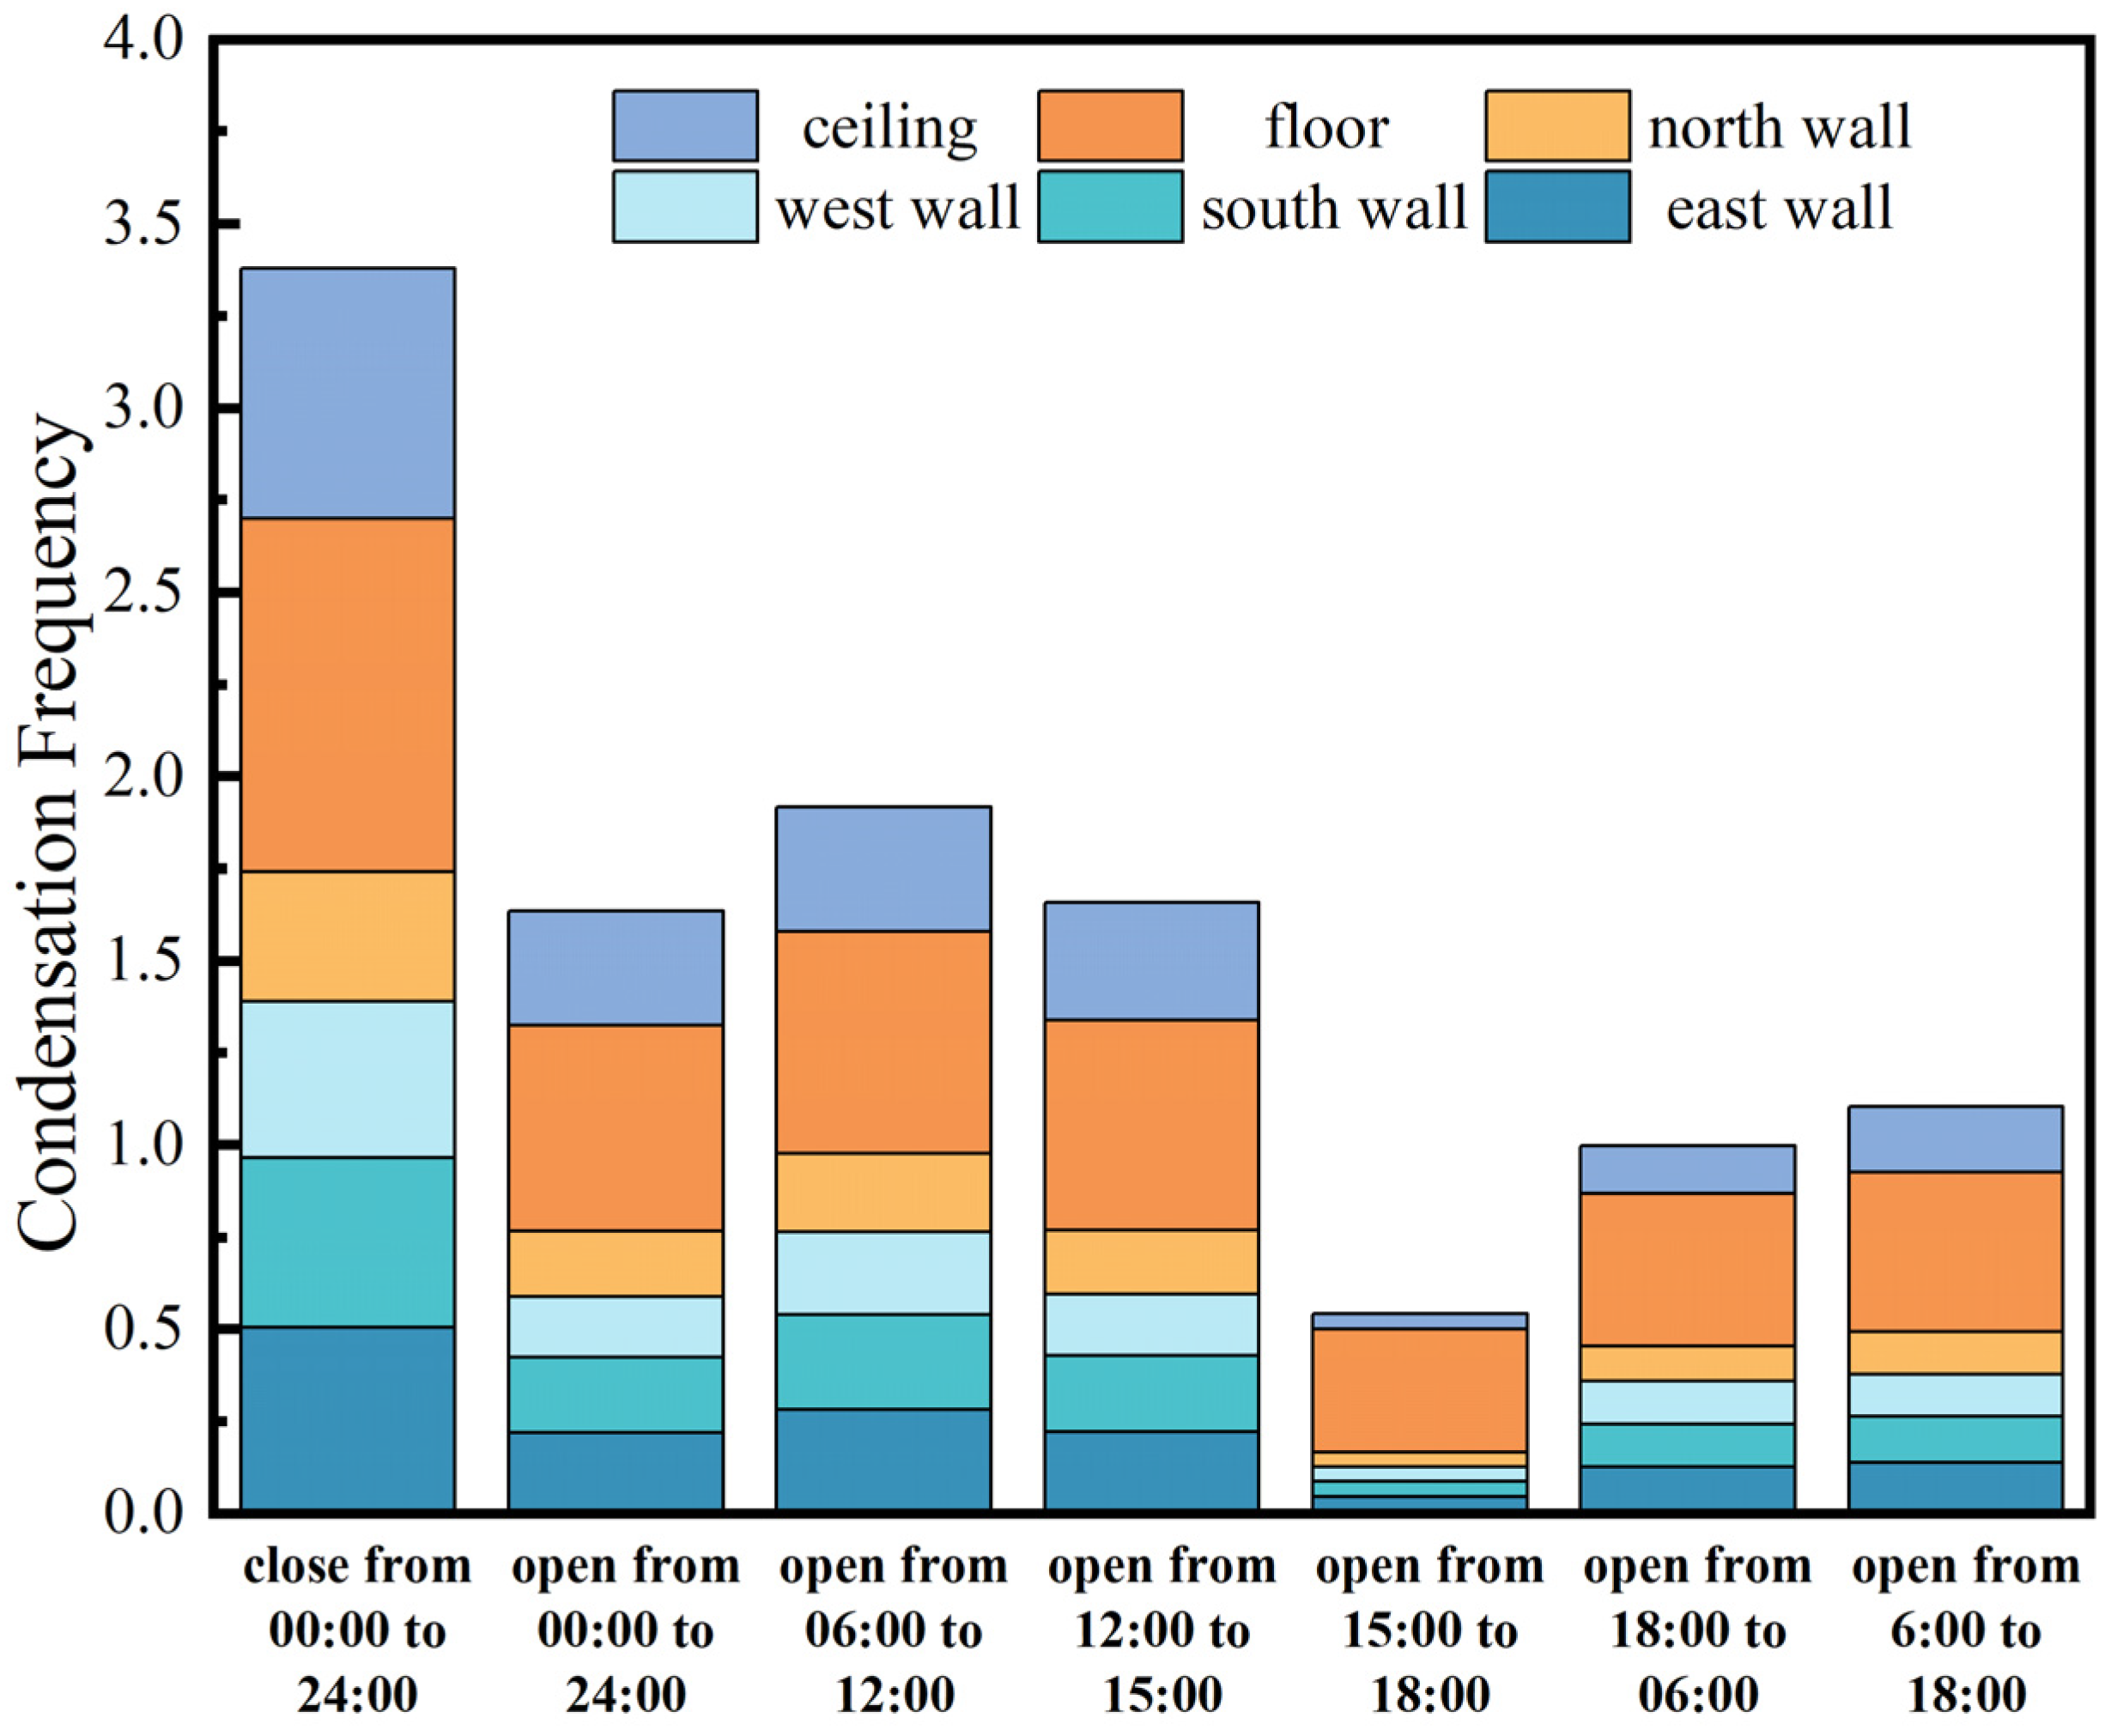
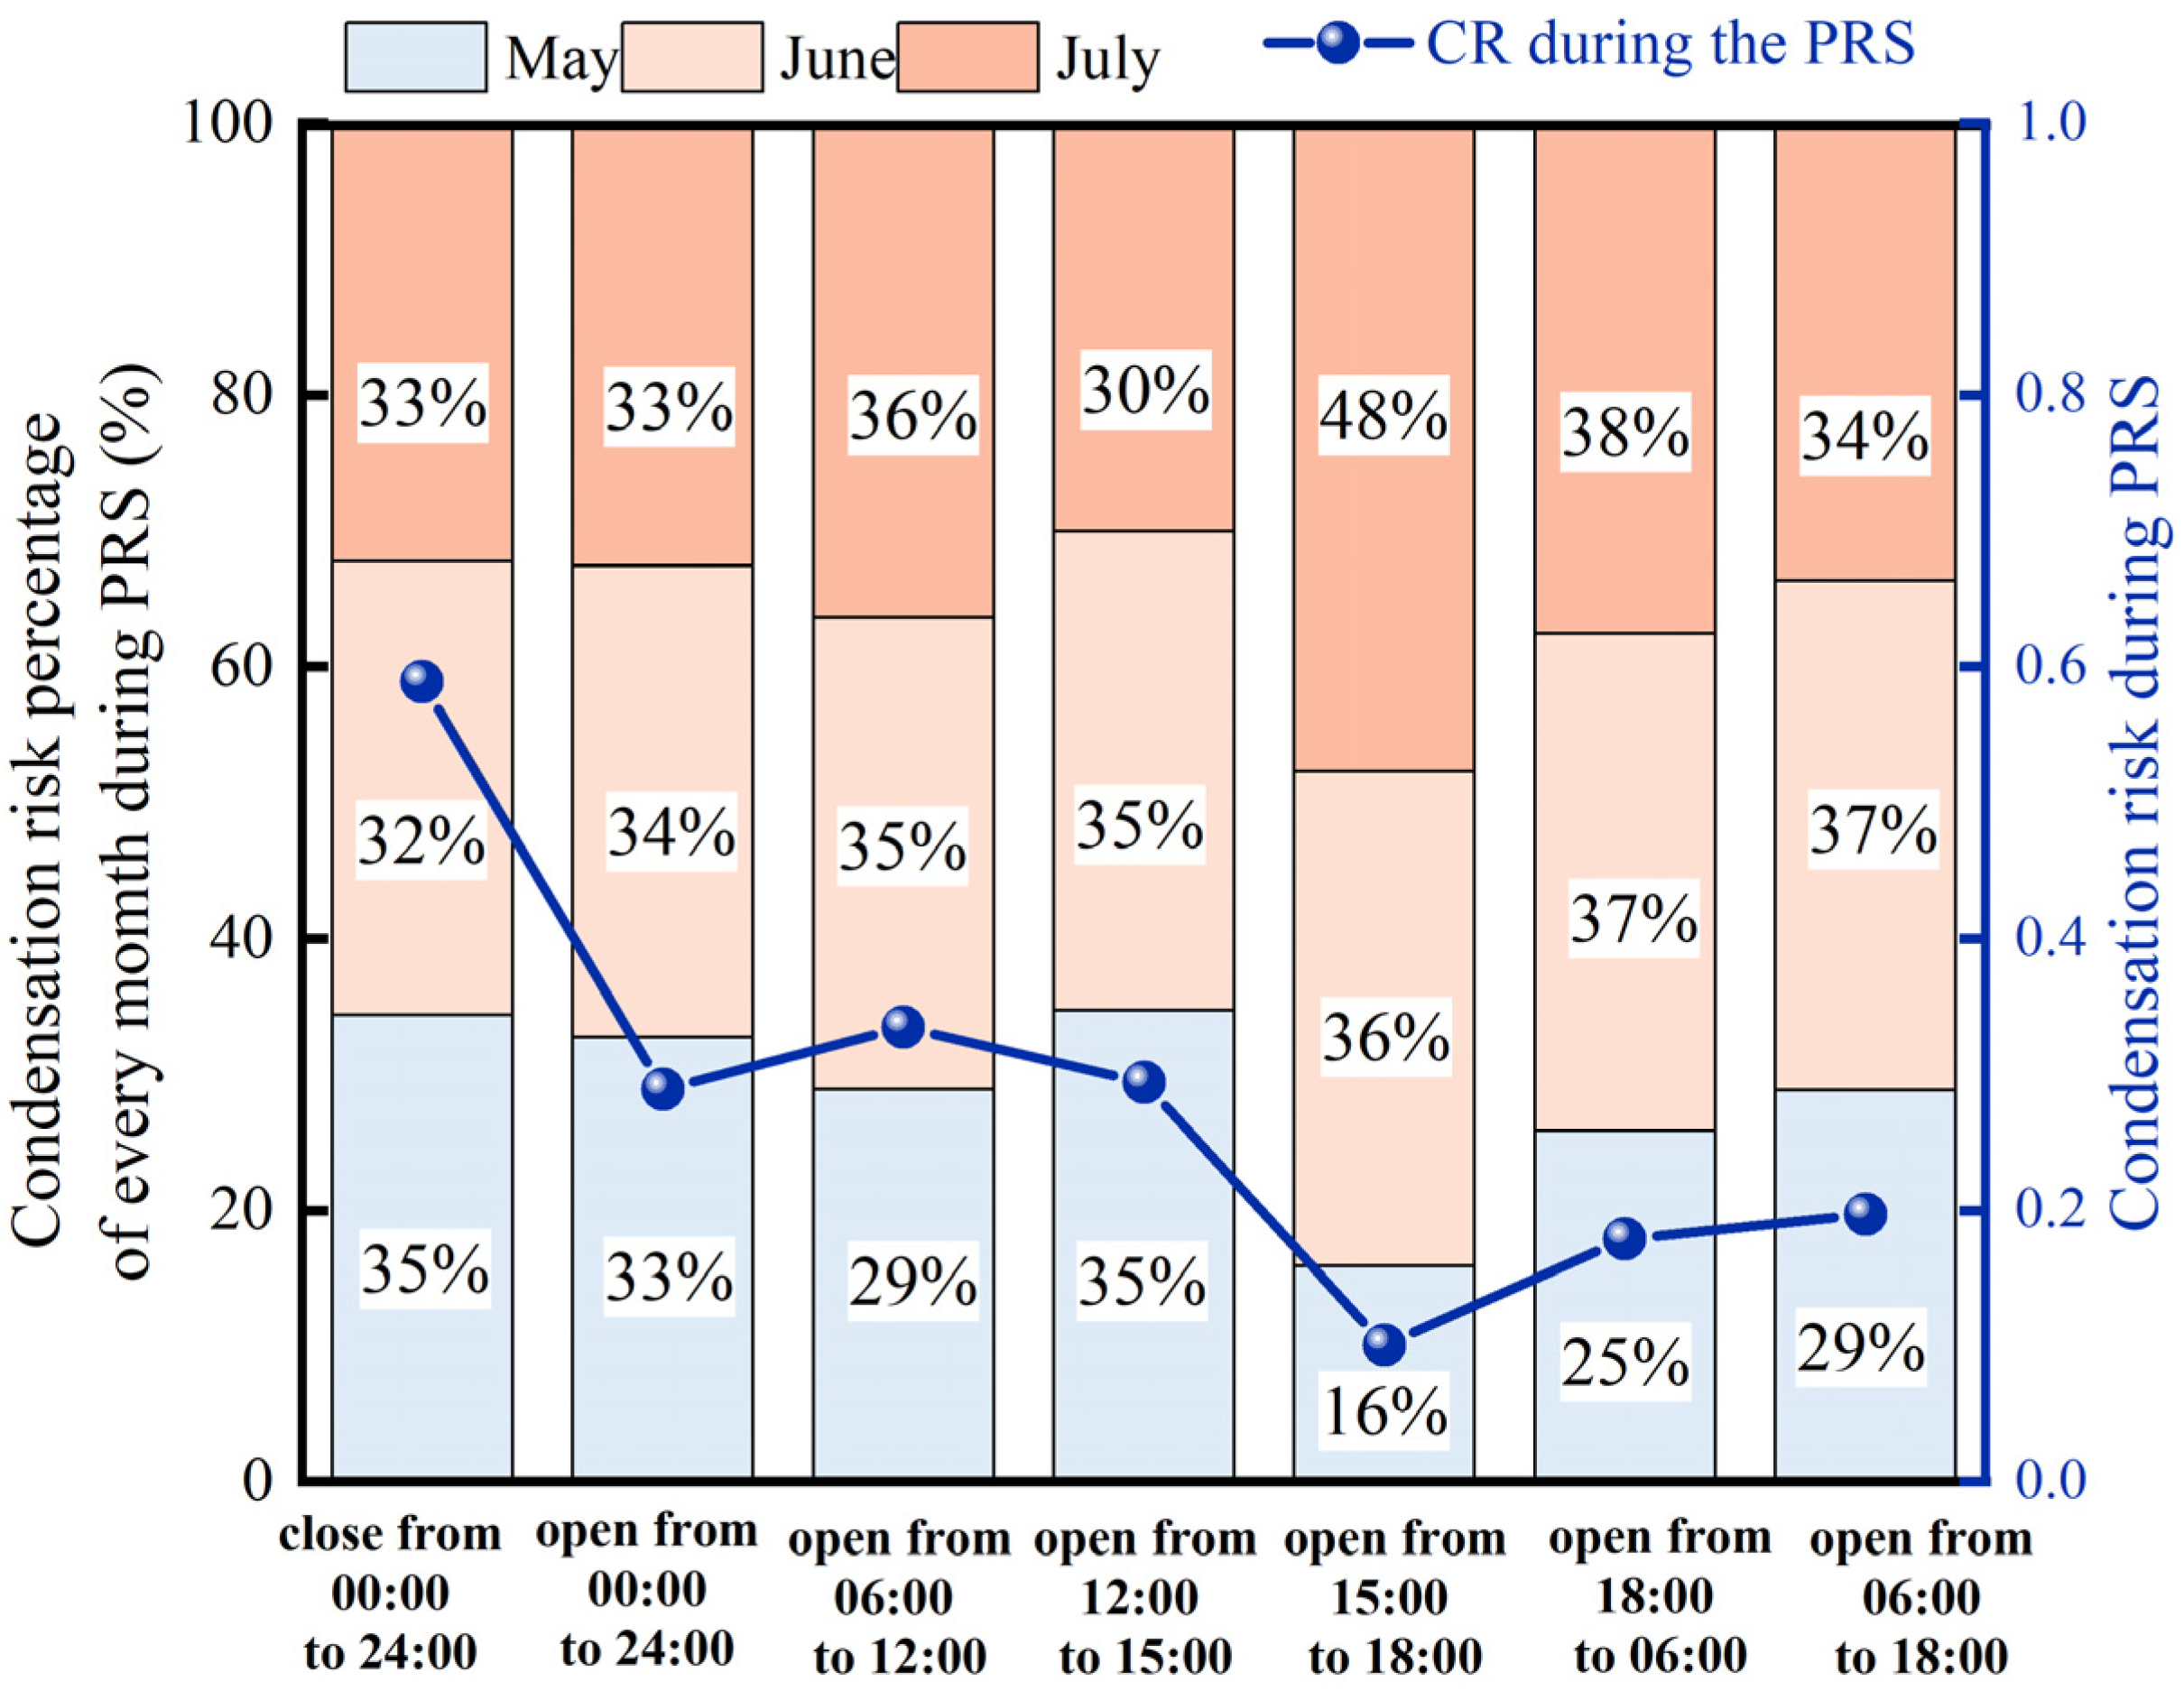
3.2. Effect of Window Opening Duration on Indoor Humidity Environment

By exploring the condensation situation of different window periods with the same degree of window opening, the effect of window opening periods was analysed. The following analysis of selected data shows the impact of the window opening time with the opening degree of 0.25.
By analysing Figure 10, the following conclusions were obtained:
  • Long-term window closing prevents moisture generated by indoor occupant activities from escaping, and the accumulated moisture could significantly increase the CR on the interior surfaces. Thus, the CR curve for all-day and all-night window closures was much higher than other periods.
  • When the window was open in the morning, in the noon and in the late afternoon during the PRS, their annual CRs were 0.335, 0.294 and 0.149, respectively. The CR of window opening in the morning was the highest of three, which was affected by the daily cycle of variations in temperature and humidity. The air temperature and humidity rise rapidly in the morning, while the ground temperature and the internal surface temperatures of the enclosure structure rise slowly so that when the window is open in the morning, condensation is more likely to occur. Furthermore, the humidity of early morning in PRS is close to saturation, and the cold, moist outdoor air is denser; when sinking and rapid contact with low-temperature surfaces, a sudden increase in local humidity accelerates condensation. In the afternoon, when the outdoor air temperature is higher, warm and humid air mobility is stronger, so the indoor environment is mixed more uniformly, and moisture is not easy to gather local condensation. Moreover, the surface temperature rises after heat absorption. Therefore, compared with the other two time periods during the daytime during the PRS, windows should be open in the afternoon to alleviate the risk of indoor surface condensation.
  • The annual CR of windows opening during the daytime and windows opening at night was 0.153 and 0.150, respectively. The CR curve of windows opening during the daytime was higher than windows openings at night, which is due to the fact that when windows are open during the daytime, more water vapour is fed into the room in a short period of time than at night, resulting in a rapid rise in dew point temperature. Because outdoor air temperature is high, barometric pressure gradients are high; air movement is fast, so the rate of air exchange is higher in the daytime. At the same time, the air temperature in daytime in PRS is high (28–32 °C) with high moisture content (20–22 g/kg dry air). Although the relative humidity may be slightly lower than at night, the dew point temperature of the air is higher because of the high temperature in the daytime.
  • The annual CR of all-day and all-night window openings was 0.289, while the highest CR was 0.343 in July. The CR rose during the PRS due to increased outdoor air moisture content during PRS and the entire exchange of outdoor air with indoor air when the windows were fully open throughout the day and night.
As shown in Figure 11, the floor has the highest percentage of CFn under different window opening durations, and the average CFn for the floor was 0.551. This is because of high soil moisture content and a significant reduction in ground temperature due to rainwater infiltration and evaporative cooling (usually lower than indoor air temperature). Concrete floors have less thermal resistance than other surfaces, which means that they are susceptible to soil temperatures, which are slow to warm up and prone to condensation. At the same time, opening windows may introduce more moisture during the PRS; indoor moisture collects near the floor due to the sinking of cold air, creating a localised area of high humidity.
The next highest CFn was the ceiling, with an average CFn of 0.286. Except for the all-day window closure, the CFn at the east, south, west, and north walls did not differ much for the rest of the windows opening duration.
From Figure 12, although the CR was higher for all-day and all-night with the window close, the percentage of CR for each month did not differ much, and the percentage of CR in May, June and July was 34%, 33% and 32%, respectively. This is because condensation, in this case, is mainly caused by the accumulation of moisture in the building.
The difference between May, June and July in the percentage of CR with windows opening in the afternoon (15:00–18:00) was significant, with only 16% in May and 48% in July; at the same time, the condensation risk during the whole PRS is lowest under the windows opening period. This means windows opening in the afternoon could alleviate the less severe condensation in May but could not be as effective in July when condensation is more intense because the increase of outdoor air temperature leads to the increase in indoor air temperature and air dew point temperature, while the temperature of the inner surface of the wall rises slowly because of the heat preservation performance of the enclosure structure. Thus, condensation in July accounts for the majority of condensation in PRS when windows open in the afternoon.
From Figure 13:
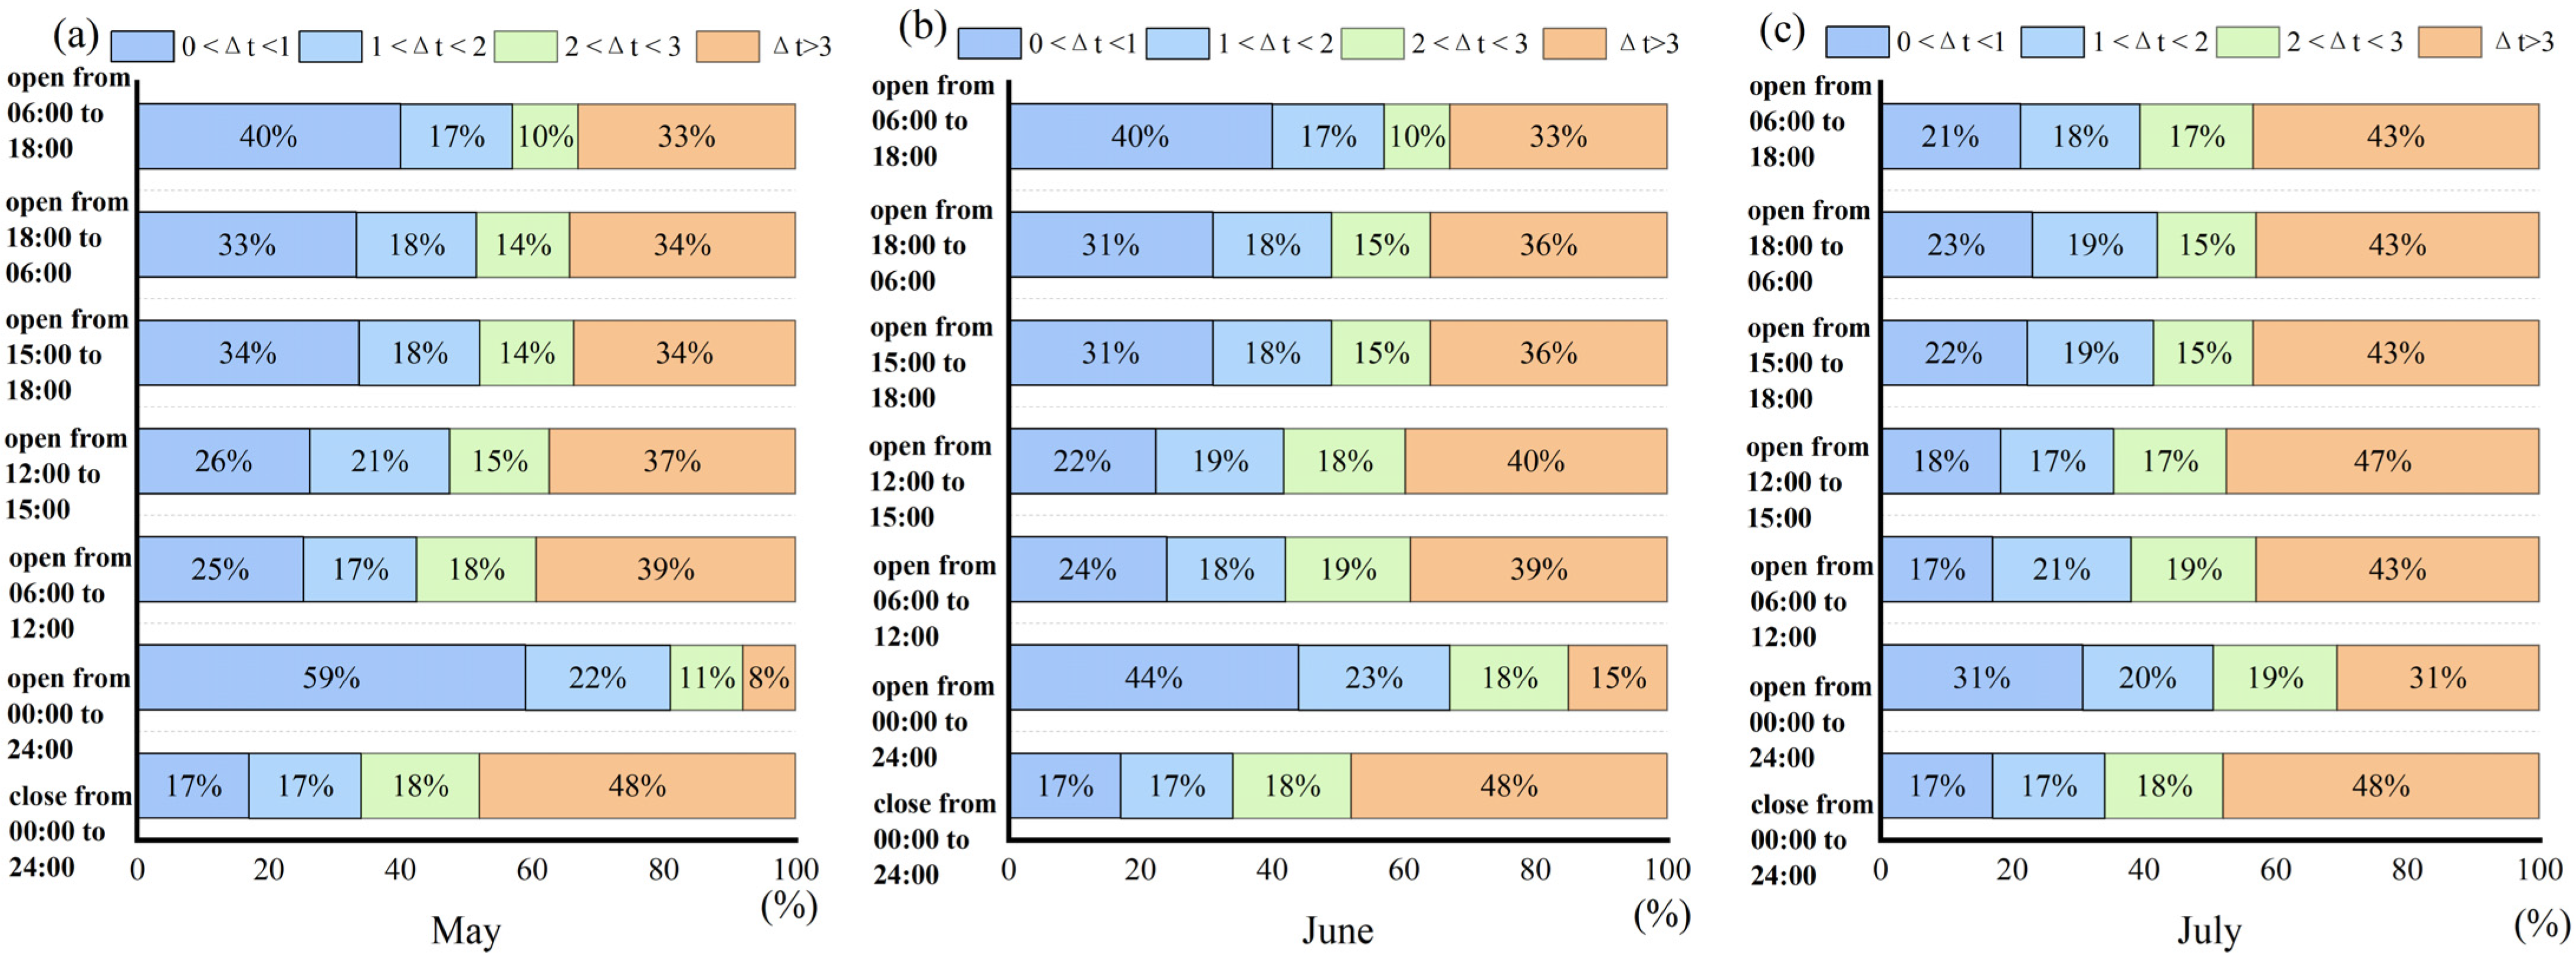
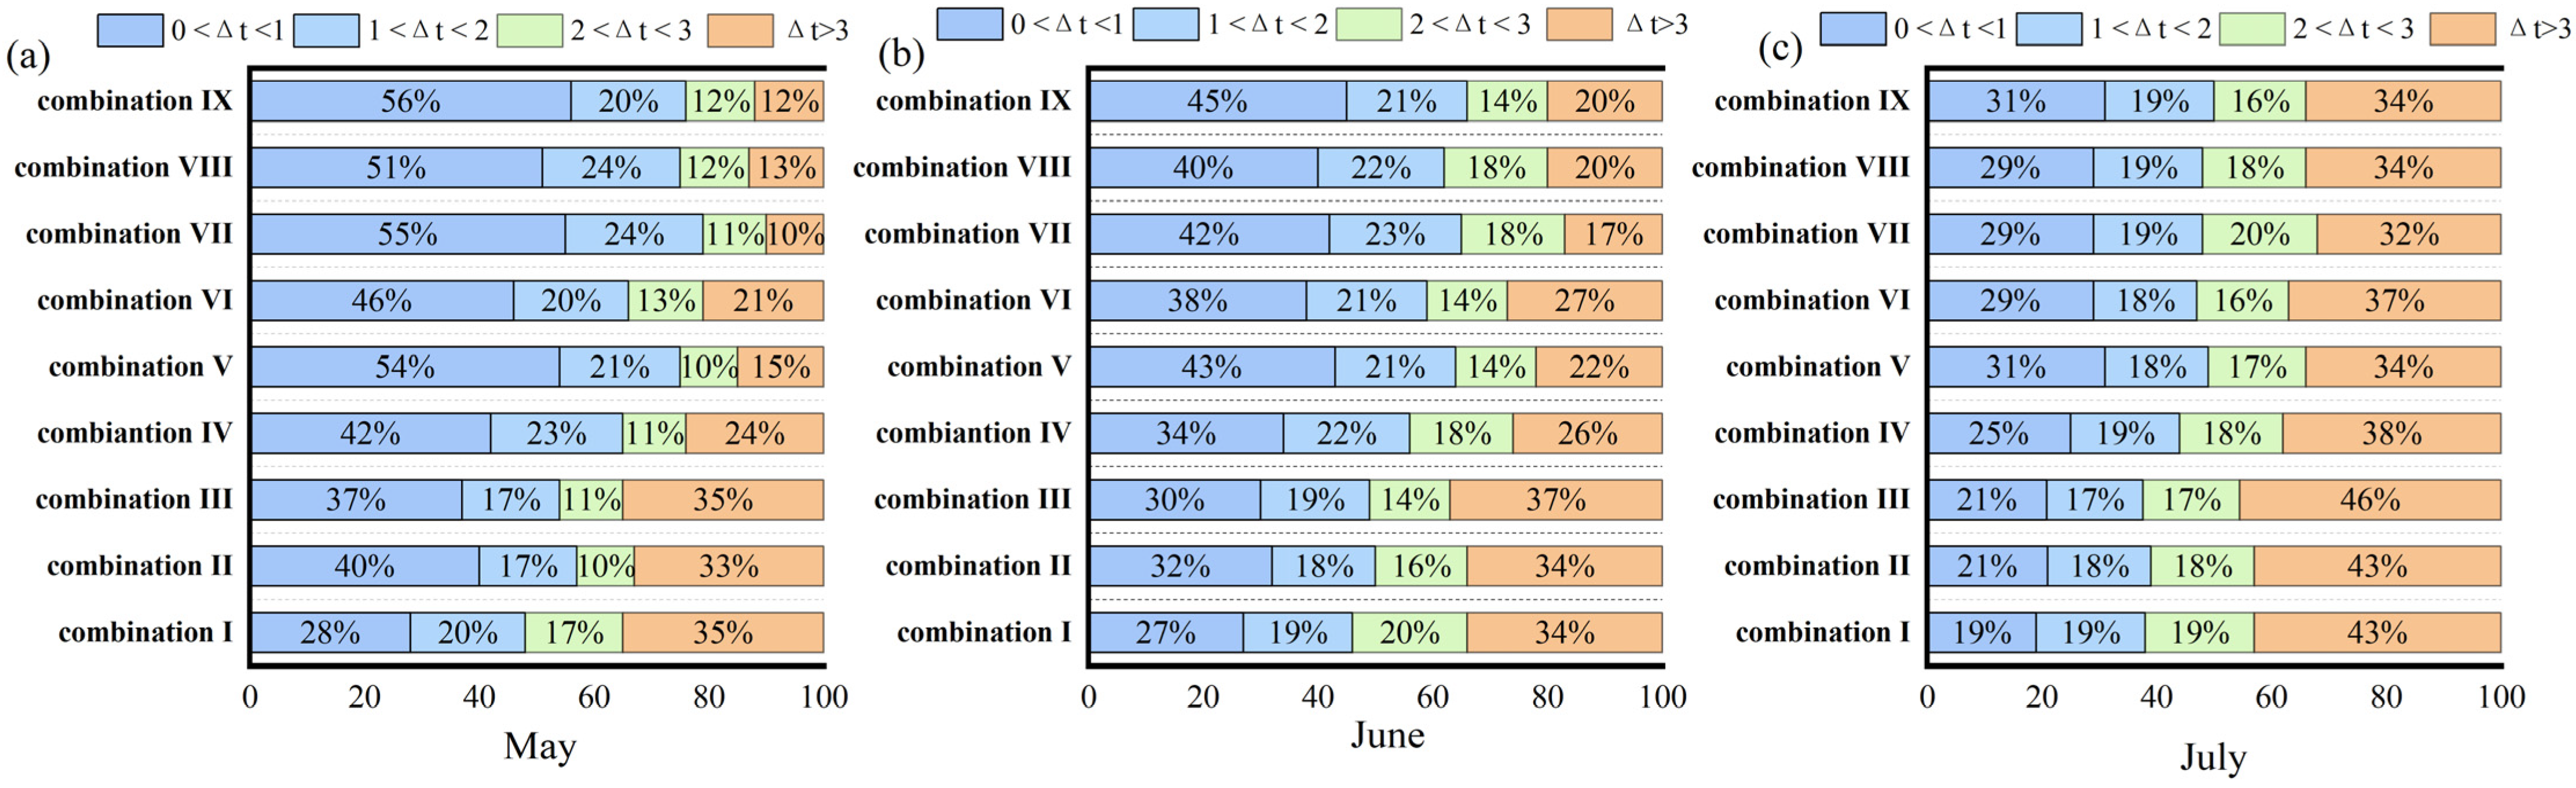
  • In May, condensation intensity in the range of 1 °C < Δ t ≤ 3 °C accounted for less, and the condensation intensity in the range of Δ t ≤ 1 °C accounted for more. With the rise of outdoor air temperature, the temperature difference between the inner surface and indoor air dew-point temperature increases, the proportion of condensation intensity in the range of Δ t ≤ 1 °C reduces, and the proportion of condensation intensity in the range of Δ t > 3 °C increases. In July, the proportion of Δ t > 3 °C accounted for the largest; at this time, the condensation period is longer, and the condensation intensity is larger, which means the condensation problem is severe.
  • All-day and all-night window closures have the opposite percentage of the range of condensation intensity compared with window openings during this period, with more intensity distributed in the range of Δ t > 3 °C. It has the typical characteristics of long condensation duration, high condensation intensity, and severe condensation problems.
  • The condensation intensity of light condensation is mainly distributed between 0 °C < Δ t ≤ 1 °C, while the condensation intensity of serious condensation is primarily distributed at Δ t > 3 °C.

3.3. Optimised Combination of Window Opening Modes

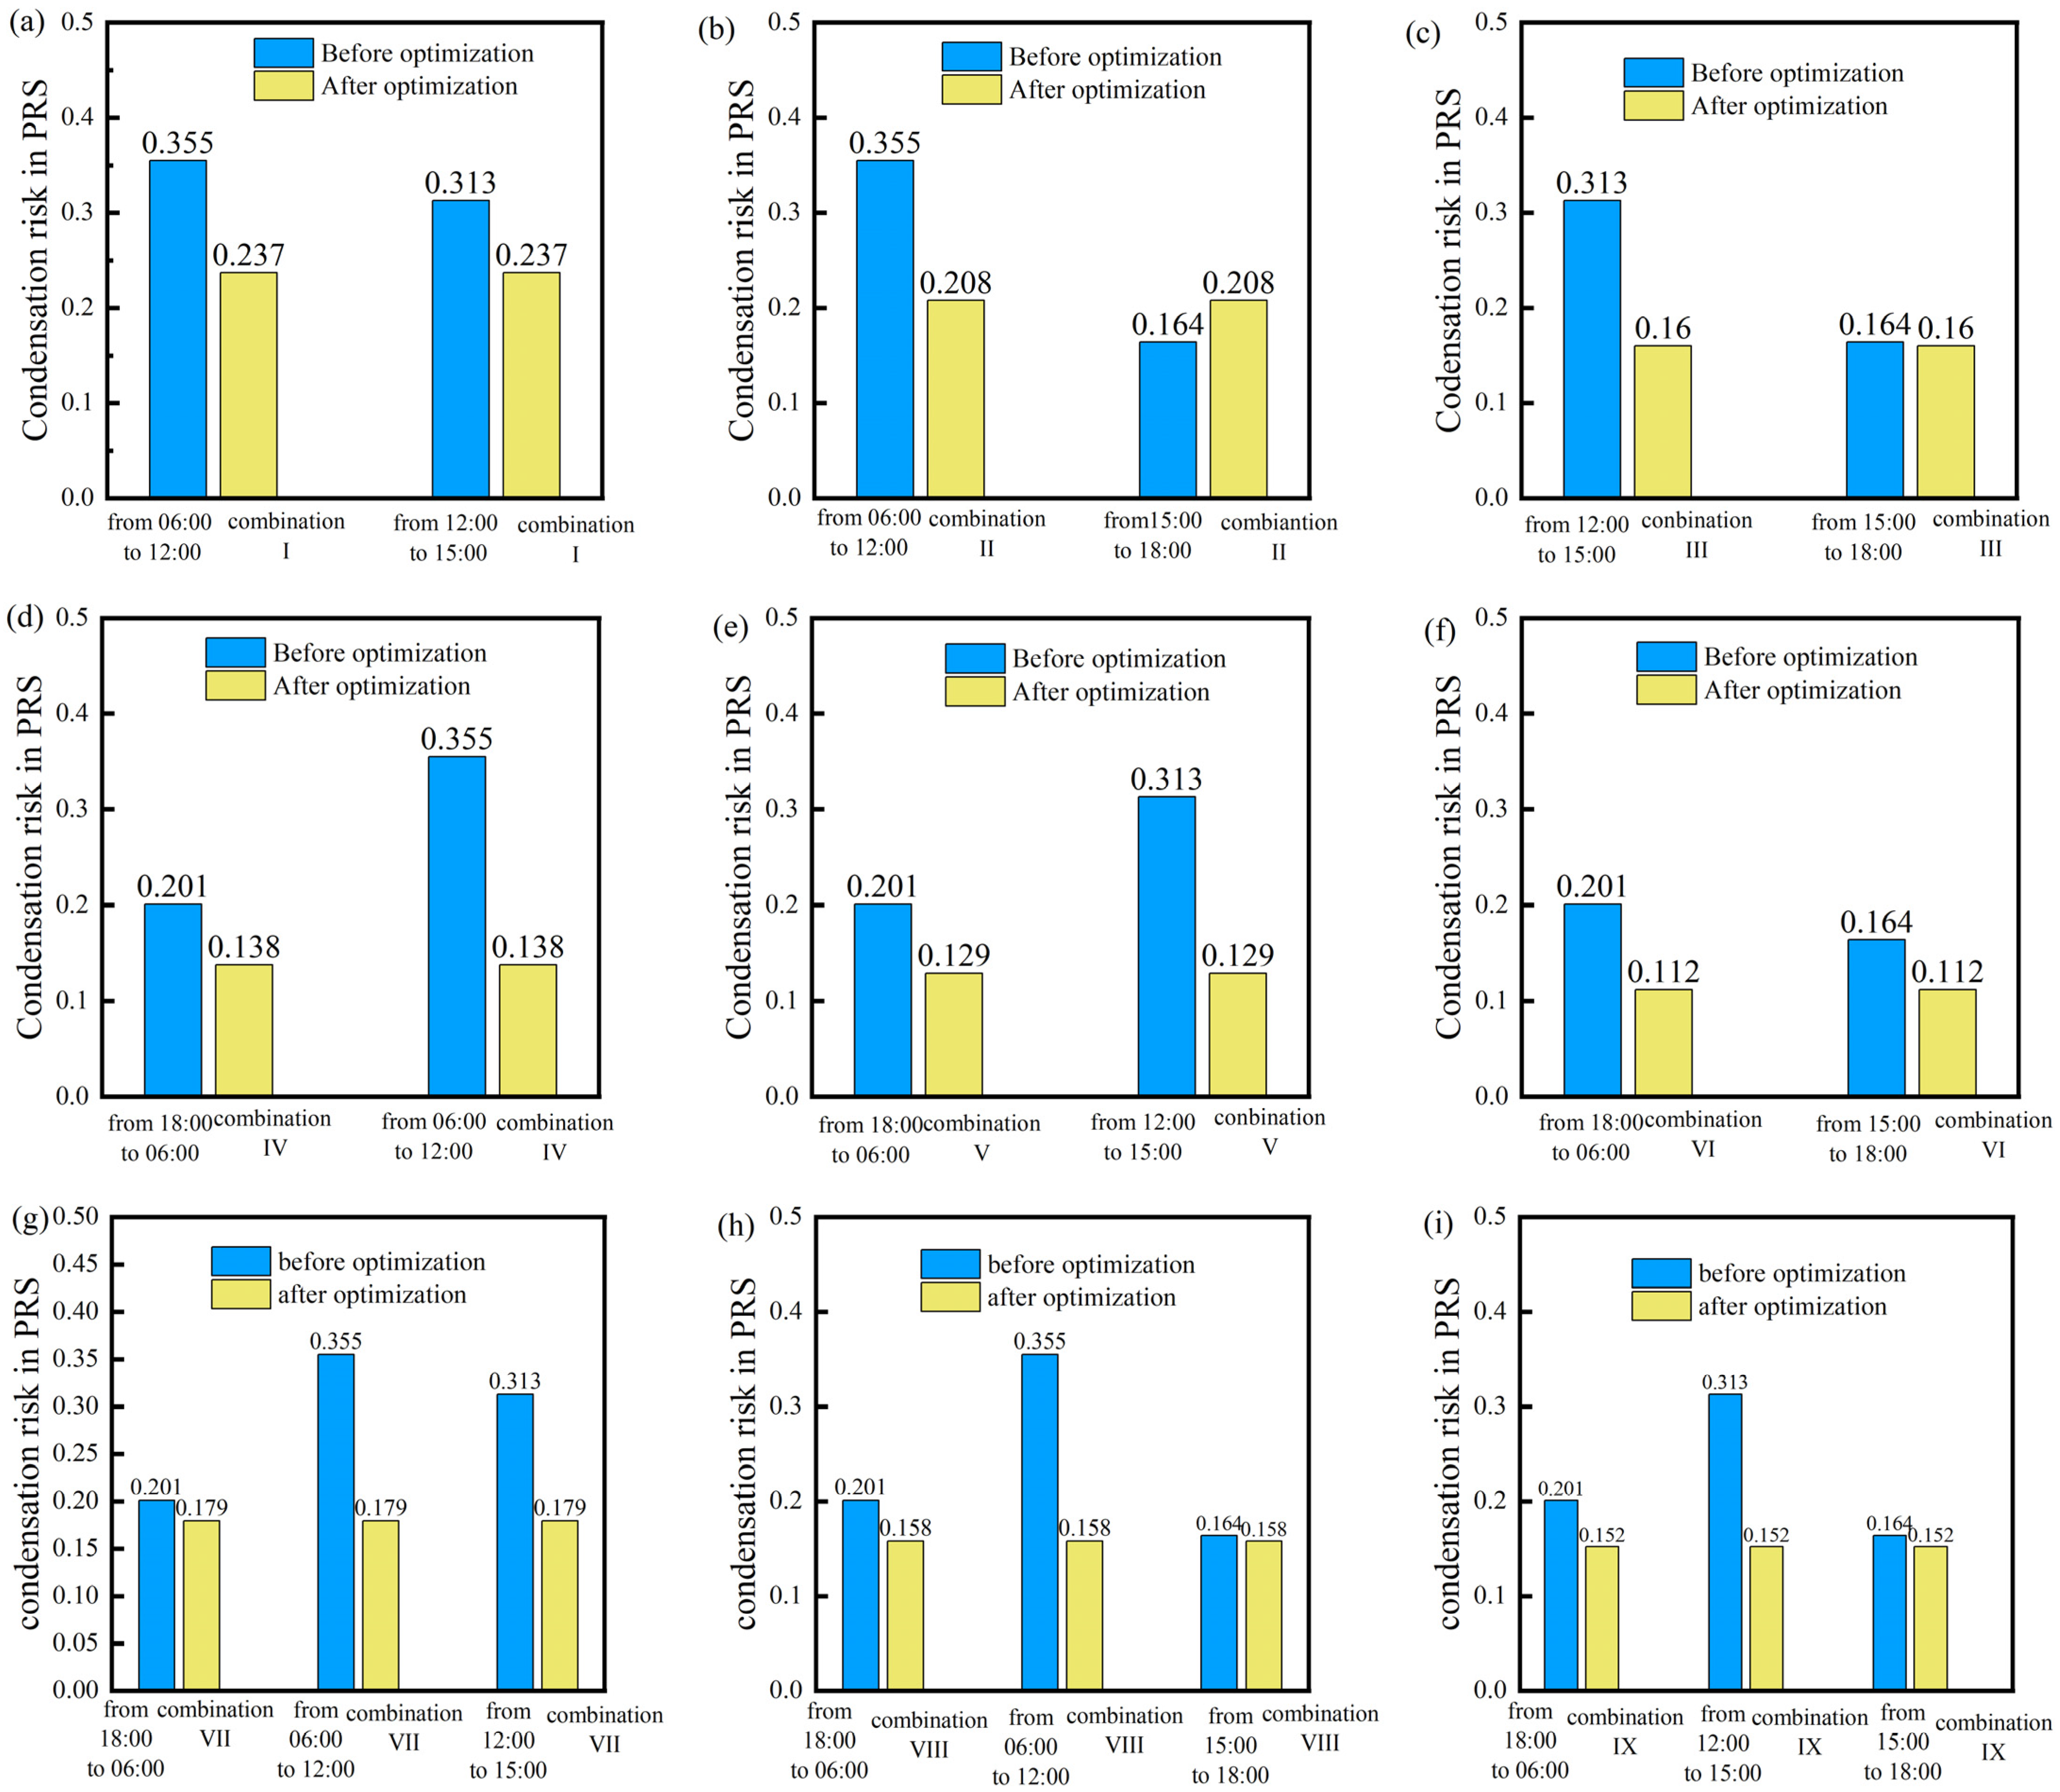
3.3.1. Optimised Combination of Window Opening Duration

As stated in the previous section, the difference in the CR at different degrees of openings in the same window opening period was minimal, based on which an optimised combination of window opening periods was carried out. Although the original window opening program covered different time periods throughout the day, it has the following two problems:
  • When the continuous window opening period was too long, and the outdoor air temperature suddenly rose, keeping the window open could aggravate the condensation on the inner surface.
  • When the windows are closed for a long time, the moisture generated by indoor personnel activities cannot be discharged promptly, and the condensation situation is aggravated.
The proposed optimisation approach to the above two problems is a combination of window opening duration. To avoid the window opening time being too long or too short, we have randomly selected two or three time periods from the four daily intervals (morning, noon, afternoon, and night) for combination, resulting in the following nine optimised solutions. The six-opening duration optimisation programmes are shown in Table 8, with the degree of the window opening set to 0.5.
As shown in Figure 14, after optimising the combinations of window opening time periods, the condensation risk in all solutions has been significantly reduced compared to the pre-optimised time periods. Among them, the CRs of combinations IV, V and VI demonstrated the best optimisation results, with condensation risk reduced to below 0.15, effectively alleviating interior surface condensation during the PRS.
Through analysis of the window opening times in Combinations IV, V and VI, we discovered that when the evening window opening period was randomly combined with any of the other three time periods (morning, noon, and afternoon), condensation was effectively mitigated. Among these combinations, the pairing with the afternoon period demonstrated the best mitigation effect, reducing CR to 0.112.
As shown in Figure 15, in May, except for Combination I, the condensation intensity of other combinations was distributed most in the range of 0 °C < Δ t ≤ 1 °C, with a low condensation intensity and a short condensation duration. Condensation intensity was low in May with a light CR. In June, the condensation intensity of all combinations except Combination I to Combination III was primarily distributed in the range of 0 °C < Δ t ≤ 1 °C, but the percentage of distribution in the range of Δ t > 3 °C was increased compared to condensation intensity in May. In July, the distribution of condensation intensity was mainly concentrated with a Δ t > 3 °C, which would be more serious condensation.
The condensation intensity of Combination I to III was concentrated in the range of Δ t > 3 °C; in contrast, Combination IV to IX was mostly distributed in the range of 0 °C < Δ t ≤ 1 °C, amongst which the condensation caused by Combination V produced the best alleviation effect.
The previous single-factor analysis shows that the higher the proportion of intensity distribution in the range of Δ t > 3 °C, the longer the condensation duration and the more serious the risk of condensation. After optimisation, the proportion of condensation intensity in the range of Δ t > 3 °C in the optimised combinations was significantly reduced compared with the proportion of the original window opening period.

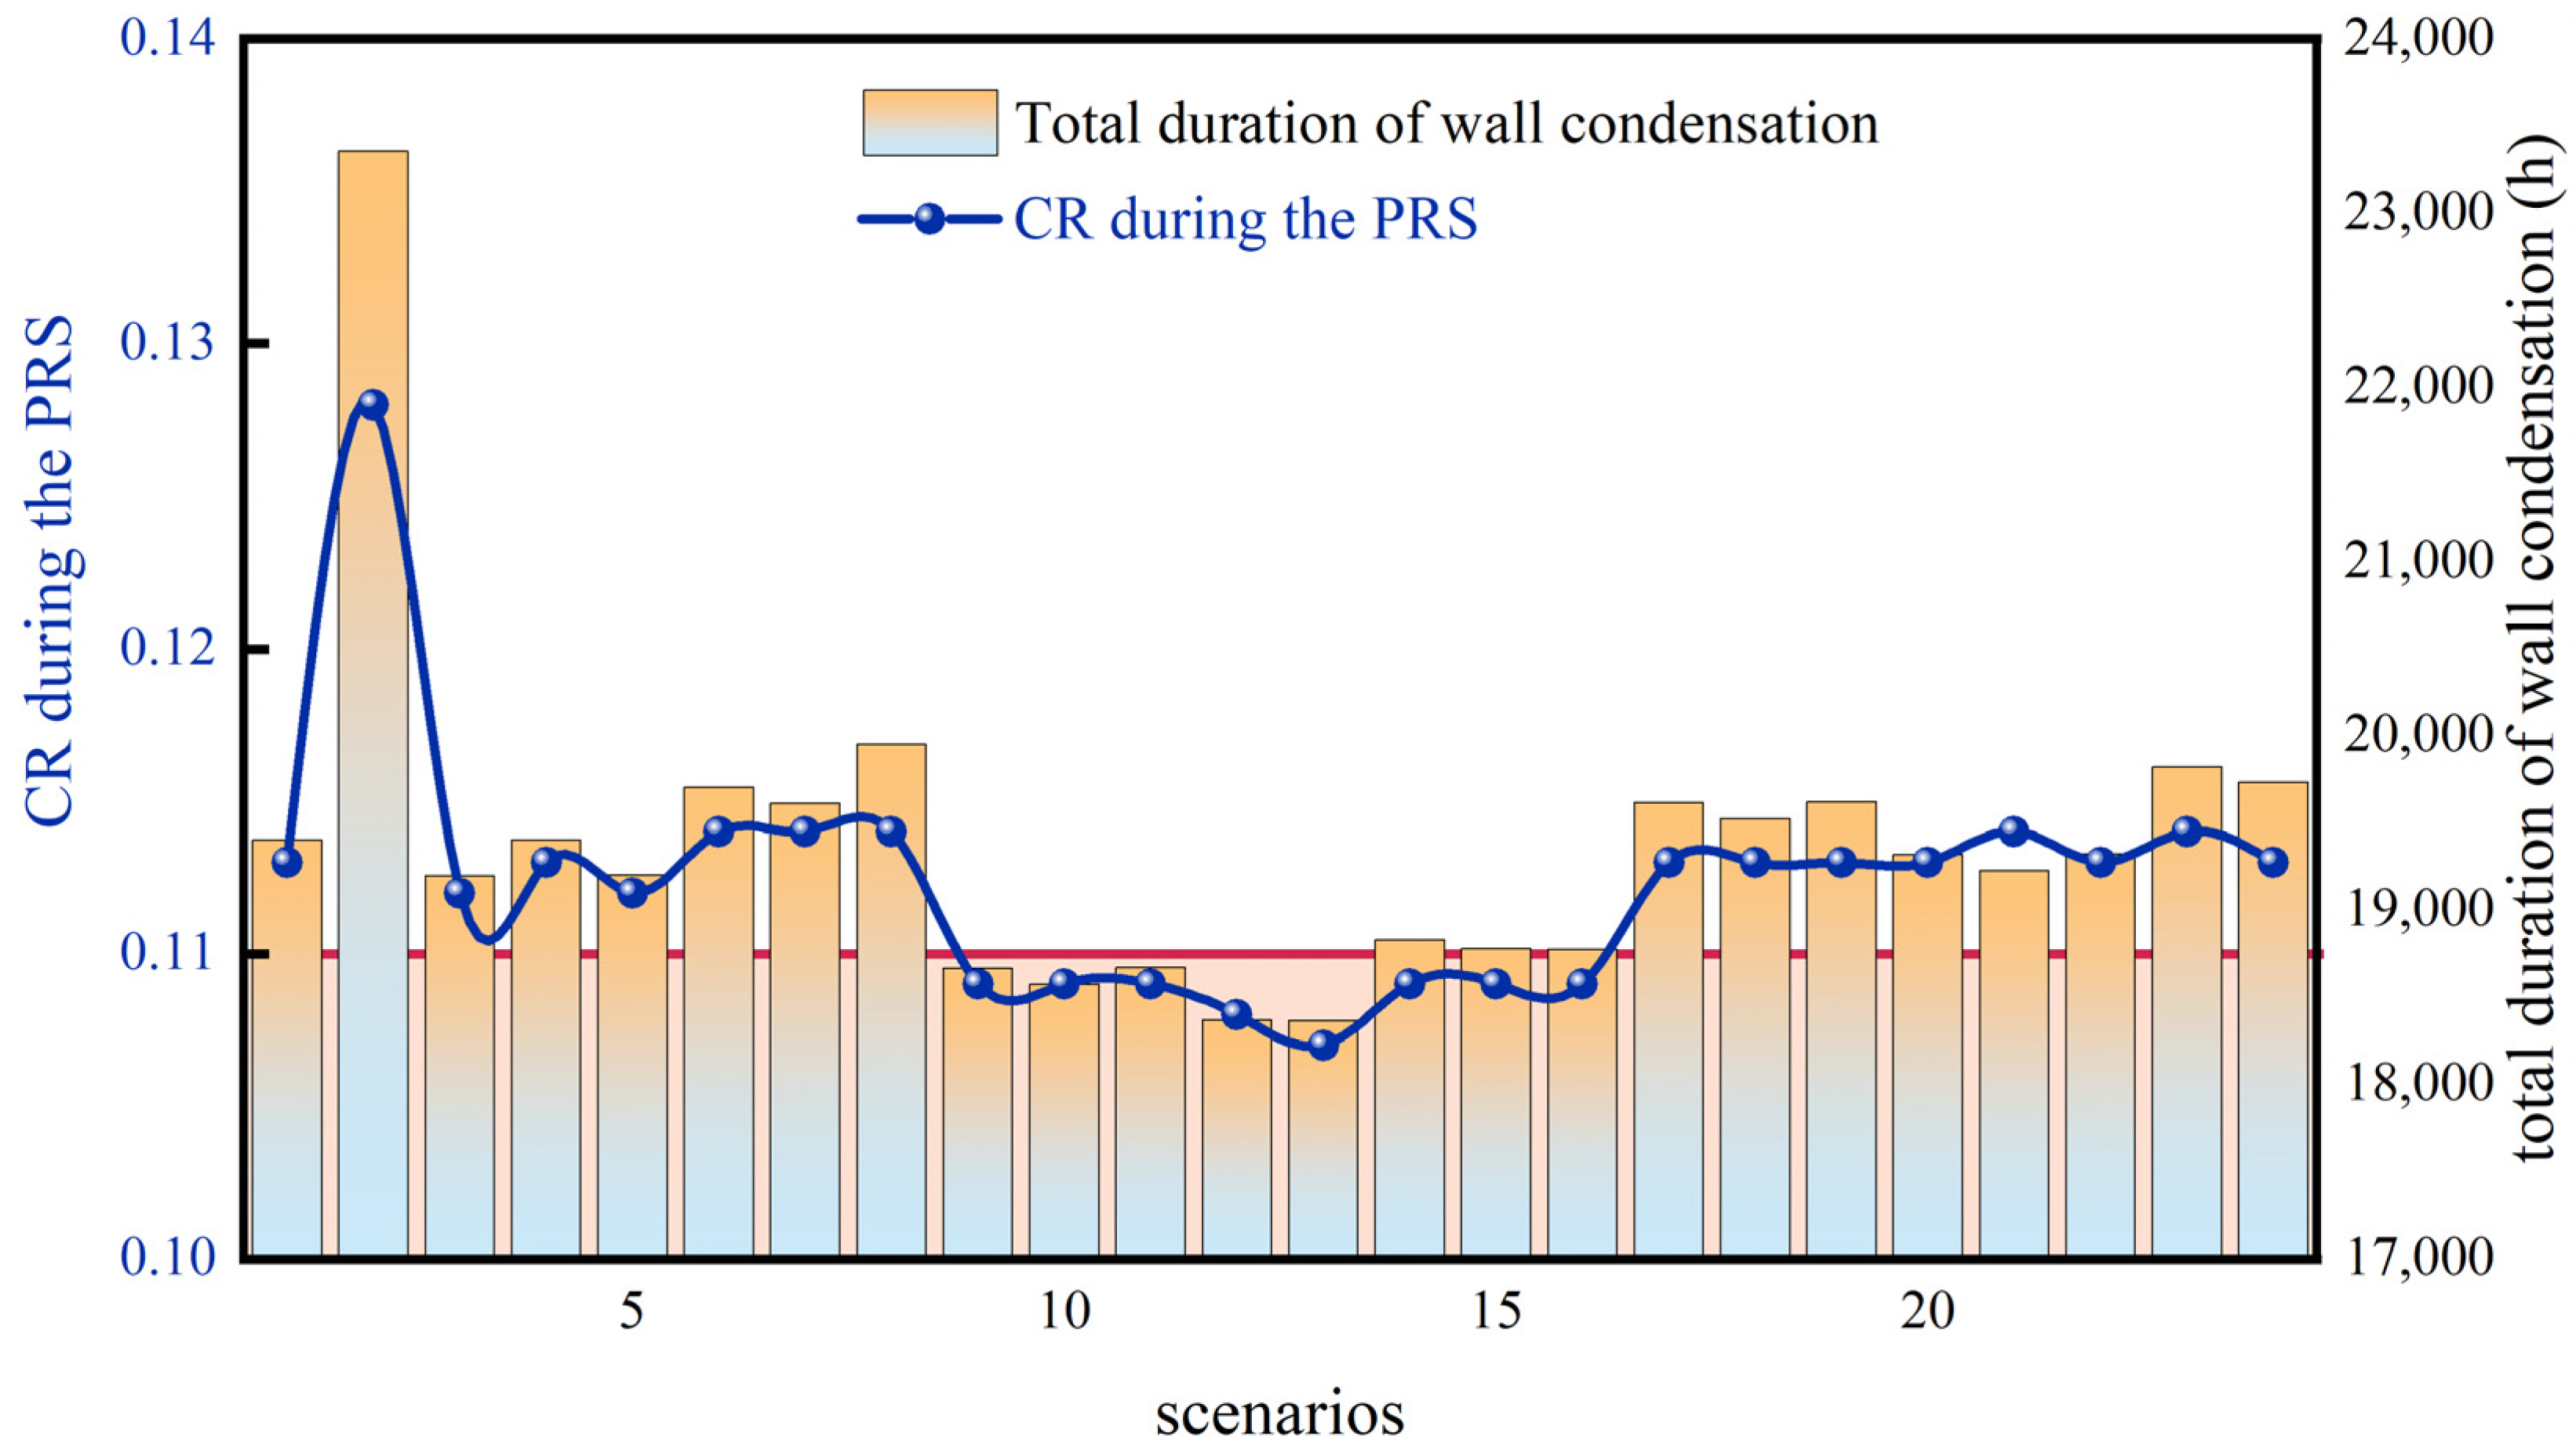
3.3.2. Optimised Combination of Window Opening Time Periods of Different Months

After the combination of the window opening period was optimised, the CR during PRS was effectively reduced, in which the mitigation effects of combinations of IV, V and VI were most apparent, and the CR was 0.138, 0.129 and 0.112, respectively, during PRS. The study above adopted the same window-opening mode for May, June and July. Therefore, we next proceed that the optimal three window opening periods (Combination IV, Combination V and Combination VI) were adopted in May, June and July, respectively. Different window-opening modes were adopted for May, June and July to find the optimal window-opening mode during PRS, as shown in Table 9, with 24 scenarios.
As shown in Figure 16, the CR for Scenarios 9–16 were all lower than 0.11. A comprehensive analysis of these effective window solutions reveals that when Combination V was taken in May, the CR was significantly reduced by randomly adopting the Combinations of IV, V and VI in June and July. The CR of the whole building was reduced to a minimum value of 0.107 when Scenario 13 was adopted, which could effectively alleviate the wall condensation problem during PRS.

4. Conclusions

In this study, Energy Plus was used to establish a rural residential model to study the impact of occupants’ window opening behaviours on indoor condensation during PRS in Changsha. We optimised the window opening periods to provide feasible window-opening solutions for occupants during PRS. The study draws the following conclusions:
  • Windows should be open and ventilated reasonably during the PRS, but prolonged window opening or closing behaviour needs to be avoided.
  • CR is higher when windows are open in the morning during the day than in the middle of the day and in the afternoon. CR is lower when windows are fully open throughout the night than throughout the daytime.
  • The CR of the window open in the afternoon was the lowest of all open duration before the duration combination; thus, opening windows in the afternoon is recommended.
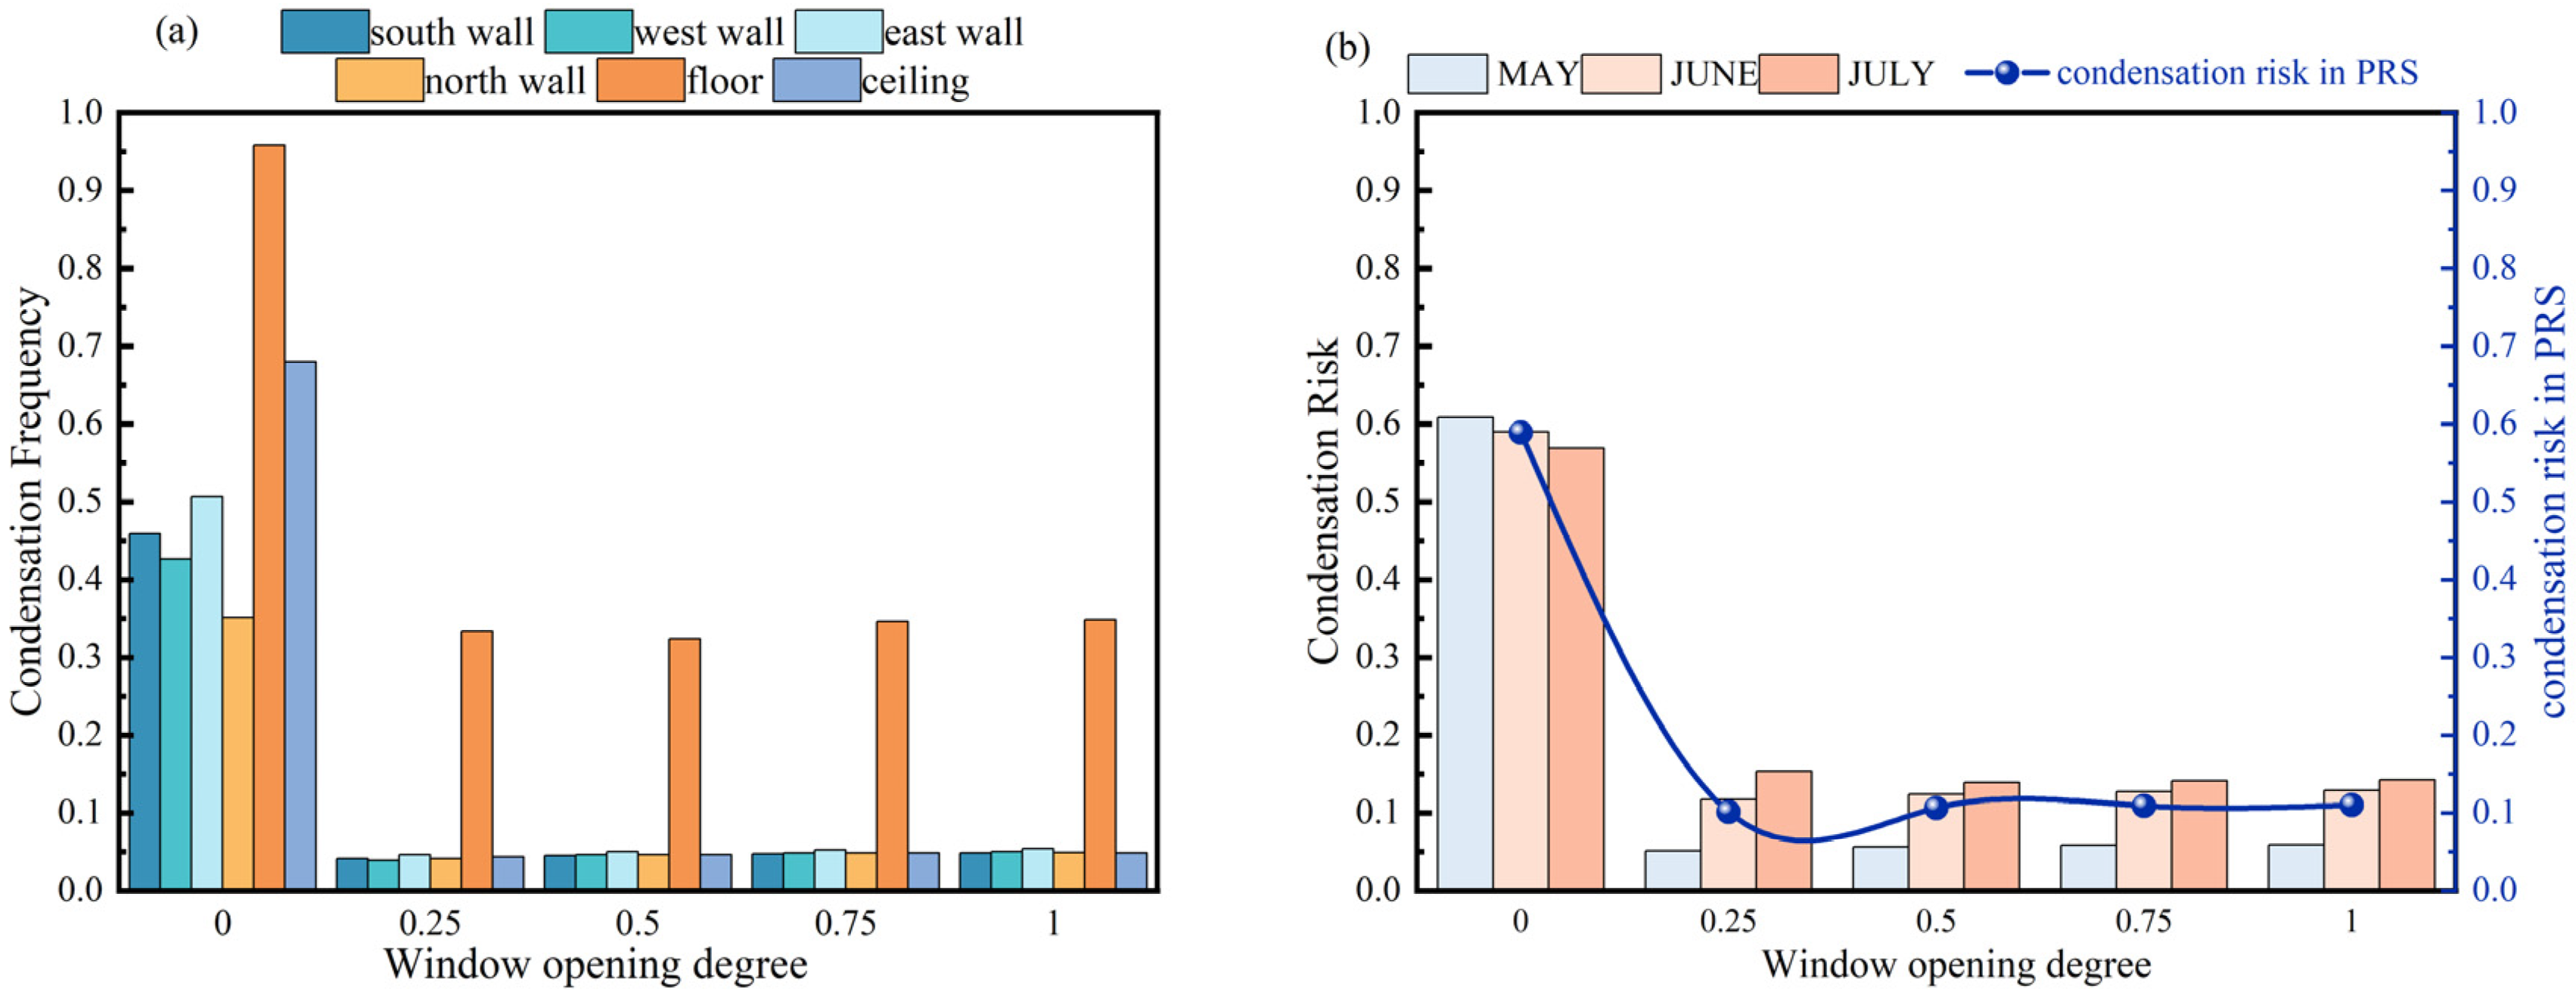
  • Amongst different window openings, the overall CR on the inner surface of the building wall during PRS when the window opening was 0 was higher than 0.50, while the rest of the window openings of 0.25, 0.5, 0.75 and 1 did not have significant changes on CR. The degree of window opening has less impact on the indoor humid environment compared to window opening duration.
  • After optimising the window opening duration, CR was reduced compared with the pre-optimisation period. Amongst them, the CR of Combination IV, V and VI was less than 0.15. After adopting different open durations in different months, the CR of a total of 8 window opening modes was equal to and less than 0.11, of which the CR of Combination VII, taken in May and June, and Combination VI, taken in July, was only 0.107.
This study has several limitations that should be acknowledged. First, the condensation analysis was based on simulated assumptions of an isolated building model without accounting for the microclimatic influences of surrounding buildings. Second, using Changsha City as a single case study provides insufficient evidence to establish universally applicable anti-condensation strategies for all regions during the PRS. Third, since the model uses a casement window typology, the influence of fixed sliding or top-hung window designs on airflow dynamics was not included in the study.
To address these limitations, future research directions could include: (1) Implementing a multi-zone modelling approach to develop a more refined natural ventilation scheme by coordinating window and door openings; (2) Expanding the geographical scope of case studies to enhance the generalizability of findings. (3) Perform simulations of the remaining window types, such as fixed sliding or top-hung window.
It is noteworthy that while this research focused on sudden outdoor temperature fluctuations, subsequent investigations should adopt more sophisticated thermal humidity coupling models to holistically capture building envelope performance under real-world transient conditions.

Author Contributions

Conceptualization, J.Z. and M.L.; methodology, M.L.; validation, J.Z., M.L. and X.Z.; formal analysis, M.L.; investigation, S.L.; resources, Z.Z.; data curation, S.L.; writing—original draft preparation, M.L.; writing—review and editing, Y.H.; visualization, Y.H.; supervision, Y.H.; project administration, Y.H.; funding acquisition, Y.H. All authors have read and agreed to the published version of the manuscript.

Funding

This work was supported by the National Natural Science Foundation of China Youth Program (No. 51806021).

Data Availability Statement

The data presented in this study are available on request from the corresponding author.

Conflicts of Interest

Author Zhigang Zhao was employed by the company GREE Electric Appliances Inc. The remaining authors declare that the research was conducted in the absence of any commercial or financial relationships that could be construed as a potential conflict of interest.

References

  1. Singh, J.; Yu, C.W.F.; Kim, J.T. Building pathology investigation of sick buildings: Toxic moulds. Indoor Built Environ. 2010, 19, 40–47. [Google Scholar] [CrossRef]
  2. Takaoka, M.; Suzuki, K.; Norbäck, D. The home environment of junior high school students in Hyogo, Japan: Associations with asthma, respiratory health, and reported allergies. Indoor Built Environ. 2016, 25, 81–92. [Google Scholar] [CrossRef]
  3. Hu, M.; Chen, Y.; Guo, X. The effect of growth of mold on building and IAQ and control strategy. Build. Energy Environ. 2006, 25, 15–21. (In Chinese) [Google Scholar]
  4. Zhang, X.; Wang, J.; Li, P. Dampness and mold in homes across China: Associations with rhinitis, ocular, throat, and dermal symptoms, headache and fatigue among adults. Indoor Air 2019, 29, 30–42. [Google Scholar] [CrossRef]
  5. Wu, X.; Yang, F.; Lu, G.; Zhao, X.; Chen, Z.; Qian, S. A breathable and environmentally friendly super hydrophobic coating for anti-condensation applications. Chem. Eng. J. 2021, 412, 128725. [Google Scholar] [CrossRef]
  6. Gong, G.; Xu, C.; Jiao, J.; Liu, Y.; Xie, S. Investigation of moisture condensation on papermaking plant envelopes in high humidity environment by orthogonal analysis and CFD simulation. Build. Environ. 2011, 46, 1639–1648. [Google Scholar] [CrossRef]
  7. Li, H.; Gong, G.; Xu, C. Thermal and humid environment and moisture condensation characteristics of cold surfaces. Indoor Built Environ. 2014, 23, 474–484. [Google Scholar] [CrossRef]
  8. Wang, F.; Zhao, X.; Pang, D.; Li, Z.; Liu, M.; Du, W.; Guo, W. Cooling performance of radiant air conditioning with an infrared-transparent membrane. Energy Build. 2023, 291, 113124. [Google Scholar] [CrossRef]
  9. Sahin, C.; Rastgeldi Dogan, T.; Yildiz, M.; Sofuoglu, S.C. Indoor environmental quality in naturally ventilated schools of a dusty region: Excess health risks and effect of heating and desert dust transport. Indoor Air 2022, 32, 13068. [Google Scholar] [CrossRef]
  10. Wang, Z.; Shaw, D.; Kahan, T.; Schoemaecker, C.; Carslaw, N. A modeling study of the impact of photolysis on indoor air quality. Indoor Air 2022, 32, 13054. [Google Scholar] [CrossRef]
  11. Dong, J.; Lan, H.; Liu, Y.; Yu, C. Indoor environment of nearly zero energy residential buildings with conventional air conditioning in hot-summer and cold-winter zone. Energy Built Environ. 2022, 3, 129–138. [Google Scholar] [CrossRef]
  12. Wang, Y.; Lian, Z.; Chang, H. The correlation between the overall thermal comfort, the overall thermal sensation and the local thermal comfort in non-uniform environments with local cooling. Indoor Built Environ. 2022, 31, 1822–1833. [Google Scholar] [CrossRef]
  13. Mao, Y.; Zhu, K.; Zheng, Z.; Fang, Z. Evaluation of the thermal comfort in different commercial buildings in Guangzhou. Indoor Built Environ. 2024, 33, 391–413. [Google Scholar] [CrossRef]
  14. Yang, Z.; Zhang, W.; Qin, M.; Liu, H. Comparative study of indoor thermal environment and human thermal comfort in residential buildings among cities, towns, and rural areas in arid regions of China. Energy Build. 2022, 273, 112373. [Google Scholar] [CrossRef]
  15. Wang, P.; Liu, Z.; Wu, J.; Liao, H.; Chen, H. Experimental and numerical study of adaptive ventilation and sunlight regulation building envelope combining variable transparency shape-stabilized phase change material. Build. Environ. 2024, 248, 111095. [Google Scholar] [CrossRef]
  16. Liu, T.; Lee, W.L. Influence of window opening degree on natural ventilation performance of residential buildings in Hong Kong. Sci. Technol. Built Environ. 2020, 26, 28–41. [Google Scholar] [CrossRef]
  17. Liao, C.; Delghust, M.; Wargocki, P.; Laverge, J. Effects of window opening on the bedroom environment and resulting sleep quality. Sci. Technol. Built Environ. 2021, 27, 995–1015. [Google Scholar] [CrossRef]
  18. Gu, Y.; Cui, T.; Liu, K.; Yang, F.; Wang, S.; Song, H.; Li, Y. Study on influencing factors for occupant window-opening behavior: Case study of an office building in Xi’an during the transition season. Build. Environ. 2021, 200, 107977. [Google Scholar] [CrossRef]
  19. Li, C.; Chen, Y. A multi-factor optimization method based on thermal comfort for building energy performance with natural ventilation. Energy Build. 2023, 285, 112893. [Google Scholar] [CrossRef]
  20. Abdullah, H.K.; Alibaba, H.Z. Open-plan office design for improved natural ventilation and reduced mixed mode supplementary loads. Indoor Built Environ. 2022, 31, 2145–2167. [Google Scholar] [CrossRef]
  21. Kitagawa, H.; Asawa, T.; Hirayama, Y. Optimum window-opening control for naturally ventilated buildings with phase change materials in the hot and humid climate of Indonesia. Build. Environ. 2023, 245, 110898. [Google Scholar] [CrossRef]
  22. Tan, Y.; Peng, J.; Curcija, C. Study on the impact of window shades’ physical characteristics and opening modes on air conditioning energy consumption in China. Energy Built Environ. 2020, 1, 254–261. [Google Scholar] [CrossRef]
  23. Yazarlou, T.; Barzkar, E. Louver and window position effect on cross-ventilation in a generic isolated building: A CFD approach. Indoor Built Environ. 2022, 31, 1511–1529. [Google Scholar] [CrossRef]
  24. Yu, C.; Du, J.; Pan, W. Impact of window and air-conditioner operation behaviour on cooling load in high-rise residential buildings. Build. Simul. 2022, 15, 1955–1975. [Google Scholar] [CrossRef]
  25. Kocik, S.; Psikuta, A.; Ferdyn-Grygierek, J. Influence of window and door opening on office room environment and human thermal sensation during different seasons in moderate climate. Build. Environ. 2024, 259, 111669. [Google Scholar] [CrossRef]
  26. Qian, H.; Tang, M.; Wang, D.; Fang, J. Effect of insulation ground on anti-condensation in rural residence. Procedia Eng. 2017, 180, 91–98. [Google Scholar] [CrossRef]
  27. Zhang, B.; Sun, Q.; Su, L.; Dong, K.; Luo, W.; Guan, H.; Wu, W. Anti-Condensation Temperature Control Strategy of the Concrete Radiant Roof. Energies 2023, 16, 4826. [Google Scholar] [CrossRef]
  28. Zhang, C.; Xu, X.; Yu, J.; Tang, X.; Yu, Z. Condensation risk-based applicability analysis and design of a dynamic thermal insulation window with ventilated airflow in different climates. Build. Eng. 2024, 86, 108913. [Google Scholar] [CrossRef]
  29. Wu, Y.; Zhang, C. Analysis of anti-condensation mechanism on superhydrophobic anodic aluminum oxide surface. Appl. Therm. Eng. 2013, 58, 664–669. [Google Scholar] [CrossRef]
  30. Wan, Y.; Zhang, C.; Zhang, M.; Xu, J. Anti-condensation behavior of bamboo leaf surface (backside) and its bionic preparation. Mater. Res. Express 2021, 8, 055002. [Google Scholar] [CrossRef]
  31. Liu, J.; Ding, Y.; Feng, Y. A novel research for restraining the condensation of radiant air conditioner by superhydrophobic surface. Energy Build. 2023, 296, 113398. [Google Scholar] [CrossRef]
  32. Deng, T.; Shen, X.; Cheng, X.; Liu, J. Investigation of window-opening behaviour and indoor air quality in dwellings situated in the temperate zone in China. Indoor Built Environ. 2021, 30, 938–956. [Google Scholar] [CrossRef]
  33. Dhalluin, A.; Limam, K. Comparison of natural and hybrid ventilation strategies used in classrooms in terms of indoor environmental quality, comfort, and energy savings. Indoor Built Environ. 2014, 23, 527–542. [Google Scholar] [CrossRef]
  34. Bayoumi, M. Impacts of window opening grade on improving the energy efficiency of a façade in hot climates. Build. Environ. 2017, 119, 31–43. [Google Scholar] [CrossRef]
  35. Sorgato, M.J.; Melo, A.P.; Lamberts, R. The effect of window opening ventilation control on residential building energy consumption. Energy Build. 2016, 133, 1–13. [Google Scholar] [CrossRef]
  36. GB 50176-2016; Thermal Design Code for Civil Building. China Construction Industry Press: Beijing, China, 2016.
  37. Lu, Y. HVAC Design Guide; China Construction Industry Press: Beijing, China, 1996. [Google Scholar]
  38. Cho, W.; Iwamoto, S.; Kato, S. Condensation risk due to variations in airtightness and thermal insulation of an office building in warm and wet climate. Energies 2016, 9, 875. [Google Scholar] [CrossRef]
  39. Li, K.; Tang, M. Simulation Study on Ground Temperature and Condensation Prevention for Rural Residences in Chongqing Area. Build. Sci. 2014, 8, 100–105. (In Chinese) [Google Scholar]
Figure 1. Simplified model drawing of the building.
Buildings 15 01536 g001
Figure 2. The layout of measurement locations on the east wall.
Buildings 15 01536 g002
Figure 3. Comparison of simulation and field experiment: (a) The temperature of interior surfaces; (b) Indoor air temperature; (c) Indoor air humidity ratio.
Buildings 15 01536 g003
Figure 4. Residential model. (a) An actual rural house in Changsha as a reference; (b) Three-dimensional drawing of the simulation model in Energy Plus; (c) First-floor plan of the building; (d) Second-floor plan of the building.
Buildings 15 01536 g004
Figure 5. Outdoor air dry-bulb temperature and moisture content during PRS.
Buildings 15 01536 g005
Figure 6. Window model: (a) Schematic diagram of external casement window; (b) The definition of opening (from a top view perspective).
Buildings 15 01536 g006
Figure 7. Simulation procedures.
Buildings 15 01536 g007
Figure 8. The condensation situation of different windows opening degrees when the window was open in the afternoon. (a) The CFn of each wall; (b) The CR in May, June and July.
Buildings 15 01536 g008
Figure 9. The CR with different degrees of openings when the window was open during the following duration: (a) 6:00–12:00; (b) 12:00–15:00; (c) 00:00–24:00; (d) 18:00–06:00; (e) 06:00–18:00.
Buildings 15 01536 g009
Figure 10. The annual condensation risk graph of different window opening durations when window opening level was 0.25.
Buildings 15 01536 g010
Figure 11. The stacked graph of total condensation frequency for each surface when the window opening level was 0.25.
Buildings 15 01536 g011
Figure 12. The percentage of CR in May, June and July and the line graph of CR with different window opening time periods during the PRS when window opening level was 0.25.
Buildings 15 01536 g012
Figure 13. Condensation intensity during different window opening periods when the degree of window opening was 0.25 in different months of the PRS: (a) In May; (b) In June; (c) In July.
Buildings 15 01536 g013
Figure 14. Comparison of the CR for combination of window opening duration before and after optimization: (a) Combination I; (b) Combination II; (c) Combination III; (d) Combination IV; (e) Combination V; (f) Combination VI; (g) Combination VII; (h) Combination VIII; (i) Combination IX.
Buildings 15 01536 g014
Figure 15. Percentage of condensation intensity for combination of window opening duration in different months of the PRS: (a) In May; (b) In June; (c) In July.
Buildings 15 01536 g015
Figure 16. Monthly combinations for optimising condensation risk and total wall condensation duration. (The total duration wall condensation is the sum of condensation occurring on 72 surfaces in PRS).
Buildings 15 01536 g016
Table 1. Envelop parameters of the experimental room.
Building StructureMaterial Name and ThicknessHeat Transfer Coefficient, W/m2·K
External wallHeavy mortar clay (240 mm) + The pure gypsum board (10 mm) + Polystyrene foam material (60 mm) + The pure gypsum board (10 mm)0.564
Internal wallCement mortar (20 mm) + Ceramsite concrete (180 mm) + Cement mortar (20 mm)1.515
RoofCement mortar (20 mm) + Reinforced concrete (200 mm) + Polystyrene (46 mm) + Cement mortar (20 mm)0.595
GroundCement mortar (20 mm) + Gravel or pebbles (40 mm)N/A
Doorsingle-layer solid wood (25.3 mm)0.350
Windowsingle-layer glass (6 mm)5.7
FloorCement mortar (20 mm) + Reinforced concrete (100 mm) + Cement mortar (20 mm)2.963
Table 2. Parameter setting of the experimental room model.
Parameter NameSpecific Values
Sunlight transmittance of the glass0.67
Shading factor of the dark cloth curtain0.65
window frame correction factor1.07
Location correction coefficient in Changsha [36]1.4
Table 3. Experimental device.
Measuring InstrumentMeasurement Accuracy
Automatic temperature and humidity recorder (TH22R-EX)0.1 °C, 1.5% RH
non-contacting infrared thermometer (AS842A-0-1)0.1 °C
Mercury thermometer0.1 °C
Table 4. Envelope parameters of the building.
Building StructureMaterial NameMaterial Thickness
mm
Heat Transfer Coefficient W/m2·K
External wallLime mortar200.93
Bituminous vermiculite slate200.033
Concrete perforated brick2000.22
Lime mortar200.93
Internal wallCeramsite concrete1900.25
GroundLime mortar200.93
Bituminous vermiculite slate200.042
Reinforced concrete1201.74
Cement mortar200.87
FloorReinforced concrete2001.74
WindowLow-E6-
Air121.8
Low-E6-
Table 5. Setting of occupant parameters in building.
Room TypeTime PeriodNumber of PersonsAverage Moisture Production per Person, (g·h−1)Average Calorie Production per Person, (W)
Bedroom
(R1-6 R2-3 R2-8 R2-6)
00:00~8:0046168
08:00~12:000
12:00~14:004
14:00~24:000
Secondary bedroom
(R1-1 R2-1)
00:00~8:0046168
living rooms
(R1-3 R2-4)
08:00~24:0006168
00:00~12:000
12:00~22:006
22:00~24:003
drawing rooms
(R1-5 R2-7)
00:00~8:0006168
08:00~9:002
09:00~24:000
Kitchen
(R1-4)
00:00~10:00010265
10:00~12:002
12:00~17:000
17:00~18:002
18:00~24:000
Recreation room
(R2-5)
00.00~20:0006168
20:00~24:004
Table 6. Settings of lighting parameters in Energy Plus of the building.
Room TypeTime PeriodLighting Power Density, W/m2
Bedroom
(R1-6 R2-3 R2-8 R2-6)
0:00~8:006
8:00~22:00
22:00~24:00
Secondary bedroom
(R1-1 R2-1)
0:00~8:006
8:00~22:00
22:00~24:00
living rooms
(R1-3 R2-4)
0:00~12:006
12:00~22:00
22:00~24:00
drawing rooms
(R1-5 R2-7)
0:00~8:006
8:00~9:00
9:00~24:00
Kitchen (R1-4)0:00~10:006
10:00~12:00
12:00~17:00
17:00~18:00
18:00~24:00
Recreation room (R2-5)00.00~20:006
20:00~24:00
Table 7. Condensation risk of the whole building during PRS (%).
Windows Opening DurationWindows Opening Degree
0.250.50.751
00:00–24:00 open30.130.430.430.5
06:00–12:00 open34.935.535.735.9
12:00–15:00 open31.131.331.431.8
15:00–18:00 open15.315.415.715.9
18:00–06:00 open19.720.120.320.3
06:00–18:00 open22.222.723.023.1
Table 8. Combination of windows opening duration.
CombinationWindow Opening Period
IWindows open during 06:00–12:00 and 12:00–15:00
IIWindows open during 06:00–12:00 and 15:00–18:00
IIIWindows open during 12:00–15:00 and 15:00–18:00
IVWindows open during 18:00–06:00 and 06:00–12:00
VWindows open during 18:00–06:00 and 12:00–15:00
VIWindows open during 18:00–06:00 and 15:00–18:00
VIIWindows open during 18:00–06:00, 06:00–12:00 and 12:00–15:00
VIIIWindows open during 18:00–06:00, 06:00–12:00 and 15:00–18:00
IXWindows open during 18:00–06:00, 12:00–15:00 and 15:00–18:00
Table 9. Optimised solution for the combination of window openings in different months during PRS.
ScenariosCombination of Window-Opening MonthsScenariosCombination of Window-Opening Months
1combination IV in May + combination IV in June + combination V in July13combination V in May + combination V in June + combination VI in July
2combination IV in May + combination IV in June + combination VI in July14combination V in May + combination VI in June + combination IV in July
3combination IV in May + combination V in June+ combination IV in July15combination V in May + combination VI in June + combination VI in July
4combination IV in May + combination V in June + combination V in July16combination V in May + combination VI in June + combination VI in July
5combination IV in May + combination V in June + combination VI in July17combination VI in May + combination IV in June + combination IV in July
6combination IV in May + combination VI in June + combination IV in July18combination VI in May + combination IV in June + combination VI in July
7combination IV in May + combination VI in June + combination V in July19combination VI in May + combination IV in June + combination VI in July
8combination IV in May + combination VI in June + combination VI in July20combination VI in May + combination V in June + combination IV in July
9combination V in May + combination IV in June + combination IV in July21combination VI in May + combination V in June + combination V in July
10combination V in May + combination IV in June + combination V in July22combination VI in May + combination V in June + combination VI in July
11combination V in May + combination IV in June + combination VI in July23combination VI in May + combination V in June + combination IV in July
12combination V in May + combination V in June + combination IV in July24combination VI in May + combination VI in June + combination V in July
Disclaimer/Publisher’s Note: The statements, opinions and data contained in all publications are solely those of the individual author(s) and contributor(s) and not of MDPI and/or the editor(s). MDPI and/or the editor(s) disclaim responsibility for any injury to people or property resulting from any ideas, methods, instructions or products referred to in the content.

