Abstract
Dewatering and excavation are fundamental processes influencing soil deformation in deep foundation pit construction. Excavation causes stress redistribution through unloading, while dewatering lowers the groundwater level, increases effective stress, and generates seepage forces and compressive deformation in the surrounding soil. To systematically investigate their combined influence, this study conducted a scaled physical model test under staged excavation and dewatering conditions within a layered multi-aquifer–aquitard system. Throughout the experiment, soil settlement, groundwater head, and pore water pressure were continuously monitored. Two dimensionless parameters were introduced to quantify the contributions of dewatering and excavation: the total dewatering settlement rate and the cyclic dewatering settlement rate . Under different experimental conditions, ranges from 0.35 to 0.63, while varies between 0.32 and 0.82. Both settlement rates decrease with increasing diaphragm wall insertion depth and increase with greater dewatering depth inside the pit and higher soil permeability. An analytical formula for dewatering-induced soil settlement was developed using a modified layered summation method that accounts for deformation coordination between soil layers and includes correction factors for unsaturated zones. Although this approach is limited by scale effects and simplified boundary conditions, the findings offer valuable insights into soil deformation mechanisms under the combined influence of excavation and dewatering. These results provide practical guidance for improving deformation control strategies in complex hydrogeological environments.
1. Introduction
As a temporary structure, foundation pit engineering often incorporates lower safety factors, increasing its susceptibility to accidents. Groundwater is a key factor influencing the stability of foundation pits and a major contributor to engineering failures [1,2]. Dewatering involves lowering the groundwater level through pumping or drainage, which reduces pore water pressure and increases effective stress within the soil. Consequently, dewatering may change soil volume and cause deformation. In regions with high groundwater levels, the safety of deep foundation pit construction relies on implementing effective dewatering measures within the pit [3,4,5,6,7]. Dewatering operations are classified into drainage dewatering and pressure relief dewatering based on their objectives. Drainage dewatering provides a dry working environment for excavations, while pressure relief dewatering reduces the risk of water inflow from confined aquifers. Drainage dewatering typically has a longer duration and broader impact. When dewatering and excavation occur simultaneously, it becomes difficult to isolate their individual effects [8]. The diaphragm wall functions as both a retaining structure and a groundwater cutoff barrier. It provides essential lateral support for the excavation while effectively reducing seepage between the interior and exterior of the foundation pit. This dual function is critical for mitigating deformation and minimizing environmental disturbance during deep foundation pit construction [9,10,11,12,13].
Research on external soil settlement caused by foundation pit dewatering relies on laboratory experiments, field tests [14,15], numerical simulations [16,17,18,19], and analytical solutions [20,21]. Laboratory experiments can be divided into two main categories. The first simulates the actual dewatering process [22] using miniature dewatering wells in the model box to replicate field conditions, though this approach is technically demanding and requires high precision. The second category approximates the dewatering process [23] by strategically placing drainage holes in the model box or along its side walls to control the internal water level drop. While this method excludes well flow effects, it effectively examines the steady-state distribution of external groundwater levels caused by internal water level reduction. For example, Xu et al. [23] conducted laboratory-scale model tests to elucidate the distribution of water levels and settlements outside the excavation during dewatering. Similarly, Wu et al. [17] used numerical simulations to analyze ground responses to dewatering in multi-aquifer systems, and Lyu et al. [21] developed an algorithm to evaluate groundwater level reductions and surface settlements caused by foundation pit dewatering. Although these studies primarily focus on surface settlement due to water level reductions, they often overlook the settlement of deeper soil layers.
Recently, a coupled seepage-stress numerical study, based on an actual deep excavation project in Xi’an, quantitatively assessed the relative contributions of excavation and dewatering to overall ground deformation. This study also proposed a deformation prediction model that incorporates multiple influencing parameters, thereby enhancing the accuracy of deformation forecasting in similar engineering scenarios [24].
In addition, some studies suggest that dewatering within the foundation pit directly induces deformation of the diaphragm wall, which subsequently causes soil displacement behind the wall. This displacement can lead to significant surface settlement outside the pit [25,26,27,28]. These studies collectively highlight that both dewatering and excavation stages contribute significantly to environmental deformation. To systematically control such deformations and meet stringent deformation control requirements, it is essential to break down overall control targets into stage-specific objectives and implement dynamic control measures at each construction stage. However, current research has not quantitatively differentiated the contributions of individual excavation stages to soil deformation. Identifying the deformation patterns of the surrounding soil during phased dewatering and excavation is crucial for effective deformation control. Such an understanding would enable designers to accurately assess the environmental impact of foundation pit construction and propose effective deformation control strategies. In parallel, machine learning techniques have demonstrated significant potential for predicting structural deformation under complex loading conditions. Recent studies have shown that advanced algorithms can accurately forecast cumulative structural damage by utilizing initial conditions and ground motion sequences. These findings provide valuable methodological references for future data-driven deformation modeling in geotechnical engineering contexts [29].
Moreover, numerous studies have examined the blocking effect of diaphragm walls on groundwater seepage [30,31,32,33]. Beyond the embedment depth of the diaphragm wall, factors such as the dewatering depth within the foundation pit and the permeability of aquifers significantly influence groundwater seepage. Consequently, the interaction between the diaphragm wall and the dewatering depth is a critical consideration when evaluating the deformation of the surrounding soil caused by dewatering.
Given the stringent construction schedules associated with deep foundation pits, conducting extensive field tests prior to excavation is often impractical. Furthermore, the high economic costs of parameter testing make model testing a viable and cost-effective alternative for simulating the dewatering and excavation processes. Scale model tests under conventional gravitational field conditions offer valuable insights into soil deformation during dewatering and excavation in metro deep foundation pit construction [34].
This study focuses on a metro station foundation pit project in Taiyuan, located in a typical river floodplain geological area characterized by alternating aquifers and aquitards. Based on this project, an indoor model box experiment was designed and executed (Section 2). Through seepage model box tests, this research investigates ground settlement patterns (Section 3.1) and seepage characteristics (Section 3.2) under the combined effects of dewatering and excavation, quantifying the independent contributions of these factors to ground settlement. Subsequently, a theoretical model was established to calculate the soil settlement induced by dewatering using an improved layered summation method (Section 3.3). Finally, parameter tests examined the influence of diaphragm wall insertion ratio and dewatering depth on the deformation of the surrounding soil (Section 4). The findings aim to provide theoretical guidance for controlling ground deformation caused by dewatering in foundation pits under complex hydrogeological conditions in regions with similar geological settings.
2. Experimental Overview
2.1. Engineering Background
This seepage model test is based on the excavation of a subway station located in Taiyuan, within the Fenhe River floodplain area. The station is 248 m long, with a standard excavation width of 21.1 m and an excavation depth of approximately 17.3 m. The primary structural support system for the excavation consists of diaphragm walls and internal bracing. The concrete diaphragm wall is 0.8 m thick, extends to a total depth of approximately 31.8 m, and has an embedded depth of 14.5 m. The insertion ratio, defined as the ratio of the diaphragm wall’s embedded depth (14.5 m) to the excavation depth (17.3 m), is approximately 0.84. A schematic diagram of the excavation area and its profile is provided in Figure 1.
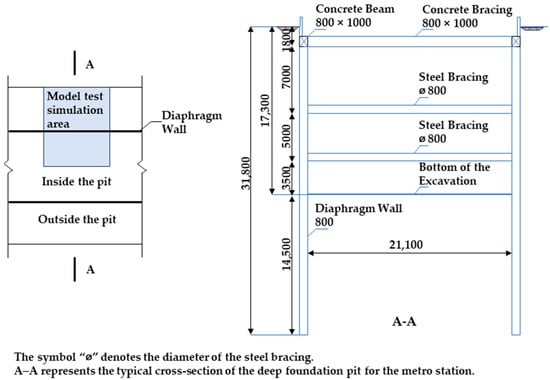
Figure 1.
Excavation area and profile diagram, showing the layout of diaphragm walls and excavation dimensions (unit: mm).
The site stratigraphy consists of Engineered Backfill, Clayey Silt, Fine Sand with occasional Silty Clay interlayers, and Gravel, arranged from top to bottom. Within the upper 55 m of the soil profile, three aquifers and two aquitards are present. The aquifers are primarily composed of Quaternary clayey silt and sand layers. Geological surveys were conducted to determine the primary parameters of each soil layer. The site features phreatic groundwater, primarily replenished through lateral flow. The stable groundwater level, measured during the survey, was approximately 3.5 m below the ground surface.
2.2. Experimental Design
2.2.1. Testing Soil
The model test is conducted based on the principles of similarity theory. While not all similarity conditions must be met in the experimental design, key physical quantities—including geometric, material, force, and kinematic similarity—must adhere to the required criteria. In such a system, a phenomenon is considered similar if all relevant physical quantities at corresponding geometric points and times maintain a consistent proportional relationship, described by the similarity constant. According to the conditions of the indoor test, the geometric similarity ratio is defined as 1:50. The test is performed under standard gravitational field conditions, ensuring that both the density similarity ratio and gravitational acceleration similarity ratio are 1:1. Using traditional dimensional analysis and the method of separated similarity design, the similarity relationships for the relevant physical and mechanical parameters are derived, as presented in Table 1 [35].

Table 1.
Similarity constants of key parameters in model soil.
To control key parameters such as density, permeability, and compressive modulus, three types of refined quartz sands with uniform particle sizes (20–40 mesh, 110–160 mesh, and 200–300 mesh) were selected to better simulate the properties of soil layers. The permeability coefficients of these quartz sand mixtures were measured in accordance with the ASTM D5084-10 standard [36]. Additionally, the mass density, specific gravity, and porosity of the samples were precisely measured to ensure the accuracy of the simulation.
Although scaled model tests cannot fully replicate the stress states and boundary conditions of actual foundation pits, they provide valuable insights into soil deformation and groundwater behavior under controlled laboratory conditions—insights that are difficult to obtain from full-scale testing. In this study, the physical model facilitated detailed observation of key responses, including surface settlement trends, seepage characteristics, and the relative effects of design parameters such as diaphragm wall insertion depth and dewatering depth. These comparative insights are particularly useful for understanding the underlying mechanisms and for informing preliminary design decisions in complex hydrogeological environments.
Mix ratios for the simulated materials were developed based on the physical and mechanical parameters of each soil layer (Figure 2) and the corresponding similarity ratios. These were determined through experimentation with various mass ratios. The detailed properties of similar materials are summarized in Figure 3.
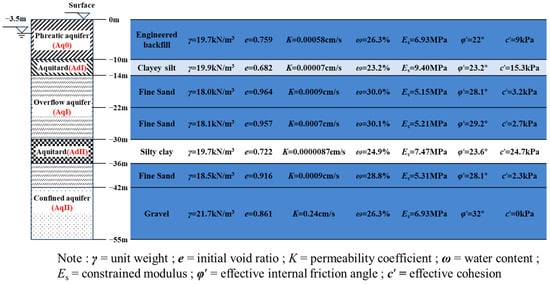
Figure 2.
Soil profile and basic properties, illustrating the stratigraphy and key soil parameters.
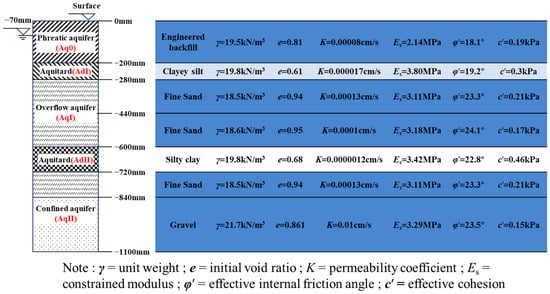
Figure 3.
Physical and mechanical properties of simulated soil layers.
2.2.2. Test Equipment
A schematic diagram of the test box system is shown in Figure 4. The system primarily consisted of the test box, diaphragm wall, water head detection system, and data acquisition equipment, as detailed below.
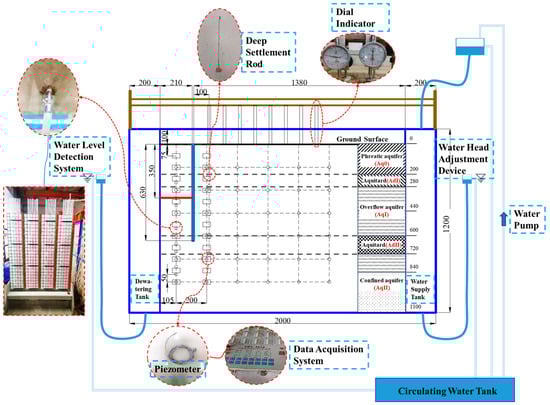
Figure 4.
Schematic diagram of the test box system, illustrating the layout of the diaphragm wall, water head detection system, and data acquisition equipment (unit: mm).
- Test box
The model box test focused on the standard section excavation at the station’s center, reducing the spatial problem to two dimensions. Considering that the influence range of the excavation is approximately three to four times the maximum excavation depth [37], the test box was designed with dimensions of 2000 × 400 × 1200 mm. Acrylic panels were used on all sides of the test box to facilitate the observation of soil changes, and surrounding beams were installed to restrict lateral deformation.
On both sides of the test box, a water supply tank and a dewatering tank were installed, separated from the soil tank by perforated partitions. The perforation area of the partitions accounted for 49% of the total area to simulate the maximum porosity of the soil layer. The number of perforations was adjustable to match the porosity of the simulated soil layer, ensuring stable seepage and water supply. Flexible hoses with adjustable openings were connected to the tanks’ bottoms to establish a constant water head boundary. A constant water head boundary, based on the layout proposed by Xu et al. [23], was set 1.38 m behind the diaphragm wall to simulate the dewatering radius.
- 2.
- Diaphragm Wall
The diaphragm wall for the subway station foundation pit, originally designed as an 800 mm thick reinforced concrete cast-in-place structure, was simulated using acrylic panels based on similarity theory and material comparisons [38]. According to the bending stiffness similarity principle, the thickness of the acrylic panels was determined to be 10 mm. The diaphragm wall model had a length of 630 mm (corresponding to a prototype depth of 31.5 m) and a width of 395 mm, slightly smaller than the width of the test box. To prevent groundwater infiltration from outside the pit and ensure that seepage occurred only along the underside of the diaphragm wall, an elastic membrane was used to seal both sides of the diaphragm wall [34].
- 3.
- Water level detection system
A total of 45 water head pipe connection holes were drilled on the front of the test box and connected to water head pipes via flexible hoses. The water head pipes, with a diameter of 10 mm, were arranged on a graduated water head reading board. The water head height at each point was measured by comparing the liquid surface height in the pipe with the scale values, ensuring accurate readings.
- 4.
- Data Acquisition Equipment
The model test employed a miniature piezometer (21 mm thick, 15.8 mm outer diameter, 5 kPa range, 0.001 kPa accuracy) and a dial indicator (0–5 mm range), which was mounted on a square hollow steel pipe using a magnetic box. A gasket was used for measuring surface settlement, and a deep settlement rod was used for deep settlement measurements. The YBY-4010 model—a 40-channel dynamic-static strain testing and analysis system—served as the data acquisition system.
2.2.3. Testing Procedure
To systematically investigate the coupled effects of dewatering and excavation, the testing procedure was divided into sequential stages. Each stage was designed to isolate and evaluate specific factors influencing soil settlement under controlled conditions. The overall procedure is summarized as follows:
Step 1: Preparation
As shown in the cross-section in Figure 2, different similar soil materials were filled into the test box. Pre-mixed soil materials were placed manually into the box with a shovel, while water was simultaneously injected through the supply hose. The injection speed was regulated to ensure a stable flow rate, allowing the soil layers to saturate from the bottom up. After every 100 mm of soil placement, compaction was performed to maintain stable physical parameters, and the compaction quality was monitored using a miniature penetration tester.
After a period of time, the soil layers became saturated. Due to the surface tension and lubrication provided by the water, the soil materials compacted, resulting in settlement deformation. Additional similar materials were added until the required height for the test was achieved. After one to two cycles of saturation and refilling, monitoring instruments were installed, and the filling of similar materials continued until the test height of 1100 mm was reached.
During the consolidation of the soil layers in the test box, the water levels in the replenishment, drainage boxes, and dewatering test areas were maintained at a height of 1030 mm. Simultaneously, the piezometer readings at different burial depths were observed and recorded. The soil layers consolidated under their own weight. Once the displacement readings of the surface settlement points were less than 0.01 mm/day, it was determined that the consolidation of the soil layer was essentially complete. At this point, the model test reached the initial state before construction, and the conditions for dewatering and excavation tests were met.
Step 2: Test Procedure
In this experiment, dewatering of the confined aquifer was simulated by opening the perforated partition only at the location of the water-bearing layer AqI, while keeping the perforated partitions of the other soil layers closed. This setup allowed for the simulation of confined aquifer dewatering.
To maintain the water level inside the pit at the required dewatering depth, the water head of the drainage box was fixed at the designated depth by adjusting the height of the water head adjustment device on the drainage pipe during each dewatering test. Piezometer readings were taken hourly during dewatering. The process was considered stabilized when changes were less than 0.01 kPa for three consecutive measurements, allowing subsequent tests to proceed.
During the excavation phase, settlement data was recorded every hour. As in the preparation phase, when the change in surface settlement was less than 0.01 mm for three consecutive readings, consolidation was considered essentially complete, allowing the experiment to advance to the next stage.
To systematically evaluate and differentiate the effects of dewatering and excavation on soil settlement, the experiment was designed to proceed in sequential stages. Using Case 0 as an example, the process was divided into seven distinct stages to separately analyze the influence of each factor. The phased excavation and dewatering process, along with the corresponding water levels at different excavation depths inside and outside the pit, is illustrated in Figure 5. In Stage 1, excavation was performed to a depth of 40 mm, reaching an elevation of 1060 mm. This was followed by Stage 2, where dewatering lowered the groundwater level to a depth of 130 mm, reaching an elevation of 900 mm before the second excavation. Stage 3 involved a second excavation to a depth of 140 mm, reducing the elevation to 920 mm. Subsequently, in Stage 4, dewatering was conducted to a depth of 100 mm, reaching an elevation of 800 mm prior to the third excavation. During Stage 5, the third excavation was carried out to a depth of 100 mm, resulting in an elevation of 820 mm. In Stage 6, dewatering further reduced the groundwater level by 70 mm, reaching an elevation of 730 mm before the fourth excavation. Finally, Stage 7 involved the fourth excavation to a depth of 70 mm, reaching an elevation of 750 mm. Once the final excavation was completed and consolidation was achieved, data collection was conducted, marking the conclusion of the experiment.
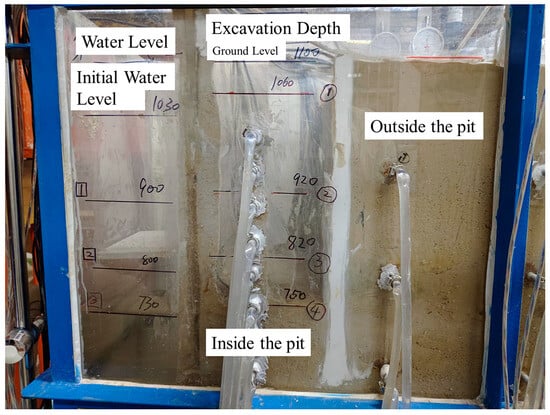
Figure 5.
Phased excavation and dewatering process, showing water levels at different excavation depths inside and outside the pit.
Step 3: Completion of the experiment
Upon completion, the collected data were organized and verified for accuracy. Once confirmed as reliable, additional tests under different working conditions were conducted using the same procedures.
3. Results and Discussion
3.1. Settlement of Surrounding Soil
Figure 6 shows the surface settlement observed under Case 0, highlighting the extent of settlement outside the excavation caused by dewatering and excavation at different experimental stages. Negative values in the figure denote surface settlement. The results indicate that the maximum settlement at each stage occurs 100 mm from the diaphragm wall. As the distance from the diaphragm wall increases, settlement caused by dewatering and excavation progressively decreases.
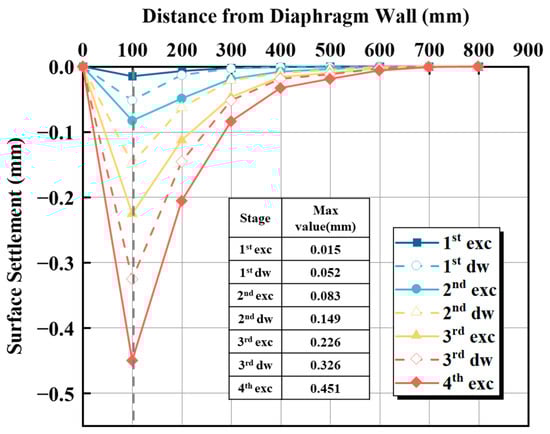
Figure 6.
Surface settlement during excavation and dewatering stages.
Figure 7 presents the vertical profile of soil settlement at the location of maximum settlement (100 mm from the diaphragm wall) during different experimental stages under Case 0. The results reveal that the maximum settlement at each stage occurs at the surface of the soil layer, with settlement values exhibiting a non-uniform distribution along the depth. During shallow excavation, deformation is mainly concentrated in the uppermost soil layer, Aq0. As excavation depth increases, settlement extends downward, with 87.1% to 93.3% of total settlement occurring above aquifer AqII. Thus, the depth above AqII is the primary influence zone, while AqII itself is a minor influence zone.
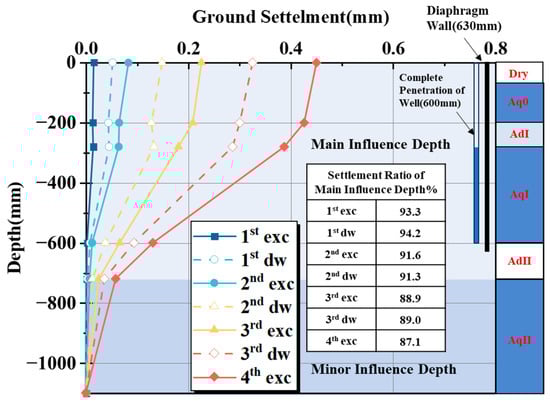
Figure 7.
Deep settlement at 100 mm from diaphragm wall.
Because the settlement values in the minor influence zone are small and may be affected by experimental errors (e.g., instrument precision limitations and random errors), subsequent analysis focuses on settlement patterns in the primary influence zone. Additionally, with increasing excavation depth, the cumulative effect of groundwater level changes becomes more pronounced, and the growing water level difference between the inside and outside of the pit amplifies deformation in the surrounding soil.
The settlement values for each soil layer at different experimental stages are summarized in Table 2. In some experimental steps, the Aq0 and AdI layers exhibited swelling, and the maximum settlement did not always occur at the surface. This swelling is attributed to the expansion of the aquitard layer located above the dewatered aquifer. Therefore, the maximum settlement caused by dewatering may occur at the surface or within deeper soil layers [39]. The hydraulic conductivity of the aquitard layer above the dewatered aquifer plays a critical role in influencing these results, underscoring the variability in the location of maximum settlement caused by dewatering.
Table 2.
Settlement of each soil layer at different stages (mm).
Figure 8 illustrates the distribution of settlement induced by a single experimental step under Case 0. The total dewatering settlement rate, , is defined as follows:
where represents the settlement of the surrounding soil outside the excavation at a specific depth caused by dewatering prior to staged excavation, and represents the settlement of the surrounding soil at the same depth caused by excavation.
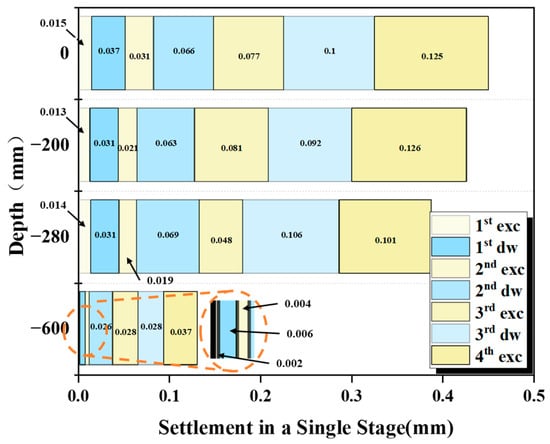
Figure 8.
Distribution of settlement during a single experimental stage, illustrating dewatering and excavation settlement at different depths.
The settlements caused by the four excavation steps (, , , ) and three dewatering steps (, , ) were analyzed. Typically, each excavation stage is preceded by dewatering, forming a dewatering–excavation cycle. However, since the initial groundwater table is below the surface of the first excavation layer, dewatering is not required before the first excavation. Therefore, the first dewatering and second excavation together comprise Cycle 1. Thus, the entire process is divided into three cycles. The dewatering settlement rate for each cycle is expressed as follows:
where .
The total dewatering settlement rate () represents the overall contribution of dewatering to soil settlement throughout the entire construction process. In contrast, the cyclic dewatering settlement rate () quantifies the relative contribution of dewatering during each cycle. Together, these two indicators provide a comprehensive assessment of both cumulative and stage-specific effects of dewatering on layered soils during excavation.
Under Case 0, the values of , , , and vary with depth. At the surface, the values are = 0.45, = 0.54, = 0.46, and = 0.44. At a depth of 200 mm, the corresponding values are = 0.44, = 0.6, = 0.44, and = 0.42. At 280 mm depth, the values are = 0.53, = 0.62, = 0.59, and = 0.51. Finally, at a depth of 600 mm, the values are = 0.46, = 0.6, = 0.48, and = 0.43.
The dewatering settlement rate () is generally higher near the upper surface of the aquifer. For example, at the upper surface of aquifer AqI (depth 280 mm), = 0.53, the highest among all depths. This indicates that dewatering has a more pronounced effect within the aquifer. Two key factors contribute to this behavior. First, the topsoil situated above the groundwater table is minimally affected by dewatering. Second, the aquifer AqI, characterized by its higher porosity and permeability, undergoes a substantial reduction in pore water pressure as a result of dewatering-induced seepage. This reduction in pore water pressure increases the effective stress within the soil, thereby causing greater settlement [40].
Analysis of settlement rates during excavation–dewatering cycles indicates that dewatering has a dominant influence during the early construction stages. This is primarily due to rapid dissipation of pore water pressure, which increases effective stress. The effect is especially pronounced in high-permeability aquifers, such as AqI, where immediate compression leads to significant settlement.
As construction advances, the impact of dewatering stabilizes, and the influence of excavation becomes increasingly significant. Excavation activities expose previously confined soil layers, resulting in stress redistribution and disturbance of the soil structure. This is particularly notable in soft or compressible soils, where such disturbances promote ongoing consolidation and long-term deformation. These deformation processes persist even after groundwater levels have stabilized.
In summary, while dewatering initiates settlement during the initial phase, excavation becomes the primary driver of long-term soil deformation. Consequently, effective deformation control strategies for deep foundation pits should address not only groundwater management but also emphasize excavation staging and support design, particularly in complex hydrogeological conditions.
3.2. Seepage Characteristics
3.2.1. Equipotential Line Diagram
Based on data obtained from the Water Level Detection System, Figure 9 illustrates the variation in water levels inside and outside the excavation for Case 0. The equipotential lines represent the distribution of the total groundwater head, where denser lines correspond to a greater hydraulic gradient and faster flow velocity. A lower permeability coefficient in the aquitard reduces recharge from the upper to the lower aquifer, resulting in more pronounced bending and a sparser distribution of the equipotential lines [41].
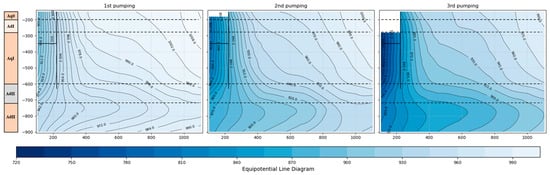
Figure 9.
Equipotential line diagram showing the variation of groundwater levels inside and outside the excavation during successive pumping stages.
When water flows from aquifer Aq0 to aquitard AdI and from aquifer AqI to aquitard AdII, the equipotential lines bend significantly, indicating reduced flow velocity and a sparser distribution in these regions. Seepage flow, which is oriented perpendicular to the equipotential lines, suggests that flow within the aquifers is predominantly horizontal, while vertical seepage becomes more pronounced within the aquitards. This occurs because the permeability coefficient of the aquifer is over two orders of magnitude greater than that of the aquitard, which allows water to flow almost vertically through the aquitard.
3.2.2. Pore Water Pressure
Figure 10 presents the distribution curve of pore water pressure along the vertical profile of maximum surface settlement under Case 0 during the dewatering and excavation process. To minimize errors due to variations in piezometer sensitivity, high-precision miniature piezometers were used to accurately measure pore water pressure in the soil surrounding the excavation [34]. In the figure, negative values indicate a reduction in pore water pressure.
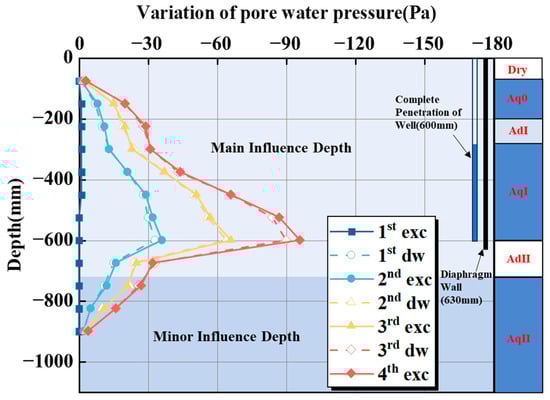
Figure 10.
Pore water pressure distribution during dewatering and excavation for case 0.
During the dewatering process, pore water pressure in all soil layers outside the excavation decreases, although the magnitude of the reduction varies across different locations. Generally, pore water pressure changes are smaller in the aquitards. During excavation, changes in pore water pressure across all soil layers are negligible. Within the primary influence depth range, pore water pressure changes increase with depth during each experimental step. In the minor influence depth range, pore water pressure decreases with depth.
This behavior is attributed to varying degrees of water table drawdown in different aquifers outside the excavation. Differential drawdown leads to distinct pore water pressure changes at different depths. For instance, the dewatering well simulated in the experiment is located within aquifer AqI, where dewatering is most effective, leading to the most significant change in pore water pressure in the AqI layer. In contrast, the aquitard layer AdII, with its much lower permeability coefficient compared to the upper aquifers, is minimally affected by water table drawdown in the upper layers. As a result, pore water pressure changes are relatively minor in the minor influence depth range.
A comparison of Figure 7 (settlement distribution) and Figure 10 (pore water pressure distribution) reveals a clear correlation between settlement in different soil layers outside the excavation and changes in pore water pressure. First, the settlement values at each step in Figure 7 are unevenly distributed with depth, forming a curve with two distinct inflection points. The upper inflection point is typically located in the aquitard layer AdI, while the lower inflection point is found in the aquitard layer AdII.
Further analysis of Figure 10 reveals significant fluctuations in pore water pressure within these two soil layers. Additionally, analysis of settlement slope (i.e., settlement per unit depth) in different soil layers outside the excavation, as shown in Figure 7, indicates that settlement in aquifer AqI is significantly higher than in other layers. This observation corresponds to the maximum change in pore water pressure within this layer.
Thus, it can be inferred that settlement per unit depth caused by dewatering is positively correlated with changes in pore water pressure. This relationship highlights the critical influence of pore water pressure changes on settlement behavior, particularly in aquifers with higher permeability and significant water table drawdown.
3.3. Derivation of Settlement Induced by Dewatering
This section presents an analytical model for calculating soil settlement induced by foundation pit dewatering, derived from the modified layered summation method. Unlike traditional approaches, this model incorporates deformation compatibility between adjacent soil layers and considers the effects of unsaturated soil behavior. The layered summation method, which is widely used in engineering practice, is a classical simplified approach. Its settlement mechanism can be explained by Terzaghi’s consolidation theory and the effective stress principle for saturated soils proposed by Terzaghi in 1923. During the dewatering process in a foundation pit, pore water pressure dissipates as dewatering progresses, and the resulting increase in effective stress is necessary to maintain the total stress balance. This increase in effective stress inevitably causes compressive deformation of the soil skeleton, which ultimately manifests as surface settlement at the macro scale. The modified layered summation method proposed by Wang [42] further considers that the settlement of a given layer is influenced not only by its own consolidation deformation but also by the consolidation deformation and deformation coordination of adjacent layers. Additionally, a deep-source pressure relief and overlying layer rebound mechanism occur during dewatering. The inconsistency in the deformation of the base slab is represented using a rebound coefficient. However, this method applies the effective stress principle for saturated soils to calculate settlement across the entire soil profile. It is important to note that this principle does not apply to the unsaturated soil present in the dewatered zone above the funnel curve.
To address this limitation, the model incorporates the effective stress principle for unsaturated soils in the dewatered zone [43], and a reduction coefficient is introduced to correct the settlement induced by dewatering in the unsaturated zone. The specific formulas are as follows:
where is the additional load at the midpoint of soil layer induced by dewatering; is the change in water head height in soil layer due to dewatering; is the unit weight of water; is the uncorrected compression of soil layer ; is the revised compression settlement of soil layer accounting for inverse rebound effects; is the calculated compression settlement of soil layer after corrections for inverse rebound effects and reductions due to the unsaturated soil zone; is the consolidation compression of soil layer ; is the compressive modulus of soil layer ; is the thickness of soil layer ; is the rebound coefficient of soil layer ; is the settlement at the top of soil layer after deformation coordination; is the settlement at the bottom of soil layer after deformation coordination, and is the reduction coefficient for the settlement of the unsaturated soil layer.
The water head change data obtained from the experiment were substituted into the above formulas to calculate the settlement values , for each soil layer at a distance of 100 mm from the diaphragm wall, as induced by dewatering. The measured settlement was also determined, and the error between the measured and calculated values was evaluated. The results are summarized in Table 3.
Table 3.
Settlement parameters of soil layers under dewatering.
As shown in Table 3, soil layers Aq0, AdI, and AqI are located in the unsaturated zone and require correction with a reduction coefficient ranging from 76% to 90%. In contrast, soil layers AdII and AqII, located below the dewatering wells, are less affected by dewatering and remain primarily in the saturated zone; a reduction coefficient of is sufficient for these layers. After applying the corrections, the theoretical settlement values for each soil layer exhibit minimal error compared to the measured values, thereby meeting the calculation requirements.
4. Parametric Analysis
4.1. Effect of the Insertion Ratio of the Diaphragm Wall
The insertion depth of the diaphragm wall significantly affects its interaction with the surrounding soil and influences the overall bearing capacity of the structure. This section investigates the effect of different diaphragm wall insertion depths on soil settlement during staged dewatering and excavation under complex geological conditions. Only the diaphragm wall insertion depth was varied in this study, while all other parameters remained constant. Three insertion depths were analyzed, as detailed in Table 4.
Table 4.
List of the different wall insertion ratio conditions.
4.1.1. Deformation Characteristics
Figure 11 illustrates the final surface settlement at the conclusion of the experiment for different diaphragm wall insertion depths. In all cases (I-1, I-2, and I-3), the maximum surface settlement consistently occurred at the first measuring point, which is located 100 mm outside the diaphragm wall. The maximum surface settlement values are 0.639 mm for Case I-1, 0.592 mm for Case I-2, and 0.451 mm for Case I-3. As the insertion ratio increases from 0.4 to 0.6, the maximum settlement decreases by 7.4%. Further increasing the ratio to 0.8 leads to an additional 29.4% reduction in settlement.
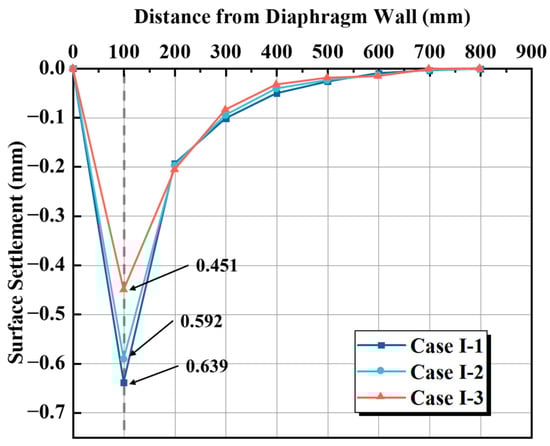
Figure 11.
Surface settlement at different diaphragm wall depths.
Increasing the insertion depth of the diaphragm wall not only reduces the overall magnitude of settlement but also changes the spatial distribution of surface settlement. As illustrated in Figure 11, a higher insertion ratio results in surface settlement that is more concentrated in the vicinity of the wall. The settlement curve becomes steeper near the diaphragm wall and levels off more quickly with distance, indicating a more localized deformation pattern. This is because a deeper wall lengthens the seepage path and enhances the cutoff effect on groundwater, which limits the spread of excess pore pressure and confines the settlement zone closer to the excavation.
These results suggest that, when the diaphragm wall does not fully penetrate the aquifer, increasing the insertion depth only slightly improves control of the surface settlement outside the excavation. This is because, even with an increased insertion depth, the hydraulic connection between the inside and outside of the pit cannot be effectively improved, and only a limited reduction in settlement caused by dewatering can be achieved. In contrast, when the diaphragm wall fully penetrates the aquifer, it effectively blocks the hydraulic connection between the inside and outside of the pit and increases the seepage path, which significantly reduces settlement in the surrounding soil.
Figure 12 depicts the total dewatering settlement rate () and the dewatering settlement rates for each cycle (, , ) at different insertion depths. The results show that decreases as the diaphragm wall insertion depth increases, falling from 0.55 in Case I-1 to 0.52 in Case I-2 and further to 0.45 in Case I-3. A similar downward trend is observed in deeper soil layers, indicating that the influence of dewatering on settlement decreases with greater diaphragm wall insertion depth, whereas the effect of excavation on settlement becomes more pronounced.
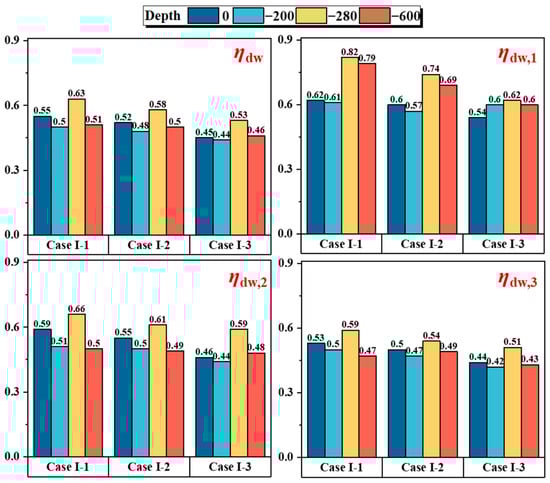
Figure 12.
, at different diaphragm wall depths.
The values for each cycle follow a similar trend, with cumulative effects becoming increasingly apparent as the experiment progresses. Analysis of deep settlement 100 mm from the wall (Figure 13) indicates that, in Case I-1 and Case I-2, where the diaphragm wall does not fully penetrate aquifer AqI, the hydraulic cutoff effect is insufficient. Therefore, water pressure reduction and settlement due to dewatering are limited. In contrast, in Case I-3, where the diaphragm wall fully penetrates aquifer AqI, the hydraulic connection between the interior and exterior of the excavation is effectively severed, significantly reducing settlement.
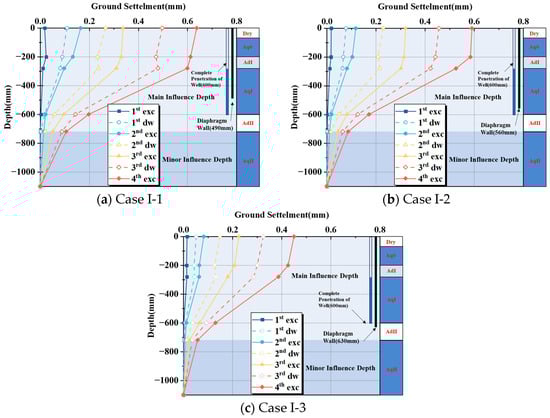
Figure 13.
Deep settlement 100 mm from wall at different diaphragm wall depths.
Further analysis reveals that dewatering-induced settlement is mainly concentrated within aquifer AqI, at depths of −280 mm to −600 mm. The total dewatering settlement rate () at the top of this layer ranges from 0.53 to 0.63 for different insertion depths. The cyclic dewatering settlement rates are as follows: ranges from 0.62 to 0.82, from 0.59 to 0.66, and from 0.51 to 0.59.
4.1.2. Seepage Characteristics
Water level curves for each condition (Figure 14) were plotted using measurements from piezometers and water head boards. In Case I-1 and Case I-2, where the diaphragm wall does not fully penetrate aquifer AqI, the hydraulic connection between the interior and exterior of the excavation remains relatively strong. Consequently, groundwater recharge from outside the excavation is significant, and most head loss occurs in the soil layers surrounding the excavation.
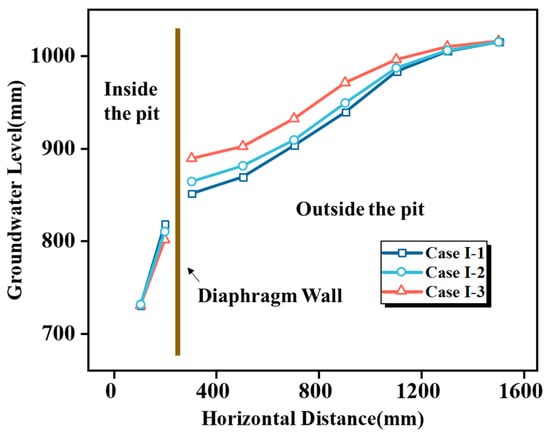
Figure 14.
Groundwater level at different diaphragm wall depths.
In contrast, in Case I-3, where the diaphragm wall fully penetrates aquifer AqI and extends into aquitard AdII, the hydraulic connection between the interior and exterior of the excavation is weakened. The seepage path is lengthened, resulting in increased head loss at the diaphragm wall. Simultaneously, the radius of the dewatering influence decreases. As the insertion depth increases, the water level difference between the interior and exterior of the excavation increases to 54 mm in Case I-2 and 88 mm in Case I-3. These values are 1.64 and 2.67 times greater than the 33 mm observed in Case I-1, respectively.
These findings demonstrate that full penetration of the diaphragm wall effectively blocks groundwater inflow from surrounding areas and reduces the environmental impact of dewatering. Combined with soil settlement analysis (Figure 13), these results highlight the link between external soil settlement under various conditions and seepage characteristics. This connection offers valuable insights for predicting the settlement behavior of the surrounding soil.
4.2. Effect of the Dewatering Depth in the Excavation
In excavation engineering, dewatering is routinely used to maintain a stable construction environment, particularly when the working surface is below the groundwater level. However, lowering the water level within the pit alters the hydraulic head in the surrounding soil layers, not only affecting nearby soils but also causing deformation at greater distances. Varying dewatering depths within the pit influence water level changes outside the pit and impact the settlement behavior of the surrounding soil.
This study examines the effect of different dewatering depths on soil settlement under staged dewatering and excavation in complex geological conditions, with the goal of minimizing settlement while meeting construction requirements. Four dewatering depths were analyzed by varying the dewatering depth in the pit, with all other parameters held constant. The test conditions are listed in Table 5.
Table 5.
List of the different dewatering depth conditions.
4.2.1. Deformation of Surrounding Soil
Figure 15 illustrates the surface settlement distribution at the end of the experiment for different dewatering depths within the pit. In all cases, the maximum surface settlement occurs at the first measurement point outside the pit (100 mm from the diaphragm wall), with values of 0.415 mm for Case II-1, 0.426 mm for Case II-2, 0.451 mm for Case II-3, and 0.494 mm for Case II-4. As the dewatering depth increases from 0 mm to 10 mm, the maximum settlement rises by 0.011 mm (2.7%). At 20 mm, the increase is an additional 0.025 mm (5.9%), and at 40 mm, the increase reaches 0.043 mm (9.5%). Overall, the maximum surface settlement outside the pit increases approximately linearly with increasing dewatering depth, although the differences in settlement are relatively small. The findings indicate that when the diaphragm wall fully penetrates the aquifer, adjusting the dewatering depth within the pit has a limited effect on controlling surface settlement outside the pit.
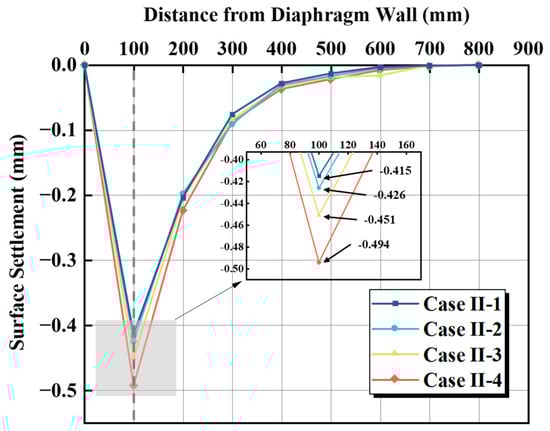
Figure 15.
Surface settlement at different dewatering depths.
When the diaphragm wall fully penetrates the aquifer, it effectively blocks the hydraulic connection between the interior and exterior of the pit. Consequently, deepening the dewatering process only lowers the water level inside the wall, without causing significant additional seepage or pore pressure dissipation in the surrounding soil. Therefore, increasing the dewatering depth has a diminishing effect on external settlement.
Figure 16 shows the total dewatering settlement rate () and the dewatering settlement rates for each cycle (, , ) under varying dewatering depths. The results show that increases with dewatering depth, with surface values of 0.4, 0.42, 0.45, and 0.48 for Case II-1, Case II-2, Case II-3, and Case II-4, respectively. A similar increasing trend is observed in deeper soil layers, indicating that as dewatering depth increases, the contribution of dewatering to settlement becomes more significant, while the contribution of excavation to settlement remains largely unchanged.
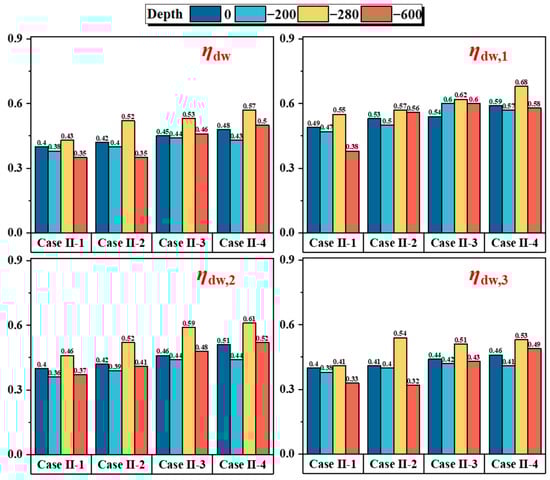
Figure 16.
, at different diaphragm wall depths.
The values for each cycle exhibit a comparable trend. As the experiment progresses, the cumulative effects of dewatering become more pronounced. Deep settlement analysis at 100 mm from the wall (Figure 17) shows that dewatering-induced settlement is concentrated in aquifer AqI, between depths of −280 mm and −600 mm. The total dewatering settlement rate at these depths ranges from 0.43 to 0.57 across all dewatering depths. The cyclic dewatering settlement rates are as follows: ranges from 0.55 to 0.68, from 0.46 to 0.61, and from 0.41 to 0.54.
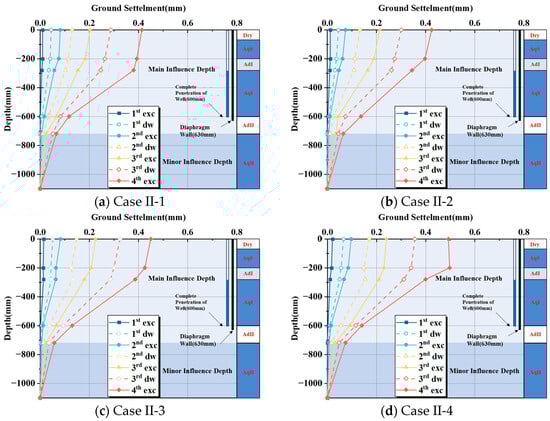
Figure 17.
Deep settlement 100 mm from wall at different dewatering depths.
4.2.2. Seepage Characteristics
Figure 18 presents the water level profiles inside and outside the diaphragm wall for different dewatering depths. Comparison of Case II-1, Case II-2, Case II-3, and Case II-4 shows that the water level difference between the inside and outside of the pit increases with dewatering depth. Specifically, the water level differences are 85 mm, 88 mm, 88 mm, and 91 mm, respectively. This trend indicates that greater dewatering depths result in larger water level differences.
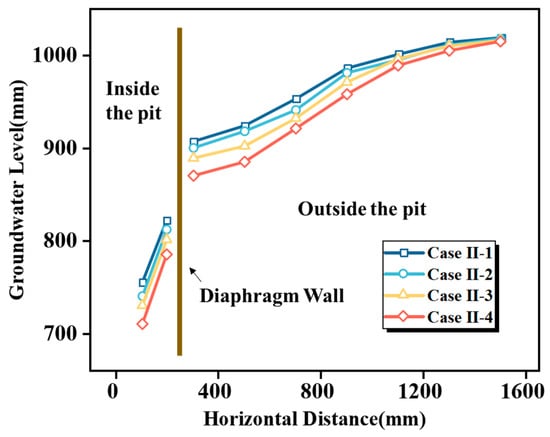
Figure 18.
Groundwater level at different dewatering depths.
This behavior results from increased dewatering volumes, which significantly lower groundwater levels inside the pit. Since the permeability of the surrounding soil remains unchanged, groundwater replenishment occurs slowly, resulting in a gradual increase in the water level difference.
Integration of settlement data (Figure 17) and seepage characteristics reveals that changes in seepage significantly influence settlement differences outside the pit. These findings provide a basis for predicting settlement behavior to some extent.
The parametric study results indicate that both the diaphragm wall insertion ratio and dewatering depth significantly influence soil deformation during excavation. An increased insertion ratio reduces seepage-induced settlement, especially when the diaphragm wall fully penetrates the aquifer. Conversely, increasing the dewatering depth amplifies settlement as a result of greater pore pressure dissipation.
Based on these findings, two key design strategies are recommended for mitigating deformation under similar hydrogeological conditions: (1) increasing the diaphragm wall insertion ratio—preferably to achieve full penetration into permeable aquifers—effectively severs hydraulic connectivity and reduces ground settlement; and (2) maintaining a moderate dewatering depth helps prevent excessive drawdown, which could otherwise cause abrupt increases in effective stress and unnecessary soil consolidation. These recommendations provide valuable guidance for optimizing deformation control in deep foundation pit design.
5. Conclusions
This study investigates the coupled effects of dewatering and excavation on soil deformation in deep foundation pits, particularly in alternating multi-aquifer–aquitard environments with diaphragm wall barriers. Based on a reduced-scale model test simulating a subway station project in Taiyuan, this research quantitatively analyzed settlement and seepage patterns under various diaphragm wall insertion ratios and dewatering depths. The main conclusions are as follows:
- (1)
- In layered strata, dewatering near a highly permeable aquifer leads to significant soil deformation. Settlement decreases with increasing distance from the diaphragm wall and is primarily concentrated within the dewatered aquifer and its overlying layers, with the influence extending downward as excavation progresses.
- (2)
- Settlement induced by dewatering is mainly attributed to reductions in pore water pressure, particularly in high-permeability aquifers such as AqI. Analysis of settlement rates across construction cycles shows that dewatering has a greater effect during the early stages, while excavation gradually becomes the dominant factor as construction advances.
- (3)
- This study proposes an analytical formula for calculating dewatering-induced soil settlement based on a modified layered summation method. The model incorporates deformation coordination effects and introduces a reduction coefficient for unsaturated soil zones, thereby improving the accuracy of settlement prediction.
- (4)
- Increasing the diaphragm wall insertion ratio significantly reduces external settlement, especially when the wall fully penetrates the aquifer, effectively blocking seepage paths.
- (5)
- The analysis reveals that the influence of dewatering depth on the settlement of the surrounding soil is limited. In particular, when the diaphragm wall fully penetrates the aquifer, further increases in dewatering depth within the pit have a diminishing effect on controlling settlement outside the pit.
Future research should validate the proposed findings under a range of geological conditions. Additionally, integrating physical model results with numerical simulations is recommended to develop more general and practical design guidelines.
Author Contributions
Conceptualization, Y.J.; methodology, C.Z., Y.C., G.Z. and G.L.; formal analysis, C.Z. and G.L.; resources, Y.C.; writing—original draft, C.Z.; writing—review and editing, G.Z., G.L. and Y.J.; visualization, C.Z.; supervision, Y.J.; funding acquisition, Y.J. All authors have read and agreed to the published version of the manuscript.
Funding
This research was funded by the National Natural Science Foundation of China (No. 51879180), and the Science and Technology Development Project of Taiyuan Rail Transit Group Co., Ltd., China (No. KY20201001).
Data Availability Statement
Data used for this work are available upon reasonable request.
Conflicts of Interest
Author Yimei Cheng was employed by the company Taiyuan Rail Transit Group Co., Ltd. The remaining authors declare that the research was conducted in the absence of any commercial or financial relationships that could be construed as a potential conflict of interest.
References
- Lin, S.S.; Shen, S.L.; Zhang, N.; Zhou, A.N. An Extended TODIM-Based Model for Evaluating Risks of Excavation System. Acta Geotech. 2022, 17, 1053–1069. [Google Scholar] [CrossRef]
- Wu, Y.X.; Shen, S.L.; Lyu, H.M.; Zhou, A.N. Analyses of Leakage Effect of Waterproof Curtain during Excavation Dewatering. J. Hydrol. 2020, 583, 124582. [Google Scholar] [CrossRef]
- Goh, A.; Zhang, R.H.; Wang, W.; Wang, L.; Liu, H.L.; Zhang, W. G Numerical Study of the Effects of Groundwater Drawdown on Ground Settlement for Excavation in Residual Soils. Acta Geotech. 2020, 15, 1259–1272. [Google Scholar] [CrossRef]
- Wu, Y.X.; Lyu, H.M.; Han, J.; Shen, S.L. Dewatering–Induced Building Settlement around a Deep Excavation in Soft Deposit in Tianjin, China. J. Geotech. Geoenviron. Eng. 2019, 145, 05019003. [Google Scholar] [CrossRef]
- Zeng, C.F.; Zheng, G.; Xue, X.L.; Mei, G.X. Combined Recharge: A Method to Prevent Ground Settlement Induced by Redevelopment of Recharge Wells. J. Hydrol. 2019, 568, 1–11. [Google Scholar] [CrossRef]
- Li, M.G.; Chen, J.J.; Xia, X.H.; Zhang, Y.Q.; Wang, D.F. Statistical and Hydro-Mechanical Coupling Analyses on Groundwater Drawdown and Soil Deformation Caused by Dewatering in a Multi-Aquifer-Aquitard System. J. Hydrol. 2020, 589, 125365. [Google Scholar] [CrossRef]
- Shen, S.L.; Wu, Y.X.; Misra, A. Calculation of Head Difference at Two Sides of a Cut-Off Barrier during Excavation Dewatering. Comput. Geotech. 2017, 91, 192–202. [Google Scholar] [CrossRef]
- Li, Q.; Zhang, J.; Zheng, G.; Cheng, X.S.; Lei, Y.W.; Sun, Y.D.; Jia, J.W.; Liu, X.M. Mechanisms and Countermeasures of Deformation Induced by Dewatering of Excavation in Leaky Aquifers. China Civ. Eng. J. 2023, 56, 89–101. [Google Scholar]
- Wang, X.W.; Yang, T.L.; Xu, Y.S.; Shen, S.L. Evaluation of Optimized Depth of Waterproof Curtain to Mitigate Negative Impacts during Dewatering. J. Hydrol. 2019, 577, 123969. [Google Scholar] [CrossRef]
- Tan, Y.; Lu, Y.; Wang, D. Deep Excavation of the Gate of the Orient in Suzhou Stiff Clay: Composite Earth-Retaining Systems and Dewatering Plans. J. Geotech. Geoenviron. Eng. 2018, 144, 05017009. [Google Scholar] [CrossRef]
- Wang, J.; Liu, X.; Wu, Y.; Liu, S.; Wu, L.; Lou, R.; Lu, J.; Yin, Y. Field Experiment and Numerical Simulation of Coupling Non-Darcy Flow Caused by Curtain and Pumping Well in Foundation Pit Dewatering. J. Hydrol. 2017, 549, 277–293. [Google Scholar] [CrossRef]
- Pujades, E.; Vázquez-Suñé, E.; Carrera, J.; Jurado, A. Dewatering of a Deep Excavation Undertaken in a Layered Soil. Eng. Geol. 2014, 178, 15–27. [Google Scholar] [CrossRef]
- Xu, Y.S.; Shen, S.L.; Ma, L.; Sun, W.J.; Yin, Z.Y. Evaluation of the Blocking Effect of Retaining Walls on Groundwater Seepage in Aquifers with Different Insertion Depths. Eng. Geol. 2014, 183, 254–264. [Google Scholar] [CrossRef]
- Zhang, W.G.; Goh, A.T.C.; Goh, K.H.; Chew, O.Y.S.; Zhou, D.; Zhang, R.H. Performance of Braced Excavation in Residual Soil with Groundwater Drawdown. Undergr. Space 2018, 3, 150–165. [Google Scholar] [CrossRef]
- Zeng, C.F.; Zheng, G.; Zhou, X.F.; Xue, X.L.; Zhou, H.Z. Behaviours of Wall and Soil during Pre-Excavation Dewatering under Different Foundation Pit Widths. Comput. Geotech. 2019, 115, 103169. [Google Scholar] [CrossRef]
- Li, M.G.; Chen, J.J.; Xu, Y.S.; Tong, D.G.; Cao, W.W.; Shi, Y.J. Effects of Groundwater Exploitation and Recharge on Land Subsidence and Infrastructure Settlement Patterns in Shanghai. Eng. Geol. 2021, 282, 105995. [Google Scholar] [CrossRef]
- Wu, Y.X.; Zheng, Q.; Zhou, A.; Shen, S.L. Numerical Evaluation of the Ground Response Induced by Dewatering in a Multi-Aquifer System. Geosci. Front. 2021, 12, 101209. [Google Scholar] [CrossRef]
- Zeng, C.F.; Wang, S.; Xue, X.L.; Zheng, G.; Mei, G.X. Evolution of Deep Ground Settlement Subject to Groundwater Drawdown during Dewatering in a Multi-Layered Aquifer-Aquitard System: Insights from Numerical Modelling. J. Hydrol. 2021, 603, 127078. [Google Scholar] [CrossRef]
- Zeng, C.F.; Xue, X.L.; Zheng, G.; Xue, T.Y.; Mei, G.X. Responses of Retaining Wall and Surrounding Ground to Pre-Excavation Dewatering in an Alternated Multi-Aquifer-Aquitard System. J. Hydrol. 2018, 559, 609–626. [Google Scholar] [CrossRef]
- Feng, Q.; Lin, H. Transient Flow Induced by Pumping in an Anisotropic Confined Aquifer with a Waterproof Curtain during Excavation Dewatering. Comput. Geotech. 2024, 168, 106116. [Google Scholar] [CrossRef]
- Lyu, H.M.; Shen, S.L.; Wu, Y.X.; Zhou, A.N. Calculation of Groundwater Head Distribution with a Close Barrier during Excavation Dewatering in Confined Aquifer. Geosci. Front. 2021, 12, 791–803. [Google Scholar] [CrossRef]
- Wang, J.; Liu, X.; Liu, S.; Zhu, Y.; Pan, W.; Zhou, J. Physical Model Test of Transparent Soil on Coupling Effect of Cut-Off Wall and Pumping Wells during Foundation Pit Dewatering. Acta Geotech. 2019, 14, 141–162. [Google Scholar] [CrossRef]
- Xu, Y.S.; Yan, X.X.; Shen, S.L.; Zhou, A.N. Experimental Investigation on the Blocking of Groundwater Seepage from a Waterproof Curtain during Pumped Dewatering in an Excavation. Hydrogeol. J. 2019, 27, 2659–2672. [Google Scholar] [CrossRef]
- Liu, X.; Huang, H.; Liu, X.; He, S. Analysis of Deep Dewatering Foundation Pit and Retaining Structure Considering Coupled Seepage-stress Effects. KSCE J. Civ. Eng. 2025, 100212. [Google Scholar] [CrossRef]
- Zeng, C.F.; Powrie, W.; Xue, X.L.; Li, M.K.; Mei, G.X. Effectiveness of a Buttress Wall in Reducing Retaining Wall Movement during Dewatering before Bulk Excavation. Acta Geotech. 2021, 16, 3253–3267. [Google Scholar] [CrossRef]
- Zeng, C.F.; Xue, X.L.; Li, M.K. Use of Cross Wall to Restrict Enclosure Movement during Dewatering inside a Metro Pit before Soil Excavation. Tunn. Undergr. Space Technol. 2021, 112, 103909. [Google Scholar] [CrossRef]
- Zheng, G.; Zeng, C.F.; Diao, Y.; Xue, X.L. Test and Numerical Research on Wall Deflections Induced by Pre-Excavation Dewatering. Comput. Geotech. 2014, 62, 244–256. [Google Scholar] [CrossRef]
- Zeng, C.F.; Song, W.W.; Xue, X.L.; Li, M.K.; Bai, N.; Mei, G.X. Construction Dewatering in a Metro Station Incorporating Buttress Retaining Wall to Limit Ground Settlement: Insights from Experimental Modelling. Tunn. Undergr. Space Technol. 2021, 116, 104124. [Google Scholar] [CrossRef]
- Lazaridis, P.C.; Kavvadias, I.E.; Demertzis, K.; Iliadis, L.; Vasiliadis, L.K. Structural Damage Prediction of a Reinforced Concrete Frame under Single and Multiple Seismic Events Using Machine Learning Algorithms. Appl. Sci. 2022, 12, 3845. [Google Scholar] [CrossRef]
- Ni, J.C.; Cheng, W.C.; Ge, L. A Simple Data Reduction Method for Pumping Tests with Tidal, Partial Penetration, and Storage Effects. Soils Found. 2013, 53, 894–902. [Google Scholar] [CrossRef]
- Pujades, E.; Vázquez-Suñé, E.; Carrera, J.; Vilarrasa, V.; De Simone, S.; Jurado, A.; Ledesma, A.; Ramos, G.; Lloret, A. Deep Enclosures versus Pumping to Reduce Settlements during Shaft Excavations. Eng. Geol. 2014, 169, 100–111. [Google Scholar] [CrossRef]
- Liu, X.X.; Shen, S.L.; Xu, Y.S.; Yin, Z.Y. Analytical Approach for Time-Dependent Groundwater Inflow into Shield Tunnel Face in Confined Aquifer. Int. J. Numer. Anal. Methods Geomech. 2018, 42, 655–673. [Google Scholar] [CrossRef]
- Wang, Z.F.; Shen, S.L.; Modoni, G. Enhancing Discharge of Spoil to Mitigate Disturbance Induced by Horizontal Jet Grouting in Clayey Soil: Theoretical Model and Application. Comput. Geotech. 2019, 111, 222–228. [Google Scholar] [CrossRef]
- Zeng, C.F.; Xue, X.L.; Song, W.W.; Li, M.K.; Bai, N. Mechanism of Foundation Pit Deformation Caused by Dewatering before Soil Excavation: An Experimental Study. Rock Soil Mech. 2020, 41, 2963–2972, 2983. [Google Scholar]
- Wang, Z.; Zhang, J.; Fu, X.; Yan, K.; Wang, M.; Peng, S. Isolated Similar Design Method for a Scaled Model Test and Its Application to Slope-Anchor Cable-Lattice Beam System. Rock Soil Mech. 2016, 37, 2617–2623. [Google Scholar]
- ASTM D5084-10; Standard Test Methods for Measurement of Hydraulic Conductivity of Saturated Porous Materials Using a Flexible Wall Permeameter. ASTM International: West Conshohocken, PA, USA, 2010.
- Hsieh, P.G.; Ou, C.Y. Shape of Ground Surface Settlement Profiles Caused by Excavation. Can. Geotech. J. 1998, 35, 1004–1017. [Google Scholar] [CrossRef]
- Yang, Q.; Zhao, B. Experimental and Theoretical Study on the Surface Subsidence by Dewatering of Foundation Pit in Phreatic Aquifer. Chin. J. Rock Mech. Eng. 2018, 37, 1506–1519. [Google Scholar]
- Pujades, E.; De Simone, S.; Carrera, J.; Vazquez-Sune, E.; Jurado, A. Settlements around Pumping Wells: Analysis of Influential Factors and a Simple Calculation Procedure. J. Hydrol. 2017, 548, 225–236. [Google Scholar] [CrossRef]
- Zeng, C.F.; Wang, S.; Xue, X.L.; Zheng, G.; Mei, G.X. Characteristics of Ground Settlement due to Combined Actions of Groundwater Drawdown and Enclosure Wall Movement. Acta Geotech. 2022, 17, 4095–4112. [Google Scholar] [CrossRef]
- Liu, F. Research on Ground Settlement Caused by Dewatering Considering the Initial Hydraulic Gradient and Interlayer Recharge. Ph.D. Thesis, China Academy of Buildings Research, Beijing, China, 2016. [Google Scholar]
- Wang, J.; Wu, L.; Zhu, Y.; Tang, Y.; Yang, P.; Lou, R. Mechanism of Dewatering-Induced Ground Subsidence in Deep Subway Station Pit and Calculation Method. Chin. J. Rock Mech. Eng. 2009, 28, 1010–1019. [Google Scholar]
- Wu, Y.; Zhu, Y. Improved Calculation of Settlement due to Dewatering of Foundation Pits in Phreatic Aquifer. J. Zhejiang Univ. Eng. Sci. 2016, 50, 2188–2197. [Google Scholar]
Disclaimer/Publisher’s Note: The statements, opinions and data contained in all publications are solely those of the individual author(s) and contributor(s) and not of MDPI and/or the editor(s). MDPI and/or the editor(s) disclaim responsibility for any injury to people or property resulting from any ideas, methods, instructions or products referred to in the content. |
© 2025 by the authors. Licensee MDPI, Basel, Switzerland. This article is an open access article distributed under the terms and conditions of the Creative Commons Attribution (CC BY) license (https://creativecommons.org/licenses/by/4.0/).