Article

Numerical Study on Long-Distance Heating System Based on High-Velocity Jet at Ambient Temperature for Induced Air Supply

1
School of Building Services Science and Engineering, Xi’an University of Architecture and Technology, Xi’an 710055, China
2
State Key Laboratory of Green Building, Xi’an University of Architecture and Technology, Xi’an 710055, China
*
Author to whom correspondence should be addressed.
Buildings 2025, 15(6), 979; https://doi.org/10.3390/buildings15060979
Submission received: 13 February 2025 / Revised: 14 March 2025 / Accepted: 18 March 2025 / Published: 20 March 2025
(This article belongs to the Special Issue Research on Ventilation and Airflow Distribution of Building Systems)

Abstract

In the long-distance thermal air heating process of large space buildings, there are common problems of thermal air trajectory deflection and low energy efficiency caused by thermal buoyancy. This study proposes an induced air supply system that is easy to design for integration; that is, adding a high-velocity ambient temperature induced airflow above the thermal jet, which can instantly and efficiently suppress the buoyancy of the thermal jet and maintain its axial center temperature, thereby achieving good heating performance. This study uses a numerical simulation method to analyze the effect of the induced airflow and compares the flow field characteristics and heating performance of a single thermal jet and an induced air supply system. The results show that the greater the velocity of the induced airflow, the wider the control range of the thermal jet; the induced airflow can reduce the mixing of the thermal jet and the ambient airflow, and effectively suppress the deflection of the thermal jet and increase its axial center temperature; when the target area is close to the air inlet (y/D ≤ 7.5), the single thermal jet air supply can be used, because too small a deflection height will cause more induced airflow to enter the target area, which will worsen the heating effect. The induced air supply system is best for improving the average temperature of the target area at y/D = 15; as the target distance increases, on the premise of ensuring the blowing feeling, it is possible to consider increasing the induced airflow velocity to obtain a higher heating gain.

1. Introduction

Building energy consumption plays an important role in global energy consumption, and its proportion of total energy consumption is expected to continue to grow from 20.6% in 2022 to 22% in 2050 [1]. As a major component of building energy consumption, the optimal design and efficient regulation of the heating, ventilation, and air conditioning (HVAC) system is not only crucial to ensuring indoor thermal comfort and air quality [2,3,4], but also has a significant impact on the energy consumption of the building [5,6]. Among these factors, the selection of the heating system is particularly critical, as it directly affects the accurate prediction and regulation of indoor air flow distribution and, thus, affects the uniformity of the indoor thermal environment [7]. When there is a temperature difference between the supply air jet and the surrounding air flow, the thermal buoyancy effect will cause the jet to deflect [8]. This deflection phenomenon will not only have an adverse effect on the indoor thermal environment, but also reduce the thermal efficiency of the air supply system [9]. Therefore, optimizing the air supply system and achieving more precise air flow control are of great significance for improving energy efficiency and improving indoor environmental quality [10,11].
The deflection of non-isothermal jets usually manifests as thermal jets floating up and cold jets sinking down. This phenomenon will shorten the air flow propagation distance and limit the coverage range, thus failing to meet the air supply needs of long-distance indoor spaces [12,13]. In traditional mixed ventilation, the air supply velocity is usually increased, and the jet with larger impulse is used to weaken the buoyancy effect and reduce environmental entrainment, but too high air supply velocity will increase human discomfort [14,15]. Studies have shown that compared with circular orifices, thermal jets with parallel flow outlets can optimize the air flow trajectory and cover a longer distance [16]. At the same time, adding a secondary airflow device to the existing air supply can provide additional momentum for the supplied air, thereby ensuring the long-distance delivery of cold air [17,18]. In addition, by predicting the air flow trajectory and diffusion range of non-isothermal air supply in advance, the buoyancy characteristics can be used to achieve more accurate and comfortable personalized air supply [19]. In recent years, researchers have proposed a number of new air supply technologies. First, compared with traditional circular jet air supply, the use of air vortex ring air supply technology can enhance the directionality of air flow and slow down temperature attenuation [20,21]. Second, by coupling the air supply airflow with media of different densities, the jet deflection phenomenon can be effectively improved. For example, the oxygen–thermal coupled jet technology not only extends the horizontal range of the air supply jet but also solves the oxygen supply problem in plateau areas [22,23]. In addition, the use of tilted deflectors to guide the air supply jet to the target area can further optimize the indoor air flow distribution [8].
The phenomenon of non-isothermal jet deflection will aggravate indoor thermal stratification, thereby affecting the energy efficiency of the air supply system and the thermal comfort of the human body [9,24,25]. In response to this problem, researchers have proposed a variety of solutions. First, by optimizing the air supply layout of various ventilation systems, including adjusting the shape of the air supply inlet [26], the angle of the fan blades [27,28], and the position and height of the return air outlet [29], the indoor thermal environment can be improved from the perspective of airflow organization control. Secondly, as an effective airflow control technology, air curtains use high-velocity airflow to form an aerodynamic barrier to reduce the adverse diffusion of buoyancy plumes, thereby isolating energy transfer, such as segmented recirculating horizontal air curtain (SRHAC) [30]. In addition, the use of integrated personalized ventilation systems can customize the air supply needs of specific areas and reduce the impact of temperature stratification on thermal comfort from the perspective of improving the local microenvironment, for example, the hybrid system of impinging jet ventilation and ductless personalized ventilation [31,32], and the hybrid system of displacement ventilation and ductless personalized ventilation [33]. These technologies not only solve the problem of temperature stratification but also achieve the dual optimization goals of thermal comfort and energy efficiency.
The above research on the optimization design of ventilation systems mainly focuses on small and medium-sized public buildings. However, for large spaces, such as large conference rooms, stadiums, industrial workshops, etc., centralized air-conditioning systems or cabinet air-conditioning units are usually used for air supply. Due to the limitations of building structure and space layout, air-conditioning inlets are mostly arranged on the side walls of the building. As shown in Figure 1a, this layout method limits the air supply coverage during air conditioning cooling or heating, resulting in the thermal environment far away from the air inlet area often not being fully considered [18]. In addition, this phenomenon will lead to more significant indoor temperature gradients, further reducing the heating energy efficiency [25,34]. For most existing buildings, it is difficult to retrofit the air supply system to accommodate the need for more efficient ventilation. Therefore, existing ventilation solutions have limitations in practical applications and it difficult for them to meet the needs of large spaces for efficient and uniform air supply.
In order to solve the problems of short effective air supply distance and low energy efficiency of non-isothermal jets, this study proposes an induced air supply system that uses induced airflow to optimize the heating effect for the thermal air heating scenario in winter. That is, an ambient temperature induced air supply inlet is set above the heating air inlet to form a closely adjacent double-temperature air supply jet. The upper induced airflow is used to increase the forward momentum of the thermal air below, reduce the mixing of the thermal air flow and the ambient air, and finally, suppress the buoyancy of the lower thermal jet, extend the thermal air supply distance, and improve the performance of long-distance precision heating.
In this study, the effects of the size and air velocity of the ambient temperature induced air inlet on the trajectory and axial center temperature of the thermal jet are investigated, and the optimal induced airflow parameters are determined for each target heating area. The study is organized as follows: Section 2 explains the concept and principle of the induced air supply system; Section 3 describes the numerical simulation, evaluation indicators and case settings, Section 4 validates the numerical method; Section 5 discusses the research results in detail; and Section 6 gives the main conclusions of the study.

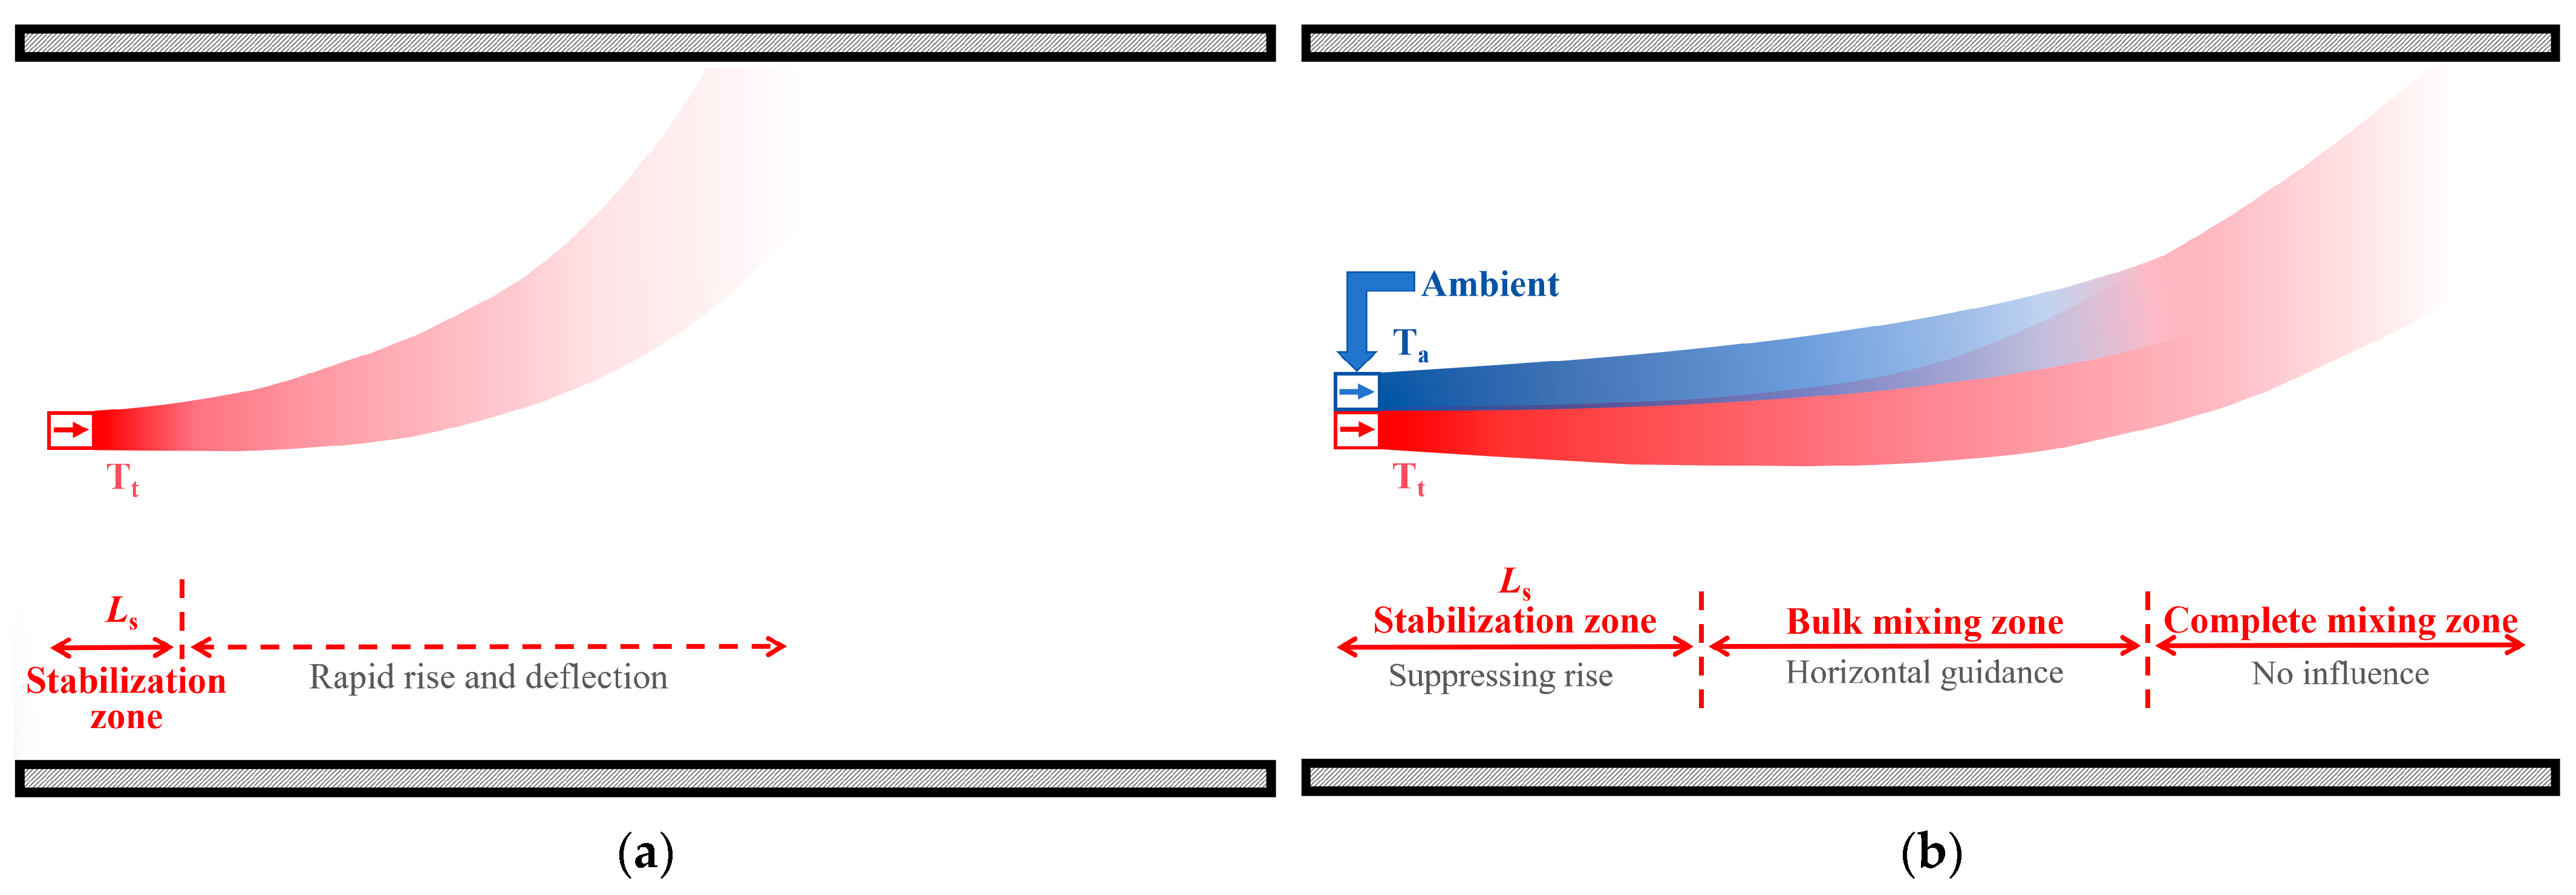
2. Concept of the Induced Air Supply System

In this study, the induced air supply system consists of two air inlets with different air supply temperatures: an ambient induced air inlet and a thermal air inlet. The airflow supplied by the ambient induced air inlet comes from the indoor environment, while the airflow of the thermal air inlet is provided by hot air heating equipment such as air conditioners and heaters. The ambient induced air inlet is located directly above the thermal air inlet, and the two air inlets are directly adjacent to each other. This layout can not only reduce the total area occupied by the air inlet, making it easier to realize the integrated design of the system, but also enable the induced airflow to immediately suppress the upward floating tendency of the thermal jet in the vertical direction after the thermal air is delivered, thereby weakening the influence of thermal buoyancy on the non-isothermal horizontal air supply range. In addition, this design can also reduce the mixing of the thermal jet with the ambient airflow, while providing the thermal jet with greater momentum in the air supply direction, which helps to improve the utilization efficiency of thermal energy.
Figure 1b shows the working principle of the induced air supply system. Within a certain distance near the air inlet, the diffusion trajectory of the heat jet is almost horizontal, and this area is defined as the jet stabilization zone (Ls). In this region, the momentum of the two jets is large and the mixing effect is weak, and the ambient temperature induced airflow has a significant inhibitory effect on the rising of the thermal jet. As the flow further develops, the entrainment and mixing of the thermal jet with the surrounding fluid is enhanced, accompanied by the deflection of the upper boundary of the thermal jet. This stage is defined as the bulk mixing zone. In the stage, the inhibitory effect of the induced airflow on thermal buoyancy gradually weakens, and at this time it mainly provides horizontal transport power for the thermal jet. Until the two jets are completely mixed, the influence of the induced airflow on the thermal jet disappears, and then, the induced air supply system exhibits the transport characteristics of a single jet.

3. Method

3.1. Numerical Simulation

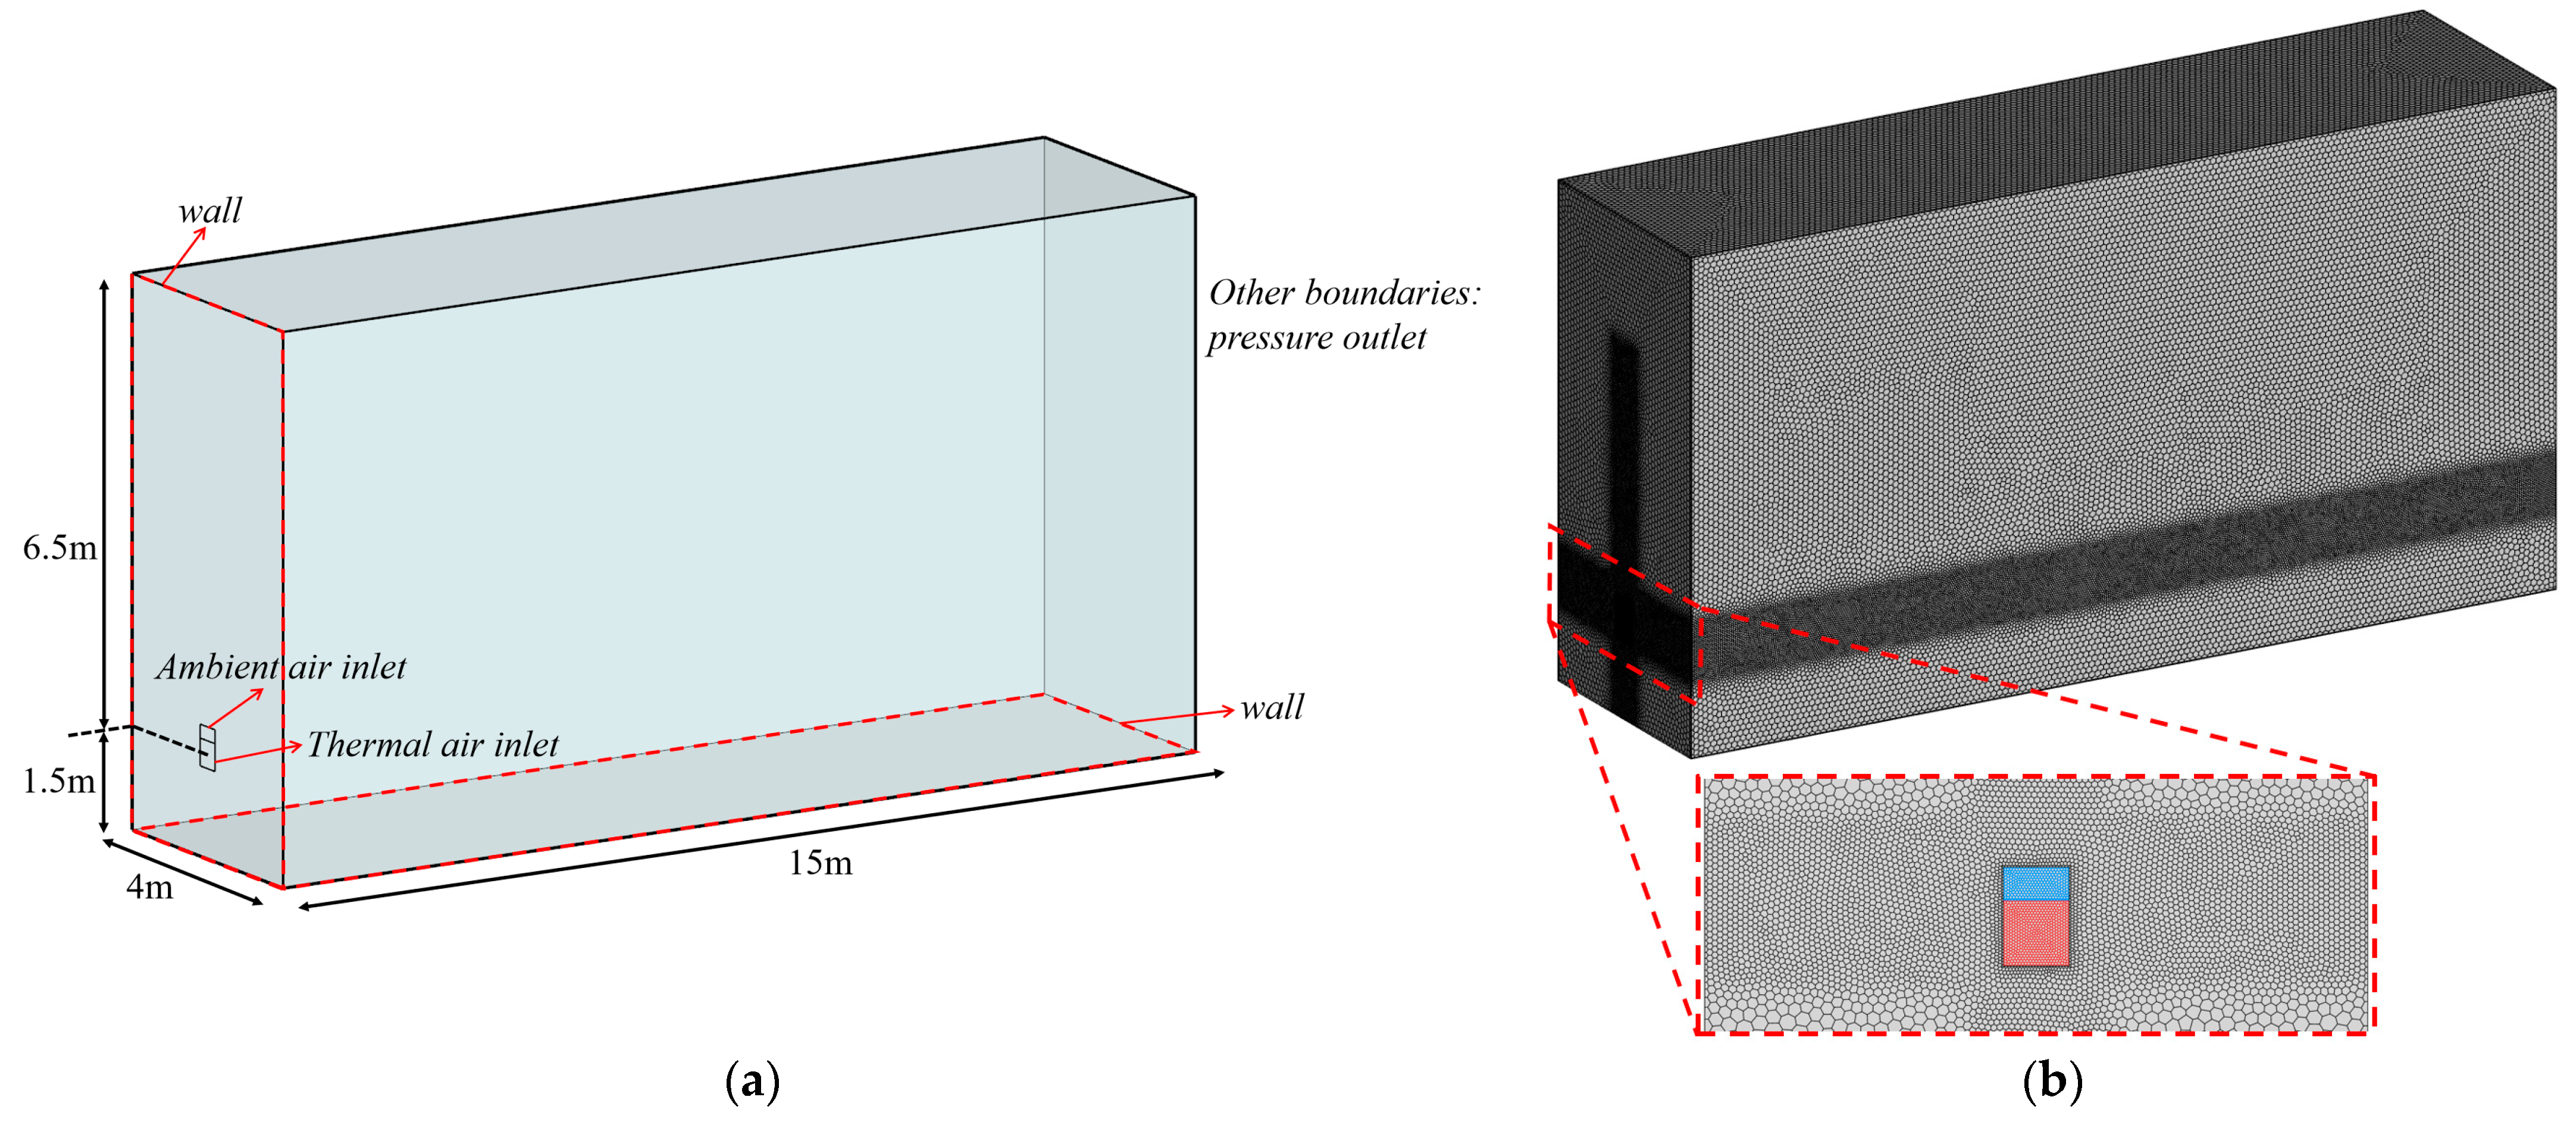
3.1.1. Computational Domain and Grid Distribution

In this study, the finite volume method is used to solve the transport trajectory of the thermal jet, and the established fluid calculation domain is shown in Figure 2a. The calculation domain size is set to length × width × height = 15 m × 4 m × 8 m to ensure that the boundary of the calculation domain will not affect the offset height and transportation distance of the jet, where the center position of the thermal air inlet is 1.5 m from the ground.
This study uses a polyhedral grid with a hexahedral grid as the core and uses a standard wall function to solve the flow law in the near-wall boundary layer. In order to ensure that y+ > 30 near the wall, the thickness of the first layer of grid near the wall is set to 0.93 × 10⁻³ m [35]. Since this study mainly examines the transport trajectory of the thermal jet, the air inlet and the main flow area are locally encrypted, and the grid growth rate from the encrypted area to the boundary of the calculation domain is 1.2. The specific grid division and encryption are shown in Figure 2b.

3.1.2. Boundary Conditions

The boundary conditions of the calculation model are shown in Table 1. The jet inlet boundary is set as the velocity inlet, and the wall and floor where the jet inlet is located are set as non-slip adiabatic walls. Since the calculation domain of this study is part of a large space building, the remaining outer boundaries can be extended outward, so they are set as pressure outlets. Under this condition, the indoor temperature rise can be ignored, and the supply air temperature of the ambient temperature induced air inlet is always 283.15 K.
This study adopts a steady-state solution, and opens the energy equation and gravity term. Assume that the air is an incompressible Newtonian fluid. The SIMPLE algorithm is used for the pressure–velocity coupling mode. The momentum, turbulent kinetic energy, turbulent dissipation rate, and energy all adopt the second-order upwind schemes. The pressure term adopts the PRESTO! discretization scheme. The specific numerical simulation solution settings are shown in Table 2. The residual value monitoring is turned on during the calculation process. When the residual value of the energy term is less than 10−6 and the residual value of other terms is less than 10−3, the calculation is considered to be converged.

3.1.3. Governing Equations and Computational Solution

Solving the continuity and momentum equations in the three-dimensional steady-state incompressible Reynolds-averaged Navier–Stokes equations, the general formula for the mass, momentum, and energy equations is as follows [36]:
ρ φ t + d i v ( ρ u φ ) = d i v ( Γ · g r a d φ ) + S
where φ is a general variable that can represent velocity, temperature, and other solution variables; Γ is a generalized diffusion coefficient; S is a generalized source term, in which each term is a transient term, a convection term, a diffusion term, and a source term.
In engineering flow problems, the two equations k- ε model is often used to capture turbulent characteristics [37]. This study selected the realizable k- ε turbulence model, which can obtain accurate calculation results when simulating unbounded shear flows such as mixed flows and plane jets, as well as when the fluid has a large degree of curvature [38,39]. The transport equations of this model include the turbulent kinetic energy (k) equation and the turbulent dissipation rate ( ε ) equation:
ρ k t + ρ x i u i k = x i μ + μ t σ k k x i + G k + G b ρ ε Y M
ρ ε t + ρ x i u i ε = x i μ + μ t σ ε ε x i + ρ C 1 S ε ρ C 2 ε 2 k + v ε + C ε 1 ε k C ε 3 G b
where u i represents the velocity component in the direction of the i axis, m/s; μ is the kinematic viscosity, m2/s; ρ is the air density, kg/m3; μ t is the turbulent viscosity and μ t = C μ k 2 ε , Pa·s; Y M is the effect of the compressibility of the fluid on turbulence. Since this study is an incompressible flow involving heat transfer, Y M = 0 ; the variables G k and G b are the turbulent kinetic energy generated by the velocity gradient and buoyancy, respectively; S is the modulus of the average strain rate tensor, which is defined as S = 2 S i j S i j . The model coefficients are C 1 = m a x [ 0.43 , η η + 5 ] , C 2 = 1.9 , and C ε 1 = 1.44 , where η = S k ε .

3.2. Evaluation Parameters

3.2.1. Thermal Jet Flow Characteristics

  • Axial center temperature (Tcenter)
In this study, the maximum temperature point at each cross section along the Y-axis direction is taken as the axis center position of the jet, and the temperature at the axis center is represented by Tcenter. By connecting these axis center points, the trajectory curve of the thermal jet is constructed, and its schematic diagram is shown in Figure 3a. By analyzing the distribution characteristics of the jet axis center temperature, this study can infer the overall temperature change trend of the thermal jet.
2.
Dimensionless deflection height (z*)
According to the definition of the jet trajectory, the offset height z of the jet at each position can be determined, so as to quantitatively analyze the deflection of the thermal jet along the flow path. To this end, this study introduces the dimensionless deflection height as an evaluation parameter, and its mathematical expression is defined as follows:
z * = z / D
where D is the characteristic size of the thermal air inlet, and in this study, D = 0.4 m.
3.
Local Archimedes number (Ary)
In order to explore the relative magnitude of buoyancy and inertial force at different development stages of thermal jet, this study introduces the local Archimedes number Ary [40] as a descriptive parameter, which is expressed as follows:
A r y = g y T / ( T a V y 2 )
where T a is the ambient temperature, and Vy is the velocity of the thermal jet axis center along the Y axis at a distance of y m from the air inlet. When Ary ≤ 0.15, it can be considered that the thermal jet is not affected by buoyancy and is in the momentum-dominated area; when 0.15 < Ary < 1, it is considered that the thermal jet is affected by the combined effect of inertia and buoyancy and is in the transition zone; when Ary ≥ 1, it is considered that the thermal jet is greatly affected by buoyancy and is in the buoyancy-dominated area.

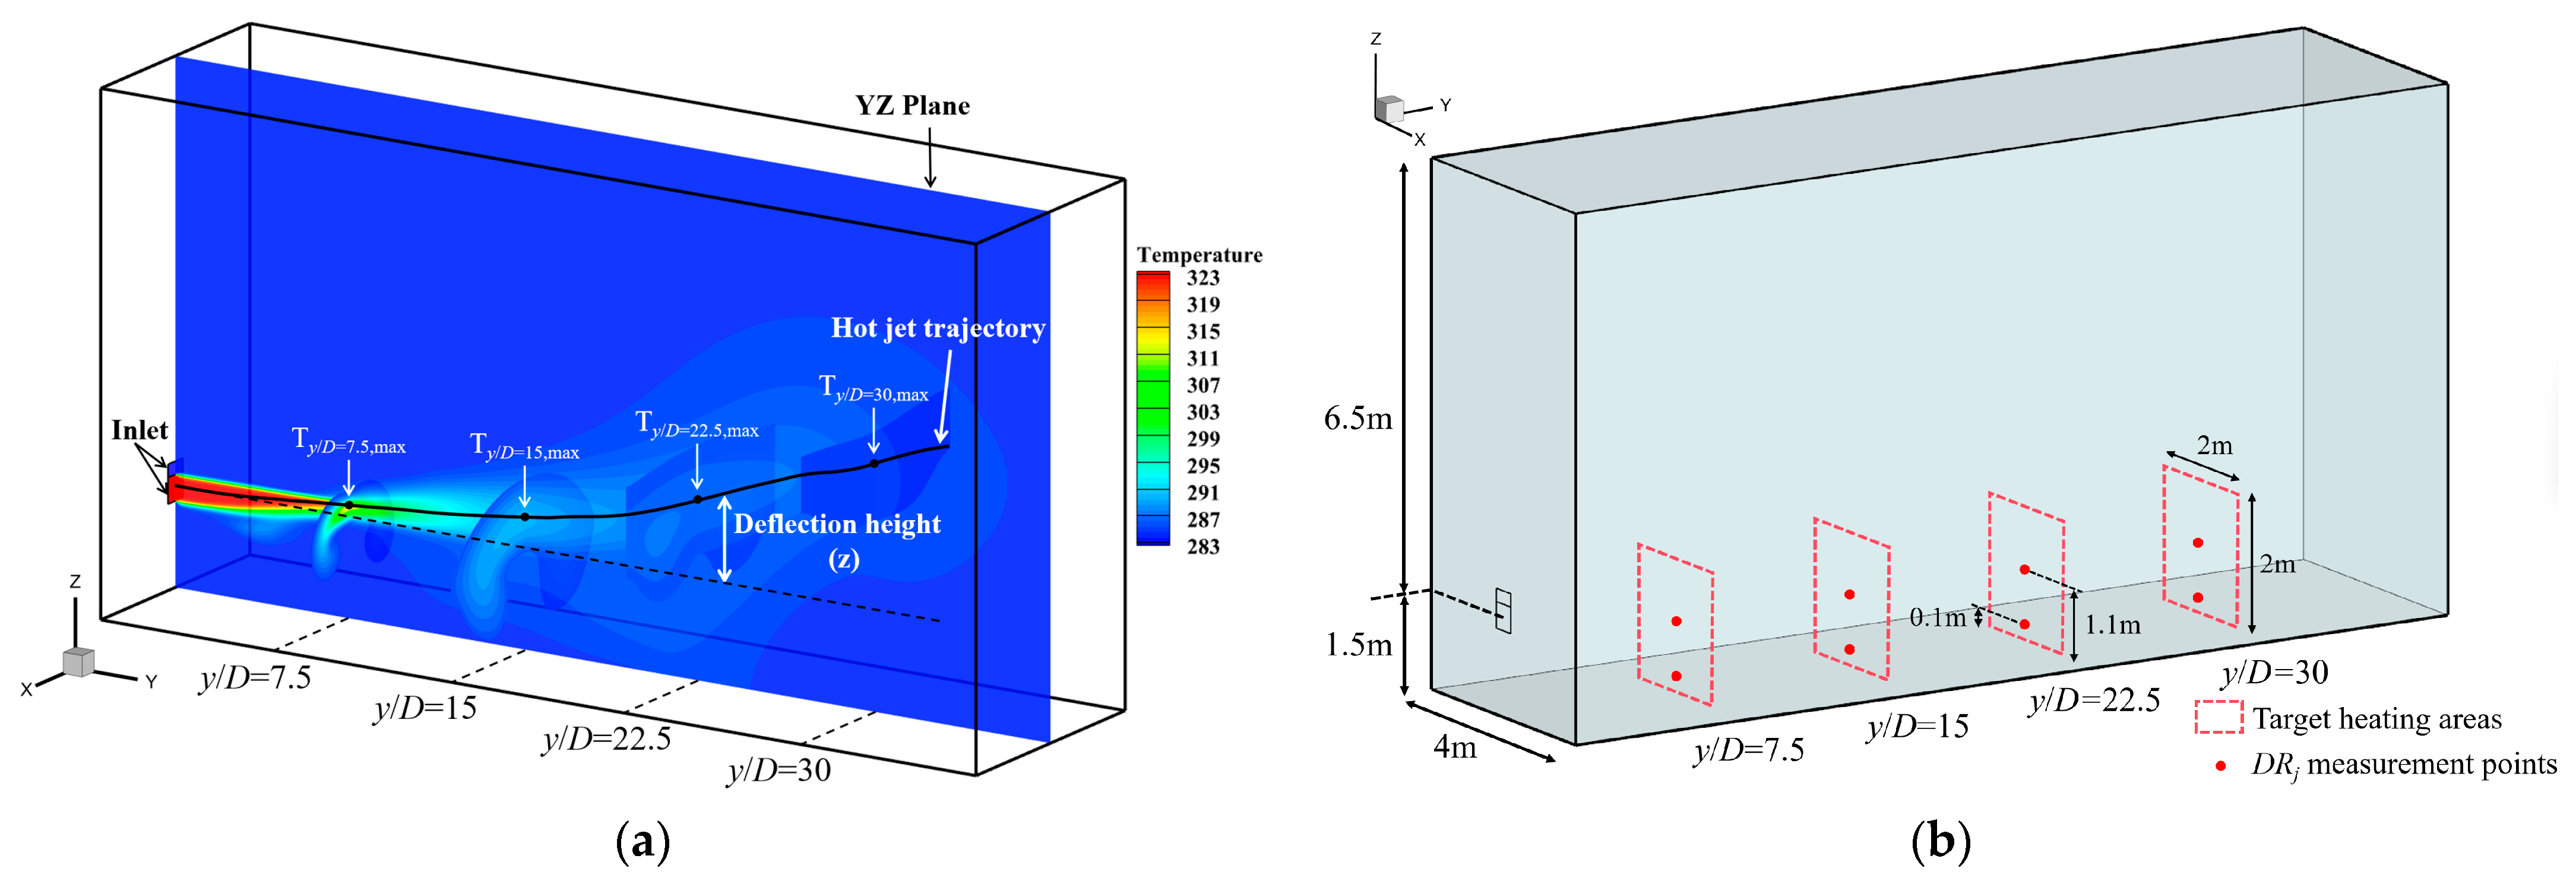
3.2.2. Target Area Heating Performance

In order to evaluate the impact of the induced air supply system on heating performance under different long-distance air supply requirements, this study defines four target heating areas, which are located at dimensionless distances y/D = 7.5, 15, 22.5, and 30. The size of each area is 2 m (width) × 2 m (height). The specific layout is shown in Figure 3b. Heating a certain area in the room mainly includes two evaluation factors: heating temperature and draught rate.
  • Heating gain ( T 0 )
The heating temperature is the difference T a between the average temperature in the area and the ambient temperature after the thermal air is delivered. At the same time, by comparing the average temperature change T 0 of the target area under each induced air supply condition relative to a single thermal jet, the heating gain of the induced air supply system can be quantitatively evaluated, providing a key indicator for determining the optimal parameter configuration. The expressions of T a and T 0 are as follows:
T a = T i j T a
T 0 = T i j T 0
where T 0 is the average temperature in a certain area under single thermal jet (case 0), and T i j is the average temperature in a certain area under induced air supply condition (case i-j).
2.
Draught rate ( D R w h o l e )
In order to consider the impact of the air supply velocity of the induced air supply system on human thermal comfort, this study uses the draught rate (DR) [41] to evaluate the local cooling sensation caused by air flow. The study focuses on the draught rate at vertical heights of 0.1 m and 1.1 m, which correspond to the human ankle position and the breathing height when sitting, respectively. The measurement point arrangement is shown in Figure 3b. The calculation formula for the local draught rate ( D R j ) at the measurement point is
D R j = ( 34 T ) ( V 0.05 ) 0.62 ( 3.14 + 0.37 · V · T u )
The calculation formula of the average draught rate ( D R w h o l e ) in the target area is
D R w h o l e = j 1 n D R j n
where T is the local air temperature, °C; V is the local air velocity, m/s, and when V < 0.05 m/s, take V = 0.05 m/s; T u is the local turbulence intensity, %; and n is the total number of indoor draught rate measurement points. According to the Chinese national standard GB 33658-2017 [42], D R w h o l e should be less than 40%.

3.3. Case Description

In the ventilation mode of this study, the velocity V a of the induced airflow is the key driving factor for guiding the horizontal transport of the thermal jet, while the size S a of the induced air inlet plays an important role in shielding the upward movement of the thermal jet. Therefore, in order to explore the specific impact of the induced airflow configuration on the thermal jet transport trajectory and heating performance, this study takes the size S a of the induced air inlet and the air supply velocity V a as the key research variables, and the induced airflow flow rate Q a is jointly determined by the size of the induced air inlet and the air supply velocity.
Table 3 shows the four air inlet models in detail and lists the corresponding operating conditions, including a single thermal jet ( S a : S t = 0:1) and three induced air supply systems ( S a : S t = 0.25:1, 0.5:1, 1:1). To ensure the comparability of the simulation results, the thermal air supply parameters of all operating conditions are kept consistent; that is, the thermal air inlet size S t , air supply velocity V t , and air supply temperature T t are all constant values, and the specific parameters are S t = D × D (D = 0.4 m), V t   = 5 m/s, and T t = 323.15 K. By adjusting the induced air inlet parameters, the best thermal air supply effect can be achieved in different target heating areas. In the setting of the induced air inlet, three different sizes S a were considered, namely, 0.25 D × D, 0.5 D × D, and D × D, as well as three different ambient temperature induced airflow velocities V a .

4. Model Validation

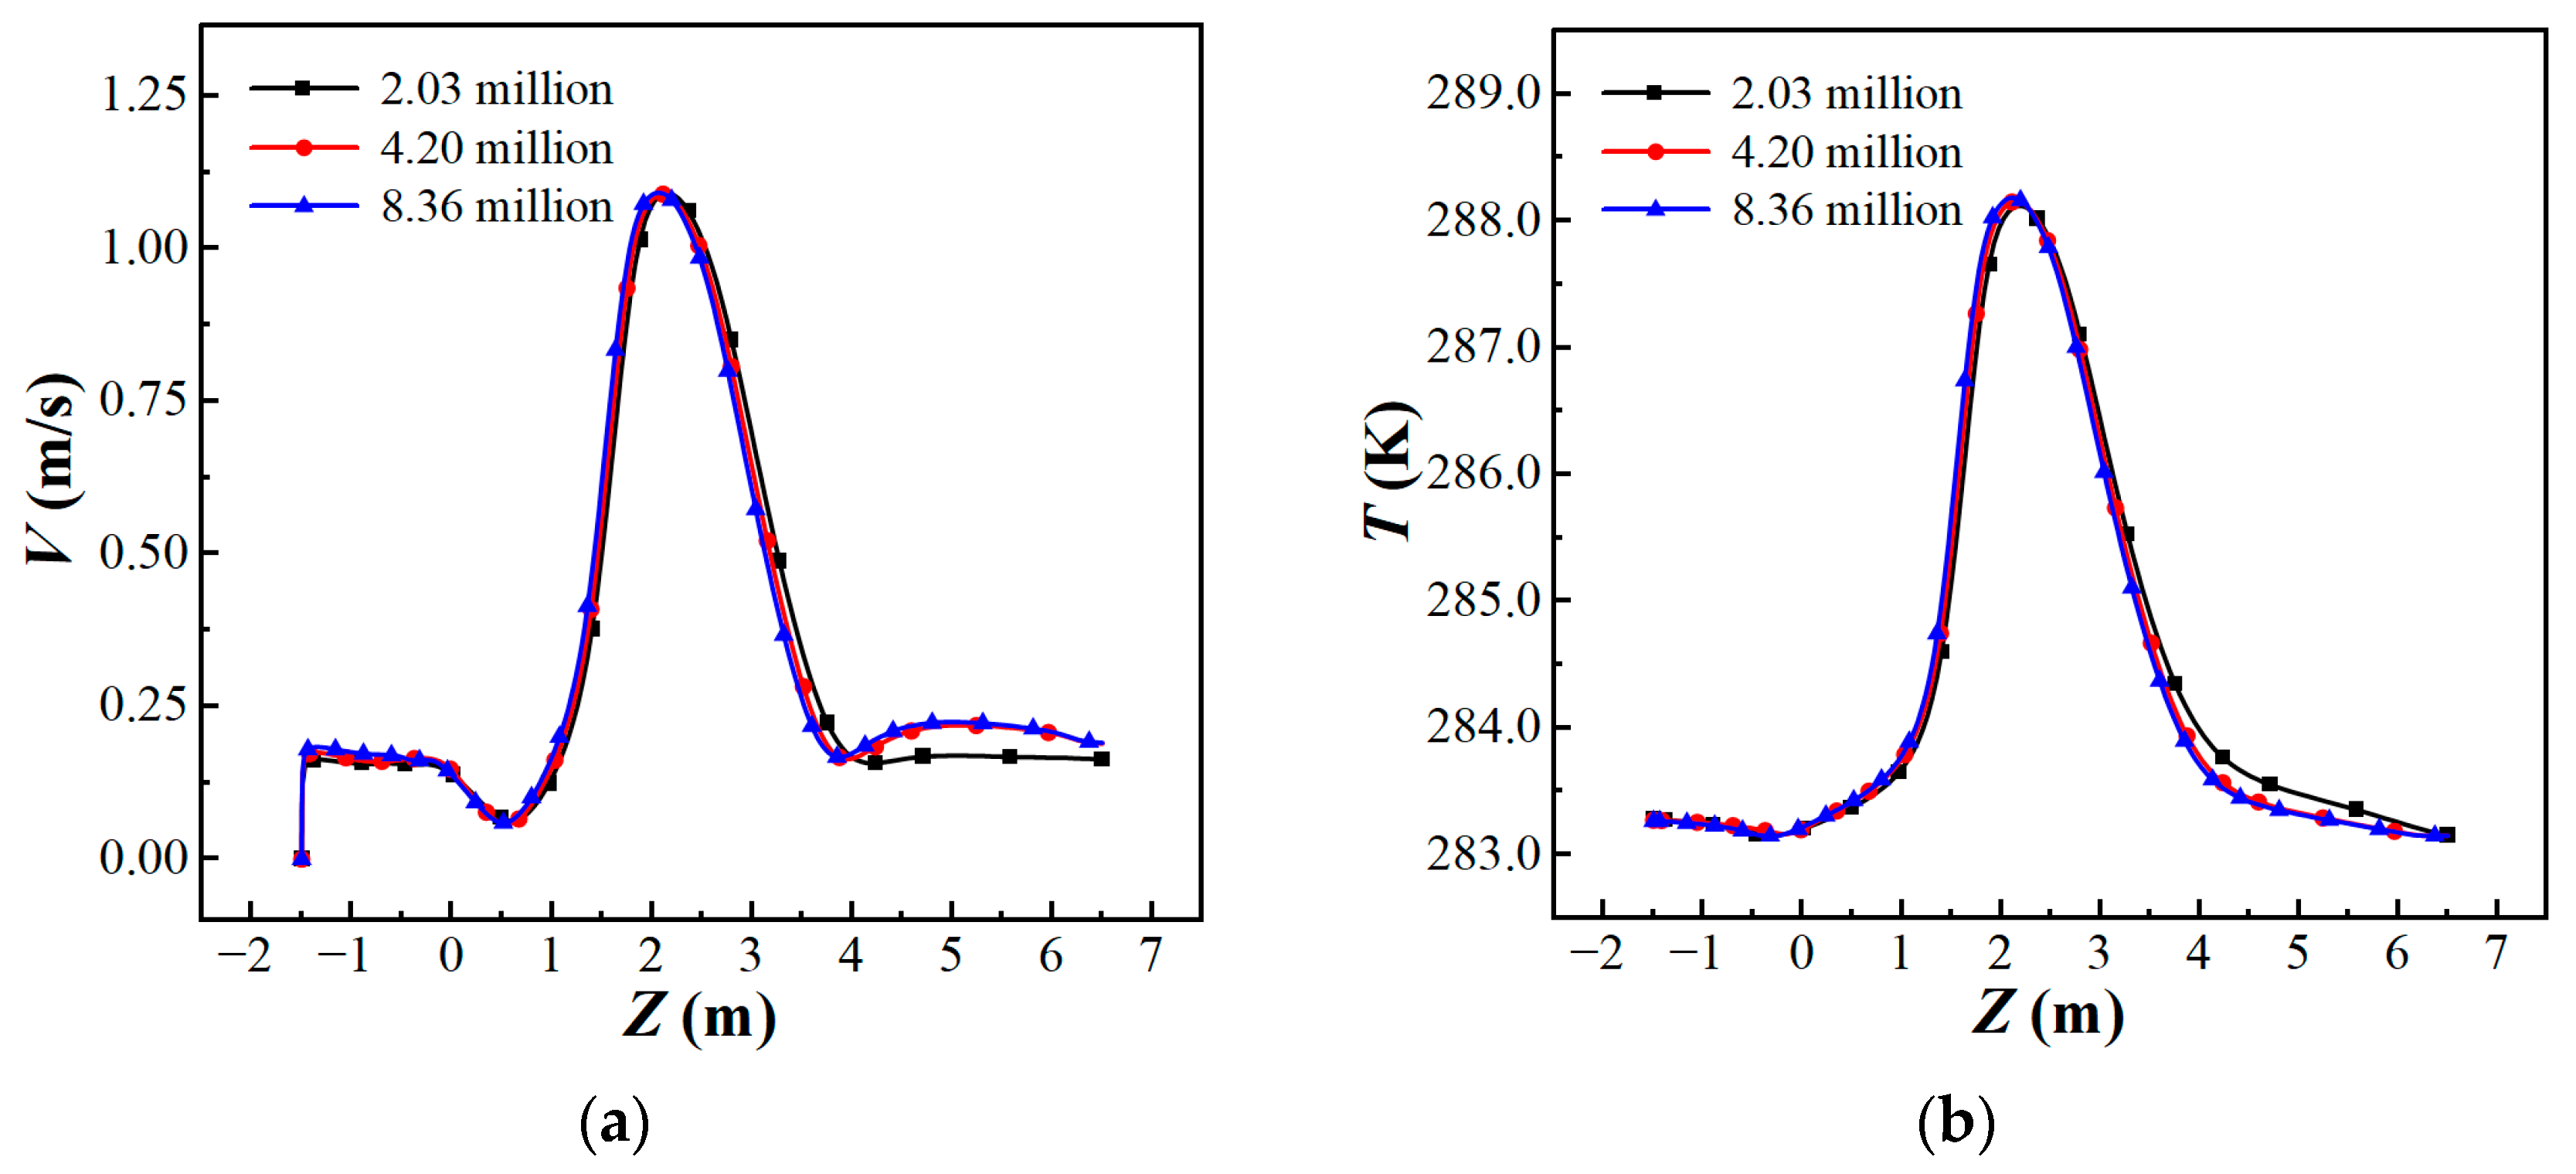
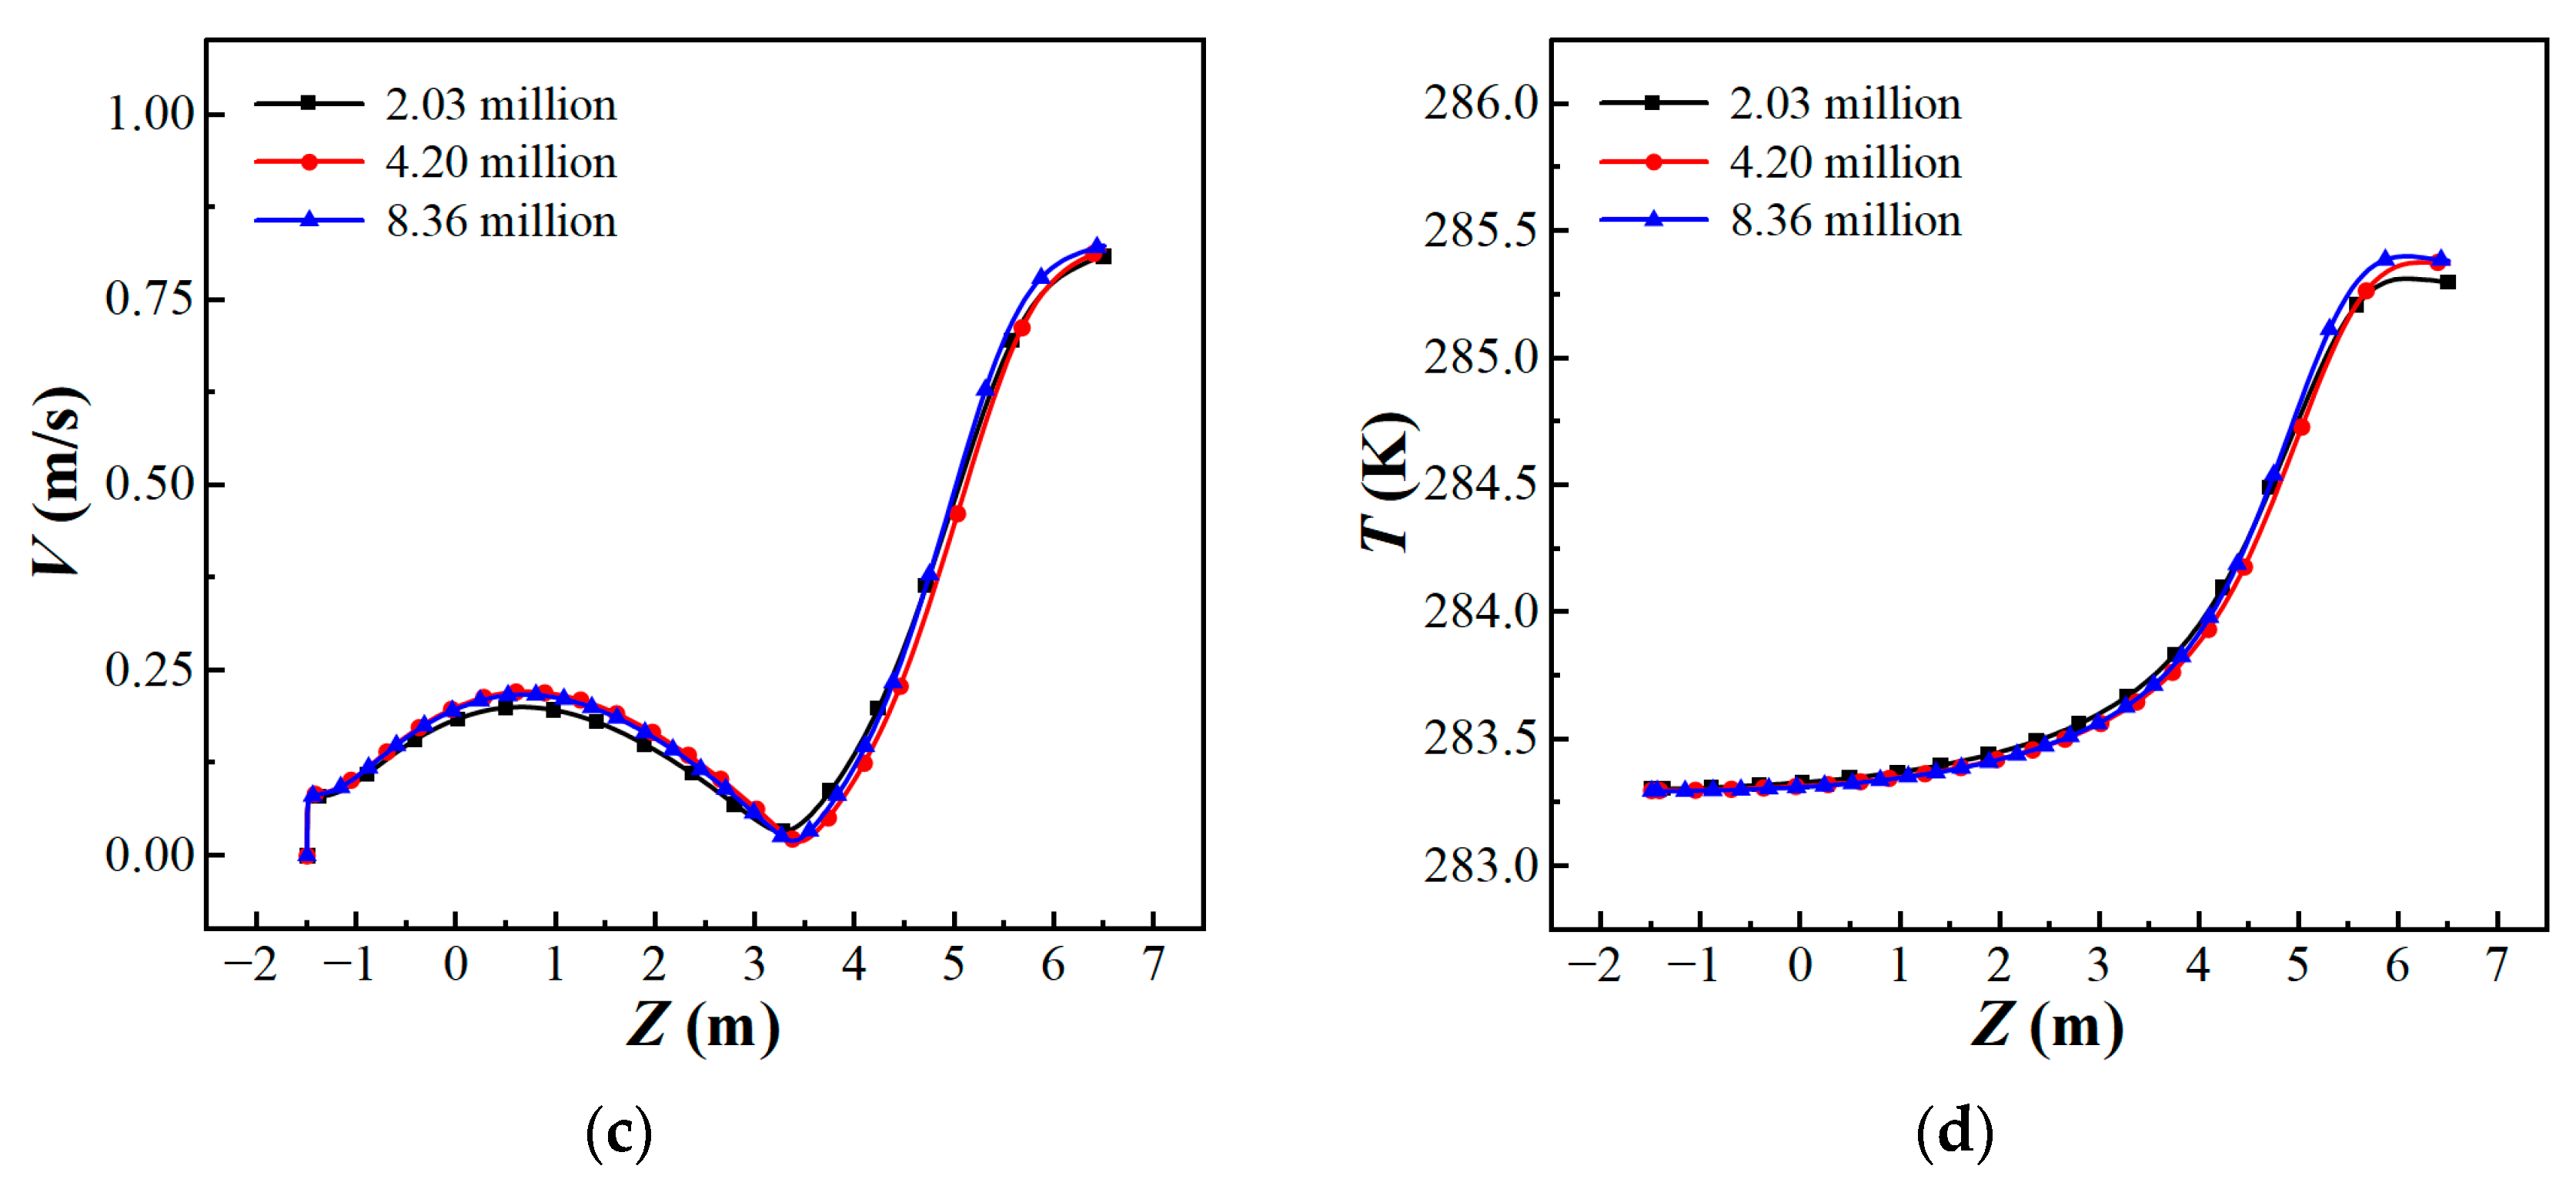
4.1. Grid Independence Verification

In CFD simulation, mesh resolution is a key factor affecting the accuracy of simulation results and the effectiveness of subsequent analysis [37]. In order to ensure mesh accuracy while controlling computational costs, this section will conduct a comprehensive evaluation of the number of meshes required. This study set three different mesh densities for independence verification, with the mesh numbers being basic—2.03 million, fine—4.20 million, and finer—8.36 million.
The convergence of the simulation results is evaluated by monitoring the temperature distribution in the vertical direction at different positions. The corresponding calculation results under three grid densities are shown in Figure 4. Figure 4a–d show the velocity and temperature distribution in the vertical direction at y/D = 20 and y/D = 30, respectively. The results show that the data distribution trend of the basic grid at y/D = 20 deviates greatly from that of fine and finer, while the predictions of the velocity and temperature in the calculation domain by fine and finer grids are consistent.
To further examine the convergence of the grid, this study uses the grid convergence index (GCI) as an evaluation tool [43]. The calculation of GCI is based on the Richardson error estimator. The corresponding solution is obtained by multiplying it by the safety factor Fs, and the obtained solutions are compared to estimate the discretization error relative to the basic grid solution. The specific formula is as follows:
G C I f i n e = F S f 2 f 1 f 1 ( r p 1 ) 1
where F s is the safety factor. In this study, F s = 3; f 1 and f 2 represent the results of fine grid and coarse grid calculations, respectively; r is the grid refinement factor; p represents the formal order of calculation accuracy, and in this study, p = 2.
This study focuses on the distribution of velocity and temperature in the target heating areas, so the GCI of the average velocity and average temperature in the two target areas at y/D = 7.5 and y/D = 15 are calculated, respectively. The calculation results of GCI are detailed in Table 4, and it is considered that the grid calculation results of fine and finer have reached independence and can be used for subsequent turbulence model verification analysis. Considering the saving of computing resources, the fine—4.20 million grid model is selected for subsequent research work.

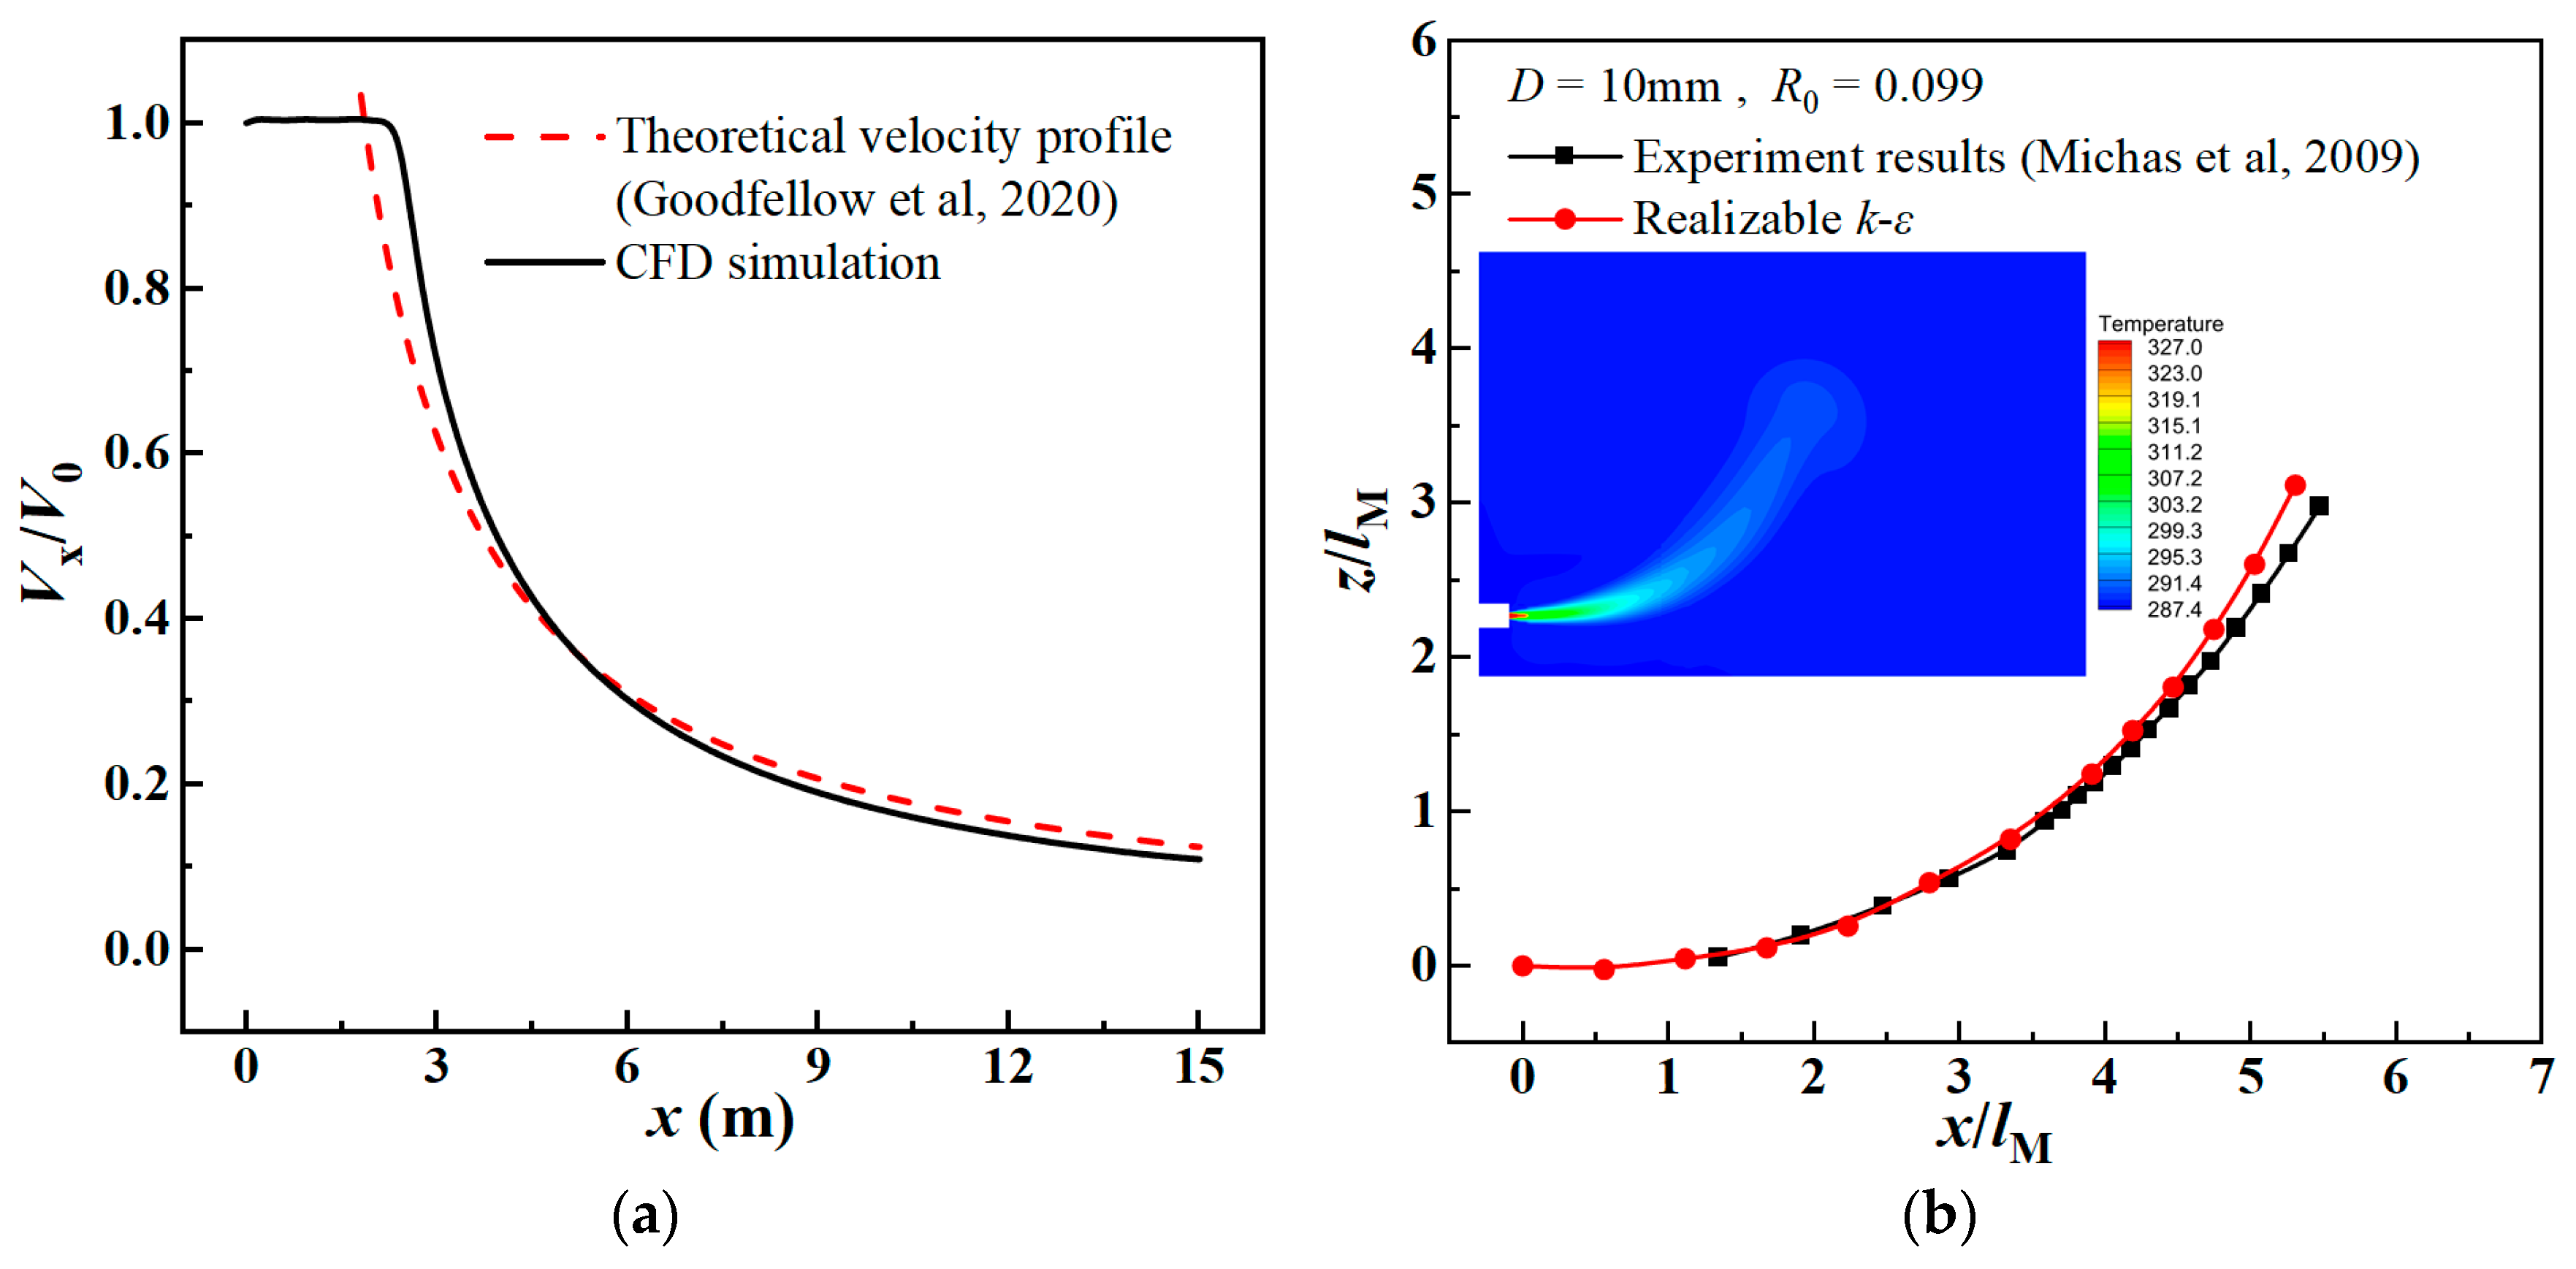
4.2. CFD Setup Verification

In order to evaluate the accuracy of the realizable k- ε turbulence model and numerical simulation operating conditions in predicting the isothermal and non-isothermal jet flow field distribution and diffusion trajectory, this study selected the theoretical formulas and experimental results of relevant scholars for verification.
In the case of isothermal free jet air supply, the theoretical formula for the centerline velocity of the jet body section [40] is defined as follows:
V x V 0 = K v A 0 x
where V x is the center velocity of the jet at a distance of x m from the air inlet; V 0 is the initial jet velocity; A 0 is the air inlet area; K v is the dynamic characteristic value of the air supply jet, and the experimental research of Rodi [44] shows that K v is close to 7.
Figure 5a compares the theoretical Formula (11) with the results of numerical simulation. The results show that the theoretical model and the numerical simulation have good consistency, and the maximum relative error of the centerline velocity between the two is 13.8%.
For the non-isothermal jet verification, the experimental measurement results of the deflected trajectory of a horizontal circular thermal jet discharging in a uniform ambient fluid by Michas et al. [45] were used, which has a circular thermal jet inlet diameter of 10 mm and R0 (Richardson number) = 0.099. Figure 5b is a comparison of the experimental thermal jet trajectory and the numerical simulation results. The two have good consistency, and the maximum relative error is 13.6%. The above results show that the realizable k- ε model and CFD settings used in this study can accurately predict the flow field distribution and diffusion trajectory of the jet.

5. Results and Discussion

5.1. Effect of Induced Airflow

Figure 6 comprehensively shows the temperature distribution under different cases and depicts the corresponding jet trajectory. Case 0 represents a single thermal jet; the lower side of the group graph shows the gradual increase of the induced air inlet area from left to right, and the gradual increase of the induced airflow velocity from top to bottom. After a short jet stabilization zone, the single thermal jet quickly floats up. When the target heating area is far away from the air inlet, the single thermal jet deflects significantly under the action of buoyancy, and there is a risk of failing to achieve effective heating. After introducing induced airflow with different parameter configurations above the thermal jet, such as cases 1-1 to 3-3, as the area or air supply velocity of the ambient temperature induced air inlet increases, the jet stabilization zone is effectively extended, and the upward floating tendency at the position far away from the air inlet is reduced. This phenomenon shows that in the induced air supply system, the induced airflow can effectively suppress the jet deflection and play a positive role in extending the effective transportation distance of the thermal jet.
Figure 7 depicts in detail the distribution distance of the thermal jet at each development stage under different cases. The study shows that as the size of the induced air inlet and air supply velocity increase, the continuous distance of the jet stabilization zone increases; that is, the effect of inhibiting the floating of the thermal jet is enhanced. Compared with case 0, the stabilization zone of case 3-3 is extended by 10 D, which significantly delays the occurrence of thermal jet floating. After the induced air supply system enters the bulk mixing stage of the two jets, the induced airflow mainly guides the horizontal transport of the thermal jet. This guiding effect is related to the velocity of the induced airflow. Therefore, regardless of the induced air inlet size, the bulk mixing zone is extended with the increase in the induced airflow velocity. In addition, the formation of a complete mixing zone was not observed in case 2-3, case 3-2, and case 3-3, indicating that under these cases, the induced airflow parameter configuration has a strong effect in inhibiting the floating of the thermal jet and promoting its horizontal transport.
The jet stabilization zone and the bulk mixing zone are the key stages where the induced airflow affects the transport of the thermal jet. By comparing two groups of cases with induced airflow flow rates of 0.4 m3/s (Group A) and 0.8 m3/s (Group B), it is found that increasing the size of the induced air inlet and the velocity of the induced airflow will have a significant effect on the continuous distance of the jet stabilization zone and the bulk mixing zone, respectively. The comprehensive results show that the greater the velocity of the induced airflow, the farther the distance for the two jets to completely merge; that is, the wider the control range of the induced airflow on the thermal jet, such as case 1-3 and case 2-3.

5.2. Characterization of the Flow Field of an Induced Air Supply System

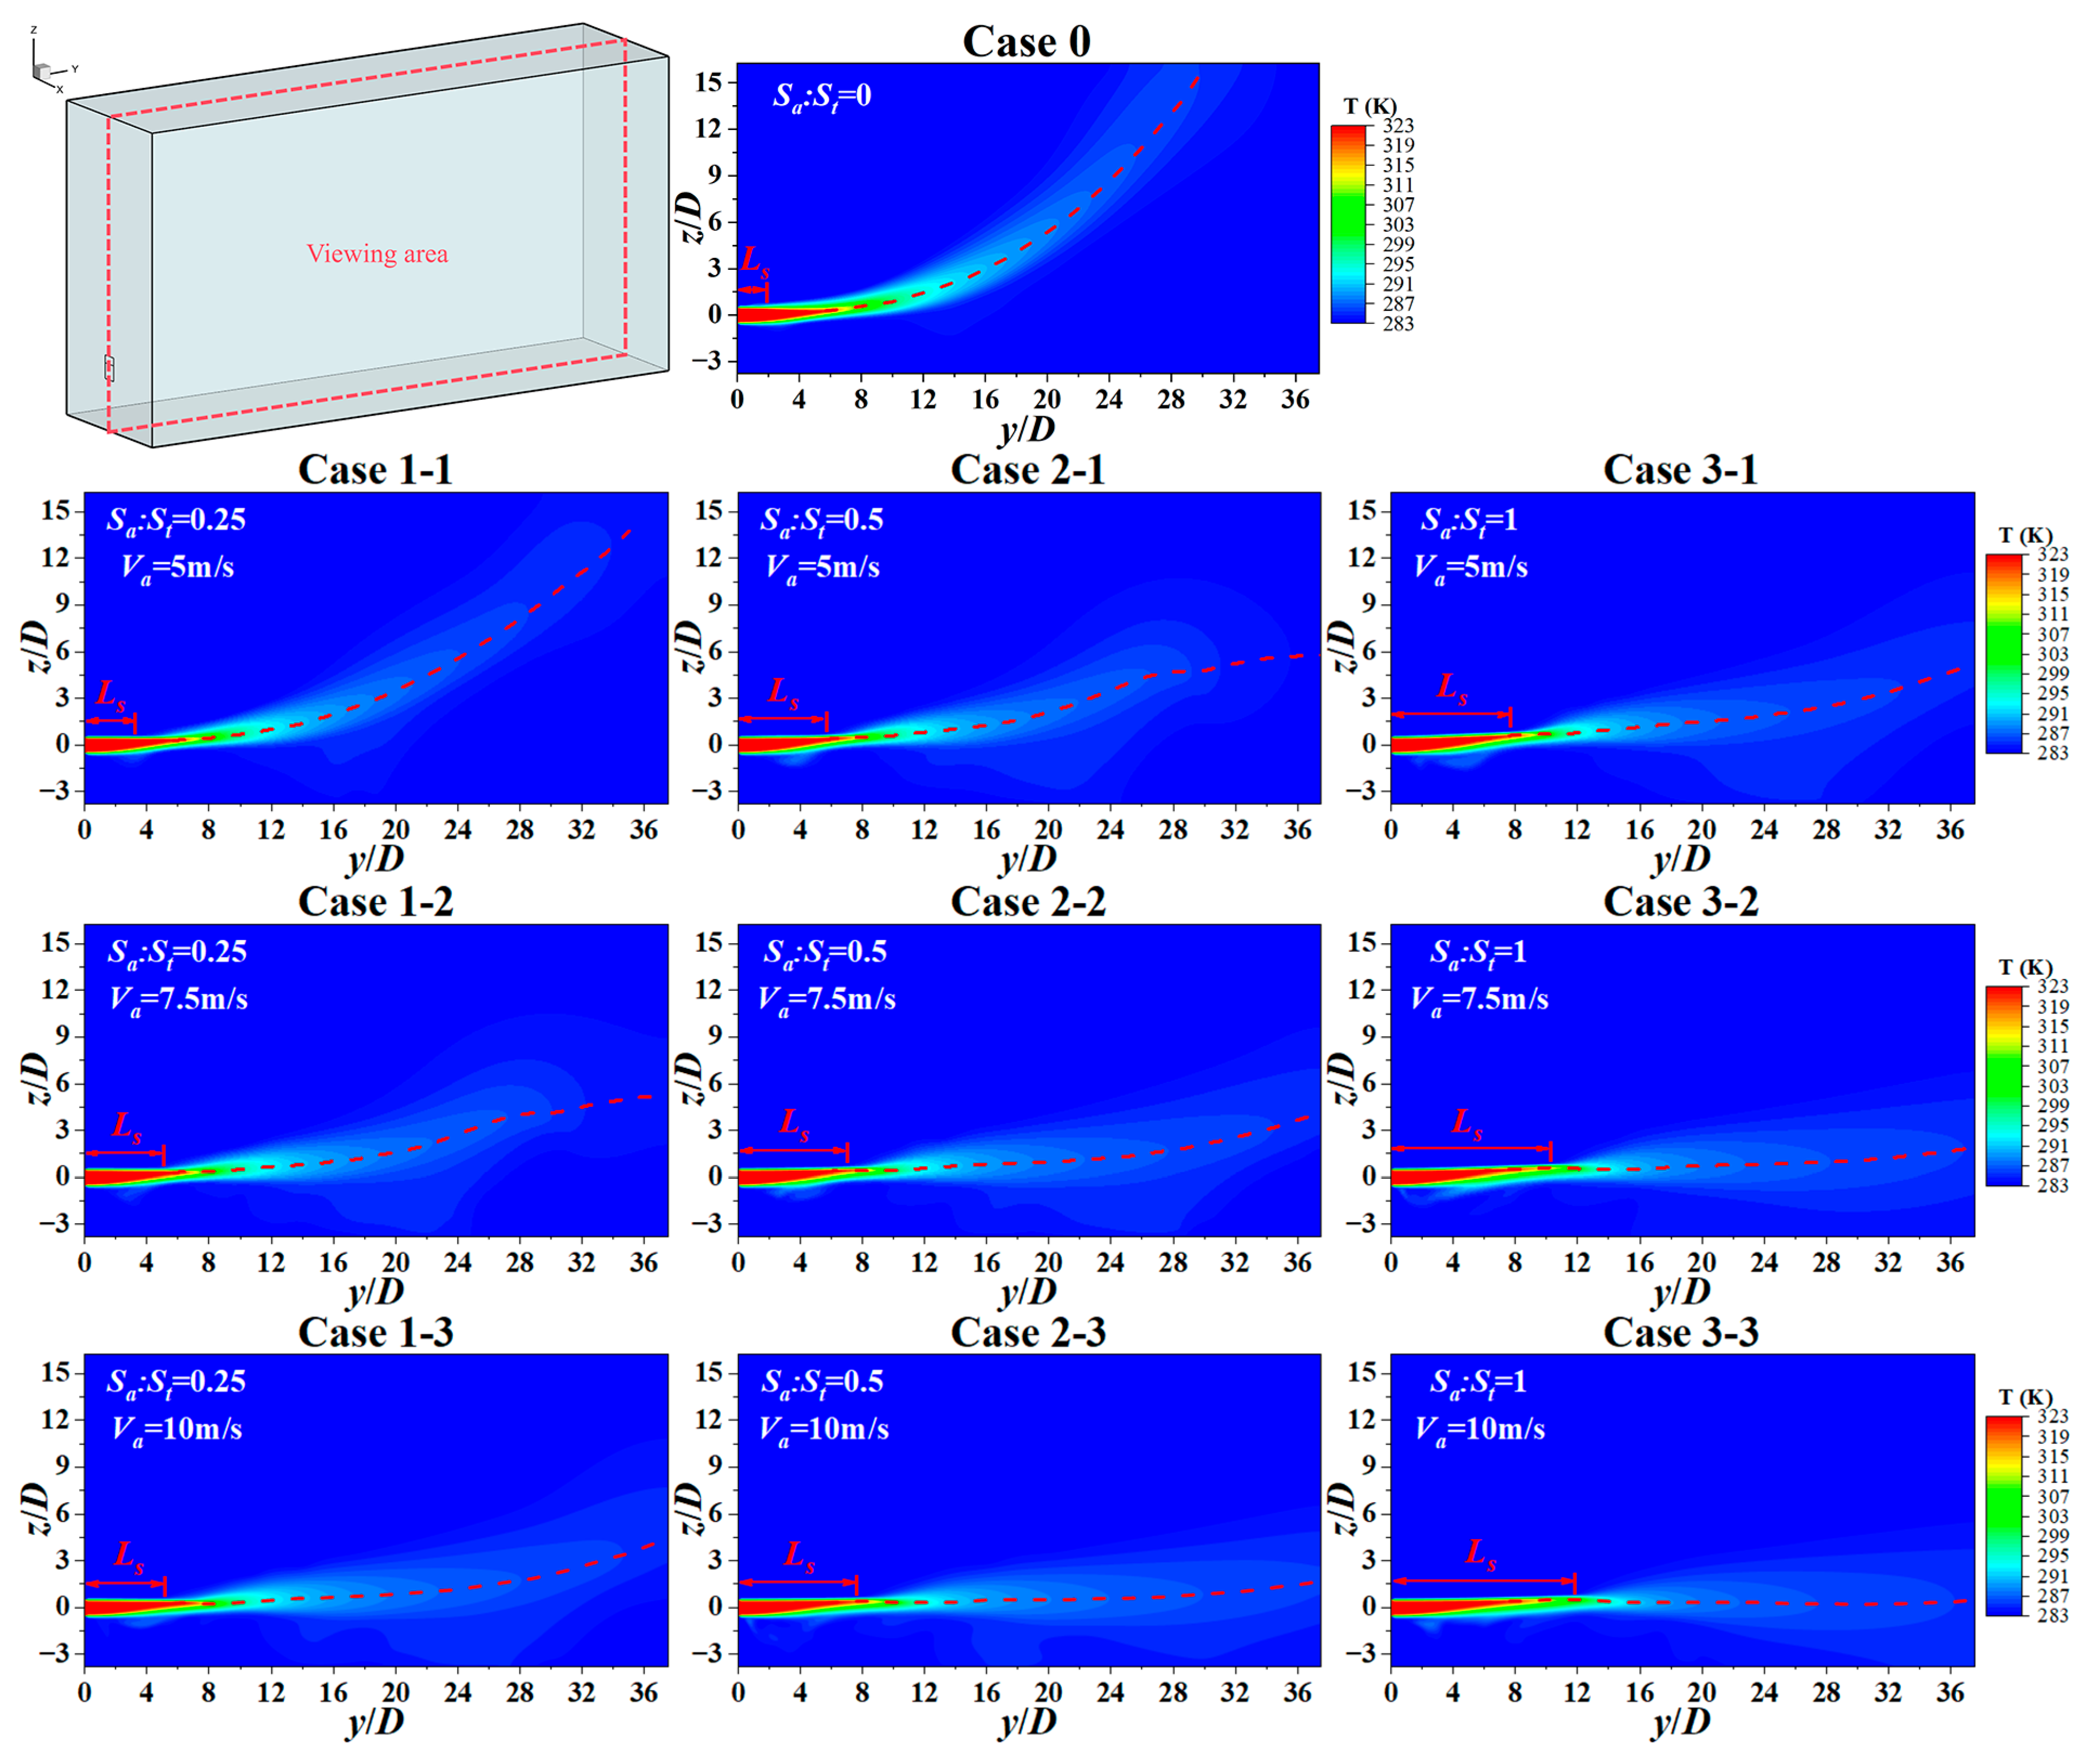
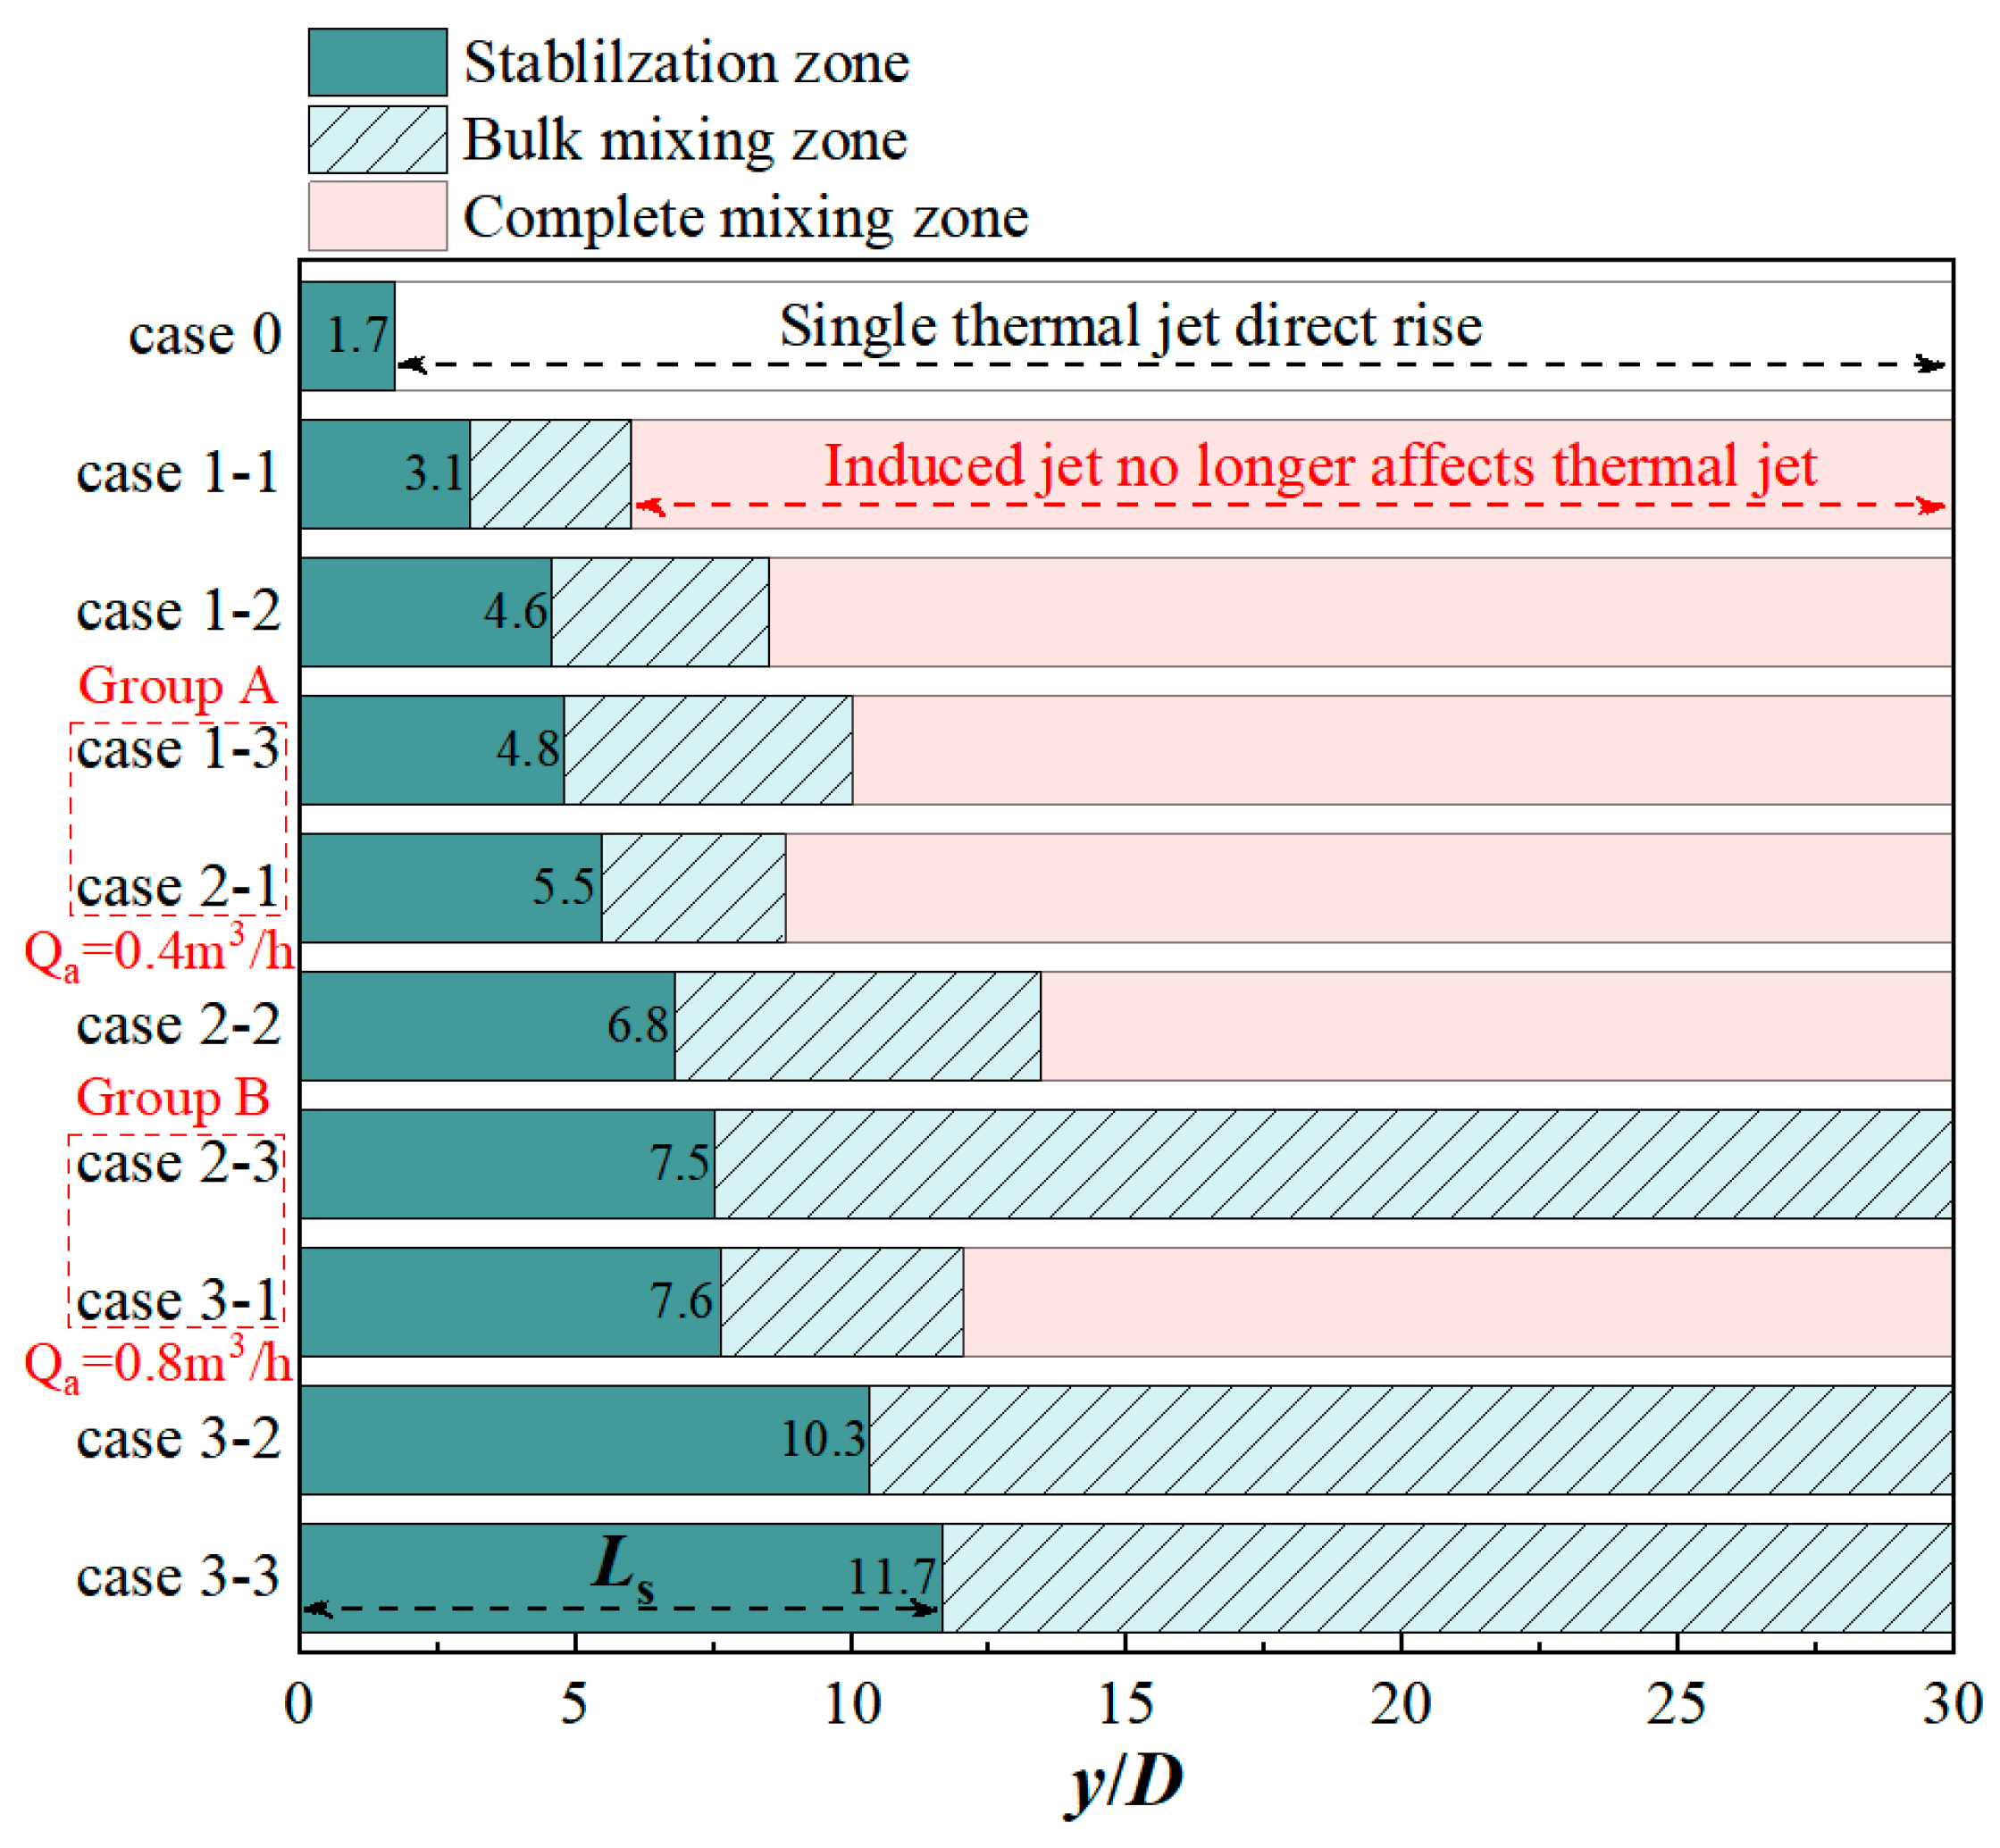
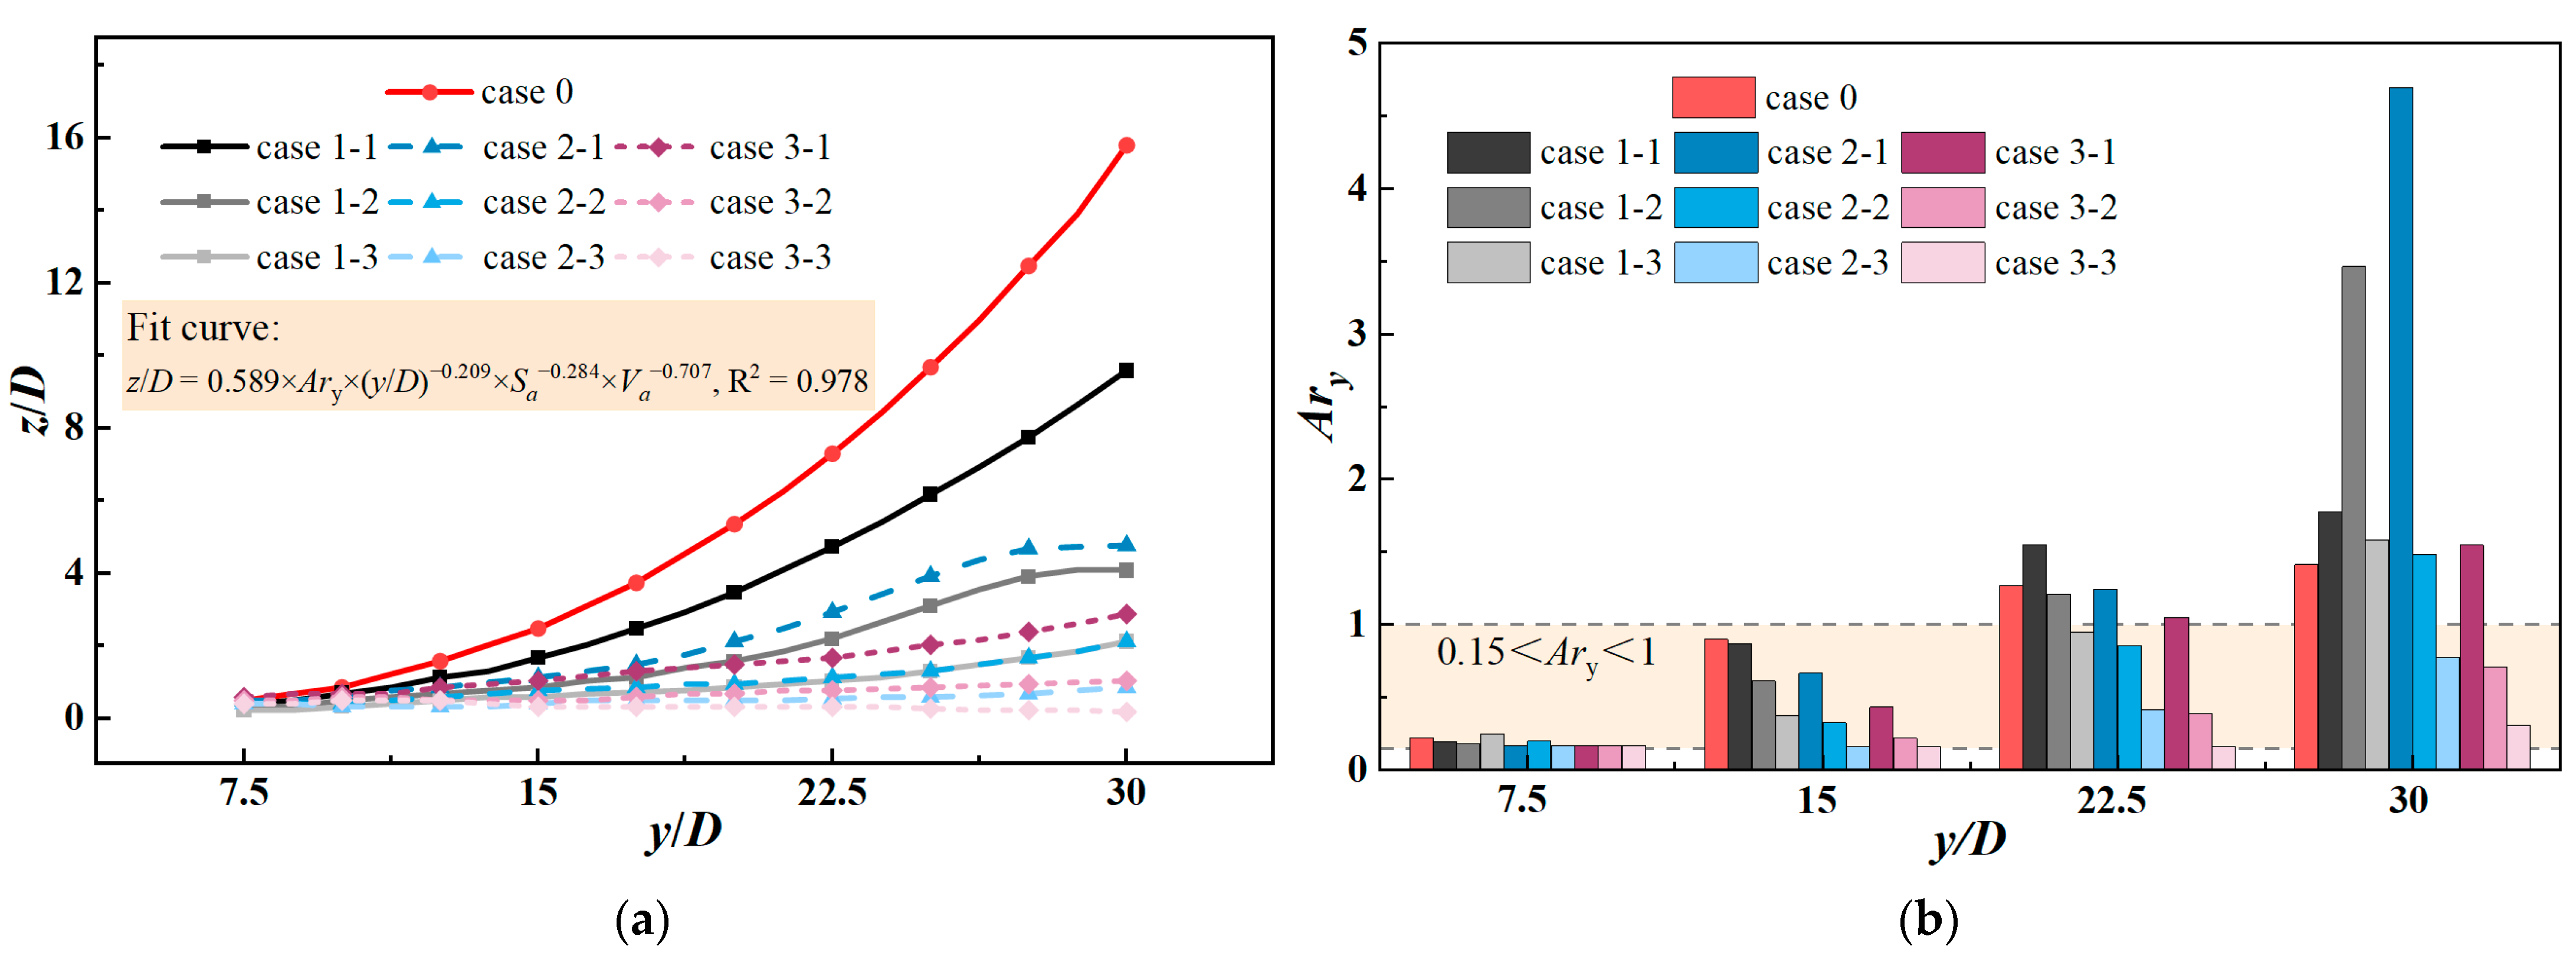
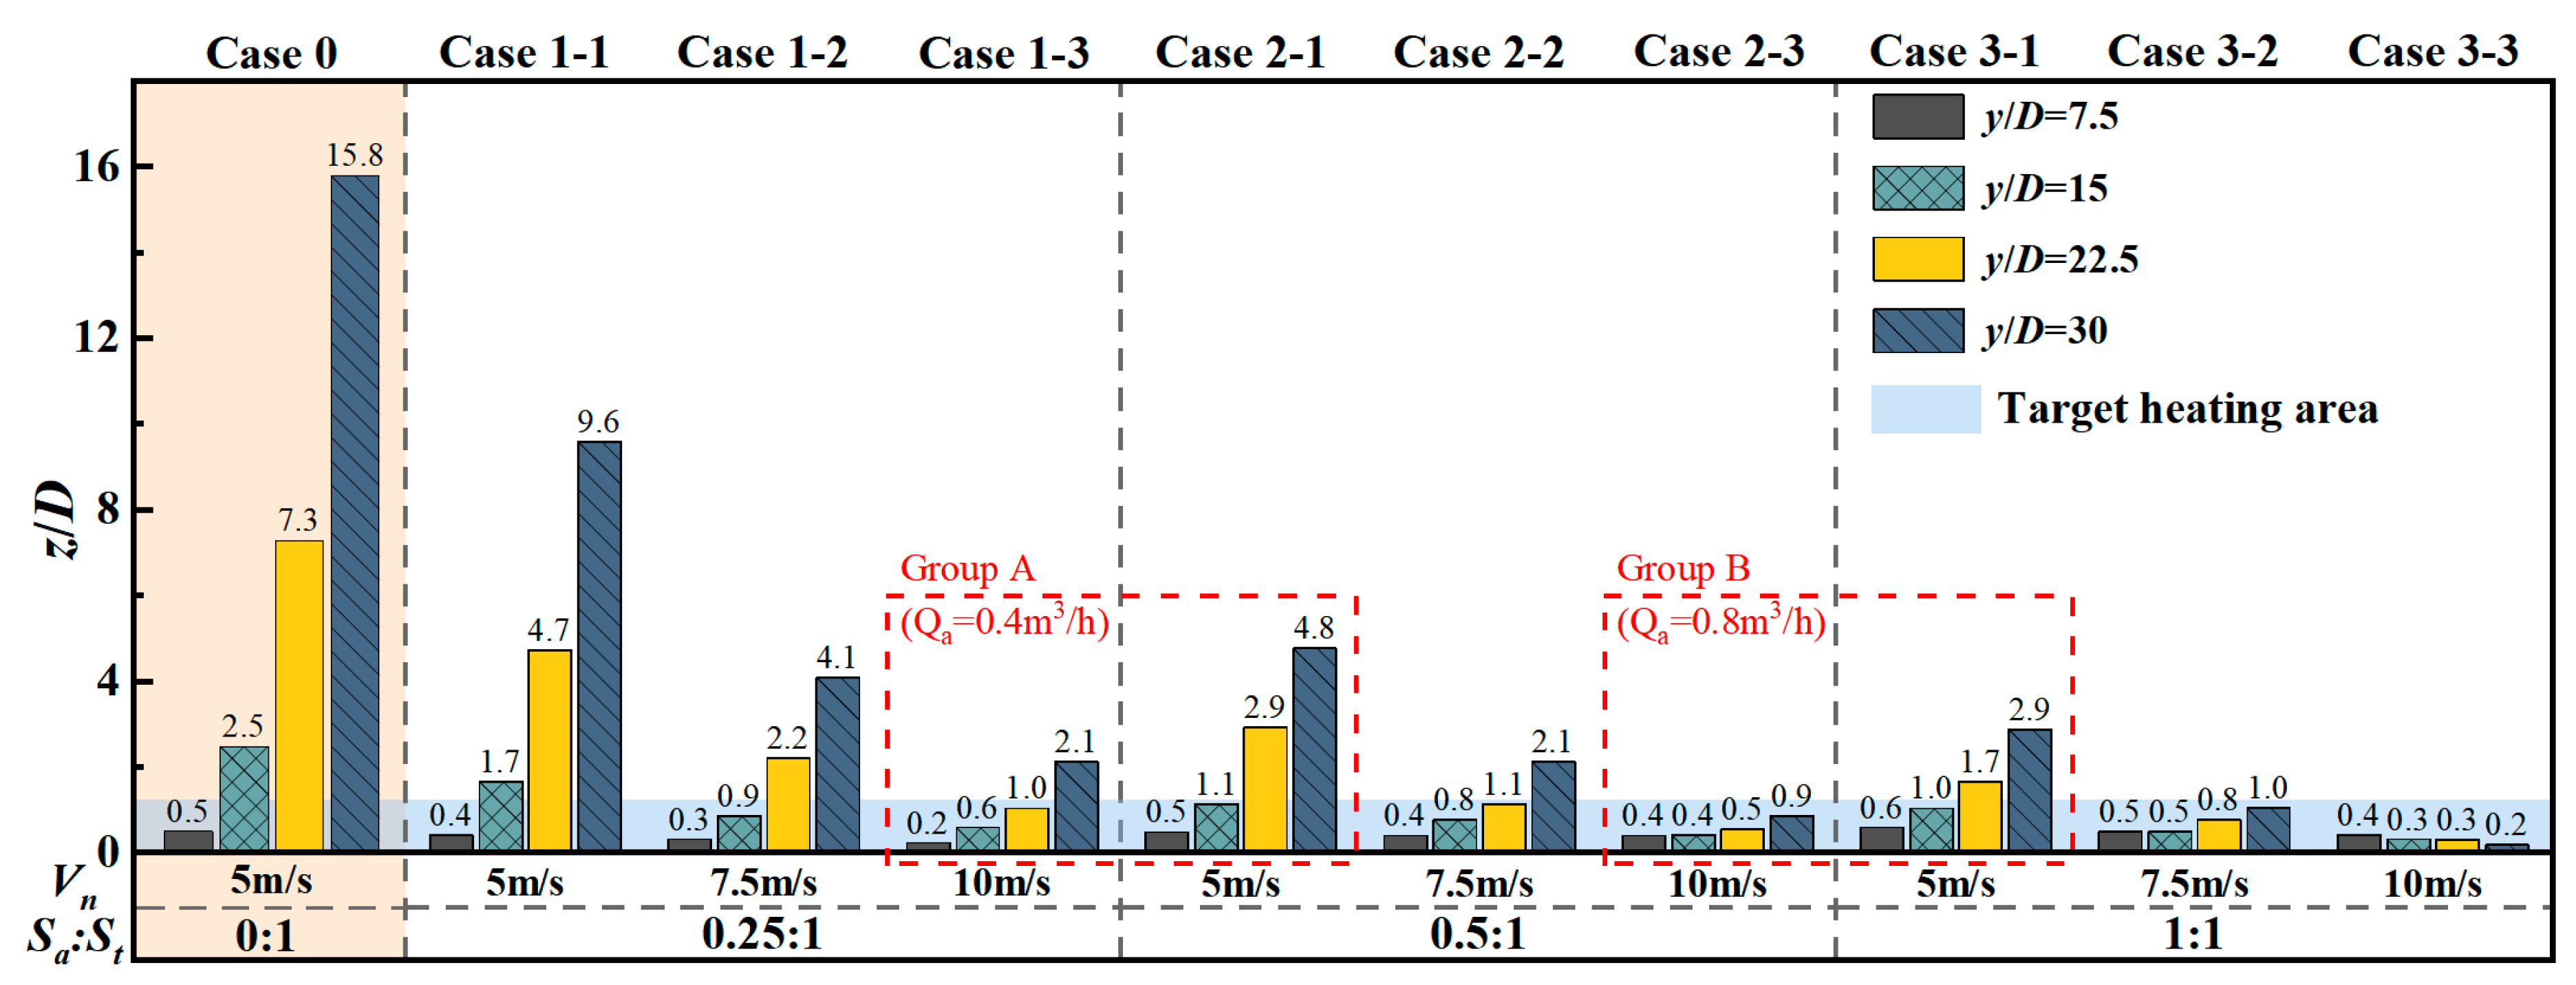
5.2.1. Thermal Jet Trajectory and Deflection Height

The trajectory curves of the thermal jet under different air supply parameter configurations are shown in Figure 8a. The overall trend shows that with the increase in the induced air inlet area or air supply velocity, the thermal jet trajectory is closer to the horizontal, and the degree of suppression of the upward deflection of the thermal jet gradually decreases. Figure 8b shows the local Archimedes number (Ary) at different distances under different cases, from which the relative magnitude relationship between the inertial force and the buoyancy force of the induced air supply system during its development can be judged. The results show that Ary increases with increasing distance. At y/D = 7.5, the momentum of the thermal jet is strong, and the induced air supply condition and the single thermal jet are close to the momentum-dominated area. At this time, the induced airflow has little effect on the movement trend of the thermal jet. Further observation at y/D = 15 shows that with the increase of the induced airflow velocity and the air inlet area, Ary shows a decreasing trend compared with the single thermal jet and remains in the transition zone. When y/D ≥ 22.5, most of the cases are in the momentum-dominated zone, and the high-velocity induced airflow can provide sufficient horizontal momentum for the thermal jet, thereby significantly reducing the influence of buoyancy. However, at y/D = 30, the Ary of case 1-2 and case 2-1 is abnormally high. According to Formula (5), this phenomenon is mainly caused by the low axial center velocity. The above phenomenon shows that the induced airflow can inhibit the conversion of the thermal jet from the transition zone to the buoyancy-dominated zone to a certain extent.
In order to clarify the relationship between the deflection height of the thermal jet and the local Archimedes number and the configuration of the induced airflow parameters, according to the regular formula of the circular non-isothermal jet trajectory summarized by the related scholars [46], this study proposes the basic formula of the fitting curve for the trajectory of the thermal jet in the induced air supply system, which is as follows:
z / D = K × A r y × ( y / D ) m × S a n × V a t
where S a is the induced air inlet area; V a is the induced airflow velocity; K is the coefficient; m, n, t are all exponents. Substituting the trajectory curves of different cases into the above formula for fitting, obtain K = 0.589, m = −0.209, n = −0.284, and t = −0.707.
The dimensionless deflection height of the thermal jet along the flow direction can be quantitatively analyzed according to Figure 9. The blue area marked in the figure is the target heating area, from which the optimal cases for delivering thermal air to different target areas can be clearly identified.
For the target heating area close to the air inlet, such as when y/D = 7.5, the dimensionless deflection height of the single thermal jet is 0.5, which is within the height range of the target area (z/D ≤ 1.25). When the target area is located at y/D = 15, the trajectory of the single thermal jet slightly deviates from this area. At this time, the introduction of an appropriate amount of induced airflow can guide the thermal flow to the target area, such as in cases 1-2 to 3-3. For target areas farther away, such as y/D ≥ 22.5, larger induced air inlet or higher air supply velocities are required to guide the thermal flow, such as in cases 2-3, 3-2, and 3-3. Compared with a single thermal jet, the deflection degree of the induced air supply system at y/D = 30 can be reduced by up to 98.7%. Therefore, the introduction of induced airflow greatly improves the upward deflection phenomenon of the thermal jet.
In addition, in order to explore the influence of the size and air supply velocity of the induced air inlet on the results, two groups of cases with the same induced airflow rate (Group A and Group B) were compared. Although the induced airflow rate of each group is equal, the deflection of the thermal jet is not consistent. Generally, the greater the induced airflow velocity, the more obvious the effect of suppressing the deflection of the thermal jet. This result shows that the velocity of the induced airflow has a more significant effect on the deflection height of the thermal jet. It is unreasonable to blindly increase the induced air inlet to suppress the deflection of the thermal jet, which makes it easy to cause the waste of resources and poor air supply effect. This conclusion is particularly significant in Group B.

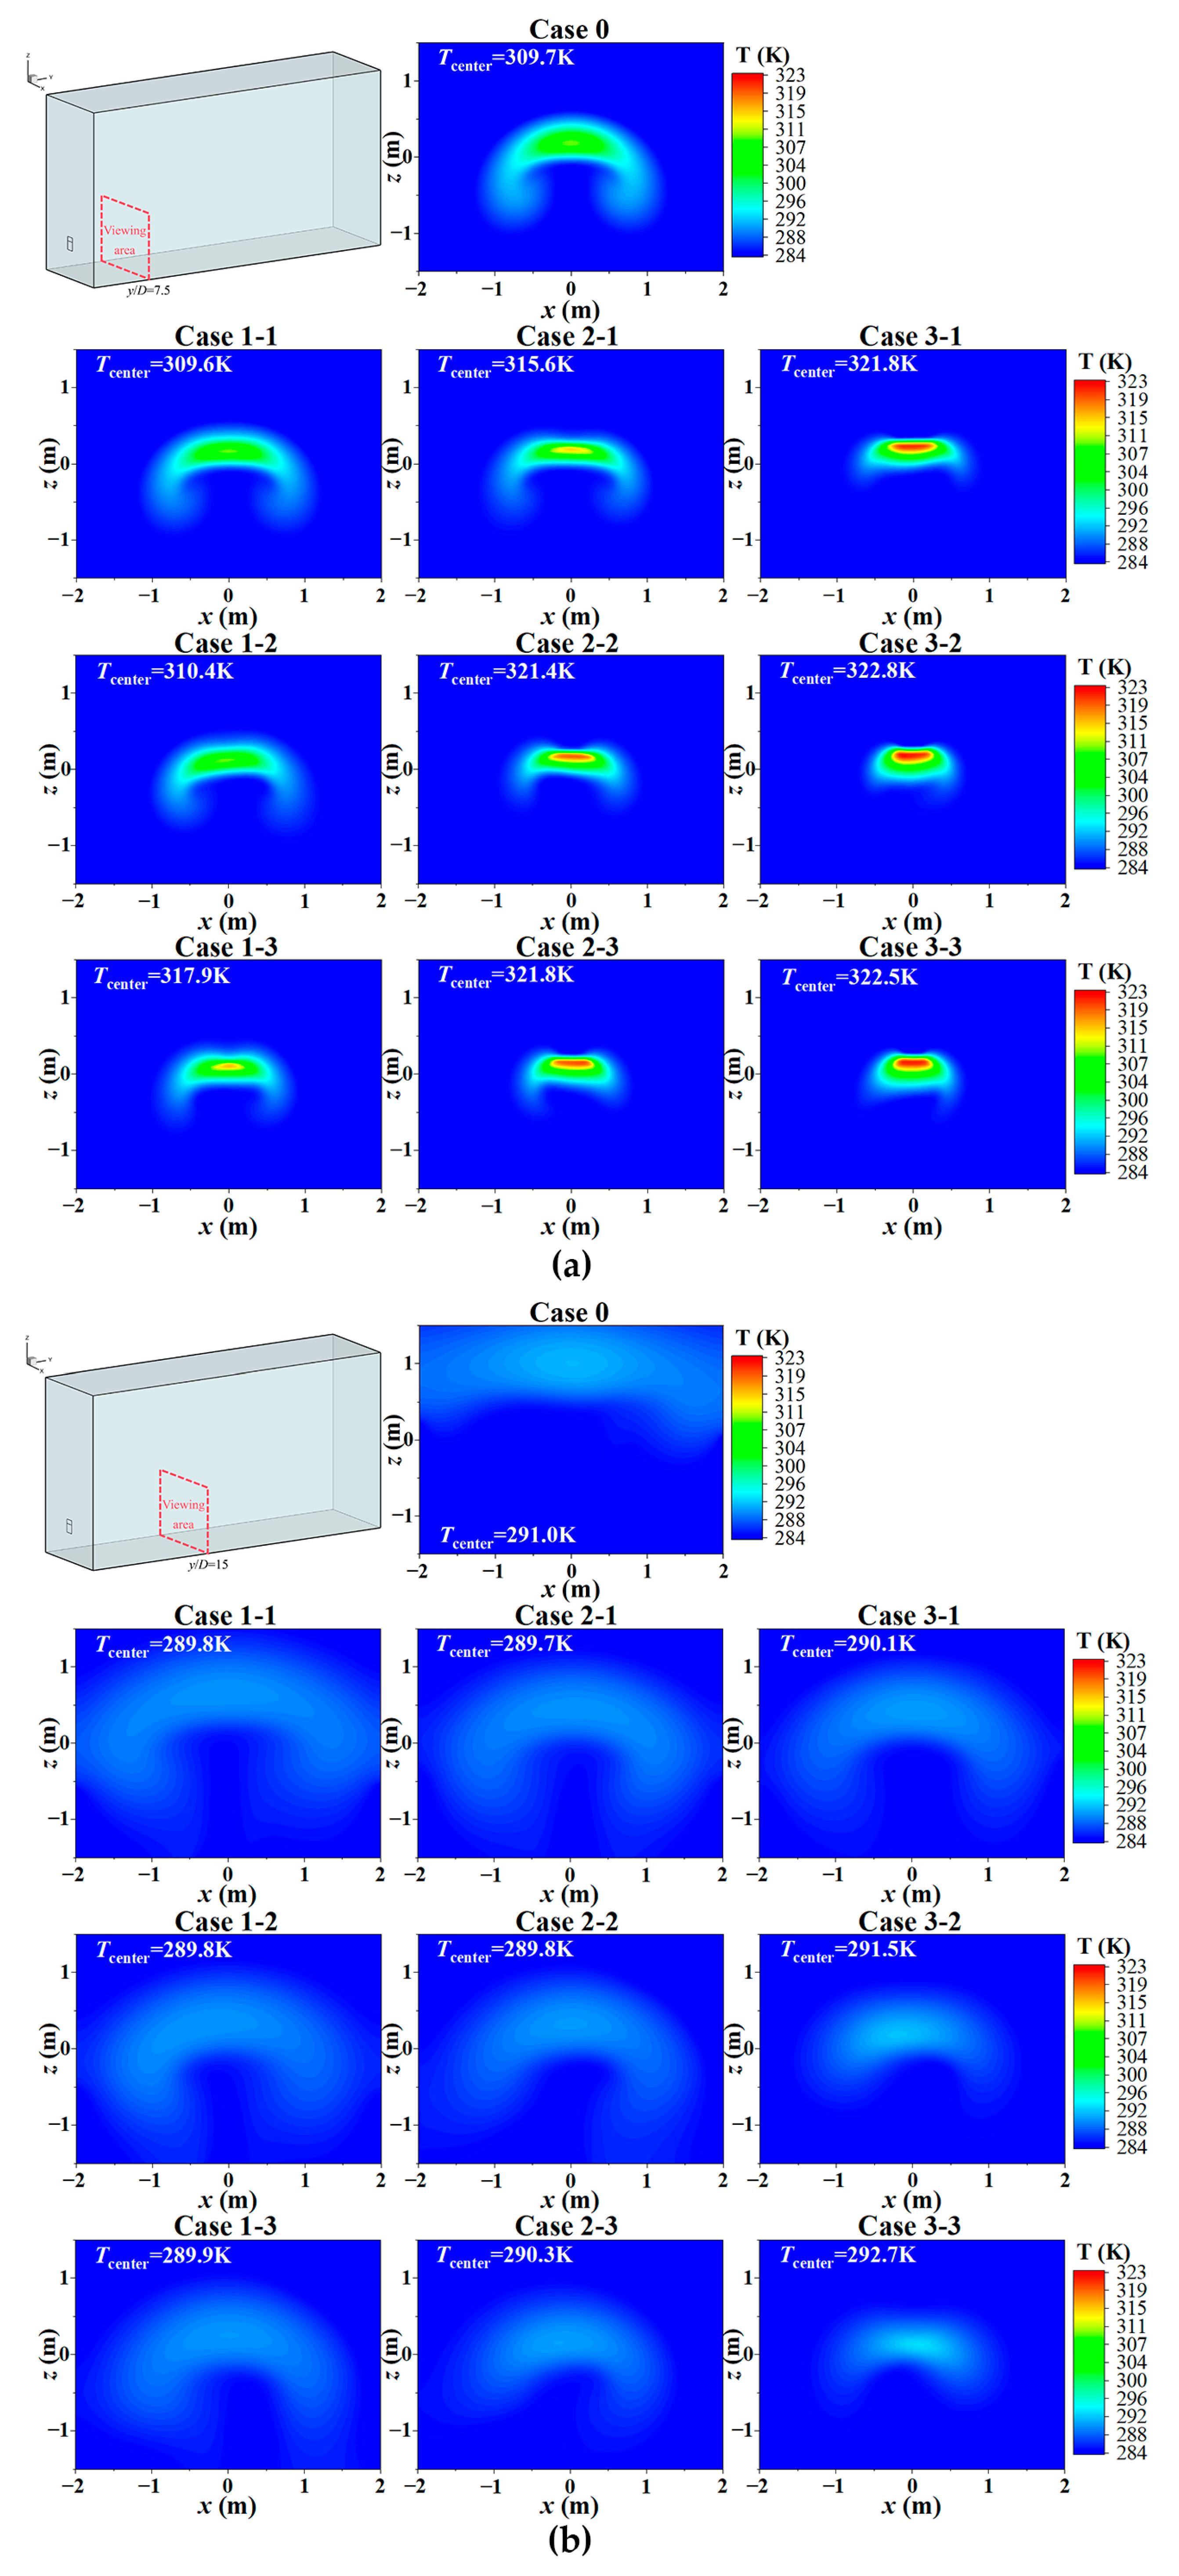
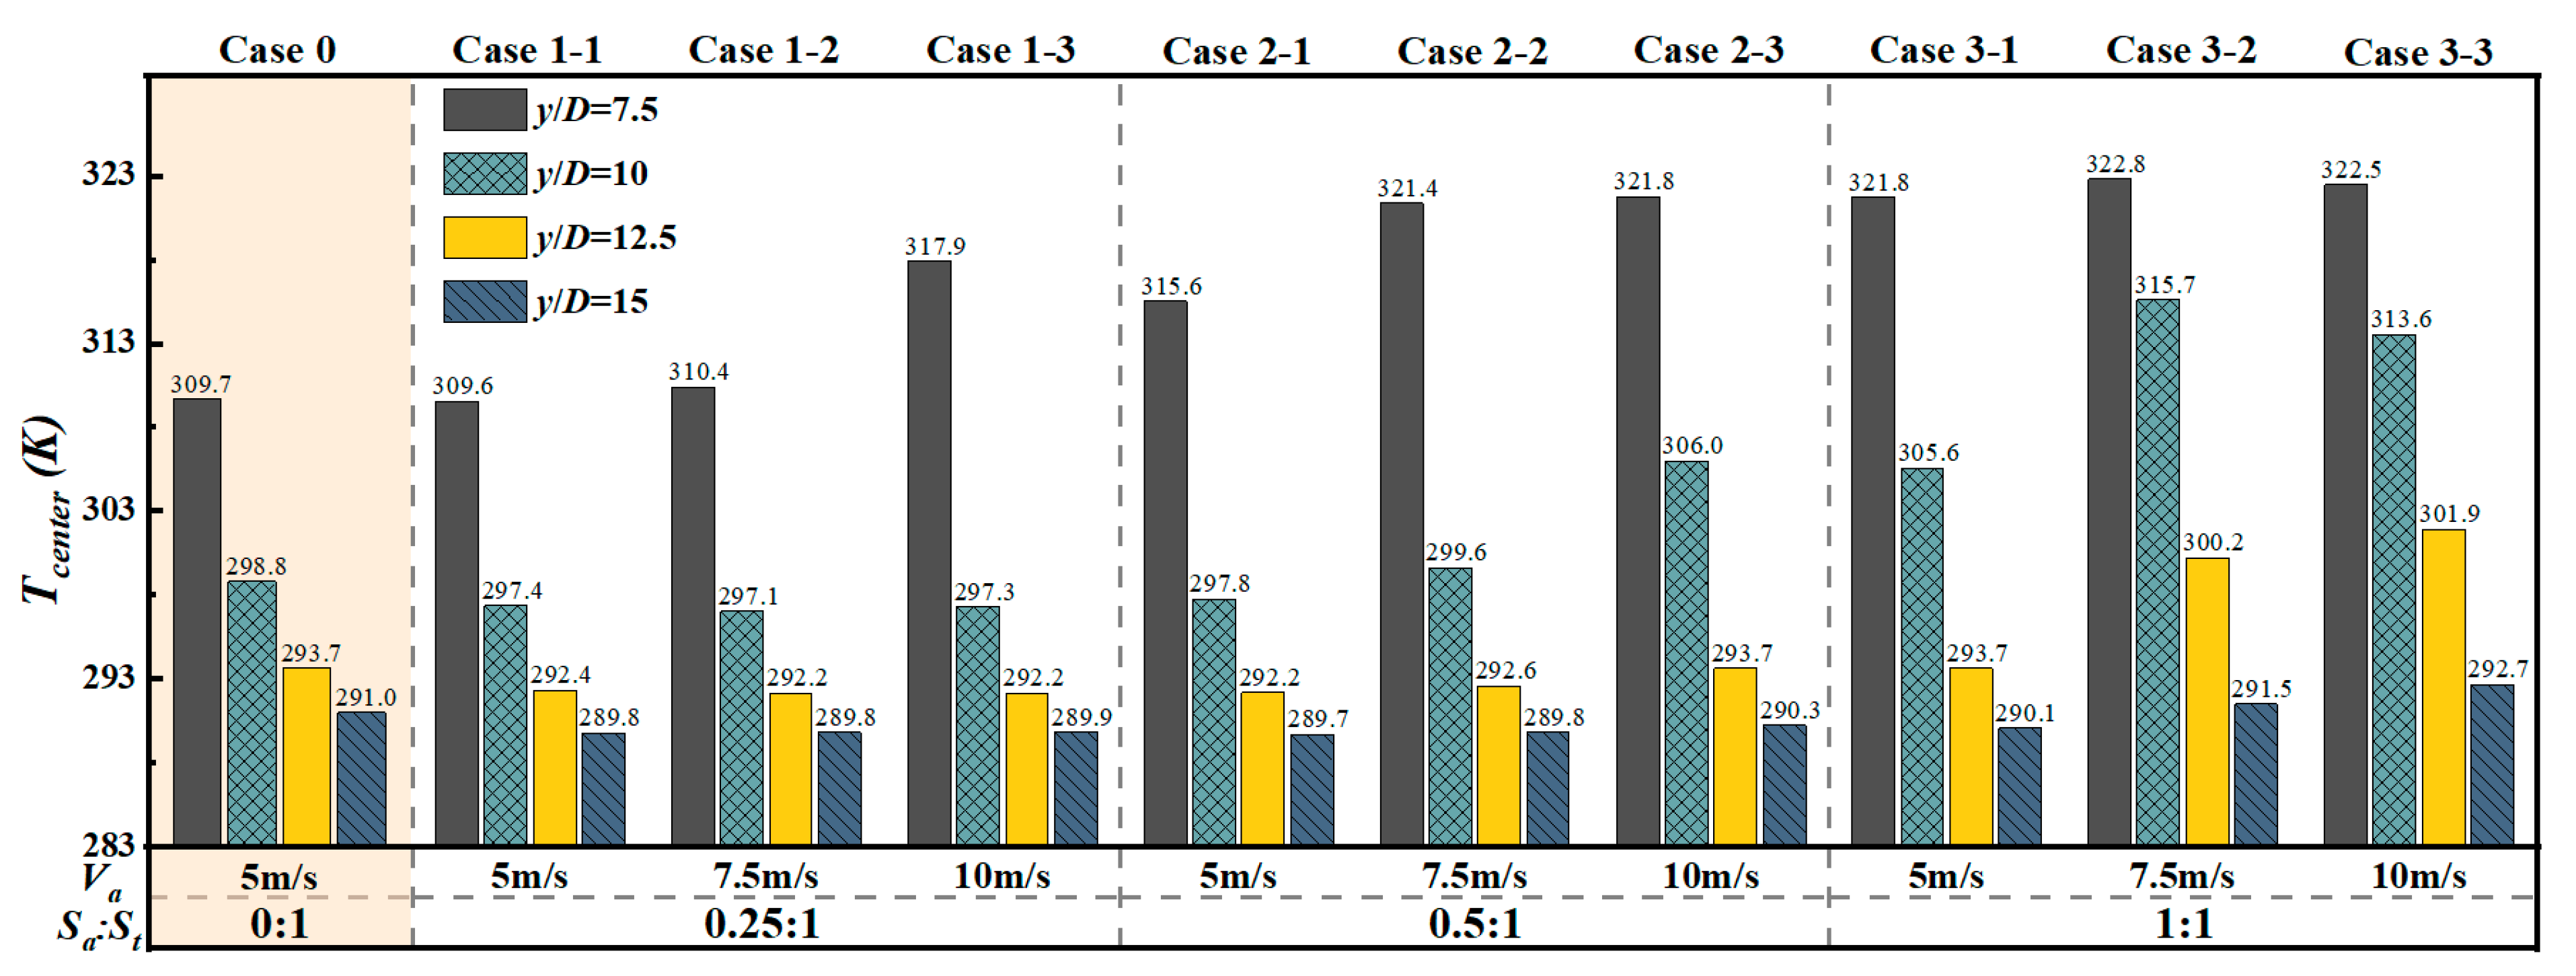
5.2.2. Thermal Jet Axial Center Temperature

Although certain induced air supply conditions can effectively suppress the deflection of the thermal jet, further attention should be paid to the temperature distribution along the airflow path to comprehensively evaluate the temperature maintenance capability of the induced air supply system in the target area.
Figure 10 shows the temperature distribution under different air inlet types at dimensionless distances y/D = 7.5 and y/D = 15. In Figure 10a, the temperature distribution of the single thermal jet presents an arched shape, and the axis center of the thermal jet is located above the center. After the addition of the induced airflow, the diffusion range of the thermal jet decreases and the axial center temperature increases significantly. And with the increase in the size and air supply velocity of the induced air inlet, the arch feature of the thermal jet gradually disappears. In Figure 10b, the single thermal jet floats up significantly, and the thermal flow spreads to both sides. In contrast, the rise of the induced air supply condition is small, the diffusion range decreases with the increase in the induced airflow flow rate, and the axial center temperature increases. Therefore, the induced airflow can effectively inhibit the diffusion of the thermal jet; that is, delay the mixing of the thermal jet with the surrounding fluid, and maintain the axial center temperature at a high level.
Figure 11 shows the axial center temperature distribution under different cases within y/D = 7.5 to 15. By analyzing these data, the ability of the induced air supply system to suppress the mixing of the thermal jet and the surrounding fluid can be evaluated. The results show that at y/D = 7.5, the degree of axial center temperature attenuation of case 1-1 and case 1-2 is similar to that of case 0. This is mainly due to the small flow rate of the induced airflow and the limited ability to suppress the thermal jet. Within y/D < 7.5, the two jets have entered the bulk mixing stage, resulting in a rapid decrease in the axial center temperature. When the induced airflow rate Q a ≥ 0.4 m3/s, the degree of suppression of the thermal jet is enhanced, and its axial center temperature is significantly higher than that of the single thermal jet, with an increase of 5.8–13.1 K, and the maximum increase can be 49.3%. As the induced airflow rate continues to increase, when Q a ≥ 0.6 m3/s, further increasing the induced airflow rate has a limited inhibitory effect on the axial center temperature decay, and its axial center temperature is basically close to the initial supply air temperature of the thermal jet (323.15 K).
At the dimensionless distance y/D = 10, the axial center temperature of cases 1-3 and 3-1 dropped significantly, with the maximum attenuation reaching 20.6 K. This is consistent with the above situation. The above cases entered the mixing stage between y/D = 10 and 12.5. When the induced airflow rate is large (cases 3-2 and 3-3), the attenuation of the axial center temperature is reduced to 7.1 K. At y/D ≥ 12.5, all cases are in the mixing zone, and the axial center temperature shows different degrees of reduction. The above studies show that the larger the induced airflow rate, the stronger the shielding effect on the thermal jet, thereby maintaining a higher supply air temperature while suppressing the floating of the thermal jet.

5.3. Heating Gain of Induced Air Supply System

The ability of the induced air supply system to optimize the trajectory of the thermal jet and maintain a high temperature along the way is the primary condition for improving the efficiency of the target heating area. The above analysis is based on two independent perspectives: jet trajectory and axial center temperature. This section will focus on the impact of different induced airflow parameter configurations on the heating temperature of the target area and evaluate the heating gain of the induced air supply system to clarify the optimal air supply conditions for the four target areas.
Figure 12 compares the heating capacity of the target area with that of the single thermal jet and the induced air supply system. The results show that the heating temperature of the target area at y/D = 7.5 by the single thermal jet is higher. However, due to the rapid rise of the thermal flow, very little heat is obtained at y/D = 15, and effective heating is almost impossible at y/D ≥ 22.5. The above problems are effectively alleviated by introducing the induced airflow. Although the heating capacity of the induced air supply condition at y/D = 7.5 is lower than that of the single thermal jet, the thermal environment at y/D ≥ 15 is significantly improved. In addition, only a small amount of induced airflow is required to improve the heating capacity of the three areas at the same time, such as in case 1-3. As the flow rate of the induced airflow increases, the difference in heating temperature of different target areas under each condition gradually decreases, such as in case 3-3, which can provide a more uniform thermal environment for the entire heating process. Therefore, the heating capacity of the induced air supply system in the target area is significantly better than that of the single thermal jet, and it can achieve effective temperature control in a wider area.
In addition, by comparing two groups of conditions with the same induced airflow rate (Group A and Group B), the results show that, except for the close distance (y/D = 7.5), when supplying heat at a medium distance or farther (y/D ≥ 15), using a larger induced airflow velocity can make the heating temperature of the target area higher. Therefore, optimizing the induced airflow velocity is a key parameter to improve the efficiency of long-distance heating by thermal jet, and this conclusion echoes the analysis results of Section 5.1 and Section 5.2.
Figure 13 shows the change in the average temperature of each target area relative to a single thermal jet under different induced airflow configurations. Overall, since the maintenance of the thermal jet deflection height and axial center temperature in the induced air supply system is improved compared with the single thermal jet, the average value of the heating gain at different target heating distances is positive; that is, more heat energy can be transported from the air inlet to the target work area. This result shows that the use of the induced air supply system has a significant optimization effect on the overall heating performance of the entire space compared to a single thermal jet.
It is worth noting that for the target area at the dimensionless distance y/D = 7.5, the heating gain of the induced air supply condition is negative, and the heating effect becomes worse as the induced airflow rate increases. As mentioned in the previous section, although the axial center temperature of the induced air supply system increases at y/D = 7.5, its deflection height is basically unchanged compared with the single thermal jet, which causes the upper ambient temperature induced airflow to enter the target heating area and reduce the average temperature of the area. In fact, at the target distance of y/D = 7.5, both the single thermal jet and the induced air supply thermal jet are in the momentum-dominated area, and the single thermal jet has a better heating capacity for the target area. At this time, the induced air inlet may not be opened; that is, the single thermal jet air supply method can be used.
For the three target heating areas at the dimensionless distance y/D ≥ 15, the heating gains of each operating condition are all positive, and there are significant differences in the degree of improvement of the heating effect by the different configurations of the induced airflow. At y/D = 15, although the axial center temperature at this position is basically unchanged, the upward deflection height is effectively reduced, so the heating gain is the best, at 2.9 K. This shows that in practical applications, it is not appropriate to pursue a lower deflection height alone, and it is still necessary to consider the comprehensive effect of the axial center temperature and the deflection effect on the target area. For the target heating areas located at y/D = 22.5 and y/D = 30, as the size of the induced air inlet and the induced air velocity increase, the heating gain of the target area increases. Therefore, for these two target areas at long distances, there is a specific operating condition that maximizes the heating gain, and the maximum heat gains are 2.6 K and 2.0 K, respectively.

5.4. Draught Rate of the Induced Air Supply System

While pursuing high heating gain, human discomfort caused by excessive air supply velocity must be considered. Figure 14 calculates the average draught rate (DRwhole) of the optimal cases in each target area. The analysis found that the increase in the induced airflow rate will lead to an increase in the draught rate in the target area. Especially in case 2-3, the DRwhole has exceeded the 40% human thermal comfort threshold.
In order to ensure a high heating gain while reducing the draught rate, the induced airflow rate needs to be adjusted reasonably. For example, in case 1-3, a high heating gain was achieved at y/D = 30, and the draught rate of the whole process remained at a low level. In addition, the draught rate of case 2-4 was calculated, and it had the same induced airflow parameters and heating amount as case 2-3. The results show that the dissatisfaction caused by air supply velocity in case 2-4 is lower, and the heating gain decreases at the same time. Therefore, when the human body shows high dissatisfaction with the draught rate caused by the induced air supply system, it can be optimized by adjusting the induced airflow or thermal jet parameters. However, these adjustments may come at the expense of some heating gain.

6. Conclusions

In winter, when using thermal air for heating, the problem of short thermal air transmission distance is often faced, which leads to low overall heating efficiency. Therefore, this study proposes an induced air supply system based on an ambient temperature high-velocity jet. Through the instant interaction between the induced airflow and the thermal jet below, the rising trend of the thermal flow can be quickly suppressed, and its temperature attenuation can be slowed down, thereby improving the energy efficiency of the target heating area. This system has the advantages of high efficiency, energy-saving properties, and an easy integrated design. This study analyzes the control effect of ambient temperature induced airflow on the thermal jet, and it discusses the influence of induced airflow configuration on the trajectory and axial center temperature of the thermal jet, the heating gain, and draught rate of the target areas. The main conclusions of this study are as follows:
(1)
The induced airflow significantly prolongs the jet stabilization zone and delays the position where the thermal jet floats up. Compared with the single thermal jet, the jet stabilization zone of the induced air supply system can be extended by up to 10 D; under the same induced airflow flow rate, the greater the induced air velocity, the wider the control range of the thermal jet.
(2)
The induced airflow effectively improves the phenomenon of upward deflection of the thermal jet and extends the horizontal transport distance of the thermal flow. The induced airflow can inhibit the transformation of the thermal jet from the transition zone to the buoyancy-dominated zone. Compared with a single thermal jet, the deflection of the induced air supply system can be reduced by up to 98.7% at long distances compared to a single thermal jet. Under the same induced airflow flow rate, a larger induced airflow velocity has a more significant inhibitory effect on the deflection of the thermal jet.
(3)
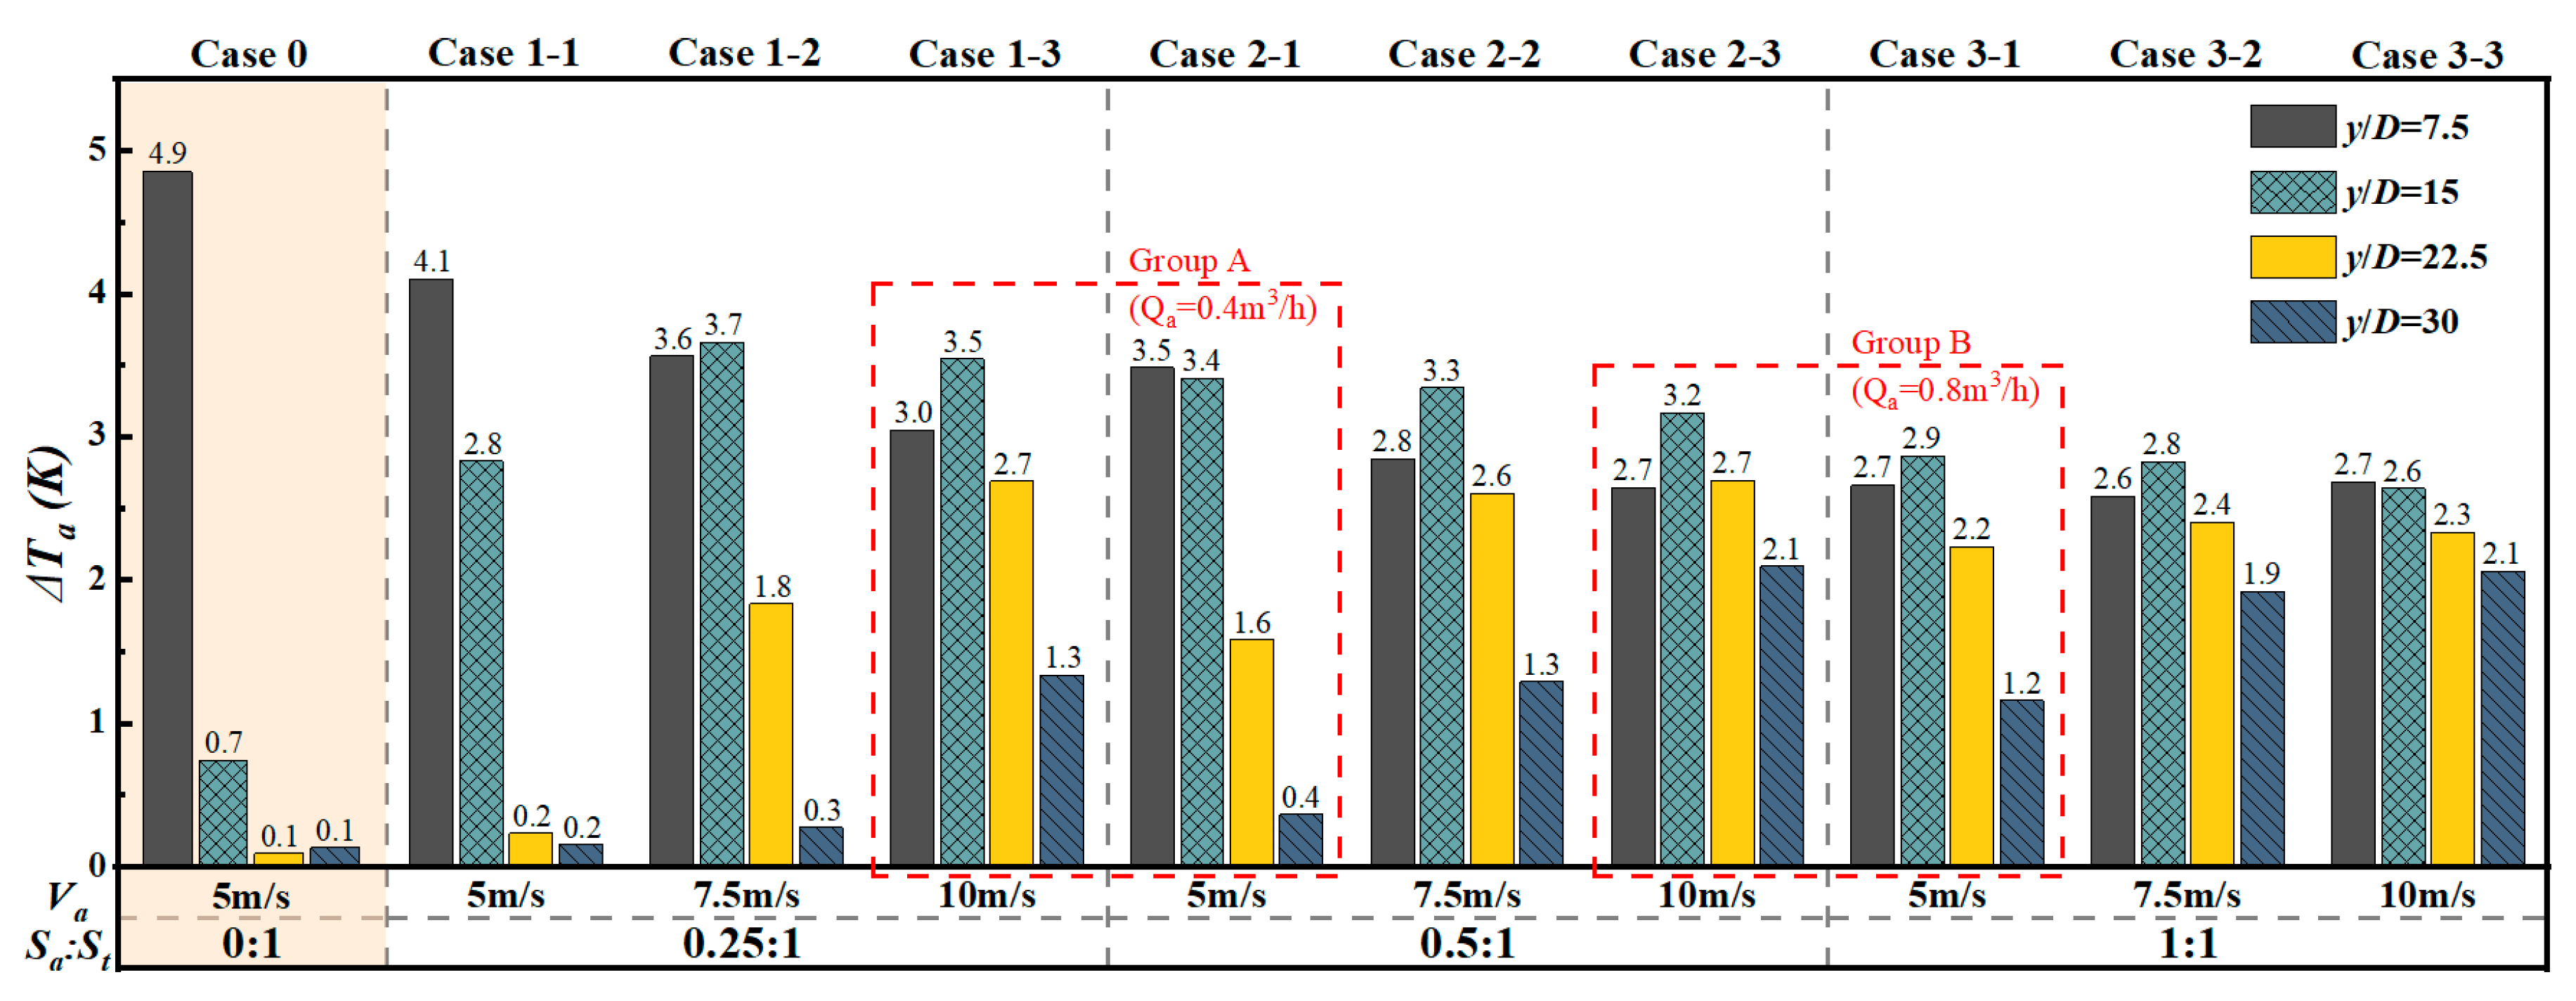
The induced airflow can inhibit the mixing of the thermal jet with the surrounding fluid and affect the axial center temperature of the thermal jet. Compared with the single thermal jet, the axial center temperature of the induced air supply system at a close distance (y/D = 7.5) can be increased by 49.3%; a larger induced airflow flow rate can reduce the axial center temperature attenuation of the induced air supply condition from 20.6 K to 7.1 K.
(4)
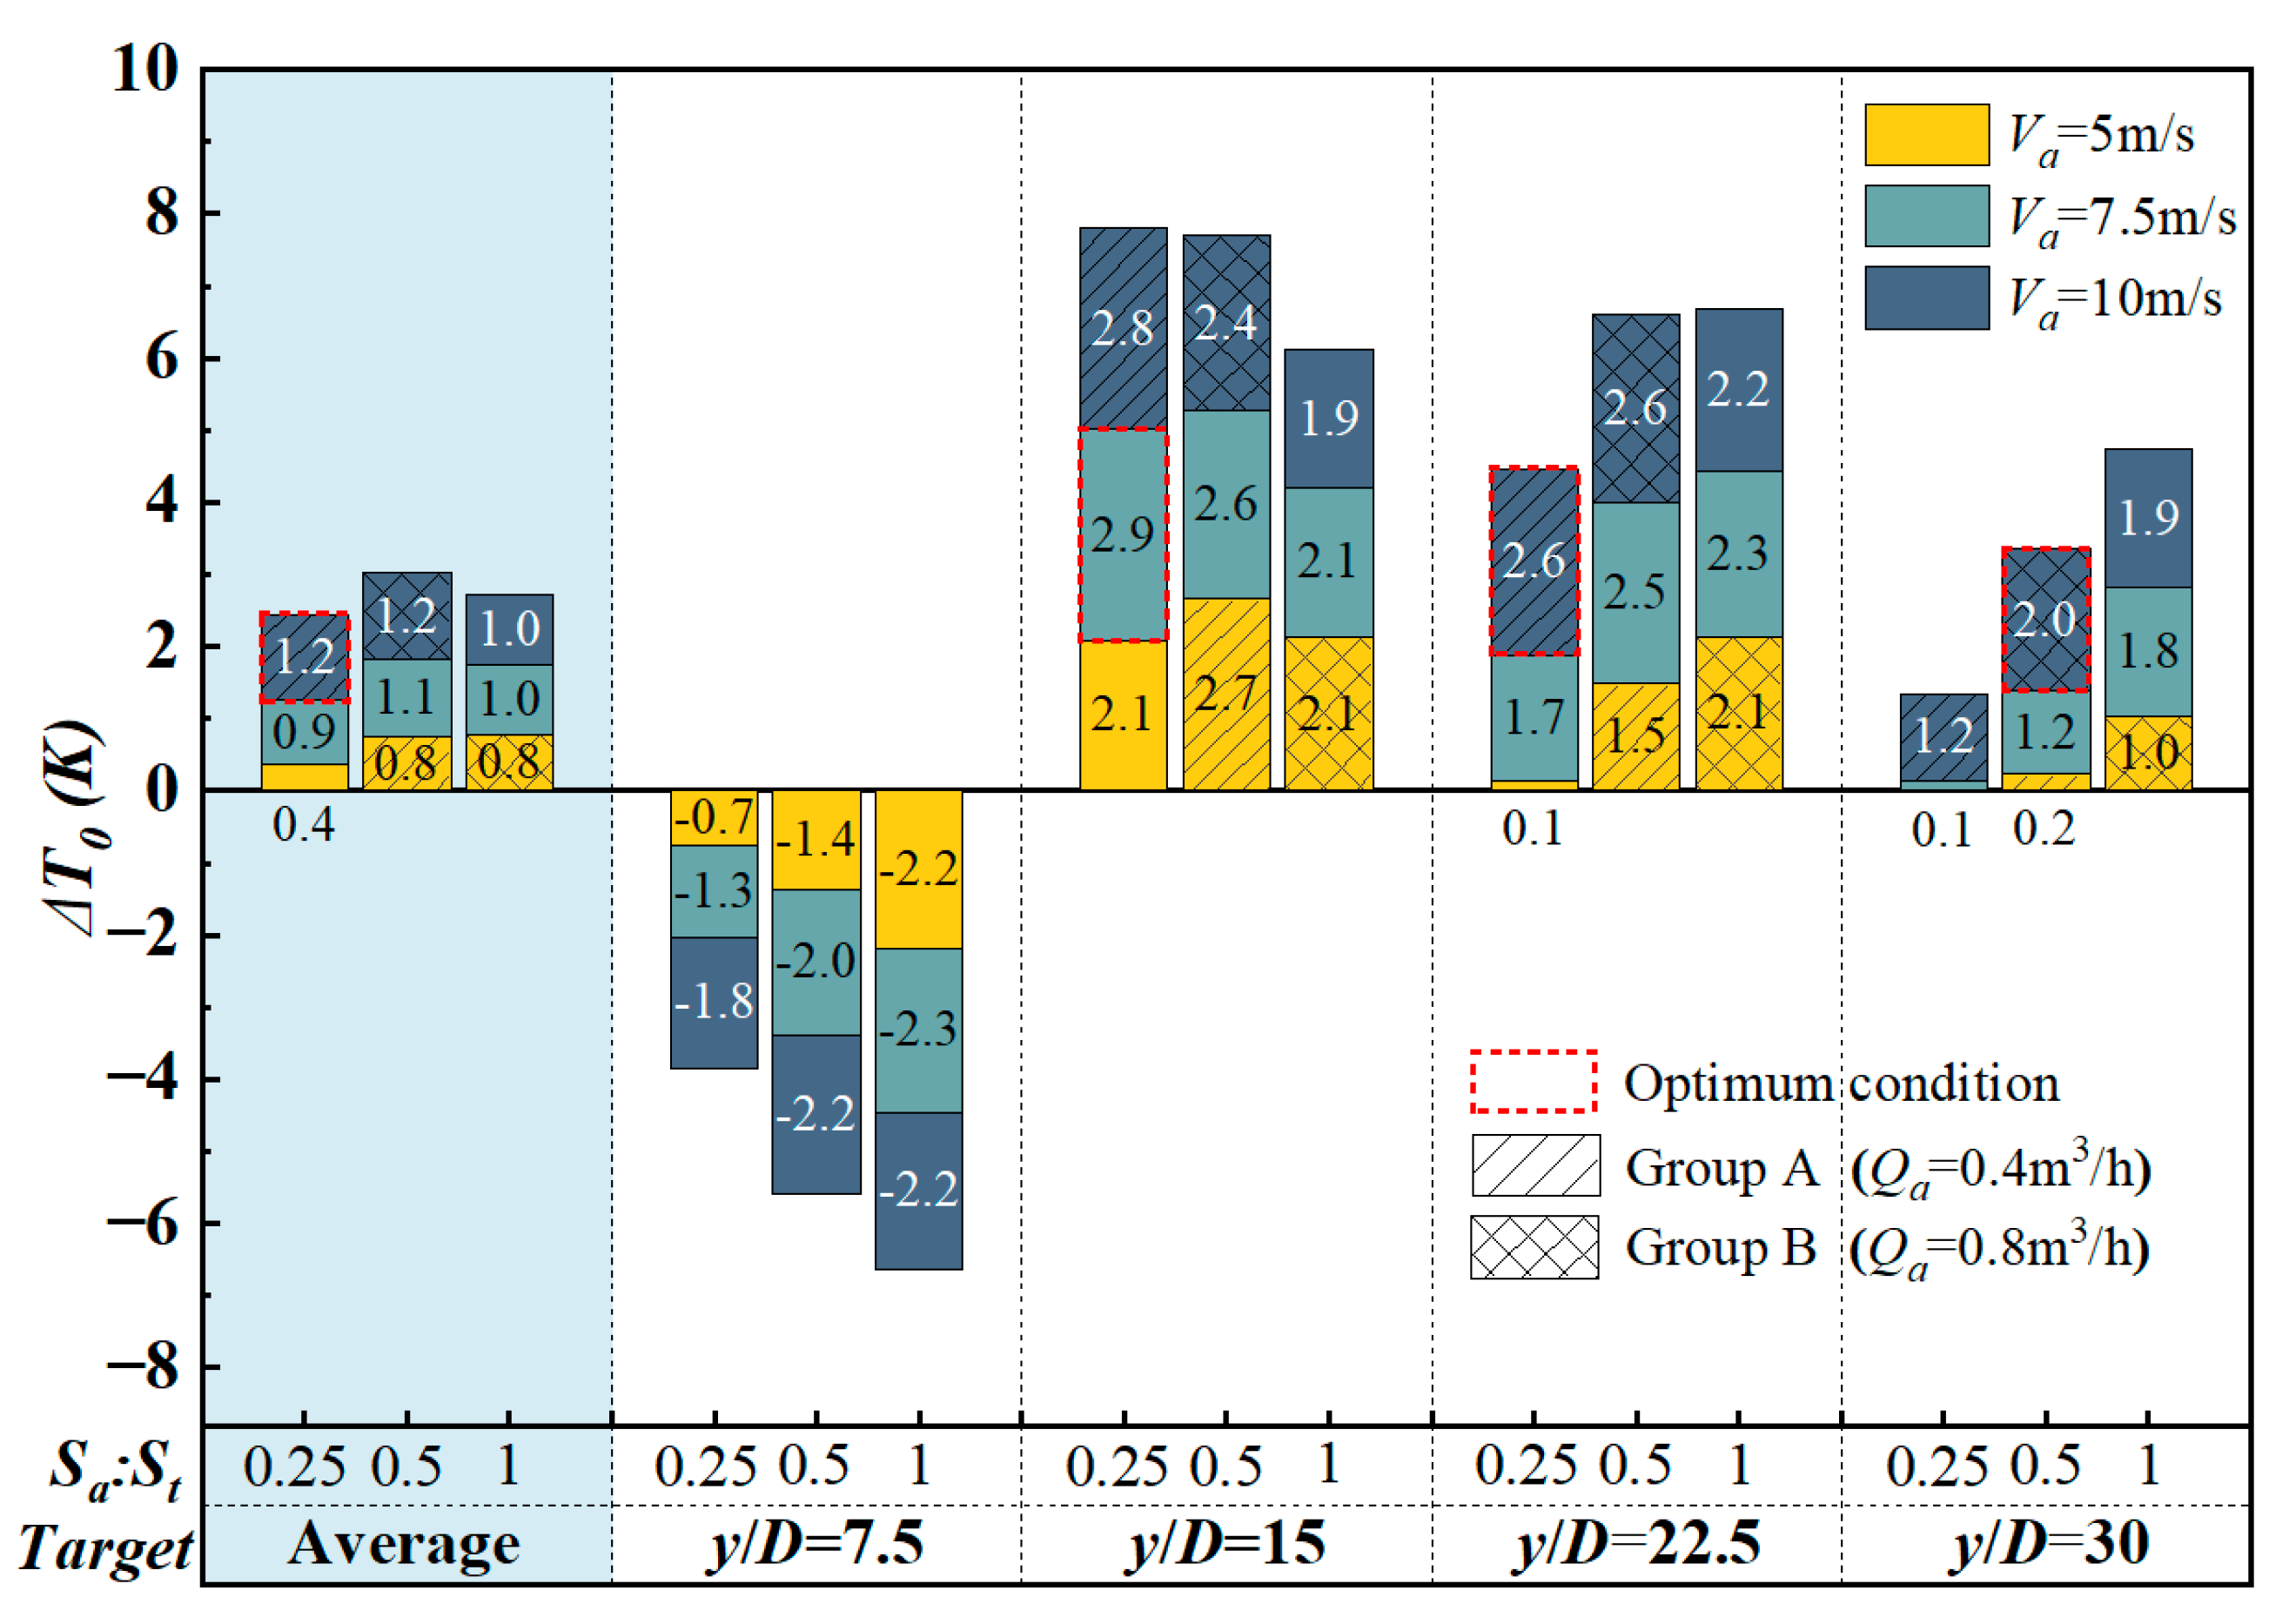
The comprehensive heating performance of the induced air supply system in the entire space is better than that of the single thermal jet. It is necessary to consider the comprehensive impact of jet deflection and axial center temperature on the target area at the same time; the larger the induced airflow rate, the more uniform the thermal environment of the entire heating process. For the target area at a close distance (y/D = 7.5), the single thermal jet air supply can be used; when heating at a medium distance or above (y/D ≥ 15), it is possible to consider increasing the induced airflow velocity first to obtain a higher heating gain.
(5)
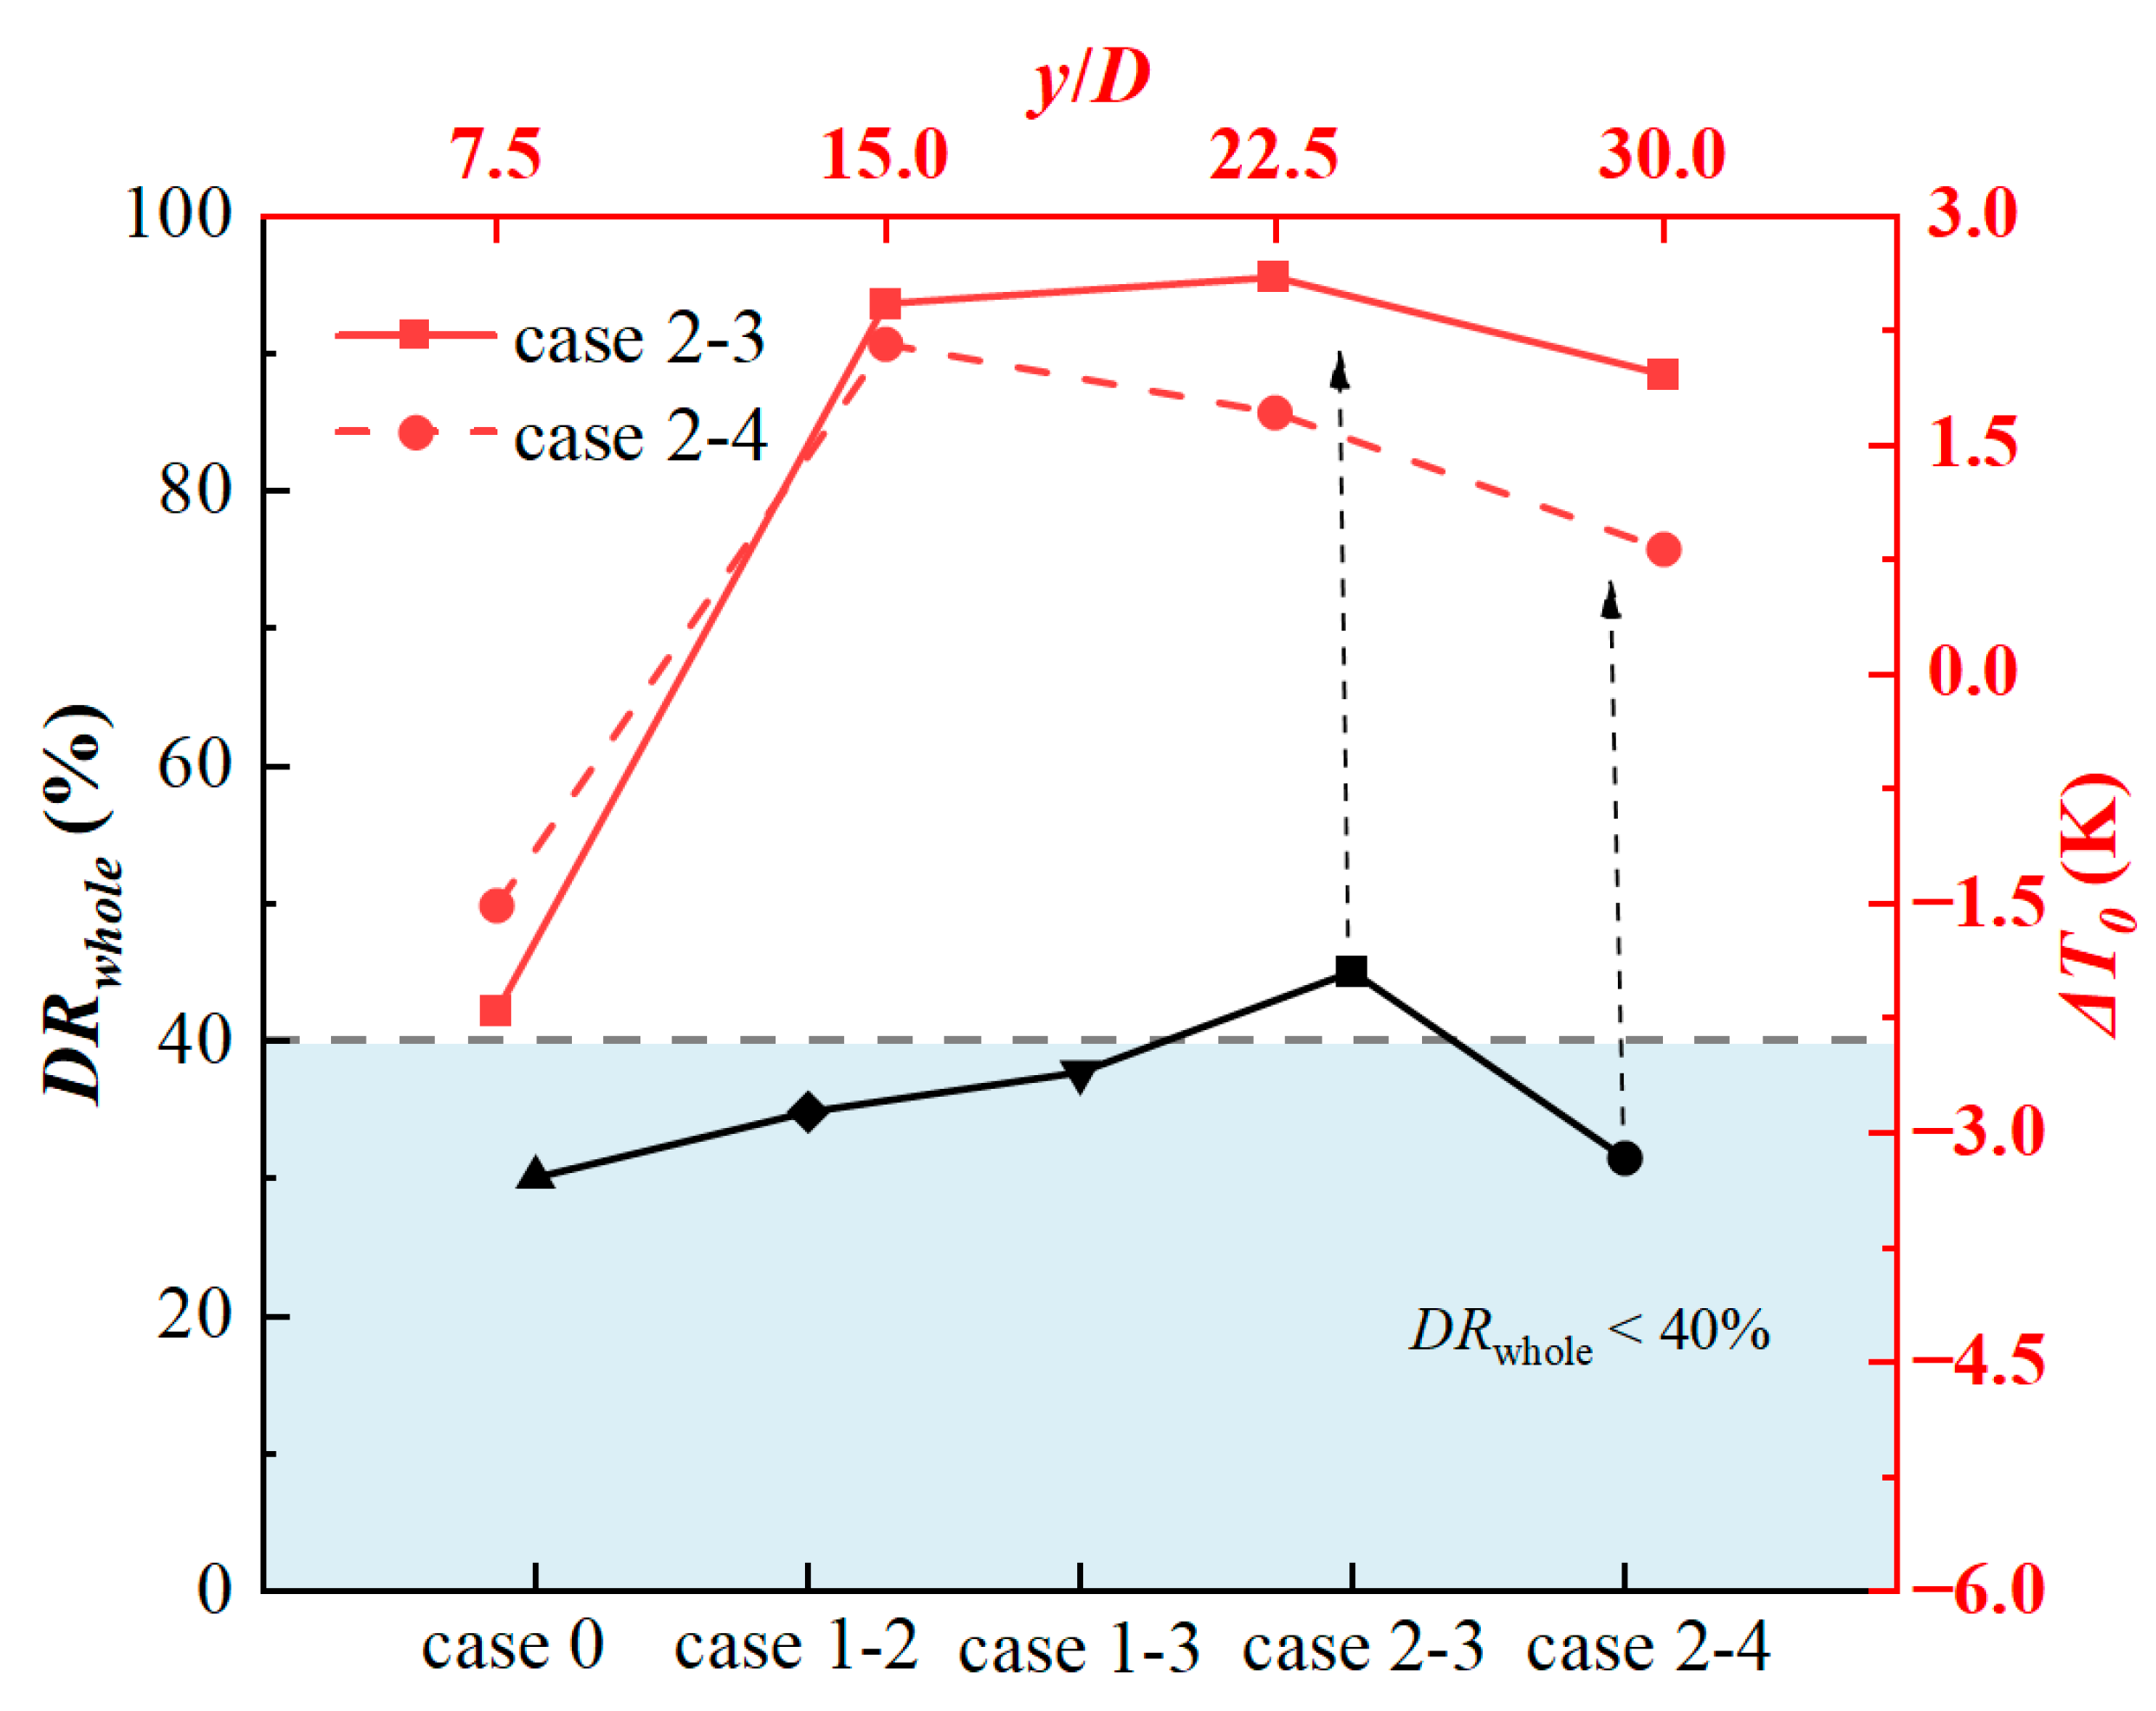
For the discomfort caused by excessive air supply velocity in the induced air supply system, the overall draught rate in the target area can be improved by adjusting the induced airflow or thermal jet parameters, but at the same time, the heating gain will be reduced.

Author Contributions

J.Z.: validation, data curation, writing—original draft preparation; Y.B.: methodology, formal analysis, project administration; Z.C.: conceptualization, writing—review and editing, funding acquisition; Z.Y.: investigation; W.L.: supervision. All authors have read and agreed to the published version of the manuscript.

Funding

This research was funded by National Natural Science Foundation of China, grant number 52278128.

Data Availability Statement

The original contributions presented in the study are included in the article; further inquiries can be directed to the corresponding author.

Conflicts of Interest

The authors declare that they have no known competing financial interests or personal relationships that could have appeared to influence the work reported in this paper.

References

  1. EIA. International Energy Outlook. Available online: www.eia.gov/ieo (accessed on 11 October 2023).
  2. Szczepanik-Scislo, N.; Flaga-Maryan’czyk, A. Indoor air quality modelling and measurements of a studio apartment with a mechanical exhaust system. E3S Web Conf. 2018, 44, 171. [Google Scholar] [CrossRef]
  3. Szczepanik-Scislo, N.; Scislo, L. Air leakage modelling and its influence on the air quality inside a garage. E3S Web Conf. 2018, 44, 172. [Google Scholar] [CrossRef]
  4. Liddament, M.W. A review of ventilation and the quality of ventilation air. Indoor Air 2000, 10, 193–199. [Google Scholar] [CrossRef]
  5. Khan, A.; Bradshaw, C.R. Quantitative comparison of the performance of vapor compression cycles with compressor vapor or liquid injection. Int. J. Refrig. 2023, 154, 386–394. [Google Scholar] [CrossRef]
  6. Pérez-Lombard, L.; Ortiz, J.; Pout, C. A review on buildings energy consumption information. Energy Build. 2008, 40, 394–398. [Google Scholar] [CrossRef]
  7. Szczepanik-Scislo, N.; Scislo, L. Dynamic Real-Time Measurements and a Comparison of Gas and Wood Furnaces in a Dual-Fuel Heating System in Order to Evaluate the Occupants’ Safety and Indoor Air Quality. Buildings 2023, 13, 2125. [Google Scholar] [CrossRef]
  8. Cheng, F.; Li, Y.; Wu, Y.; Cheng, Y.; Lin, Z. Experimental study of air distribution and heating performances of deflection ventilation. Energy Build. 2023, 282, 112800. [Google Scholar] [CrossRef]
  9. Ye, X.; Zhu, H.; Kang, Y.; Zhong, K. Heating energy consumption of impinging jet ventilation and mixing ventilation in large-height spaces: A comparison study. Energy Build. 2016, 130, 697–708. [Google Scholar] [CrossRef]
  10. Szczepanik-Scislo, N.; Antonowicz, A.; Scislo, L. PIV measurement and CFD simulations of an air terminal device with a dynamically adapting geometry. SN Appl. Sci. 2019, 1, 370. [Google Scholar] [CrossRef]
  11. Szczepanik-Scislo, N. Improving Household Safety via a Dynamic Air Terminal Device in Order to Decrease Carbon Monoxide Migration from a Gas Furnace. Int. J. Environ. Res. Public Health 2022, 19, 1676. [Google Scholar] [CrossRef]
  12. Ye, X.; Kang, Y.; Zuo, B.; Zhong, K. Study of factors affecting warm air spreading distance in impinging jet ventilation rooms using multiple regression analysis. Build. Environ. 2017, 120, 1–12. [Google Scholar] [CrossRef]
  13. Hu, J.; Wang, Y.; Wang, D.; Song, J. Impacts of low atmospheric pressure on distribution of indoor hot air jet in plateau area. Indoor Built Environ. 2022, 31, 2447–2466. [Google Scholar] [CrossRef]
  14. Krajcik, M.; Simone, A.; Olesen, B.W. Air distribution and ventilation effectiveness in an occupied room heated by warm air. Energy Build. 2012, 55, 94–101. [Google Scholar] [CrossRef]
  15. Kabanshi, A.; Sandberg, M. Entrainment and its implications on microclimate ventilation systems: Scaling the velocity and temperature field of a round free jet. Indoor Air 2019, 29, 331–346. [Google Scholar] [CrossRef]
  16. Wang, Y.; Huang, Y.; Zhou, Y.; Shu, Y.; Liu, J. Experimental study on one-side confined jets from a parallel-flow outlet in a push-pull ventilation system. Indoor Built Environ. 2015, 24, 73–86. [Google Scholar] [CrossRef]
  17. Wang, H.; Tang, X.; Huang, C. Investigating ventilation system performance in large space building: A nozzle primary air supply with secondary airflow-relay system. Sci. Technol. Built Environ. 2017, 23, 296–306. [Google Scholar] [CrossRef]
  18. Wang, H.; Huang, C.; Cui, Y.; Zhang, Y. Experimental study on the characteristics of secondary airflow device in a large enclosed space building. Energy Build. 2018, 166, 347–357. [Google Scholar] [CrossRef]
  19. Zhu, S.; Cai, W.; Spengler, J.D. Control of sleep environment of an infant by wide-cover type personalized ventilation. Energy Build. 2016, 129, 69–80. [Google Scholar] [CrossRef]
  20. Cao, Z.; Wang, R.; Zhai, C.; Wang, Y.; Zhao, T.; Wu, S. Flow characteristics and formation optimization of vortex ring air supply. Indoor Air 2022, 32, e13096. [Google Scholar] [CrossRef]
  21. Zhai, C.; Wang, Y.; Cao, Z.; Zhao, T.; Wang, R.; Zhang, C.; Wu, S. Effect of thermal buoyancy on vortex ring air supply mode. Build. Environ. 2022, 221, 109257. [Google Scholar] [CrossRef]
  22. Wang, X.; Liu, Y.; Song, C.; Gao, L. Characteristics of oxygenic-thermal coupled jet driven by concentration difference and temperature difference at high altitudes. Build. Environ. 2023, 228, 109897. [Google Scholar] [CrossRef]
  23. Song, C.; Yang, X.; Liu, Y.; Wang, X. Diffusion characteristics of vertical oxygenic-thermal coupled jet and indoor oxygenic-thermal environment regulation in high-altitude areas. J. Build. Eng. 2024, 93, 109797. [Google Scholar] [CrossRef]
  24. Saïd, M.N.A.; MacDonald, R.A.; Durrant, G.C. Measurement of thermal stratification in large single-cell buildings. Energy Build. 1996, 24, 105–115. [Google Scholar] [CrossRef]
  25. Espinosa, F.A.D.; Glicksman, L.R. Determining thermal stratification in rooms with high supply momentum. Build. Environ. 2017, 112, 99–114. [Google Scholar] [CrossRef]
  26. Chen, H.; Moshfegh, B.; Cehlin, M. Computational investigation on the factors influencing thermal comfort for impinging jet ventilation. Build. Environ. 2013, 66, 29–41. [Google Scholar] [CrossRef]
  27. Zhang, S.; Lin, Z.; Ai, Z.; Wang, F.; Cheng, Y.; Huan, C. Effects of operation parameters on performances of stratum ventilation for heating mode. Build. Environ. 2019, 148, 55–66. [Google Scholar] [CrossRef]
  28. Zhang, S.; Cheng, F.; Zhang, X.; Lin, Z.; Cheng, Y. Cooling effect of air movement of advanced air distribution under heating mode: Experimental analyses of stratum ventilation. Build. Environ. 2023, 231, 110041. [Google Scholar] [CrossRef]
  29. Fan, Y.; Li, X.; Yan, Y.; Tu, J. Overall performance evaluation of underfloor air distribution system with different heights of return vents. Energy Build. 2017, 147, 176–187. [Google Scholar] [CrossRef]
  30. Yu, Y.; Xia, Y.; Xu, Y.; Gao, J. Aerodynamic sealing using a segmented recirculating horizontal air curtain for buoyancy-driven flows in doorways. Build. Environ. 2024, 247, 111028. [Google Scholar] [CrossRef]
  31. Yang, B.; Liu, P.; Liu, Y.; Wang, F. Performance evaluation of ductless personalized ventilation combined with impinging jet ventilation. Appl. Therm. Eng. 2023, 222, 119915. [Google Scholar] [CrossRef]
  32. Duan, T.; Ye, X.; Du, P.; Qi, H.; Kang, Y.; Zhong, K. Study of indoor local thermal comfort for impinging jet ventilation combined with ductless personalized ventilation under different cooling loads. Build. Environ. 2024, 265, 112013. [Google Scholar] [CrossRef]
  33. Fernandez, K.B.; Yoo, S.-J.; Kuga, K.; Ito, K. Toward occupant-centric system: Multicriteria optimization of hybrid displacement-personalized ventilation system using computational fluid dynamics with computer-simulated person. Build. Environ. 2024, 262, 111837. [Google Scholar] [CrossRef]
  34. Liu, X.; Liu, X.; Zhang, T. Influence of air-conditioning systems on buoyancy driven air infiltration in large space buildings: A case study of a railway station. Energy Build. 2020, 210, 109781. [Google Scholar] [CrossRef]
  35. Kanagalingam, S.; William, Y.E. Assessment of Computational Fluid Dynamics Reynolds-Averaged Navier–Stokes Models for Bluff Bodies Aerodynamics. SAE Int. J. Commer. Veh. 2023, 16, 403–419. [Google Scholar] [CrossRef]
  36. Zhai, Z.J.; Zhang, Z.; Zhang, W.; Chen, Q.Y. Evaluation of various turbulence models in predicting airflow and turbulence in enclosed environments by CFD: Part 1—Summary of prevalent turbulence models. Sci. Technol. Built Environ. 2007, 13, 853–870. [Google Scholar]
  37. Khan, A.; Irfan, M.; Niazi, U.M.; Shah, I.; Legutko, S.; Rahman, S.; Alwadie, A.S.; Jalalah, M.; Glowacz, A.; Khan, M.K.A. Centrifugal compressor stall control by the application of engineered surface roughness on diffuser shroud using numerical simulations. Material 2021, 14, 2033. [Google Scholar] [CrossRef]
  38. Shih, T.-H.; Liou, W.W.; Shabbir, A.; Yang, Z.; Zhu, J. A new k-ε eddy viscosity model for high reynolds number turbulent flows. Comput. Fluids 1995, 24, 227–238. [Google Scholar] [CrossRef]
  39. Shaheed, R.; Mohammadian, A.; Gildeh, H.K. A comparison of standard k-ε and realizable k-ε turbulence models in curved and confluent channels. Environ. Fluid Mech. 2019, 19, 543–568. [Google Scholar] [CrossRef]
  40. Goodfellow, H.D.; Kosonen, R. Industrial Ventilation Design Guidebook: Volume 1: Fundamentals; Academic Press: Cambridge, MA, USA, 2020; pp. 268–271. [Google Scholar]
  41. ISO 7730:2005; Ergonomics of the Thermal Environment-Analytical Determination and Interpretation of Thermal Comfort Using Calculation of the PMV and PPD Indices and Local Thermal Comfort Criteria. ISO: Geneva, Switzerland, 2005.
  42. GB 33658-2017; Thermal Comfort Requirements and Evaluation for Indoor Environment (in Chinese). Standards Press of China: Beijing, China, 2017.
  43. Roache, P.J. Perspective: A method for uniform reporting of grid refinement studies. J. Fluids Eng. 1994, 116, 405–413. [Google Scholar] [CrossRef]
  44. Hossain, M.; Rodi, W. A turbulence model for buoyant flows and its application to vertical buoyant jets. In Turbulent Buoyant Jets and Plumes; Elsevier: Amsterdam, The Netherlands, 1982; pp. 121–178. [Google Scholar]
  45. Michas, S.N.; Papanicolaou, P.N. Horizontal round heated jets into calm uniform ambient. Desalination 2009, 248, 803–815. [Google Scholar] [CrossRef]
  46. Koestel, A. Paths of Horizontally Projected Heated and Chilled Air Jet. ASHVE Trans. 1955, 61, 213–232. [Google Scholar]
Figure 1. Schematic diagram of air supply effect and air supply principle. (a) Single thermal jet; (b) induced air supply system.
Buildings 15 00979 g001
Figure 2. (a) Computational domain geometry model; (b) overall mesh division.
Buildings 15 00979 g002
Figure 3. (a) Schematic diagram of thermal jet trajectory and deflection height; (b) locations of four target heating areas and draught rate measurement points.
Buildings 15 00979 g003
Figure 4. Grid independence verification results. (a) Vertical velocity distribution and (b) vertical temperature distribution at y/D = 20; (c) vertical velocity distribution and (d) vertical temperature distribution at y/D = 30.
Buildings 15 00979 g004aBuildings 15 00979 g004b
Figure 5. Numerical simulation verification results. (a) Isothermal jet [40]; (b) non-isothermal jet [45].
Buildings 15 00979 g005
Figure 6. Temperature distribution on the Z = 0 plane under different cases.
Buildings 15 00979 g006
Figure 7. Distribution of stable zone, bulk mixing zone, and complete mixing zone during the thermal jet transportation process under different cases.
Buildings 15 00979 g007
Figure 8. (a) Thermal jet trajectories under different cases; (b) local Archimedes number (Ary) at y/D = 7.5, 15, 22.5, 30 under different cases.
Buildings 15 00979 g008
Figure 9. Dimensionless deflection height of the thermal jet at y/D = 7.5, 15, 22.5, and 30 under different induced airflow parameter configurations.
Buildings 15 00979 g009
Figure 10. Temperature distribution under different cases. (a) y/D = 7.5; (b) y/D = 15.
Buildings 15 00979 g010
Figure 11. Axial center temperature distribution of the thermal jet at y/D = 7.5, 10, 12.5, and 15 under different induced airflow parameter configurations.
Buildings 15 00979 g011
Figure 12. Heating temperature of each target area by thermal jet under different induced airflow parameter configurations.
Buildings 15 00979 g012
Figure 13. Relative to the single thermal jet, the heating gain of each target area after introducing different parameters of the induced airflow.
Buildings 15 00979 g013
Figure 14. Distribution of DRwhole values of the best cases in each target area.
Buildings 15 00979 g014
Table 1. Boundary conditions of the numerical simulation.
RegionBoundary TypeBoundary Conditions
InletVelocity inletTemperature: 283.15 K/323.15 K/333.15 K
Other outer boundariesPressure outletBackflow Total Temperature: 283.15 K
Floor and rear wallWallNon-slip, adiabatic
Table 2. Operating conditions settings of numerical simulation.
Project SettingsOperating Conditions
SolverImplicit solution based on pressure
Pressure-velocity coupling modeSIMPLE
Momentum, turbulent kinetic energy, turbulent dissipation rate and energySecond order upwind
PressurePRESTO!
Air densityIncompressible ideal gas
Operating environment temperature283.15 K
Table 3. Numerical simulation conditions settings.
Sa:StJet Inlet TypeCaseAmbient Air Jet
(Ta = 283.15 K)
Thermal Air JetQa
(m3/s)
Va (m/s)Vt (m/s)Tt (K)
0:1Buildings 15 00979 i0010/5323.150
0.25:1Buildings 15 00979 i0021-155323.150.2
1-27.55323.150.3
1-3105323.150.4
0.5:1Buildings 15 00979 i0032-155323.150.4
2-27.55323.150.6
2-3105323.150.8
2-4104333.150.8
1:1Buildings 15 00979 i0043-155323.150.8
3-27.55323.151.2
3-3105323.151.6
Table 4. GCI calculation results.
ItemGrid NumberrVave
(y/D = 7.5)
Tave
(y/D = 7.5)
Vave
(y/D = 15)
Tave
(y/D = 15)
φ 12 203/420 × 1061.670.76%0.11%12.20%0.06%
GCI203/420 × 1061.671.27%0.18%20.47%0.11%
φ 23 420/836 × 1061.290.07%0.01%2.13%0.02%
GCI420/836 × 1061.290.32%0.05%9.63%0.09%
Disclaimer/Publisher’s Note: The statements, opinions and data contained in all publications are solely those of the individual author(s) and contributor(s) and not of MDPI and/or the editor(s). MDPI and/or the editor(s) disclaim responsibility for any injury to people or property resulting from any ideas, methods, instructions or products referred to in the content.

