Article

Impact of Streetscape Built Environment Characteristics on Human Perceptions Using Street View Imagery and Deep Learning: A Case Study of Changbai Island, Shenyang

1
School of Architecture and Urban Planning, Shenyang Jianzhu University, Shenyang 110168, China
2
Faculty of Environmental Engineering, The University of Kitakyushu, Kitakyushu 8080135, Japan
*
Author to whom correspondence should be addressed.
Buildings 2025, 15(9), 1524; https://doi.org/10.3390/buildings15091524
Submission received: 1 April 2025 / Revised: 22 April 2025 / Accepted: 25 April 2025 / Published: 1 May 2025

Abstract

Since the reform and opening-up policy, the accelerated urbanization rate has triggered extensive construction of new towns, leading to architectural homogenization and environmental quality degradation. As urban development transitions toward a “quality improvement” paradigm, there is an urgent need to synergistically enhance the health performance of human settlements through the optimization of public space environments. The purpose of this study is to explore the impact of the built environment of urban streets on residents’ perceptions. In particular, in the context of rapid urbanization, how to improve the mental health and quality of life of residents by improving the street environment. Changbai Island Street in the Heping District of Shenyang City was selected for the study. Baidu Street View images combined with machine learning were employed to quantify physical characterizations like street plants and buildings. The ‘Place Pulse 2.0’ dataset was utilized to obtain data on residents’ perceptions of streets as beautiful, safe, boring, and lively. Correlation and regression analyses were used to reveal the relationship between physical characteristics such as green visual index, openness, and pedestrians. It was discovered that the green visual index had a positive effect on perceptions of it being beautiful and safe, while openness and building enclosure factors influenced perceptions of it being lively or boring. This study provides empirical data support for urban planning, emphasizing the need to focus on integrating environmental greenery, a sense of spatial enclosure, and traffic mobility in street design. Optimization strategies such as increasing green coverage, controlling building density, optimizing pedestrian space, and enhancing the sense of street enclosure were proposed. The results of the study not only help to understand the relationship between the built environment of streets and residents’ perceptions but also provide a theoretical basis and practical guidance for urban space design.

1. Introduction

Human perception plays an important role in public and environmental psychology [1]. Human perception has been shown in environmental psychology research to be a mediator between physical characteristics and human behavior [2]. Analyzing human perception in urban spaces is essential for researchers to uncover the intricate relationships between the built environment, psychological well-being, and spatial behavior [3,4]. Recent investigations have significantly advanced our understanding of how human perception is shaped by environmental factors and its implications for urban sustainability [5]. Several studies have shown that visual space reflects much of the urban environment. The visual space of the built urban environment influences the psychological and health perceptions of its inhabitants [6,7].
Driven by the accelerated globalization process, urbanization has emerged as the most prominent spatial restructuring phenomenon in the 21st century. As the largest developing nation, China has seen its urbanization rate leap from 17.9% in 1978 to 66.16% in 2023. The initial pattern of urban expansion was a shift from the renewal of old urban areas to sprawl development dominated by new urban areas [8]. This initial rough construction has led to problems such as the decay of the environmental effectiveness of new urban areas [9]. The World Health Organization (2016) highlights that environmental pressures on new urban areas and lifestyle changes are exacerbating mental health risks for residents [10]. These challenges are prompting a shift in China’s urban development paradigm from “extensive growth” to “quality-oriented improvement”. China’s State Council’s 14th Five-Year Plan for Modern Urban Governance explicitly states that China should implement the “Urban Quality Enhancement Initiative” and lists the optimization of the public space environment as a core task of new urbanization. This requires urban planners and government personnel to realize a synergistic enhancement of the quality of the habitat and the well-being of the residents of new urban areas in the early stages of expansion within the context of people-centered planning [11,12]. Therefore, exploring how to solve the health and environmental problems brought about by urbanization in new towns and improving the quality of public space in roughly developed new towns plays a crucial role in modern urban development [13].
As a public space frequently engaged by urban residents in their daily activities, the street’s spatial environment directly affects the residents’ impression of the city [14], further influencing their behavior and mental health [15]. Streets connect different functional areas of the city [16,17], and at the same time, streets are defined for different functions such as commerce, transportation, and residence [18,19,20]. Moreover, emerging evidence highlights that the impacts of distinct street-scale built environments on human perception vary significantly. Empirical findings demonstrate divergent perceptual responses across zones with differing land-use compositions, where residential and commercial areas tend to evoke feelings of safety and vibrancy, whereas parklands and residential neighborhoods foster stronger aesthetic appreciation [1]. Several studies have found that negative perceptions are significantly related to poorer street built environments [21]. Therefore, improving the aesthetics and vibrancy of streets not only enhances the quality of urban streets but also reduces the psychological pressure on the public [22]. Several studies have shown that the creation of high-quality streets has a positive impact on residents [23], as well as enhancing their attachment to multiple places [24]. Several scholars in their research have proposed that the quality and spatial characteristics of streets affect public perceptions such as safety and stress [25]. Optimizing the spatial characteristics of streets as well as the quality of streets can alleviate human depression and anxiety [26].
Existing research at the street scale focuses on the preservation of historic districts [27], the analysis of residents’ perceptions in old urban areas [28], and the assessment of the visual quality of campuses [29]. Over time, the problem of alienation of the built environment caused by the rough construction in the early stage of the expansion of new districts has become more and more obvious. The relationship between street form and human perception is more complex in new districts than in organically grown old districts. However, existing research has paid insufficient attention to the evaluation of visual quality and perception of streets in the early stages of the expansion of new districts. A quantitative index system for street perception applicable to the expansion stage of new cities in China has not been established.
Based on previous research on urban quality, this study selected the Changbai Island area in Shenyang City as an empirical object, using streetscape big data and deep learning techniques to explore the integrated area in the early stages of urban rough construction. We developed evaluation indicators for the physical characteristics of street space and dimensions of human perception during the expansion of new districts and uncovered the mechanisms of spatial heterogeneity in how the physical environment shapes human perception. The methodological framework includes the following steps:
(1)
Delineate the study area and determine the sample points in ArcGIS.
(2)
Quantify physical street characteristics via semantic segmentation technology and extract key morphological indices, such as green visibility rate and interface continuity.
(3)
Obtain residents’ street perception data using the Place Pulse 2.0 dataset.
(4)
Explore the relationship between physical street attributes and residents’ emotional perceptions.
This study provides technical references for enhancing the quality of life and promoting the mental health of urban residents.

2. Literature Review

2.1. Theoretical Studies Related to Human Perception

Over the years, several disciplines and fields, such as environmental psychology, neuroscience, and urban planning, have been exploring the relationship between the environment and human perception [30,31]. Human perception of the city refers to the preference of urban residents for the urban environment and their cognitive judgment of specific scenes such as city streets, buildings, and parks [32]. In his book Space and Place: A Perspective on Experience, Tuan elaborated on the formation logic of space and place and analyzed how places influence human perceptions [33]. Based on environmental psychology, Rachel and Stephen Kaplan (1989) proposed that the natural environment influences human perception and mental health [30]. Ulrich’s empirical research found that the natural environment influences people’s aesthetic preferences [34]. In the 1990s, Ulrich proposed the Stress Reduction Theory (SRT) [35], and Kaplan proposed the Attention Restoration Theory (ART) [36]. Both theories emphasize the capacity of high-quality environments (natural and urban) to restore human attention and alleviate stress. Among the core elements in the Attention Restoration Theory are ease, fascination, coherence, and compatibility.

2.2. Human Perception Assessment of Urban Streets

Scholars have been scoring scenes in Chicago-area pictures based on visual attributes like safety, beauty, and landscape preference since 1967. Data on safety, beauty, and preference were used to analyze public perception studies of the visual appearance of neighborhoods. Building on this foundation, scholars have explored human perception and psychological well-being by examining factors such as socio-economic determinants, social dynamics, the physical environment [37], infrastructure configurations [38], and tourism-related attributes [39]. Humans’ psychological perception of urban scenes stems from their perceptions [40] and satisfaction [41] after experiencing the place. It influences humans’ emotions and, through perception, affects their willingness to engage in physical activities [42,43]. Human psychological perception after place experience mainly covers positive perceptions such as beauty and safety and negative perceptions such as boredom, insecurity, and depression [44,45,46].
In Maslow’s Hierarchy of Needs Theory, safety and beauty are the main factors that fulfill people’s basic needs [47]. Beauty is also the most basic aesthetic indicator and can be described as the “relatively aesthetic impeccability of a landscape” [48]. By setting rules for the design of urban aesthetics, it is possible to allow different areas to develop a unique style based on local culture and the needs of the inhabitants [49]. Scholars have employed visual aesthetic metrics to assess the visual quality of streets and parks [47,50]. Perceptions of safety are commonly desired and indicate that a person’s presence in a place does not create feelings of embarrassment, foreboding, and danger [51]. Research has shown that the built environment, along with individual physiological and psychological factors, influences perceptions of crime risk [52]. Factors that primarily affect perceptions of safety include the quality of sidewalks as well as infrastructure in public places [53]. Street vitality, an external expression of social vitality in urban contexts, is a key indicator and important manifestation of urban livability [54]. Vitality is the interaction between a person being in that place and the environment. Empirical research has demonstrated that greenscapes significantly enhance street vitality. Conversely, the perception of boredom involves evaluating street aesthetics and represents a subjective experience of monotony during street use. There are significant differences in the perceptions formed by humans in built environments of different qualities [55,56].

2.3. Assessment of the Physical Characteristics of Urban Streets

Previous scholars have analyzed the urban built environment from the perspectives of geography, resource environment, land use, and infrastructure. Physical street characteristics, a key aspect of scholars’ spatial quality assessments, accurately reflect the objective physical conditions of streets [57]. Scholars have focused on the physical elements of the street, such as buildings, sky openness, greenery, and sidewalks. Furthermore, the relationship between the street environment and human perception is analyzed based on these physical characteristics. Urban environmental factors such as population density, non-vegetated land cover, arterial road network, vehicular air pollution, tree canopy density, and Normalized Vegetation Index (NDVI) commonly affect human perception of urban space [55]. The richness of infrastructure and the context of different land use types can lead to differences in subjective perceptions [56].
Streets are entities of built space that have the role of linking public infrastructure to the physical characteristics of the built environment [58] and have a very important impact on public perception and mental health [59,60]. In previous studies, the physical characteristics of streets can represent the spatial quality of streets [61]. Scholars have found that the physical characteristics of street space, such as building scale [7], greenery [62], maintenance [3], walkability [63], and openness [60], influence human perception [64]. Among them, the area of vegetation cover affects the perception of beauty [48,65] and safety [66]. Conversely, streets with excessive building density and limited openness increase residents’ stress and boredom [67]. Street scale, building density, and open space shape the perception of vitality [68].

2.4. Methods for Acquiring Human Perceptual Features

When studying the spatial quality of streets, traditional ways of investigating human perception include field surveys, interviews, and questionnaires [69,70], which use feedback to summarize the characteristics researchers need to form conclusions [71]. Traditional methods of collecting human perception data are time-consuming and resource-intensive, and they only facilitate the study of smaller areas [72]. The aesthetics evaluation method and the semantic differential method are traditional ways of evaluating visual quality [48]. Scholars often use a Likert scale to score the physical environment of a study area.
Through continuous research, methods to quantify human perception have gradually been rationalized. Cognitive maps, photography, and emoji-based emotion categorization approaches have become the main methods for studying human perception. Based on the development of neurological disciplines, scholars have advocated the use of physiological data to reflect the perceptual state of the public. Consequently, the acquisition of physiological metrics, including electrocardiogram (ECG), galvanic skin response (GSR), electroencephalogram (EEG), and blood pressure, has emerged as a valuable approach for capturing human perceptual responses in urban research [56]. Kacha et al. used EEG experiments to analyze the relationship between the physical characteristics of streetscape images and human perception [73]. However, physiological methods can be limited by small sample sizes, resulting in a failure to reflect true experimental results [74].
In recent years, advances have been made in visual perception research, with researchers transforming data collection and analysis methods through crowdsourcing methods and deep learning algorithms [55]. Crowdsourcing access to large-scale, diverse image data, combined with the powerful feature extraction capabilities of deep learning algorithms, has now become a new approach to studying the field of visual perception. Moreover, researchers are able to more accurately model and predict human perceptual responses to visual environments based on this approach [72].
Dubey et al. (2016) collected the MIT Place Pulse 2.0 dataset of 110,988 images from 56 cities and rated by 84,630 online volunteers, which led to the development of the FCN + RF deep learning visual model [15]. This deep learning model can more accurately predict perceptions of safety, wealth, vitality, beauty, boredom, and depression [75]. In the Place Pulse 1.0 study, it was found that the age, gender, or location of individual participants did not affect their preference for the appearance of the city [76], suggesting that there was no significant cultural bias in the dataset. Additionally, after an empirical study of multiple cities, it is clear that the deep learning visual model of the MIT Place Pulse 2.0 dataset is able to predict people’s perceptions of safety, wealth, vitality, beauty, boredom, and depression more generally [75]. Such large-scale perceptual predictions enable automated audits of the urban appearance of cities around the world [29]. Currently, Zhang (2018) applied this large-scale perception model to analyze six dimensions of urban perception in Shanghai [72]. Ruifan Wang employed the FCN + RF model to assess urban perception in Wuhan, demonstrating its ability to efficiently recognize residents’ perceptions [77]. This accuracy has enabled urban planners to integrate perceptual insights into planning practices.

2.5. Methods for Obtaining the Physical Spatial Characteristics of Streets

Scholars who studied the built environment of streets often used traditional quantitative methods such as field surveys [78], expert evaluations [79], and photography [80]. While these traditional research methods were more suitable for analyzing the problems of small-scale streets, they had difficulty analyzing the problems existing in large-scale street spaces in a refined way [81]. Over the past decade, advancements in artificial intelligence and big data analytics have driven crowdsourced mapping platforms and street-level imagery [82] to become key data resources for urban studies. Publicly available photos from Google Street View and Baidu Street View offer the advantages of broad accessibility, high resolution, and extensive spatial coverage [83].
In recent years, streetscape images have been used to examine the physical characteristics of the built environment of streets in terms of sky, buildings [84], water bodies [85], and greenery [86]. The results of several scholars’ studies have shown that streetscape data can accurately depict the physical environment of a city, as well as show that streetscape images can analyze the visual perception of residents [85]. Streetscape imagery is currently widely used in research on mental health [87], human perception [88], walkability [89], and the visual quality of streets [90]. With the development of computer vision technology, semantic segmentation has become the main method for processing massive data [91]. Scholars use datasets such as SegNet [92,93,94] and Cityscape for semantic segmentation. The boundaries of the landscape elements in the image are divided by automation. Researchers systematically analyze physical attributes in street-level imagery by quantifying the ratios of landscape components [91].

3. Materials and Methods
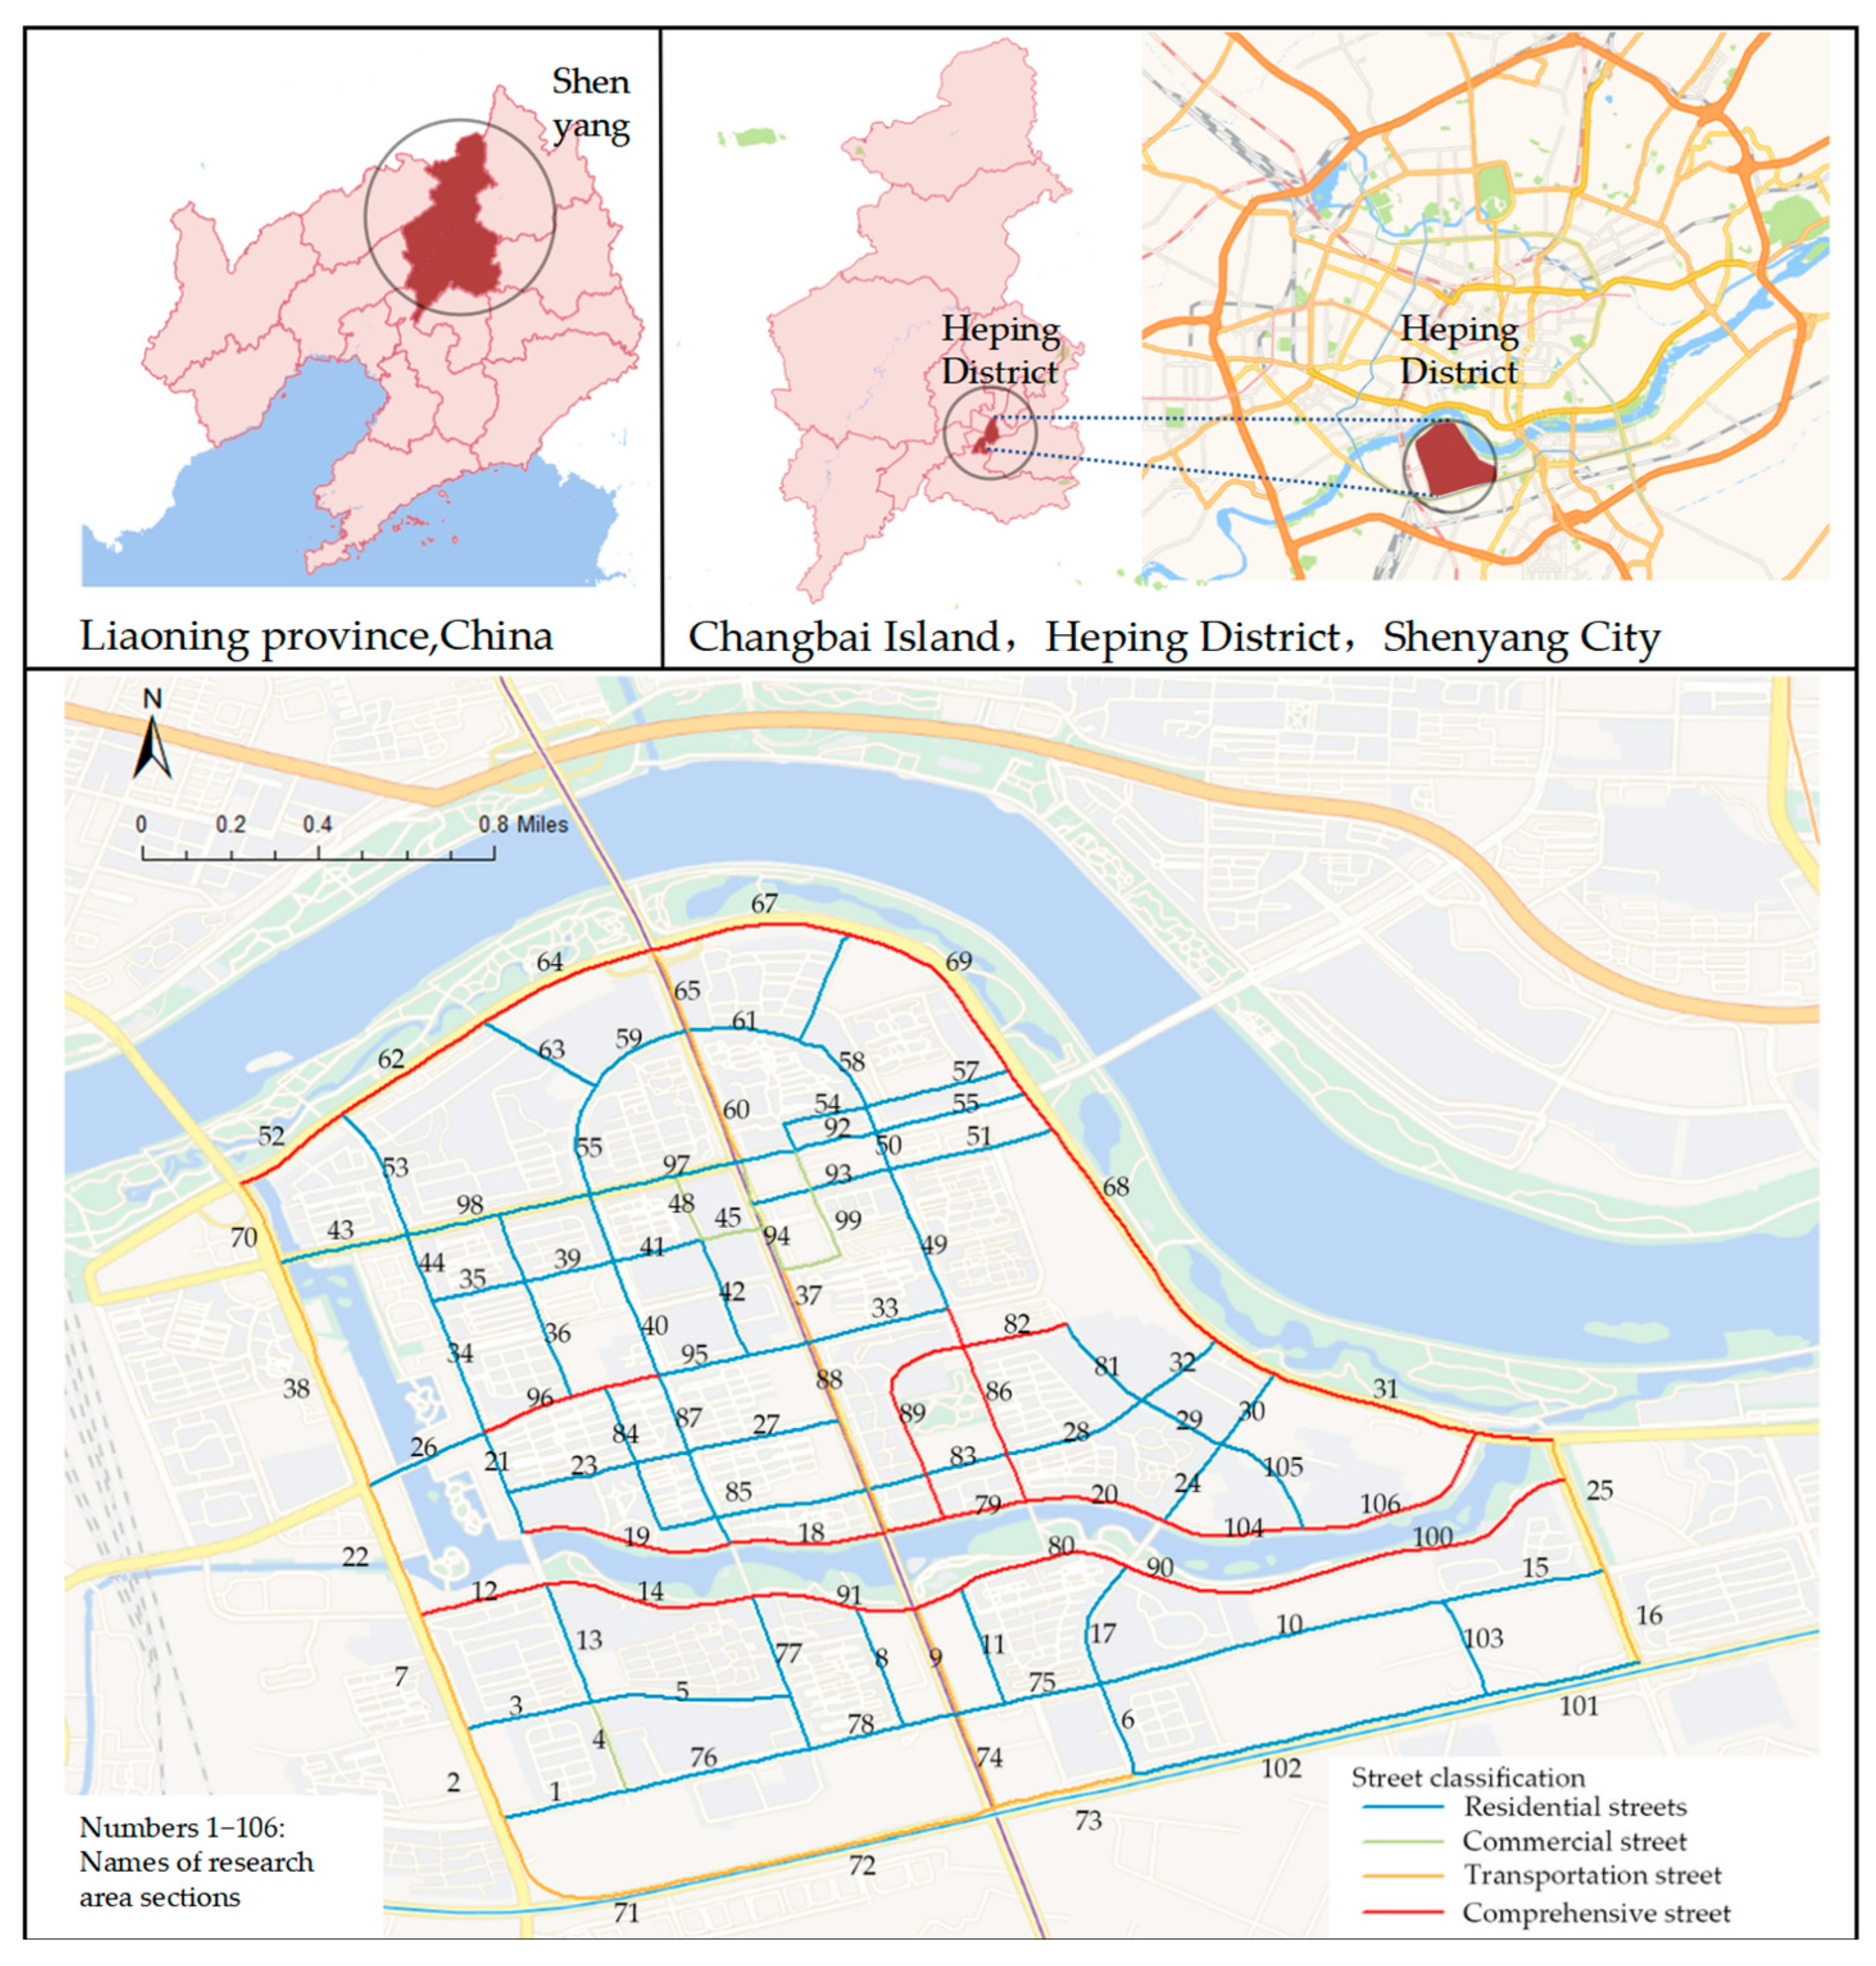
3.1. Study Site

The study site is Changbai Island in Heping District, Shenyang City, which is an integrated residential cluster (Figure 1). The area’s residential, transportation, natural resources, educational resources, and commercial amenities have developed from 2008 to the present. Changbai Island is divided into an inner island and an outer island. The inner island covers an area of about 5 square kilometers, and the outer island is about 5.87 square kilometers. The inner and outer islands are separated by a circular water system of about 10 km in length. Forty-seven settlements have been built in the study area, with most completed between 2010 and 2019. These settlements are densely packed and feature a variety of architectural forms. At the same time, several large-scale comprehensive parks and recreational green squares have been constructed on the outer side of Changbai Island. Malls and several schools have also been built on the island. Overall, the Changbai Island area is a typical comprehensive residential area. This area demonstrates the diversity of physical characteristics of built space during urban expansion.
In order to more clearly assess the spatial quality of streets in the study area, the streets have been categorized in various ways in previous studies. Based on the existing street design guidelines in China and the location, physical attributes, transportation, and functions of the study area, we classified the streets in the study area into four main street types: residential, commercial, transportation, and comprehensive streets (Table 1).
A detailed overview of the data collection, processing, and analysis procedures is presented in Figure 2.

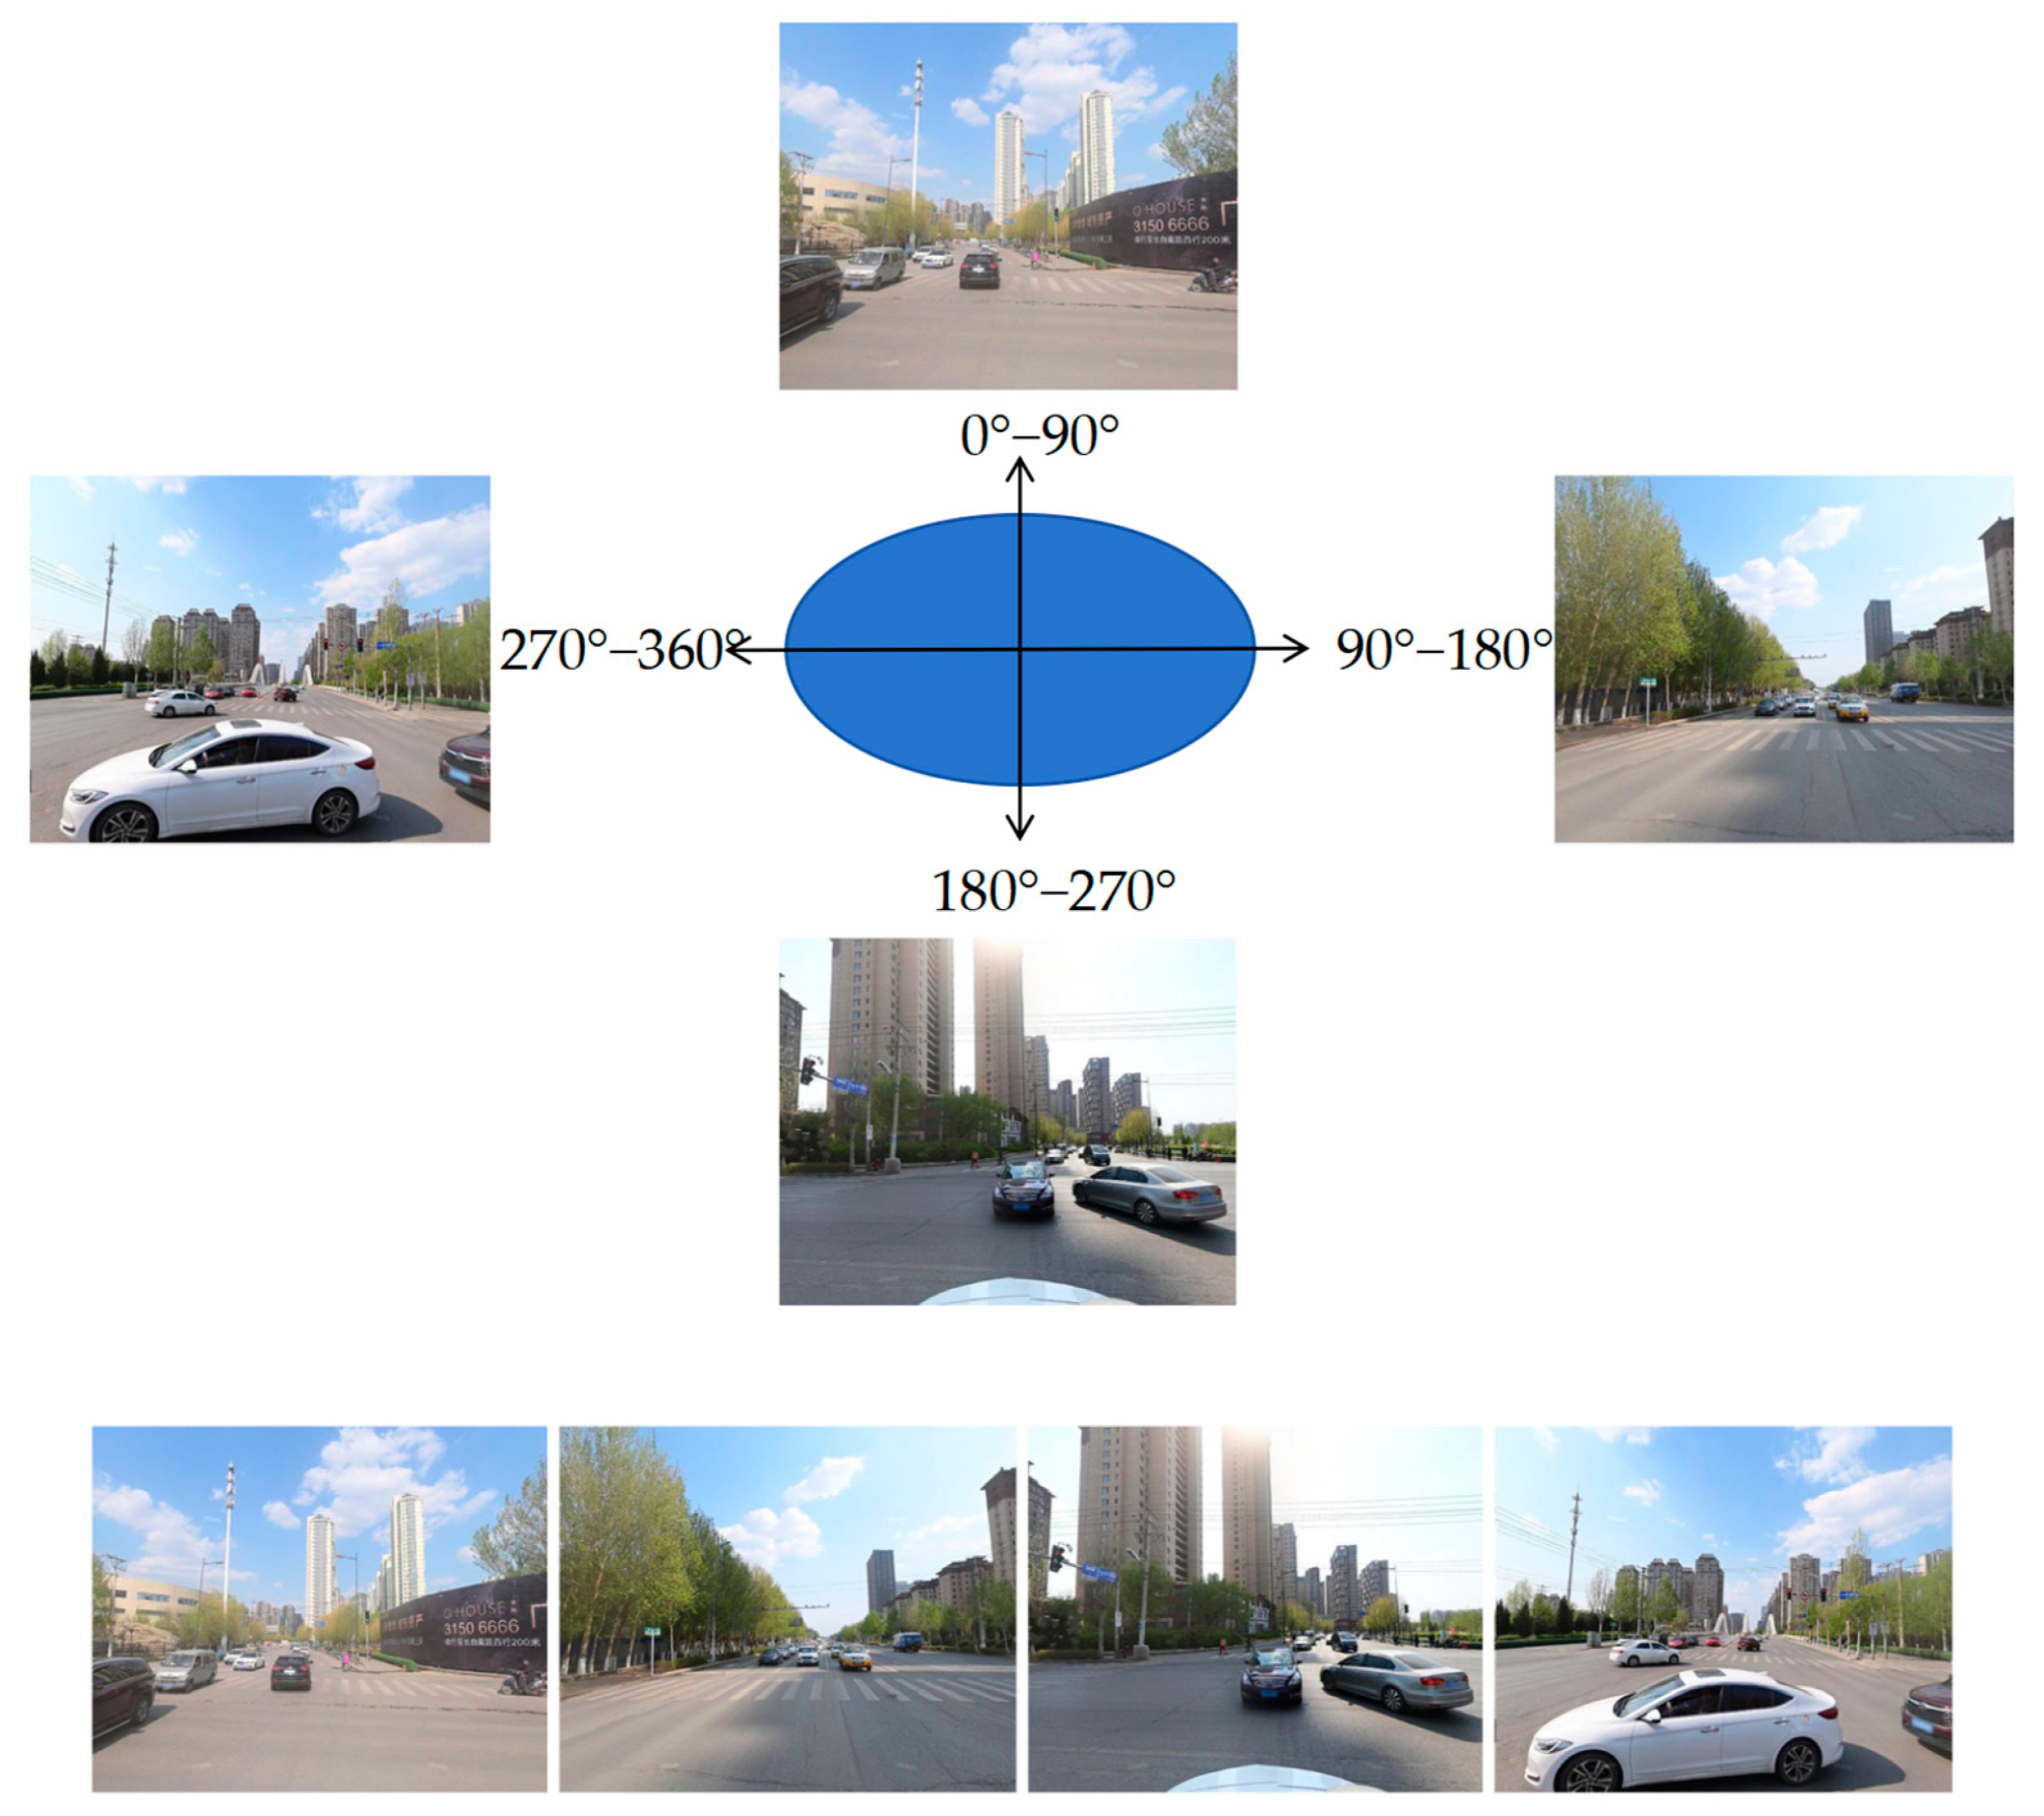
3.2. Baidu Street View Image Collection

Streetscape imagery is a method for obtaining data on the appearance of cities [95]. This method has been widely used to study the objective attributes of streets and subjective human perceptions [96]. Baidu Maps (https://map.baidu.com/ (accessed on 25 February 2023)) is the largest online map provider in China. Baidu Maps provides panoramic images similar to Google Street View (GSV) [67]. Baidu Street View images were captured by a team of collectors from 10 am to 4 pm on weekdays. To explore the relationship between visual perception and physical characteristics of streets, this study used OpenStreetMap (OSM) to obtain the road network data of the study area. The road network data were used to create road maps, which were then transferred into ArcGIS to simplify the network into single-lane streets [97]. ArcGIS10.2 software was used to delineate sampling points at 50-m intervals, creating a total of 955 sample points. To ensure that the street photos reflected the visual characteristics of pedestrians, the parameters of the street images were configured before capturing the images. Parameters were captured by presetting the street images to ensure the equivalence between the simulated visual field and the actual perception of pedestrians [98]. The heading angles were respectively set to 0, 90, 180, and 270 (Figure 3). Baidu Street View (BSV) images were then manually captured for all sample points in four horizontal directions.

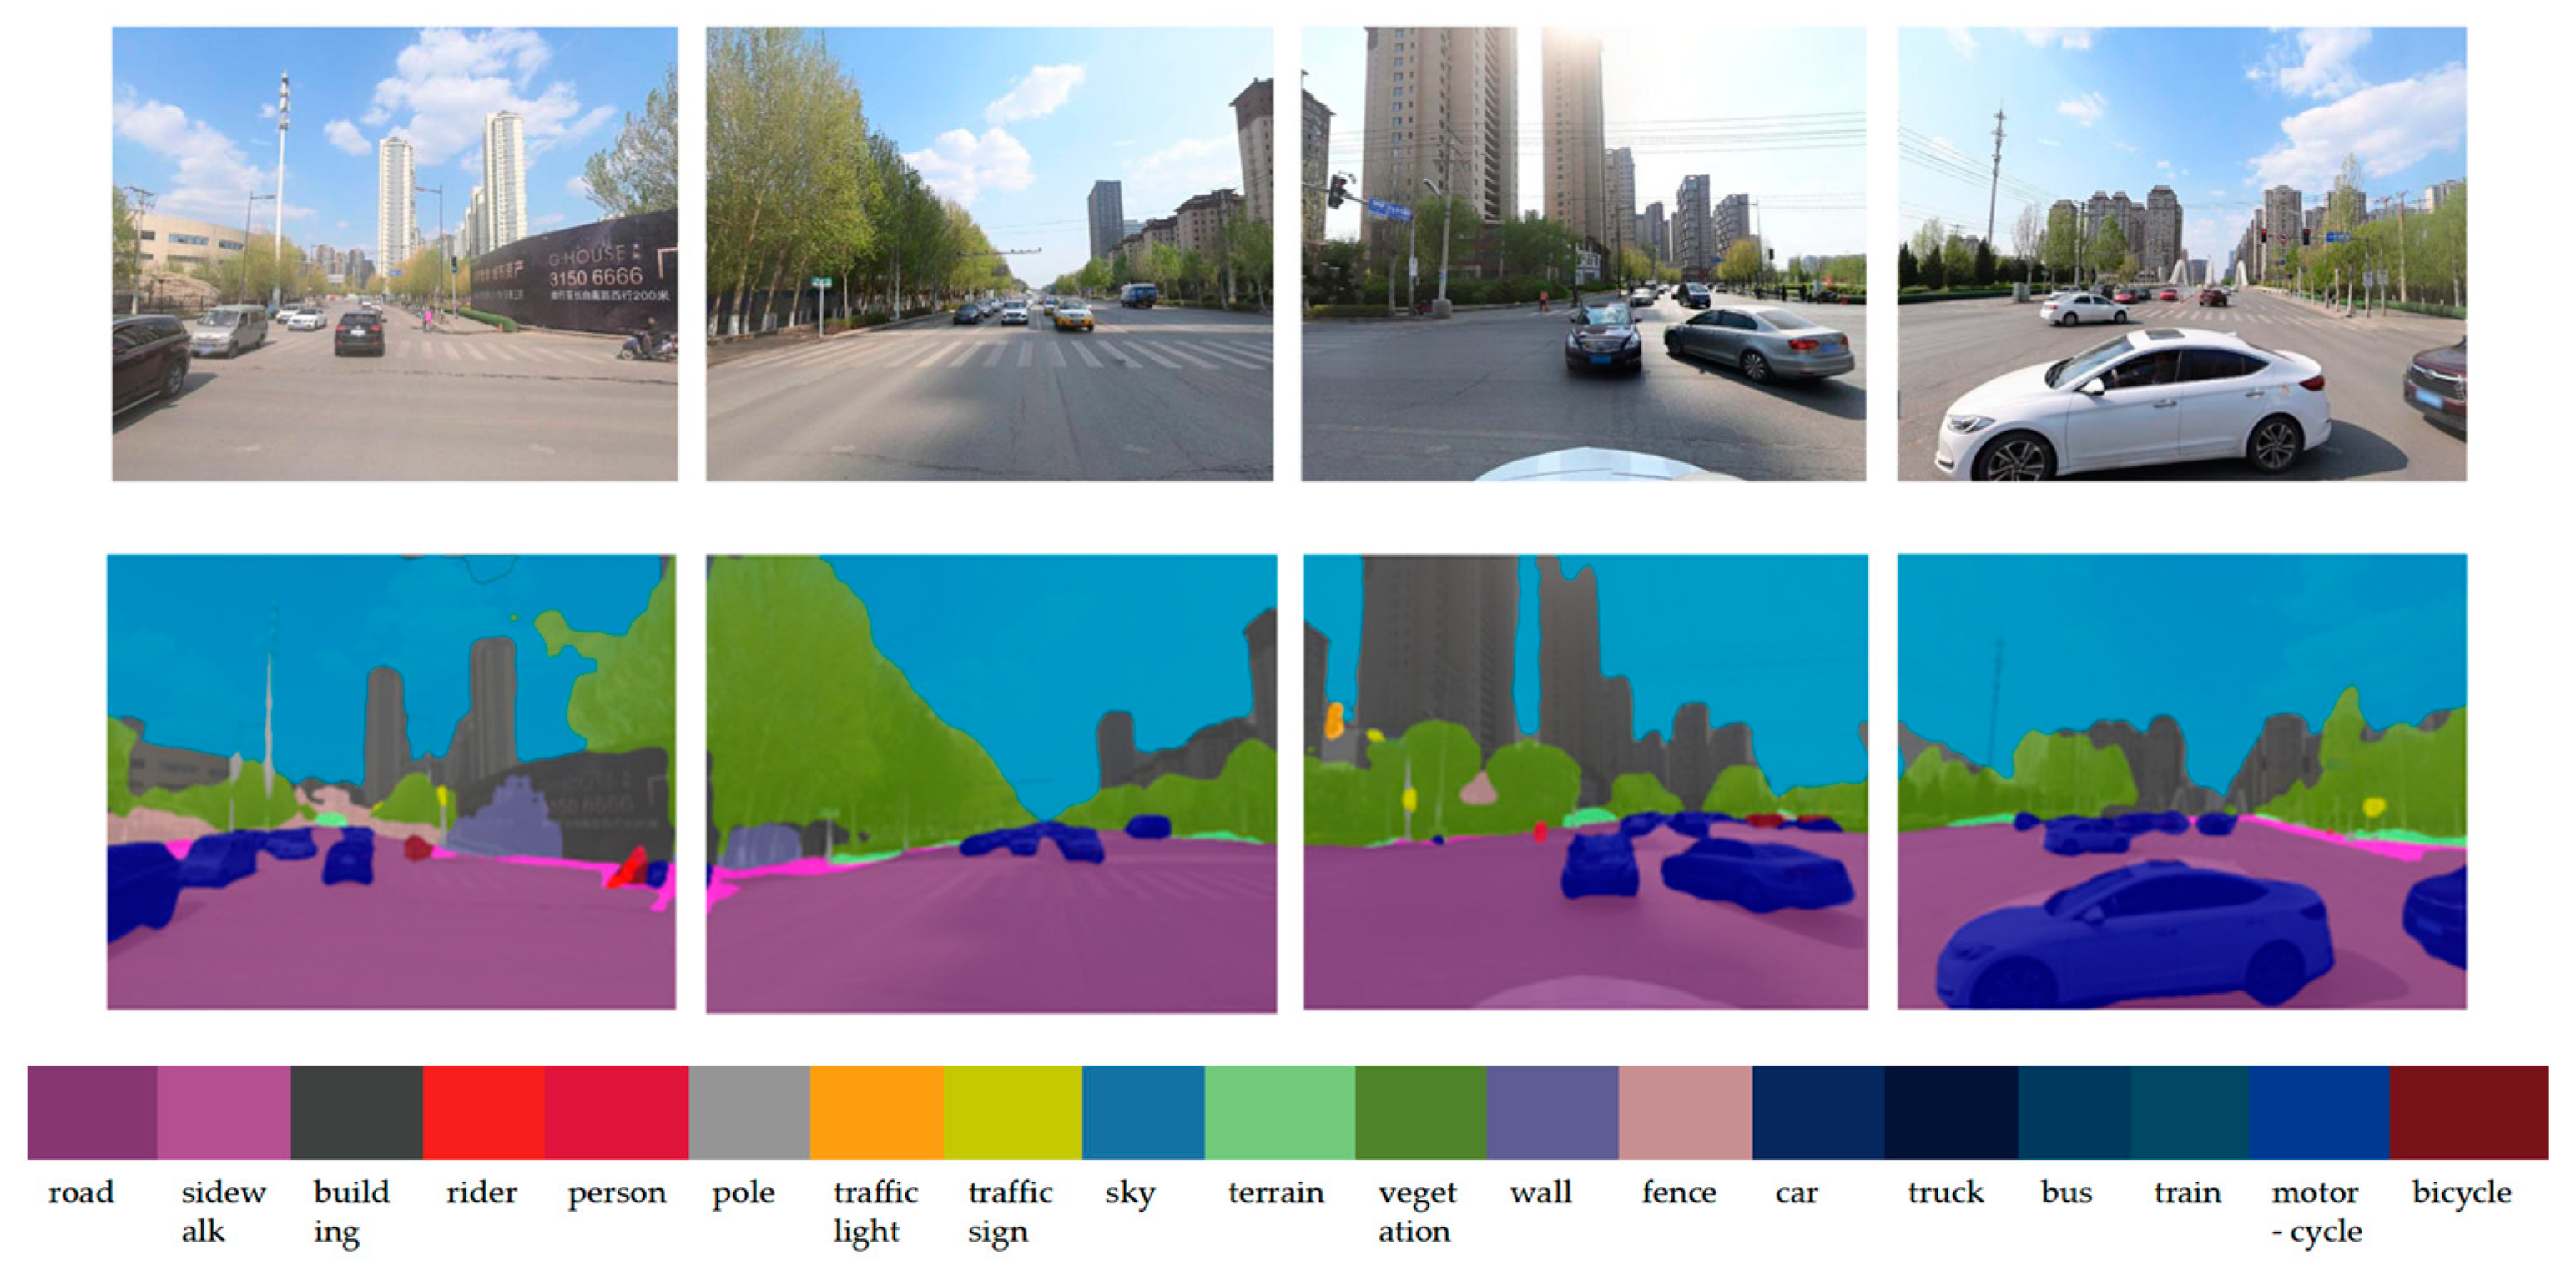
3.3. Street Space Environment Indicator Extraction

Semantic segmentation is an important part of computer vision technology. DeeplabV3+ is a convolutional neural network model for semantic segmentation algorithms, enabling more accurate information acquisition. In this study, the urban streetscape was classified by DeeplabV3+ into 19 categories, such as roads, sidewalks, and buildings, achieving an overall accuracy of 90% [99]. DeeplabV3+ is capable of handling high-resolution streetscape analysis tasks and is suitable for micro-level assessment of urban areas [100,101,102] (Figure 4).
We chose and identified seven important physical characteristics. It is important to note that all the physical characteristics can be calculated by semantic segmentation. The formulas for calculating the selected seven physical characteristics are shown in Table 2.

3.4. Calculating Public Visual Perception Data

MIT’s Place Pulse 2.0 was a crowdsourcing platform that aggregated data on human ratings of urban landscapes [100]. The platform employed a deep learning computer vision model developed by Dubey et al., capable of predicting human perceptions. Beauty and safety, as foundational dimensions of human perceptual needs [31], influence the attractiveness of urban spaces. In Kaplan’s Attention Restoration Theory (ART), the element of fascination reflects the degree to which a place engages attention, while boredom perception serves as an indicator of built environment unattractiveness. Liveliness perception, representing space-use efficiency, captures interactions and emotions between individuals and street environments, balancing human activities with urban contexts [103]. Although boredom is perceived as a negative emotion and safety, vitality, and beauty as positive ones, the four perceptions in this study are not opposites; each is independent and reflects distinct aspects of street visual quality. Thus, our focus in this study is to utilize this approach to obtain data on the four perceptions of beauty, safety, boredom, and liveliness in the study area.

3.5. Statistical Analysis

Correlation and regression analyses were performed in this study using SPSS 25.0. We treated four perceptual predictors of beauty, safety, boredom, and liveliness as dependent variables and seven physical characteristics, such as green visual index and openness, as independent variables. Regression analyses were conducted to explore the relationships between beauty, safety, boredom, and liveliness and physical characteristics, respectively. Four regression models were developed for beauty, safety, boredom, and liveliness.

4. Results

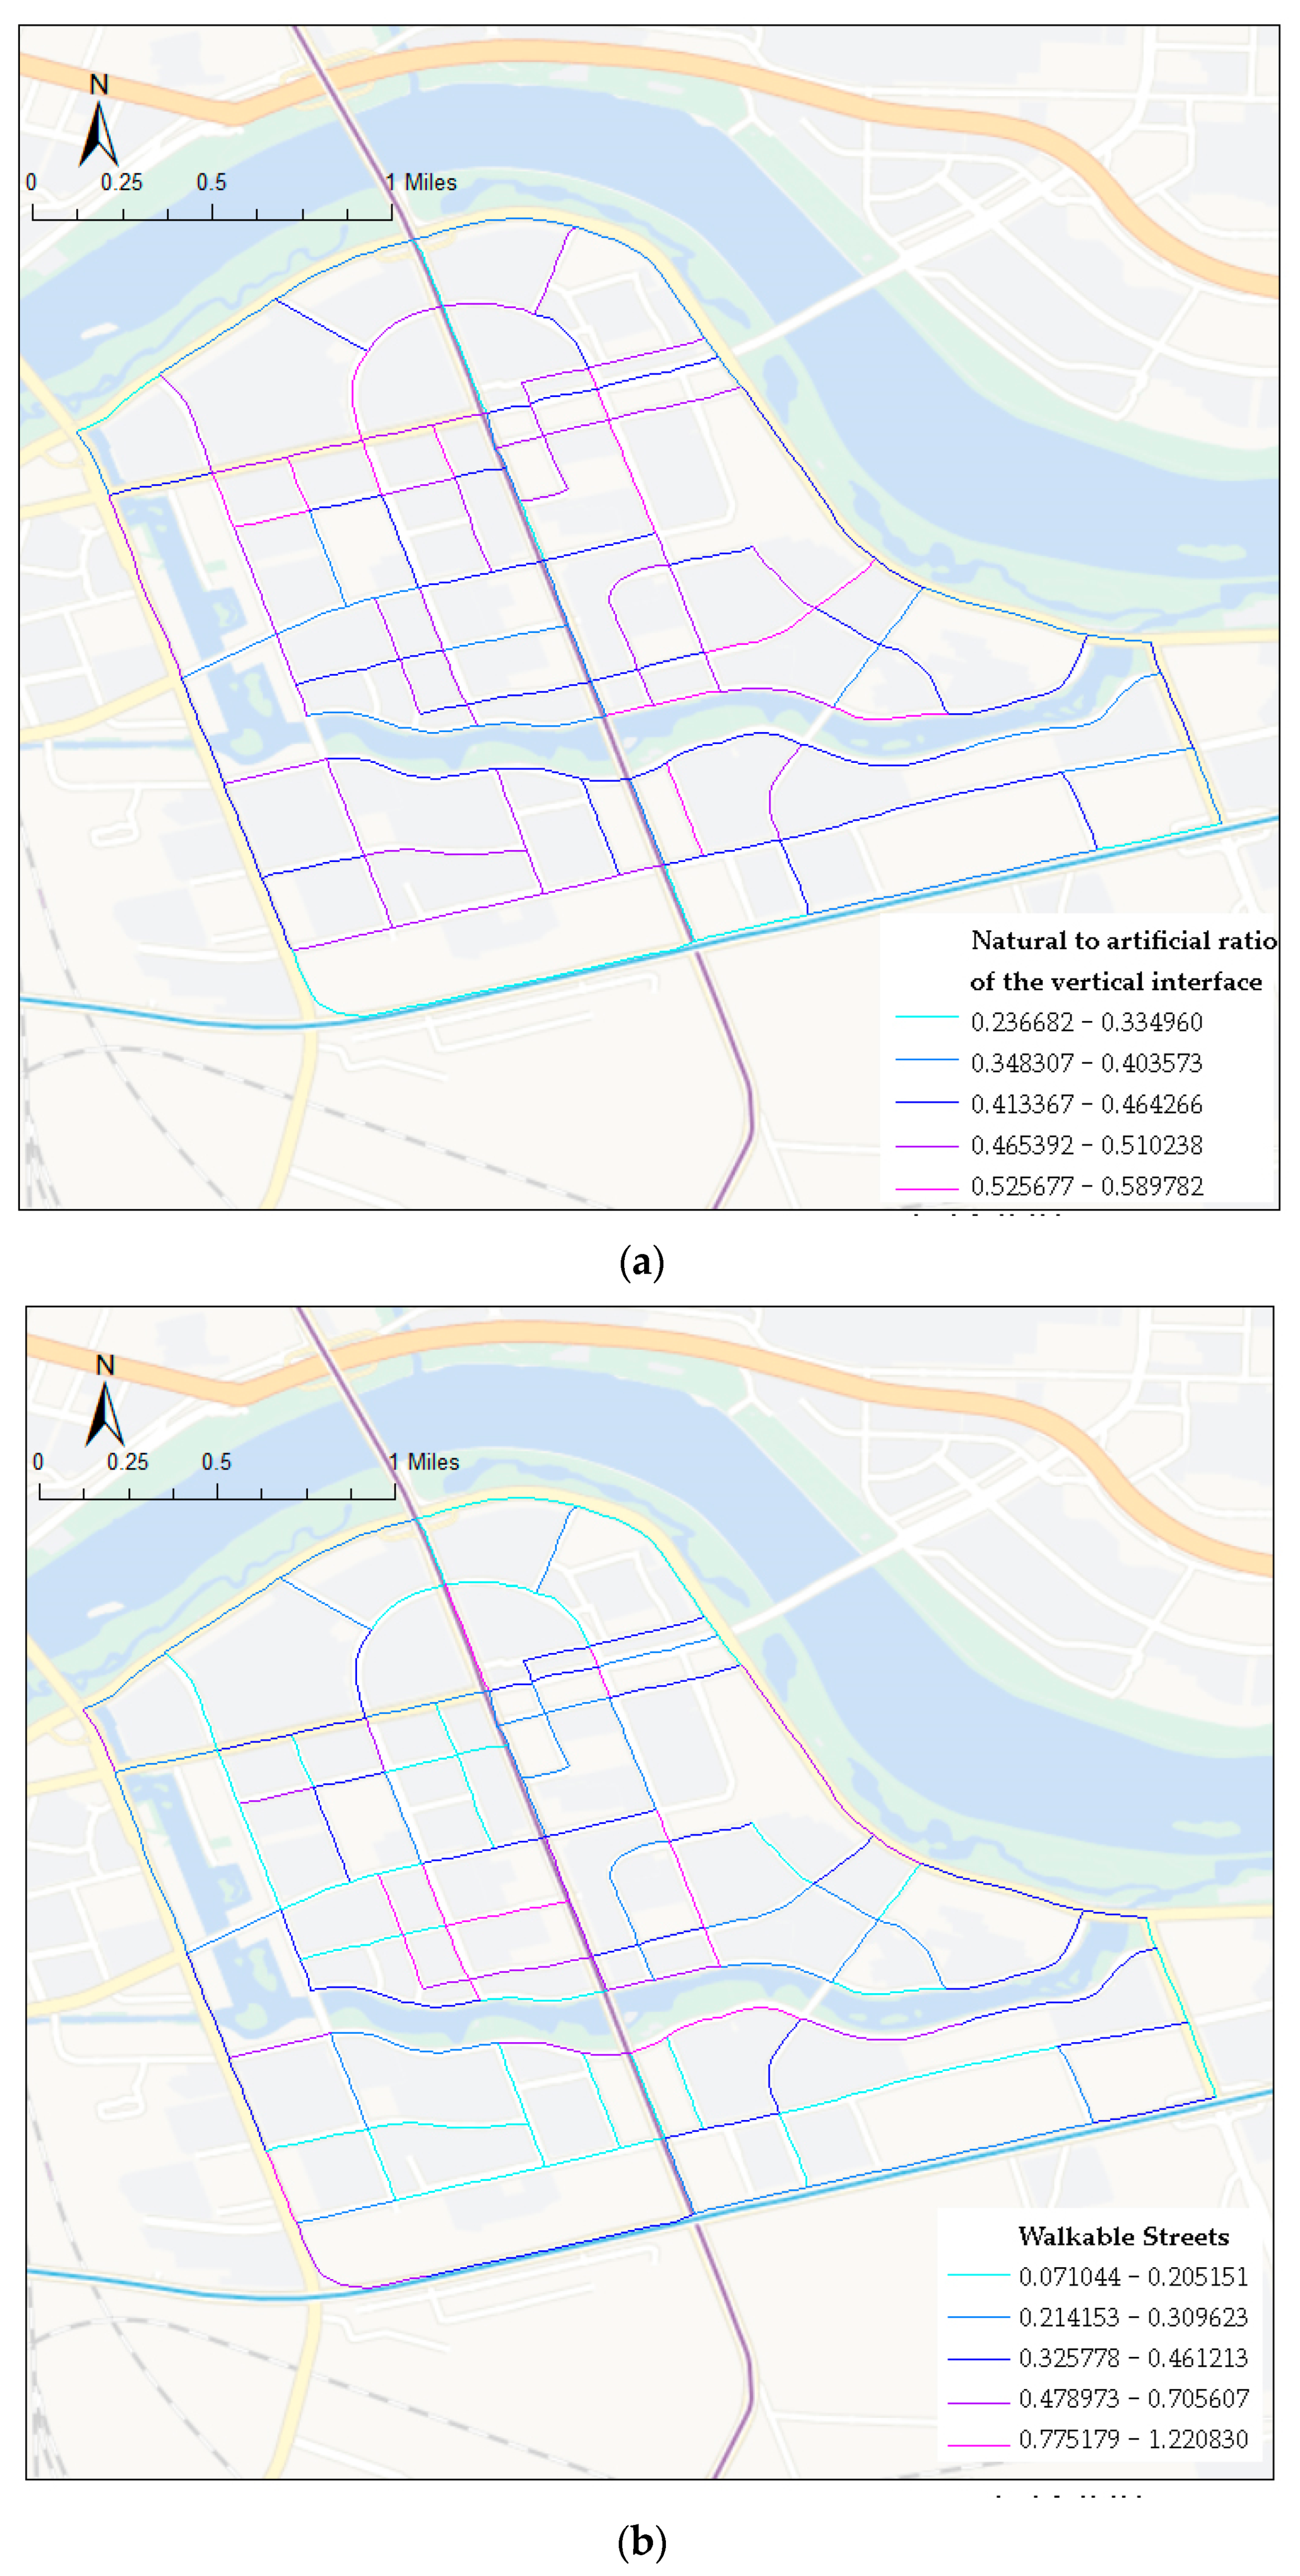
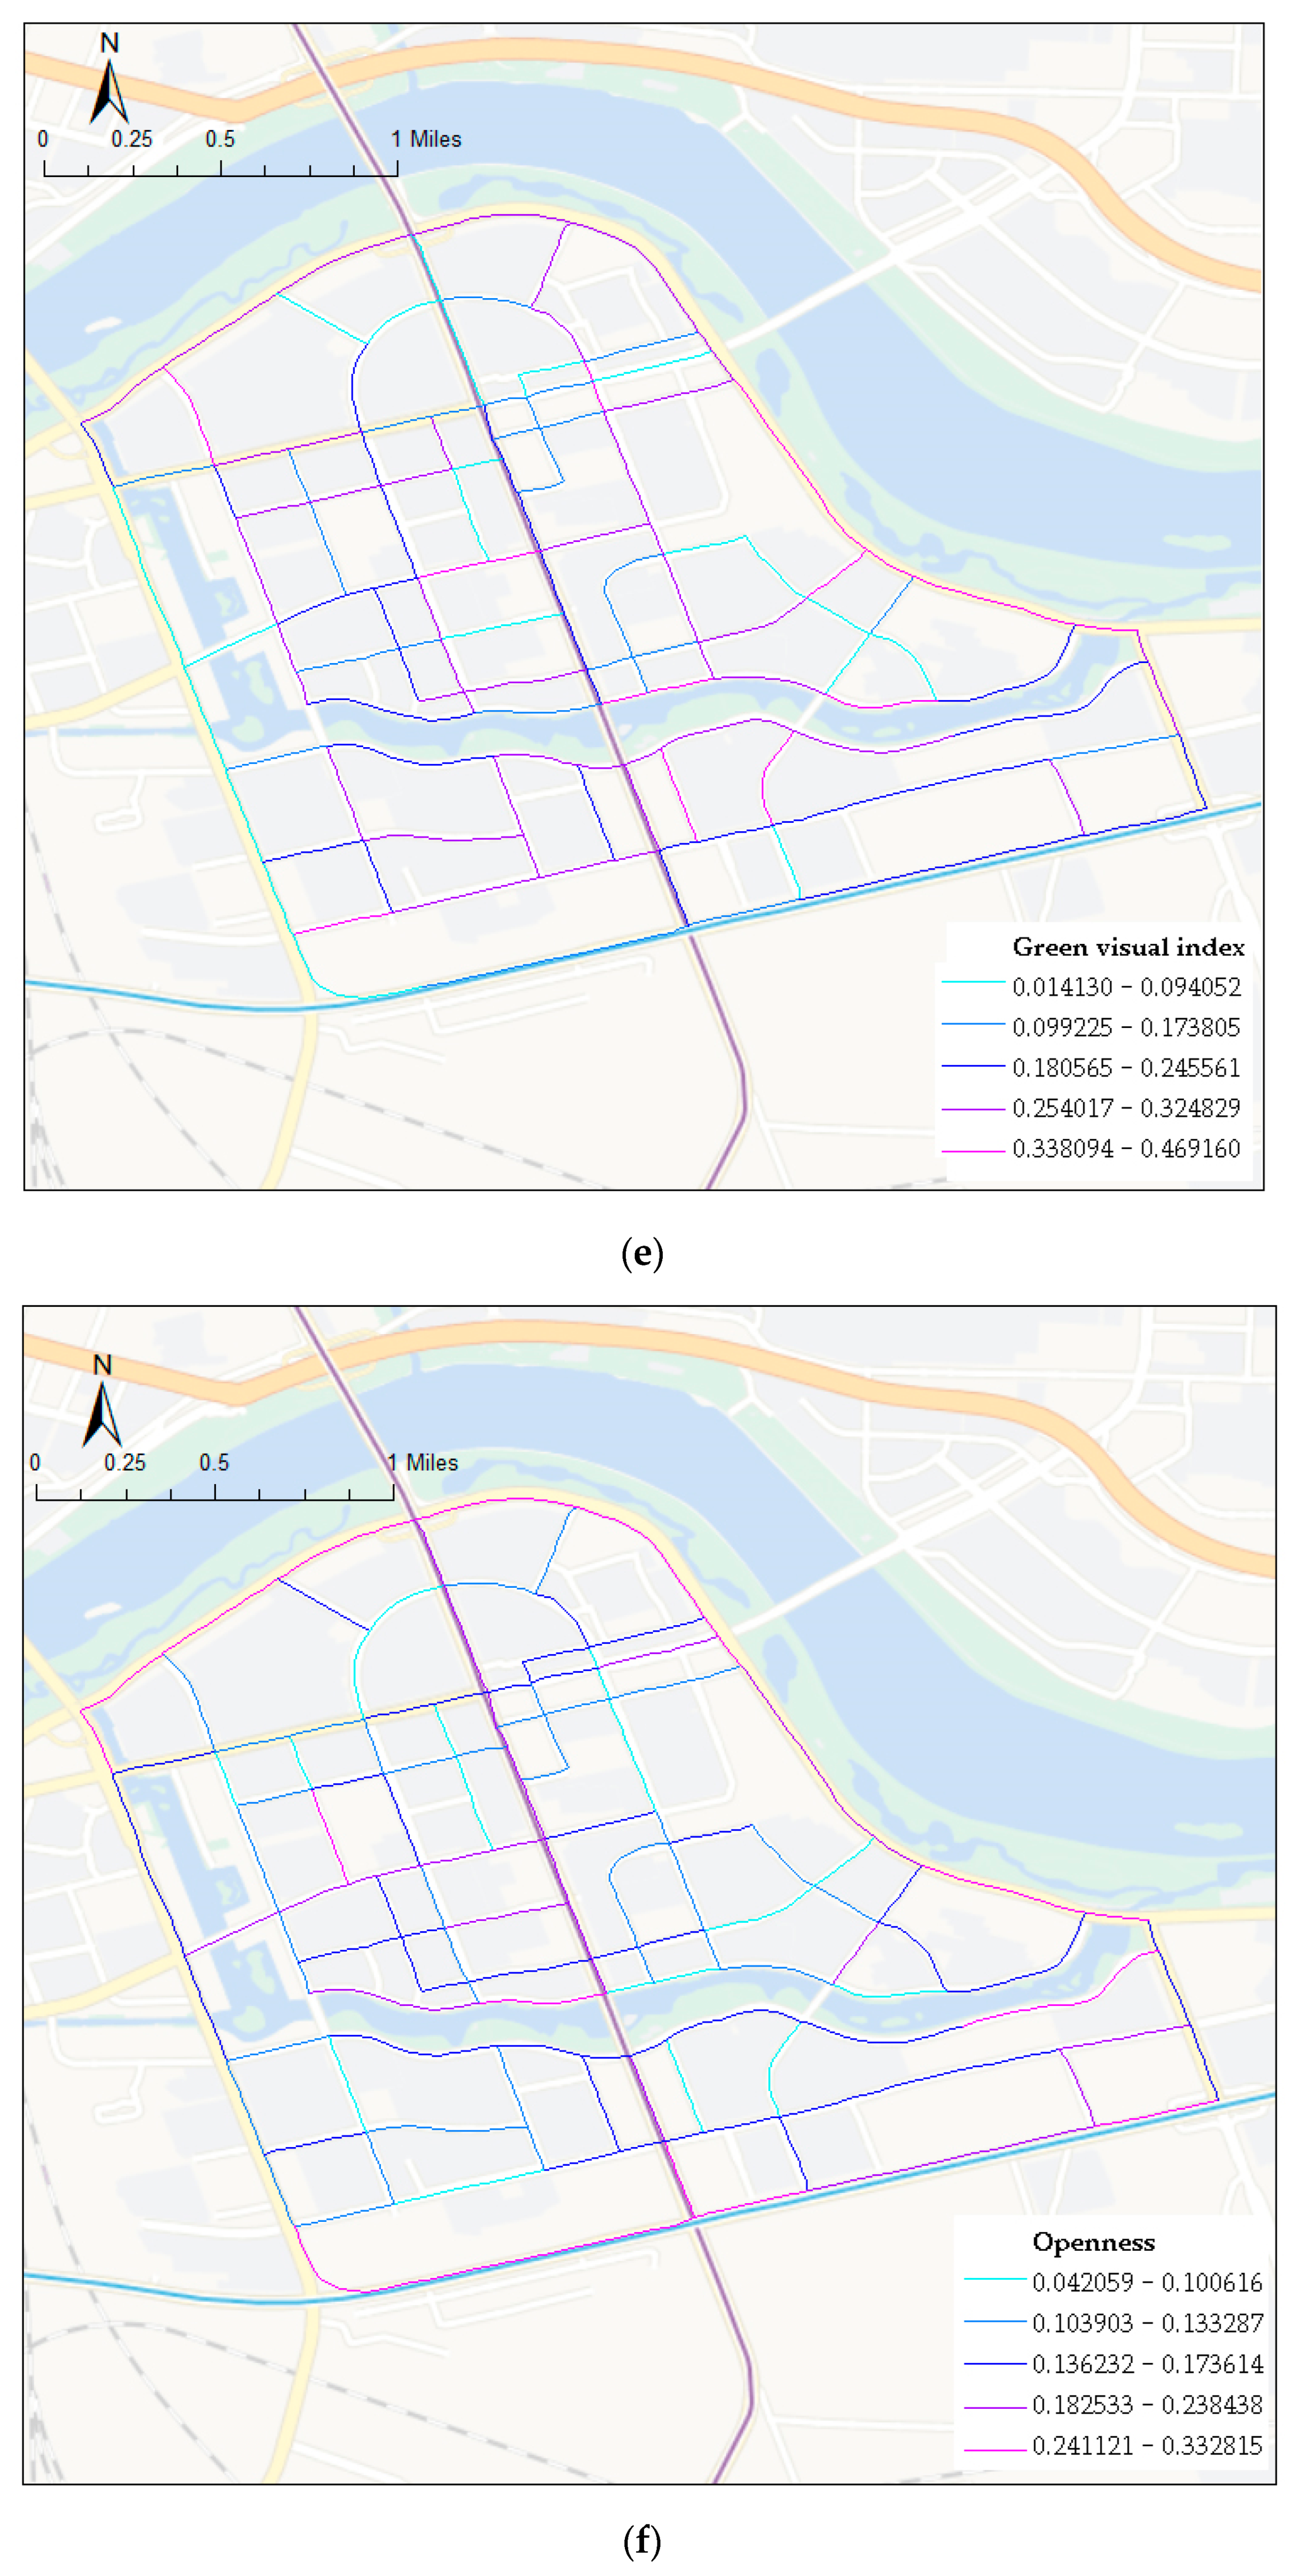
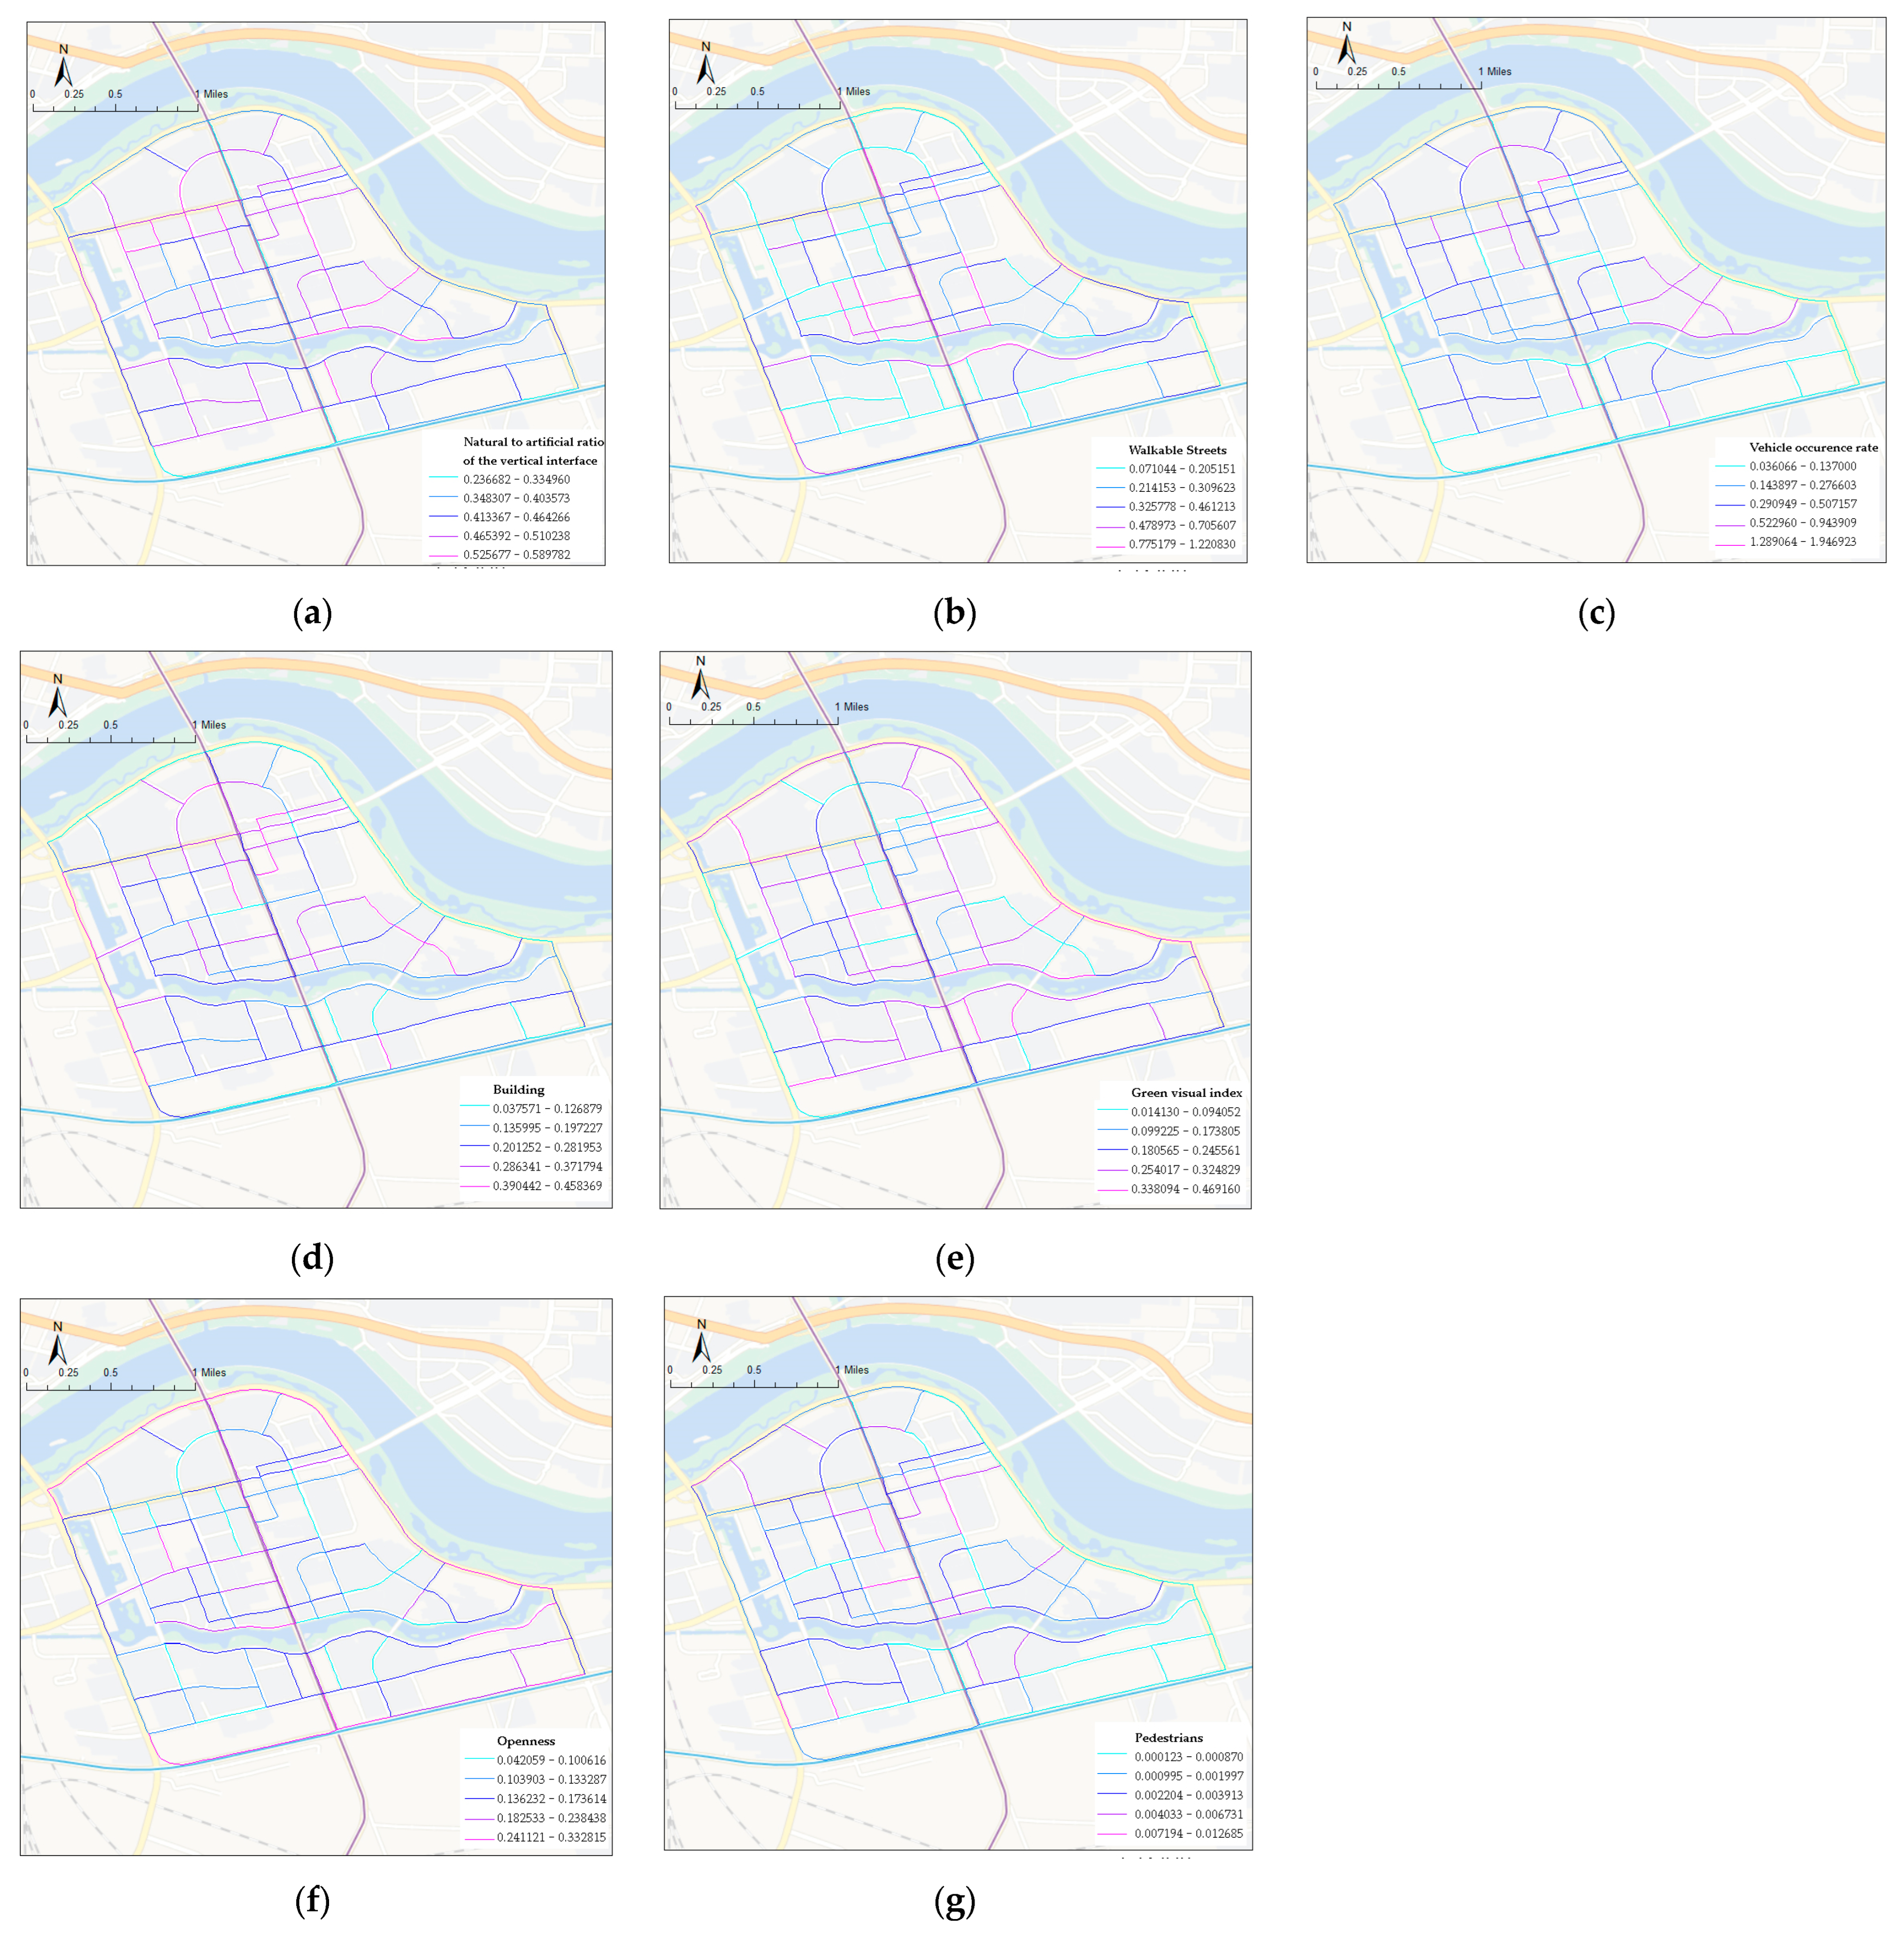
4.1. Physical Characteristics of the Study Area

In this study, DeeplabV3+ was used for semantic segmentation of sample point photographs, and elements from the built environment of the street were extracted. After the calculation, we obtained the information for the physical characteristics. Calculating the mean value for each physical characteristic, we obtained the following ranking of values: Natural to artificial ratio of the vertical interface (0.4433) > Walkable streets (0.3409) > Vehicle occurrence rate (0.3143) > Building (0.2423) > Green visual index (0.2085) > Openness (0.1589) > Pedestrians (0.0025). The information from the sample points was assigned to street segments, and the point information was homogenized to form street segment information. We analyzed the spatial distribution of physical characteristics based on the street segment information (Figure 5).
Plants were a key component of urban streets, and they affected people’s emotional and mental health. We found differences in the degree of greening of different types of streets through the data on green visibility. Comprehensive streets (0.2143) and residential streets (0.2126) had a high GVI, while transportation streets (0.1995) had an average GVI, and commercial streets (0.1777) had the lowest GVI. Comprehensive streets were predominantly flanked by landscaped areas, residential neighborhoods, and schools, and these street segments had high levels of green visibility. For example, the 101st, 95th, and 106th Street segments had lush street trees, and the landscaped area was open on one side with a wide variety of plant species, creating a diverse vegetative landscape. Street segments in areas with mixed traffic and residential functions were bordered by tall and lush street trees and neatly trimmed bushes. Street segments in which schools were mixed with residential neighborhoods had well-aligned and well-grown street trees. The combination of plants on both sides of the road and on the campus effectively reduced street noise and created a quiet learning environment for students. The residential streets were adjoined by residential areas, the roads were narrow, and there was a concentration of green spaces on both sides, resulting in a high GVI. Commercial streets had elements that were primarily paved and amenities with relatively little plant cover, resulting in a low GVI.
Commercial streets (0.3089) and residential streets (0.2701) exhibited higher BE values. There was less vegetation around the commercial streets, with buildings taking up a larger proportion of the area; residential streets were flanked by residential buildings. In addition to the street trees, a large percentage of the residential building facades were occupied. In contrast, comprehensive streets (0.2106) and transportation streets (0.2003) displayed a relatively low percentage of buildings. There was a large number of other elements in the composite street, hence the low Building Enclosure rating. Transportation streets had wide roadways, and buildings were set back from the roadway, so the percentage of buildings was lower. The results of the study indicated that factors such as street type, vegetation cover, and roadway width influenced the BE value in the built environment. Together, these factors shaped the public’s visual perception of the street. The results of the study showed that openness was highest on traffic streets. The wide roads of the traffic streets and the vegetation and buildings farther away from the traffic streets were the main factors that enhanced the openness. Residential street segments (0.1252) and commercial street areas (0.1242) had lower sky-view openness. Tall buildings and lush vegetation around the streets created shading and reduced the visual area of the sky.
The composite streets were composed of landscaped areas, residential neighborhoods, and schools. Residents and students mainly entered and exited the area on foot. Consequently, due to the high pedestrian traffic, the WS in this area had a higher value. Transportation and comprehensive streets were required to accommodate both pedestrian and vehicular traffic. To avoid congestion, the area of driveways on the portion of the composite street was increased, while the area of walkways was reduced. Transportation streets, generally regional main roads and expressways, were focused on transportation needs and consisted of wide motorized roads and pedestrian paths. Plantings were used to separate driveways and sidewalks, creating a sophisticated system for pedestrian–vehicle traffic separation. Commercial streets had a low average percentage of WS. Two main reasons contributed to this: first, commercial buildings were still under construction and not open to the public. Second, the presence of more automobiles outside these streets reduced the walkable street area.
Higher mean values of the VI were found on residential streets (0.4827) and commercial streets (0.4760). The high VI on residential streets was primarily due to street trees, residential building facades, and fences enclosing the neighborhood’s outer layers. In contrast, commercial streets had a VI dominated by commercial buildings with a relatively small percentage of plantings. Traffic streets exhibited the lowest average VI values. The wide roads and open skies of traffic streets led to a diminished proportion of vegetation and buildings, which weakened their VI. Differences in VI were found to influence residents’ spatial perception: high enclosure created a closed visual experience, while low enclosure fostered an open visual experience.
Residential and commercial streets had the highest average VOR values. This indicated that more vehicles were parked on both sides of these streets. Streets with standardized parking systems maintained orderly vehicle arrangements, while those lacking parking infrastructure exhibited disorderly vehicle placement, which negatively affected the overall street environment. Notably, a high number of non-motorized vehicles—primarily delivery and take-out worker vehicles—were parked in disorderly clusters in the rear areas of commercial streets. In contrast, composite and transportation streets had fewer parked vehicles, with traffic primarily consisting of moving roadway vehicles. Consequently, impacts on other areas of the roadway were limited.
PR values were the lowest across all streets, with a mean of only 0.0025. This can be attributed to the fact that street photography was conducted during weekday working hours, resulting in fewer pedestrians outdoors. Commercial streets (0.0034) had the highest average PR, which can be attributed to two main factors. First, commercial streets accommodate more workers and are primarily used for daily services such as commuting and food delivery; second, adjacent plazas and commercial facilities attract elderly individuals and children to linger and engage in activities in the area. In contrast, comprehensive streets (0.0019) exhibited the lowest pedestrian percentage.

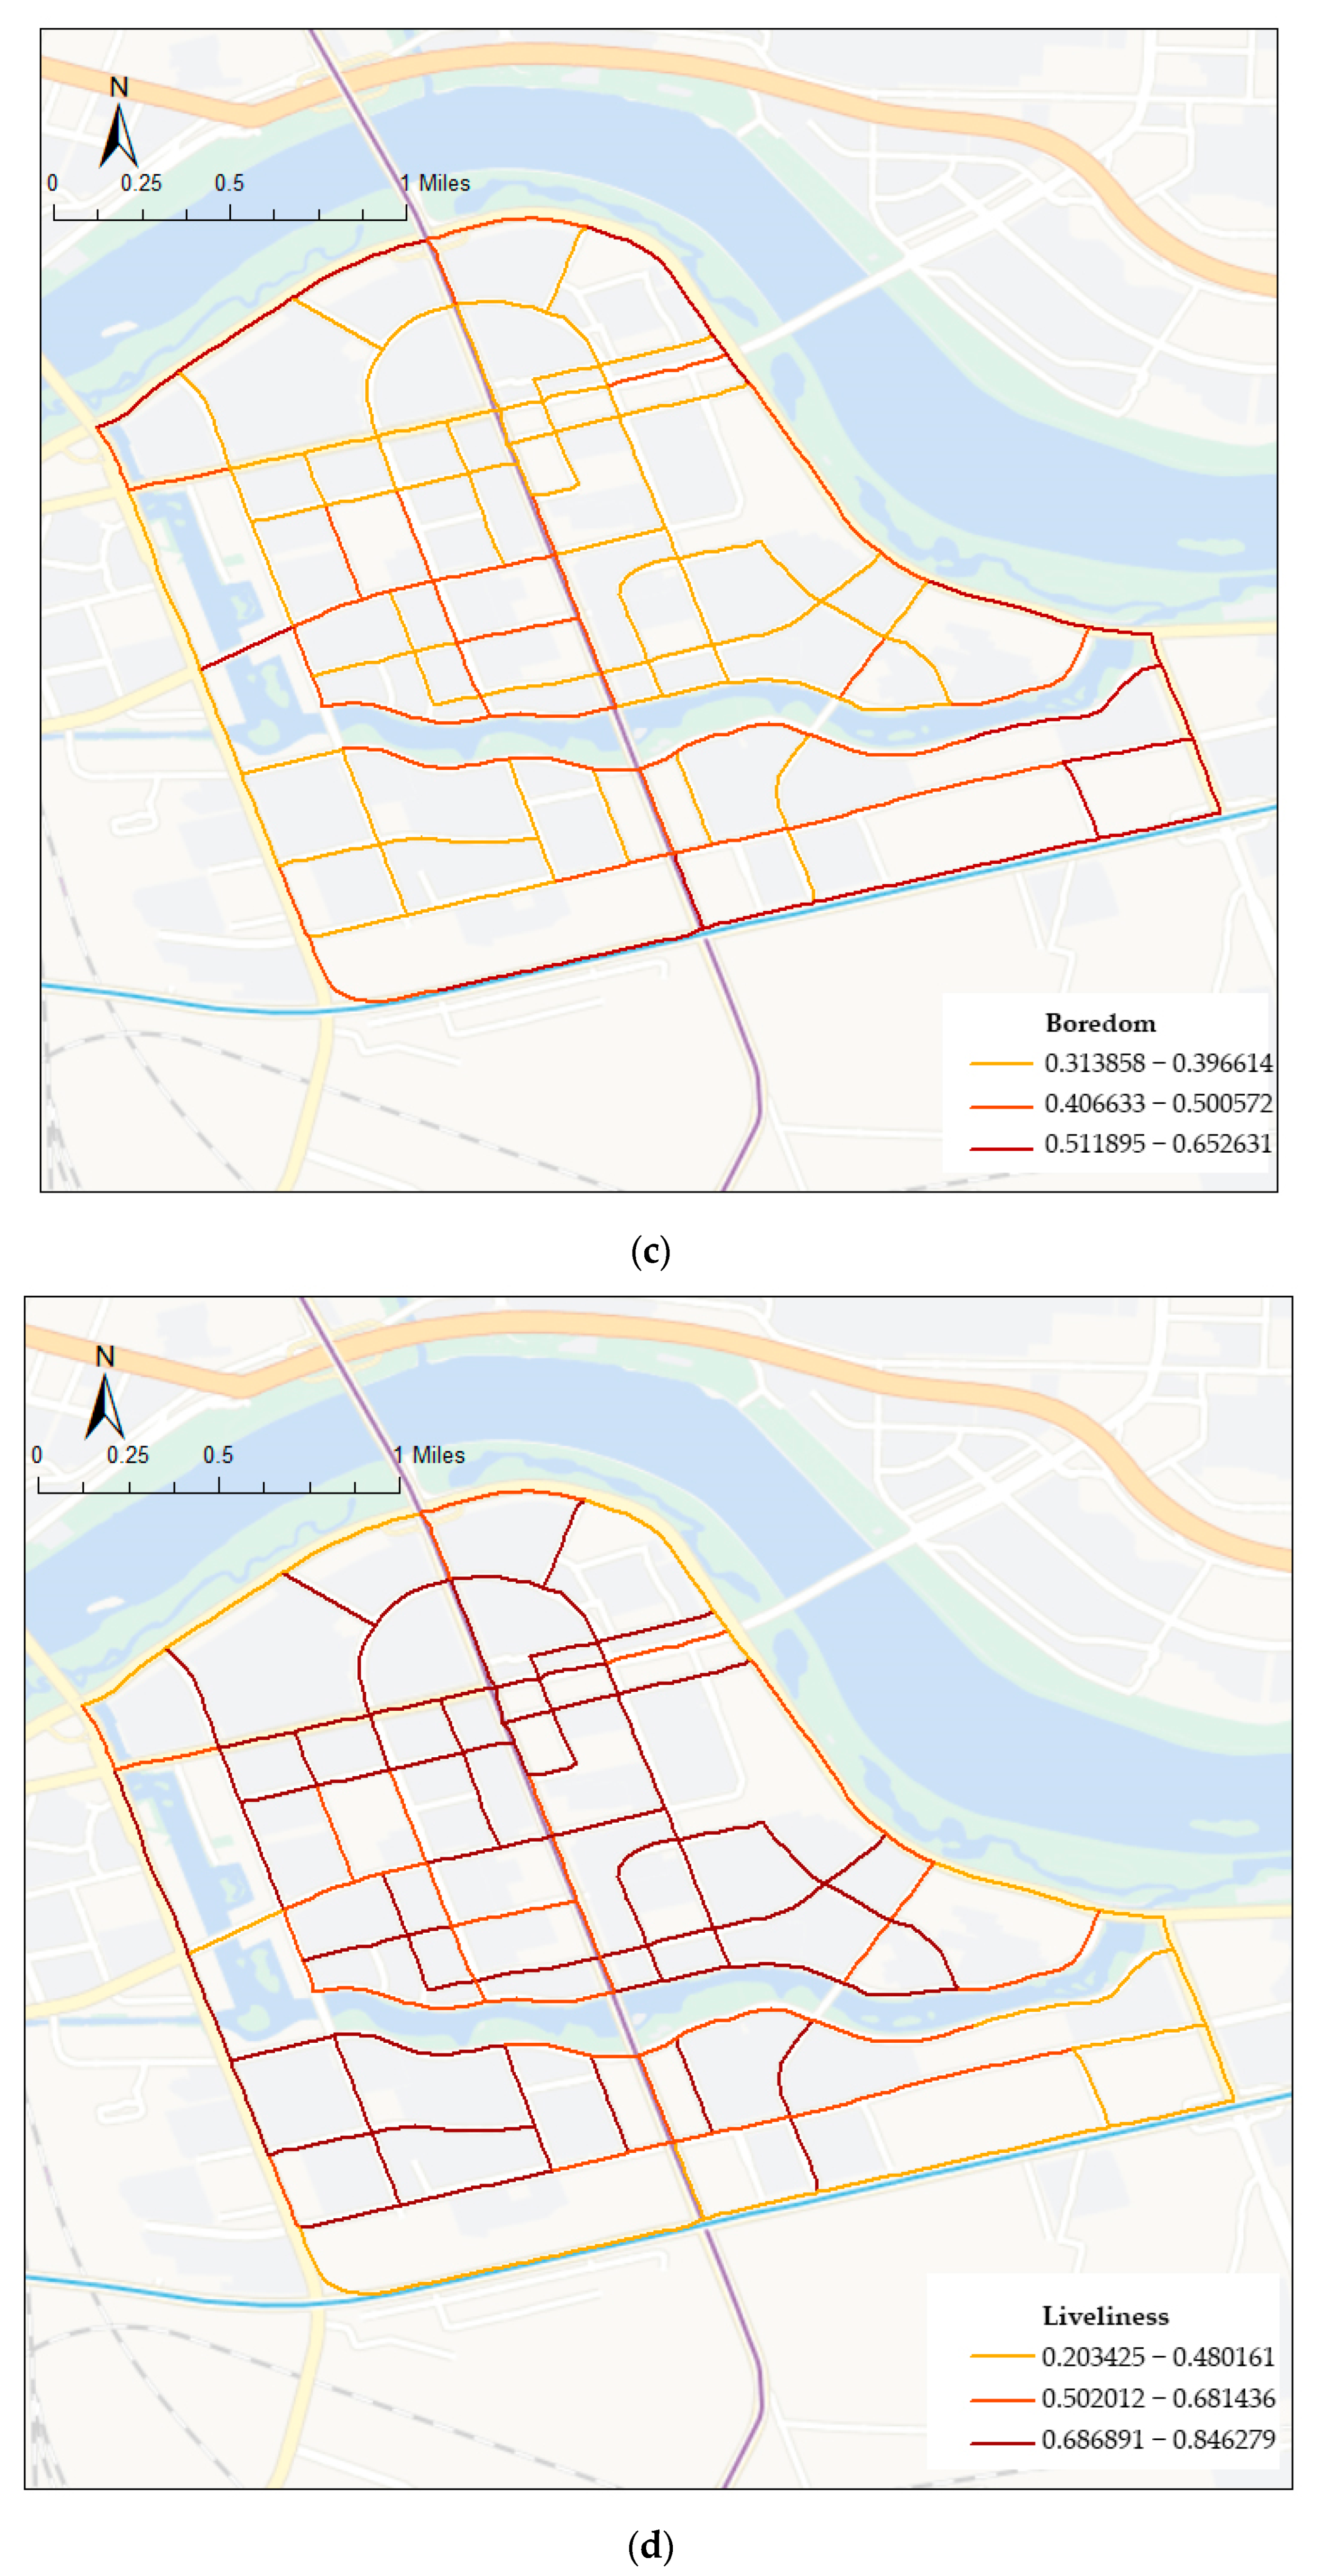
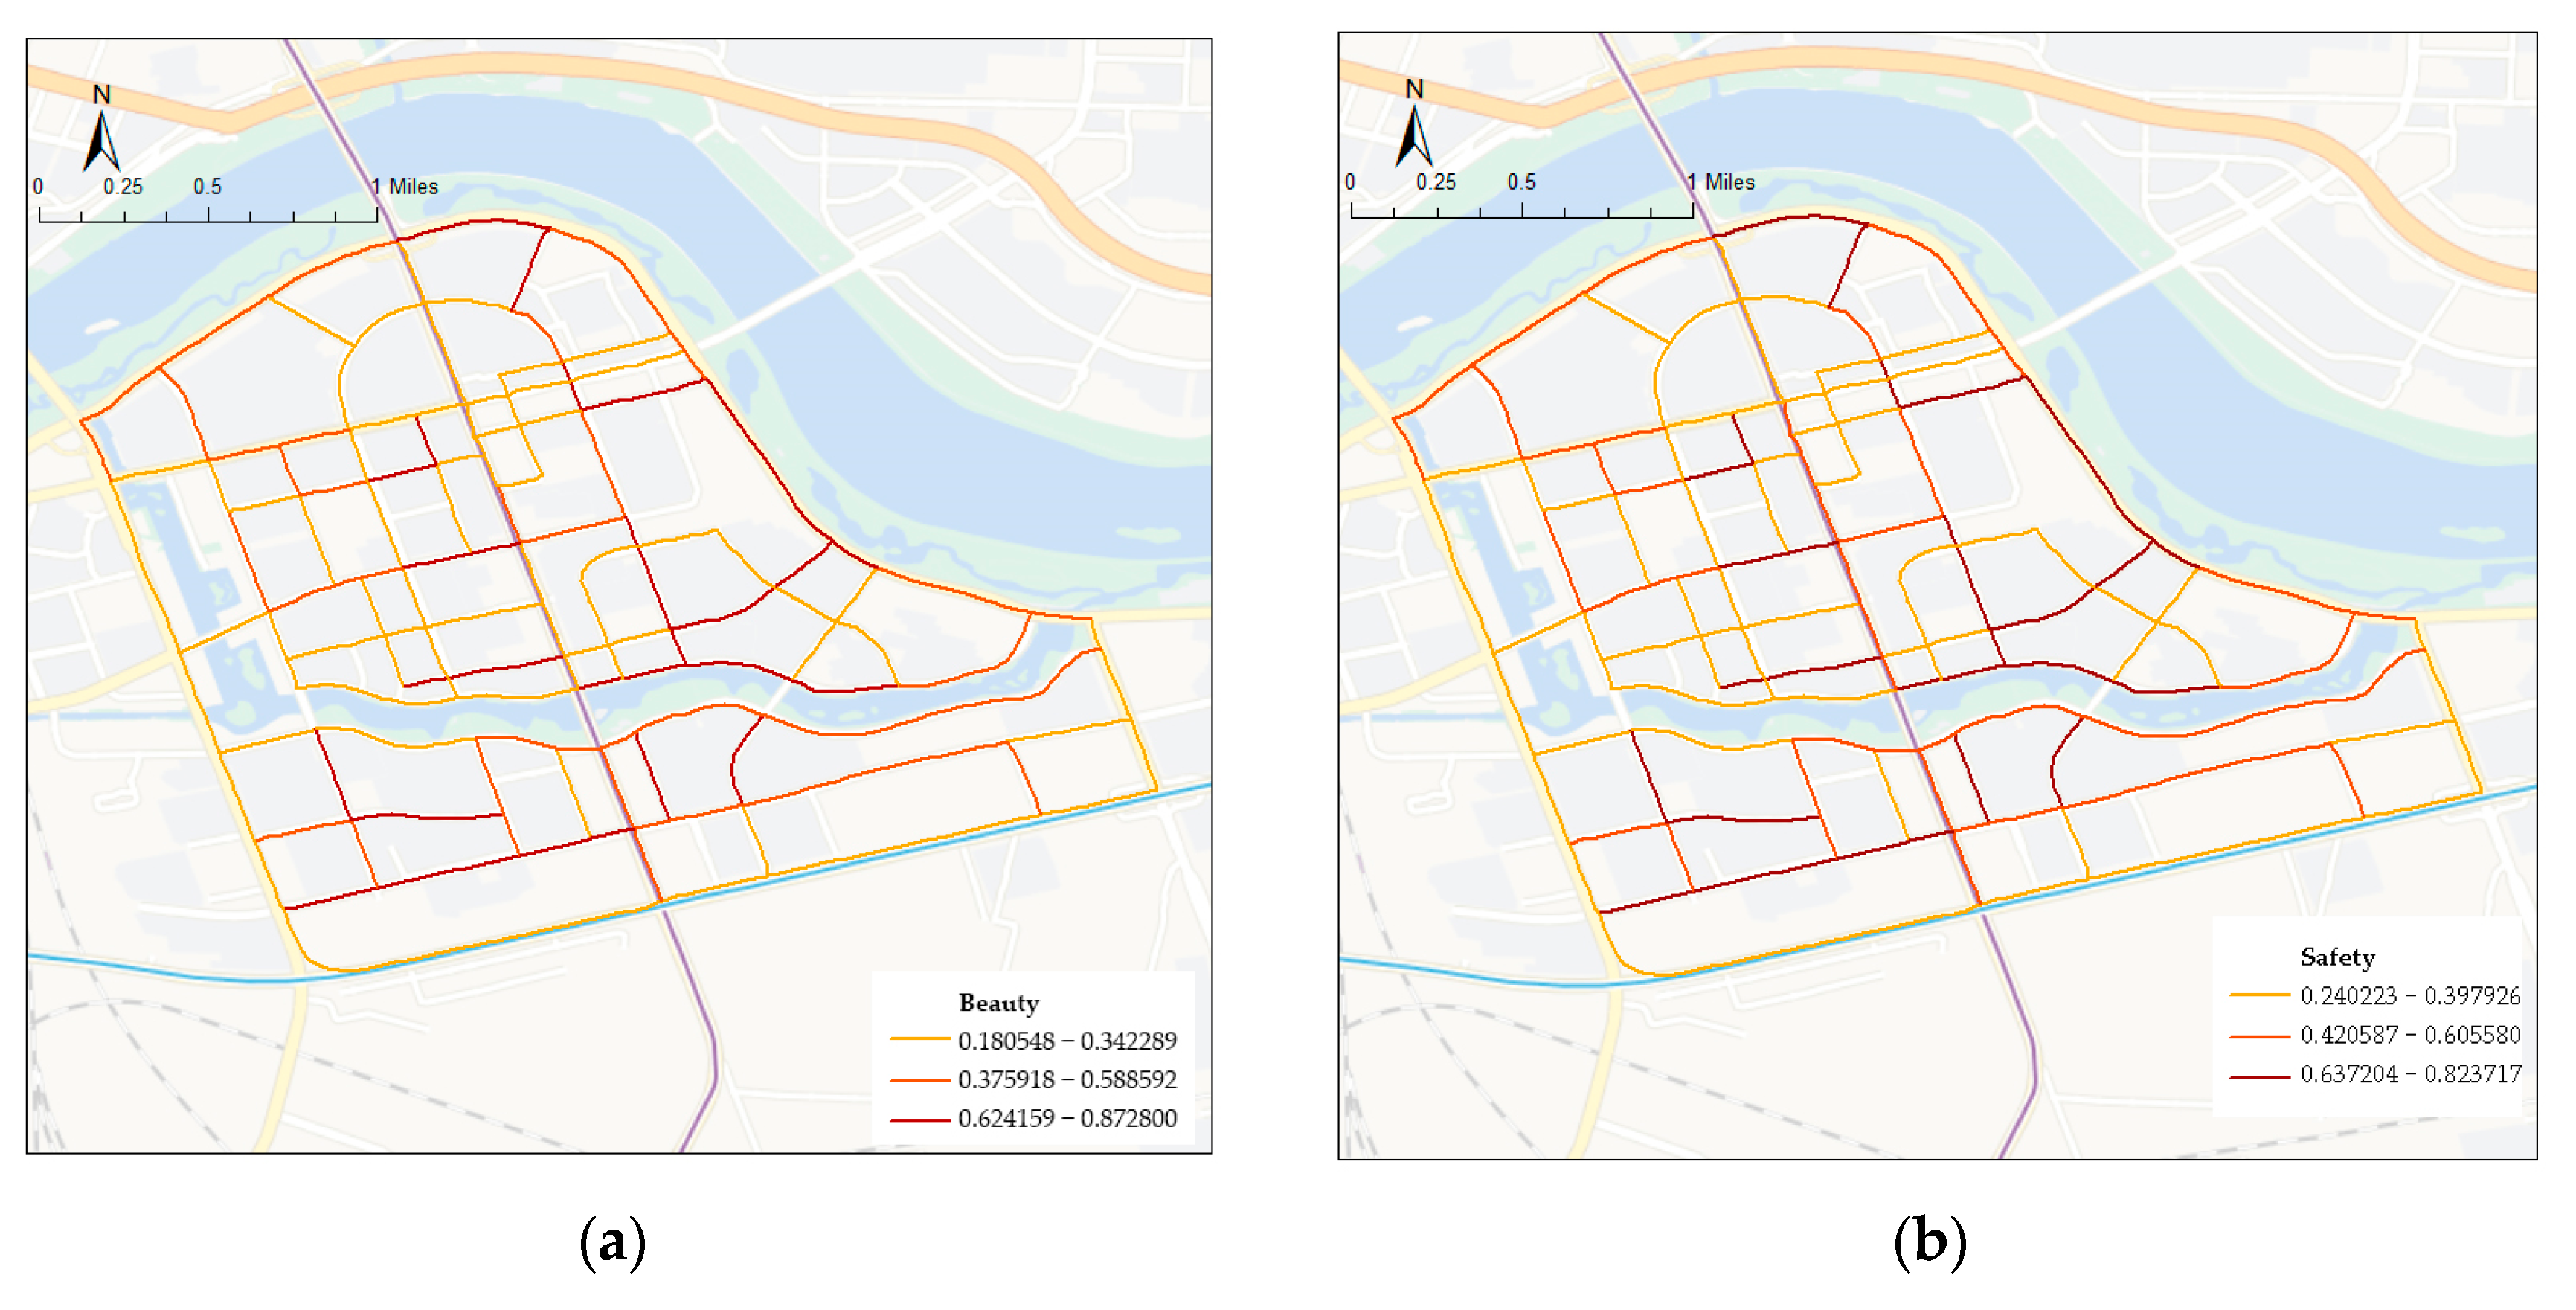
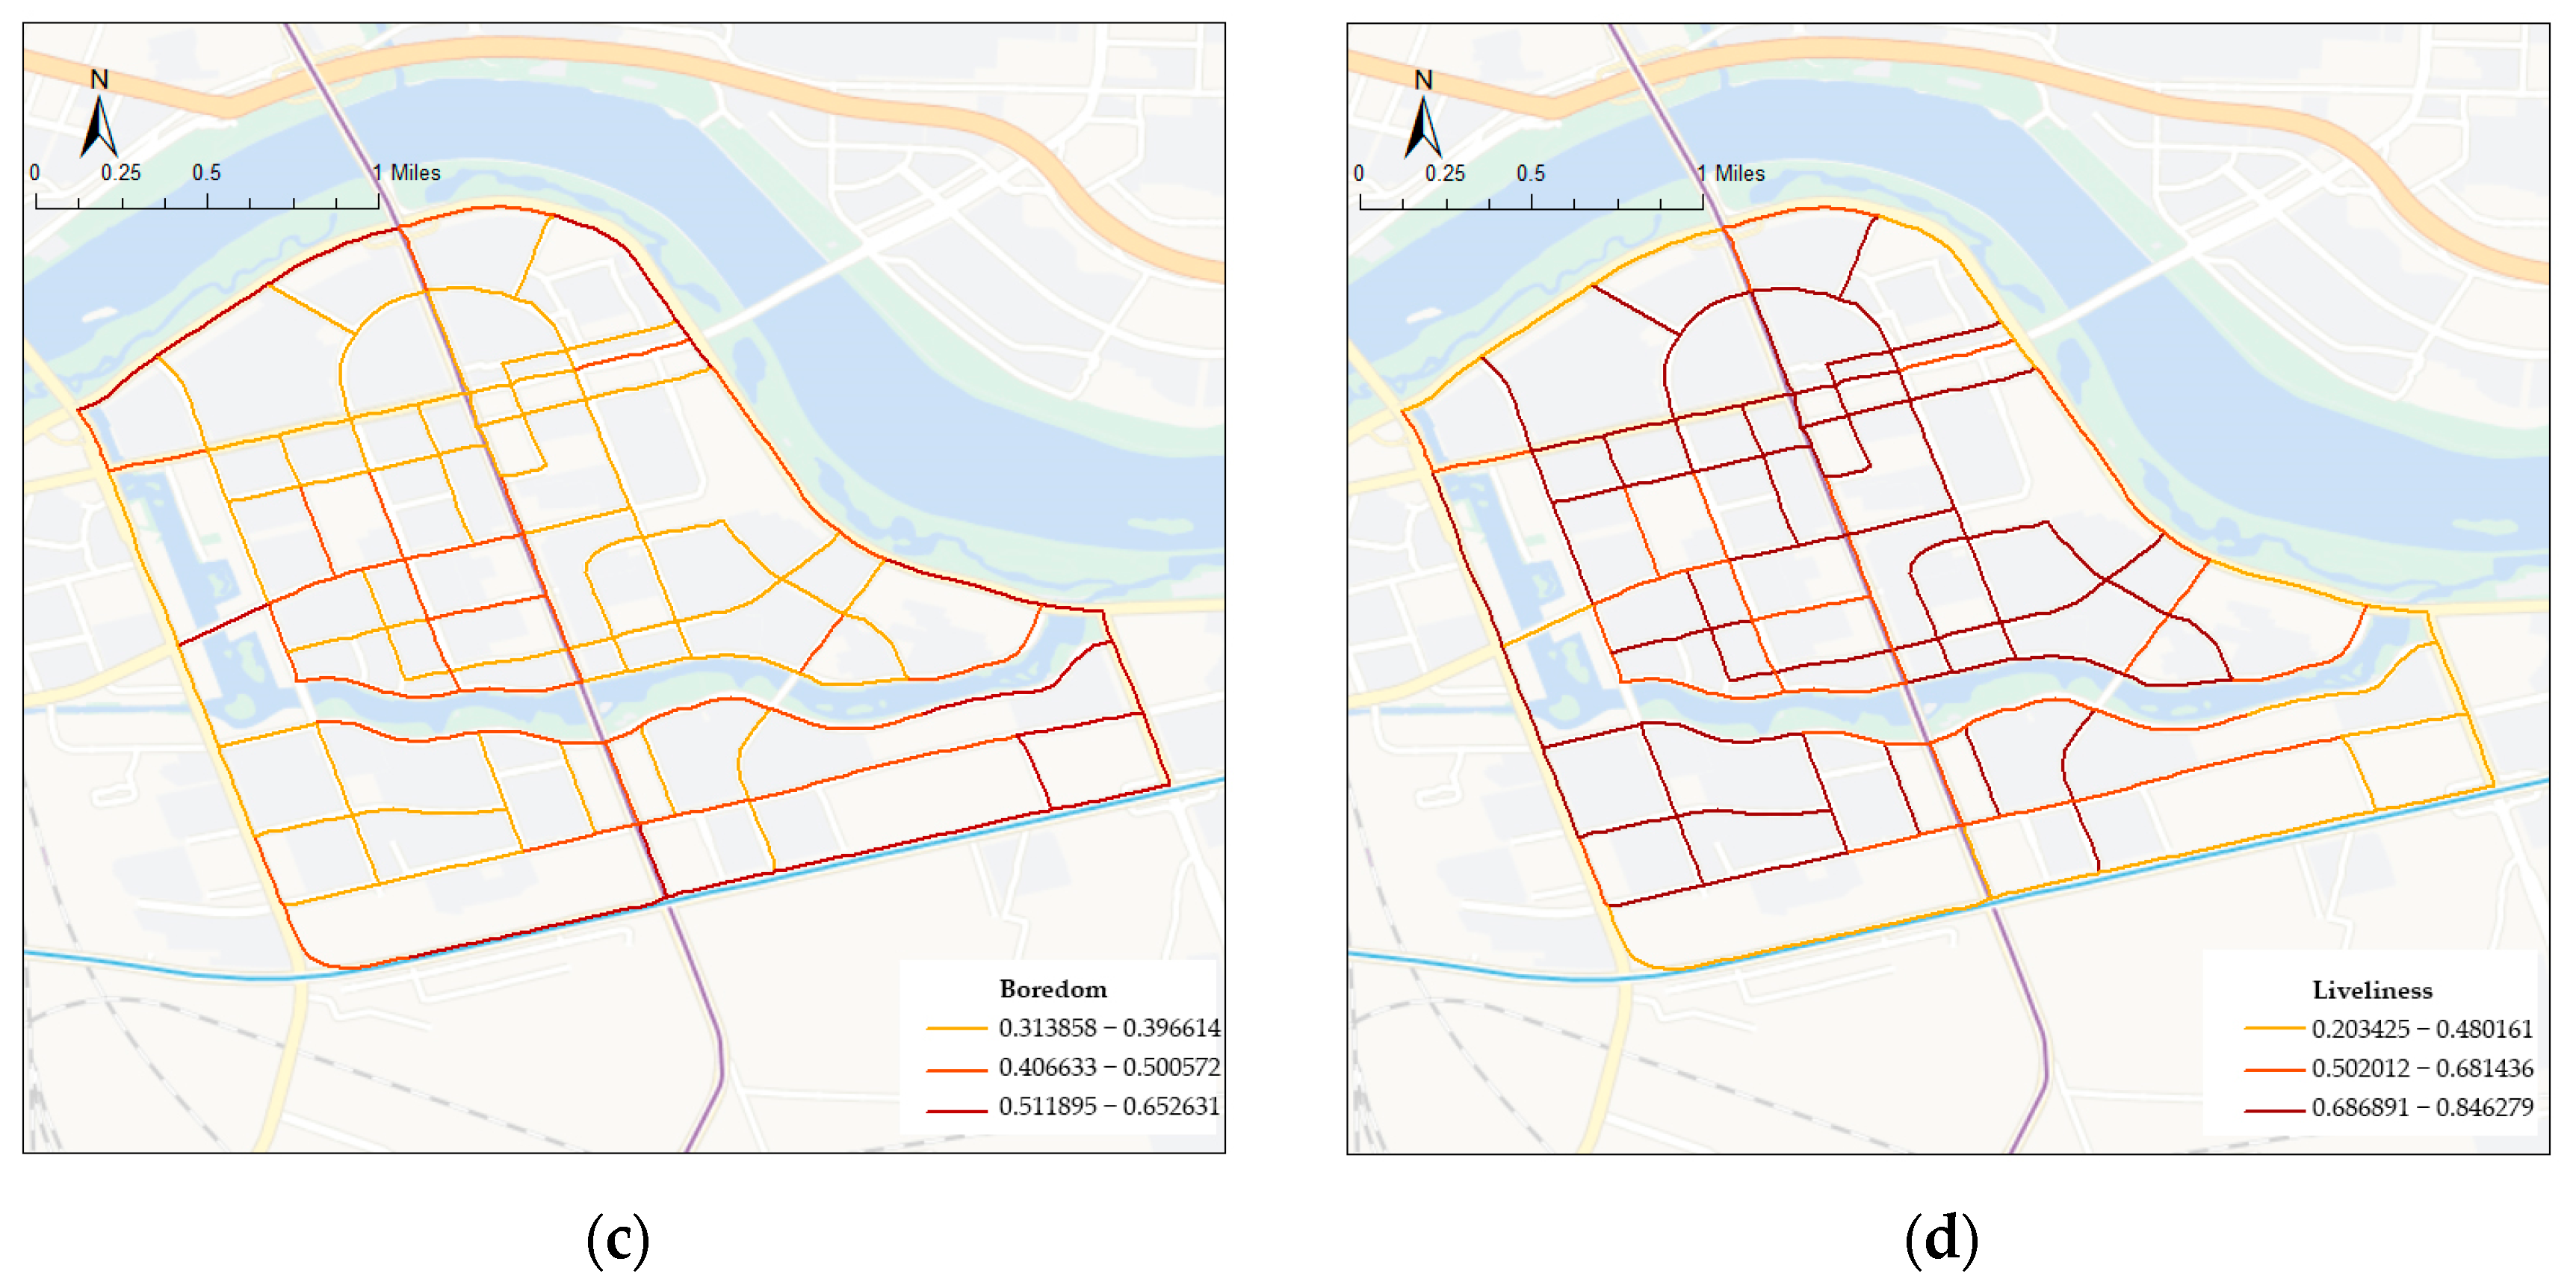
4.2. Perceptual Characterization Data Results

We assigned the spatial perceptual prediction data to each street segment and calculated the average perceptual eigenvalue for each segment. The results of the four perceptions of beauty, safety, boredom, and liveliness were visualized, and significant spatial heterogeneity in the perceptions of the study area was found (Figure 6). Overall, beauty and safety showed similar patterns in spatial distribution, while boredom and liveliness showed significantly different spatial distributions.
The average values of street perception were ranked as follows: Liveliness (0.661) > Safety (0.454) > Boredom (0.414) > Beauty (0.411) (Table 3). The ranking of the four perceptions revealed the public’s overall tendency to perceive the street environment on Changbai Island. The results of the study showed that the average value of liveliness perception was the highest in the study area. The range of the data on liveliness perception was 0.253–0.846, and the standard deviation was 0.140, with a wide range of data variability. Most sections of Changbai Island streets were considered to have liveliness, and a few were considered to lack liveliness. We compared the average perceived values of different street types, which were ranked as follows: commercial streets (0.771) > residential streets (0.724) > comprehensive streets (0.641) > transportation streets (0.489) (Table 4). The study found that commercial and residential streets among the Changbai Island streets stood out in terms of perceived liveliness. Commercial streets (0.025) and residential streets (0.082) had smaller deviations. The deviation data suggested that commercial and residential streets had more balanced perceptions of liveliness and that these two types of streets were also the primary high-liveliness-perceived streets on Changbai Island. Liveliness was closely related to the street’s commercial activities, public space design, and public engagement, which together shaped the spatial vibrancy of the street.
The perceptions of safety data for streets ranged from 0.240 to 0.824, and the standard deviation of safety perceptions was 0.172. The data suggested that safety perceptions varied significantly between roadway segments. This implied that some sections of Changbai Island received positive ratings from the public in terms of perceived safety, while other sections received lower ratings. This situation may be related to factors such as traffic flow and the sharing of vehicles and pedestrians. The ranking of the mean values of perceived safety for different types of streets was residential streets (0.470) > comprehensive streets (0.450) > commercial streets (0.443) > transportation streets (0.424). This ranking revealed the differences in safety perception among different street types. The standard deviation of perceived safety was higher for residential streets and commercial streets. This showed that these two types of streets were unevenly distributed in terms of perceived safety. The standard deviation of safety perceptions was lower for transportation streets and comprehensive streets. It indicated that the distribution of safety perceptions for these two types of streets was balanced, and the public was more likely to perceive safety.
The boredom data for Changbai Island ranged between 0.314 and 0.626, with a mean value of 0.414, which was close to the neutral value. It indicated that the boredom of the streets of Changbai Island was at a moderate level. The standard deviation of boredom was 0.073, the smallest among the four perceptions. This result showed that the public was more consistent in their boredom perceptions of the streets of Changbai Island. The ranking of the mean boredom values for different types of streets was transportation streets (0.499) > comprehensive streets (0.431) > residential streets (0.378) > commercial streets (0.359). The standard deviation of boredom for all four types of streets was less than 0.100, while the standard deviation of residential and commercial streets was less than 0.05. This further confirmed that the distribution of boredom in the streets of Changbai Island was more balanced.
The beauty data for the streets in the study area fluctuated between 0.181 and 0.873, indicating significant differences between roadway segments. Overall, the average beauty of the streets of Changbai Island was 0.411. This indicated that the public gave a moderately high rating to the perceived beauty of Changbai Island. The standard deviation of beauty was 0.201, showing the large variability and spatial dispersion of the public’s evaluation of the perceived beauty of each road segment. It also suggested that the main factor influencing beauty perception was the subjective experience of the public, which was related to factors such as personal preference and cultural background. The uncertainty and subjectivity of beauty perception were emphasized. Specifically, for the different types of streets, the beauty data means were ranked as follows: residential streets (0.429) > mixed-use streets (0.396) > transportation streets (0.395) > commercial streets (0.389). The results showed that the public rated the beauty of residential streets as high. The highest standard deviation was found for residential streets, indicating that the distribution of beauty perceptions was uneven among residential streets. The standard deviation of beauty perceptions was lower for comprehensive and transit streets than for the other two types of streets. This indicated that the beauty distribution of comprehensive and transit streets was more balanced and that public perceptions of beauty were consistent. In summary, beauty showed significant differences across street types and was influenced by personal and cultural factors. This provides an important reference for urban planning and beautification.

4.3. The Effect of the Physical Characteristics of the Built Environment of Streets on Perceived Features

SPSS 25.0 was employed to conduct correlation and multiple regression analyses. The analysis aimed to explore the relationships between perceptual variables and physical characteristics and identify key physical factors influencing perceptual outcomes. We used correlation analysis to examine associations between the four perceptual dimensions and physical attributes. Regression analysis was performed with each perceptual feature as the dependent variable and the retained physical characteristics as independent variables. Stepwise model construction, a common statistical approach in regression analysis, involves selecting a subset of relevant predictor variables for model inclusion. In this study, forward selection was used for stepwise model building: physical indicators were retained based on a predefined significance level (p-value < 0.05), and four multiple regression models were constructed accordingly.

4.3.1. Correlation Analysis

The data of perceptual and physical characteristics were imported into SPSS software for correlation analysis. The results are shown in Table 5. Beauty perception was positively correlated with the GVI, VI, and OP and negatively correlated with BE. Perceived safety was positively correlated with the GVI and VI and negatively correlated with OP and BE. Perceived liveliness was positively correlated with the VOR, VI, PR, and BE and negatively correlated with OP. Boredom perception was positively correlated with OP and negatively correlated with the VOR, VI, PR, and BE.

4.3.2. Regression Analysis

Perceived features were used as dependent variables, with physical characteristics retained after correlation analysis serving as independent variables. Stepwise regression analysis was performed using SPSS 25.0 to obtain regression models for beauty, safety, boredom, and liveliness perceptions.
(1)
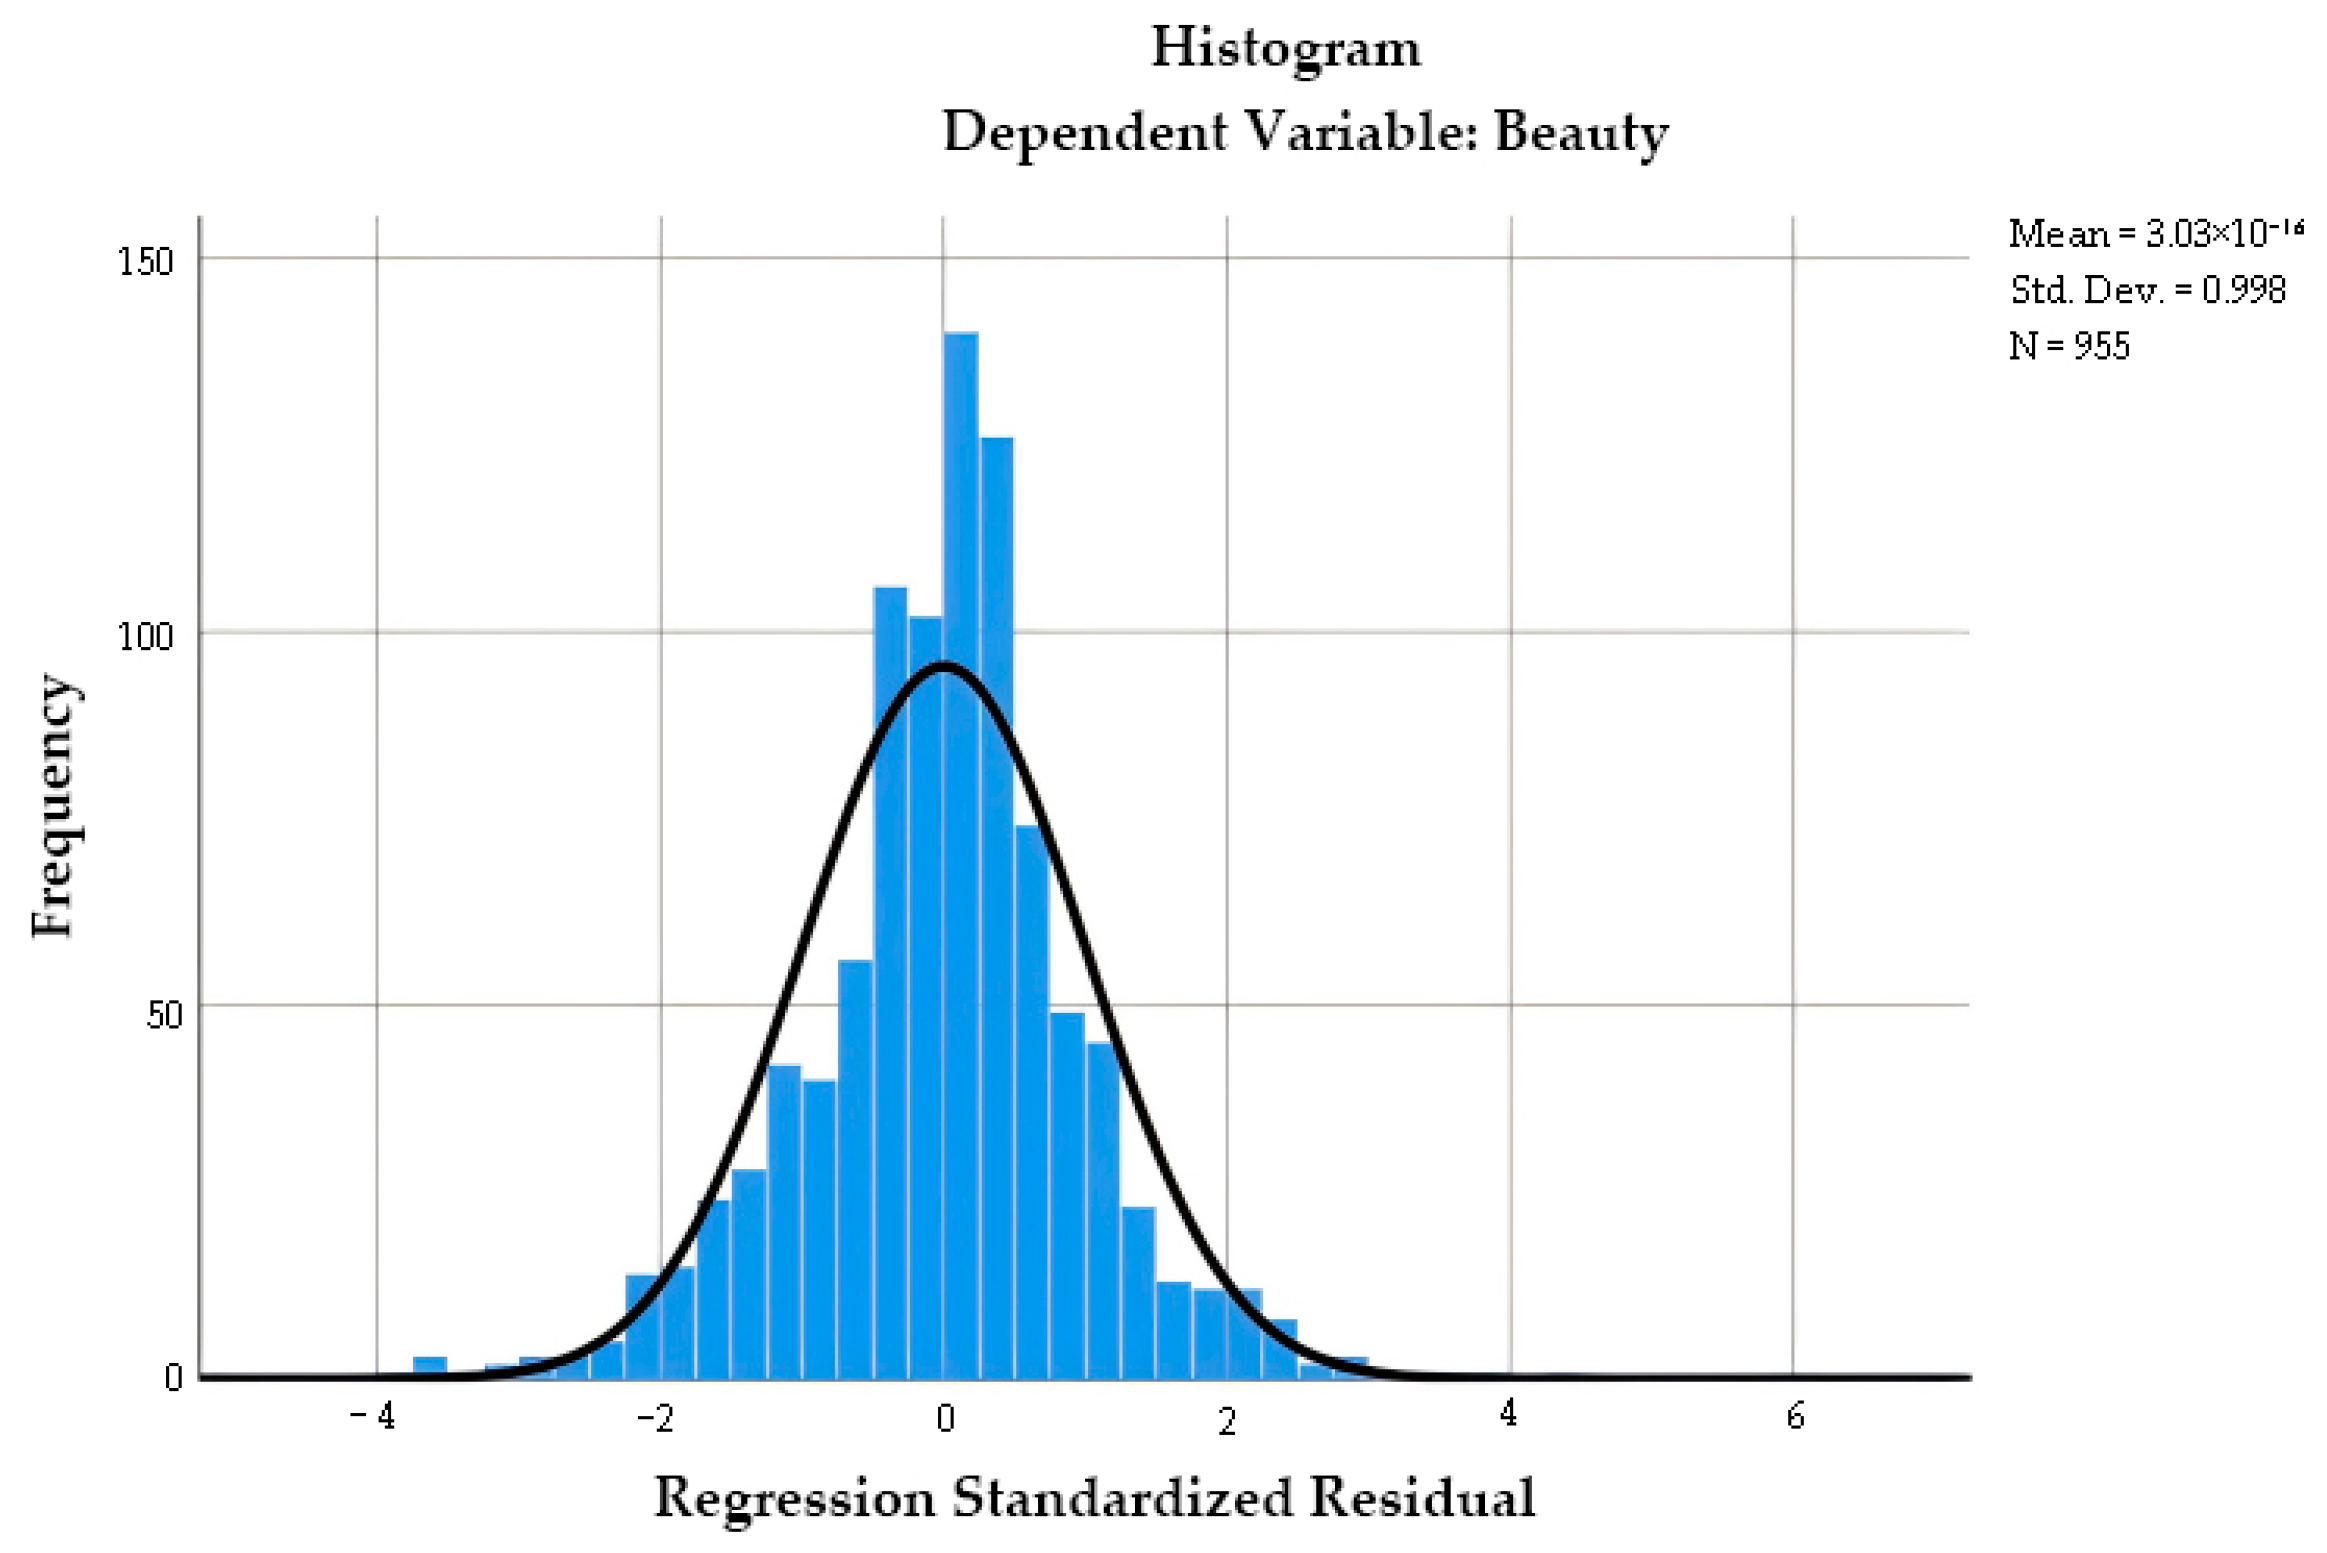
Multiple linear regression analysis of beauty perception
To model the relationship between beauty perception and physical street characteristics, we performed a stepwise regression analysis with beauty perception as the dependent variable and the four retained physical characteristics as independent variables (Figure 7). The standardized regression residuals exhibited a near-normal distribution, confirming that the data satisfied the model’s normality assumption.
As shown in Table 6, the R2 value for the beauty perception regression analysis was 0.653, indicating the model effectively fits the data and can explain the perceptual outcomes. The F-test significance levels were all below 0.05, confirming the statistical significance of the multiple linear regression model and the validity of the overall regression relationship. The p-values of the t-tests were all less than 0.05, indicating significant regression coefficients. Additionally, the VIF values of the retained physical characteristics were all under 10, suggesting no multicollinearity among model factors.
In summary, the results of the regression model of beauty perception and physical characteristics of streets are valid.
The final regression equation for the beauty perception of Shenyang Changbai Island streets was as follows:
Y1 = −0.352 + 4.738 × GVI − 2.106 × OP − 1.281 × BE
where Y1 was the beauty perception evaluation value.
The study shows that there are three physical features that affect the beauty perception of the streets of Changbai Island. The standardized beta coefficients indicate that the physical features of the street influence the beauty perception in the order of CVI, OP, and BE. The GVI was significantly positively correlated with beauty perception. The OP and BE ratings were significantly negatively correlated with beauty perception. Our analysis showed that lush vegetation along streets relaxed and delighted pedestrians, enhancing perceived street beauty. Conversely, high sky openness reflected street emptiness, reducing visual aesthetics, and excessive building dominance in the streetscape imposed psychological pressure on individuals, diminishing perceived beauty.
(2)
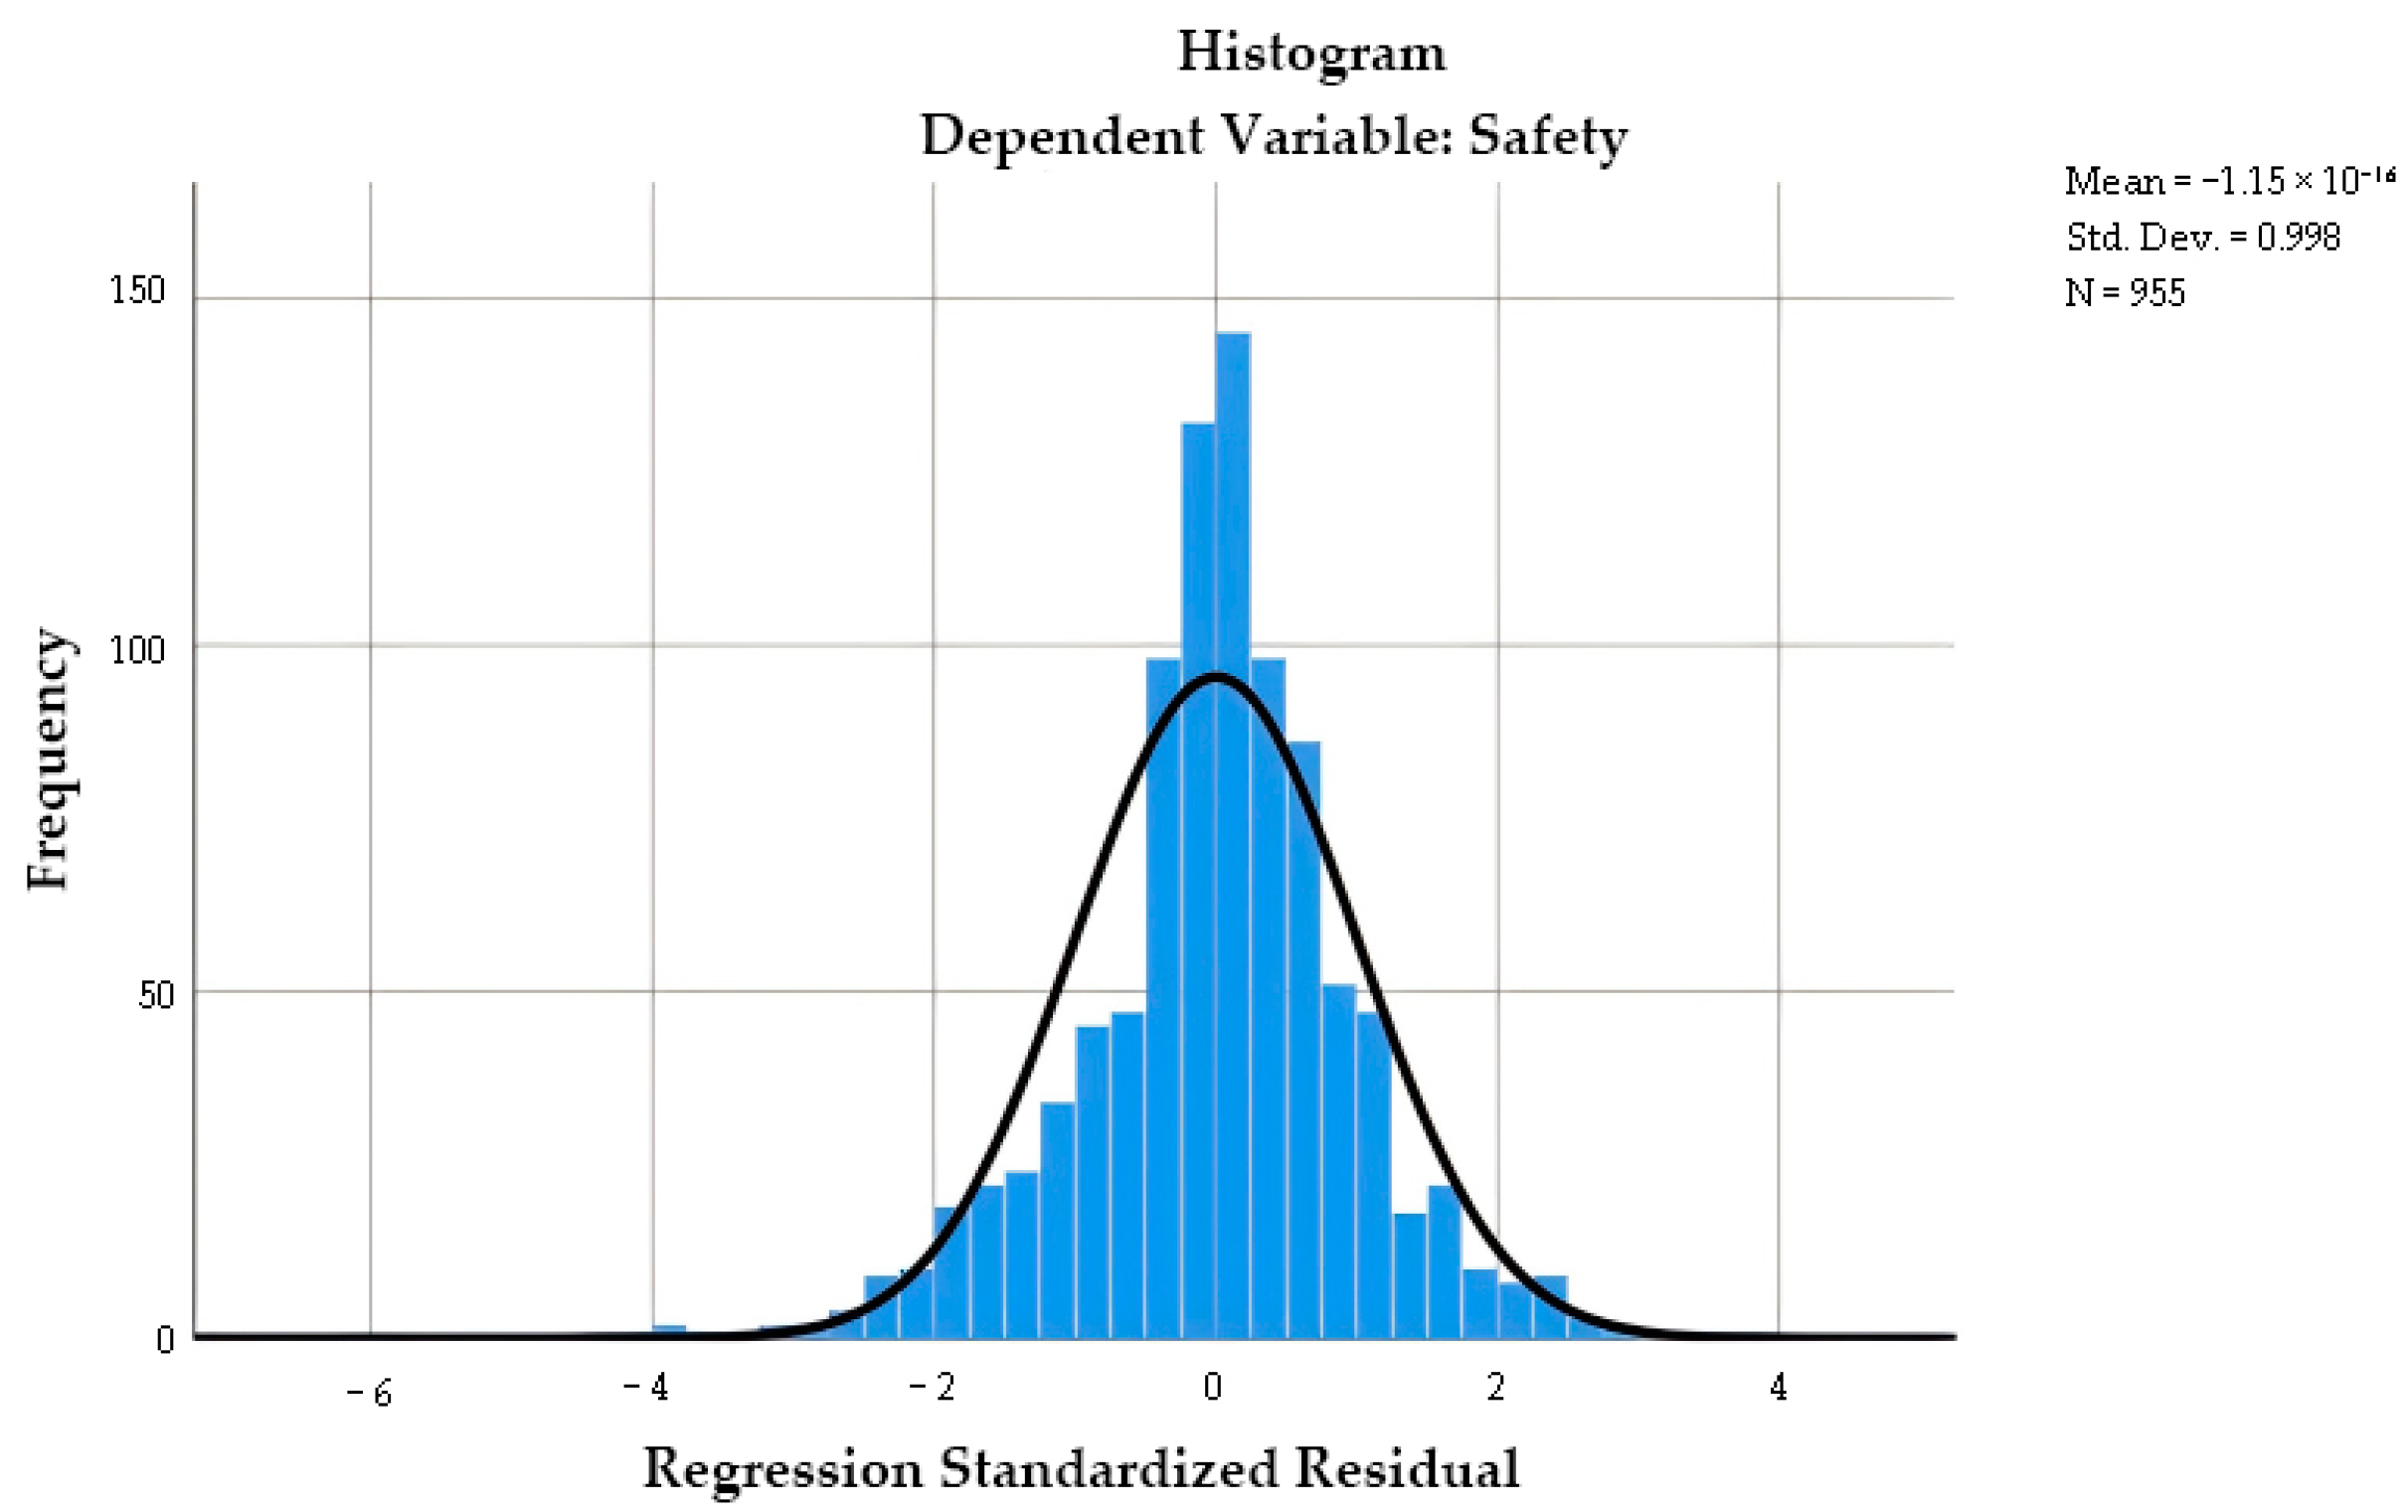
Multiple linear regression analysis of safety perception
To model the relationship between safety perception and physical street characteristics, we performed a stepwise regression analysis with safety perception as the dependent variable and the four retained physical characteristics as independent variables (Figure 8). The standardized regression residuals exhibited a near-normal distribution, confirming that the data satisfied the model’s normality assumption.
As shown in Table 7, the R2 value for the safety perception regression analysis was 0.643, indicating the model effectively fits the data and can explain the perceptual outcomes. The F-test significance levels were all below 0.05, confirming the statistical significance of the multiple linear regression model and the validity of the overall regression relationship. The p-values of the t-tests were all less than 0.05, indicating significant regression coefficients. Additionally, the VIF values of the retained physical characteristics were all under 10, suggesting no multicollinearity among model factors.
In summary, the results of the regression model of safety perception and physical characteristics of streets are valid.
The final regression equation for the safety perception of Shenyang Changbai Island streets was as follows:
Y2 = 0.075 + 5.803 × GVI − 3.223 × OP − 1.754 × VI
where Y2 was the safety perception evaluation value.
The study showed that there are three physical features that affect the perception of safety on the streets of Changbai Island (2). Among them, the degree of influence of physical features of the street on the perception of safety is CVI, OP, and BE, in that order. The GVI was significantly positively correlated with safety perception (p < 0.01), while OP (p < 0.05) and VI (p < 0.05) were negatively correlated with safety perception. This suggested that abundant vegetation along streets could enhance pedestrian safety, whereas high sky openness or vertical interface closure reduced perceived safety.
(3)
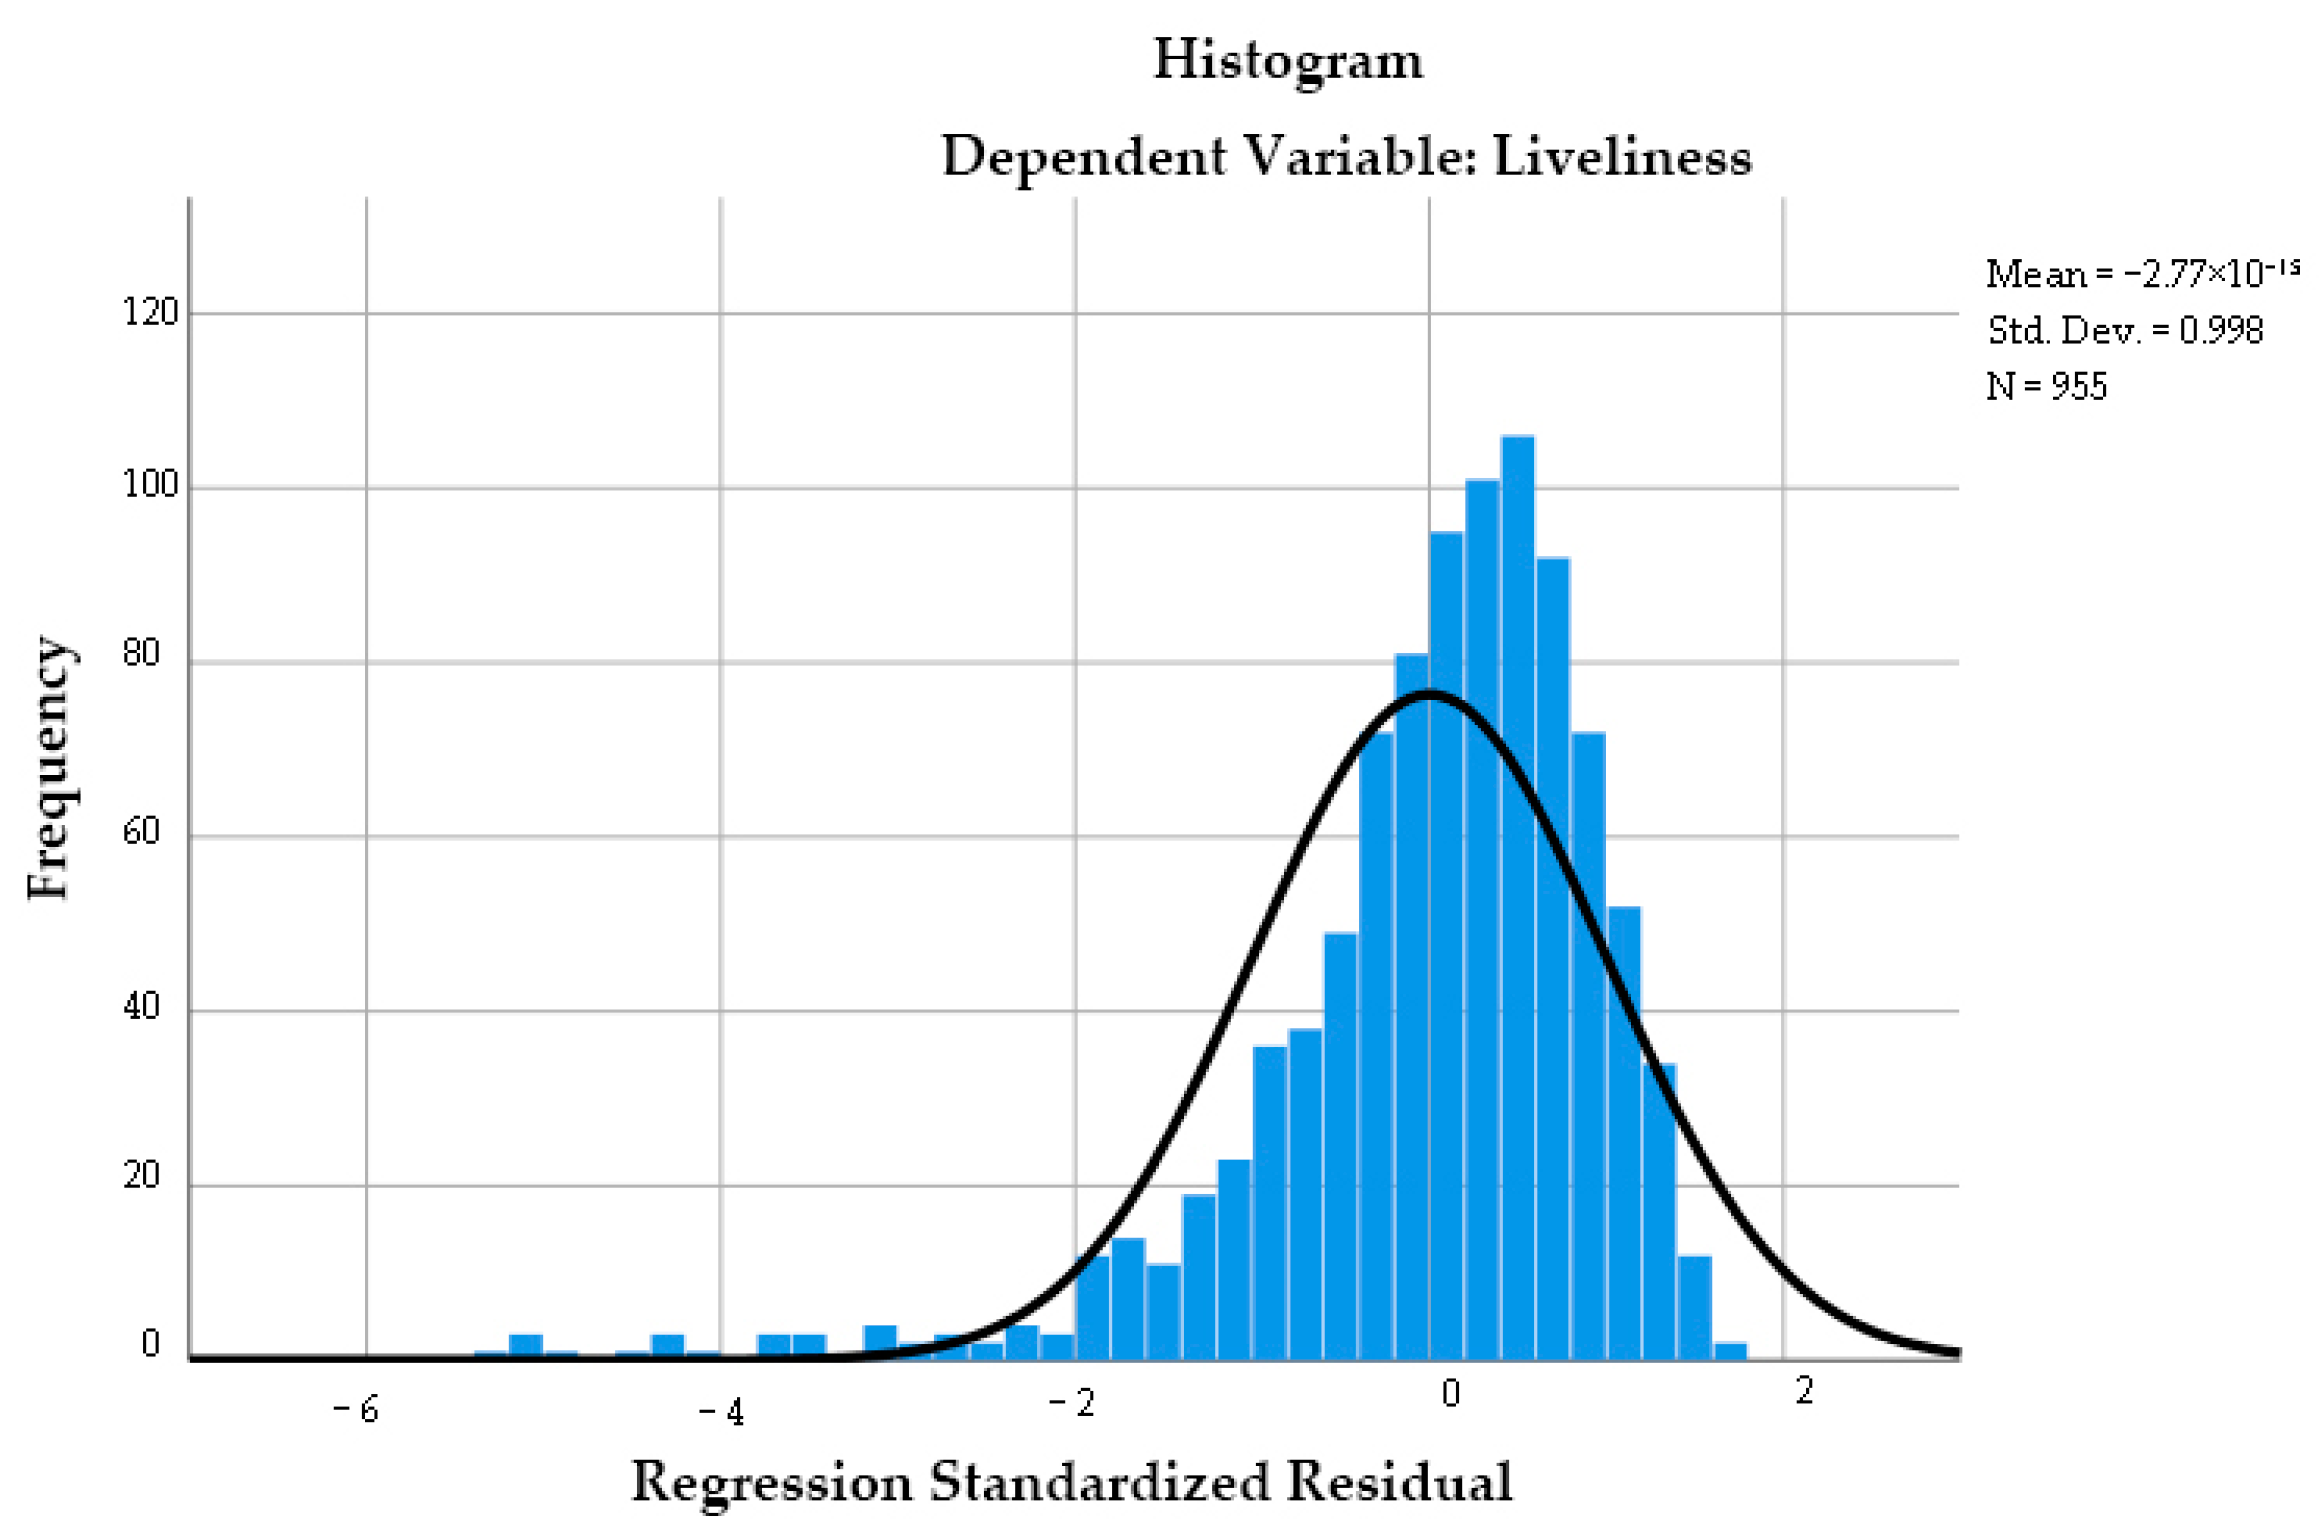
Multiple linear regression analysis of liveliness perception
To model the relationship between liveliness perception and physical street characteristics, we performed a stepwise regression analysis with liveliness perception as the dependent variable and the five retained physical characteristics as independent variables. The regression standardized residuals showed a slight left skew and extreme values (Figure 9); however, the main body of the data distribution (the middle region between −2 and 2) closely matched the normality curve. This distribution was considered to essentially satisfy the normality assumption, as indicated by the model diagnostics, confirming that the data met the regression model’s requirements.
As shown in Table 8, the R2 value for the liveliness perception regression analysis was 0.628, indicating the model effectively fits the data and can explain the perceptual outcomes. The F-test significance levels were all below 0.05, confirming the statistical significance of the multiple linear regression model and the validity of the overall regression relationship. The p-values of the t-tests were all less than 0.05, indicating significant regression coefficients. Additionally, the VIF values of the retained physical characteristics were all under 10, suggesting no multicollinearity among model factors.
In summary, the results of the regression model of liveliness perception and physical characteristics of streets are valid.
The final regression equation for the liveliness perception of Shenyang Changbai Island streets was as follows:
Y3 = −0.856−7.805 × OP + 1.727 × BE + 0.153 × VOR + 10.746 × PR
where Y3 was the liveliness perception evaluation value.
This shows that there are four physical features that affect the perception of the liveliness of the streets of Changbai Island. The standardized beta coefficients indicate that the degree of influence of physical features of the street on the perception of liveliness is OP, BE, VOR, and PR, in that order. OP had the greatest effect on liveliness perception and was notably negatively correlated with it. It indicated that the more open the sky is, the lower the perceived liveliness of the street. BE, VOR, and PR were significantly and positively correlated with the liveliness perception. This suggested that the higher the building, vehicle, and pedestrian occupancy of the street, the stronger the street’s liveliness.
(4)
Multiple linear regression analysis of boredom perception
To model the relationship between boredom perception and physical street characteristics, we performed a stepwise regression analysis with boredom perception as the dependent variable and the five retained physical characteristics as independent variables. The regression standardized residuals (Figure 10) showed that, although there was a slight left skew, the mean and median were close to 0, the standard deviation approximated 1, and the superimposed curves matched the data—especially in the middle region—indicating a near-normal distribution. These results confirmed that the data met the regression model’s assumptions.
As shown in Table 9, the R2 value for the boredom perception regression analysis was 0.671, indicating the model effectively fits the data and can explain the perceptual outcomes. The F-test significance levels were all below 0.05, confirming the statistical significance of the multiple linear regression model and the validity of the overall regression relationship. The p-values of the t-tests were all less than 0.05, indicating significant regression coefficients. Additionally, the VIF values of the retained physical characteristics were all under 10, suggesting no multicollinearity among model factors.
The final regression equation for the boredom perception of Shenyang Changbai Island streets was as follows:
Y4 = 0.129 + 5.803 × OP−1.677 × BE − 0.3 × VOR − 1.553 × VI − 14.225 × PR
where Y4 was the boredom perception evaluation value.
This shows that there are five physical features that affect the perception of boredom of the streets of Changbai Island. The standardized beta coefficients indicate that the degree of influence of the physical features of the street on the perception of boredom is OP, BE, VI, VOR, and PR, in that order. OP was notably and positively correlated with street boredom perception. BE, VOR, VI, and PR were remarkably negatively correlated with street boredom perception. In summary, this suggested that streets with a high percentage of sky, which meant a low percentage of other landscape elements, were visually boring. The abundance of buildings, vehicles, pedestrians, and plants in the street reduced the perceived boredom of the street.

5. Discussion

5.1. Perceptual and Physical Characteristics of Urban Streets

Urban streets are not only a central component of the built environment but also a medium through which the urban environment is perceived, providing space for socialization, movement, and living [66]. To a large extent, the street also influences human perceptions and psychological responses [47]. Several studies have suggested that physical characteristics such as the green visual index, building openness, and sky openness of a street can directly affect residents’ sensations of the street’s beauty, vitality, and safety [75].
This study verified the significant impact of different physical characteristics on residents’ sensations by analyzing the streets of Changbai Island. The results show that commercial and residential streets ranked highest in sensations of liveliness, which is closely related to the active social activities and adequate public space design of these streets. Commercial and residential streets have ample public spaces, and residents go out and participate in a wide range of social activities, thus enhancing the perceived vitality of the street [103]. Transportation streets showed a high sensation of boredom. Transportation streets are designed to ensure rapid vehicular movement [23], and the landscape elements of traffic streets are relatively simple in design, lacking a diversity of public spaces and pedestrian activity areas. Scholars such as Taylor have noted that transportation streets often lack visual variety and opportunities for interaction, easily leading to feelings of monotony and boredom [104], which is consistent with this study.
In addition, commercial streets had relatively low beauty perception scores, which were largely related to commercial building layout and functionality. Commercial streets are dominated by dense commercial buildings, paving, and amenities, with fewer planting configurations. These factors contribute to the overall monotonous visual landscape of commercial streetscapes. Commercial streets lack natural elements and adequate open space, further reducing the perceived beauty of the street. The density and functional design of buildings directly affect the aesthetics of streets [71]. Wong scholars argue that overly dense buildings not only detract from aesthetics but also enhance dullness [105], which is consistent with this study. Residential and comprehensive streets demonstrated a high sensation of safety. The main reason for this is that these streetscapes are mostly flanked by residential or low-density buildings, creating a strong sense of spatial enclosure. At the same time, the streets are lined with lush street trees, reducing the sense of unease pedestrians feel about the outside space.
The beauty, safety, liveliness, and boredom perceptions of city streets can reflect residents’ subjective evaluations of city streets. This study shows that the streets of Changbai Island have the highest mean value of liveliness perception and the lowest perception of boredom, indicating that the area has a high level of social vitality and spatial diversity. The green visual index, as a core physical feature, significantly influenced the public’s perception of the beauty and safety of the street. This is consistent with the results of previous studies, emphasizing the role of greenery in enhancing the quality of urban environments [106,107]. Therefore, a deeper understanding of how the physical characteristics of urban streets affect human sensation is essential to guide future urban design.

5.2. Relationship Between Physical and Perceptual Characteristics

In this study, correlation and multiple regression analyses were used to reveal in detail the complex relationship between physical and perceived characteristics of streets. These physical characteristics were selected for their direct impact on residents’ sensations. It was shown that these physical characteristics not only shape the visual and spatial qualities of the street but also influence the mood and behavior of the residents. The green visual index is significantly and positively correlated with emotion-related perceptions of beauty and safety. Studies have shown that the presence of verdant urban street vegetation significantly enhances people’s visual beauty and safety sensations [7], while green space can play an important role in the public’s mental health [46,108]. Lush green plants are an important part of urban streets, and the greater the complexity of their hierarchy and structure, the more they attract attention and stimulate positive emotional feedback [109,110].
Openness, which also refers to the degree of sky exposure, was negatively correlated with perceptions of beauty, liveliness, and safety, suggesting that overly open spaces may lead to negative emotions, which is consistent with existing research [23]. Too high or low sky exposure in the streetscape can negatively impact the public. When the sky visibility is overly high, the road appears more spacious, and buildings and plants seem farther away from the streetscape. This situation diminishes the beauty and liveliness of the streetscape and can induce a sense of emptiness. When the sky visibility is too low, buildings and plants in the streetscape are overly enclosed, often forming a more confined space, causing the public in the streetscape to feel depressed [7,72,111]. It has also been shown that large amounts of sky reduce the perceived safety of streets [112]. Therefore, urban planners should consider how to balance sky visibility in their designs to create an urban space that is neither empty nor oppressive, thereby enhancing the overall perception of residents.
The natural to artificial ratio of the vertical interface (VI) represents the percentage of natural and artificial elements in the street. A higher value of VI suggests that the street has more natural elements, and a lower value of VI indicates that the street has a higher percentage of artificial elements. This study found a negative correlation between VI and safety perception, indicating that streets with more vegetation and fewer buildings are associated with lower safety perceptions. VI values are negatively correlated with boredom, indicating that when streets have a high proportion of architectural elements and a low proportion of vegetation, people feel bored and find the street unattractive. Relevant studies have shown that densely vegetated living spaces can be more enclosed and can increase residents’ feelings of insecurity. Excessive built space, in turn, increases street homogeneity, which can induce boredom among residents [102]. In residential and commercial areas, mitigating greenery-induced enclosure can alleviate residents’ negative perceptions [113,114]. Reducing the height of enclosed spaces created by high-rise buildings can enhance the attractiveness of streets and improve the quality of the street environment.
Vehicle occurrence rate (VOR) was positively correlated with liveliness perception and negatively correlated with boredom perception. Mahsa Farahani’s study demonstrated that high traffic density induces congestion and slow-moving vehicles, fostering feelings of dullness and monotony in street experiences—findings consistent with this study [115]. The positive association between VOR and liveliness perception aligns with Jacobs’ (1992) emphasis on urban vitality as a core livability criterion [116]. In urban spaces, crowded and chaotic transportation environments can create negative emotions [50]. Research has shown that motorized and non-motorized vehicles, as dynamic street elements, often evoke pedestrian insecurity [117]. However, some studies suggest that moderate vehicle presence enhances residents’ safety perception, as road vehicles signal a harmonious and vibrant environment. Too many vehicles on the street can cause visual and physical discomfort [51]. These contradictory findings diverge from our results. Consequently, complex nonlinear relationships between VOR and safety in the study area may exist, warranting further in-depth investigation.
The pedestrian indicator is the percentage of people in the street. The streets we studied had a relatively small percentage of people on them. As images were captured during weekday working hours, there were fewer pedestrians and a lower pedestrian percentage in the streets. However, our analysis revealed a significant effect of pedestrian percentage on boredom perception. Pedestrian activity has also been shown in related studies to enhance the vitality and aesthetic appeal of streets by increasing social interaction and reducing boredom [118].
There was a negative correlation between building coverage ratio and perceptions of beauty and boredom, suggesting that increasing building coverage reduced street beauty and increased boredom. Dense building layouts and rundown structures detracted from street aesthetics, contributing to a monotonous and unappealing streetscape [100]. Therefore, a moderate reduction in floor area ratio, combined with increased open space and diverse greenery, could significantly enhance street visual aesthetics [119].
In our study, walkable streets were not significantly correlated with beauty, safety, liveliness, and boredom. The lack of correlation between walkable streets and perception indicators may be due to a combination of multidimensional drivers, variable interactions, and data limitations. First, the quantitative approach of the current study, which focuses on “percentage”, fails to cover the core characteristics of the walking environment. Second, the percentage of walkable streets in the sample shows low variability, weakening the validity of the statistical test. Third, the effect of walkable streets on perceptions may be realized indirectly through mediating or moderating variables, but traditional linear regressions have difficulty capturing such nonlinear relationships. Despite insignificant macro-statistical associations, finely designed walking paths have been shown to be a central vehicle for enhancing social vitality [70].
This study revealed relationships between physical characteristics, including the GVI, BE, OP, and residents’ perceptions of beauty, safety, liveliness, and boredom. These findings offer valuable references for urban planning while specifically highlighting the importance of integrating environmental greenery, spatial enclosure, and traffic mobility in street design. By improving physical street environments, urban planners can effectively elevate residents’ quality of life and enhance the overall attractiveness of urban spaces. Therefore, balancing these factors is crucial to creating aesthetically pleasing, safe, vibrant, and non-monotonous urban environments.

5.3. Optimization Strategies Proposed by the Study

Based on these findings, we propose the following optimization strategies to improve the quality of urban streetscapes. First, enrich streetscapes with vegetation. Studies have shown that increasing vegetation on both sides of streetscapes significantly enhances the perceived beauty and safety of the street [120]. Planting more street trees and shrubs in residential and commercial streetscapes can boost the visual appeal of the streetscapes while enhancing the mental health and well-being of residents. Second, moderately control sky openness and the floor area ratio. Overly open street space and high-density building layouts can reduce residents’ sense of safety and aesthetics. Rapoport (1990) suggested that moderate spatial enclosure can provide psychological comfort [121]. Therefore, urban planners should control building density during planning and retain a moderate amount of open space during the design process to ensure a sense of visual balance. At the same time, pedestrian space and transportation facilities need to be optimized. On commercial and residential streetscapes, the design of pedestrian areas should be enhanced by increasing the width and continuity of sidewalks and providing appropriate public facilities. Gehl (2010) emphasized that a pedestrian-friendly street design promotes social interaction and enhances the vitality of streetscapes [122]. Finally, enhance the sense of enclosure of the streetscapes. In commercial and residential streetscapes, enhancing the sense of enclosure by increasing the close connection between buildings and street greenery can effectively elevate the perception of street vitality.

5.4. Limitations of This Study

While our proposed framework aims to explore the relationship between street environments and human perception, integrating new data sources and methodologies would enable more nuanced investigations into this association. First, Baidu Street View, combined with semantic segmentation, can effectively quantify street features. However, Baidu Street View has time constraints, so it cannot completely replace field studies.
Second, regarding street environments, this study focuses on seven physical features. However, factors like street lighting, seating facility integrity, and pedestrian–vehicle separation should also be incorporated into such characteristics. Scholars of previous studies have also shown that visual data alone may not fully encapsulate the complexity of urban life [123]. Thus, future research should integrate POI data, nighttime light imaging, and acoustic measurement to capture variables like commercial activity, lighting quality, and noise levels. This would facilitate a more comprehensive analysis of built environment activities and cultural contexts.
Finally, regarding human perception, although previous studies have demonstrated that the dataset used in the current study is free of cultural and individual differences and is able to effectively quantify human perception, it cannot completely replace subjective perception. Human perception is shaped by the interaction between the physical environment, mental states, and social factors. Therefore, future research could consider adding physiological monitoring techniques to further analyze the mechanisms of human perception and the influence of the built environment.

6. Conclusions

In this study, the streets of Changbai Island in Shenyang were used as the research object. We quantitatively analyzed the streetscape environment using streetscape images and machine learning. Meanwhile, we obtained data on four perceived features: safety, beauty, boredom, and liveliness. We analyzed the built environment of the streets in the study area from the perspectives of both physical traits and perceptual features. Moreover, we developed a regression model of perceptual and physical characteristics based on the four perceptual evaluations.
In terms of built environment physical characteristics, residential streets had low sky openness and walkability; commercial streets exhibited a high GVI; and transportation streets showed a low VI and high BE rating. Resident perception distributions indicated that residential streets elicited strong perceptions of liveliness, safety, and beauty, whereas transportation streets generated higher boredom and lower liveliness, beauty, and safety sensations. Comprehensive analysis revealed that the GVI influenced beauty and safety perceptions, addressing residents’ fundamental needs, while OP, VOR, and BE shaped liveliness and boredom perceptions. Urban planners should integrate these factors to align urban environments with resident needs. This study explored relationships between street built environments and resident perceptions, identifying physical characteristics that impact subjective evaluations. The findings provide empirical data for urban planning and theoretical foundations for improving resident mental health and quality of life.
However, this study was constrained by temporal limitations in relying on Baidu Street View images for street characteristic quantification. Visually driven analytical frameworks, while effective, struggle to capture the multidimensional complexity of urban life. Although standardized perceptual datasets mitigate cultural biases, they cannot fully substitute for individual subjective experiences or dynamic mental processes.
Future research should integrate multi-source data, including POI, nighttime light imagery, and acoustic measurements, to construct a full-factor analysis system encompassing commercial activities and environmental quality. Additionally, incorporating physiological monitoring techniques alongside social and behavioral data will help uncover the mechanisms through which the physical environment influences perception via sensory experiences, bridging objective measurements and subjective human responses.

Author Contributions

Conceptualization, X.L., Q.L. and D.S.; Data curation, Q.L., X.J. and Y.M.; Formal analysis, Q.L. and D.S.; Funding acquisition, X.L. and Q.L.; Investigation, X.L., Q.L., D.S. and M.L.; Methodology, Q.L., X.J. and Y.M.; Project administration, X.L., D.S. and M.L.; Resources, X.L., D.S. and M.L.; Software, Q.L., X.J. and Y.Y.; Supervision, X.L. and D.S.; Validation, X.L., D.S. and M.L.; Visualization, Q.L.; Writing—original draft, X.L., Q.L., X.J., D.S. and Y.M.; Writing—review and editing, X.L., Q.L., Y.Y. and M.L. All authors have read and agreed to the published version of the manuscript.

Funding

This research was funded by the National Natural Science Foundation of China (grant number 52178045).

Data Availability Statement

Interview transcripts and interpreted statements supporting this study’s findings and the smart contract codes are available from the corresponding author upon reasonable request.

Acknowledgments

We would like to thank the journal experts who edited this paper. We also appreciate the constructive suggestions and comments on the manuscript from the reviewers and editors.

Conflicts of Interest

The authors declare no conflicts of interest.

Appendix A

The following are well-defined spatial distribution maps of street characteristics.
Figure A1. Spatial distribution maps of physical characteristics: (a) natural to artificial ratio of the vertical interface; (b) walkable streets; (c) vehicle occurrence rate; (d) building enclosure; (e) green visual index; (f) openness; (g) pedestrians.
Buildings 15 01524 g0a1aBuildings 15 01524 g0a1bBuildings 15 01524 g0a1cBuildings 15 01524 g0a1d

Appendix B

The following are well-defined spatial distribution maps of perceptual characteristics.
Figure A2. Spatial distribution maps of perception features: (a) beauty; (b) safety; (c) boredom; (d) liveliness.
Buildings 15 01524 g0a2aBuildings 15 01524 g0a2b

References

  1. Wei, J.; Yue, W.; Li, M.; Gao, J. Mapping human perception of urban landscape from street-view images: A deep-learning approach. Int. J. Appl. Earth Obs. Geoinf. 2022, 112, 102886. [Google Scholar] [CrossRef]
  2. Ewing, R.; Handy, S. Measuring the unmeasurable: Urban design qualities related to walkability. J. Urban Des. 2009, 14, 65–84. [Google Scholar] [CrossRef]
  3. Wang, R.; Liu, Y.; Lu, Y.; Zhang, J.; Liu, P.; Yao, Y.; Grekousis, G. Perceptions of built environment and health outcomes for older Chinese in Beijing: A big data approach with street view images and deep learning technique. Comput. Environ. Urban Syst. 2019, 78, 101386. [Google Scholar] [CrossRef]
  4. Nasar, J.L. Perception, Cognition, and Evaluation of Urban Places. Public Places Spaces 1989, 10, 31–56. [Google Scholar]
  5. Wood, L.; Hooper, P.; Foster, S.; Bull, F. Public green spaces and positive mental health–investigating the relationship between access, quantityand types ofparks and mental wellbeing. Health Place 2017, 48, 63–71. [Google Scholar] [CrossRef]
  6. Su, M.; Du, Y.K.; Liu, Q.M.; Ren, Y.J.; Kawachi, I.; Lv, J.; Li, L.M. Objective assessment of urban built environment related to physical activity—Development, reliability and validity of the China Urban Built Environment Scan Tool (CUBEST). BMC Public Health 2014, 14, 109. [Google Scholar] [CrossRef]
  7. Dai, L.Y.; Zheng, C.L.; Dong, Z.K.; Yao, Y.; Wang, R.F.; Zhang, X.T.; Ren, S.L.; Zhang, J.Q.; Song, X.Q.; Guan, Q.F. Analyzing the correlation between visual space and residents’ psychology in Wuhan, China using street-view images and deep-learning technique. City Environ. Interact. 2021, 11, 100069. [Google Scholar] [CrossRef]
  8. Wang, X.X.; Shi, R.T.; Zhou, Y. Dynamics of urban sprawl and sustainable development in China. Socio-Econ. Plan. Sci. 2020, 70, 100736. [Google Scholar] [CrossRef]
  9. Chen, C.; Li, H.; Luo, W.; Xie, J.; Yao, J.; Wu, L.; Xia, Y. Predicting the effect of street environment on residents’ mood states in large urban areas using machine learning and street view images. Sci. Total Environ. 2022, 816, 151605. [Google Scholar] [CrossRef]
  10. Li, X.Y.; Mou, Y.C.; Wang, H.Y.; Yin, C.H.; He, Q.S. How does polycentric urban form affect urban commuting? quantitative measurement using geographical big data of 100 cities in china. Sustainability 2018, 10, 4566. [Google Scholar] [CrossRef]
  11. Musse, M.A.; Barona, D.A.; Santana Rodriguez, L.M. Urban environmental quality assessment using remote sensing and census data. Int. J. Appl. Earth Obs. Geoinf. 2018, 71, 95–108. [Google Scholar] [CrossRef]
  12. Kaklauskas, A.; Bardauskiene, D.; Cerkauskiene, R.; Ubarte, I.; Raslanas, S.; Radvile, E.; Kaklauskaite, U.; Kaklauskiene, L. Emotions analysis in public spaces for urban planning. Land Use Policy 2021, 107, 105458. [Google Scholar] [CrossRef]
  13. Barahmand, U.; Shahbazi, H.; Shahbazi, Z. Implications ofperceived physical and social aspects ofthe environment for self-reported physical and mental health. Int. J. Environ. Health Res. 2013, 23, 31–45. [Google Scholar] [CrossRef] [PubMed]
  14. Li, X.; Zhang, C.; Li, W.; Ricard, R.; Meng, Q.; Zhang, W. Assessing street-level urban greenery using Google Street View and a modified green view index. Urban For. Urban Green. 2015, 14, 675–685. [Google Scholar] [CrossRef]
  15. Dubey, A.; Naik, N.; Parikh, D.; Raskar, R.; Hidalgo, C.A. Deep Learning the City: Quantifying Urban Perception at a Global Scale. In Proceedings of the European Conference on Computer Vision, Amsterdam, The Netherlands, 11–14 October 2016. [Google Scholar]
  16. Karndacharuk, A.; Wilson, D.J.; Dunn, R. A review of the evolution of shared (street) space concepts in urban environments. Transp. Rev. 2014, 34, 190–220. [Google Scholar] [CrossRef]
  17. Liu, M.; Han, L.; Xiong, S.; Qing, L.; Ji, H.; Peng, Y. Large-scale street space quality evaluation based on deep learning over street view image. In Proceedings of the International Conference on Image and Graphics, Beijing, China, 23–25 August 2019. [Google Scholar]
  18. Zhu, D.; Wang, N.; Wu, L.; Liu, Y. Street as a big geo-data assembly and analysis unit in urban studies: A case study using Beijing taxi data. Appl. Geogr. 2017, 86, 152–164. [Google Scholar] [CrossRef]
  19. Xing, H.; Meng, Y. Measuring urban landscapes for urban function classification using spatial metrics. Ecol. Indic. 2020, 108, 105722. [Google Scholar] [CrossRef]
  20. Ma, F.; Ren, F.; Yuen, K.F.; Guo, Y.; Zhao, C.; Guo, D. The Spatial Coupling Effect between Urban Public Transport and Commercial Complexes: A Network Centrality Perspective. Sustain. Cities Soc. 2019, 50, 101645. [Google Scholar] [CrossRef]
  21. Galea, S.; Ahern, J.; Rudenstine, S.; Wallace, Z.; Vlahov, D. Urban built environment and depression: A multilevel analysis. J. Epidemiol. Community Health 2005, 59, 822–827. [Google Scholar] [CrossRef]
  22. Carmona, M.; Gabrieli, T.; Hickman, R.; Laopoulou, T.; Livingstone, N. Street appeal: The value of street improvements. Prog. Plan. 2018, 126, 1–51. [Google Scholar] [CrossRef]
  23. Lei, Y.L.; Zhou, H.T.; Xue, L.; Yuan, L.B.; Liu, Y.G.; Wang, M.; Wang, C. Evaluating and comparing human perceptions of streets in two megacities by integrating street-view images, deep learning, and space syntax. Buildings 2024, 14, 1847. [Google Scholar] [CrossRef]
  24. Han, X.; Wang, L.; He, J.; Jung, T. Restorative perception of urban streets: Interpretation using deep learning and MGWR models. Front. Public Health 2023, 11, 1141630. [Google Scholar] [CrossRef]
  25. Jiang, Y.; Han, Y.; Liu, M.; Ye, Y. Street vitality and built environment features: A data-informed approach from fourteen Chinese cities. Sustain. Cities Soc. 2022, 79, 103724. [Google Scholar] [CrossRef]
  26. Moore, T.H.M.; Kesten, J.M.; López-López, J.A.; Ijaz, S.; McAleenan, A.; Richards, A.; Gray, S.; Savovic, J.; Audrey, S. The effects of changes to the built environment on the mental health and well-being of adults: Systematic review. Health Place 2018, 53, 237–257. [Google Scholar] [CrossRef]
  27. Luo, S.; Shang, W.; Yan, Z.; Bi, S. Research on factors influencing the style of Chinese historic districts based on the mask R-CNN deep learning model. Buildings 2024, 14, 420. [Google Scholar] [CrossRef]
  28. Ma, D.F.; Zhang, S.J.; Xiao, T.Q.; Shui, T.T. Aspects of new and old urban parks most valued by residents on social media: A case study in Hefei. Sustainability 2023, 15, 13771. [Google Scholar] [CrossRef]
  29. Meng, Y.M.; Li, Q.Y.; Yu, Y.Q.; Yue, D.; Gan, M.Q.; Wang, S.Y.; Niu, J.N.; Fukuda, H. Research on campus space features and visual quality based on street view images: A case study on the Chongshan Campus of Liaoning University. Buildings 2023, 13, 51332. [Google Scholar] [CrossRef]
  30. Kaplan, R.; Kaplan, S. The Experience of Nature: A Psychological Perspective; Cambridge University Press: Cambridge, UK, 1989. [Google Scholar]
  31. Lynch, K. The Image of the City; MIT Press: Cambridge, MA, USA, 1960; Volume 11. [Google Scholar]
  32. Porzi, L.; Rota Bul`o, S.; Lepri, B.; Ricci, E. Predicting and understanding urban perception with convolutional neural networks. In Proceedings of the 23rd ACM International Conference on Multimedia, Brisbane, Australia, 26–30 October 2015. [Google Scholar]
  33. Tuan, Y.F. Space and Place: The Perspective of Experience; University of Minnesota Press: Minneapolis, MN, USA, 1977. [Google Scholar]
  34. Ulrich, R. Aesthetic and Affective Response to Natural Environment; Plenum Press: New York, NY, USA, 1983; Volume 6, pp. 85–125. [Google Scholar]
  35. Ulrich, R. Stress recovery during exposure to natural and urban environments. J. Environ. Psychol. 1991, 11, 201–230. [Google Scholar] [CrossRef]
  36. Kaplan, S. The restorative benefits of nature: Toward an integrative framework. J. Environ. Psychol. Green Psychol. 1995, 15, 169–182. [Google Scholar] [CrossRef]
  37. Rui, J.; Li, X. Decoding vibrant neighborhoods: Disparities between formal neighborhoods and urban villages in eye-level perceptions and physical environment. Sustain. Cities Soc. 2024, 101, 105122. [Google Scholar] [CrossRef]
  38. Sayers, J.M.; Cleary, M.; Hunt, G.E.; Burmeister, O.K. Service and infrastructure needs to support recovery programmes for Indigenous community mental health consumers. Int. J. Ment. Health Nurs. 2017, 26, 142–150. [Google Scholar] [CrossRef] [PubMed]
  39. Silva, M.G.E.; Remoaldo, P.; Peluso, M.L. Human values and tourism perception: A new approach in residents’ perceptions. Curr. Issues Tour. 2024, 28, 353–358. [Google Scholar] [CrossRef]
  40. Cresswell, T. Place: An Introduction, 2nd ed.; Wiley: Chichester, UK, 2014; pp. 165–190. [Google Scholar]
  41. Jeon, J.Y.; Jo, H.I. Effects of audio-visual interactions on soundscape and landscape perception and their influence on satisfaction with the urban environment. Build. Environ. 2020, 169, 106544. [Google Scholar] [CrossRef]
  42. Farias, J.C.; Lopes, A.D.; Mota, J.; Santos, M.P.; Ribeiro, J.C.; Hallal, P.C. Perception of the social and built environment and physical activity among Northeastern Brazil adolescents. Prev. Med. 2011, 52, 114–119. [Google Scholar]
  43. Jack, E.; McCormack, G.R. The associations between objectively-determined and self-reported urban form characteristics and neighborhood-based walking in adults. Int. J. Behav. Nutr. Phys. Act. 2014, 11, 71. [Google Scholar] [CrossRef]
  44. Polat, A.T.; Akay, A. Relationships between the visual preferences of urban recreation area users and various landscape design elements. Urban For. Urban Green. 2015, 14, 573–582. [Google Scholar] [CrossRef]
  45. Wu, Z.F.; Ren, Y. The influence of greenspace characteristics and building configuration on depression in the elderly. Build. Environ. 2021, 188, 107477. [Google Scholar]
  46. Gascon, M.; Sánchez-Benavides, G.; Dadvand, P.; Martínez, D.; Gramunt, N.; Gotsens, X.; Cirach, M.; Vert, C.; Molinuevo, J.L.; Crous-Bou, M.; et al. Long-term exposure to residential green and blue spaces and anxiety and depression in adults: A cross-sectional study. Environ. Res. 2018, 162, 231–239. [Google Scholar] [CrossRef]
  47. Song, L.Y.; Zhang, A.; Hu, Z.W. Greenspace exposure is conducive to the resilience of public sentiment during the COVID-19. Health Place 2023, 83, 103096. [Google Scholar] [CrossRef]
  48. Sun, D.; Li, Q.Y.; Gao, W.J.; Huang, G.H.; Tang, N.; Lyu, M.; Yu, Y.Q. On the relation between visual quality and landscape characteristics: A case study application to the waterfront linear parks in Shenyang, China. Environ. Res. Commun. 2021, 3, 115013. [Google Scholar] [CrossRef]
  49. Nasar, J.L. Urban design aesthetics: The evaluative qualities of building exteriors. Environ. Behav. 1994, 26, 377. [Google Scholar] [CrossRef]
  50. Huang, G.H.; Yu, Y.Q.; Lyu, M.; Sun, D.; Zeng, Q.; Bart, D. Using google street view panoramas to investigate the influence of urban coastal street environment on visual walkability. Environ. Res. Commun. 2023, 5, 065017. [Google Scholar] [CrossRef]
  51. Kawshalya, L.W.G.; Weerasinghe, U.G.D.; Chandrasekara, D.P. The impact of visual complexity on perceived safety and comfort of the users: A study on urban streetscape of Sri Lanka. PLoS ONE 2022, 17, e0272074. [Google Scholar] [CrossRef] [PubMed]
  52. Dillon, R. Designing urban space for psychological comfort: The Kentish Town Road project. J. Public Ment. Health 2005, 4, 10–20. [Google Scholar] [CrossRef]
  53. Park, Y.; Garcia, M. Pedestrian safety perception and urban street settings. Int. J. Sustain. Transp. 2020, 14, 860–871. [Google Scholar] [CrossRef]
  54. Liu, M.; Jiang, Y.; He, J.L. Quantitative evaluation on street vitality: A case study of Zhoujiadu Community in Shanghai. Sustainability 2021, 13, 3027. [Google Scholar] [CrossRef]
  55. Larkin, A.; Gu, X.; Chen, L.Z.; Hystad, P. Predicting perceptions of the built environment using GIS, satellite and street view image approaches. Landsc. Urban Plan. 2021, 216, 104257. [Google Scholar] [CrossRef]
  56. Zhang, J.X.; Yu, Z.L.; Li, Y.Q.; Wang, X.Q. Uncovering Bias in Objective Mapping and Subjective Perception of Urban Building Functionality: A Machine Learning Approach to Urban Spatial Perception. Land 2023, 12, 1322. [Google Scholar] [CrossRef]
  57. Lee, J.; Kim, D.; Park, J. A machine learning and computer vision study of the environmental characteristics of streetscapes that affect pedestrian satisfaction. Sustainability 2022, 14, 5730. [Google Scholar] [CrossRef]
  58. Ma, X.Y.; Ma, C.Y.; Wu, C.; Xi, Y.L.; Yang, R.F.; Peng, N.Y.Z.; Zhang, C.; Ren, F. Measuring human perceptions of streetscapes to better inform urban renewal: A perspective of scene semantic parsing. Cities 2021, 110, 103086. [Google Scholar] [CrossRef]
  59. Li, X.J.; Ratti, C.; Seiferling, I. Quantifying the shade provision of street trees in urban landscape: A case study in Boston, USA, using Google Street View. Landsc. Urban Plan. 2018, 169, 81–91. [Google Scholar] [CrossRef]
  60. Lu, Y. Using Google Street View to investigate the association between street greenery and physical activity. Landsc. Urban Plan. 2019, 191, 103435. [Google Scholar] [CrossRef]
  61. Harvey, C.; Aultman-Hall, L.; Hurley, S.E.; Troy, A. Effects of skeletal streetscape design on perceived safety. Landsc. Urban Plan. 2015, 142, 18–28. [Google Scholar] [CrossRef]
  62. Li, X.J.; Cai, B.; Ratti, C. Using Street-level Images and Deep Learning for Urban Landscape Studies. Landsc. Archit. Front. 2018, 6, 20. [Google Scholar] [CrossRef]
  63. Zhou, H.; He, S.; Cai, Y.; Wang, M.; Su, S. Social inequalities in neighborhood visual walk ability: Using street view imagery and deep learning technologies to facilitate healthy city planning. Sustain. Cities Soc. 2019, 50, 101605. [Google Scholar] [CrossRef]
  64. Wu, B.; Yu, B.; Shu, S.; Liang, H.; Zhao, Y.; Wu, J. Mapping fine-scale visual quality distribution inside urban streets using mobile LiDAR data. Build. Environ. 2021, 206, 108323. [Google Scholar] [CrossRef]
  65. Orzechowska-Szajda, I. Classification model ofurban riverside landscape using the oder river as an example. Pol. J. Environ. Stud. 2019, 29, 205–215. [Google Scholar] [CrossRef]
  66. Wang, L.; Han, X.; He, J.; Jung, T. Measuring residents’ perceptions of city streets to inform better street planning through deep learning and space syntax. ISPRS J. Photogramm. Remote Sens. 2022, 190, 215–230. [Google Scholar] [CrossRef]
  67. Tang, Y.W.; Zhang, J.X.; Liu, R.J.; Li, Y.Q. Exploring the impact of built environment attributes on social followings using social media data and deep learning. ISPRS Int. J. Geo-Inf. 2022, 11, 325. [Google Scholar] [CrossRef]
  68. Ames, D.L. The new urbanism: Toward an architecture of community. J. Urban Aff. 2002, 24, 118–122. [Google Scholar]
  69. Miller, B. In place out of place: Geography, ideology, and transgression. Ann. Assoc. Am. Geogr. 1998, 88, 737–739. [Google Scholar]
  70. Montello, D.R.; Goodchild, M.F.; Gottsegen, J.; Fohl, P. Where’s downtown?: Behavioral methods for determining referents of vague spatial queries. Spat. Cogn. Comput. 2003, 3, 185–204. [Google Scholar]
  71. Santosa, H.; Ernawati, J.; Wulandari, L.D. Visual quality evaluation of urban commercial streetscape for the development of landscape visual planning system in provincial street corridors in Malang, Indonesia. IOP Conf. Ser. Earth Environ. Sci. 2018, 126, 012202. [Google Scholar] [CrossRef]
  72. Zhang, F.; Zhou, B.L.; Liu, L.; Liu, Y.; Fung, H.H.; Lin, H.; Ratti, C. Measuring human perceptions of a large-scale urban region using machine learning. Landsc. Urban Plan. 2018, 180, 148–160. [Google Scholar] [CrossRef]
  73. Kacha, L.; Matsumoto, N.; Mansouri, A. Electrophysiological evaluation of perceived complexity in streetscapes. J. Asian Archit. Build. Eng. 2015, 14, 585–592. [Google Scholar] [CrossRef]
  74. Sun, D.; Zhou, F.J.; Lin, J.J.; Yang, Q.R.; Lyu, M. A study on landscape feature and emotional perception evaluation of waterfront greenway. Environ. Res. Commun. 2024, 6, 095023. [Google Scholar] [CrossRef]
  75. Yao, Y.; Liang, Z.T.; Yuan, Z.H.; Liu, P.H.; Bie, Y.P.; Zhang, J.B.; Wang, R.Y.; Wang, J.L.; Guan, Q.F. A human-machine adversarial scoring framework for urban perception assessment using street-view images. Int. J. Geogr. Inf. Sci. 2019, 33, 2363–2384. [Google Scholar] [CrossRef]
  76. Mouratidis, K. Urban planning and quality of life: A review of pathways linking the built environment to subjective well-being. Cities 2021, 115, 103229. [Google Scholar] [CrossRef]
  77. Wang, R.; Ren, S.; Zhang, J.; Yao, Y.; Wang, Y.; Guan, Q. A comparison of two deep-learning-based urban perception models: Which one is better? Comput. Urban Sci. 2021, 1, 3. [Google Scholar] [CrossRef]
  78. Tang, L.; Ding, W.W. Linking the signs on street façades to the characteristics of street space. Archit. J. 2015, 2, 18–22. [Google Scholar]
  79. Ewing, R.; Cervero, R. Travel and the built environment: A synthesis (with discussion). Transp. Res. Rec. 2001, 1780, 87–114. [Google Scholar] [CrossRef]
  80. Zhao, J.W.; Luo, P.J.; Wang, R.H.; Cai, Y.L. Correlations between aesthetic preferences ofriver and landscape characters. J. Environ. Eng. Landsc. Manag. 2013, 21, 123–132. [Google Scholar] [CrossRef]
  81. Ye, Y.; Zhang, Z.X.; Zhang, X.H.; Zeng, W. Human-scale quality on streets: A large-scale and efficient analytical approach based on street view images and new urban analytical tools. Urban Plan. Int. 2019, 34, 18–27. [Google Scholar] [CrossRef]
  82. Liu, Y.; Liu, X.; Gao, S.; Gong, L.; Kang, C.G.; Zhi, Y.; Chi, G.H.; Shi, L. Social sensing: A new approach to understanding our socioeconomic environments. Ann. Assoc. Am. Geogr. 2015, 105, 512–530. [Google Scholar] [CrossRef]
  83. Lyu, M.; Meng, Y.M.; Gao, W.J.; Yu, Y.Q.; Ji, X.; Li, Q.Y.; Huang, G.H.; Sun, D. Measuring the perceptual features of coastal streets: A case study in Qingdao, China. Environ. Res. Commun. 2022, 4, 115002. [Google Scholar] [CrossRef]
  84. Gong, F.Y.; Zeng, Z.C.; Zhang, F.; Li, X.J.; Ng, E.; Norford, L.K. Mapping sky, tree, and building view factors of street canyons in a high-density urban environment. Build. Environ. 2018, 134, 155–167. [Google Scholar] [CrossRef]
  85. Helbich, M.; Yao, Y.; Liu, Y.; Zhang, J.B.; Liu, P.H.; Wang, R.Y. Using deep learning to examine street view green and blue spaces and their associations with geriatric depression in Beijing, China. Environ. Int. 2019, 126, 107–117. [Google Scholar] [CrossRef]
  86. Meng, Y.M.; Shi, J.X.; Lyu, M.; Sun, D.; Fukuda, H. Research into the Influence Mechanisms of Visual-Comfort and Landscape Indicators of Urban Green Spaces. Land 2024, 13, 1688. [Google Scholar] [CrossRef]
  87. Sun, D.; Ji, X.; Gao, W.J.; Zhou, F.J.; Yu, Y.Q.; Meng, Y.M.; Yang, M.Q.; Lin, J.J.; Lyu, M. The Relation between Green Visual Index and Visual Comfort in Qingdao Coastal Streets. Buildings 2023, 13, 457. [Google Scholar] [CrossRef]
  88. Yao, Y.; Wang, J.L.; Hong, Y.; Qian, C.; Guan, Q.F.; Liang, X.; Dai, L.Y.; Zhang, J.B. Discovering the homogeneous geographic domain of human perceptions from street view images. Landsc. Urban Plan. 2021, 212, 104125. [Google Scholar] [CrossRef]
  89. Sun, D.; Ji, X.; Lyu, M.; Fu, Y.; Gao, W.J. Evaluation and diagnosis for the pedestrian quality of service in urban riverfront streets. J. Clean. Prod. 2024, 452, 142090. [Google Scholar] [CrossRef]
  90. Lyu, M.; Lin, J.J.; Zhou, F.J.; Niu, J.N.; Sun, D.; Meng, Y.M.; Ji, X. A method for evaluating the visual quality of wetland park landscapes: A case study of qianlu lake wetland park in Wuping, China. Environ. Res. Commun. 2024, 6, 105024. [Google Scholar] [CrossRef]
  91. Kido, D.; Fukuda, T.; Yabuki, N. Assessing future landscapes using enhanced mixed reality with semantic segmentation by deep learning. Adv. Eng. Inform. 2021, 48, 101281. [Google Scholar] [CrossRef]
  92. Tang, J.X.; Long, Y. Measuring visual quality of street space and its temporal variation: Methodology and its application in the Hutong area in Beijing. Landsc. Urban Plan. 2019, 191, 103436. [Google Scholar] [CrossRef]
  93. Shen, Q.; Zeng, W.; Ye, Y.; Arisona, S.M.; Schubiger, S.; Burkhard, R.; Qu, H. StreetVizor: Visual Exploration of Human-Scale Urban Forms Based on Street Views. In Proceedings of the IEEE Transactions on Visualization and Computer Graphics, Phoenix, AZ, USA, 1–6 October 2017. [Google Scholar]
  94. Zhang, Y.L.; Dong, R.C. Iimpacts of street-visible greenery on housing prices: Evidence from a hedonic price model and a massive street view image dataset in Beijing. ISPRS Int. J. Geo-Inf. 2018, 7, 104. [Google Scholar] [CrossRef]
  95. He, J.L.Y.; Zhang, J.B.; Yao, Y.; Li, X. Extracting human perceptions from street view images for better assessing urban renewal potential. Cities 2023, 134, 104189. [Google Scholar] [CrossRef]
  96. Li, Y.Q.; Yabuki, N.; Fukuda, T. Measuring visual walkability perception using panoramic street view images, virtual reality, and deep learning. Sustain. Cities Soc. 2022, 86, 104140. [Google Scholar] [CrossRef]
  97. Li, Y.Q.; Yabuki, N.; Fukuda, T.; Zhang, J.X. A big data evaluation of urban street walkability using deep learning and environmental sensors a case study around Osaka University Suita campus. In Proceedings of the International Conference on Education and Research in Computer Aided Architectural Design in Europe, Berlin, Germany, 6 November 2024. [Google Scholar]
  98. Li, X.; Zhang, C.R.; Li, W.D.; Kuzovkina, Y.A.; Weiner, D. Who lives in greener neighborhoods? The distribution of street greenery and its association with residents’ socioeconomic conditions in Hartford, Connecticut, USA. Urban For. Urban Green. 2015, 14, 751–759. [Google Scholar] [CrossRef]
  99. Rahman, A.K.M.M.; Zaber, M.; Cheng, Q.W.; Nayem, A.B.S.; Sarker, A.; Paul, O.; Shibasaki, R. Applying State-of-the-Art Deep-Learning Methods to Classify Urban Cities of the Developing World. Sensors 2021, 21, 7469. [Google Scholar] [CrossRef]
  100. Chen, Y.X.; Zhang, Q.L.; Deng, Z.; Fan, X.R.; Xu, Z.M.; Kang, X.D.; Pan, K.L.; Guo, Z.H. Research on green view index of urban roads based on street view image recognition: A case study of changsha downtown areas. Sustainability 2022, 14, 16063. [Google Scholar] [CrossRef]
  101. Meng, Y.M.; Sun, D.; Lyu, M.; Niu, J.N.; Fukuda, H. Measuring human perception of residential built environment through street view image and deep learning. Environ. Res. Commun. 2024, 6, 055020. [Google Scholar] [CrossRef]
  102. Wu, C.; Peng, N.; Ma, X.; Li, S.; Rao, J. Assessing multiscale visual appearance characteristics of neighbourhoods using geographically weighted principal component analysis in Shenzhen, China. Comput. Environ. Urban Syst. 2020, 84, 101547. [Google Scholar] [CrossRef]
  103. Yang, J.Y.; Li, X.M.; Du, J.; Cheng, C.H. Exploring the relationship between urban street spatial patterns and street vitality: A case study of Guiyang, China. Int. J. Environ. Res. Public Health 2023, 20, 1646. [Google Scholar] [CrossRef] [PubMed]
  104. Taylor, N. The aesthetic experience of traffic in the modern city. Urban Stud. 2003, 40, 1609–1625. [Google Scholar] [CrossRef]
  105. Wong, M.S.; Nichol, J.; Ng, E. A study of the “wall effect” caused by proliferation of high-rise buildings using GIS techniques. Landsc. Urban Plan 2011, 102, 245–253. [Google Scholar] [CrossRef]
  106. Fleming, C.M.; Manning, M.; Ambrey, C.L. Crime, greenspace and life satisfaction: An evaluation of the New Zealand experience. Landsc. Urban Plan. 2016, 149, 1–10. [Google Scholar] [CrossRef]
  107. Zhang, Y.; Van den Berg, A.E.; Van Dijk, T.; Weitkamp, G. Quality over quantity: Contribution of urban green space to neighborhood satisfaction. Int. J. Environ. Res. Public Health 2017, 14, 535. [Google Scholar] [CrossRef]
  108. Vries, S.D.; Verheij, R.A.; Groenewegen, P.P.; Spreeuwenberg, P. Natural environments: Healthy environments? An exploratory analysis of the relationship between greenspace and health. Environ. Plan. A Econ. Space 2003, 35, 1717–1731. [Google Scholar] [CrossRef]
  109. Wang, R.; Lu, Y.; Zhang, J.; Liu, P.; Yao, Y.; Liu, Y. The relationship between visual enclosure for neighbourhood street walkability and elders’ mental health in China. J. Transp. Health 2019, 13, 90–102. [Google Scholar] [CrossRef]
  110. Wolf, K.L. Business district streetscapes, trees, and consumer response. J. For. 2005, 103, 396–400. [Google Scholar] [CrossRef]
  111. Duan, J.P.; Liao, J.J.; Liu, J.; Gao, X.X.; Shang, A.L.; Huang, Z.H. Evaluating the spatial quality of urban living streets: A case study of Hengyang city in central south China. Sustainability 2023, 15, 10623. [Google Scholar] [CrossRef]
  112. Hamim, O.F.; Ukkusuri, S.V. Towards safer streets: A framework for unveiling pedestrians’ perceived road safety using street view imagery. Accid. Anal. Prev. 2024, 195, 107400. [Google Scholar] [CrossRef] [PubMed]
  113. Nordbø, E.C.A.; Nordh, H.; Raanaas, R.K.; Aamodt, G. GIS-derived measures of the built environment determinants of mental health and activity participation in childhood and adolescence: A systematic review. Landsc. Urban Plan. 2018, 177, 19–37. [Google Scholar] [CrossRef]
  114. Ji, Q.; Yin, M.; Li, Y.; Zhou, X. Exploring the influence path of high-rise residential environment on the mental health of the elderly. Sustain. Cities Soc. 2023, 98, 104808. [Google Scholar] [CrossRef]
  115. Farahani, M.; Razavi-Termeh, S.V.; Sadeghi-Niaraki, A.; Choi, S.M. A hybridization of spatial modeling and deep learning for people’s visual perception of urban landscapes. Sustainability 2023, 15, 10403. [Google Scholar] [CrossRef]
  116. Jacobs, J. The Death and Life of Great American Cities; Vintage: New York, NY, USA, 1992. [Google Scholar]
  117. Xu, L.; Jiang, W.; Chen, Z. Study on perceived safety in public spaces: Take perception of stree view in shanghai as an example research on the sense of security in public space. Landsc. Archit. 2018, 25, 23–29. [Google Scholar]
  118. Si, R.; Lin, Y.; Xiao, Z.; Ye, Y. Spatio-temporal analysis of built environment and street vitality relationship based on street-level imagery: A case study of Futian District, Shenzhen. Sci. Geogr. Sin. 2021, 41, 1536–1545. [Google Scholar]
  119. Wang, L.; Zhou, Y.; Wang, F.; Ding, L.; Love, P.E.; Li, S. The influence of the built environment on people’s mental health: An empirical classification of causal factors. Sustain. Cities Soc. 2021, 74, 103185. [Google Scholar] [CrossRef]
  120. Li, Y.C.; Peng, L.; Wu, C.W.; Zhang, J.Z. Street view imagery (SVI) in the built environment: A theoretical and systematic review. Buildings 2022, 12, 1167. [Google Scholar] [CrossRef]
  121. Rapoport, A. The Meaning of the Built Environment: A Nonverbal Communication Approach; University of Arizona Press: Tucson, AZ, USA, 1990. [Google Scholar]
  122. Gehl, J. Cities for People; Island Press: Washington, DC, USA, 2010. [Google Scholar]
  123. Zhang, F.; Salazar-Miranda, A.; Duarte, F.; Vale, L.; Hack, G.; Chen, M. Urban visual intelligence: Studying cities with artificial intelligence and street-level imagery. J. Plan. Lit. 2024, 39, 453. [Google Scholar] [CrossRef]
Figure 1. Study area and location of of Changbai Island.
Buildings 15 01524 g001
Figure 2. Experimental flow chart.
Buildings 15 01524 g002
Figure 3. The sample point panoramic view and BSV image.
Buildings 15 01524 g003
Figure 4. Examples of semantic segmentation.
Buildings 15 01524 g004
Figure 5. Spatial distribution maps of physical characteristics: (a) natural to artificial ratio of the vertical interface; (b) walkable streets; (c) vehicle occurrence rate; (d) building enclosure; (e) green visual index; (f) openness; (g) pedestrians. (Clear diagrams have been placed in Appendix A).
Buildings 15 01524 g005
Figure 6. Spatial distribution maps of perception features: (a) beauty; (b) safety; (c) boredom; (d) liveliness. (Clear diagrams have been placed in Appendix B).
Buildings 15 01524 g006aBuildings 15 01524 g006b
Figure 7. Regression standardized residuals for beauty perception.
Buildings 15 01524 g007
Figure 8. Regression standardized residuals for safety perception.
Buildings 15 01524 g008
Figure 9. Regression standardized residuals for liveliness perception.
Buildings 15 01524 g009
Figure 10. Regression standardized residuals for boredom perception.
Buildings 15 01524 g010
Table 1. Description of street classification.
Street Functional TypeDescriptionTypical Road Section
Transportation streetTransportation streets are characterized by continuous closed interfaces. These streets prioritize maximizing motor vehicle movement efficiency, focusing on facilities such as bus lanes.Example: 2, 7, 22, 38, 70
Residential streetResidential streets serve as composite functional spaces dominated by residential use, where citizens’ daily life and activities are concentrated. These streets constitute linear public space systems anchored by small- and medium-sized commercial services, cultural stations, and public facilities.Example: 1, 3, 4, 5, 76, 78, 8, 9
Commercial streetCommercial streets are linear public spaces where commercial activities—such as retail, dining, and office uses—predominate, characterized by distinct service capacities or industrial clusters.Example: 99, 94, 45, 48
Comprehensive streetComprehensive streets exhibit diverse functions and activities along the roadway, integrating the characteristics of two or more street types (e.g., commercial, lifestyle services, transportation, and landscape–recreation).Example: 52, 62, 64, 67, 69, 68, 31
Table 2. Physical features of street space.
Physical IndicatorsFormulaInterpretationDefinition
Green visual index G V I = 1 n i = 1 n T 1 i + 1 n i = 1 n V 1 i i ( 1,2 , , n ) V1i and T1i denote the proportions of vegetation and terrain pixels, respectively.
n is the number of BSV images of a sample point.
It refers to the ratio of tree and grass pixels to the
overall pixels.
Openness O P = 1 n i = 1 n S 1 i i ( 1,2 , , n ) S1i denotes the proportion of sky pixels; the sum indicates the total number of sky pixels in each image.It refers to the open degree in the coastal interface.
Walkable streets W S = 1 n i = 1 n P 1 i + 1 n i = 1 n F 1 i + 1 n i = 1 n R 1 i i ( 1,2 , , n ) P1i denotes the proportion of pavement pixels; F1i denotes the proportion of fence pixels; R1i denotes
the proportion of road pixels.
It refers to the ratio of walkable street pixels to the
overall pixels.
Vehicle occurrence rate V O R = 1 n i = 1 n C 1 i + 1 n i = 1 n T 2 i + 1 n i = 1 n B 1 i + 1 n i = 1 n T 3 i 1 n i = 1 n R 1 i
i ( 1,2 , , n )
C1i denotes the proportion of car pixels; T2i denotes
the proportion of truck pixels; B1i denotes the pro-
portion of bus pixels; T3i denotes the proportion of
train pixels; R1i denotes the proportion of road pixels.
It refers to the proportion of vehicle attendance in the
road space.
Natural to artificial ratio
of the vertical
interface
V I = 1 n i = 1 n T I i 1 n i = 1 n B 2 i i ( 1,2 , , n ) T1i denotes the proportion of tree pixels; B2i denotes
the proportion of building pixels.
It refers to the ratio of natural pixels to artificial
pixels in the vertical interface.
Pedestrians P R = 1 n i = 1 n P 3 i i ( 1,2 , , n ) P3i denotes the proportion of pedestrian pixels; the
sum indicates the total number of pedestrian pixelsin each image.
It refers to the ratio of pedestrian pixels to the overall
street space pixels, including riders and standing or sitting
pedestrians.
Building enclosure B E = 1 n i = 1 n B 2 i i ( 1,2 , , n ) B2i denotes
the proportion of building pixels.
It refers to the ratio of building pixels to the overall pixels.
Table 3. Perceptual feature profiles of Changbai Island Street.
Human PerceptionMinimumMinimumMeanStandard Deviation
Beauty0.1810.8730.4110.201
Boredom0.3140.6260.4140.073
Safety0.2400.8240.4540.172
Liveliness0.2530.8460.6610.140
Table 4. Perceptual feature profiles of different street types in Changbai Island.
Human PerceptionResidential StreetsTransportation StreetsCommercial StreetsComprehensive Streets
MeanStandard DeviationMeanStandard DeviationMeanStandard DeviationMeanStandard Deviation
Beauty0.4290.2240.3950.18450.3890.22190.3960.175
Boredom0.3780.0420.4990.08420.3590.0260.4310.063
Safety0.4700.1950.4240.1510.4430.1810.4500.150
Liveliness0.7240.0820.4890.1600.7710.0250.6410.123
Table 5. Correlation analysis.
Perceived FeaturesBeautySafetyLivelinessBoredom
1. Green visual index (GVI)0.804 **0.793 **0.024−0.042
2. Vehicle occurrence rate (VOR)0.011−0.0060.279 **−0.326 **
3. Natural to artificial ratio
of the vertical
interface (VI)
0.345 **0.362 **0.701 **−0.742 **
4. Walkable streets (WS)0.003−0.032−0.024−0.04
5. Openness (OP)−0.285 **−0.318 **−0.763 **0.783 **
6. Pedestrians (PR)0.0070.0130.180 **−0.196 **
7. Building enclosure (BE)−0.550 **−0.522 **0.498 **−0.508 **
** Significant correlation at the 0.01 level.
Table 6. Regression analysis of beauty perception and physical characteristics.
Model Unstandardized Coefficients Standardized CoefficientstSig.VIFAdjusted R SquareF-Sig.
BStd. ErrorBeta
3(Constant)−0.3520.273 −1.2920.197 0.6530.000
1. Green visual index
(GVI)
4.7380.4140.64111.45208.605
5. Openness (OP)−2.1060.504−0.177−4.17904.946
7. Building enclosure (BE)−1.2810.471−0.16−2.7180.0079.504
Dependent Variable: Beauty
Table 7. Regression analysis of safety perception and physical characteristics.
Model Unstandardized Coefficients Standardized CoefficientstSig.VIFAdjusted R SquareF-Sig.
BStd. ErrorBeta
3(Constant)−0.1050.277 −0.380.704 0.6430.000
1. Green visual index (GVI)4.3820.4190.59310.44708.605
5. Openness (OP)−2.7910.511−0.235−5.46404.946
3. Natural to artificial ratio
of the vertical
interface (VI)
−1.5230.478−0.19−3.1870.0019.504
Dependent Variable: Safety
Table 8. Regression analysis of liveliness perception and physical characteristics.
Model Unstandardized Coefficients Standardized CoefficientstSig.VIFAdjusted R SquareF-Sig.
BStd. ErrorBeta
4(Constant)0.8560.075 11.3390 0.6280.000
5. Openness (OP)−7.8050.261−0.657−29.94401.236
7. Building enclosure (BE)1.7270.1760.2169.78301.246
2. Vehicle occurrence rate (VOR)0.1530.0640.052.3890.0171.111
6. Pedestrians (PR)10.7465.3610.042.0040.0451.035
Dependent Variable: Liveliness
Table 9. Regression analysis of boredom perception and physical characteristics.
Model Unstandardized Coefficients Standardized CoefficientstSig.VIFAdjusted R SquareF-Sig.
BStd. ErrorBeta
5(Constant)0.1290.308 0.4180.676 0.6710.000
5. Openness (OP)6.1850.590.52110.48907.155
7. Building enclosure (BE)−1.6770.166−0.209−10.10101.247
2. Vehicle occurrence rate (VOR)−0.30.06−0.097−4.96801.112
3. Natural to artificial ratio
of the vertical
interface (VI)
−1.5530.479−0.157−3.2410.0016.811
6. Pedestrians (PR)−14.2255.042−0.053−2.8210.0051.035
Dependent Variable: Boredom
Disclaimer/Publisher’s Note: The statements, opinions and data contained in all publications are solely those of the individual author(s) and contributor(s) and not of MDPI and/or the editor(s). MDPI and/or the editor(s) disclaim responsibility for any injury to people or property resulting from any ideas, methods, instructions or products referred to in the content.

