Article

Evaluating and Diagnosing Urban Function and Perceived Quality Based on Multi-Source Data and Deep Learning Using Dalian as an Example

1
Faculty of Environmental Engineering, The University of Kitakyushu, Kitakyushu 808-0135, Japan
2
School of Design and Art, Shenyang Jianzhu University, Shenyang 110168, China
3
School of Architecture and Urban Planning, Shenyang Jianzhu University, Shenyang 110168, China
*
Author to whom correspondence should be addressed.
Buildings 2025, 15(7), 998; https://doi.org/10.3390/buildings15070998
Submission received: 26 February 2025 / Revised: 14 March 2025 / Accepted: 19 March 2025 / Published: 21 March 2025

Abstract

Currently, coordinated development in terms of perceived urban quality and function has become a key problem. However, there is an imbalance between the street environment and urban amenities. It is necessary to explore the current status and propose optimization strategies to promote the coordinated development of urban spaces. Dalian, China, was selected as the study area. Based on space syntax, high-accessibility and low-accessibility streets were selected as study sites. An evaluation system was constructed as part of the study. It included the urban function and perceived street quality. Data on the density and diversity of urban amenities were obtained by establishing points of interest (POIs). The subjective and psychological perception of quality was calculated using street view images (SVIs). Then, a coupling analysis based on the urban function and perceived quality was conducted as part of the study. The results indicated that there were differences in the development levels of urban amenities and in regard to spatial quality in Dalian. Specifically, high-accessibility streets and urban amenities were mainly concentrated in the central urban area. The perceived quality of high-accessibility streets was higher than low-accessibility streets. The coupling analysis found that high-accessibility and low-accessibility streets had the highest proportions of advantage streets and opportunity streets. The urban amenities and subjective perception of quality were the highest in regard to advantage streets. The perception of beauty was the lowest in regard to maintenance streets. The psychological perception was the highest among improvement streets. Openness was the highest in regard to opportunity streets. As a result of the coupling analysis, this study not only helps to optimize the layout of urban amenities and improve the quality of the street environment, but also provides practical guidance for future urban design. Additionally, the results of this study will help to promote the coordinated development of street environments and urban amenities and enhance the overall livability and spatial quality of the urban environment.

1. Introduction

Urban amenities and perceived quality represent urban vitality and environmental quality, respectively [1]. Urban amenities play an important role in determining the quality of life, experiences, livability, and well-being of residents [2,3]. The availability and accessibility of urban amenities are helpful for enhancing the quality of urban life [4]. However, due to the differences in urban development, the accessibility of urban amenities is limited in certain areas [5,6]. Improving the uneven distribution of urban functions is an essential strategy to construct healthier and more livable urban development [7]. The perceived quality of streets directly affects the accessibility and attractiveness of amenities [8]. A comfortable, beautiful, and safe street environment could attract more pedestrian and commercial activities, promoting economic development [9].
Coastal cities have rich natural environments and economic conditions, leading to a high population density and high levels of urbanization [10]. Therefore, these cities attract large numbers of tourists. Urban amenities are required that have a high density and diversity, such as entertainment, education, transportation, and shopping facilities [11,12]. The provision of comprehensive urban amenities and a high level of perceived quality in terms of those amenities could meet the needs of tourists and residents. They are helpful for enhancing the livability and attractiveness of the city [13,14].
Currently, cities are facing some problems as follows: (1) the distribution of urban amenities is uneven; (2) the existing density of transportation and public services is insufficient to meet the needs of tourists and residents; and (3) there are some perceived quality problems in terms of streets, including a lack of aesthetic qualities and uniqueness, poorly designed sidewalks, and low levels of greening.
Scholars initially quantified street accessibility in terms of street connectivity. Street space quality was quantified according to objective perceptions, such as road density, greening, and building density. Space quality could influence human psychological perceptions of the street environment. Then, some scholars quantified psychological perceptions such as safety, comfort, imageability, complexity, and transparency. Meanwhile, they explored the influence of the mechanisms between objective perception and psychological perception. A high-quality street environment not only affects residents’ daily walking experiences, but also enhances social interactions and contributes to the urban image. Urban amenities serve as the core support for urban functions. Their density and diversity affect residents’ living convenience and space utilization efficiency. In regard to urban planning and spatial optimization, it is hard to reveal the complexity of the urban environment using single-dimensional analysis. Therefore, this study conducted a coupled analysis of perceived quality, urban amenities, and accessibility. It helps to enable a more scientific and systematic assessment of the rationality of urban planning. Additionally, the results of this study could help to develop optimization strategies for urban governance and planning.
Urban amenities provide urban functions for residents, such as residential, educational, office, commercial, leisure, entertainment, and health services [15,16]. They are essential parts of daily life [17]. The density and diversity of urban amenities play a crucial role in enhancing the livability and attractiveness of cities. Previous studies have shown that multifunctional facilities can attract residents, thereby stimulating demand for services and, thus, attracting more residents [18,19]. Meanwhile, they enhance unban vitality [20]. Some street environment factors encourage people to travel and take part in social activities, such as mixed land use [21], parks [22], and sports services [23]. These factors are helpful for promoting human physical and mental well-being [24,25]. In previous studies, scholars have explored urban amenities from different perspectives, such as in regard to spatial distribution, equity [26,27], accessibility effects [28,29], and economic impacts [30].
Furthermore, the urban function and perceived street quality can together promote public travel [31]. Some design qualities can influence the walking environment and human perception, such as street design, safety, and land use [32,33]. Previous studies have shown that visual is crucial for spatial perception [34]. It plays an important role in street space quality. Some landscape elements are associated with the perceived quality of streets, such as buildings, walls, greening, and walking spaces [35,36,37]. Additionally, a street’s spatial features, like greenery and openness, can promote positive spatial perceptions [38,39]. For example, Ewing evaluated street design quality using five perceptual features, imageability, enclosure, transparency, human scale, and complexity [40,41].
Accessibility is the most common measure used to evaluate the equity of urban amenities [42]. Street accessibility affects people’s access to convenient facilities [17]. In previous studies, space syntax theory has been widely used to measure street accessibility [43]. Spatial syntax is an important theory in regard to urban morphology for describing and analyzing the urban space and human activities [44,45]. In the 1970s, it was introduced by Bill Hillier. Since then, this theory has been widely applied in some fields, such as architecture [46], the urban environment [47], and spatial planning [48]. Some scholars have used this theory to research street accessibility [49,50], spatial structures [51], space syntax, and big data [52,53]. For example, based on space syntax and points of interest (POIs), Wang et al. explored the relationship between street accessibility and urban amenities, from the city scale to the street scale [54]. Furthermore, spatial syntax and Geographic Information Systems (GIS) could enhance the expressive capability of spatial syntax analysis [55].
The core urban area in Dalian, China, is selected as the study site. The POIs are used to quantify the density and diversity of the urban amenities. Then, an evaluation system is established to assess street perception quality from both psychological and objective perspectives. The streets are divided into four types according to their urban function and perceived quality. This study analyzes urban function and perceived quality according to different levels of accessibility and proposes corresponding optimization strategies. The Section 2 in this paper introduces the review of urban function and perceived quality in the literature, and the relevant quantitative methods. Section 3, the research framework is introduced, as well as the evaluation systems, data sources, and analysis methods. Section 4 and Section 5 present the results and discussion. This study analyzes the spatial distribution of urban amenities and perceived quality. Meanwhile, the study diagnoses problems with different types of streets and proposes optimization strategies. Finally, the study concludes with a presentation of the findings and its contributions.

2. Literature Review

2.1. Study of Urban Function and Perceived Quality

Previous studies have shown that the spatial distribution of urban amenities has a significant impact on residents’ quality of life, accessibility, and travel patterns [56]. Urban amenities include green public space [57], shopping services [58], transportation services [59,60], and cultural services [61]. Transportation services are one of the built environment factors that can encourage walking and reduce automobile use [62,63]. Shopping services are essential to support the sustainability of daily life [64]. Public services mainly refer to green spaces and open spaces in the city. Green public spaces are fundamental elements of the built environment and are essential public services [65,66]. They provide daily leisure activities for residents. They enhance the aesthetics of the urban landscape [67,68], improving the environmental function [69], and climate regulation [70,71]. Additionally, cities offer educational opportunities. The diversity and accessibility of education can influence public well-being. Public services enhance the positive evaluation of a neighborhood’s social quality [72]. The diversity of POIs reflects the richness of the surrounding urban amenities [73]. Communities with high diversity in terms of land use have easier access to various facilities and services [25,74,75].
Perceived quality is a key factor in quantifying the spatial experience of streets. It is divided into objective perception and psychological perception [76,77,78].
Objective perception refers to the physical features of street quality that can be measured and observed [79]. Physical features were used to establish an objective framework. They were extracted from SVIs to evaluate streetscape perceptions [80,81]. As key landscape elements of the built environment, greenness can improve spatial quality and alleviate urban heat island effects. Additionally, they can promote human physical and mental health, and enhance people’s sense of well-being [82,83]. Imageability refers to the environmental quality that strongly impresses observers [84]. The proportion of buildings and traffic signs can reflect the memorability of street spaces [85]. The literature on visual evaluations indicated that the level of enclosure is one of the significant features influencing human responses to the environment [86]. It is formed by horizontal interfaces and vertical landscape elements [87]. Openness refers to the visibility of the sky. Previous studies have shown that openness not only promotes mental health, but also enhances the attractiveness of streetscapes and increases spatial comfort [38,88]. Street design can influence the walking environment and pedestrian perceptions [87,89]. The amount of paved sidewalks can be used to measure pedestrian safety and comfort [84,90]. Walkability is a fundamental aspect of accessibility. It can provide pedestrians with more accessible movement, thereby creating a better walking environment [91]. These studies indicate that objective features of the street space influence the quality of the street space, such as openness, greenness, enclosure, and walkability.
Psychological perception refers to personal experiences and feelings in regard to the quality of streets [92]. Human perception directly reflects the quality of the street environments [93]. Positive perceived street quality can promote positive perceptions [94,95]. Previous studies have shown that street space design influences certain perceptions, such as whether the environment is safe, beautiful, or depressing [56]. Safe and beautiful are two fundamental human perceptions [96]. Boring and lively represent the attractiveness of the public in the street space [56]. The “Place Pulse 2.0” dataset was produced by Massachusetts Institute of Technology (MIT). It evaluated human perceptions in regard to six aspects: beautiful, lively, boring, depressing, wealthy, and safe. These perceptions related to residents’ lives [81,97]. Zhang et al. validated the effectiveness of this dataset in capturing human perceptions [98]. These studies indicate that psychological perception is influenced by physical features, such as spatial design, greening, and social activities. Additionally, psychological perception was closely related to residents’ mental health.
In summary, the research indicates that the density and diversity of urban amenities could represent urban functions, such as transportation, shopping, green public spaces, public services, and science/culture and education services. A high-quality street environment could enhance the utilization efficiency of the facilities. The spatial features of streets and human psychological perceptions were measured in order to evaluate the perceived street quality. Therefore, this study conducted a coupling analysis in regard to three dimensions, namely street accessibility, urban function, and perceived quality.

2.2. Methods of Measuring Urban Function and Perceived Quality

In previous studies, the data collection methods used mainly included questionnaire surveys [99], interviews [100], photography [101], and field surveys [102]. Due to time and cost restrictions, these methods are often limited to small-scale studies. However, with the development of data collection technology, multiple-source datasets are gradually being applied in urban research. Data collection technologies include street view images (SVIs) [103], social media data [104], Location-Based Services (LBSs) [105], and point of interest (POI) data [106]. These datasets include the objective features of street environments and human perceptions on a large scale [107]. For example, SVIs can directly show real spatial environments of streets [108]. By using SVIs, some studies have carried out the extraction of landscape elements for street quality evaluations on a large scale [109]. On the other hand, POIs provide spatial and attribute information in terms of geography. This information is relevant to people’s daily life. So, POIs are widely used in identifying urban functions and evaluating street vitality [110,111].
Currently, new computer technologies include Geographic Information Systems (GIS) and deep learning. These technologies have been used to process data. These technologies are helpful for enhancing our understanding of urban morphology on a large scale [112]. For example, deep learning integrates the advantages of convolutional neural networks, recurrent neural networks, and generative adversarial networks. Deep learning increases the efficiency of such networks by reducing the need for interventions [113]. Some scholars have combined street view images with deep learning to carry out research [114,115]. The relevant research includes assessing building facade quality, walkability, aesthetics, and human perceptions across micro, meso, and macro scales [116,117]. As a geographic spatial system for analyzing, managing, and visualizing all types of geographic spatial data, GIS have been widely applied in some studies related to urban planning and land resource management [118,119].

3. Materials and Methods

3.1. Research Framework
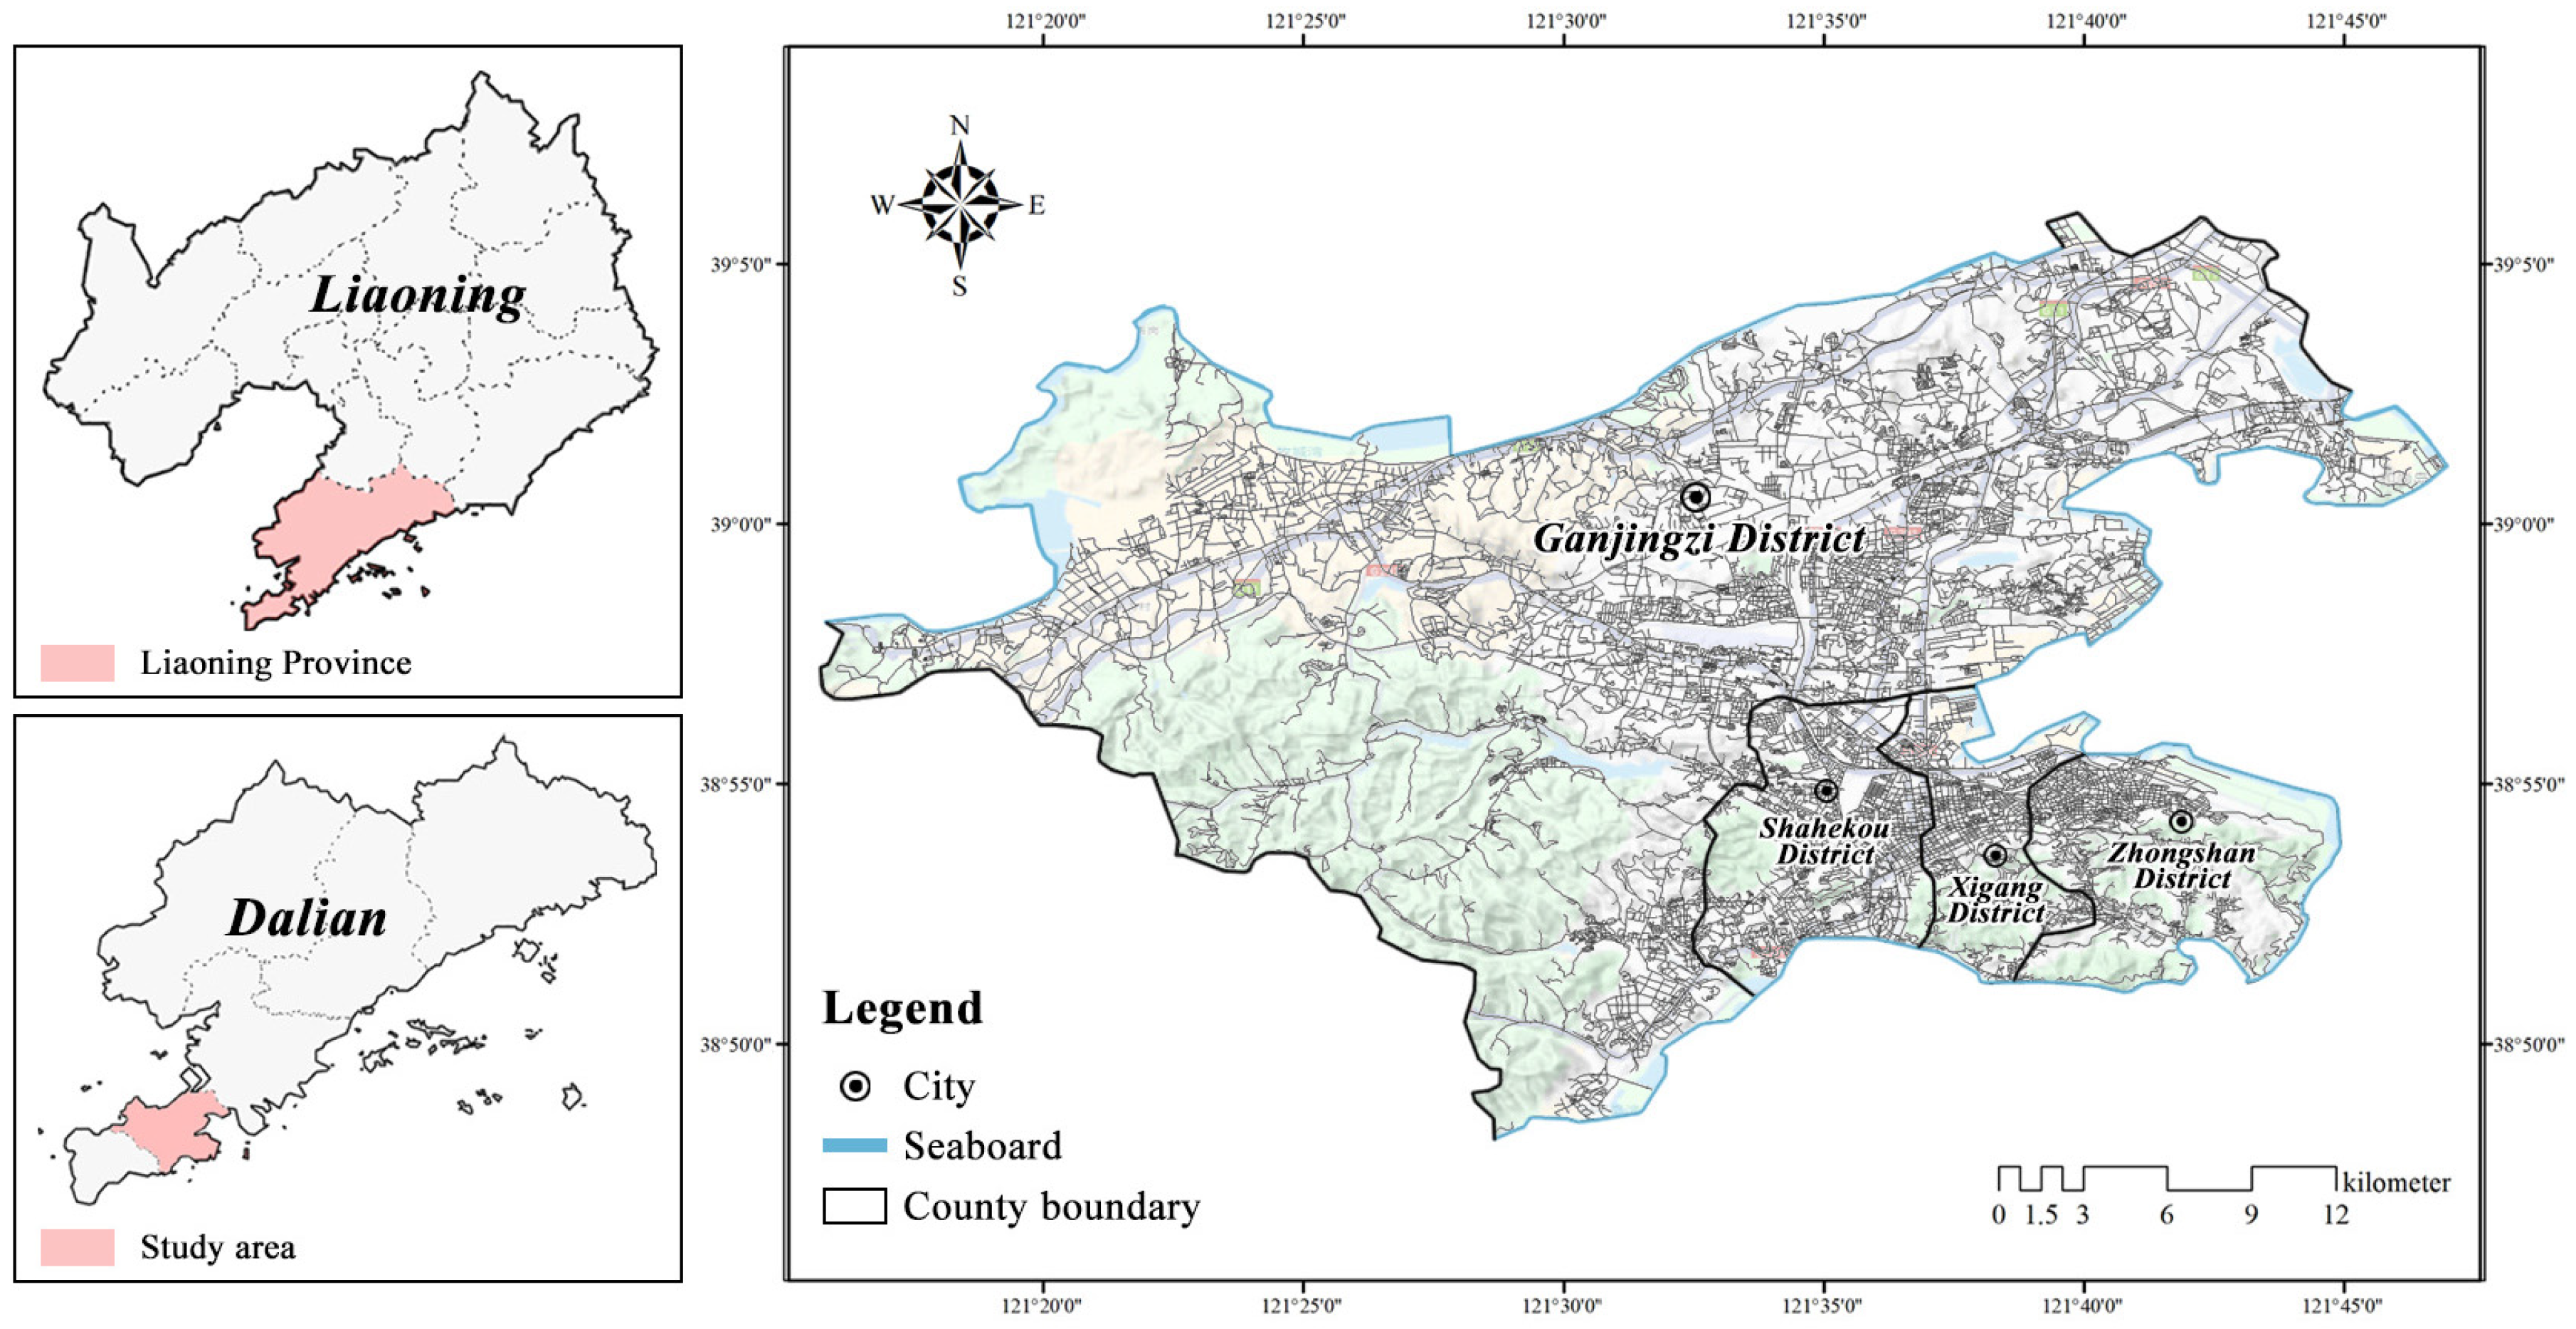
Firstly, the study obtained the data on the original road network in Dalian, China, from OpenStreetMap (OSM) and simplified the road network. Based on spatial syntax, a street accessibility analysis was conducted as part of the study, with high-accessibility streets and low-accessibility streets selected as study sites.
Secondly, in this study, street view images and points of interest (POIs) data were obtained for high-accessibility and low-accessibility streets. Using street view images and deep learning, the perceived street quality was obtained, including psychological and objective perceptions. Using semantic segmentation, six objectives perceptions were quantified, namely openness, greenness, paved sidewalks, walkability, imageability, and enclosure. Using the “Place Pulse 2.0” dataset, six psychological perceptions were obtained, namely beautiful, lively, boring, wealthy, depressing, and safe. Additionally, based on POIs data and the ArcGIS software, this study calculated the POI diversity and five types of facility densities (green public space, shopping facility, transportation facility, cultural facility, and public facility). The Delphi method was used to obtain weights for the psychological and objective perception features. Then, in this study, the heterogeneity of the perceived quality and urban function for high-accessibility streets and low-accessibility streets were analyzed.
Finally, this study established a coordinate system with regard to perceived quality, urban function, and street accessibility. The streets were divided into four types (advantage street, maintained street, improvement street, and opportunity street). The study conducted a heterogeneity analysis of the perceived quality and urban functions of different types of streets. This analysis is helpful for the development of urban amenities and urban planning (Figure 1).

3.2. Study Site

As a coastal industrial city, Dalian has undergone rapid urbanization in recent years. The city is gradually transitioning from a traditional industrial city to an eco-tourism city. Meanwhile, the land use and functional layout of Dalian have undergone significant changes. The core areas in Dalian (121.6147° E, 38.9140° N) were chosen as the study area. These are the Zhongshan District, Xigang District, Shahekou District, and Ganjingzi District (Figure 2). These areas are the center of polity, the economy, and culture in Dalian. The core area is located at the south of the Liaodong Peninsula, which borders the Yellow Sea to the east and the Bohai Sea to the west. In addition, it has excellent port conditions and abundant marine resources. With a total area of approximately 573 square kilometers and a dense population, the core urban area has various urban functions, such as shopping, administration, cultural, industry, and transportation facilities for residents. It includes the main residential areas and commercial areas in Dalian.

3.3. Evaluation and Analysis Methods

3.3.1. Data Collection

This study utilizes three types of data: road network data in Dalian, street view images, and POIs data.
The original road network data from Dalian were provided by OpenStreetMap (OSM). Space syntax theory was used to conduct topological analysis of the spatial features [120]. This theory pointed out that higher integration values indicate greater accessibility [121]. So, this study selected the angle patterns in the segment model to evaluate street accessibility. A radius of 500 m (R = 500) was set as the accessibility radius [122,123]. The study obtained the local integration in regard to the core urban area in Dalian. Then, the results of the street accessibility assessment were classified into five classes using the natural breaks classification method. Finally, we selected streets with very high accessibility (VH) and streets with very low accessibility (VL) as the study sites.
The Baidu map was selected as a data source for the street view images. Using the ArcGIS10.8 software, we generated sample points every 100 m, based on the simplified road network, and obtained their latitude and longitude coordinates [95]. Next, the image dimensions were set to 2048 × 624 pixels, the heading and pitch were set at 0°, and the images were selected from April to October. A total of 6273 images were obtained for high-accessibility streets, and 3295 images for low-accessibility streets. The DeepLabV3+ semantic segmentation architecture was used to partition the landscape elements using the ADE20K dataset, such as trees, buildings, fences, roads, and sidewalks [124,125]. The proportions of the landscape elements in the study area were used to calculate the objective perception values using the formulas listed in Table 1. In addition, six psychological perceptions were measured using a deep learning model and the “Place Pulse 2.0” dataset [126]. The method has been widely used to quantify human perception on a large scale [127]. It can be used to explore the relationship between the urban built environment and public sentiment [128].
As a form of geographic big data, POIs have advantages in terms of extensive coverage, ease of access, and high positional accuracy [129,130]. The Gaode open platform was selected as the data resource. A total of 122,314 POIs data were obtained in the core urban area in Dalian. These data include attribute information, such as name, address, type, coordinates, and administrative region. Then, the POIs data were divided into five types: green public space, shopping service, transportation service, public service, and science/culture and education service.

3.3.2. The Establishment of the Evaluation System

In previous studies, perceived street quality was divided into psychological perception and objective perception. Psychological perception quality is represented by the terms beautiful, lively, wealthy, safe, depressing, and boring, while objective perception includes greenness, openness, imageability, walkability, paved sidewalk, and enclosure. In addition, POI diversity was used to represent urban function. Shannon’s index was used to calculate it. In this study, the densities of the five types of facilities were calculated, according to a 500 m × 500 m grid [131] (Table 1).
The Delphi method is used to determine the weights of evaluation indicators. It is an iterative questionnaire that collects opinions from multiple experts on the same indicators. The experts answer questionnaires during two or more rounds. Finally, we obtained the weights of the indicator. The Delphi method has been widely applied in previous studies for establishing various evaluation indicator systems [132,133]. In this study, 20 experts from three majors (architecture, urban planning, and landscape design) were invited to evaluate the importance of three groups of indicators, using a 1–5 scale. A total of 20 complete questionnaires were obtained. Finally, we obtained weight values for objective perception quality, psychological perception quality, and urban function (Table 2). In addition, the overall perceived quality of the streets was obtained by averaging the weights of the objective and psychological perceptions.

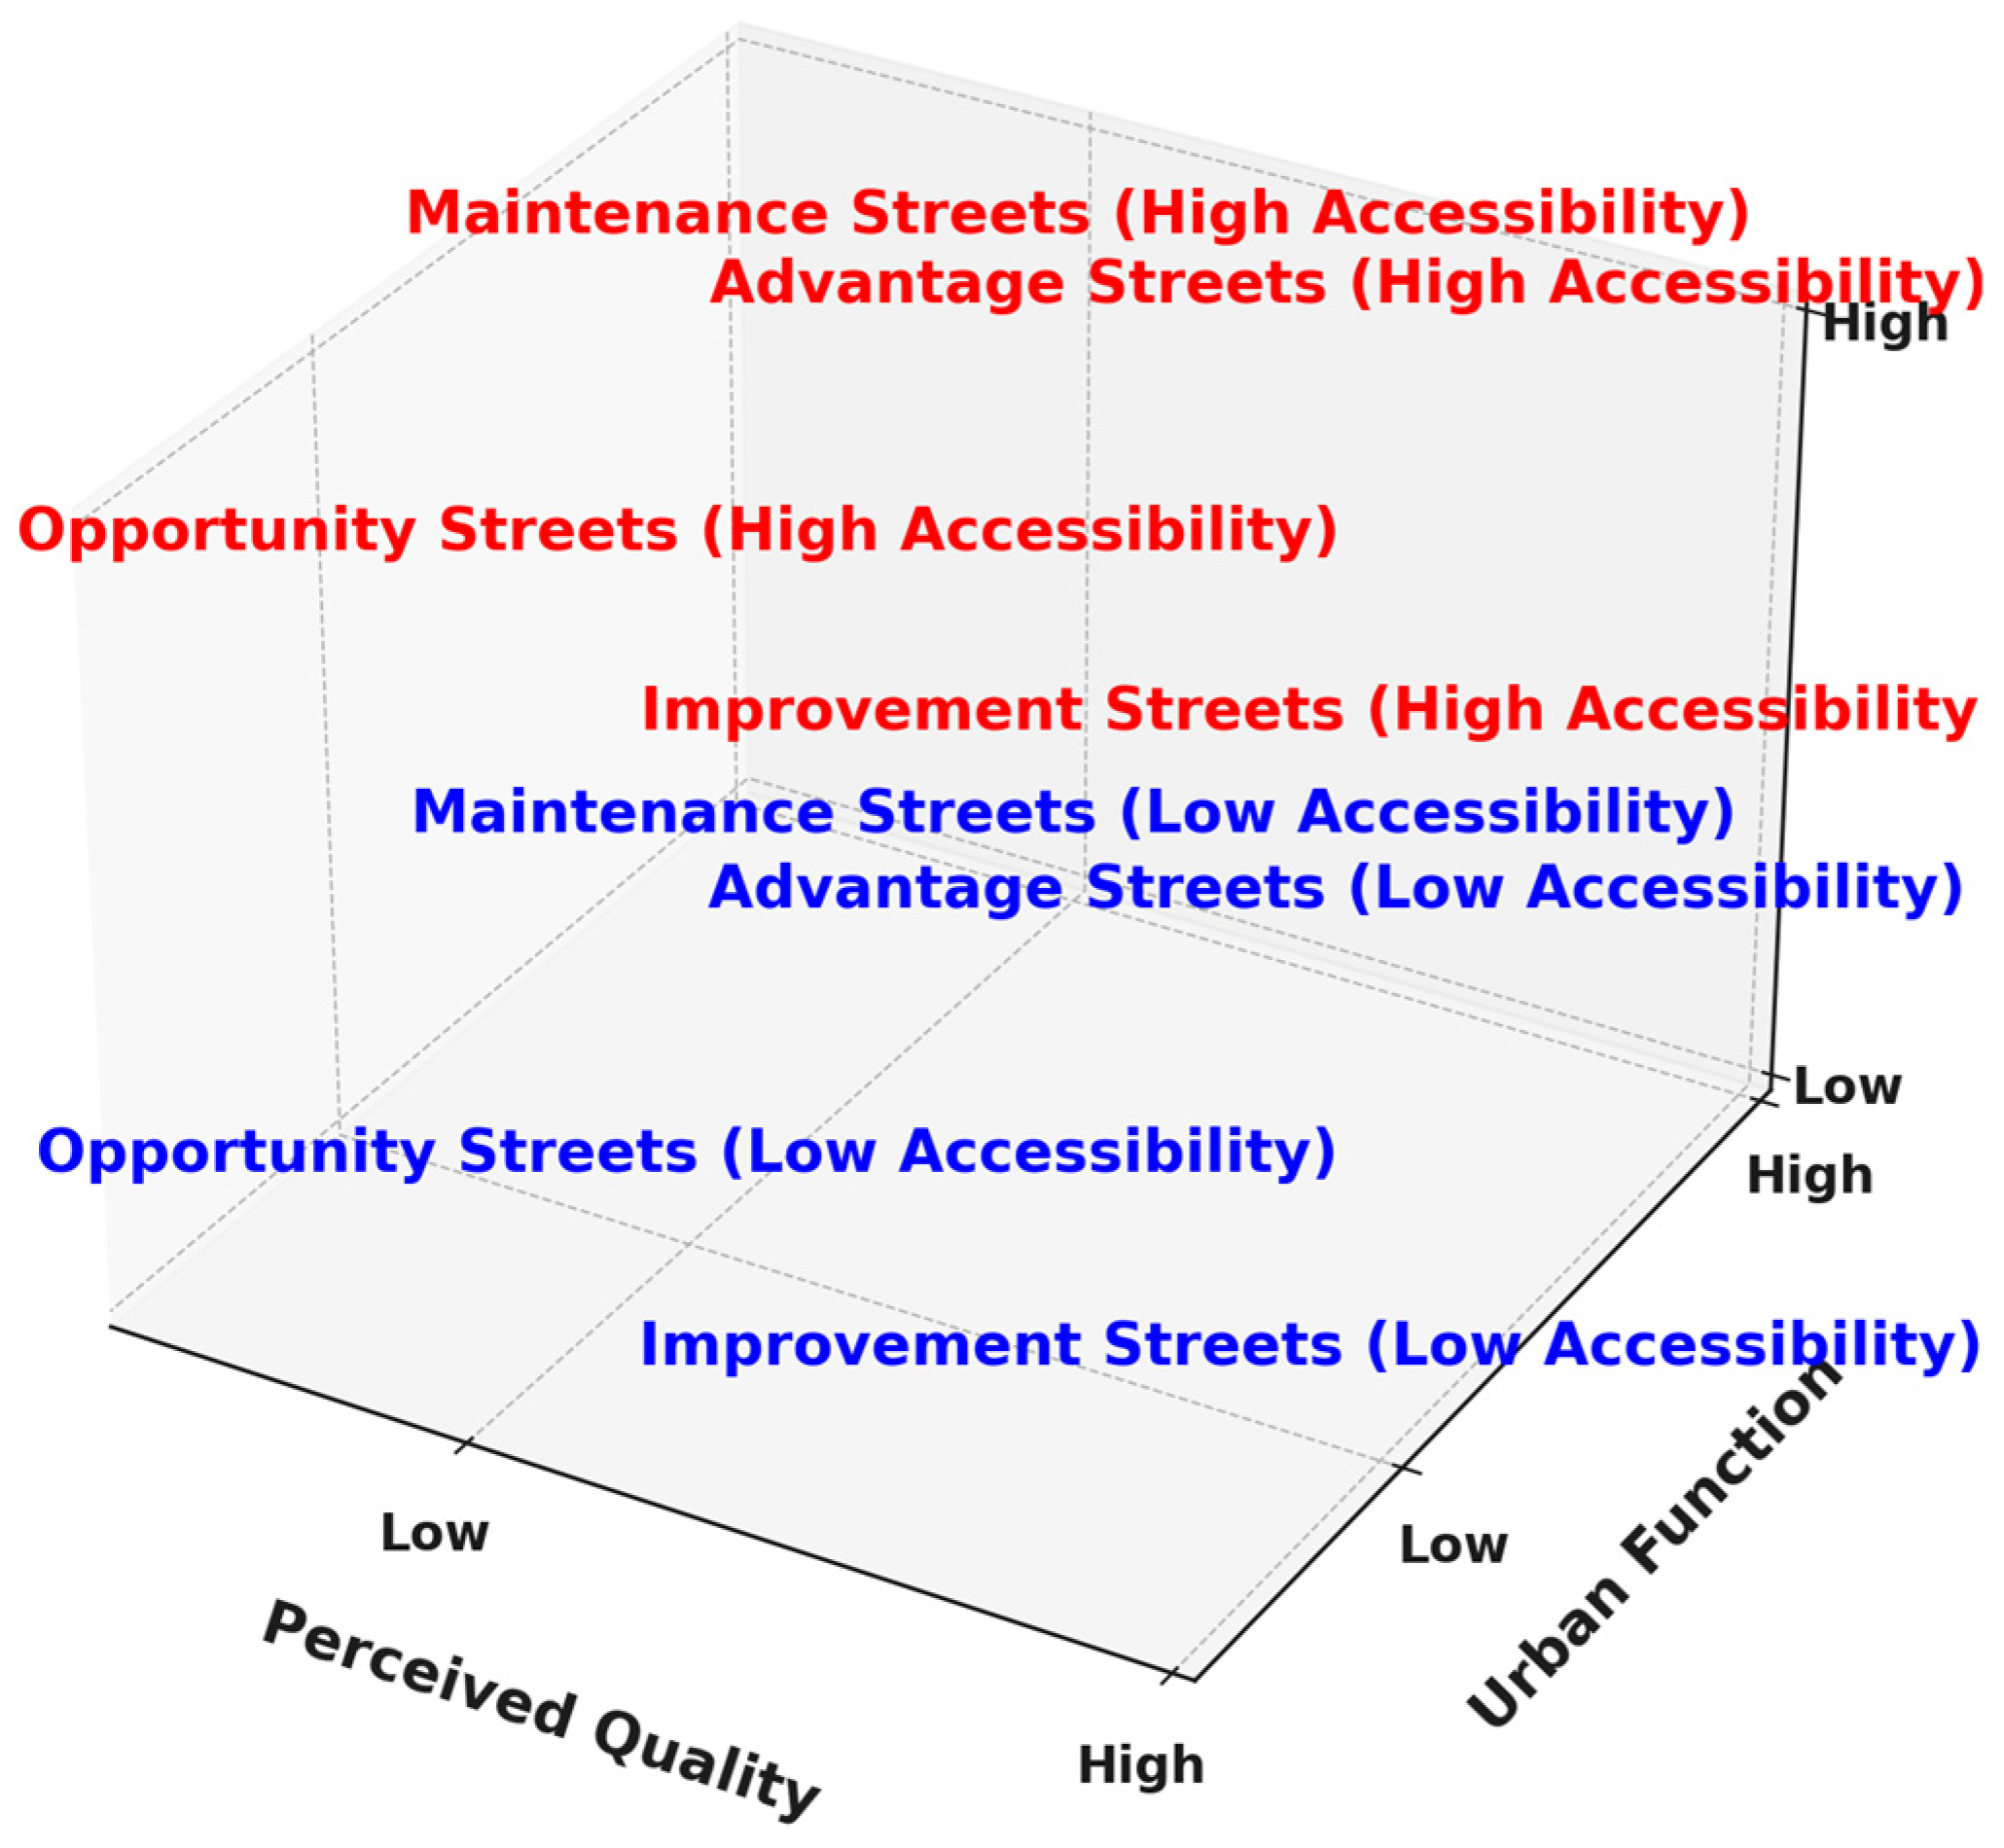
3.4. Spatial Diagnosis

This study involved the carrying out of a couple of analyses of street accessibility, urban function, and perceived quality. A three-dimensional coordinate system was established in this study, with the perceived quality as the X axis, the urban function as the Y axis, and the street accessibility as the Z axis. The streets in the core urban area were divided into four types of street spaces, including advantage streets, maintenance streets, improvement streets, and opportunity streets (Figure 3).

4. Results

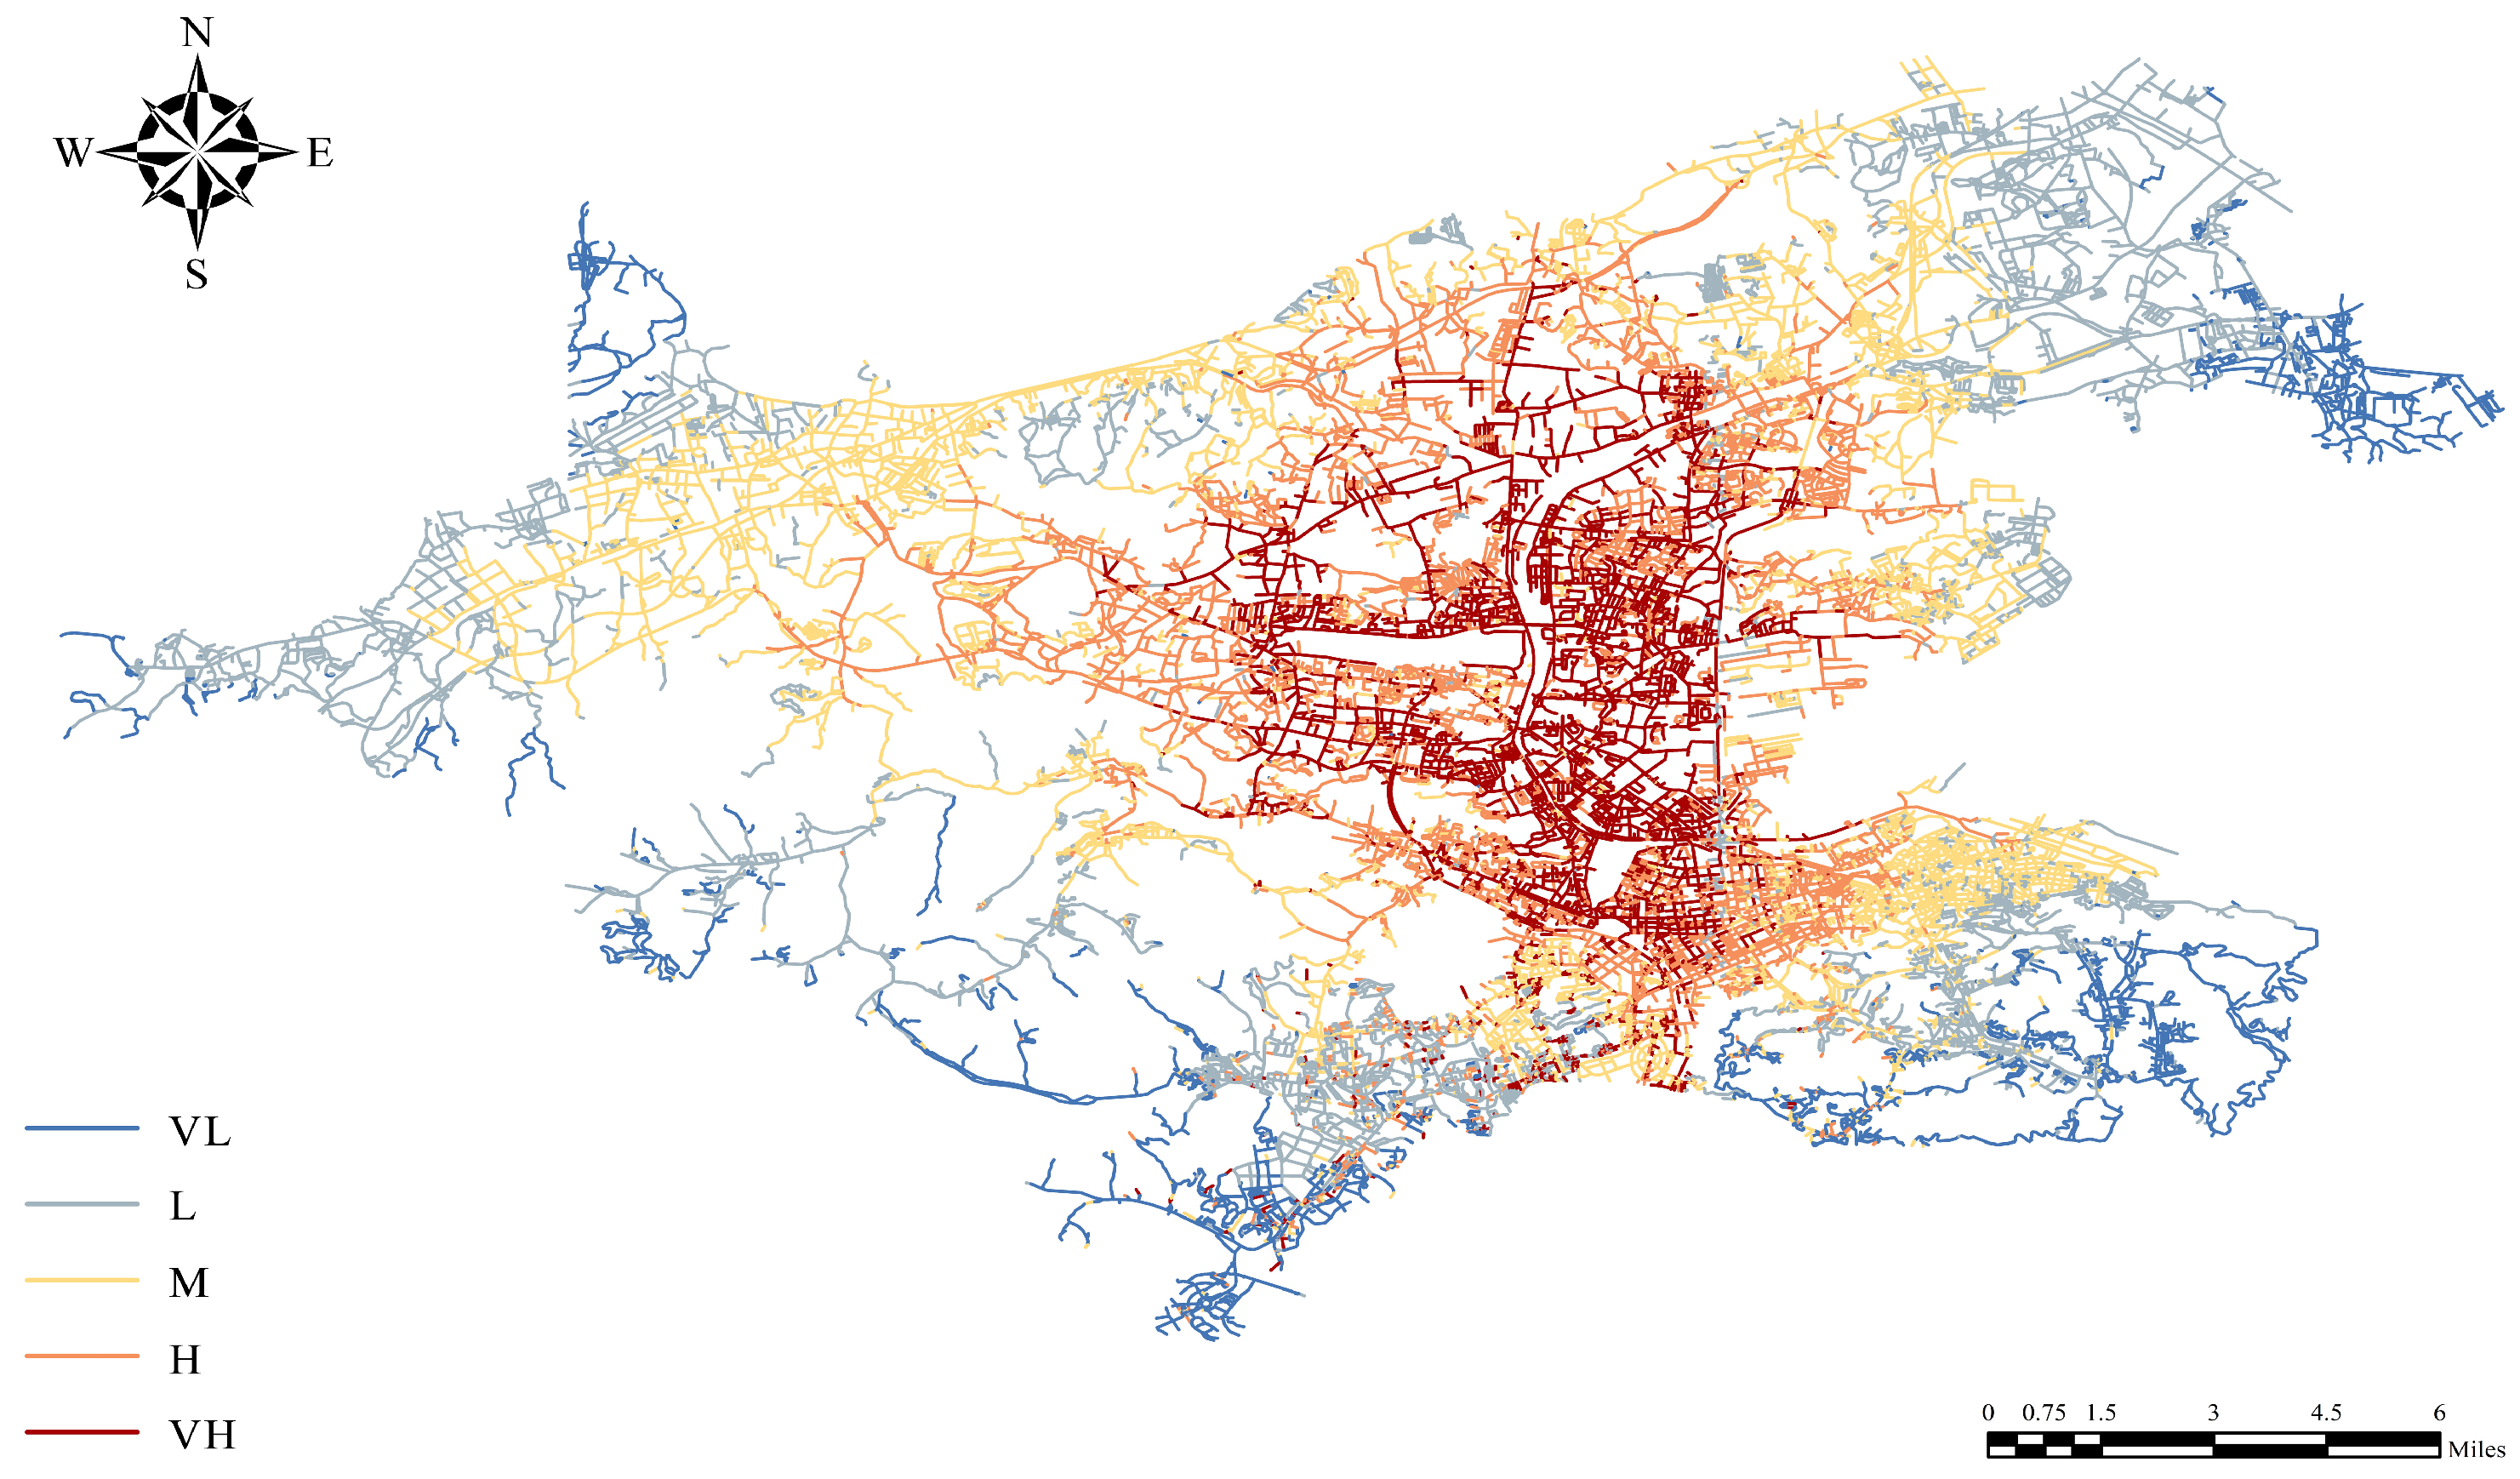
4.1. Analysis of Street Accessibility

Figure 4 illustrates the street accessibility in the core urban area of Dalian, based on a 500 m radius. High-accessibility streets and low-accessibility streets were separately marked in blue and red. In the core urban area in Dalian, the street accessibility showed a trend of decreasing from the center towards the suburbs. High-accessibility streets were mainly located in the central areas of the core urban area. These streets were mainly major urban expressways and main streets. Low-accessibility streets were mainly located in suburban areas. These streets were mainly located in the suburbs of the Ganjingzi District and the mountains in the Zhongshan District.

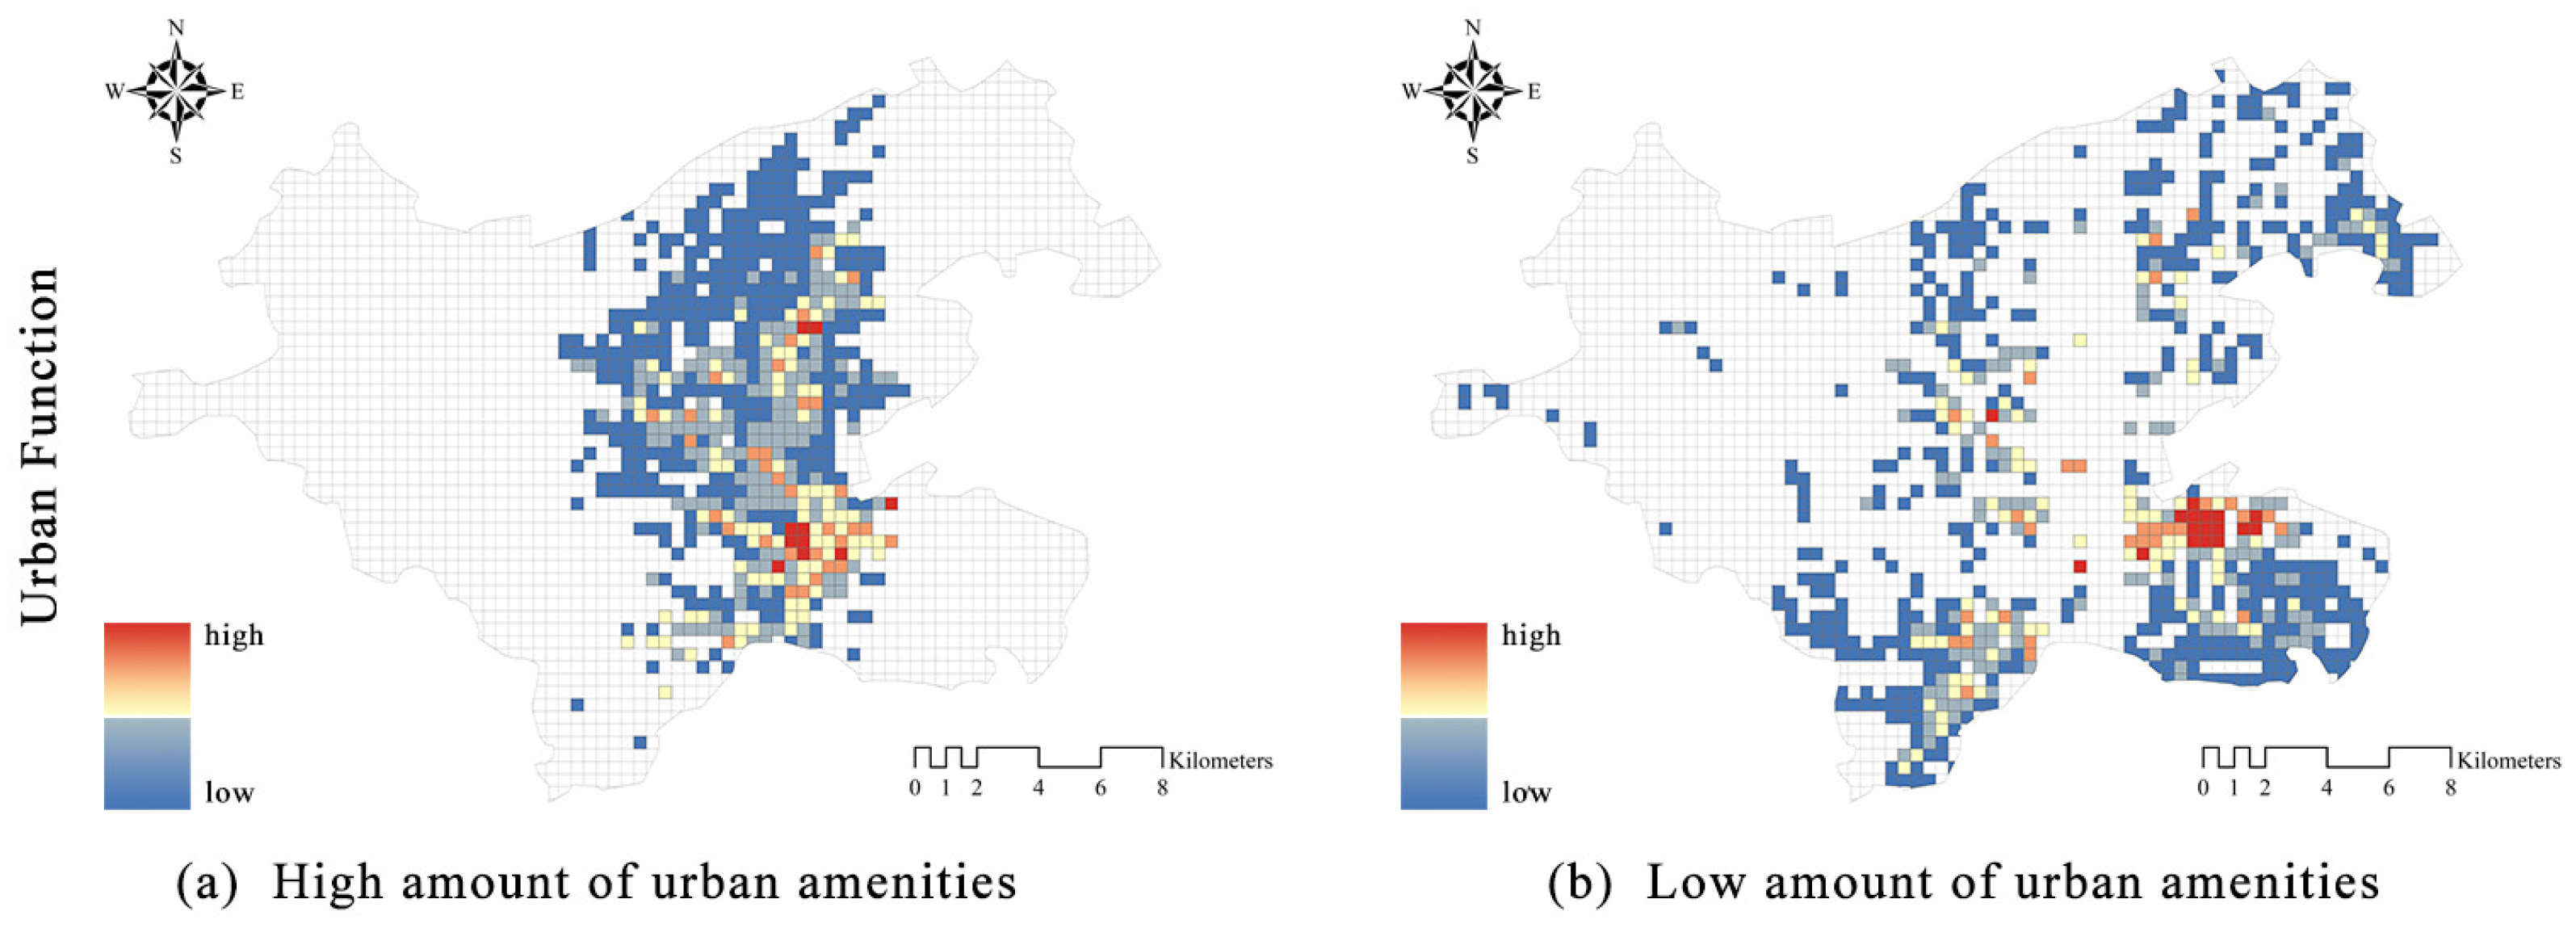
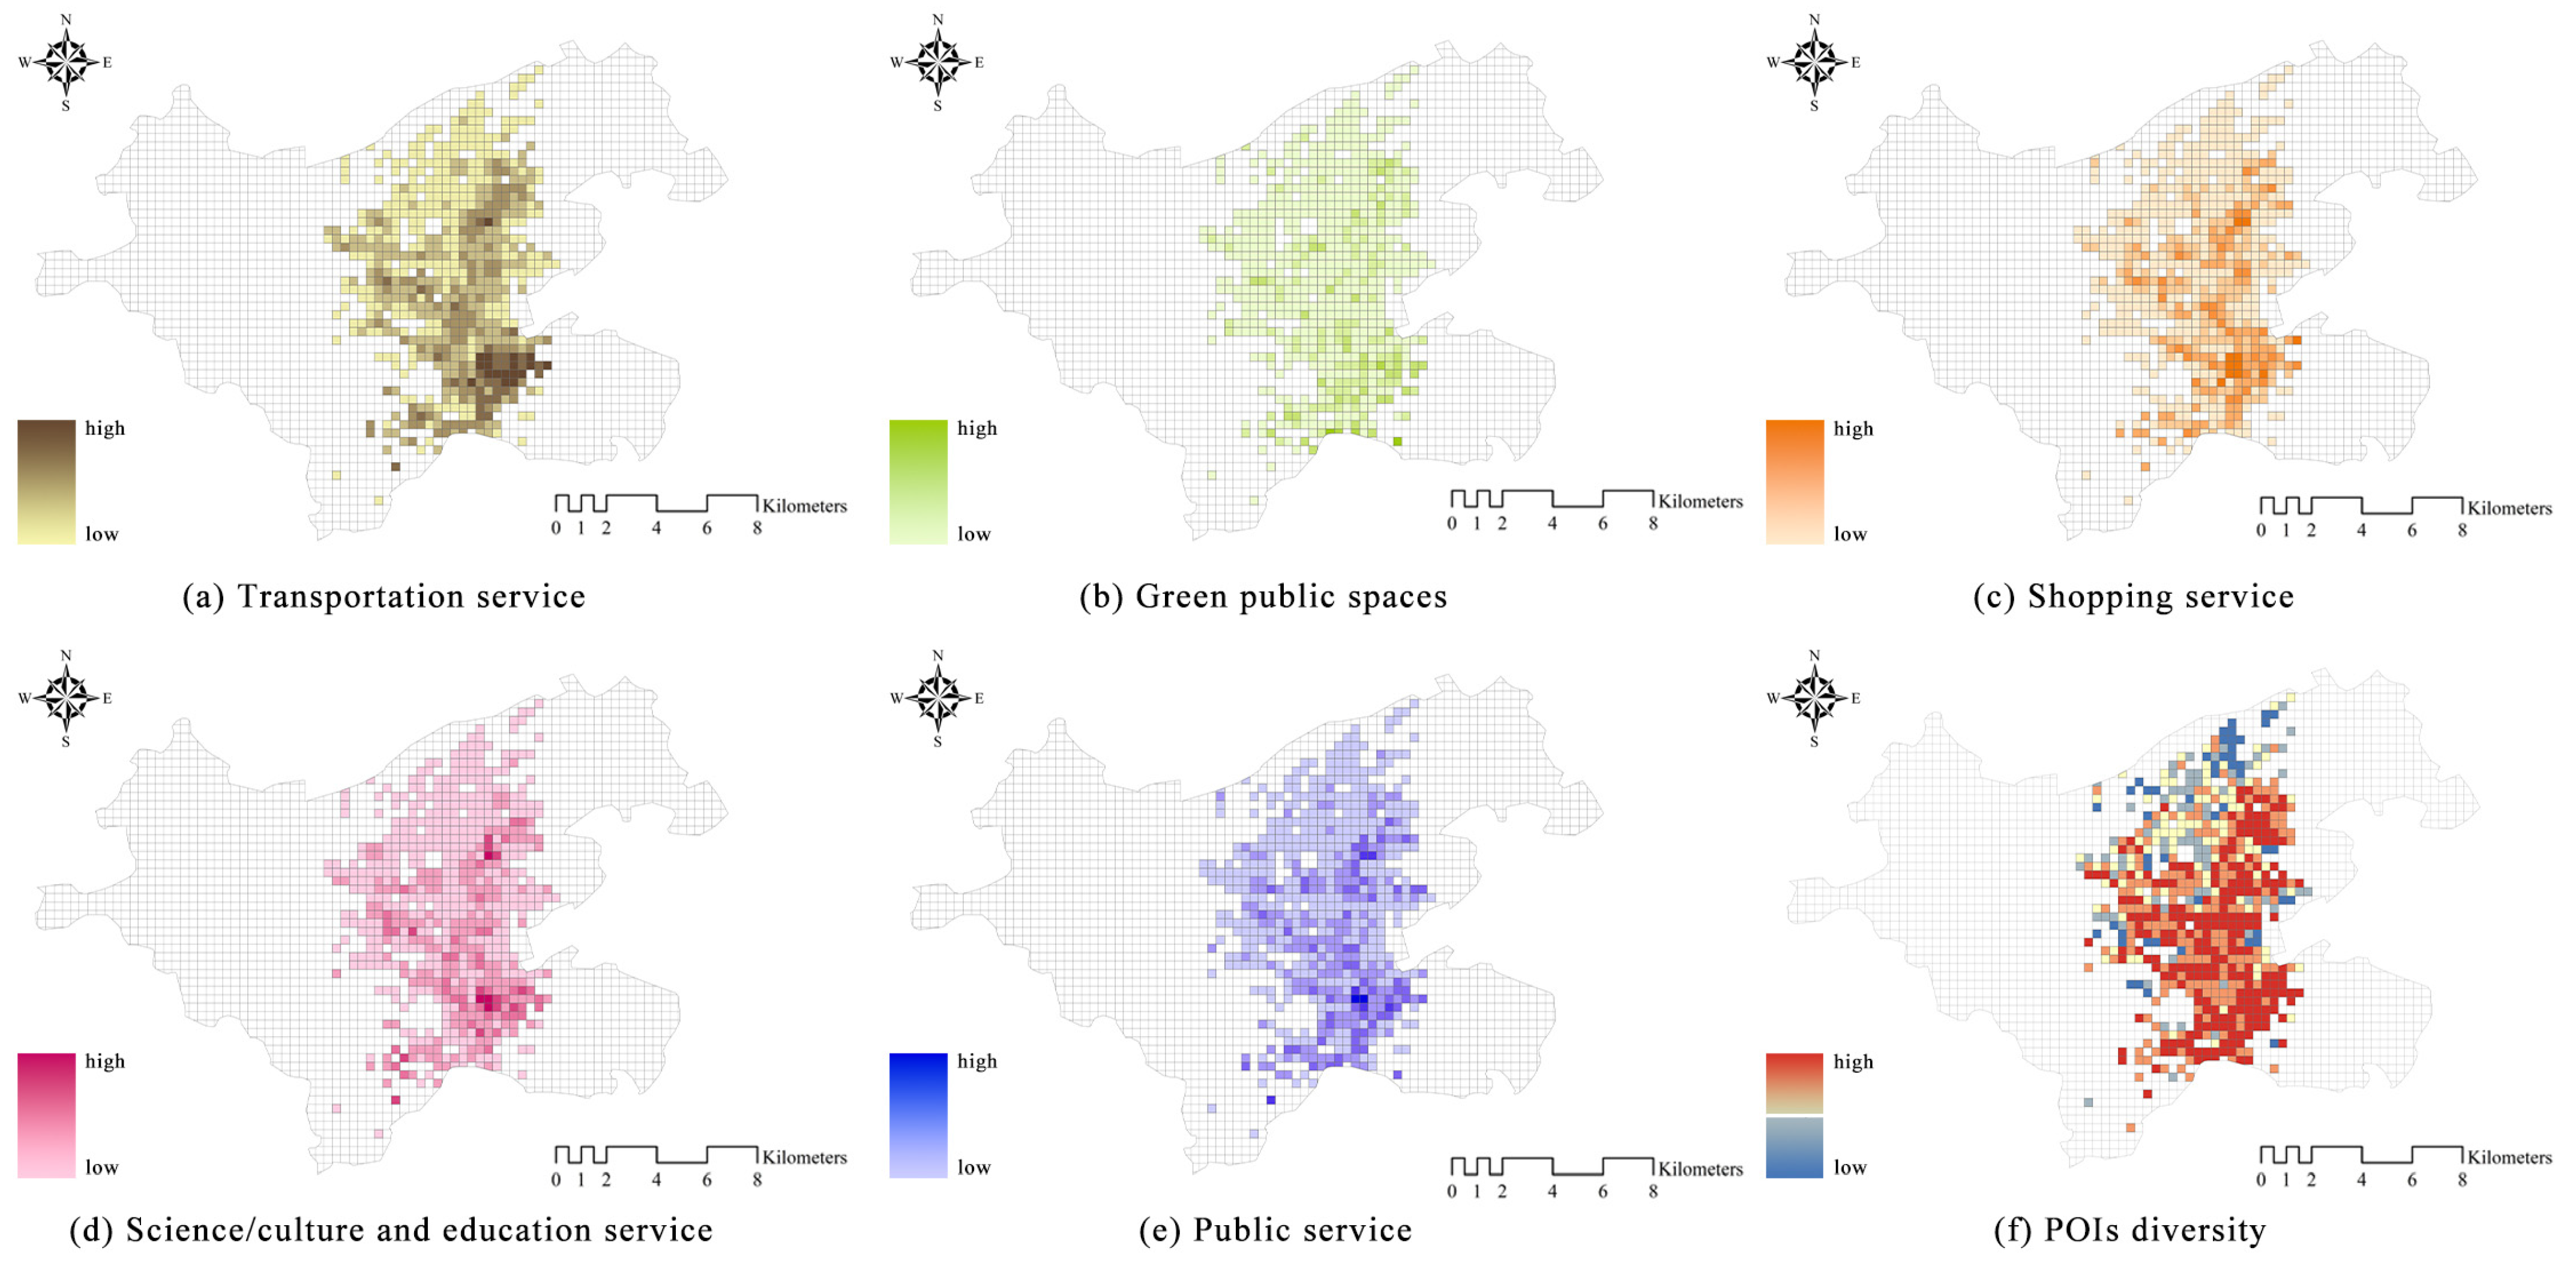
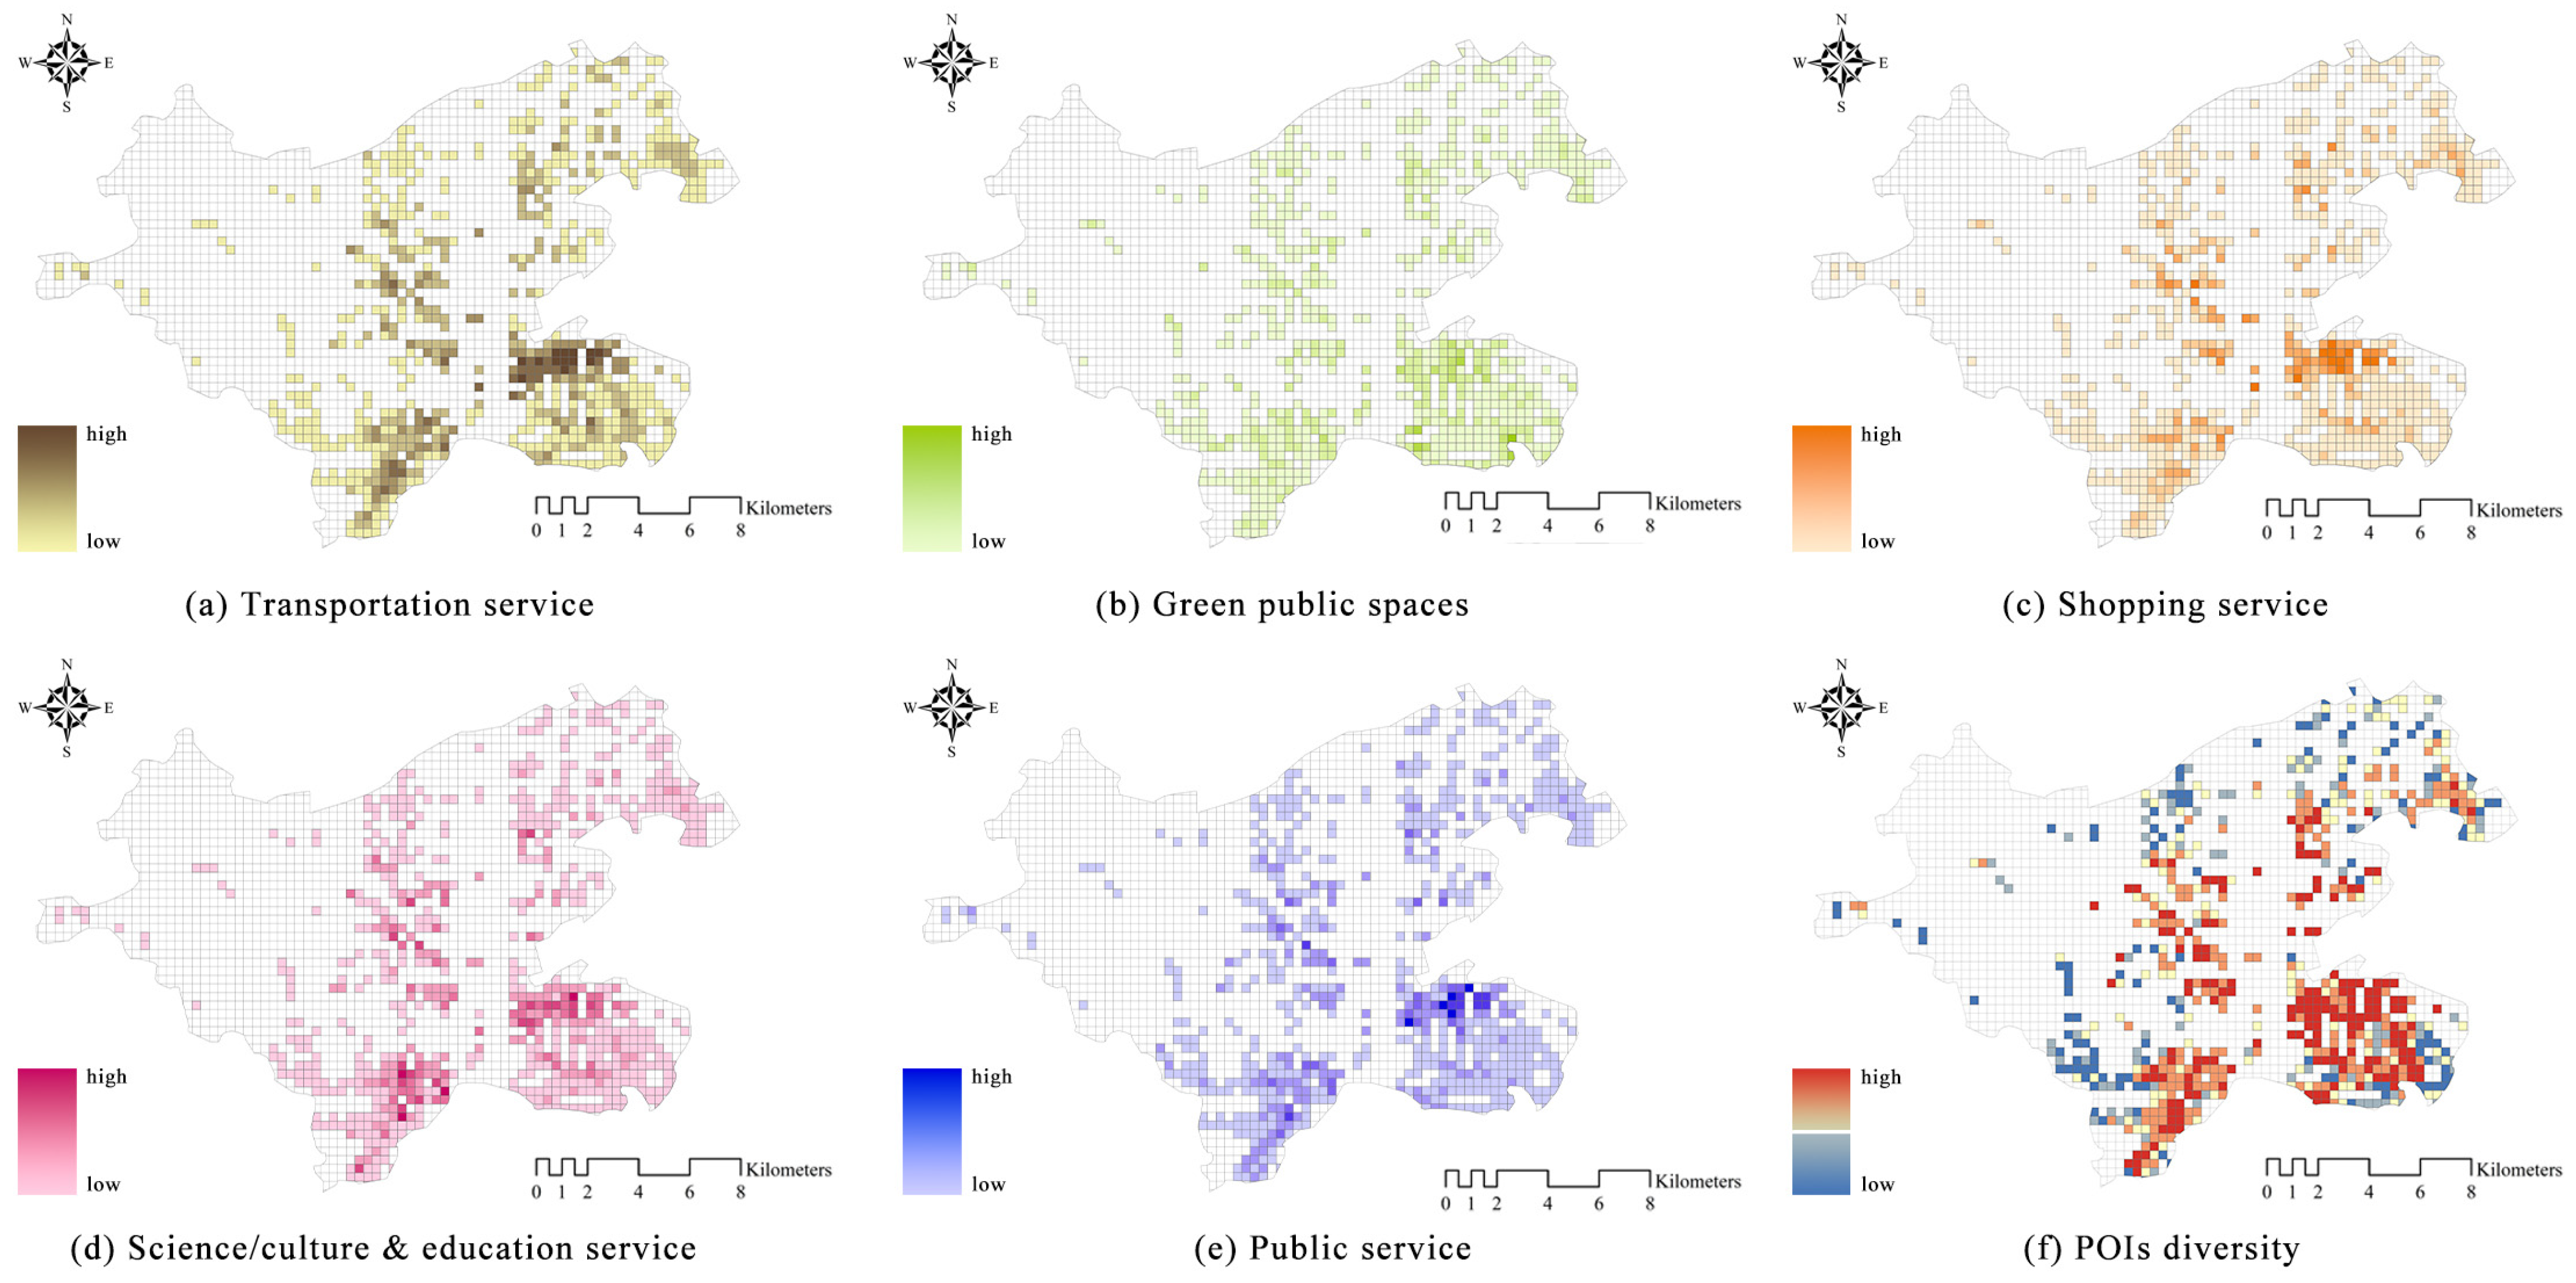
4.2. The Analysis of Urban Functions

To further explore the regional differences in the distribution and density of various urban amenities, spatial distribution, density, and diversity analyses of the urban amenities in terms of high and low accessibility were conducted in this study.
There was a clear clustering pattern in the core area of Dalian (Figure 5). The high-accessibility streets had a higher density of urban amenities than low-accessibility streets. In addition, high-value areas in high-accessibility streets accounted for 5.87% of the total area. High-value areas in low-accessibility streets accounted for 5.52% of the total area. The results showed that the distribution of urban amenities is more balanced in regard to low-accessibility streets (Table 3). In regard to different types of urban amenities, only the density of green public spaces was lower than low-accessibility streets. The results indicated that the central areas could provide residences with a higher density of urban functions and urban amenities than suburban areas. However, there were more green public spaces in low-accessibility streets.
In high-accessibility streets, five types of urban amenities clustered together to form the core area of the city. These were mainly located in the north of the Xigang District and the central part of the Ganjingzi District (Figure 6). In addition, the mean value of the facility density ranked as follows: shopping service > transportation service > science/culture and education service > public facility > green public facility (Table 3). This indicated that shopping malls and commercial districts were mainly clustered in high-accessibility streets. They provide residents with more commercial services. However, the density of green public spaces was the lowest, which suggested a lack of large green spaces in high-accessibility streets. Furthermore, the high-value areas in terms of POI diversity accounted for 66.39% of high-accessibility streets. This result indicated that the urban functions with a very high density included residential, shopping, leisure, transportation, medical, and cultural services. This finding reflects the high level of urbanization, high convenience, and high vitality in high-accessibility streets. These facilities could meet the basic needs of pedestrians (Figure 6f).
In low-accessibility streets, the distribution of urban amenities exhibited a scattered pattern (Figure 7). The results showed two minor peaks in the density distribution. These facilities were mainly located in the north of the Zhongshan District and the south of the scenic coastal area in the Ganjingzi District. The north of the Zhongshan District included several major urban functions, such as Dalian Railway Station and Roosevelt Plaza. There was lower pedestrian accessibility in the south of the Ganjingzi District. However, some scenic areas were located there, such as Xinghai Square. Transportation services, shopping services, and cultural facilities were densely concentrated within the area. Table 3 shows the mean value of the facility densities, which ranked as follows: shopping service > transportation service > science/culture and education service > public facility > green public facility. This result indicated that in terms of land use, shopping services and transportation services took priority and were responsible for the major urban functions in the area. However, green public spaces were constrained. High-value areas in terms of POI diversity accounted for 50.65% of low-accessibility streets. This result indicated that most streets in these areas had a single functional diversity, resulting in lower urban vitality.

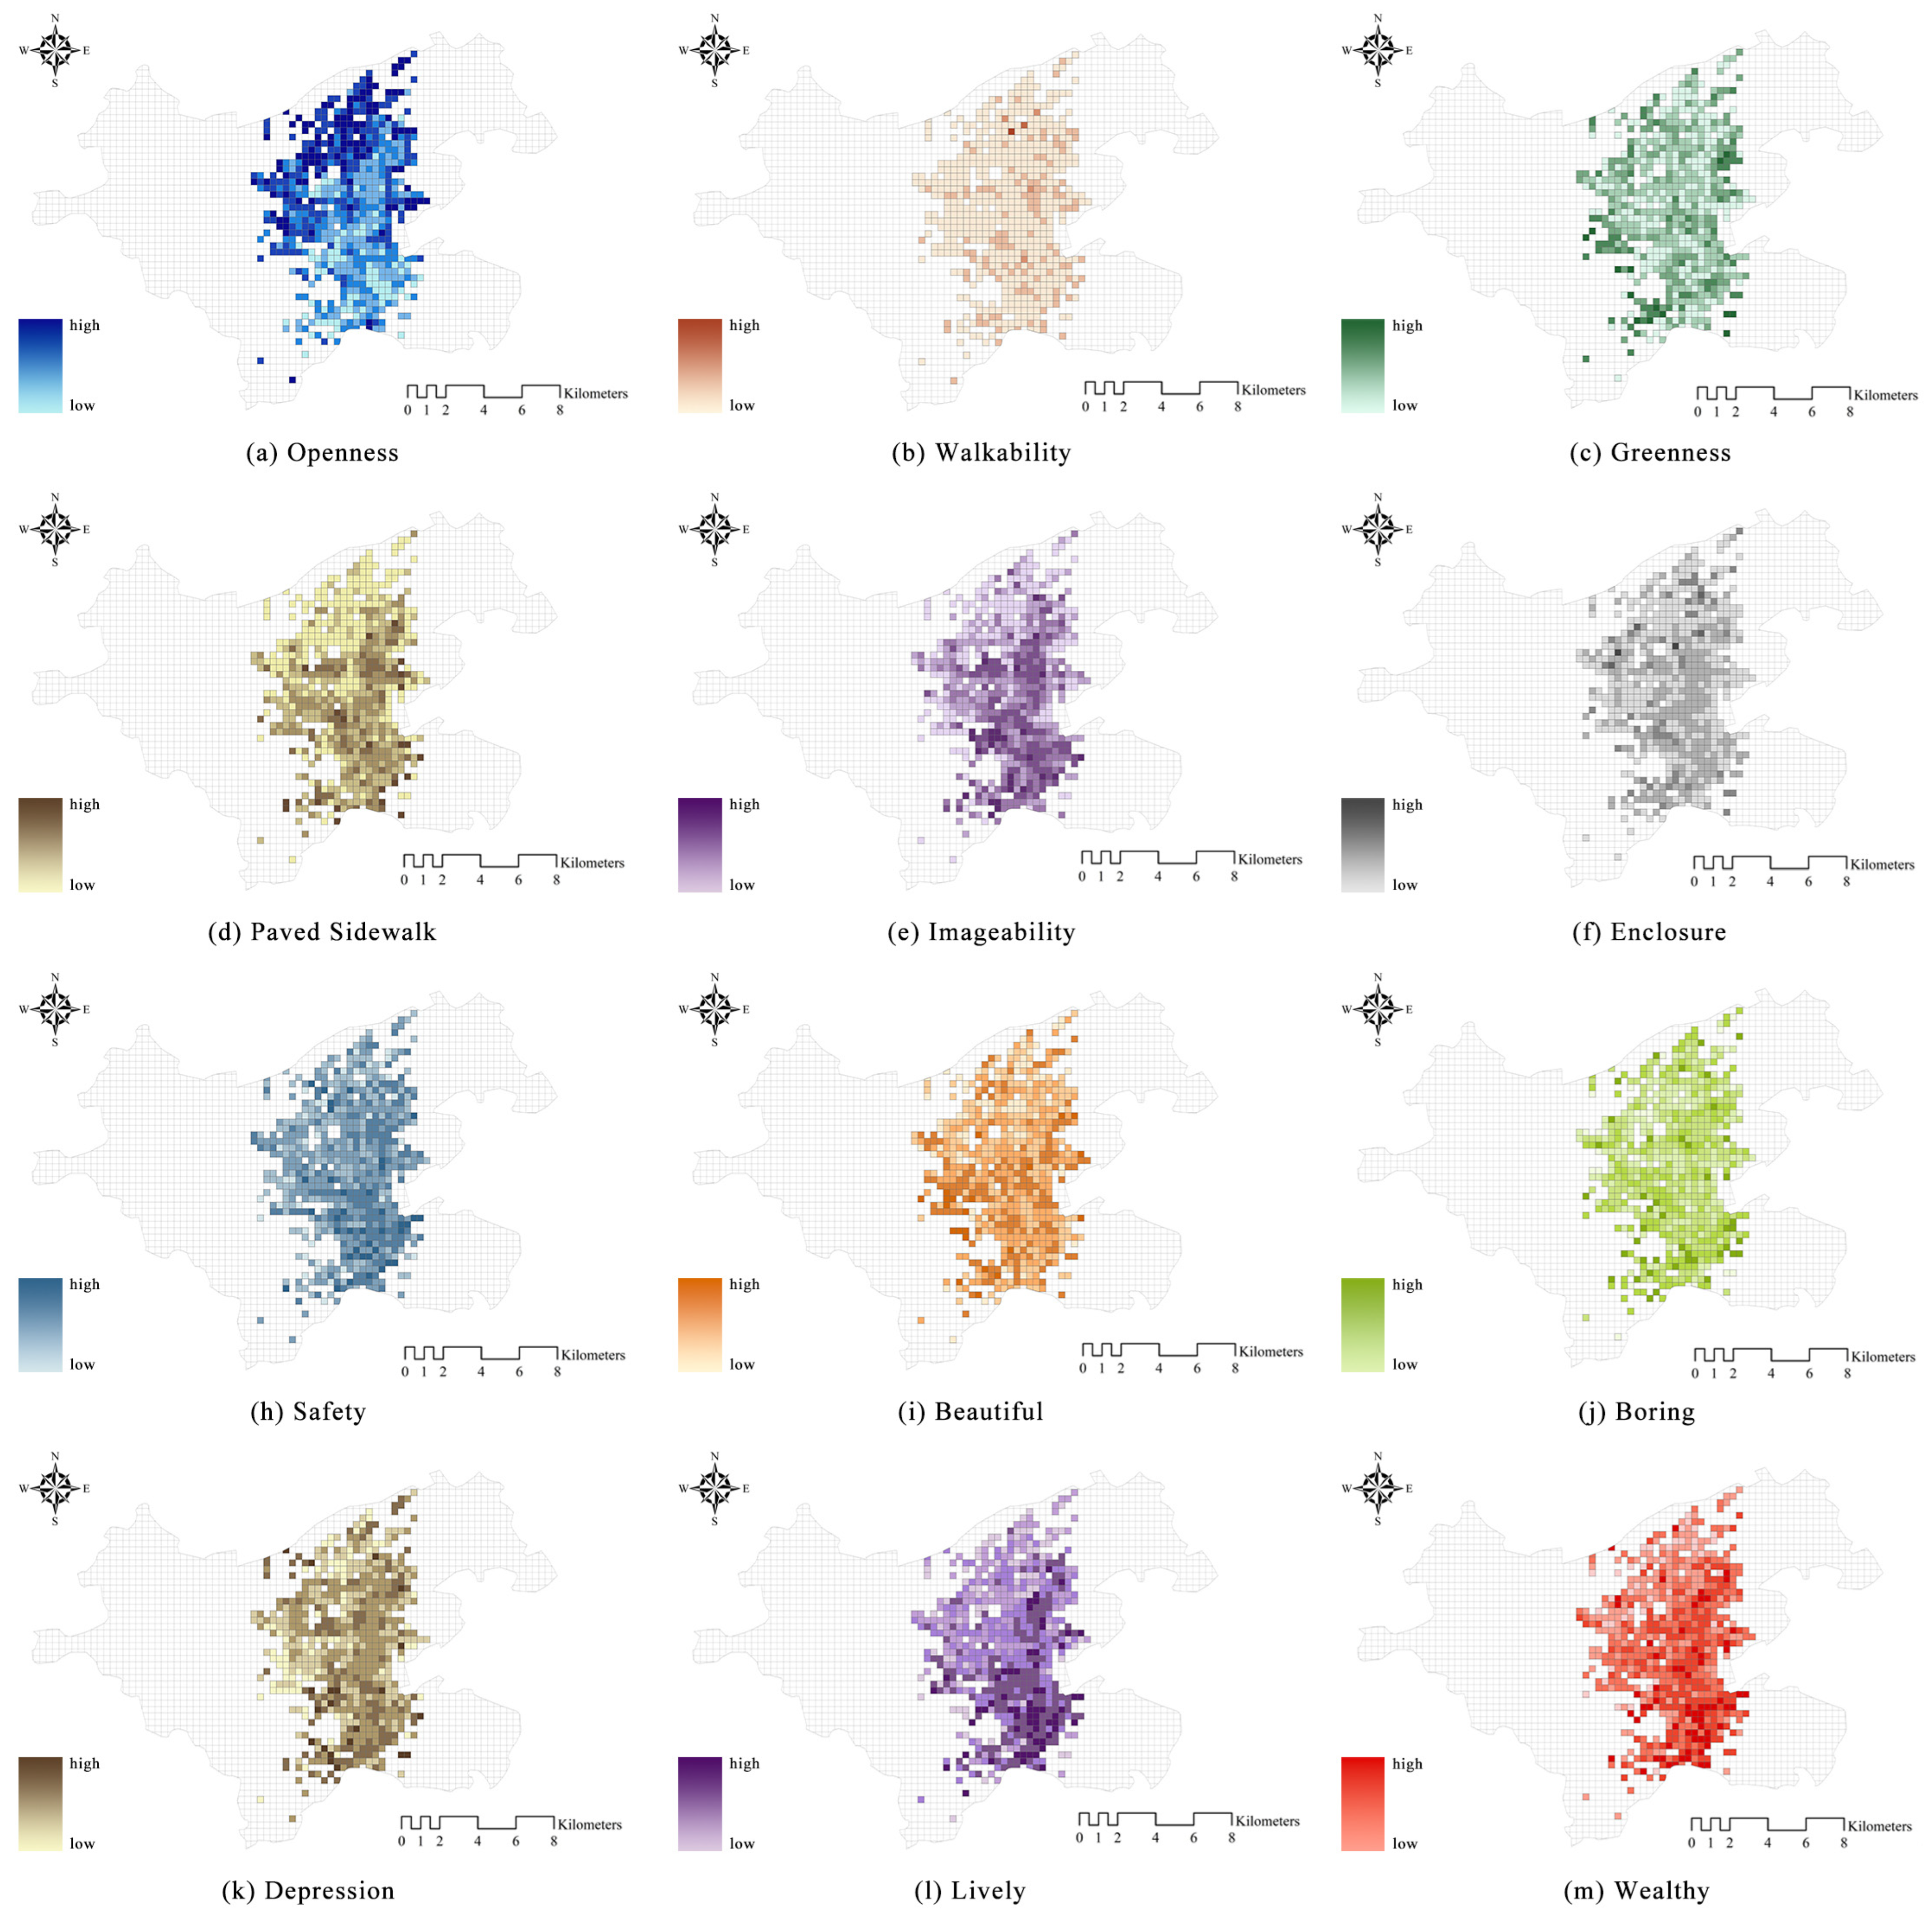
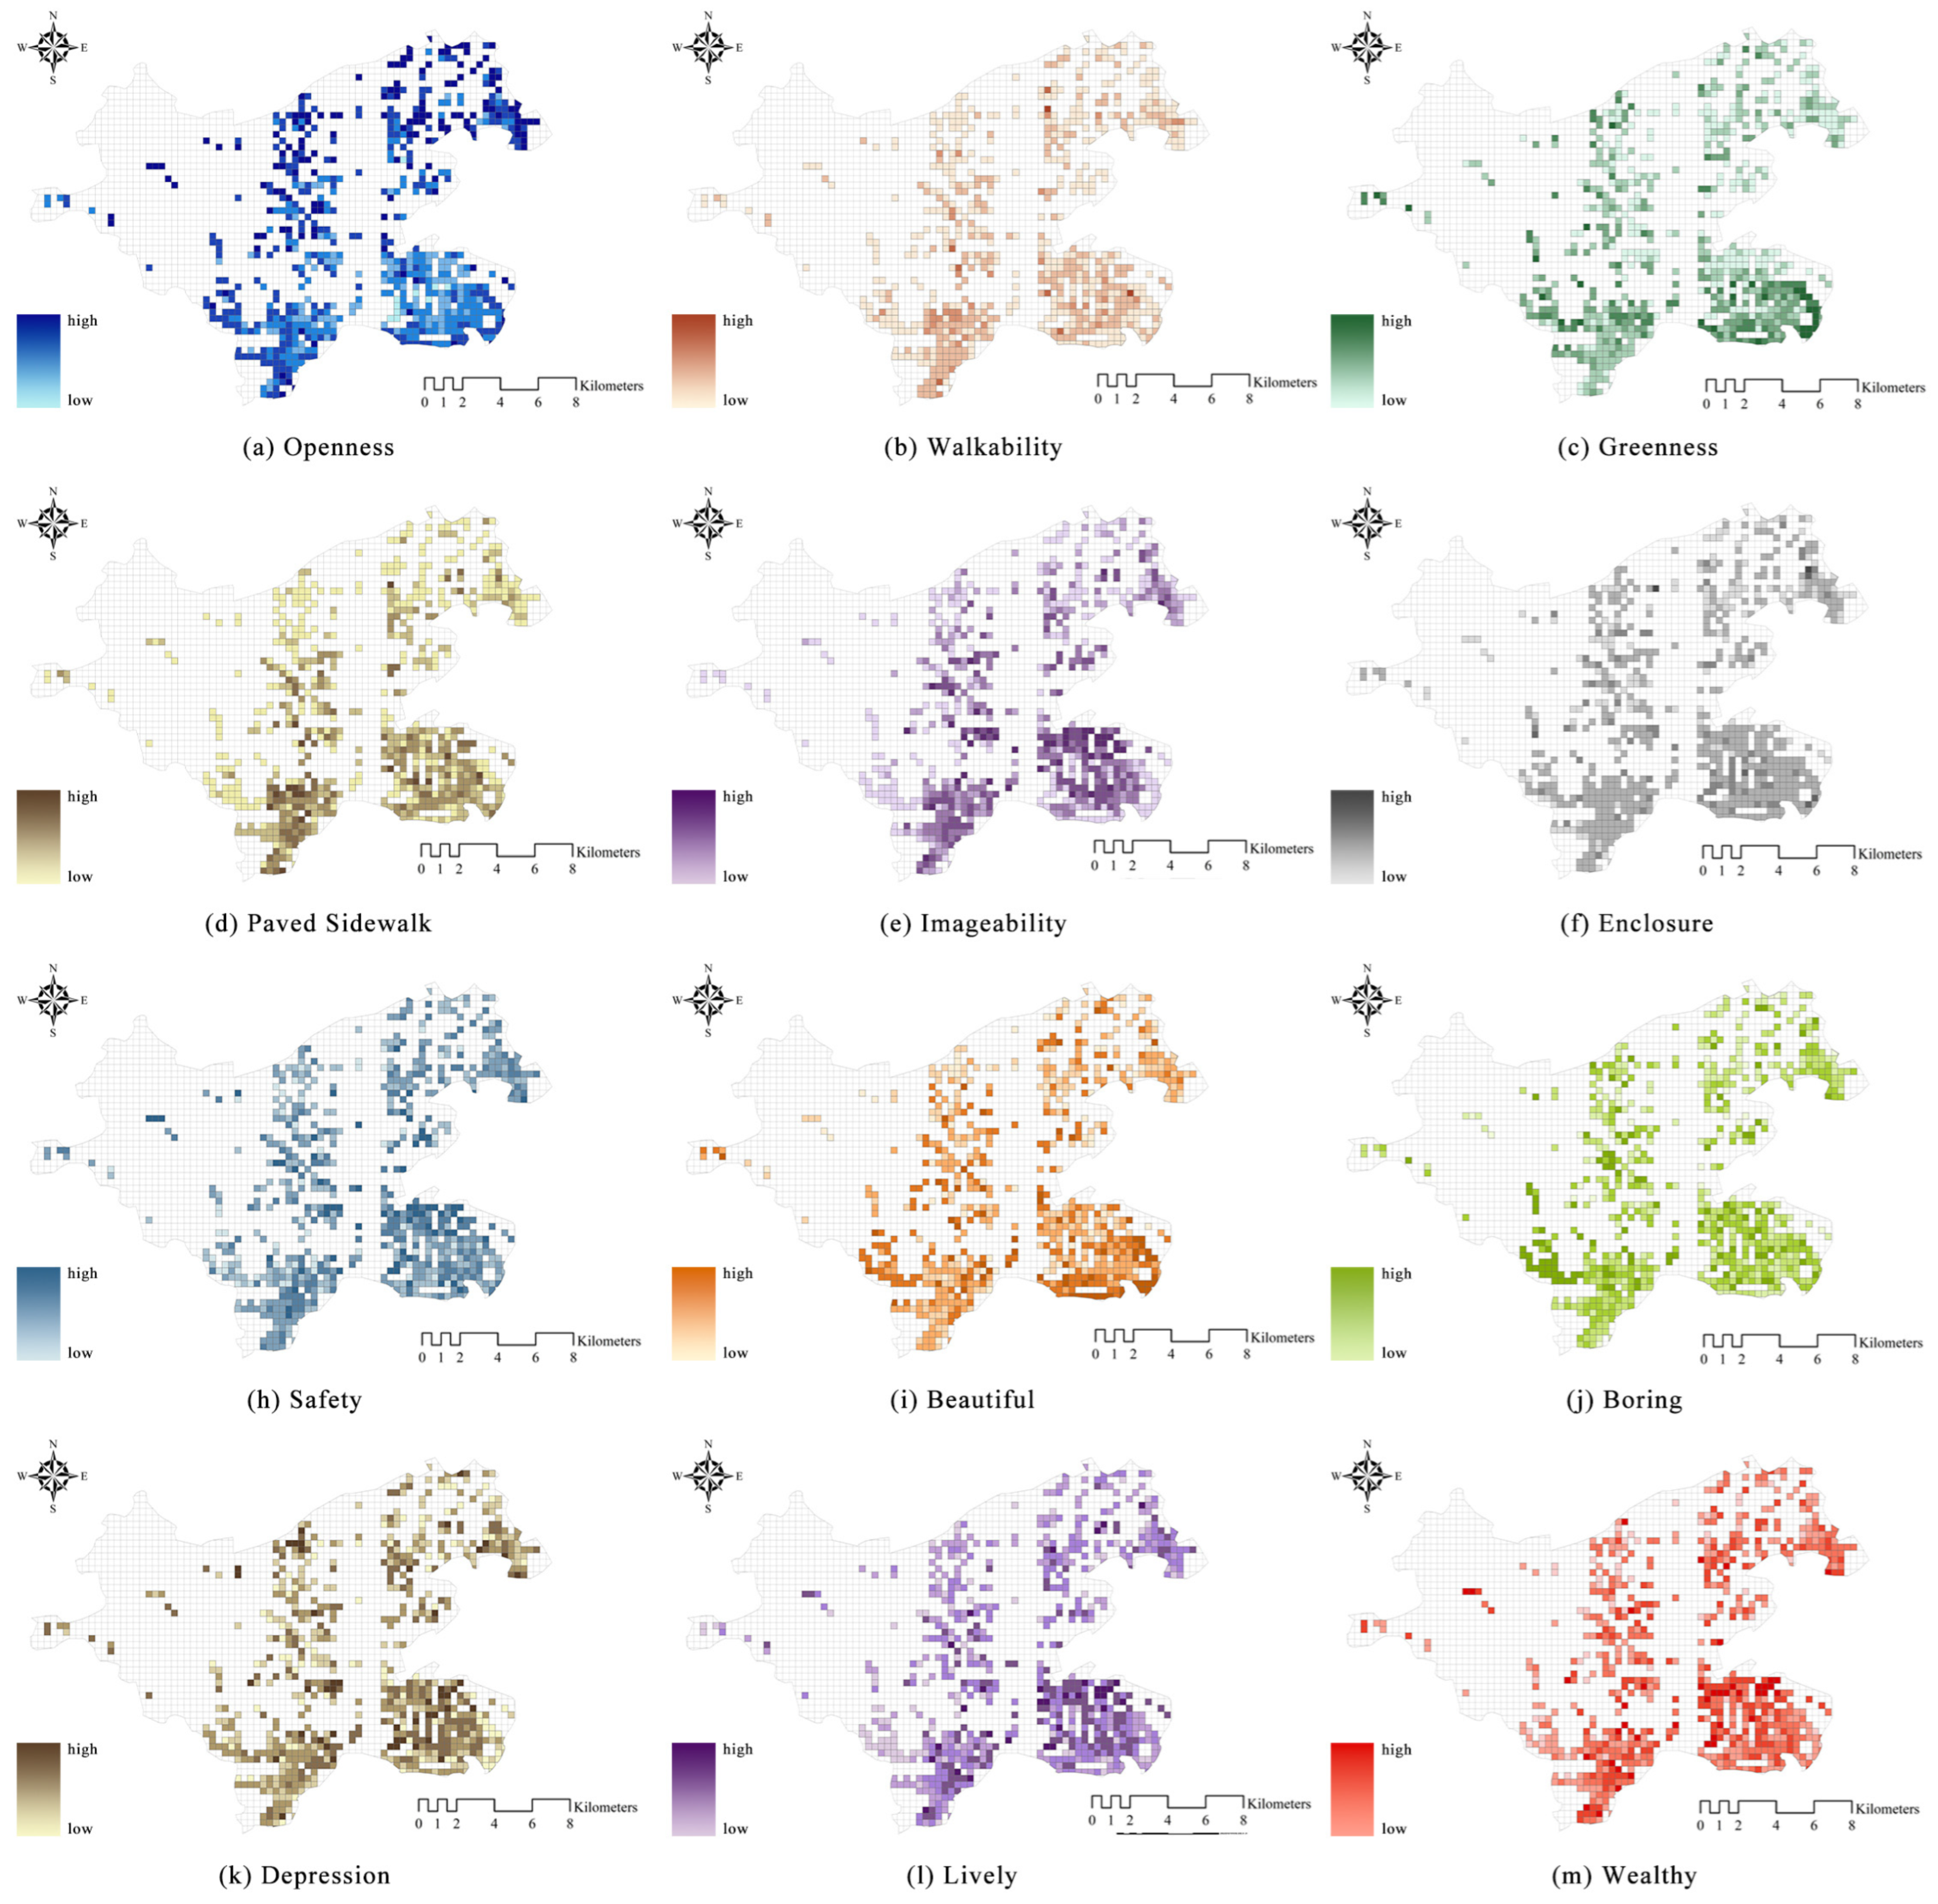
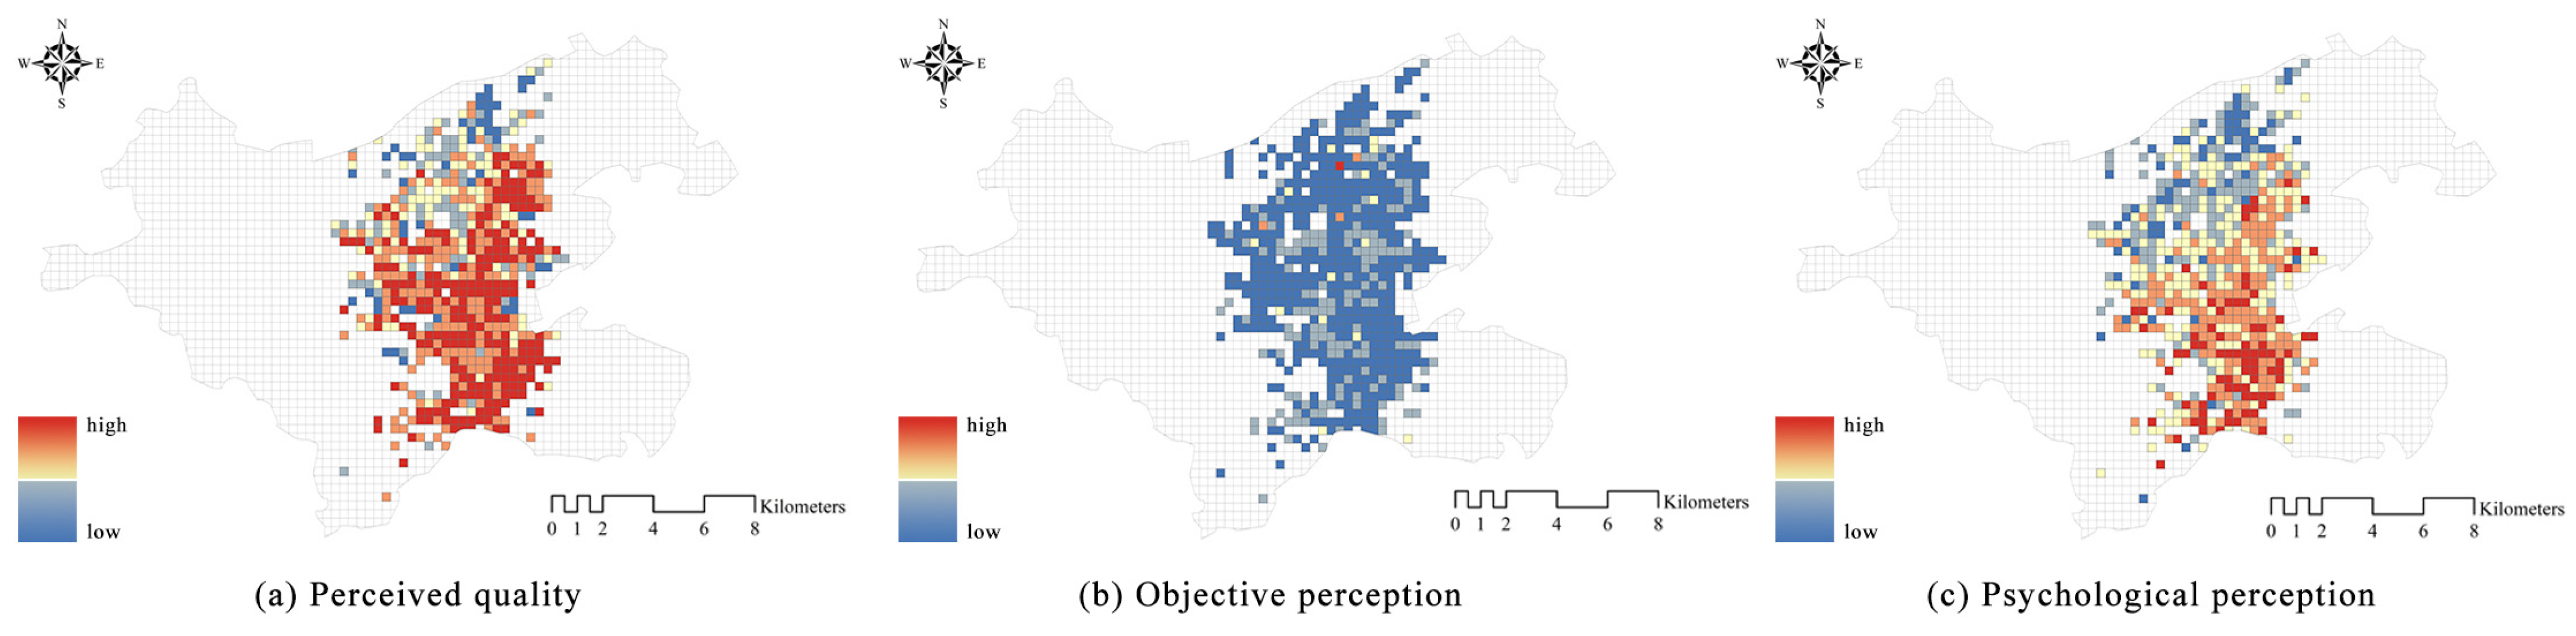
4.3. The Analysis of Perceived Quality

The perceptual quality of streets showed minimal differences between the different levels of accessibility. Figure 8 illustrates that high-accessibility streets exhibit a higher overall level of perceptual quality compared to those with low accessibility. In terms of objective perception, low-accessibility streets rated higher than those with high accessibility. However, in terms of subjective perception, high-accessibility streets scored higher than those with low accessibility.
Table 4 presents subjective and objective perception quality evaluations of the streets with different levels of accessibility. In terms of objective perception, high-accessibility streets exhibited a higher level of openness and lower enclosure compared to those with low accessibility, albeit slightly lower levels of green coverage, intentionality, and pedestrian convenience. Regarding subjective perception, high-accessibility streets scored higher in regard to perceived vibrancy, safety, and affluence compared to their low-accessibility counterparts. They also rated lower in terms of perceived beauty, depressiveness, and boredom, indicating that high-accessibility streets tend to evoke more positive psychological responses among the public.
In high-accessibility streets, those with a higher perceived quality are predominantly located in the Xigang District (Figure 9a). The distribution of the objective quality perceptions is more dispersed (Figure 9b), with Table 3 showing the average ranking of the objective perceptions, as follows: enclosure > openness > walkability > imageability > paved sidewalk > greenness. This result indicates that most streets have the highest enclosure and lowest greenness. The strong sense of enclosure in these streets is influenced by the large proportion of sky coverage and significant presence of motorways, minimal pedestrian pavements, and poor walkability, thus offering inadequate walking conditions for residents. Moreover, these street spaces lack distinctive buildings and landscapes, making it difficult for the public to form lasting impressions of the street environment (Appendix A.1). Streets with a higher subjective perception quality are mainly concentrated in the central areas of Xigang and Ganjingzi districts (Figure 9c). The ranking of the subjective perceptions are as follows: boredom > depressing > affluence > beauty > safety > vibrancy. This indicates that in high-accessibility street spaces, the public experiences more negative psychological perceptions of boredom and depression, with a lack of vibrancy. The poor environmental conditions and deteriorating buildings diminish the overall aesthetic appeal of the streets and reduce public perceptions of safety, leading to anxiety.
In low-accessibility streets, those with a higher perceived quality exhibit a dispersed pattern, mainly distributed in the southern part of the central area of Dalian City (Figure 10a). Streets with higher objective quality perceptions also show a scattered distribution, with weak clustering tendencies (Figure 10b). The overall green coverage in these street spaces is relatively low. Table 3 displays the average ranking of the objective perceptions, as follows: enclosure > openness > walkability > imageability > paved sidewalks > greenness. The low green coverage ratio and high level of enclosure indicate that buildings constitute the primary component of low-accessibility streets. Due to the relatively high openness of these street spaces, it suggests that most buildings are low-rise structures. While the streets exhibit good walkability, the low intentionality suggests a scarcity of iconic streetscape elements, such as traffic signs and billboards (Appendix A.2). Subjectively, perceptions are also dispersed (Figure 10c). The ranking of the subjective perceptions are as follows: boring > depressing > wealthy > beautiful > safe > lively. Low-accessibility streets score lowest in terms of vibrancy and highest in regard to depression and boredom, indicating that such perceptions have an impact on public social behavior. Streets with low perceptions in terms of safety accompany higher crime rates. Low perceptions of beauty and affluence suggest that the built street environment has a lower maintenance level.

4.4. Spatial Diagnostics

Based on high accessibility and low accessibility, this study established two coordinate systems. Perceived quality was used as the horizontal axis. Urban function was used as the vertical axis (Figure 11).

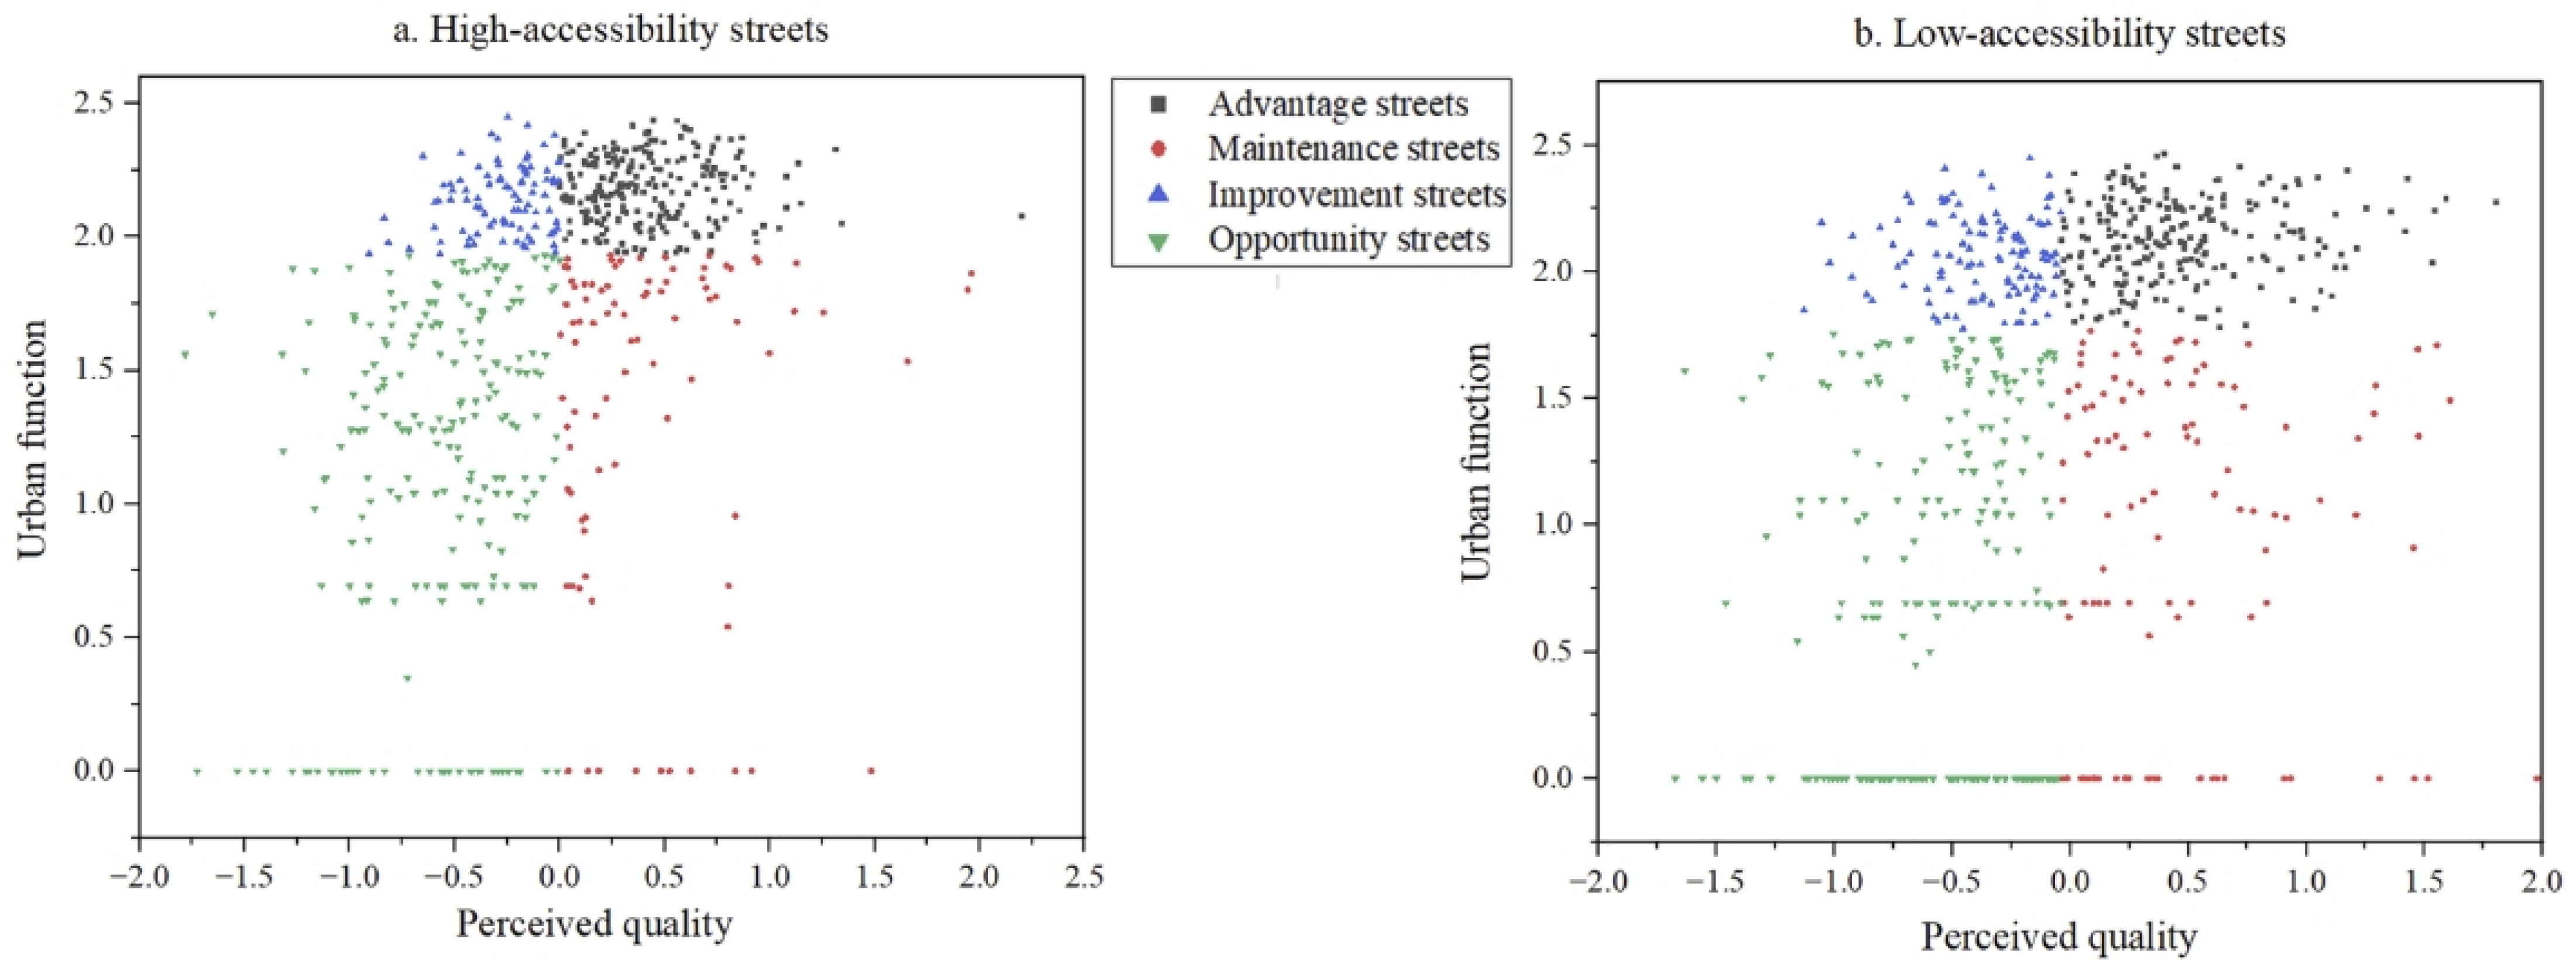
4.4.1. The Spatial Diagnosis in Terms of High-Accessibility Streets

Table 5 shows the distribution of four types of streets in terms of high-accessibility streets. Advantage streets and opportunity streets are the most common, accounting for 35.23% and 34.91%. Table 6 shows the subjective and objective qualities and urban facility results for the four types of high-accessibility street spaces. From Table 6, it can be seen that compared to other streets, advantage streets provide residents with sufficient density and variety in terms of urban infrastructure. These streets also rank the highest in terms of certain psychological perceptions, including boring, depressing, lively, safe, and wealthy. In terms of objectives perception, advantage streets exhibit the highest values for paved sidewalks and imageability. However, their greenness and openness are the lowest among the four street types. Maintenance streets have a relatively high amount of urban infrastructure, primarily consisting of public and commercial facilities. However, their perceived quality is lower due to poor levels of paved sidewalks, walkability, and imageability. In terms of psychological perceptions, attributes such as beautiful, depressing, lively, and wealthy were ranked lower. Improvement streets exhibited an overall high level of perceived quality, with the highest objective perception value. Enclosure and walkability were the highest ranked among the four street types. However, these streets have a lower quantity and variety of urban facilities, making it difficult for all residents to fully benefit from these urban functions. Transportation service is the lowest ranked type, while only the commercial facility density is relatively high in regard to this street type, meeting residents’ basic living needs. Increasing other types of facilities would help enhance the quality of life and overall livability in this regard. Opportunity streets have the lowest urban functions and perceived quality, showing significant potential for improvement among high-accessibility streets. However, openness is the highest ranked among the four types.

4.4.2. The Spatial Diagnosis in Terms of Low-Accessibility Streets

Table 5 shows the distribution of four types of streets in low-accessibility areas of the main urban area in Dalian. Among them, advantage streets and opportunity streets are the most common, accounting for 33.42% and 33.14%. From Table 7, it can be seen that compared to other street types, advantage streets have the highest quality and variety of urban facilities, allowing them to carry out most public urban functions. In terms of psychological perceptions, advantage streets have the highest score among the four street types, particularly for the terms depressing, lively, safe, and wealthy. In regard to objective perceptions, paved sidewalks and imageability are the highest ranked among the four street types, while openness is the lowest. Maintenance streets have a relatively high level of urban functionality, but lower perceived quality. In terms of psychological perceptions, beautiful has the lowest score among the four street types. In terms of objective perceptions, greenness and enclosure are the lowest ranked types, indicating a lack of aesthetic attractiveness. Enhancing greenness by planting a diverse range of vegetation to improve both the aesthetics and overall environmental quality would be beneficial. Improvement streets have a relatively low density and variety of urban facilities, showing that increasing the density and variety of facilities on these streets would help enhance their attractiveness and enrich the urban functions. The perceived quality of improvement streets was the highest among the four street types. In terms of objective perceptions, improvement streets have the highest score for greenness, walkability, and enclosure. In terms of psychological perceptions, beautiful has the highest score among the four street types. Opportunity streets have the lowest amount of urban facilities and level of quality among the four street types. However, openness has the highest, indicating significant potential for improvements to enhance the accessibility of these street.

5. Discussion

5.1. The Analysis of the Coupling Between Street Accessibility and Urban Functions

Streets are the basic framework of the urban space. They connect different functional areas, such as shopping, transportation, culture, and public services [17]. The street network in Dalian was evaluated using accessibility analysis and space syntax. Then, we quantified the urban amenities using POI data. The study found that the functional distribution of urban functions showed strong centripetal characteristics, gradually decreasing from the center to the outer area. High-accessibility streets have a higher density and diversity of urban functions than low-accessibility streets, particularly in regard to shopping services, transportation services, science/culture and education services, and public services. The spatial concentration of facilities reflects urbanization development model in Dalian. Urban functions are mainly located in streets with higher accessibility, which is consistent with the findings by Yin and Hajrasouliha [134].
Additionally, this study found that high-accessibility streets have higher perceived quality than low-accessibility streets. In terms of psychological perceptions, high-accessibility streets provide the public with a sense of liveliness, safety, and wealth. The results showed that rich facilities and social opportunities helped to decrease public stress. Thus, these benefits offer advantages in terms of mental health [135]. At the same time, the high amount of urban functions on offer reduces car travel. These functions provide the public with more opportunities for walking and cycling [136]. Therefore, residents find it easier to take part in daily physical activities, such as walking to the shops, visiting attractions, or going to parks. These activities are helpful for reducing the risk of obesity and cardiovascular diseases [137].
In the context of urban renewal, high-accessibility streets are often located in core areas where urban functions and facilities are concentrated. Living in core areas means it is easier to access urban amenities than living in suburban areas [138,139].
Furthermore, this difference reflected the land use strategies and priorities adopted in the city center. In Dalian, the commercial, transportation, cultural, and public facilities were constructed first. Based on spatial syntax theory, some research has shown that high-accessibility streets foster high street vitality [140]. These streets with convenient walking environments typically promote higher pedestrian flows and urban economic activities. A high density of shopping services indicated that economic activities were concentrated in certain areas. These facilities could meet the needs of consumers and businesses and promote economic growth. A high density of transportation services was helpful for enhancing spatial vitality, because a high density of transportation services could increase public mobility and social interactions [141]. Transportation services could also promote the integration of urban amenities, enhancing urban livability and sustainability [142]. A high density of education and medical facilities could meet residents’ basic needs [143]. Meanwhile, public services provided diverse leisure activities. Sports services were helpful for physical health. The reasonable planning of public facilities could enable residents to enjoy convenient and efficient services. It could enhance public life-related satisfaction and well-being [144]. However, the total area of green spaces in the central district was limited by other land uses. It is hard to increase the amount of green spaces.
On the other hand, a high-quality street environment could enhance the facility utilization efficiency. It could offer more convenience to residents and tourists. A good walking environment could improve street accessibility. It was found that some urban amenities were easier to use, such as commercial and public facilities. For example, high levels of greenness and openness provide the public with high-quality resting spaces. These subjective features were helpful for decreasing the pressure due to high-density streets. Therefore, they could enhance street comfort and safety, thus increasing the public’s willingness to stay in the area.
Low-accessibility streets were mainly located in suburban areas. Some streets with a high density of urban amenities and a high level of perceived quality need to improve their accessibility. These streets were helpful for enhancing residents’ walking experiences and easier to gain access to urban functions. Increasing transportation facilities is one way to improve convenience for non-motorized vehicles and pedestrians. For example, constructing dedicated pedestrian and bicycle lanes was helpful for creating safe and convenient walking and cycling environments. Studies have indicated that well-designed pedestrian and cycling facilities not only reduced traffic congestion, but also promoted healthy lifestyles [145]. Furthermore, some methods could be used to improve street accessibility, such as enhancing street quality, optimizing street layout, or enhancing landscape design. In addition, increasing the number of green spaces and sidewalk widths were helpful for optimizing street layouts. This could enhance comfort and safety for pedestrians and cyclists and promote vitality in these areas [146]. Integrating art installations and urban culture into street spaces was helpful for enhancing the perceived quality of the area by residents and visitors, enhancing social interactions and vitality in the area [147].

5.2. Identify the Priority Roads in the Location

This study established a coordinate system based on urban function, street accessibility, and perceived quality. Then, spatial diagnostics were conducted for every type of street.
Advantage streets had high-density and high-diversity urban amenities. These streets could provide diverse services and amenities. They were helpful for meeting the needs of residents and tourists. In addition, these streets showed a high level of perceived quality, with well-designed public spaces. In regard to objective perceptions, paved sidewalks and imageability were the highest ranked of the four street types. This indicates that advantage streets have advantages in terms of the walking environment and landscape ionizability. But greenness and openness were the lowest ranked types, because high-density buildings reduce green spaces and open spaces. In terms of psychological perceptions, depressing, lively, safe, and wealthy types were the lowest ranked in terms of the four street types. This indicated that these streets are generally considered to be more prosperous, safe, and economically developed areas.
In regard to maintenance streets, the distribution of urban amenities was clustered together. These facilities could meet residents’ basic needs. Moreover, enhancing the perceived quality could improve the environment in regard to these streets. In regard to objective perceptions, paved sidewalks, walkability, and imageability were the lowest ranked in regard to the four street types. This indicates that creating a pleasant walking and leisure environment is key to enhancing objective perceptions in regard to maintenance streets [148]. In terms of psychological perceptions, beautiful was ranked lower in regard to maintenance streets in regard to high- and low-accessibility streets. Reinforcing infrastructure maintenance could enhance street aesthetics [149].
Improvement streets have high potential. These streets need to increase infrastructure investment, while preserving and enhancing existing the environmental quality. Urban functions could be enhanced by adding commercial, education, and medical services. Street vitality could be improved by improving transportation services [150]. In terms of perceived quality, improvement streets had a high level of greenness, but the street interface was closed and it was stressful for pedestrians. Increasing vertical greening not only enhanced the level of greenness, but also improved sky visibility [151,152].
Opportunity streets had significant potential for development in regard to both urban amenities and spatial aspects. Investing in infrastructure construction could enhance the region’s basic service levels. Increasing the level of openness could enhance the comfort of public activities, positive emotions, and psychological well-being [80]. Furthermore, constructing unique architecture, installing landscape features, and planting diverse vegetation could enhance the aesthetics and attractiveness of streetscapes [153]. Thereby, enhancing the overall perceptual quality of opportunity streets.

5.3. Limitations

This study has certain limitations that need to be discussed.
It focuses on the city level. But this study does not include a functional classification for commercial, residential, shopping, and cultural services. Classification research is beneficial for formulating more targeted policies and measures based on the specific needs and characteristics of different functional areas. This method could promote coordinated development among different zones and enhance the urban functions in the city.
This study conducts spatial analysis based on street accessibility. In future research, urban heat maps could be used to learn about pedestrian and traffic flows at different times. Analyzing urban functional vitality at various times could help identify deficiencies in living facilities and services, thereby improving residents’ quality of life and satisfaction.
Furthermore, deep learning and street view images were used to quantify public perceptions in this study. In future research, neurobiological methods could be applied to more precisely measure and evaluate residents’ real-time experiential environment while walking and sitting. This approach could explore the impact of street density and the distribution of various urban amenities on human perceptions [106].

6. Conclusions

Based on space syntax theory, this study analyzed street accessibility. Then, high- and low-accessibility streets were identified for the study. Points of interest (POIs) data were used to measure the density of urban amenities. Perceived quality was quantified using deep learning and SVIs. In addition, this study involved carring out a coupling analysis from three dimensions: street accessibility, urban amenities, and perceived street quality. Then, the spatial distribution differences in terms of urban amenities and perceived quality were analyzed in this study in regard to streets with different levels of accessibility. Then, the streets were divided into four types. Problems with the layout of facilities and spatial quality were explored in terms of the different street types. Meanwhile, the study proposed targeted optimization strategies. This study is helpful for ensuring residents can equitably enjoy urban amenities and high-quality streets.
This study’s findings are as follows:
(1)
In the core area of Dalian, high-accessibility streets were mainly located in the central region, while low-accessibility streets mainly located in the urban periphery;
(2)
High-accessibility streets have a higher perceived quality than low-accessibility streets. Specifically, in terms of psychological perceptions, lively, safe, and depressing perceptions scored higher in regard to high-accessibility streets than low-accessibility streets. In terms of objective perceptions, high-accessibility streets ranked lower than low-accessibility streets. Greenness, the amount of paved sidewalks, and walkability in high-accessibility streets need to be improved;
(3)
By comparing the density of urban amenities, shopping services were ranked the highest in regard to high-accessibility streets and low-accessibility streets. However, public services were ranked the lowest;
(4)
Through carrying out coupling analysis, this study found that high-accessibility streets and low-accessibility streets share similar advantages and problems in regard to the four street types. The proportion of advantage streets and opportunity streets were high in regard to the four types of streets. The density and diversity of urban amenities were the highest in regard to advantage streets. In terms of psychological perceptions, depressing, lively, safe, and wealthy were ranked the highest in regard to the four street types. In terms of objective perceptions, paved sidewalks and imageability were ranked the highest in terms of the four types of streets. In regard to the maintenance streets, beautiful was ranked the lowest of the four street types. In regard to the improvement streets, the objective perception was ranked the highest in terms of the four types of streets. However, beautiful was ranked the highest. In regard to opportunity streets, openness was the highest ranked of the four types of streets.
Optimizing the function and quality of different street types not only enhances the overall environmental quality, but also promotes social equity and economic development. It is helpful for sustainable urban development. Meanwhile, this study provides scientific data analysis and a comprehensive evaluation of the area for urban planning and management departments. It is helpful for creating more urban development strategies that enhance overall urban livability and attractiveness.

Author Contributions

Conceptualization, Y.M., J.S., H.F. and M.L.; methodology, Y.M., J.S. and H.F.; software, Y.M., J.S. and D.S.; validation, J.S., M.L. and H.F.; formal analysis, J.S., M.L. and H.F.; investigation, Y.M., J.S. and D.S.; resources, Y.M., J.S., M.L. and H.F.; data curation, Y.M. and J.S.; writing—original draft preparation, Y.M., J.S. and M.L.; writing—review and editing, Y.M., J.S., M.L. and D.S.; visualization, Y.M. and D.S.; supervision, Y.M., H.F. and M.L.; project administration, H.F. and M.L.; funding acquisition, M.L. All authors have read and agreed to the published version of the manuscript.

Funding

This research was funded by a Project of Liaoning Provincial Department of Education, grant numbers, JYTMS20231583.

Data Availability Statement

Interview transcripts and interpreted statements supporting this study’s findings and the smart contract codes are available from the corresponding author upon reasonable request.

Acknowledgments

We would like to thank the journal experts who edited this paper. We also appreciate the constructive suggestions and comments on the manuscript from the reviewers and editors.

Conflicts of Interest

The authors declare that there are no conflicts of interest.

Appendix A

Appendix A.1

Figure A1. The spatial distribution of perceptual features in high-accessibility streets.
Buildings 15 00998 g0a1

Appendix A.2

Figure A2. The spatial distribution of perceptual features in low-accessibility streets.
Buildings 15 00998 g0a2

References

  1. Gehl, J. Cities for People; Island Press: Washington, DC, USA, 2010. [Google Scholar]
  2. Cai, Z.; Kwak, Y.; Cvetkovic, V.; Deal, B.; Mörtberg, U. Urban spatial dynamic modeling based on urban amenity data to inform smart city planning. Anthropocene 2023, 42, 100387. [Google Scholar] [CrossRef]
  3. Smith, B.A. Measuring the value of urban amenities. J. Urban Econ. 1978, 5, 370–387. [Google Scholar] [CrossRef]
  4. Larsson, A.; Elldér, E.; Vafeiadis, E.; Curtis, C.; Steiner, A. Exploring the potential for sustainable accessibility across settlement types. A Swedish case. Transp. Res. Part D: Transp. Environ. 2022, 107, 103297. [Google Scholar] [CrossRef]
  5. Olsen, J.R.; Thornton, L.; Tregonning, G.; Mitchell, R. Nationwide equity assessment of the 20-min neighbourhood in the scottish context: A socio-spatial proximity analysis of residential locations. Soc. Sci. Med. 2022, 315, 115502. [Google Scholar] [CrossRef] [PubMed]
  6. Olsen, J.R.; Nicholls, N.; Whitley, E.; Mitchell, R. Association between local amenities, travel behaviours and urban planning: A spatial analysis of a nationwide UK household panel study. J. Transp. Health 2024, 36, 101784. [Google Scholar] [CrossRef]
  7. Xiao, Y.; Wang, Z.; Li, Z.; Tang, Z. An assessment of urban park access in Shanghai—Implications for the social equity in urban China. Landsc. Urban Plan. 2017, 157, 383–393. [Google Scholar] [CrossRef]
  8. Jane, J. The Death and Life of Great American Cities; Random House: New York, NY, USA, 1961. [Google Scholar]
  9. Carmona, M. Public Places Urban Spaces: The Dimensions of Urban Design, 3rd ed.; Routledge: London, UK, 2021. [Google Scholar]
  10. Zhang, G.; Xing, L. Research on tourism economic effect under the threshold of new-type urbanization in coastal cities of China: From the perspective of development economics. Ocean. Coast. Manag. 2023, 239, 106587. [Google Scholar] [CrossRef]
  11. Özer, M.; Küçüksakarya, S.; Maiti, M. Nexus of tourism demand, economic growth, and external competitiveness in leading tourist destination countries. Tour. Manag. Perspect. 2022, 42, 100965. [Google Scholar] [CrossRef]
  12. Santamaria, D.; Filis, G. Tourism demand and economic growth in Spain: New insights based on the yield curve. Tour. Manag. 2019, 75, 447–459. [Google Scholar] [CrossRef]
  13. Montgomery, J. Making a city: Urbanity, vitality and urban design. J. Urban Des. 2007, 3, 93–116. [Google Scholar] [CrossRef]
  14. Gehl, J. Life Between Buildings: Using Public Space; Island Press: Washington, DC, USA, 2011. [Google Scholar]
  15. Liu, J.; Meng, B.; Shi, C. A multi-activity view of intra-urban travel networks: A case study of Beijing. Cities 2023, 143, 104634. [Google Scholar] [CrossRef]
  16. Burger, M.J.; van der Knaap, B.; Wall, R.S. Polycentricity and the Multiplexity of Urban Networks. Eur. Plan. Stud. 2013, 22, 816–840. [Google Scholar] [CrossRef]
  17. Yang, X.; Zheng, X.; Cao, Y.; Chen, H.; Tang, L.; Yang, H. Connectivity analysis in pedestrian networks: A case study in Wuhan, China. Appl. Geogr. 2023, 151, 102843. [Google Scholar] [CrossRef]
  18. Li, H.; Wei, Y.D.; Wu, Y. Urban amenity, human capital and employment distribution in Shanghai. Habitat Int. 2019, 91, 102025. [Google Scholar] [CrossRef]
  19. Glaeser, E.L.; Kominers, S.D.; Luca, M.; Naik, N. Big Data and Big Cities: The Promises and Limitations of Improved Measures of Urban Life. Econ. Inq. 2016, 56, 114–137. [Google Scholar] [CrossRef]
  20. Mulligan, G.F.; Carruthers, J.I. Amenities, Quality of Life, and Regional Development. In Investigating Quality of Urban Life; Marans, R., Stimson, R., Eds.; Springer: Dordrecht, The Netherlands, 2011. [Google Scholar]
  21. Mobley, L.R.; Root, E.D.; Finkelstein, E.A.; Khavjou, O.; Farris, R.P.; Will, J.C. Environment, obesity, and cardiovascular disease risk in low-income women. Am. J. Prev. Med. 2006, 30, 327–332. [Google Scholar] [CrossRef] [PubMed]
  22. Kaczynski, A.T.; Besenyi, G.M.; Stanis, S.A.; Koohsari, M.J.; Oestman, K.B.; Bergstrom, R.; Potwarka, L.R.; Reis, R.S. Are park proximity and park features related to park use and park-based physical activity among adults? Variations by multiple socio-demographic characteristics. Int. J. Behav. Nutr. Phys. Act. 2014, 11, 146. [Google Scholar] [CrossRef]
  23. Halonen, J.I.; Stenholm, S.; Kivimaki, M.; Pentti, J.; Subramanian, S.V.; Kawachi, I.; Vahtera, J. Is change in availability of sports facilities associated with change in physical activity? A prospective cohort study. Prev. Med. 2015, 73, 10–14. [Google Scholar] [CrossRef]
  24. Sarkar, C.; Webster, C. Urban environments and human health: Current trends and future directions. Curr. Opin. Environ. Sustain. 2017, 25, 33–44. [Google Scholar] [CrossRef]
  25. Ewing, R.; Cervero, R. Travel and the Built Environment. J. Am. Plan. Assoc. 2010, 76, 265–294. [Google Scholar] [CrossRef]
  26. Tahmasbi, B.; Mansourianfar, M.H.; Haghshenas, H.; Kim, I. Multimodal accessibility-based equity assessment of urban public facilities distribution. Sustain. Cities Soc. 2019, 49, 101633. [Google Scholar] [CrossRef]
  27. Ashik, F.R.; Mim, S.A.; Neema, M.N. Towards vertical spatial equity of urban facilities: An integration of spatial and aspatial accessibility. J. Urban Manag. 2020, 9, 77–92. [Google Scholar] [CrossRef]
  28. Xu, Y.; Zhang, Q.; Zheng, S. The rising demand for subway after private driving restriction: Evidence from Beijing’s housing market. Reg. Sci. Urban Econ. 2015, 54, 28–37. [Google Scholar] [CrossRef]
  29. Zhang, Y.; Dong, R. Impacts of Street-Visible Greenery on Housing Prices: Evidence from a Hedonic Price Model and a Massive Street View Image Dataset in Beijing. ISPRS Int. J. Geo-Inf. 2018, 7, 104. [Google Scholar] [CrossRef]
  30. Aschauer, D.A. Is Public Expenditure Productive? J. Monet. Econ. 1989, 23, 177–200. [Google Scholar] [CrossRef]
  31. Næss, P.; Strand, A.; Wolday, F.; Stefansdottir, H. Residential location, commuting and non-work travel in two urban areas of different size and with different center structures. Prog. Plan. 2019, 128, 1–36. [Google Scholar] [CrossRef]
  32. Naess, P. Urban form and travel behavior: Experience from a Nordic context. J. Transp. Land Use 2012, 5, 21–45. [Google Scholar] [CrossRef]
  33. Newman, P.W.G.; Kenworthy, J.R. Cities and Automobile Dependence: A Sourcebook; Gower Technical: Farnham, UK, 1989. [Google Scholar]
  34. Cafuta, M.R. Open Space Evaluation Methodology and Three Dimensional Evaluation Model as a Base for Sustainable Development Tracking. Sustainability 2015, 7, 13690–13712. [Google Scholar] [CrossRef]
  35. Lee, J.; Kim, D.; Park, J. A Machine Learning and Computer Vision Study of the Environmental Characteristics of Streetscapes That Affect Pedestrian Satisfaction. Sustainability 2022, 14, 5730. [Google Scholar] [CrossRef]
  36. Proshansky, H.M. The City and Self-Identity. Environ. Behav. 2016, 10, 147–169. [Google Scholar] [CrossRef]
  37. Ye, Y.; Zeng, W.; Shen, Q.; Zhang, X.; Lu, Y. The visual quality of streets: A human-centred continuous measurement based on machine learning algorithms and street view images. Environ. Plan. B Urban Anal. City Sci. 2019, 46, 1439–1457. [Google Scholar] [CrossRef]
  38. Tang, J.; Long, Y. Measuring visual quality of street space and its temporal variation: Methodology and its application in the Hutong area in Beijing. Landsc. Urban Plan. 2019, 191, 103436. [Google Scholar] [CrossRef]
  39. Johansson, M.; Sternudd, C.; Kärrholm, M. Perceived urban design qualities and affective experiences of walking. J. Urban Des. 2016, 21, 256–275. [Google Scholar] [CrossRef]
  40. Cheng, L.; Chu, S.; Zong, W.; Li, S.; Wu, J.; Li, M. Use of Tencent Street View Imagery for Visual Perception of Streets. ISPRS Int. J. Geo-Inf. 2017, 6, 265. [Google Scholar] [CrossRef]
  41. Ewing, R.; Cervero, R. Travel and the Built Environment: A Synthesis. Transp. Res. Rec. 2001, 1780, 87–114. [Google Scholar] [CrossRef]
  42. Lee, J.; Miller, H.J. Measuring the impacts of new public transit services on space-time accessibility: An analysis of transit system redesign and new bus rapid transit in Columbus, Ohio, USA. Appl. Geogr. 2018, 93, 47–63. [Google Scholar] [CrossRef]
  43. Ye, Y.; Richards, D.; Lu, Y.; Song, X.; Zhuang, Y.; Zeng, W.; Zhong, T. Measuring daily accessed street greenery: A human-scale approach for informing better urban planning practices. Landsc. Urban Plan. 2019, 191, 103434. [Google Scholar] [CrossRef]
  44. Hillier, B. The Hidden Geometry of Deformed Grids: Or, Why Space Syntax Works, When it Looks as Though it Shouldn’t. Environ. Plan. B Plan. Des. 1999, 26, 169–191. [Google Scholar] [CrossRef]
  45. Hillier, B.; Hanson, J. The Social Logic of Space; Cambridge University Press: London, UK, 1984. [Google Scholar]
  46. Zhang, T.; Lian, Z.; Xu, Y. Combining GPS and space syntax analysis to improve understanding of visitor temporal–spatial behaviour: A case study of the Lion Grove in China. Landsc. Res. 2020, 45, 534–546. [Google Scholar] [CrossRef]
  47. Hacar, Ö.; Gülgen, F.; Bilgi, S. Evaluation of the Space Syntax Measures Affecting Pedestrian Density through Ordinal Logistic Regression Analysis. ISPRS Int. J. Geo-Inf. 2020, 9, 589. [Google Scholar] [CrossRef]
  48. Bafna, S. Space Syntax. Environ. Behav. 2016, 35, 17–29. [Google Scholar] [CrossRef]
  49. Li, Q.; Liu, X.; Lian, X.; Lin, S.; Li, J. Research on Park Green Space Accessibility of Nantai Island in Fuzhou City, China, Based on Space Syntax. J. Guangxi Norm. Univ. Nat. Sci. Ed. 2021, 39, 181–195. [Google Scholar] [CrossRef]
  50. Tan, W.; Liu, L.; Chen, T.; Lv, L.; Pan, H. Accessibility of Comprehensive Parks of Fuzhou City Based on Spatial Syntax. J. Chin. Urban For. 2019, 18, 52–56. [Google Scholar]
  51. Tao, W.; Lin, K.; Gu, H.; Liao, C.; Liu, S.; Ou, Q. Spatio-Temporal Evolution of Shawan Ancient Town in Guangzhou from the Perspective of Spatial Syntax. Trop. Geogr. 2020, 40, 970–980. [Google Scholar] [CrossRef]
  52. Fu, Y.; Yang, F.; Bao, Z. Research on Accessibility of Hangzhou Comprehensive Parks Based on Spatial Syntax and LBS Big Data. Landsc. Archit. 2021, 28, 69–75. [Google Scholar] [CrossRef]
  53. Gu, H.; Huang, D.; Shen, T.; Qin, X. Space Syntax Model Verification and Application in Urban Design with Multi-source Data. Planners 2019, 35, 67–73. [Google Scholar]
  54. Wang, C.; Li, Y. Study on the Space Utilization Optimization of Urban Historic Districts Based on Space Syntax and POI Analysis: A Case of Shichahai District in Beijing. Urban. Archit. 2023, 20, 69–87. [Google Scholar] [CrossRef]
  55. Jiang, B.; Claramunt, C.; Klarqvist, B. Integration of space syntax into GIS for modelling urban spaces. Int. J. Appl. Earth Obs. Geoinf. 2000, 2, 161–171. [Google Scholar] [CrossRef]
  56. Jia, J.; Zhang, X.; Huang, C.; Luan, H. Multiscale analysis of human social sensing of urban appearance and its effects on house price appreciation in Wuhan, China. Sustain. Cities Soc. 2022, 81, 103844. [Google Scholar] [CrossRef]
  57. Chang, H.-S.; Liao, C.-H. Exploring an integrated method for measuring the relative spatial equity in public facilities in the context of urban parks. Cities 2011, 28, 361–371. [Google Scholar] [CrossRef]
  58. Tsou, K.-W.; Hung, Y.-T.; Chang, Y.-L. An accessibility-based integrated measure of relative spatial equity in urban public facilities. Cities 2005, 22, 424–435. [Google Scholar] [CrossRef]
  59. Welch, T.F.; Mishra, S. A measure of equity for public transit connectivity. J. Transp. Geogr. 2013, 33, 29–41. [Google Scholar] [CrossRef]
  60. Sahitya, K.S.; Prasad, C.S.R.K. Evaluation of opportunity based urban road network accessibility using GIS. Spat. Inf. Res. 2020, 28, 487–493. [Google Scholar] [CrossRef]
  61. Witten, K.; Exeter, D.; Field, A. The Quality of Urban Environments: Mapping Variation in Access to Community Resources. Urban Stud. 2016, 40, 161–177. [Google Scholar] [CrossRef]
  62. Sun, D.; Ji, X.; Lyu, M.; Fu, Y.; Gao, W. Evaluation and diagnosis for the pedestrian quality of service in urban riverfront streets. J. Clean Prod. 2024, 452, 142090. [Google Scholar] [CrossRef]
  63. Cerbero, R.; Kockelman, A.K. Travel demand and the 3Ds Density, diversity, and design. Transp. Res. Part D Transp. Environ. 1997, 2, 199–219. [Google Scholar]
  64. Hwang, J.; Joh, K.; Woo, A. Social inequalities in child pedestrian traffic injuries: Differences in neighborhood built environments near schools in Austin, TX, USA. J. Transp. Health 2017, 6, 40–49. [Google Scholar] [CrossRef]
  65. Woo, A.; Yu, C.-Y.; Lee, S. Neighborhood walkability for subsidized households: Revisiting neighborhood environments of Housing Choice Voucher and Low-Income Housing Tax Credit households. Cities 2019, 89, 243–251. [Google Scholar] [CrossRef]
  66. Dumbaugh, E.; Li, W.; Joh, K. The built environment and the incidence of pedestrian and cyclist crashes. Urban Des. Int. 2013, 18, 217–228. [Google Scholar] [CrossRef]
  67. Smith, M.; Hosking, J.; Woodward, A.; Witten, K.; MacMillan, A.; Field, A.; Baas, P.; Mackie, H. Systematic literature review of built environment effects on physical activity and active transport—An update and new findings on health equity. Int. J. Behav. Nutr. Phys. Act. 2017, 14, 158. [Google Scholar] [CrossRef]
  68. Besenyi, G.M.; Kaczynski, A.T.; Stanis, S.A.; Bergstrom, R.D.; Lightner, J.S.; Hipp, J.A. Planning for health: A community-based spatial analysis of park availability and chronic disease across the lifespan. Health Place 2014, 27, 102–105. [Google Scholar] [CrossRef] [PubMed]
  69. Xiao, Y.; Li, Z.; Webster, C. Estimating the mediating effect of privately-supplied green space on the relationship between urban public green space and property value: Evidence from Shanghai, China. Land Use Policy 2016, 54, 439–447. [Google Scholar] [CrossRef]
  70. Kong, F.; Sun, C.; Liu, F.; Yin, H.; Jiang, F.; Pu, Y.; Cavan, G.; Skelhorn, C.; Middel, A.; Dronova, I. Energy saving potential of fragmented green spaces due to their temperature regulating ecosystem services in the summer. Appl. Energy 2016, 183, 1428–1440. [Google Scholar] [CrossRef]
  71. Yang, J.; Guan, Y.; Xia, J.C.; Jin, C.; Li, X. Spatiotemporal variation characteristics of green space ecosystem service value at urban fringes: A case study on Ganjingzi District in Dalian, China. Sci. Total Environ. 2018, 639, 1453–1461. [Google Scholar] [CrossRef] [PubMed]
  72. Costanza, R.; Chichakly, K.; Dale, V.; Farber, S.; Finnigan, D.; Grigg, K.; Heckbert, S.; Kubiszewski, I.; Lee, H.; Liu, S.; et al. Simulation games that integrate research, entertainment, and learning around ecosystem services. Ecosyst. Serv. 2014, 10, 195–201. [Google Scholar] [CrossRef]
  73. Knoke, T.; Paul, C.; Hildebrandt, P.; Calvas, B.; Castro, L.M.; Hartl, F.; Dollerer, M.; Hamer, U.; Windhorst, D.; Wiersma, Y.F.; et al. Compositional diversity of rehabilitated tropical lands supports multiple ecosystem services and buffers uncertainties. Nat. Commun. 2016, 7, 11877. [Google Scholar] [CrossRef]
  74. Pelorosso, R.; Gobattoni, F.; Geri, F.; Leone, A. PANDORA 3.0 plugin: A new biodiversity ecosystem service assessment tool for urban green infrastructure connectivity planning. Ecosyst. Serv. 2017, 26, 476–482. [Google Scholar] [CrossRef]
  75. Mouratidis, K.; Yiannakou, A. What makes cities livable? Determinants of neighborhood satisfaction and neighborhood happiness in different contexts. Land Use Policy 2022, 112, 105855. [Google Scholar] [CrossRef]
  76. Wu, L.; Kim, S.K. Exploring the equality of accessing urban green spaces: A comparative study of 341 Chinese cities. Ecol. Indic. 2021, 121, 107080. [Google Scholar] [CrossRef]
  77. Pan, Z.; Liu, Y.; Liu, Y.; Huo, Z.; Han, W. Age-friendly neighbourhood environment, functional abilities and life satisfaction: A longitudinal analysis of older adults in urban China. Soc. Sci. Med. 2024, 340, 116403. [Google Scholar] [CrossRef]
  78. Biswas, B.; Sultana, Z.; Priovashini, C.; Ahsan, M.N.; Mallick, B. The emergence of residential satisfaction studies in social research: A bibliometric analysis. Habitat Int. 2021, 109, 102336. [Google Scholar] [CrossRef]
  79. Lyu, M.; Meng, Y.; Gao, W.; Yu, Y.; Ji, X.; Li, Q.; Huang, G.; Sun, D. Measuring the perceptual features of coastal streets: A case study in Qingdao, China. Environ. Res. Commun. 2022, 4, 115002. [Google Scholar] [CrossRef]
  80. Ma, X.Y.; Ma, C.Y.; Wu, C.; Xi, Y.L.; Yang, R.F.; Peng, N.Y.Z.; Zhang, C.; Ren, F. Measuring human perceptions of streetscapes to better inform urban renewal: A perspective of scene semantic parsing. Cities 2021, 110, 26. [Google Scholar] [CrossRef]
  81. Qiu, W.S.; Zhang, Z.Y.; Liu, X.; Li, W.J.; Li, X.J.; Xu, X.; Huang, X.K. Subjective or objective measures of street environment, which are more effective in explaining housing prices? Landsc. Urban Plan. 2022, 221, 24. [Google Scholar] [CrossRef]
  82. Lee, S.; Ye, X.; Nam, J.W.; Zhang, K. The association between tree canopy cover over streets and elderly pedestrian falls: A health disparity study in urban areas. Soc. Sci. Med. 2022, 306, 115169. [Google Scholar] [CrossRef] [PubMed]
  83. Hughey, S.M.; Walsemann, K.M.; Child, S.; Powers, A.; Reed, J.A.; Kaczynski, A.T. Using an environmental justice approach to examine the relationships between park availability and quality indicators, neighborhood disadvantage, and racial/ethnic composition. Landsc. Urban Plan. 2016, 148, 159–169. [Google Scholar] [CrossRef]
  84. Shin, H.-S.; Woo, A. Analyzing the effects of walkable environments on nearby commercial property values based on deep learning approaches. Cities 2024, 144, 104628. [Google Scholar] [CrossRef]
  85. Park, K.; Ewing, R.; Sabouri, S.; Larsen, J. Street life and the built environment in an auto-oriented US region. Cities 2019, 88, 243–251. [Google Scholar] [CrossRef]
  86. Wang, R.; Lu, Y.; Zhang, J.; Liu, P.; Yao, Y.; Liu, Y. The relationship between visual enclosure for neighbourhood street walkability and elders’ mental health in China: Using street view images. J. Transp. Health 2019, 13, 90–102. [Google Scholar] [CrossRef]
  87. Ewing, R.; Handy, S. Measuring the Unmeasurable: Urban Design Qualities Related to Walkability. J. Urban Des. 2009, 14, 65–84. [Google Scholar] [CrossRef]
  88. Dai, L.; Zheng, C.; Dong, Z.; Yao, Y.; Wang, R.; Zhang, X.; Ren, S.; Zhang, J.; Song, X.; Guan, Q. Analyzing the correlation between visual space and residents’ psychology in Wuhan, China using street-view images and deep-learning technique. City Environ. Interact. 2021, 11, 100069. [Google Scholar] [CrossRef]
  89. Mouratidis, K. Urban planning and quality of life: A review of pathways linking the built environment to subjective well-being. Cities 2021, 115, 12. [Google Scholar] [CrossRef]
  90. Zang, P.; Lu, Y.; Ma, J.; Xie, B.; Wang, R.; Liu, Y. Disentangling residential self-selection from impacts of built environment characteristics on travel behaviors for older adults. Soc. Sci. Med. 2019, 238, 112515. [Google Scholar] [CrossRef]
  91. Wei, Z.; Cao, K.; Kwan, M.-P.; Jiang, Y.; Feng, Q. Measuring the age-friendliness of streets’ walking environment using multi-source big data: A case study in Shanghai, China. Cities 2024, 148, 104829. [Google Scholar] [CrossRef]
  92. Zhou, X.; Chen, S.; Chen, L.; Li, L. Social Class Identity, Public Service Satisfaction, and Happiness of Residents: The Mediating Role of Social Trust. Front. Psychol. 2021, 12, 659657. [Google Scholar] [CrossRef]
  93. Quercia, D.; Schifanella, R.; Aiello, L.M. The shortest path to happiness. In Proceedings of the 25th ACM conference on Hypertext and Social Media, Santiago, Chile, 1–4 September 2014; pp. 116–125. [Google Scholar]
  94. Meng, Y.; Li, Q.; Ji, X.; Yu, Y.; Yue, D.; Gan, M.; Wang, S.; Niu, J.; Fukuda, H. Research on Campus Space Features and Visual Quality Based on Street View Images: A Case Study on the Chongshan Campus of Liaoning University. Buildings 2023, 13, 1332. [Google Scholar] [CrossRef]
  95. Wu, Y.; Liu, Q.; Hang, T.; Yang, Y.; Wang, Y.; Cao, L. Integrating restorative perception into urban street planning: A framework using street view images, deep learning, and space syntax. Cities 2024, 147, 104791. [Google Scholar] [CrossRef]
  96. McLeod, S. Maslow’s hierarchy of needs. Simply Psychol. 2007, 1, 1–18. [Google Scholar]
  97. Meng, Y.; Sun, D.; Lyu, M.; Niu, J.; Fukuda, H. Measuring human perception of residential built environment through street view image and deep learning. Environ. Res. Commun. 2024, 6, 055020. [Google Scholar] [CrossRef]
  98. Zhang, F.; Zhou, B.; Liu, L.; Liu, Y.; Fung, H.H.; Lin, H.; Ratti, C. Measuring human perceptions of a large-scale urban region using machine learning. Landsc. Urban Plan. 2018, 180, 148–160. [Google Scholar] [CrossRef]
  99. Wang, Z.; Zhu, Z.; Xu, M.; Qureshi, S. Fine-grained assessment of greenspace satisfaction at regional scale using content analysis of social media and machine learning. Sci. Total Environ. 2021, 776, 145908. [Google Scholar] [CrossRef] [PubMed]
  100. Susaki, J.; Kubota, S. Automatic Assessment of Green Space Ratio in Urban Areas from Mobile Scanning Data. Remote Sens. 2017, 9, 215. [Google Scholar] [CrossRef]
  101. Sun, D.; Li, Q.; Gao, W.; Huang, G.; Tang, N.; Lyu, M.; Yu, Y. On the relation between visual quality and landscape characteristics: A case study application to the waterfront linear parks in Shenyang, China. Environ. Res. Commun. 2021, 3, 115013. [Google Scholar] [CrossRef]
  102. Xu, L.Q.; Kang, Q. The relationship between pedestrian behaviors and the spatial features along the ground-floor commercial street: The case of West Nanjing road in Shanghai. Urban Plan. Forum 2014, 3, 103–111. [Google Scholar]
  103. He, J.; Zhang, J.; Yao, Y.; Li, X. Extracting human perceptions from street view images for better assessing urban renewal potential. Cities 2023, 134, 104189. [Google Scholar] [CrossRef]
  104. Li, J.; Ahn, H.-J. Sensitivity of Chinese stock markets to individual investor sentiment: An analysis of Sina Weibo mood related to COVID-19. J. Behav. Exp. Financ. 2024, 41, 100860. [Google Scholar] [CrossRef]
  105. Wangbao, L. Spatial impact of the built environment on street vitality: A case study of the Tianhe District, Guangzhou. Front. Environ. Sci. 2022, 10, 966562. [Google Scholar] [CrossRef]
  106. Pan, C.; Wu, S.; Li, E.; Li, H.; Liu, X. Identification of urban functional zones in Macau Peninsula based on POI data and remote information sensors technology for sustainable development. Phys. Chem. Earth Parts A/B/C 2023, 131, 103447. [Google Scholar] [CrossRef]
  107. Liu, L.; Silva, E.A.; Wu, C.; Wang, H. A machine learning-based method for the large-scale evaluation of the qualities of the urban environment. Comput. Environ. Urban Syst. 2017, 65, 113–125. [Google Scholar] [CrossRef]
  108. Carmona, M.; Gabrieli, T.; Hickman, R.; Laopoulou, T.; Livingstone, N. Street appeal: The value of street improvements. Prog. Plan. 2018, 126, 1–51. [Google Scholar] [CrossRef]
  109. Nagata, S.; Nakaya, T.; Hanibuchi, T.; Amagasa, S.; Kikuchi, H.; Inoue, S. Objective scoring of streetscape walkability related to leisure walking: Statistical modeling approach with semantic segmentation of Google Street View images. Health Place 2020, 66, 102428. [Google Scholar] [CrossRef] [PubMed]
  110. Hu, Y.; Han, Y. Identification of Urban Functional Areas Based on POI Data: A Case Study of the Guangzhou Economic and Technological Development Zone. Sustainability 2019, 11, 1385. [Google Scholar] [CrossRef]
  111. Jin, X.; Long, Y.; Sun, W.; Lu, Y.; Yang, X.; Tang, J. Evaluating cities’ vitality and identifying ghost cities in China with emerging geographical data. Cities 2017, 63, 98–109. [Google Scholar] [CrossRef]
  112. He, S.; Zhang, Z.; Yu, S.; Xia, C.; Tung, C.-L. Investigating the effects of urban morphology on vitality of community life circles using machine learning and geospatial approaches. Appl. Geogr. 2024, 167, 103287. [Google Scholar] [CrossRef]
  113. Pouyanfar, S.; Sadiq, S.; Yan, Y.; Tian, H.; Tao, Y.; Reyes, M.P.; Shyu, M.-L.; Chen, S.-C.; Iyengar, S.S. A Survey on Deep Learning. ACM Comput. Surv. 2018, 51, 1–36. [Google Scholar] [CrossRef]
  114. Huang, G.; Yu, Y.; Lyu, M.; Sun, D.; Zeng, Q.; Bart, D. Using google street view panoramas to investigate the influence of urban coastal street environment on visual walkability. Environ. Res. Commun. 2023, 5, 065017. [Google Scholar] [CrossRef]
  115. Zeng, Q.; Bao, X.; Dewancker, B.J. Association between built environment on transport and recreational walking in Japan: The case of Kitakyushu. City Built Environ. 2023, 1, 10. [Google Scholar] [CrossRef]
  116. Lu, Y.; Sarkar, C.; Xiao, Y. The effect of street-level greenery on walking behavior: Evidence from Hong Kong. Soc. Sci. Med. 2018, 208, 41–49. [Google Scholar] [CrossRef]
  117. Middel, A.; Lukasczyk, J.; Zakrzewski, S.; Arnold, M.; Maciejewski, R. Urban form and composition of street canyons: A human-centric big data and deep learning approach. Landsc. Urban Plan. 2019, 183, 122–132. [Google Scholar] [CrossRef]
  118. Chen, Y.; Liu, X.; Li, X.; Liu, X.; Yao, Y.; Hu, G.; Xu, X.; Pei, F. Delineating urban functional areas with building-level social media data: A dynamic time warping (DTW) distance based k -medoids method. Landsc. Urban Plan. 2017, 160, 48–60. [Google Scholar] [CrossRef]
  119. Liu, X.; Niu, N.; Liu, X.; Jin, H.; Ou, J.; Jiao, L.; Liu, Y. Characterizing mixed-use buildings based on multi-source big data. Int. J. Geogr. Inf. Sci. 2018, 32, 738–756. [Google Scholar] [CrossRef]
  120. Hillier, B. Spatial sustainability in cities: Organic patterns and sustainable forms. In Proceedings of the 7th International Space Syntax Symposium, Stockholm, Sweden, 8–11 June 2009; Royal Institute of Technology: Stockholm, Sweden, 2009. [Google Scholar]
  121. Lyu, Y.; Abd Malek, M.I.; Jaàfar, N.H.; Sima, Y.; Han, Z.; Liu, Z. Unveiling the potential of space syntax approach for revitalizing historic urban areas: A case study of Yushan Historic District, China. Front. Archit. Res. 2023, 12, 1144–1156. [Google Scholar] [CrossRef]
  122. Chan, E.T.H.; Schwanen, T.; Banister, D. The role of perceived environment, neighbourhood characteristics, and attitudes in walking behaviour: Evidence from a rapidly developing city in China. Transportation 2019, 48, 431–454. [Google Scholar] [CrossRef]
  123. Lyu, Y.; Forsyth, A. Attitudes, perceptions, and walking behavior in a Chinese city. J. Transp. Health 2021, 21, 101047. [Google Scholar] [CrossRef]
  124. Sun, D.; Ji, X.; Gao, W.; Zhou, F.; Yu, Y.; Meng, Y.; Yang, M.; Lin, J.; Lyu, M. The Relation between Green Visual Index and Visual Comfort in Qingdao Coastal Streets. Buildings 2023, 13, 457. [Google Scholar] [CrossRef]
  125. Rui, J. Exploring the association between the settlement environment and residents’ positive sentiments in urban villages and formal settlements in Shenzhen. Sustain. Cities Soc. 2023, 98, 104851. [Google Scholar] [CrossRef]
  126. Leibe, B.; Matas, J.; Sebe, N.; Welling, M. Computer Vision–ECCV 2016. In Proceedings of the 14th European Conference, Amsterdam, The Netherlands, 11–14 October 2016. [Google Scholar]
  127. Zhang, F.; Zu, J.; Hu, M.; Zhu, D.; Kang, Y.; Gao, S.; Zhang, Y.; Huang, Z. Uncovering inconspicuous places using social media check-ins and street view images. Comput. Environ. Urban Syst. 2020, 81, 101478. [Google Scholar] [CrossRef]
  128. Larkin, A.; Gu, X.; Chen, L.; Hystad, P. Predicting Perceptions of the Built Environment using GIS, Satellite and Street View Image Approaches. Landsc. Urban Plan 2021, 216, 104257. [Google Scholar] [CrossRef] [PubMed]
  129. Wang, M.; Liu, J.; Zhang, S.; Zhu, H.; Zhang, X. Spatial pattern and micro-location rules of tourism businesses in historic towns: A case study of Pingyao, China. J. Destin. Mark. Manag. 2022, 25, 100721. [Google Scholar] [CrossRef]
  130. Jiang, S.; Alves, A.; Rodrigues, F.; Ferreira, J.; Pereira, F.C. Mining point-of-interest data from social networks for urban land use classification and disaggregation. Comput. Environ. Urban Syst. 2015, 53, 36–46. [Google Scholar] [CrossRef]
  131. Saleh, A.Y.; Abdu, S.A.; Ali, H.N. Evaluating the connectivity level of Fayoum city roads network: A new method using GIS. Pr. Kom. Geogr. Komun. PTG 2018, 21, 44–56. [Google Scholar] [CrossRef]
  132. Liu, L.; Zhu, J.; Wu, J.; Sun, F. Application on Expert Scoring Method in L/HIRF Evaluation Factors. Aviat. Maint. Eng. 2017, 7, 41–43. [Google Scholar] [CrossRef]
  133. Wang, G.; Zhang, B.; Tang, C.; Yan, G. Application of Delphi Experts Grading Method Based on The Computer Simulation in Visual Parameter Analysis of Bridge Landscape. J. Hunan Inst. Sci. Technol. Nat. Sci. 2014, 27, 76–81. [Google Scholar]
  134. Hajrasouliha, A.; Yin, L. The impact of street network connectivity on pedestrian volume. Urban Stud. 2014, 52, 2483–2497. [Google Scholar] [CrossRef]
  135. Sugiyama, T.; Leslie, E.; Giles-Corti, B.; Owen, N. Associations of neighbourhood greenness with physical and mental health: Do walking, social coherence and local social interaction explain the relationships? J. Epidemiol. Community Health 2008, 62, e9. [Google Scholar] [CrossRef]
  136. Frank, L.D.; Schmid, T.L.; Sallis, J.F.; Chapman, J.; Saelens, B.E. Linking objectively measured physical activity with objectively measured urban form: Findings from SMARTRAQ. Am. J. Prev. Med. 2005, 28, 117–125. [Google Scholar] [CrossRef]
  137. Saelens, B.E.; Sallis, J.F.; Frank, L.D. Environmental correlates of walking and cycling: Findings from the transportation, urban design, and planning literatures. Ann. Behav. Med. 2003, 25, 80–91. [Google Scholar] [PubMed]
  138. Dang, Y.; Yu, J.; Zhang, W.; Li, Y.; Chen, L.; Zhan, D. Satisfaction evaluation of living environment and influencing factors in the Bohai Rim area. Prog. Geogr. 2016, 35, 184–194. [Google Scholar]
  139. Guang, R.; Xi, J.; Cheng, Y. Social support measurement and influencing factors for community-living elderly in Beijing. J. Beijing Norm. Univ. Nat. Sci. 2020, 56, 102–109. [Google Scholar] [CrossRef]
  140. Yang, D.; Wang, X.; Han, R. Nonlinear and Synergistic Effects of the Built environment on Street Vitality: The Case of Shenyang. Urban Plan. Forum 2023, 5, 93–102. [Google Scholar] [CrossRef]
  141. Melis, G.; Gelormino, E.; Marra, G.; Ferracin, E.; Costa, G. The Effects of the Urban Built Environment on Mental Health: A Cohort Study in a Large Northern Italian City. Int. J. Environ. Res. Public Health 2015, 12, 14898–14915. [Google Scholar] [CrossRef]
  142. Tuli, S. Beyond Mobility: Planning Cities for People and Places. Urban Policy Res. 2019, 37, 271–273. [Google Scholar] [CrossRef]
  143. Mouratidis, K. Built environment and social well-being: How does urban form affect social life and personal relationships? Cities 2018, 74, 7–20. [Google Scholar] [CrossRef]
  144. Pan, H.; Luo, W. The Role of Public Spaces in Promoting Social Interaction: A Case Study of Urban Parks in Beijing. J. Urban Des. 2022, 27, 309–325. [Google Scholar]
  145. Pucher, J.; Dijkstra, L. Promoting Safe Walking and Cycling to Improve Public Health: Lessons From The Netherlands and Germany. J. Public Health-Heidelb. 2010, 100, 1986–1987. [Google Scholar] [CrossRef] [PubMed]
  146. Zhang, Y.; Zou, Y.; Zhu, Z.; Guo, X.; Feng, X. Evaluating Pedestrian Environment Using DeepLab Models Based on Street Walkability in Small and Medium-Sized Cities: Case Study in Gaoping, China. Sustainability 2022, 14, 15472. [Google Scholar] [CrossRef]
  147. Carr, S.; Francis, M.; Rivlin, L.G.; Stone, A.M. Public Space; Cambridge University Press: Cambridge, UK, 2010. [Google Scholar]
  148. Dempsey, N.; Brown, C.; Bramley, G. The key to sustainable urban development in UK cities? The influence of density on social sustainability. Prog. Plan. 2012, 77, 89–141. [Google Scholar] [CrossRef]
  149. Lavy, S.; Garcia, J.A.; Dixit, M.K. Establishment of KPIs for facility performance measurement: Review of literature. Facilities 2010, 28, 440–464. [Google Scholar] [CrossRef]
  150. Cheshmehzangi, A.; Butters, C.; Xie, L.; Dawodu, A. Green infrastructures for urban sustainability: Issues, implications, and solutions for underdeveloped areas. Urban For. Urban Green. 2021, 59, 127028. [Google Scholar] [CrossRef]
  151. Wu, W.; Guo, J.; Ma, Z.; Zhao, K. Data-Driven Approach to Assess Street Safe: Large-Scale Analysis of the Microscopic Design. ISPRS Int. J. Geo-Inf. 2022, 11, 537. [Google Scholar] [CrossRef]
  152. Wu, H.; Zhang, Z.; Chen, Y.; Jiao, J. The impact of street characteristics on older pedestrians’ perceived safe in Shanghai, China. J. Transp. Land Use 2020, 13, 469–490. [Google Scholar] [CrossRef]
  153. Wang, L.; Han, X.; He, J.; Jung, T. Measuring residents’ perceptions of city streets to inform better street planning through deep learning and space syntax. ISPRS J. Photogramm. Remote Sens. 2022, 190, 215–230. [Google Scholar] [CrossRef]
Figure 1. Research framework.
Buildings 15 00998 g001
Figure 2. Study site and location of the core urban area in Dalian.
Buildings 15 00998 g002
Figure 3. Establishment of the coordinate system.
Buildings 15 00998 g003
Figure 4. Space syntax model analysis result.
Buildings 15 00998 g004
Figure 5. The overall distribution of urban functions in the core urban area of Dalian.
Buildings 15 00998 g005
Figure 6. The spatial distribution of urban functions in high-accessibility streets.
Buildings 15 00998 g006
Figure 7. The spatial distribution of urban functions in low-accessibility streets.
Buildings 15 00998 g007
Figure 8. The overall perceived quality of the streets with different levels of accessibility in the core urban area of Dalian.
Buildings 15 00998 g008
Figure 9. The spatial distribution of perceived quality in high-accessibility streets.
Buildings 15 00998 g009
Figure 10. The spatial distribution of perceived quality in low-accessibility streets.
Buildings 15 00998 g010
Figure 11. Establishment of the coordinate system.
Buildings 15 00998 g011
Table 1. The formulas used in the study.
FeaturesFormulaExpressionFeatures
Urban functionPOI diversity P D I = 1 n i = 1 n P i ln P i P i is the proportion in terms of the number of class I facilities in regard to the total number of facilities.
Shopping service density S H = Num   ( N ) / Area   ( m 2 ) Num (N) is the number of shopping services in the buffer area in terms of the N th sample point.
Science/culture and education service density C E = Num   ( N ) / Area   ( m 2 ) Num (N) is the number of science/culture and education services in the buffer area in terms of the N th sample point.
Public facility density P F = Num   ( N ) / Area   ( m 2 ) Num (N) is the number of public facilities in the buffer area in terms of the N th sample point.
Transportation service density T S = Num   ( N ) / Area   ( m 2 ) Num (N) is the number of transportation services in the buffer area in terms of the N th sample point.
Green public space density G P S = Num   ( N ) / Area   ( m 2 ) Num (N) is the number of green public spaces in the buffer area in terms of the N th sample point.
Objective
perception
Imageability I i = 1 n i = 1 n B i + 1 n i = 1 n S 1 i i 1 , 2 , , n B i denotes the proportion of building pixels, S 1 i denotes the proportion of signboard pixels.
Openness O i = 1 n i = 1 n S 2 i i 1 , 2 , , n S 2 i denotes the proportion of sky pixels.
Enclosure E i = 1 n i = 1 n B i + 1 n i = 1 n T i + 1 n i = 1 n W i 1 n i = 1 n P 1 i + 1 n i = 1 n F i + 1 n i = 1 n R i i 1 , 2 , , n B i is the percentage of building pixels; T i is the percentage of tree pixels; W i is the percentage of wall pixels; P 1 i is the percentage of pavement pixels; F i is the percentage of fence pixels; R i is the percentage of road pixels.
Greenness G i = 1 n i = 1 n T i + 1 n i = 1 n G 1 i i 1 , 2 , , n T i denotes the proportion of tree pixels, G 1 i denotes the proportion of grass pixels.
Walkability E i = 1 n i = 1 n S 3 i + 1 n i = 1 n F i 1 n i = 1 n R i i 1 , 2 , , n S 3 i is the percentage of sidewalk pixels; F i is the percentage of fence pixels; R i is the percentage of road pixels.
Paved sidewalk P 2 i = 1 n i = 1 n S 3 i 1 n i = 1 n S 3 i + 1 n i = 1 n R i i 1 , 2 , , n S 3 i is the percentage of sidewalk pixels; R i is the percentage of road pixels.
Psychological
perception
Beautiful Human perception of the locals as beautiful.
Lively Human perception of the locals as lively.
Boring Human perception of the locals as boring.
Depressing Human perception of the locals as depressing.
Safe Human perception of the local area as safe.
Wealthy Human perception of locals as wealthy.
Table 2. The evaluation system for urban function and perceived quality.
First IndicatorsSecondary IndicatorsWeight
Objective perceptionImageability0.136
Openness0.209
Enclosure0.100
Greenness0.200
Walkability0.200
Paved sidewalk0.155
Psychological perceptionBeautiful0.242
Lively0.211
Boring0.074
Depressing0.063
Safe0.232
Wealthy0.179
Table 3. Comparison of urban function in streets with different levels of accessibility.
High-Accessibility StreetsLow-Accessibility Streets
Green public spaceDensity0.3640.482
The proportion of high-value amenities0.98%1.02%
Shopping serviceDensity47.432.209
The proportion of high-value amenities4.89%3.48%
Transportation serviceDensity12.0189.269
The proportion of high-value amenities6.20%4.35%
Public facilityDensity2.4391.903
The proportion of high-value amenities1.79%1.45%
Science/culture and education serviceDensity5.8664.331
The proportion of high-value amenities5.71%3.19%
POI diversityDensity1.6791.449
The proportion of high-value amenities66.39%50.65%
Table 4. The results on perceived quality.
IndicatorsHigh-Accessibility StreetsLow-Accessibility Streets
Mean ValueStandard DeviationMean ValueStandard Deviation
Perceived quality18.631.32918.5421.437
Objective perception0.3630.2750.450.399
Openness0.5690.0760.550.084
Greenness0.060.0480.0780.070
Paved sidewalk0.0850.0730.0970.092
Walkability0.2370.5490.3182.258
Imageability0.140.0970.1320.099
Enclosure1.5272.4311.7482.869
Psychological perception36.8982.64936.6352.833
Beautiful34.3755.81534.6766.913
Boring59.1593.62460.3534.663
Depressing50.8253.43651.2263.880
Lively32.4265.18631.066.625
Safe33.7642.78633.4573.614
Wealthy35.5453.92135.0424.759
Table 5. Distribution density of four street types in regard to streets with different levels of accessibility.
Diagnosed StreetsHigh-Accessibility StreetsLow-Accessibility Streets
NumberProportionsNumberProportions
Advantage Streets21635.23%23033.42%
Maintenance Streets9215.01%11516.72%
Improvement Streets9114.85%11516.72%
Opportunity Streets21434.91%22833.14%
Table 6. Comparative analysis of three types of indicators in regard to high-accessibility streets.
POIs
Diversity
Public
Facility
Shopping ServiceTransportation ServiceSports
Service
Science/Culture and Education Service
Advantage Streets2.18 20.70 75.76 0.51 4.39 11.12
Maintenance Streets2.1414.7642.970.62.936.91
Improvement Streets1.35 7.98 64.32 0.36 2.13 4.21
Opportunity Streets1.12 3.83 13.39 0.11 0.39 0.84
Perceived QualityOpennessGreennessPaved
Sidewalk
WalkabilityImageabilityEnclosureObjective Perception
Advantage Streets0.43 −0.77 −0.04 0.66 0.04 0.68 0.04 0.07
Maintenance Streets−0.280.090.09−0.02−0.1−0.14−0.15−0.17
Improvement Streets0.60 −0.20 0.06 0.03 0.37 0.15 0.47 0.66
Opportunity Streets−0.58 0.82 −0.02 −0.67 −0.16 −0.69 −0.18 −0.28
BeautifulBoringDepressingLivelySafeWealthyPsychological Perception
Advantage Streets 0.27 0.33 0.37 0.72 0.54 0.64 0.80
Maintenance Streets −0.22 0.00 −0.20 −0.33 −0.24 −0.21 −0.38
Improvement Streets 0.470.020.020.430.150.270.54
Opportunity Streets −0.38 −0.34 −0.30 −0.77 −0.51 −0.67 −0.88
Table 7. Comparative analysis of three types of indicators in regard to low-accessibility streets.
POIs
Diversity
Public
Facility
Shopping ServiceTransportation ServiceSports
Service
Science/Culture and Education Service
Advantage Streets2.13 0.88 64.79 17.83 3.92 8.81
Maintenance Streets2.06 0.44 41.80 13.09 2.72 6.31
Improvement Streets0.910.58.333.040.281.39
Opportunity Streets0.73 0.10 6.66 1.88 0.28 0.31
Perceived QualityOpennessGreennessPaved
Sidewalk
WalkabilityImageabilityEnclosureObjective Perception
Advantage Streets0.47 −0.47 −0.08 0.33 −0.01 0.56 0.03 0.17
Maintenance Streets−0.38 0.06 −0.29 0.00 −0.04 0.10 −0.14 −0.18
Improvement Streets0.56−0.20.490.170.19−0.180.160.48
Opportunity Streets−0.57 0.54 −0.02 −0.42 −0.07 −0.52 −0.05 −0.32
BeautifulBoringDepressingLivelySafeWealthyPsychological Perception
Advantage Streets 0.08 0.14 0.37 0.74 0.46 0.60 0.77
Maintenance Streets −0.36 −0.11 −0.19 −0.27 −0.24 −0.41 −0.57
Improvement Streets 0.680.14−0.060.20.230.220.65
Opportunity Streets −0.24 −0.16 −0.25 −0.70 −0.46 −0.50 −0.81
Disclaimer/Publisher’s Note: The statements, opinions and data contained in all publications are solely those of the individual author(s) and contributor(s) and not of MDPI and/or the editor(s). MDPI and/or the editor(s) disclaim responsibility for any injury to people or property resulting from any ideas, methods, instructions or products referred to in the content.

