Article

Lateral Force–Displacement Hysteretic Model for CFRP (Carbon Fiber-Reinforced Polymer)-Retrofitted Square RC Columns

1
National Defense Engineering Research Institute of Academy of Military Science of PLA, Beijing 100850, China
2
School of Civil Engineering, Harbin Institute of Technology, Harbin 150090, China
*
Authors to whom correspondence should be addressed.
Buildings 2025, 15(9), 1523; https://doi.org/10.3390/buildings15091523
Submission received: 3 April 2025 / Revised: 22 April 2025 / Accepted: 29 April 2025 / Published: 1 May 2025

Abstract

In this study, the lateral force–displacement hysteretic performance of FRP-retrofitted square reinforced concrete (RC) columns was numerically investigated. The finite element (FE) model for CFRP-retrofitted square RC columns was established by utilizing software OpenSees 3.7.1 A nonlinear force-based beam–column element with a fiber section was employed to simulate the RC column. Specifically, a self-developed stress–strain model was adopted to represent the confined concrete within the FRP-retrofitted region. After verifying the accuracy of the numerical simulation analysis results, parametric analysis was conducted to comprehend the influences of key parameters such as section size, axial compression ratio, shear/span ratio, number of layers of FRP wrap, steel reinforcement ratio, and concrete strength on the characteristic points of the lateral force–displacement curve of retrofitted columns. Subsequently, a lateral force–displacement hysteretic model for CFRP-retrofitted square RC columns was proposed. The proposed model consists of a trilinear skeleton curve and an unloading/reloading rule. By comparing it with the test results, it is shown that the proposed hysteretic model has a relatively high level of accuracy.

1. Introduction

Numerous RC structures require urgent enhancement of their load-bearing capacity, seismic performance, and durability due to environmental degradation, overloading, and changes in building use type according to architectural changes and new code requirements [1,2,3,4,5,6]. As a result, there is a substantial demand for the strengthening and retrofitting of RC structures. Fiber-reinforced polymer (FRP) has been extensively employed in the seismic strengthening/retrofitting of concrete structures owing to its advantages of light weight, high strength, and corrosion resistance [7,8,9,10]. The FRP strengthening/retrofitting technique is characterized by its straightforward construction, rapid application, and efficiency. Moreover, it imposes minimal additional loads on the structure and does not compromise the appearance or usable space, making it an effective method for the seismic retrofitting of existing RC columns [9,11].
Square RC columns are predominantly utilized in RC buildings due to their superior structural performance, ease of construction, and efficient use of space, making them highly demanded in engineering applications. Consequently, a comprehensive understanding of their mechanical and seismic performance is essential [1]. Currently, studies have extensively investigated the mechanical and seismic performance of FRP-retrofitted square RC columns. Harajli et al. [12] concluded that external FRP wrap effectively prevents the premature spalling of the concrete cover and inhibits the buckling of longitudinal steel bars, which results in increased compressive strength and ultimate strain in concrete; they pointed out that the composite confinement is the linear superposition of stirrup and FRP lateral confinement. Wang et al. [13] observed that the typical monotonic stress–strain responses of CFRP-confined square RC columns exhibit a post-peak softening behavior and noted that FRP confinement on square columns is less effective compared to circular ones, with effectiveness influenced by section size. Based on tests, Wang et al. [14] proposed a monotonic and cyclic stress–strain model, where FRP confinement is the dominant factor, considering the influence of internal reinforcement and section size. Memon et al. [15] conducted pseudo-static tests on deficient and damaged square RC columns retrofitted with Glass Fiber-Reinforced Polymer (GFRP) and found that GFRP confinement significantly enhances the ductility, energy dissipation ability, and the shear and moment capacities of deficient columns. Ilki et al. [16] carried out pseudo-static tests on FRP-retrofitted square RC columns with low-quality concrete and insufficient transverse reinforcement. They found that the reinforcement of FRP inhibits the buckling of longitudinal reinforcement and significantly improves the seismic performance of the retrofitted columns, particularly in terms of ductility. Wang et al. [17] conducted pseudo-static tests on 11 FRP-retrofitted large-scale square RC columns and realized that FRP reinforcement significantly improves the ductility and energy dissipation capacities of the nonductile RC columns, even at an ultra-high axial compression ratio.
The lateral force–displacement hysteretic model, also referred to as hysteresis characteristics, represents the ability of a structure to recover its original state after the removal of external loads [18]. The reliability of elastic-plastic dynamic analysis for predicting the overall seismic response of FRP-retrofitted concrete structures primarily depends on a thorough understanding of the hysteresis characteristics of structural members and the accuracy of the force-displacement hysteretic model. The lateral force–displacement hysteretic model consists of two parts: the skeleton curve and the hysteresis curve [19]. Some recent studies have explored the lateral hysteretic model of FRP-retrofitted RC columns [20], predominantly utilizing the empirical regression of test results to determine the characteristic points of the skeleton curve. While this approach has high accuracy for specific test outcomes, it is constrained to those particular tests. Experimental studies are limited by the test equipment and economic considerations, precluding a detailed examination of specimen size and working conditions. Consequently, these studies have inherent limitations. In contrast, numerical simulation and analysis can address these shortcomings by providing a more comprehensive examination of the lateral hysteretic model for FRP-retrofitted columns. Currently, there are relatively few refined lateral force–displacement hysteretic models for FRP-retrofitted RC columns, and even fewer focused specifically on FRP-retrofitted square RC columns. The novelty of this study is that it highlights the need for further research and development in this area to enhance the accuracy and applicability of these models.
Accurate FE numerical simulation analysis is fundamental to advancing research. FRP-retrofitted RC columns consist of materials such as FRP wrap, concrete, longitudinal bars, and stirrups, each with distinct mechanical properties. These differences present challenges for detailed FE simulation analysis. Several simulations have been conducted to analyze the seismic performance of FRP-retrofitted RC columns. Zhu et al. [21] conducted a parametric analysis of concrete-filled FRP tubes under cyclic lateral loading using OpenSees (Open System for Earthquake Engineering Simulation) [22], employing the bilinear confinement model of Samaan et al. [23] as the stress–strain envelope for FRP-confined concrete. However, they did not account for cyclic damage to the concrete. Liu et al. [24] modified the stress–strain model of FRP-confined concrete proposed by Lam and Teng [25], embedded this modified model in OpenSees, and conducted numerical simulations of concrete-filled FRP tubes under cyclic lateral loading. Based on the stress–strain model proposed by Lam and Teng [26], Teng et al. [27] simulated and analyzed FRP-jacketed circular RC columns under cyclic loading using OpenSees, taking into account footing strain penetration, but this model did not consider the confinement effect provided by the stirrups. These studies demonstrate that the OpenSees analysis platform is well-suited for static and dynamic nonlinear analysis of FRP seismic retrofitted members and structures. Nevertheless, most research has focused on circular FRP-retrofitted RC columns under monotonic or cyclic lateral loads, often utilizing FRP-confined concrete stress–strain models that do not account for the influence of internal reinforcement and section size. Additionally, many studies employ numerical simulation for parametric research, but few have proposed restoring force models for the design and analysis of FRP-retrofitted RC columns. This highlights the need for further research to develop a comprehensive restoring force model that incorporates these factors.
This paper presents a numerical simulation-based lateral force–displacement hysteretic model for FRP-retrofitted square RC columns. Based on a self-developed stress–strain model that accounts for internal reinforcement and size effects, the FE model for CFRP-retrofitted square RC columns was established using OpenSees software. After verifying the accuracy of the numerical simulation analysis results, parametric analysis was conducted to investigate the effects of key parameters such as section size, axial compression ratio, shear/span ratio, number of layers of FRP wrap, steel reinforcement ratio, and concrete strength on the characteristic points of the hysteresis curve for retrofitted columns. Finally, a lateral force–displacement hysteretic model for CFRP-retrofitted square RC columns was proposed, consisting of a trilinear skeleton curve and unloading/reloading rules. This model can be used for design and nonlinear analysis, providing a foundation for the analysis of FRP-retrofitted RC frames and the development of seismic strengthening design methodologies.

2. Finite Element Analysis

2.1. Finite Element Model

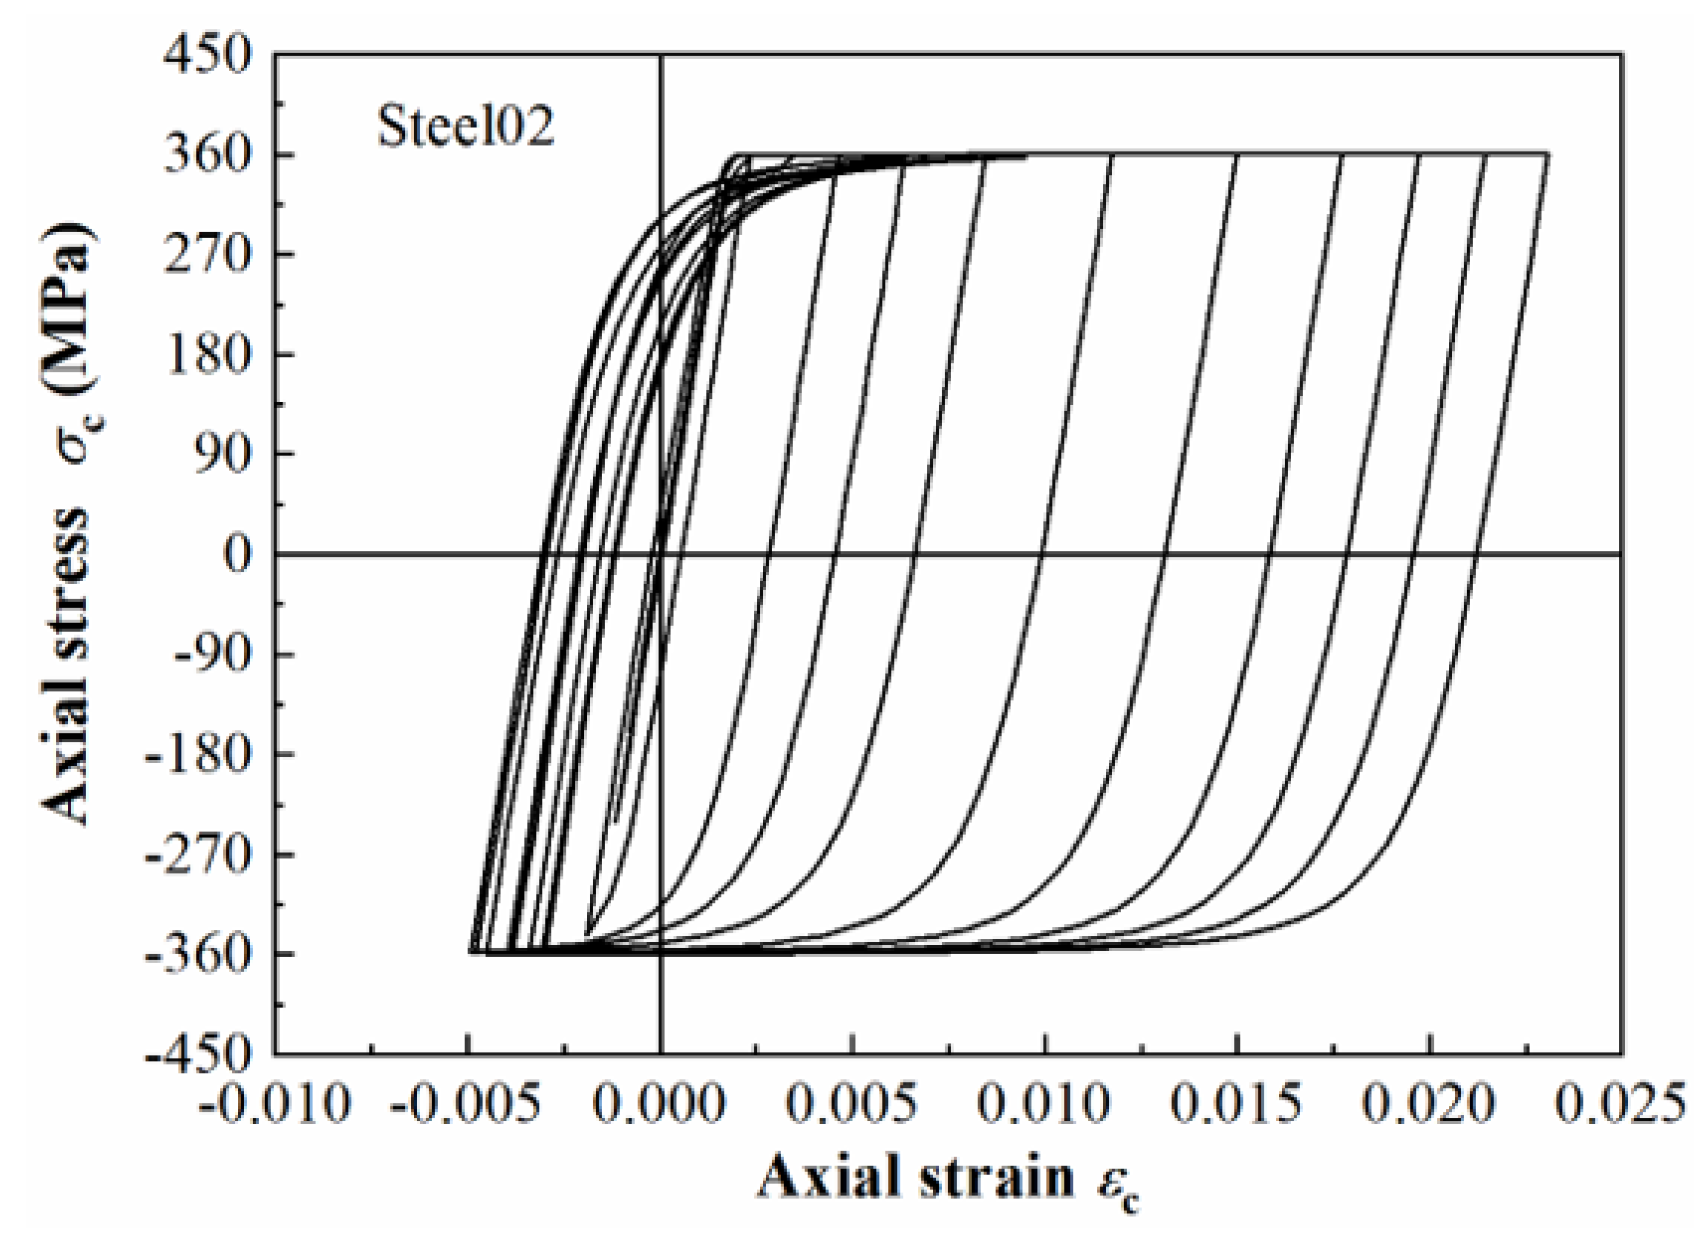
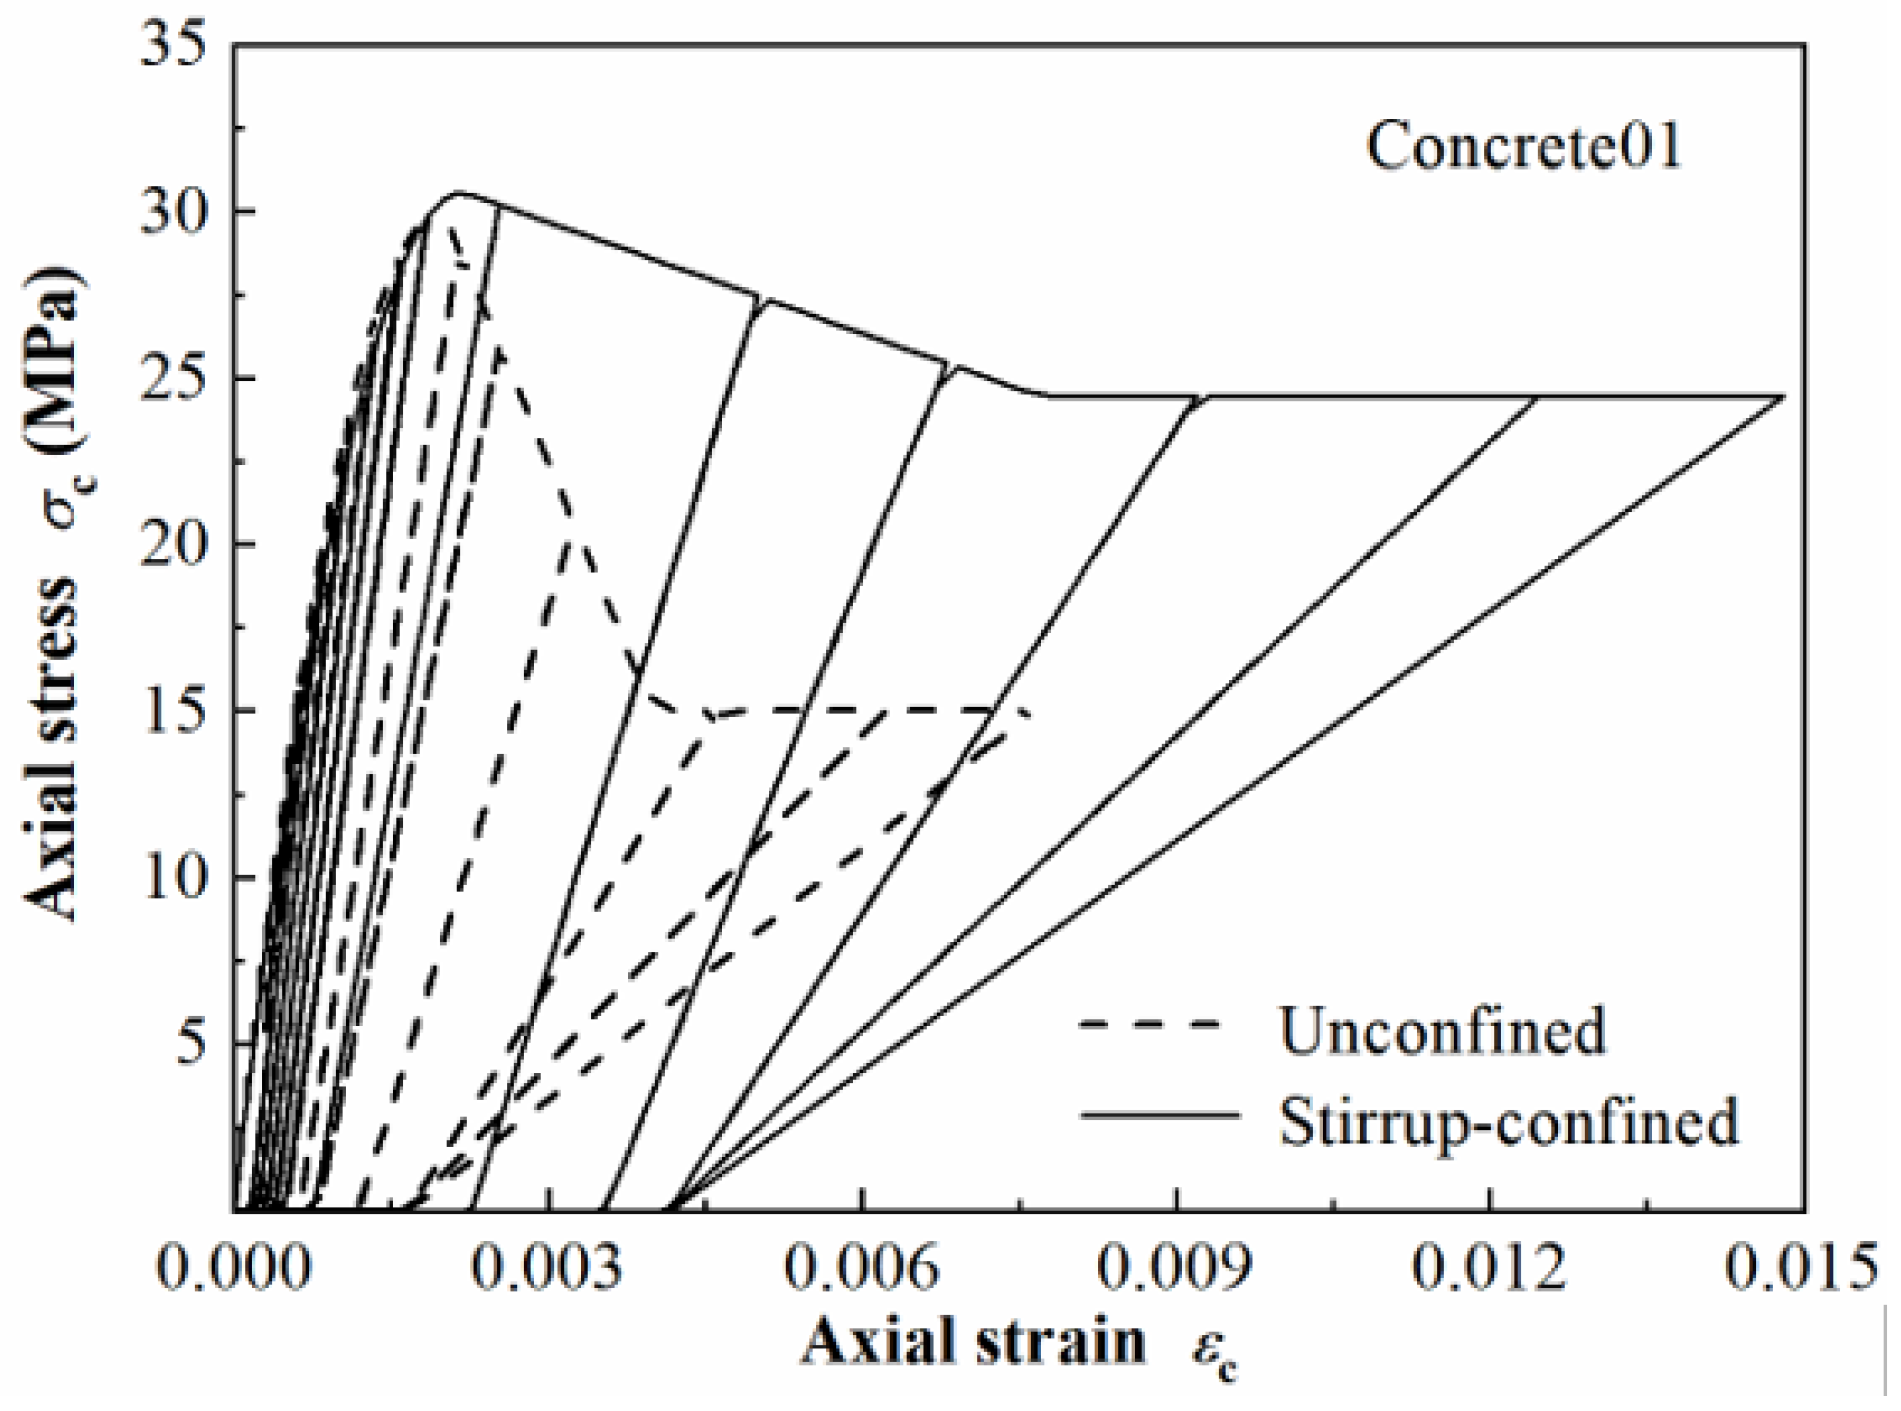
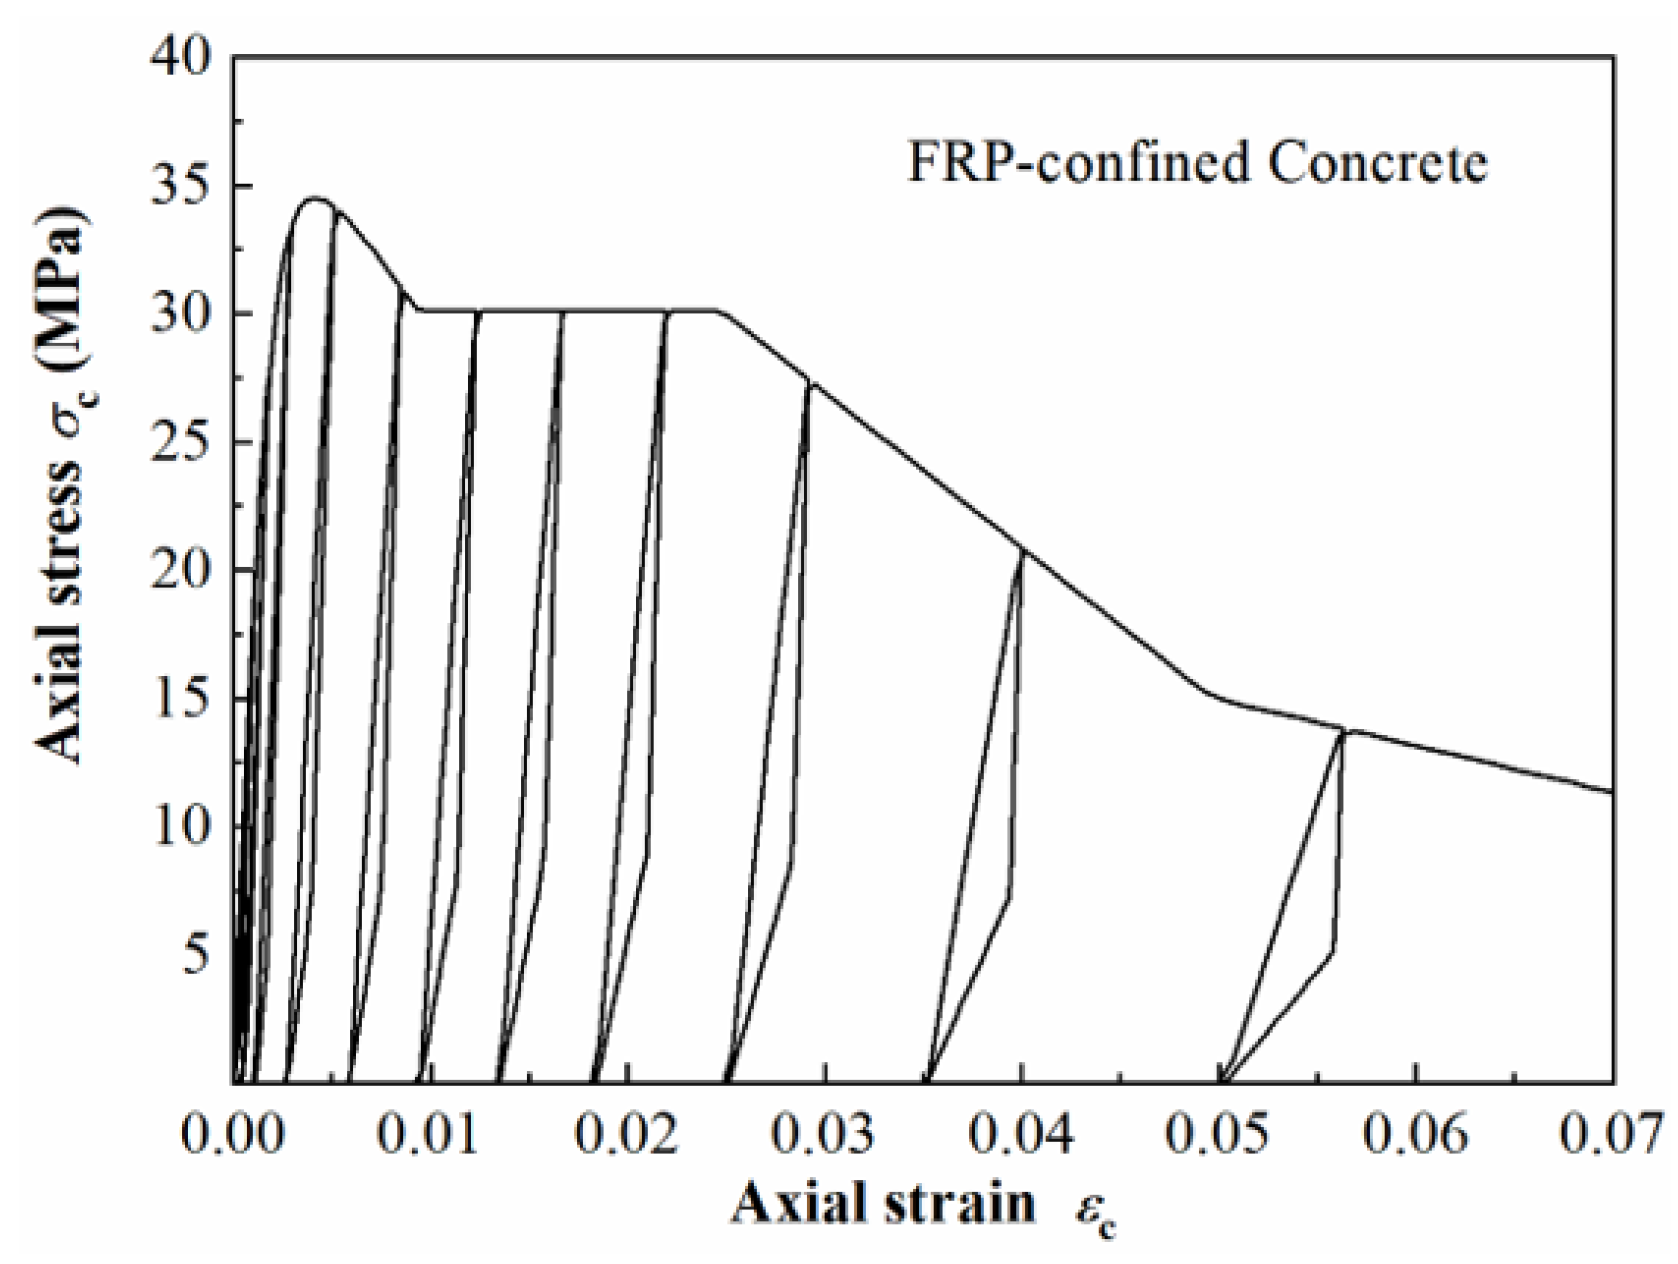
2.1.1. Material Constitutive Models

The Steel02 material model [28] in the OpenSees platform is employed for the longitudinal steel bars. This model is computationally efficient and accurately captures the Bauschinger effect, a phenomenon wherein prior plastic deformation under unidirectional loading induces anisotropic hardening/softening behavior, leading to yield strength during reversed loading. Consequently, it enables reliable and precise simulation of the cyclic stress–strain response of steel, as shown in Figure 1. When using the Steel02 material model in OpenSees, it is necessary to input the yield strength fy, initial elastic tangent Es, strain/hardening ratio b, and parameters to control the transition from elastic to plastic branches: R0, CR1, and CR2. The values of some of the material model parameters are shown in Table 1.
The unconfined concrete cover and stirrup-confined concrete were both modeled using the Concrete01 material model [29], which neglects the tensile strength of concrete, as shown in Figure 2. The stress–strain skeleton curve under monotonic compression consists of three stages. Meanwhile, the hysteresis rule under cyclic compression follows a linear unloading/reloading path that considers stiffness degradation, with unloading and reloading occurring along the same path. When utilizing Concrete01, only the compressive stresses and strains at the peak and ultimate points need to be specified. For stirrup-confined concrete, the enhancements in stress and strain at the peak and ultimate points due to the confinement effect of the stirrups should be considered. The stress–strain model for stirrup-confined concrete proposed by Guo et al. [30] is employed, and the confinement indexes are defined as follows:
λ t = μ t f yt f c
μt is the reinforcement ratio of transverse reinforcement; fyt is the yield strength of the stirrup; and fc is the peak strength of unconfined plain concrete. From this equation, it can be concluded that the confinement index of all specimens is less than 0.32, so the values of stress and strain at the peak and ultimate points of stirrup-confined concrete in square RC columns, as proposed by Guo et al. [30], are summarized in Table 2.
The FRP-confined concrete is modeled using the constitutive model for FRP-confined square RC columns [14], which takes into account the hybrid confinement of FRP and stirrups, as well as the influence of the section size. This model has been added to the OpenSees platform to simulate the stress–strain behavior of FRP-confined concrete under monotonic and cyclic loads. To enhance computational efficiency and reduce programming complexity, the unloading curve of the FRP-confined concrete uniaxial material is simplified into two stages. In the first stage, unloading occurs from the unloading point along the initial elastic modulus up to 0.45 times the stress of the unloading point. In the second stage, it extends from 0.45 times the stress of the unloading point to the residual strain (i.e., the stress is unloaded to 0). Moreover, the envelope and residual strain are consistent with the cyclic compression stress–strain model for FRP-confined concrete established by Wang et al. [14], as shown in Figure 3. The implemented material model for FRP-confined concrete requires the specification of stress and strain values at peak and ultimate points. The corresponding parameter expressions, as proposed by Wang et al. [14], are presented in Table 3.
The symbols used in Table 3 are defined as follows: fc0 and εc0 represent the peak stress and peak strain of the unconfined (plain) concrete, respectively. λf, λh, and λl are dimensionless parameters corresponding to the CFRP wrap, hoop reinforcement, and longitudinal reinforcement, respectively, as defined in [14]. fls denotes the lateral confinement pressure provided by the hoop reinforcement, while flf represents the confinement pressure contributed by the FRP wrap, as described in [13].

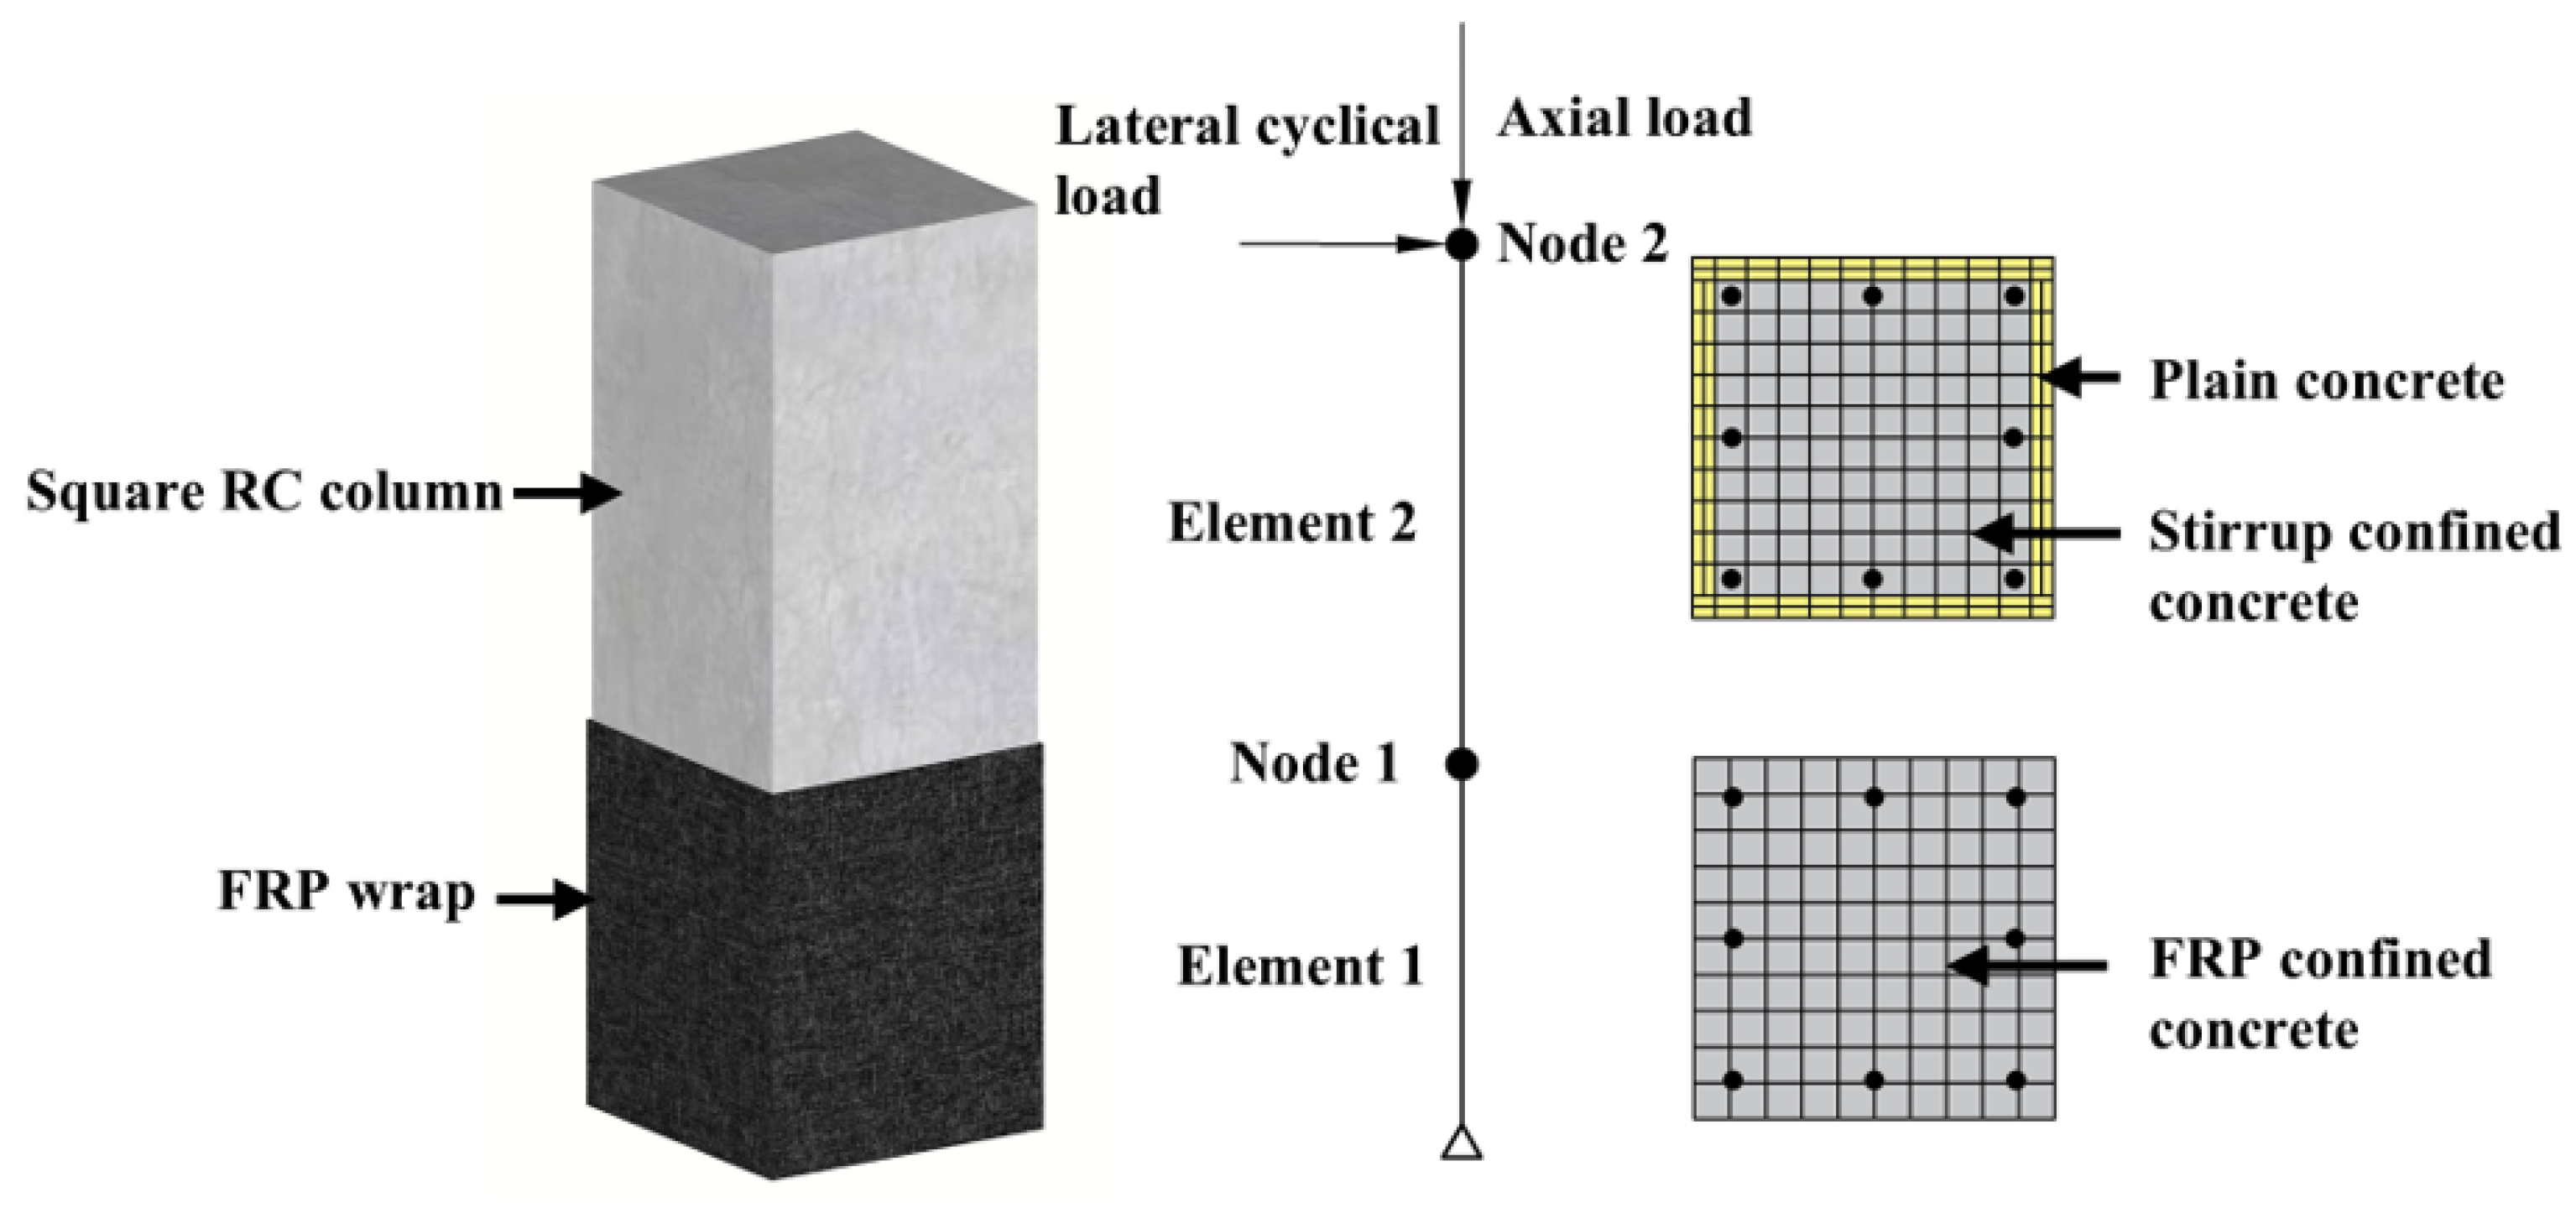
2.1.2. Section and Element

The force-based nonlinear beam–column element considering distributed plasticity was adopted to simulate RC columns before and after being retrofitted with FRP. This element model accurately captures the actual force-deformation characteristics of the column while requiring only two–three Gauss integration points to achieve sufficient computational accuracy. Additionally, it enforces displacement continuity at the nodes by default, ensuring identical axial strains and consistent curvature across the interface. Yang et al. [31] demonstrated that modeling longitudinal reinforcement slip in OpenSees by incorporating additional zero-length elements can more accurately capture the nonlinear deformation behavior of structural members. However, the simulation results also indicated that its impact on the seismic performance of retrofitted columns is relatively limited. Consequently, in light of its minimal impact and to reduce modeling complexity, the effect of longitudinal bar bond-slip is not considered in the present numerical analysis.
For unconfined RC columns, a single element is used for simulation. For FRP-retrofitted columns, two adjacent force-based beam–column elements sharing a common node at the interface are defined to represent the unconfined and CFRP-confined regions, respectively. According to Wang et al. [32], the curvature distribution along the column height is nearly identical for both the plastic hinge zone confinement of FRP and full-height confinement of FRP prior to yielding. After the onset of yielding, a slight curvature discontinuity appears at the interface between the confined and unconfined regions when only the plastic hinge is confined. Nevertheless, this discontinuity is minor (less than 5%). In this study, the FRP wrapping length is set to 2.0 B (as detailed in Section 2.3), which is sufficient to accommodate plastic hinge development. Therefore, the confinement effect is comparable to full-height wrapping, and strain compatibility at the interface can be reasonably assumed.
Each element is integrated using three Gauss–Lobatto integration points. The nonlinear beam–column elements are assigned fiber sections, with the confined and unconfined regions modeled separately. In the fiber section, neither FRP sheets nor stirrups are explicitly discretized. Instead, their confinement contribution is indirectly incorporated via using a modified concrete stress–strain model for FRP-confined concrete, as summarized in Table 2. Other corresponding material constitutive models are then applied to the fiber strips at each section to establish the finite element model (FEM). A schematic diagram of the element division and fiber section composition of the FEM for the FRP-retrofitted RC column is shown in Figure 4.
To ensure the solution convergence of the FE analysis, an energy increment test was employed as the convergence criterion. This test evaluates convergence based on the dot product of the solution vector and the norm of the right-hand side of the matrix equation, which often corresponds to the energy unbalance in the system. Additionally, three solution algorithms are adopted to enhance the robustness of the nonlinear solution process: the standard Newton–Raphson algorithm, the Newton–Raphson algorithm with line search, and the Broyden algorithm, a quasi-Newton method that approximates the Jacobian to improve computational efficiency.

2.2. Verification of the FE Model

The comparison between the simulated analysis results and the test results [17,33] for the quasi-static test of FRP-retrofitted square RC columns is shown in Figure 5. As shown in the figures, the simulation results exhibit good agreement with the experimental results in terms of the overall trend of the load–displacement curve, the envelope curve, the unloading and reloading curves, and peak bearing capacity. The slight offset in the loading apparatus affected the reverse push–pull of the specimen, causing minor asymmetry in the experimental hysteresis curves. In contrast, the simulated hysteresis responses appear more symmetric, resulting in slightly lower load-bearing capacity under negative loading. Nevertheless, with the exception of specimen N3C3A45, the overall difference between the numerical and experimental results is relatively small. More specifically, as illustrated in Table 4, a comparison is presented between the experimental and simulated yield and peak loads. The results indicate that the simulated results demonstrate a reasonable degree of proximity to the experimental results. The average deviation in yield load ranges from −10% to +15%, while the deviation in peak load ranges from −11% to +11%. It is noteworthy that all deviations fall within ±15%, which is widely accepted as an acceptable range of error in RC structural analysis and design. Therefore, the FE method adopted in this study for FRP-retrofitted square concrete columns is validated to be accurate and appropriate. The proposed numerical model demonstrates a high level of precision and reliability and can effectively predict the structural performance of FRP-confined RC columns under seismic conditions.

2.3. Parametric Analysis

Using the previously validated FE modeling method, the pushover analysis of FRP-retrofitted square RC columns was carried out under 6000 conditions, considering the influence of parameters such as section size, axial compression ratio, shear-to-span ratio, number of layers of FRP wrap, steel reinforcement ratio, and concrete strength on the load–displacement skeleton curve. The specific analytical conditions are shown in Table 5. The mechanical properties of the FRP materials used in the simulations are consistent with those reported in the experimental studies [17]. To investigate the influence of longitudinal bar diameter on the seismic performance of retrofitted columns, non-standard bar sizes (23 mm and 29 mm) are introduced in the parametric analysis. These values are only used to explore trends in parameter influence and do not represent bar sizes typically used in actual engineering practice. In addition, the simulation results indicated that when the length of wrapped CFRP in the plastic hinge region exceeds 1.0 B (B is the section width), the load–displacement curve of the specimen is comparable to that of the fully wrapped column. However, if the wrapping length is insufficient, such as being only 0.5 B, the specimen exhibits sudden failure, as shown in Figure 6. Therefore, considering all factors, the CFRP wrapping height in this study was uniformly set to be 2.0 B.

3. Lateral Force–Displacement Hysteretic Model

As previously stated, FE analysis was used to accurately simulate the force-displacement hysteretic performance of FRP-retrofitted RC columns. However, this method is not conveniently applicable to the seismic retrofitting design of RC column components and the overall frame structure. Therefore, it is necessary to develop a simplified force-displacement hysteretic model for FRP-retrofitted RC columns that can be directly applied in design. This paper references the lateral force–displacement hysteretic model for RC columns from [34] to establish a hysteretic model for FRP-retrofitted square RC columns, which consists of a force-displacement skeleton curve and hysteresis rules.

3.1. The Lateral Force–Displacement Skeleton Curve Model

The test studies [17,35] and simulation analysis results indicate that the load–displacement skeleton curve of FRP-retrofitted RC columns can be broadly divided into three stages: elastic ascent stage, elastoplastic ascent stage, and descent stage. Therefore, the skeleton curve is described by a trilinear model, as shown in Figure 7. In the figure, Py, θy, Pc, and θc are the corresponding lateral bearing capacity and drift ratio at the yield point and peak point, and θu is the corresponding ultimate drift ratio when the lateral load decreases to 85% of the peak load; K1, K2, and K3 denote the stiffness of the elastic, elastoplastic, and descent stages, respectively. Thus, determining the parameters corresponding to these three characteristic points is sufficient to establish the trilinear skeleton curve model.

3.2. Analysis of Characteristic Point

The energy method [36] was used to determine the yield point of the load–displacement curves for each working condition obtained from the previous parametric analysis, as shown in Figure 8. On this basis, the influence of axial compression ratio, shear/span ratio, and other influencing factors on the bearing capacity and displacement at the yield point, peak point, and ultimate point of the trilinear skeleton curve are further explored.

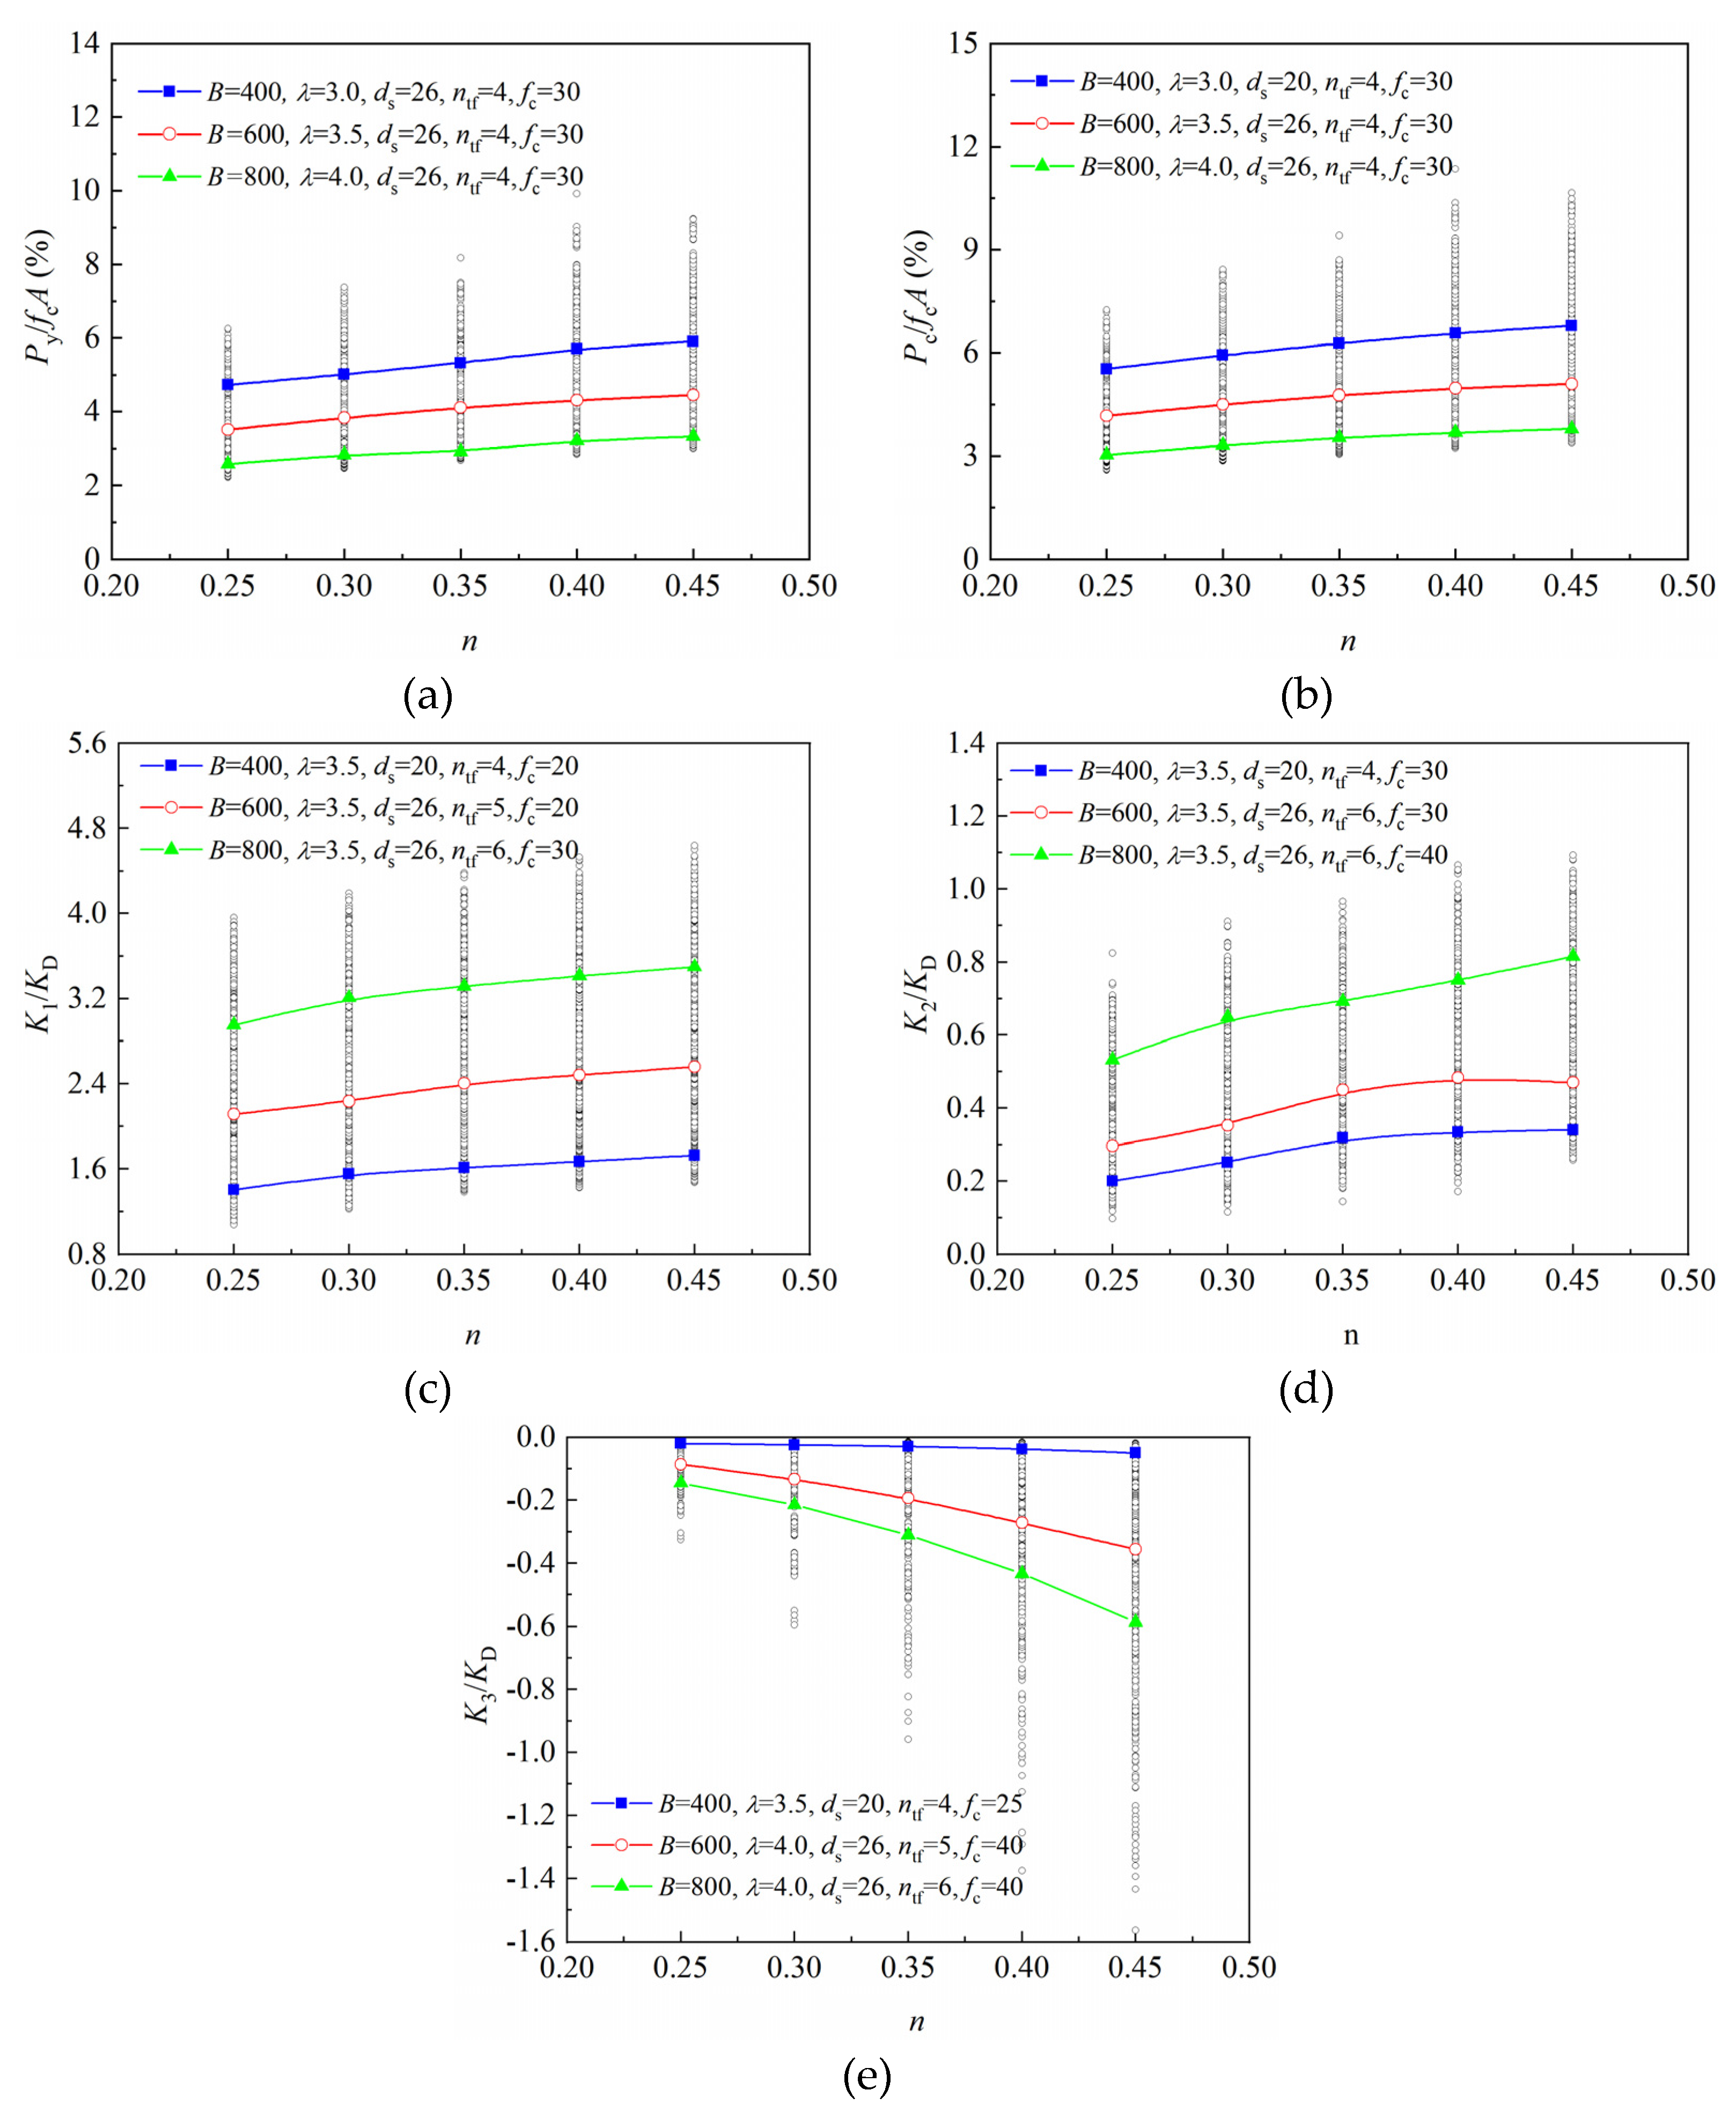
3.2.1. Influence of Axial Compression Ratio

To eliminate the effect of dimensions and enhance the applicability of the restoring force model, the characteristic points were normalized. The force was normalized relative to the product of the concrete compressive strength and the column cross-sectional area. Similarly, the stiffness was normalized relative to the lateral stiffness KD, which was determined using the D-value method, as presented in Equation (2):
K D = 12 E I H 3
where KD is the lateral stiffness; E is the modulus of elasticity of the section material; I is the moment of inertia of the section; H is the story height of the RC frame. Since a half-column model is used in this simulation, twice the column height is taken for the calculations. The effect of the axial compression ratio on the characteristic points of the load–displacement skeleton curve is shown in Figure 9. Based on the analysis results obtained from Figure 9, the following findings were obtained:
(1)
The yield load of FRP-retrofitted square RC columns shows an overall linear increase with the increase in axial compression ratio;
(2)
The peak load of the columns tends to increase with the axial compression ratio, and it exhibits a good linear relationship with it;
(3)
The elastic stiffness K1 exhibits an approximately linear increase with the rise of the axial compression ratio;
(4)
The elastoplastic stiffness K2 demonstrates an overall linear or piecewise linear increase with the axial compression ratio;
(5)
The absolute values of the descent stiffness increase with the axial pressure ratio, indicating that the descent stage of the load–displacement curve becomes steeper and ductility decreases. While the descent stiffness exhibits a certain degree of nonlinearity with the axial compression ratio, it can be considered piecewise linear.

3.2.2. Influence of Shear/Span Ratio

Figure 10 illustrates the influence of the shear/span ratio on the characteristic points of the lateral force–displacement skeleton curve. From the analysis, the following conclusions can be drawn:
(1)
There is a strong linear relationship between the shear/span ratio and the yield load, with the yield load decreasing linearly as the shear/span ratio increases;
(2)
The peak load capacity also tends to decrease with the increase in the shear/span ratio, and there is a good linear relationship between them;
(3)
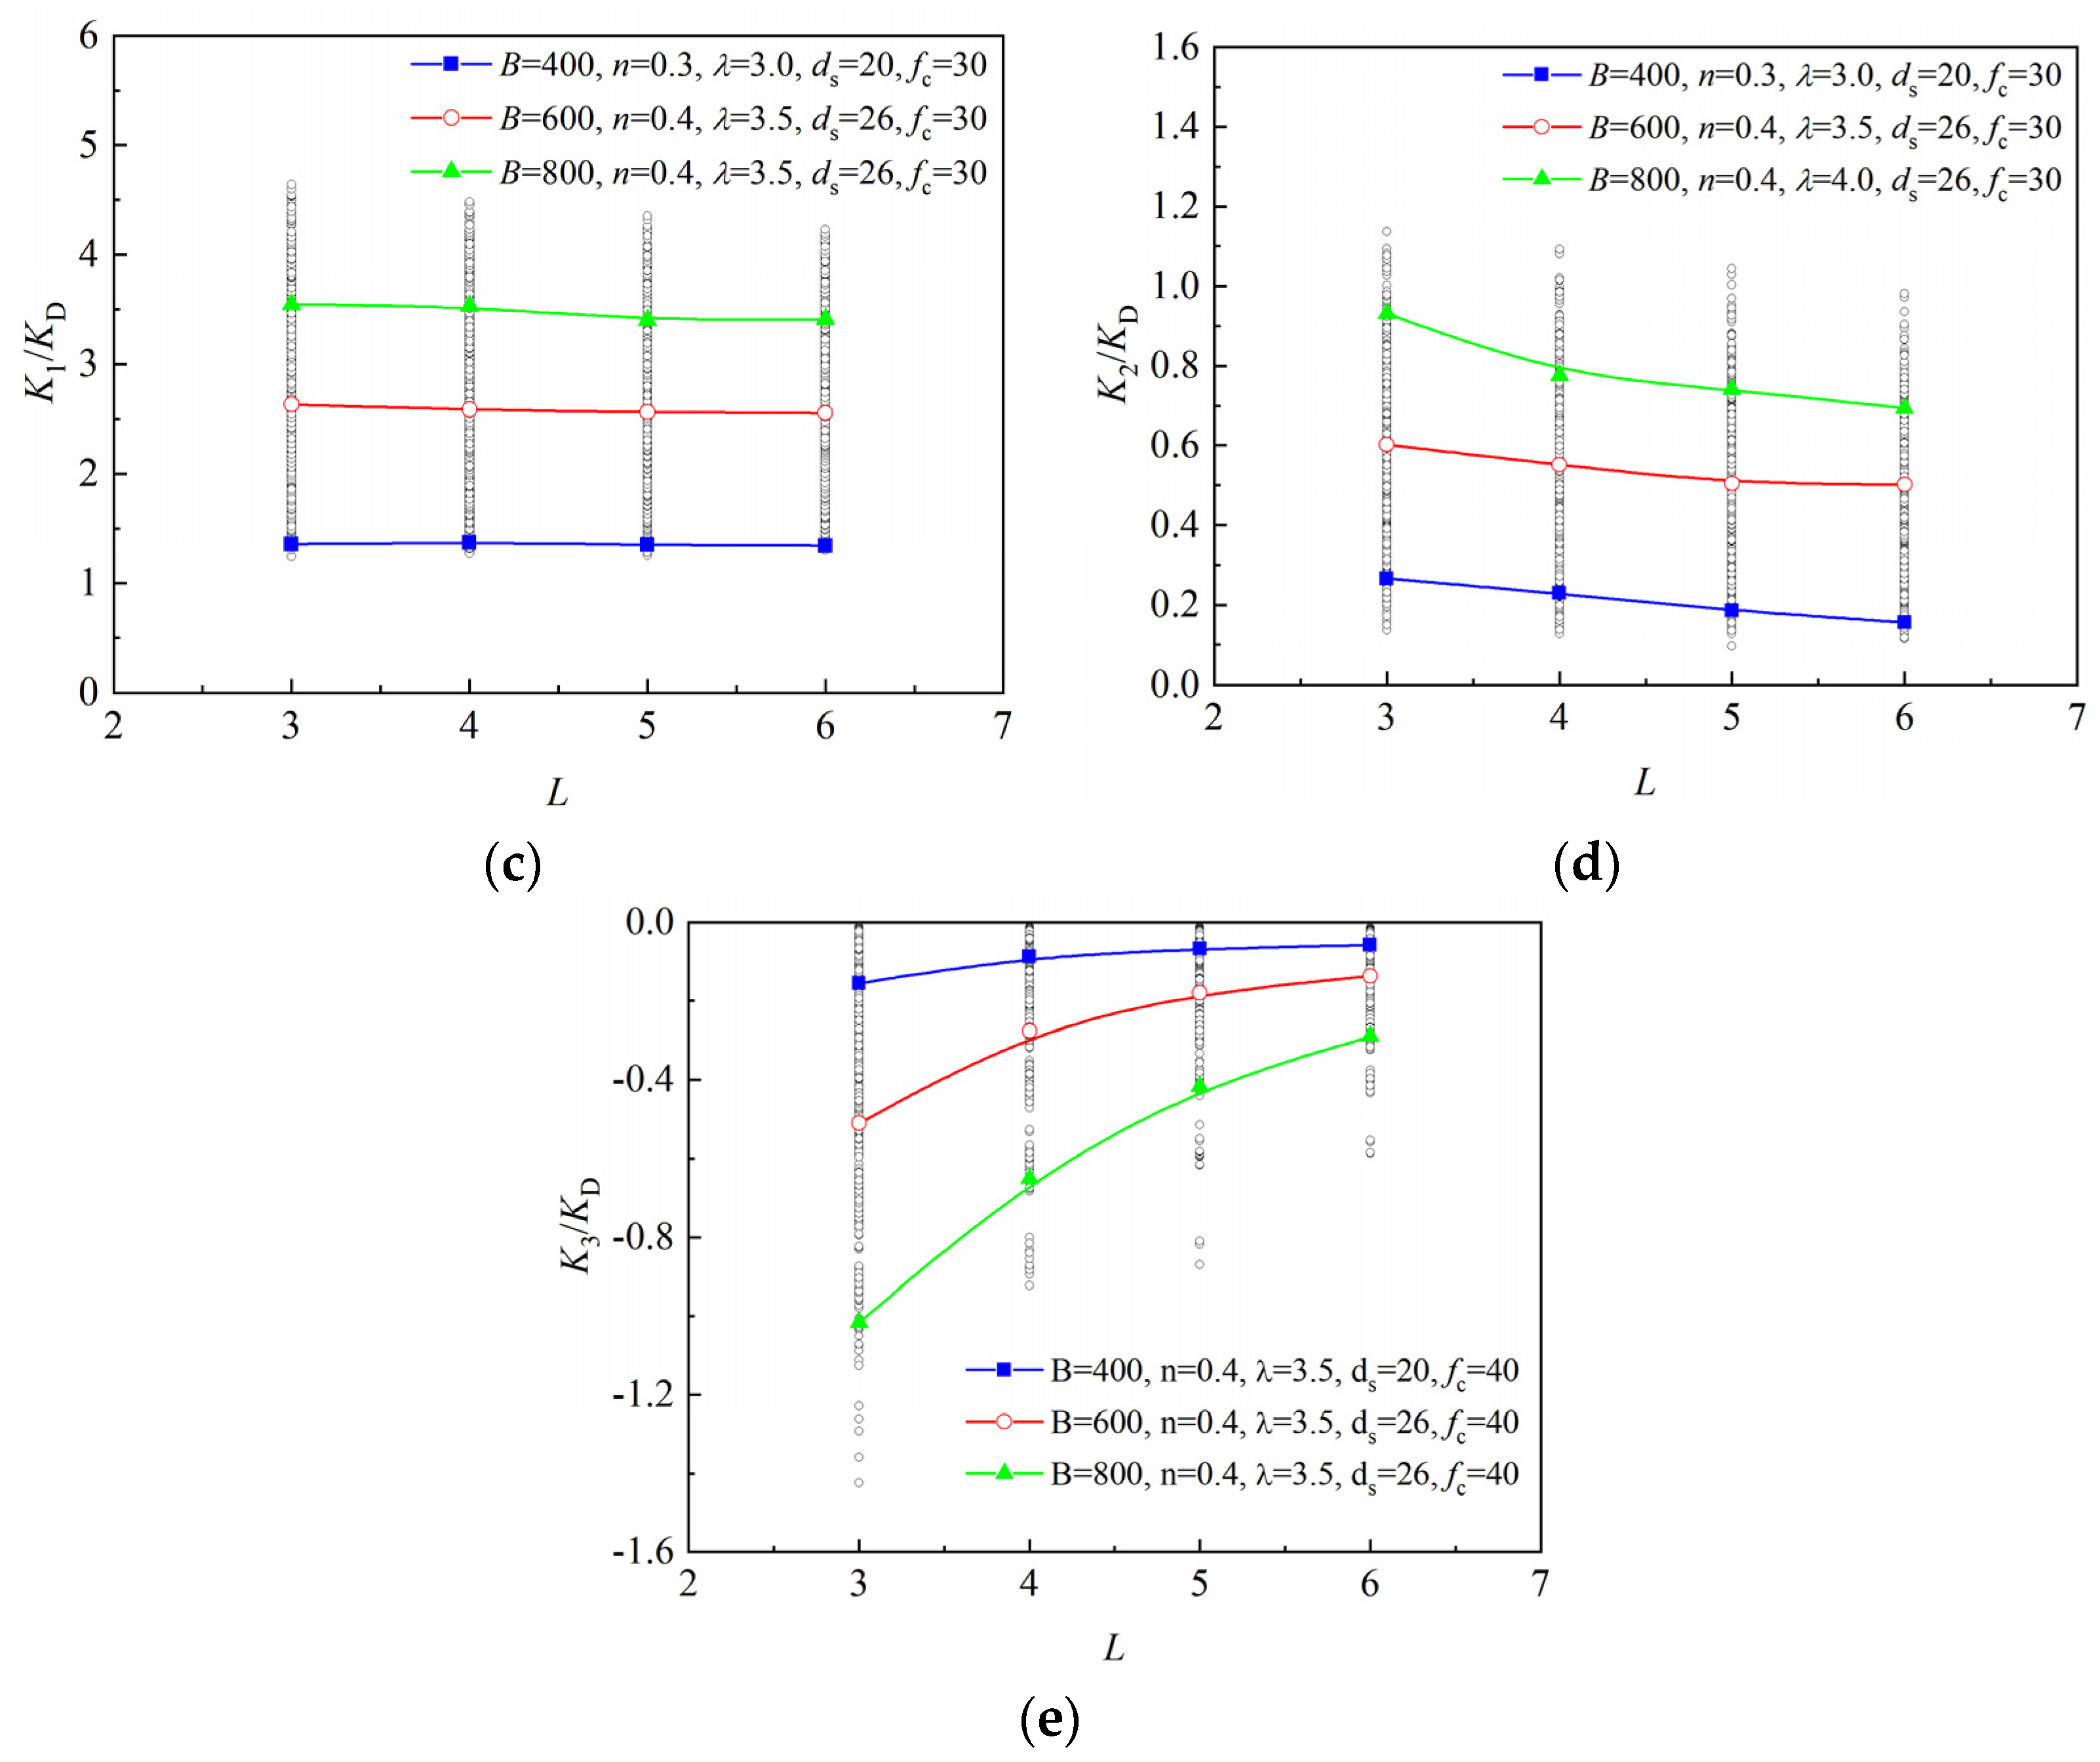
The elastic stiffness K1 exhibits a clear linear increase with the shear/span ratio;
(4)
The elastoplastic stiffness K2 shows some nonlinearity with the shear/span ratio, but the overall trend can be approximated as being linear;
(5)
The descent stiffness K3 shows a more obvious linear decreasing trend with the increase in the shear/span ratio.

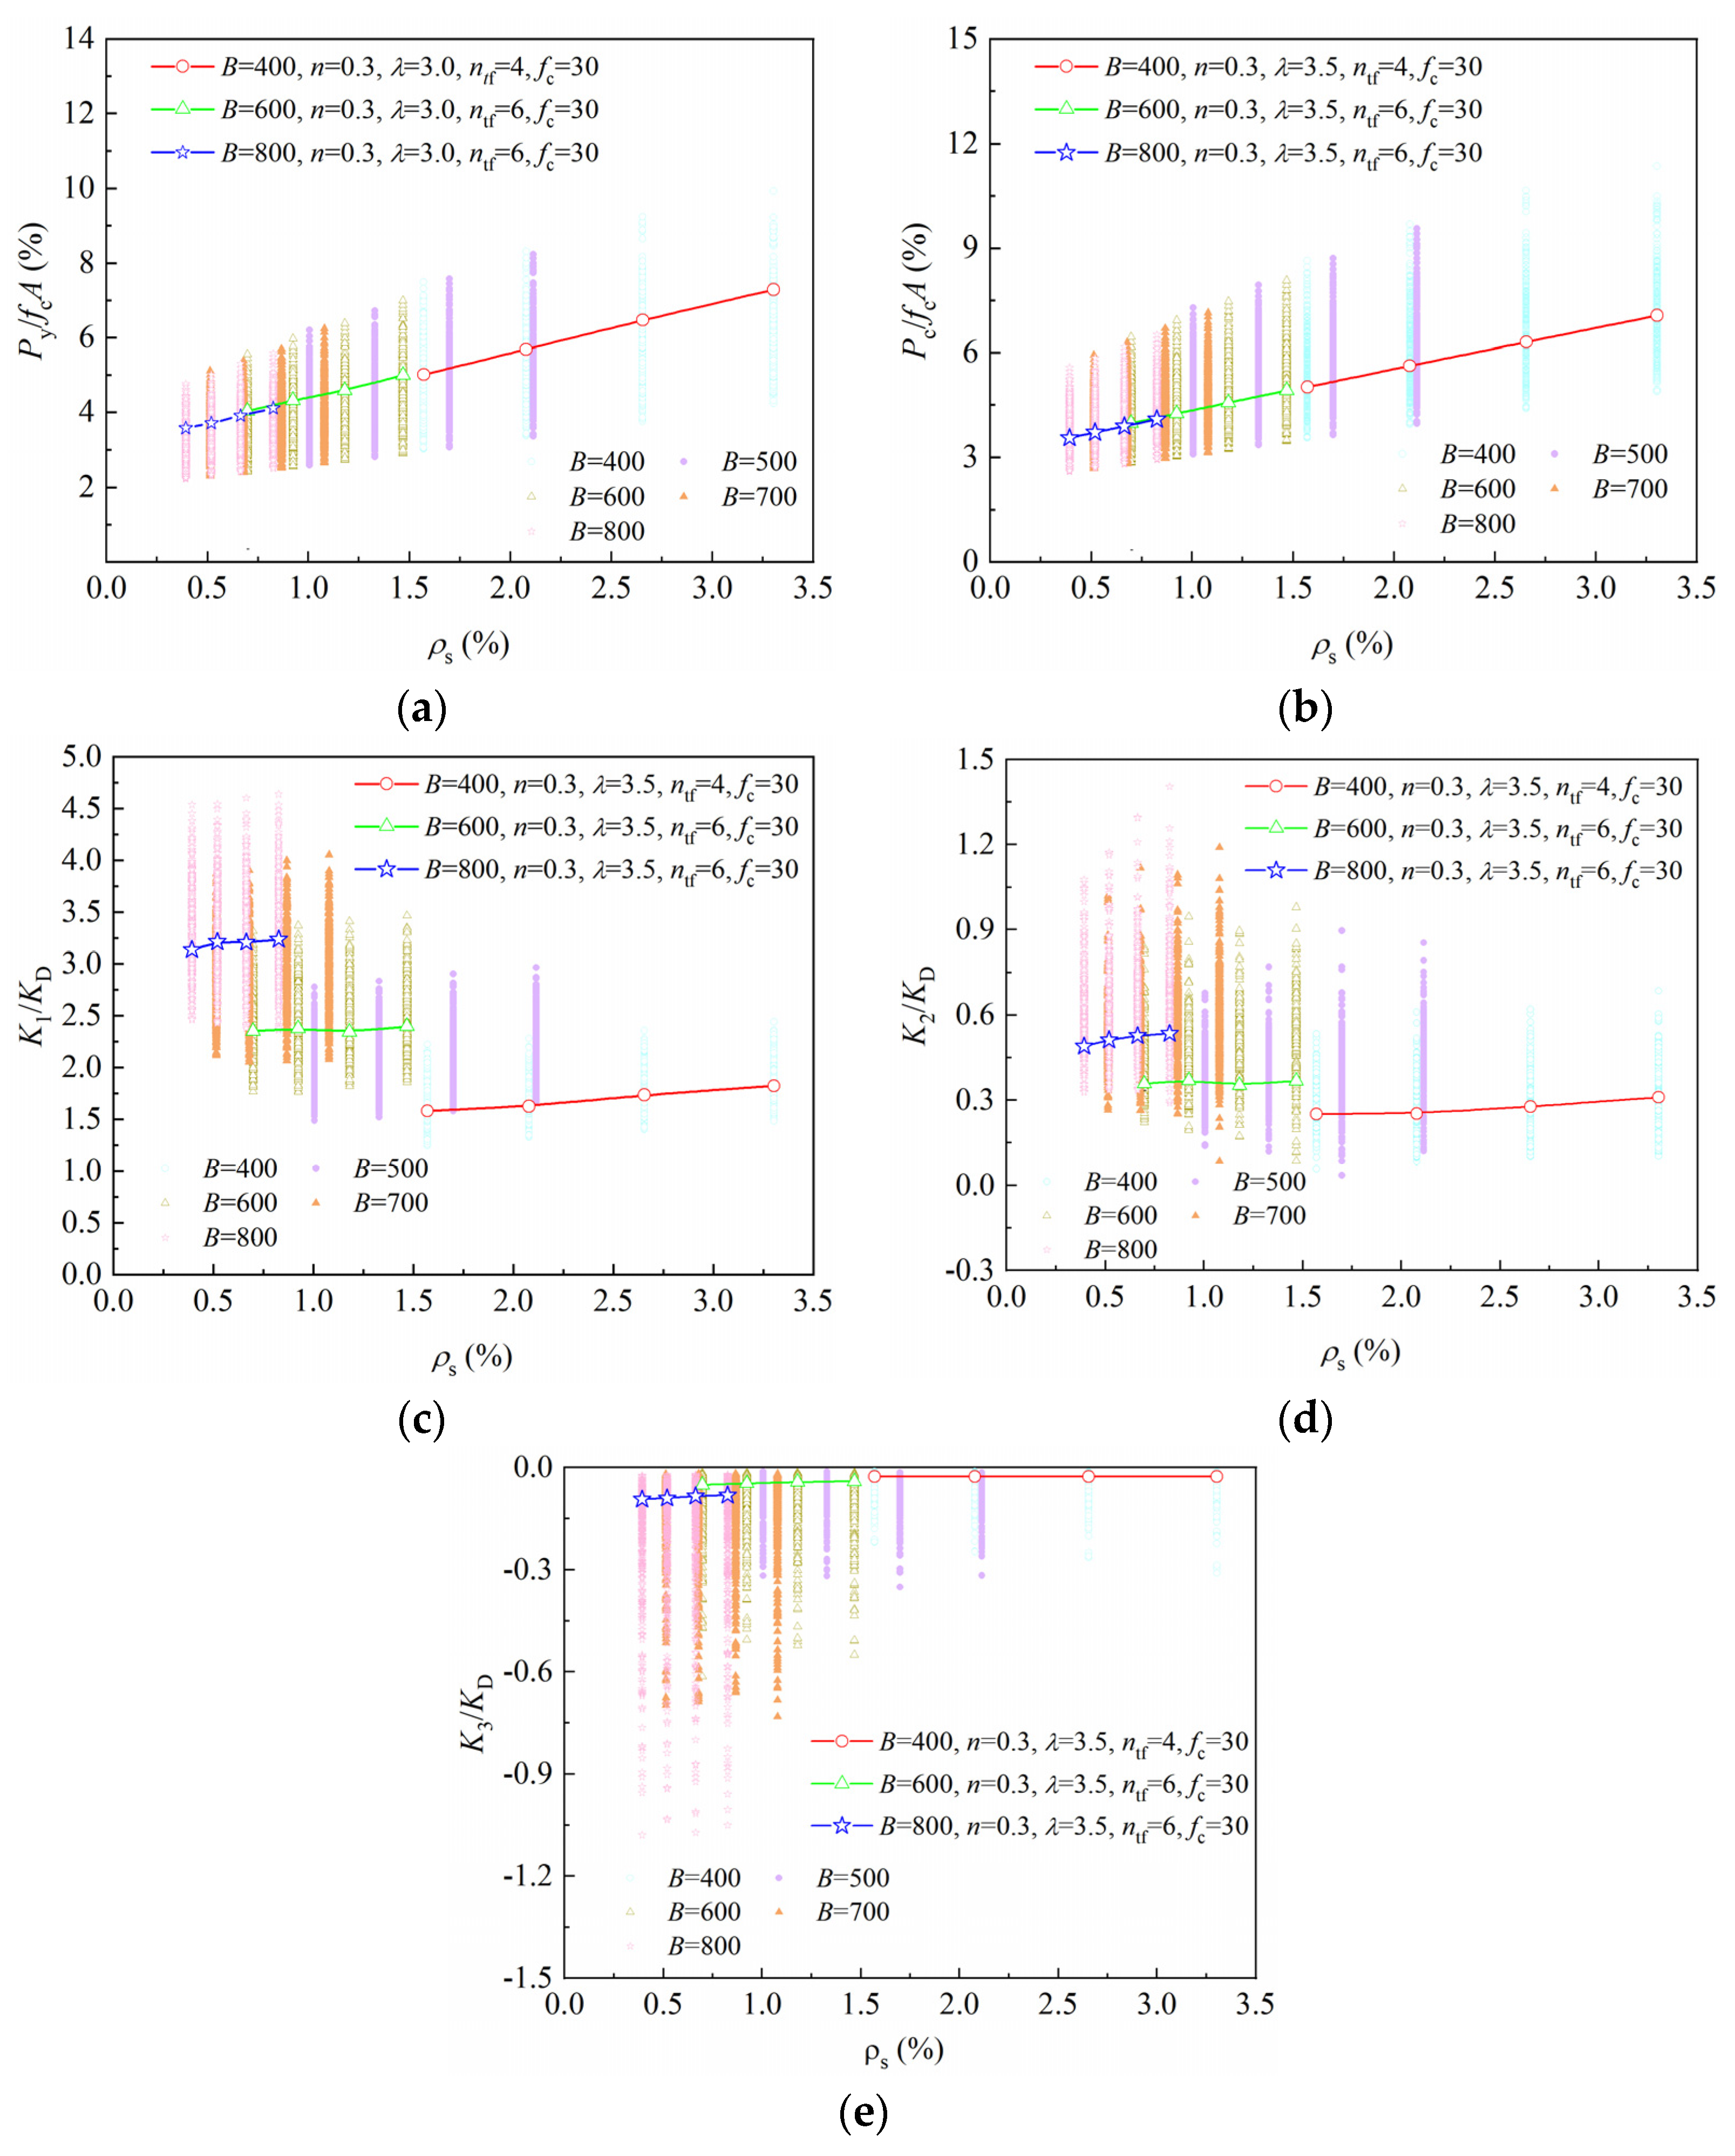
3.2.3. Influence of Steel Reinforcement Ratio

Figure 11 illustrates the influence of the steel reinforcement ratio on the characteristic points of the lateral force–displacement skeleton curve. Through the discussion and analysis of the simulation results, the following conclusions can be drawn:
(1)
The yield load exhibits an overall linear increase with the reinforcement ratio. For columns with section sizes of 400 mm and 600 mm under identical conditions, the yield load increases linearly with the reinforcement ratio. When the reinforcement ratio is approximately equal (1.5%), the normalized yield load is also similar, indicating a continuous linear relationship between the reinforcement ratio and yield load, with minimal size effect on the normalized yield load. This is consistent with the test results provided in [17].
(2)
The influence of the reinforcement ratio on peak load is similar to yield load, with a linear relationship between peak load and the reinforcement ratio. For columns with section sizes of 400 mm and 600 mm under identical conditions, the peak load increases continuously and linearly with the reinforcement ratio.
(3)
For square RC columns with the same section size, the elastic stiffness increases linearly with the reinforcement ratio. When comparing columns with different section sizes (400 mm and 600 mm) but similar axial compression ratio, shear/span ratio, and confinement ratio, the normalized elastic stiffness differs when the reinforcement ratio is equal (1.5%). Larger cross-sectional sizes result in higher normalized elastic stiffness, indicating a significant size effect on normalized elastic stiffness. This differs from the influence of the reinforcement ratio on the yield and peak loads.
(4)
The elastoplastic stiffness also exhibits a linear relationship with the reinforcement ratio. When the reinforcement ratio reaches a certain level, this relationship approximates a horizontal line, indicating the minimal impact of the reinforcement ratio on elastoplastic stiffness at higher levels. A significant size effect on elastoplastic stiffness is also observed.
(5)
The descent stiffness shows an approximate horizontal linear relationship with the reinforcement ratio, indicating the minimal impact of reinforcement ratio variations on descent stiffness. However, the size effect also has a slight impact on descent stiffness.

3.2.4. Influence of Number of Layers of FRP Wrap

Figure 12 illustrates the influence of the number of layers of FRP wrap on the characteristic points of the lateral force–displacement skeleton curve. Based on the simulation results, the findings on the influence of FRP wrap layers are as follows:
(1)
The yield load exhibits a nearly horizontal linear relationship with the number of layers of FRP wrap. As the number of layers increases, the yield load of the retrofitted column increases slightly, indicating a minimal impact of FRP layers on yield load.
(2)
Similar to yield load, the peak load has a good linear relationship with the number of layers of FRP wrap. However, the impact is minimal, with peak load increasing slowly and linearly as the number of layers of FRP wrap increases.
(3)
The number of layers of FRP wrap has a minimal impact on elastic stiffness, similar to yield load. As the number of layers of FRP wrap increases, the normalized elastic stiffness of the retrofitted column remains nearly constant, indicating that FRP wrapping has minimal effect on elastic stiffness.
(4)
The elastoplastic stiffness of the retrofitted column decreases approximately linearly with an increase in the number of layers of FRP wrap. This indicates that more FRP layers result in a flatter elastoplastic stage of the load–displacement skeleton curve. Consequently, the peak displacement increases without significant changes in peak load, improving the ductility of columns.
(5)
The absolute value of the descent stiffness decreases nonlinearly with an increase in the number of layers of FRP wrap, following a quadratic nonlinear relationship by regression analysis. This trend suggests that with more FRP layers, the descent stage of the load–displacement skeleton curve becomes flatter, resulting in larger ultimate displacement and improved ductility. The nonlinear correlation indicates that beyond a certain number of layers of FRP wrap, the improvement in ductility becomes less significant with additional layers.

3.2.5. Influence of Concrete Strength

The influence of concrete strength on the characteristic points is shown in Figure 13. The following conclusions can be drawn:
(1)
As concrete strength increases, the yield load of the retrofitted column generally decreases, exhibiting a slight nonlinear relationship. However, this nonlinearity is minimal and can be simplified to a linear or piecewise linear relationship.
(2)
Similar to the yield load, the peak load decreases in a slight nonlinearity as concrete strength increases. However, this relationship can generally be approximated by a linear or piecewise linear model.
(3)
The relationship between concrete strength and elastic stiffness is nearly linear. As concrete strength increases, the elastic stiffness shows a slight linear increase. However, the overall influence of concrete strength on elastic stiffness remains minimal.
(4)
The relationship between concrete strength and elastoplastic stiffness exhibits some nonlinearity, especially when the section size of a column is large and the number of layers of FRP wrap is low, resulting in weaker confinement. However, this relationship can be approximated by a piecewise linear correlation.
(5)
The absolute value of descent stiffness increases with concrete strength, indicating a decrease in column ductility. With other parameters constant and only concrete strength varying, descent stiffness shows a slight nonlinearity with concrete strength.

3.3. Calculation of Characteristic Point

Based on the statistical analysis under the influence of various parameters, a regression analysis was conducted on the characteristic points of the skeleton curves to determine the calculation formulas for these characteristic parameters. The regression analysis factors considered are axial compression ratio, shear/span ratio, steel reinforcement ratio, and confinement ratio (the ratio of FRP confinement stress to concrete strength). The influence of the ratio of steel yield strength to concrete strength was also included to account for the effect of steel strength. Additionally, a size effect factor was introduced for certain characteristic parameters to account for the influence of size effects.

3.3.1. Yield Load

As previously discussed, the axial compression ratio, shear/span ratio, reinforcement ratio, number of layers of FRP wrap, and concrete strength all exhibit approximately linear relationships with yield load. On this basis, and with reference to the study conducted by Dai et al. [37], the yield load calculation formula for FRP-retrofitted square RC columns was derived using the regression analysis format, as shown in Equation (3):
P y = f c A g 100 a 0 + a 1 λ a 2 + a 3 n + a 4 ρ s f y 100 f c + a 5 f lf f c
where Py is yield load; fc is the peak stress of an unconfined concrete column; Ag is the full section area of the retrofitted column; λ is the shear-to-span ratio; n is the axial compression ratio; ρs (%) is the steel reinforcement ratio; fy is the yield strength of longitudinal reinforcement; flf is the FRP confinement stress, which is computed using the effective confinement coefficient for FRP-confined square RC columns [38], as shown in Equations (4) and (5); a0a5 are regression coefficients. The specific regression results are presented in Table 6.
f lf = κ s 2 E f n t f ε fe D
κ s = A e A c = 1 3 ρ 1 ρ
ε fe = ε fu 1 0.38 B 100 0.41
κs is the section shape coefficient; D is the equivalent circular diameter, typically taken as the diameter of the circumscribed circle ( D = 2 B ) or the inscribed circle (D = B); Ef is the modulus of elasticity of FRP; n is the number of layers of FRP wrap; tf is the thickness of a single FRP layer; Ae is the effective confinement area; Ac is the total section area of a column; ρ is the longitudinal reinforcement ratio; εfe is the effective fracture strain model considering size effects proposed by Wang et al. [39]; εfu is the ultimate tensile strain of FRP; B is the width of the retrofitted column.

3.3.2. Peak Load

Given that the influencing parameters exhibit similar effects on both the yield load and the peak load, the peak load Pc is formulated using the same regression format as Equation (3), as presented in Equation (7).
P c = f c A g 100 a 0 + a 1 λ a 2 + a 3 n + a 4 ρ s f y 100 f c + a 5 f lf f c
The parameters in the equation are the same as previously defined, and the regression coefficients a0a5 are presented in Table 6.

3.3.3. Elastic Stiffness

Previous statistical analysis of the parameters indicates that elastic stiffness can be considered linearly correlated with the influencing parameters, and the size effect should also be considered. Therefore, a regression analysis was conducted using an equation similar to the load capacity formula, as shown in Equation (8):
K 1 = P y θ y = K D a 0 κ a a 1 + a 2 λ a 3 + a 4 n + ( a 5 + a 6 ρ s f y 100 f c + a 7 f lf f c ]
where K1 is elastic stiffness; θy is the yield drift ratio; κa = B/100 is the section size effect factor. Other parameters remain the same as previously defined. The specific results of the regression coefficients a0a7 are shown in Table 6.

3.3.4. Elastoplastic Stiffness

The parameter statistical analysis indicates that the elastoplastic stiffness is approximately linearly related to the influencing parameters and exhibits a piecewise linear relationship with the axial compression ratio. Therefore, regression was conducted separately for axial compression ratios less than and greater than 0.35, using the same equation form for both cases, as shown in Equation (9):
K 2 = P c P y θ c θ y = K D a 0 κ a a 1 + a 2 λ a 3 + a 4 n + ( a 5 + a 6 ρ s f y 100 f c + a 7 f lf f c ]
where K2 is the elastoplastic stiffness, and θc is the peak drift ratio. Other parameters have the same meaning as previously defined. The specific results of the regression coefficients are provided in Table 6.

3.3.5. Descent Stiffness

The parametric analysis presented in Section 2.2 reveals that the descent stiffness of FRP-retrofitted square RC columns exhibits a linear correlation with both the shear/span ratio and the steel reinforcement ratio, while its relationship with the axial load ratio can be characterized as piecewise linear. The number of layers of FRP wrap and concrete strength show an approximately quadratic nonlinear relationship with descent stiffness. Accordingly, and drawing on the methodology proposed by Dai et al. [37], a comprehensive regression analysis incorporating all these parameters is performed, as expressed in Equation (10):
K 3 = 0.15 P c θ u θ c = K D a 0 κ a a 1 + a 2 λ a 3 + a 4 n + a 5 ρ s f y 100 f c + a 6 f lf f c + a 7 f lf f c 2 a 8
where K3 represents the negative stiffness of the descent stage; θu is the ultimate drift ratio corresponding to a peak load reduction to 85%; and the other parameters have the same meaning as previously defined. The specific results of the regression coefficients a0a8 are shown in Table 6.
The comparison between the characteristic point parameters predicted using regression formulas and the results obtained from numerical simulation analysis is presented in Figure 14. This comparative analysis indicates that the regression-based prediction formulas for the yield load, peak load, and elastic stiffness of FRP-retrofitted square RC columns exhibit good agreement with the FE analysis results, with most data points falling within a ±10% deviation band from the reference line (y = x). The coefficient of determination (R2), which ranges from 0 to 1, is used to evaluate the goodness of fit between the predicted and simulated values. The closer the R2 value is to 1, the better the predicted model aligns with the simulated data. For the characteristic parameters mentioned above, the R2 values exceed 0.98, demonstrating the high accuracy and reliability of the proposed regression models. Although the predictive accuracy for elastoplastic stiffness and descent stiffness is slightly lower than that for the other characteristic parameters, their performance remains satisfactory; the simulated data points are approximately symmetrically distributed around the reference line (y = x), with deviations predominantly within ±15%. This falls within the acceptable tolerance range for RC structural performance, as deviations within ±15% are commonly regarded as acceptable in structural engineering. Moreover, the R2 values for these parameters remain above 0.90, further confirming the robustness of the regression models.

3.4. Unloading/Reloading Hysteresis Rules

Existing pseudo-static tests [17] on FRP-retrofitted square RC columns show that the unloading curves of FRP-retrofitted square RC columns are approximately straight in the initial stage and exhibit a certain degree of stiffness degradation. However, this degradation is less severe in the later stage of loading compared to unreinforced RC columns. Additionally, the reloading curves typically pass through two fixed points in both positive and negative directions. Therefore, this paper adopts the fixed-point directed hysteresis rule to define the unloading and reloading curves [40], as shown in Figure 15.
The load–displacement unloading curves (segments 1 and 3) in the figure are modeled as straight lines, with unloading stiffness calculated using the regression formula from pseudo-static tests of FRP-retrofitted square RC columns [17], as shown in Equation (11). The unloading process extends from the unloading point on the skeleton curve to the point where the horizontal load is zero. The reloading curves (segments 2 and 4) are modeled as straight lines from the zero-load point to the fixed point, serving as loading stiffness up to the skeleton curve. The positive and negative fixed-point loads were determined using the test data [17]. The statistical analysis of the test results indicated that the fixed-point load of the reloading curve for FRP-retrofitted square RC columns is approximately 0.50 times the peak load. The yield/drift ratio corresponding to the fixed point can be determined by dividing the fixed-point load by the elastic stiffness K1:
K u = K D 0.94 e 0.76 θ + 0.78
where Ku is unloading stiffness; KD is the lateral stiffness determined by the D-value method; and θ = Δ/H is the drift ratio.

3.5. Validation of Lateral Force–Displacement Hysteretic Model

Based on the five characteristic parameters of load capacity and stiffness obtained from regression, the load–displacement trilinear skeleton curve can be determined. As presented in Figure 7, the yield/drift ratio θy, peak drift ratio θc, and ultimate drift ratio θu can be defined from these five characteristic parameters, as shown in Equations (12)–(14):
θ y = P y K 1
θ c = P y K 1 + P c P y K 2
θ u = P y K 1 + P c P y K 2 0.15 P c K 3
where the parameters have the same meanings as previously defined.
Combining the trilinear skeleton curve with the hysteresis rules yields a lateral force–displacement hysteretic model for FRP-retrofitted square RC columns, suitable for design and finite element analysis. To validate the accuracy of the established model, simulations were conducted using the developed restoring-force model on the pseudo-static tests [17,33]. The results were compared with the test data, as shown in Figure 16 and Table 7.
As illustrated in Figure 16, the calculated lateral force–displacement hysteresis model for the FRP-retrofitted square RC columns shows good agreement with the experimental results. The overall trends of the calculated curves generally follow those observed in the tests, and the predicted unloading and reloading paths align well with the experimental responses, indicating that the proposed hysteresis model achieves a satisfactory level of accuracy. Table 7 provides a further comparison between the calculated and experimental values for yield and peak loads. The results indicate that the predicted values are in relatively close agreement with the test data, with average deviations ranging from –8% to +13% for yield load and from –9% to +6% for peak load. All deviations remain within ±15%, which satisfies the commonly accepted accuracy requirement for RC structural analysis. Overall, the proposed lateral force–displacement hysteresis model for FRP-retrofitted square columns is demonstrated to be both accurate and reliable.

4. Conclusions

This study utilized OpenSees to conduct numerical simulations and parameter analyses on the seismic performance of FRP-retrofitted square RC columns. Based on the numerical results, a lateral force–displacement hysteretic model was developed. The main conclusions are as follows:
(1)
Based on the nonlinear beam–column element and a self-developed stress–strain model for FRP-confined concrete, the FE model for CFRP-retrofitted square RC columns was achieved using OpenSees software. The simulation results demonstrated good agreement with the test data, thereby validating the accuracy of the modeling method.
(2)
Parametric analysis was performed to investigate the effects of axial load ratio, shear/span ratio, reinforcement ratio, number of layers of FRP wrap, and concrete strength on the key characteristics of the force–displacement skeleton curve, including yield load, peak load, elastic stiffness, elastoplastic stiffness, and descent stiffness. The results show that, except for descent stiffness having a quadratic nonlinear relation with the number of FRP wrap layers, the other influencing parameters mainly have a linear relation with the parameters of the characteristic points of the skeleton curve.
(3)
The lateral load capacity of retrofitted columns increases with a higher axial load ratio and reinforcement ratio, while FRP confinement provides only a slight improvement. In contrast, increasing the shear/span ratio and concrete strength leads to a reduction in lateral load capacity.
(4)
The displacement of the retrofitted columns increases with the number of layers of FRP wrap but decreases with a higher axial load ratio, shear/span ratio, reinforcement ratio, and concrete strength, demonstrating that FRP confinement improves their ductility.
(5)
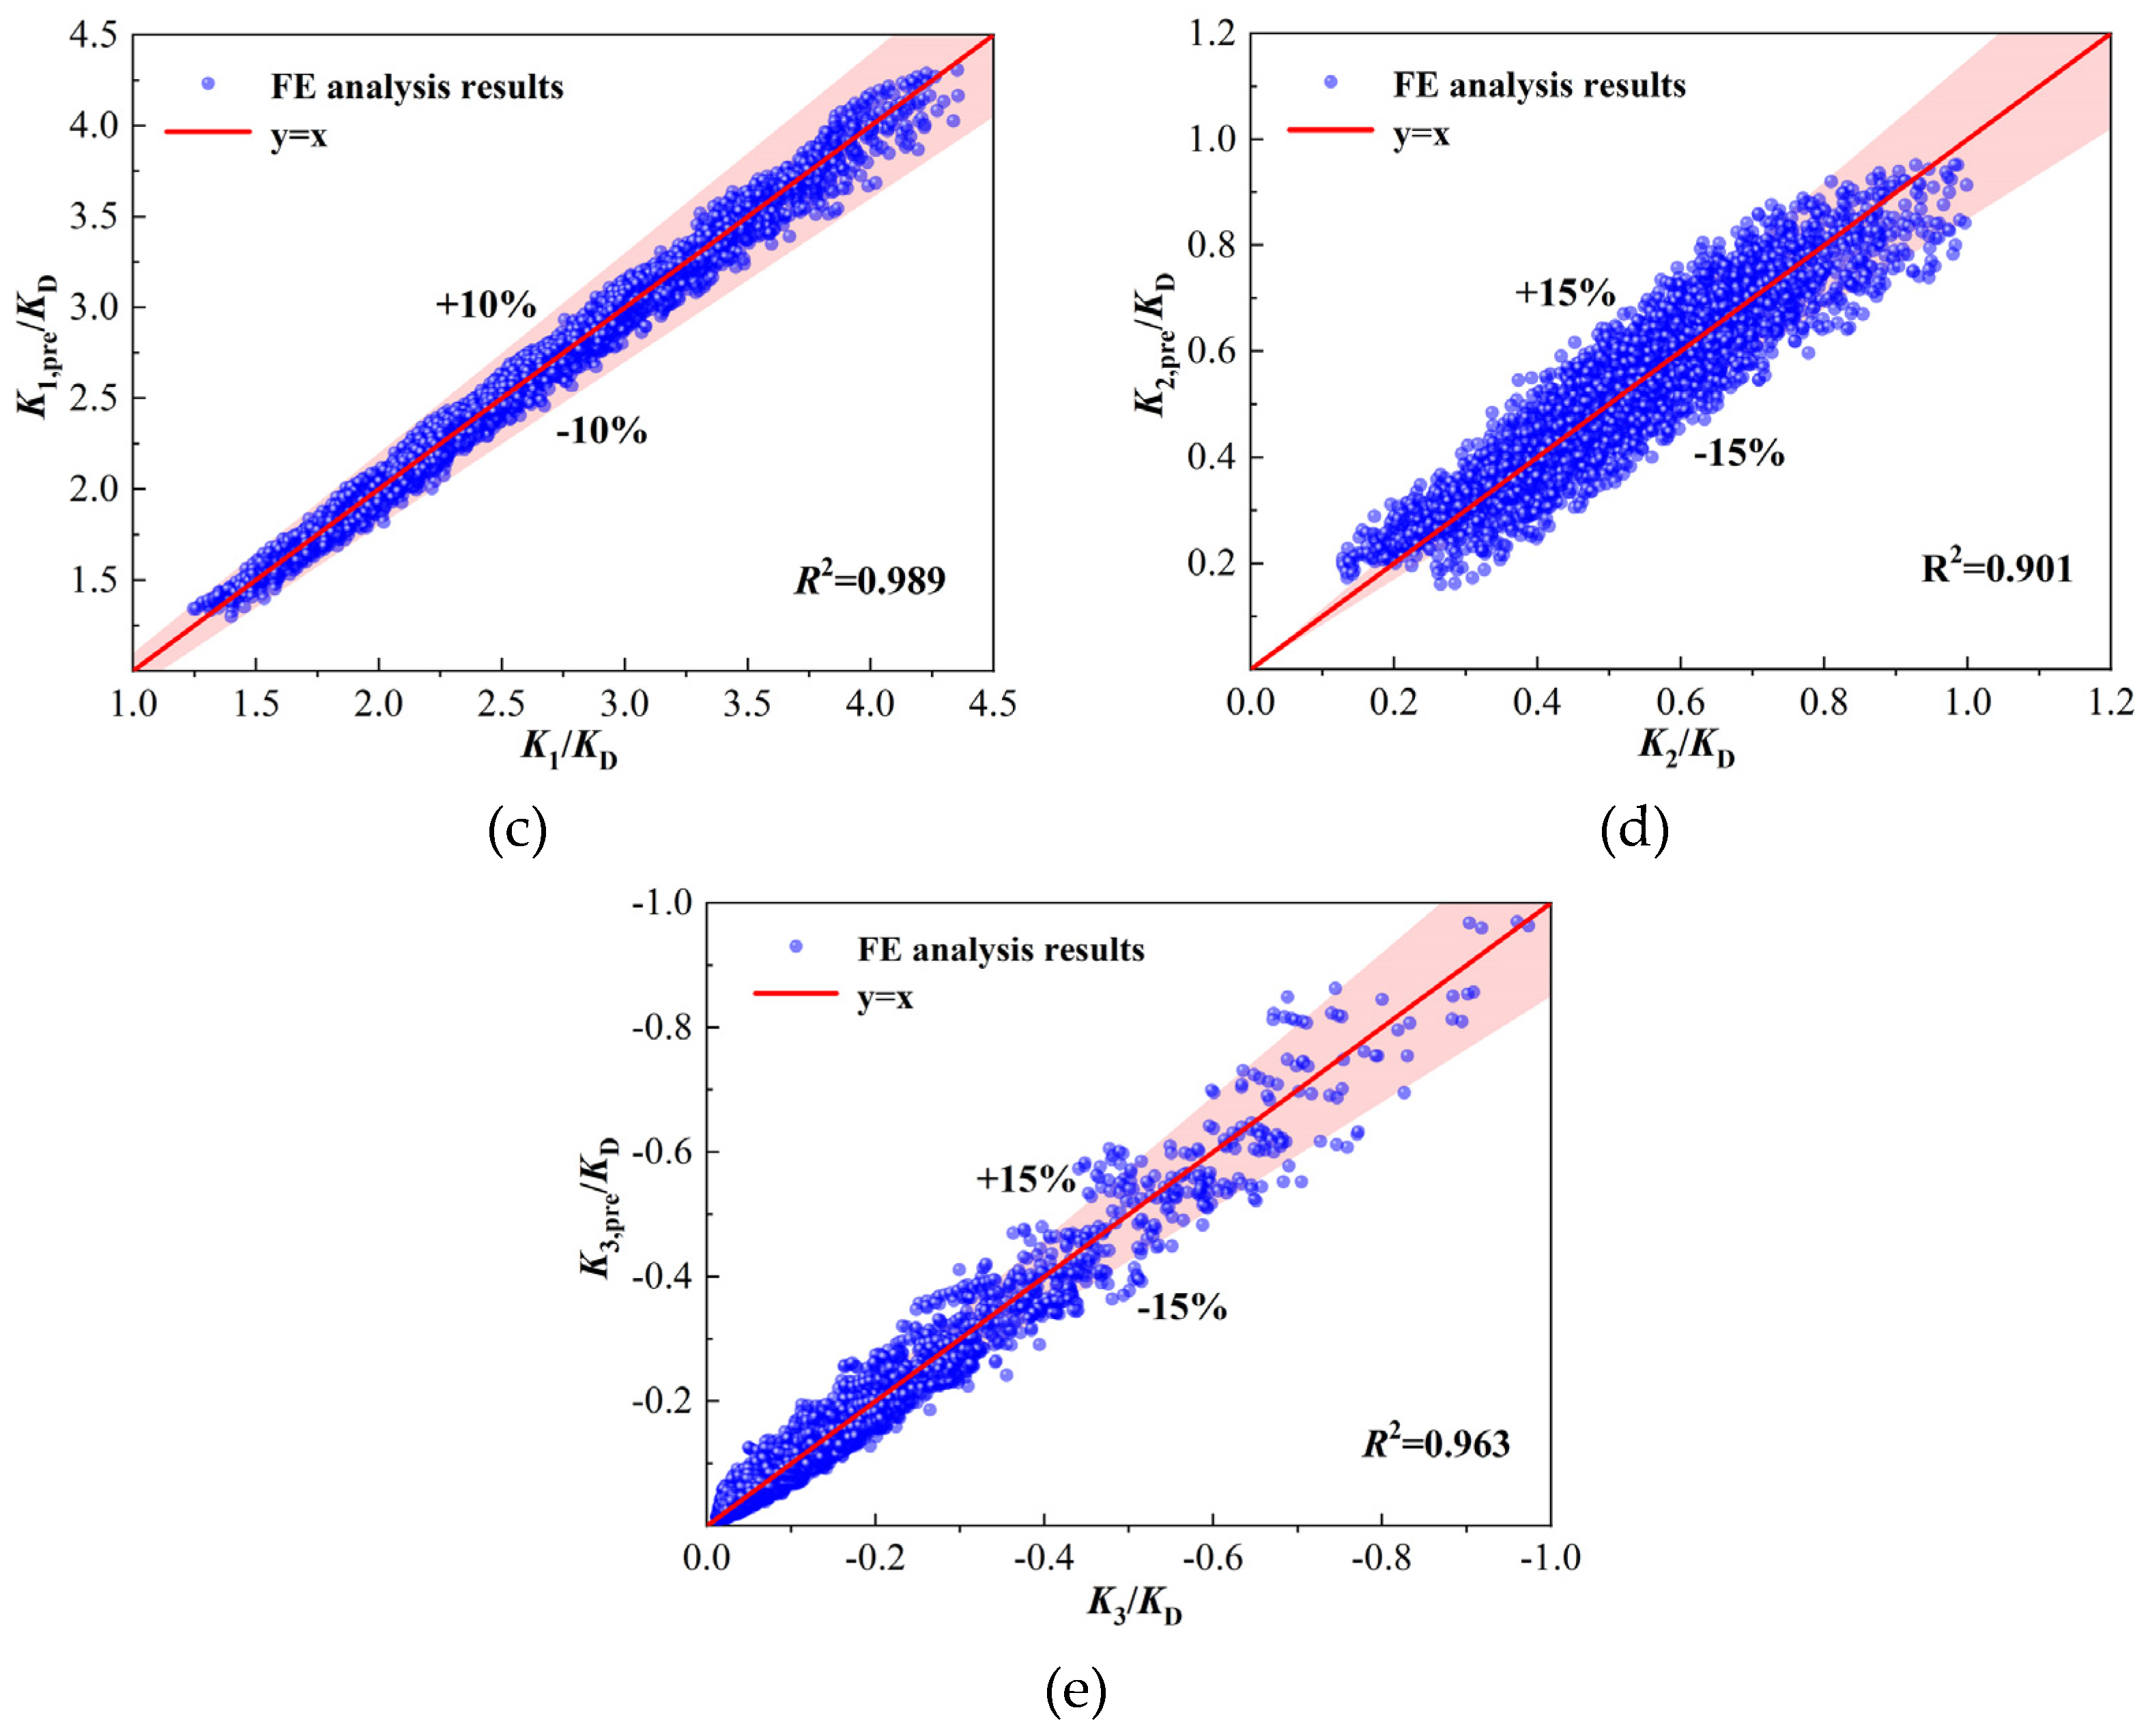
The trilinear load–displacement skeleton model was employed for CFRP-retrofitted square RC columns. Based on the regression analysis of the parameter analysis results, calculation models of yield load, peak load, elastic stiffness, elastoplastic stiffness, and descent stiffness for the skeleton model were developed.
(6)
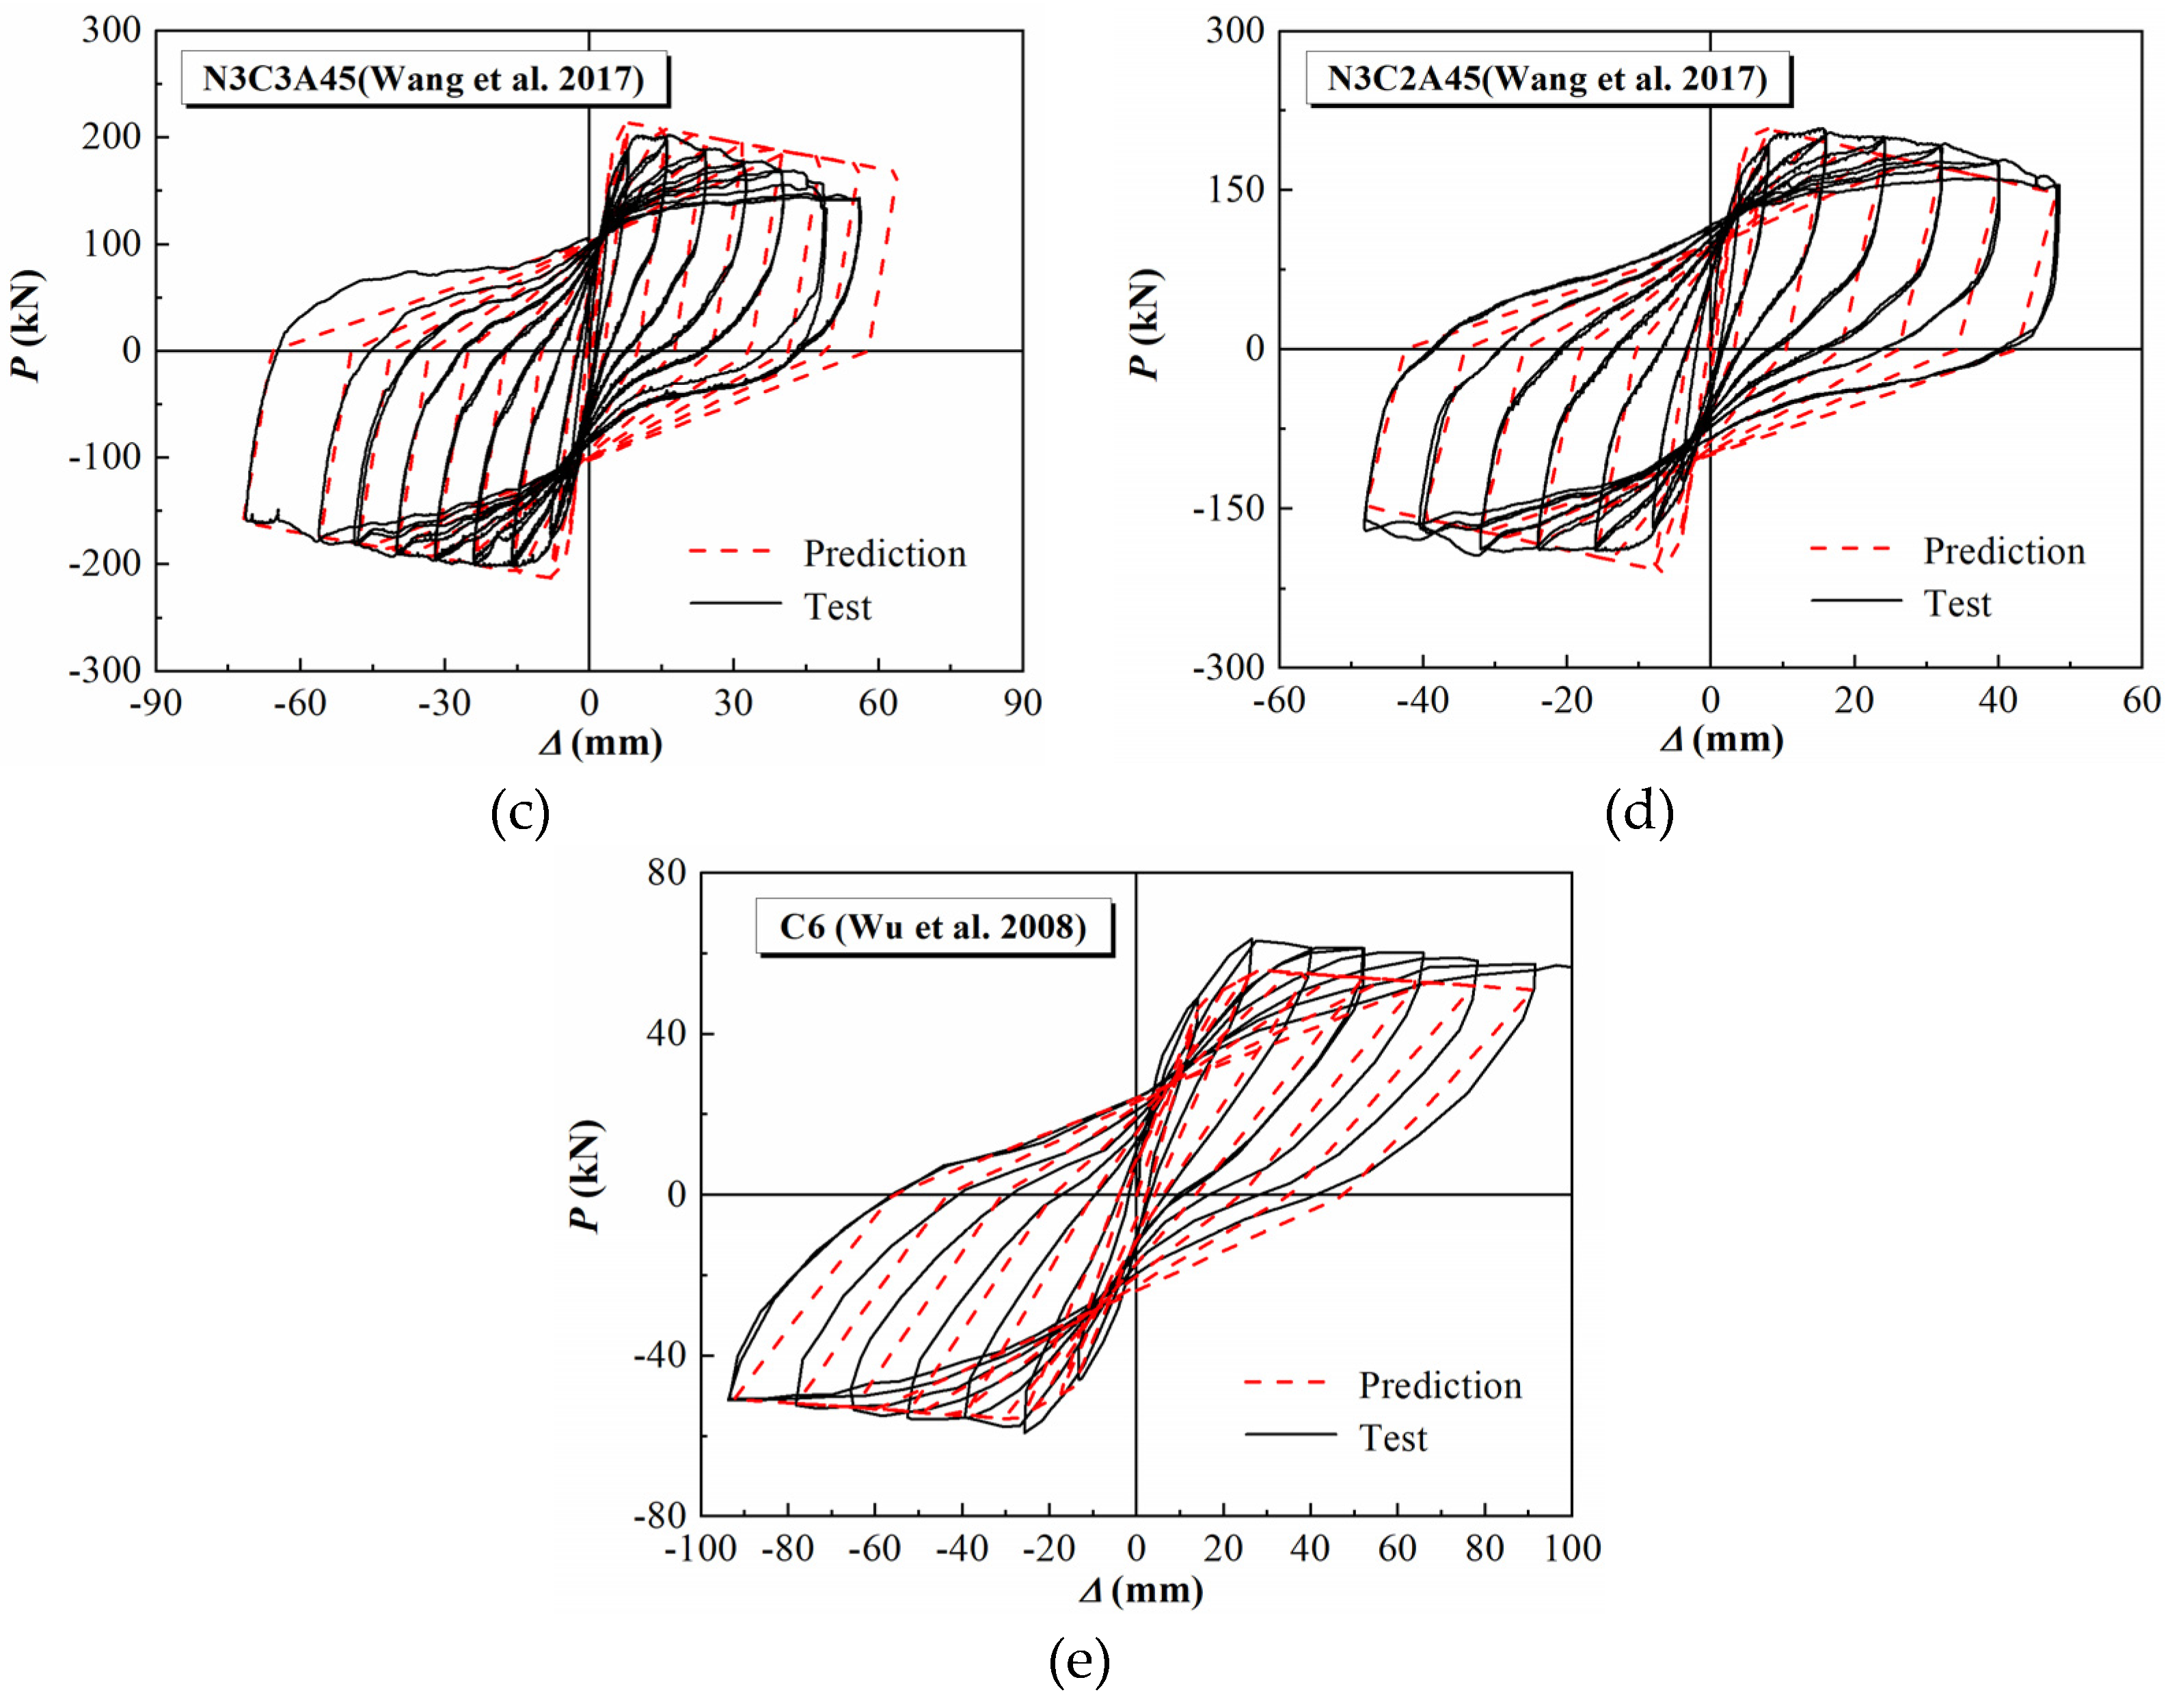
A fixed-point directed hysteresis rule for FRP-retrofitted square RC columns was proposed, with both loading and unloading curves modeled as straight lines. By combining this hysteresis rule with the trilinear skeleton model, a load–displacement restoring force model for FRP-reinforced RC square columns was developed. This model’s predictions are in good overall agreement with test results, with all average load deviations falling within ±15%.

Author Contributions

H.W.: conceptualization, methodology, and writing—original draft. M.Z.: data curation and analysis. F.Z.: writing—reviewing, validation, and editing. D.W.: validation and funding acquisition. All authors have read and agreed to the published version of the manuscript.

Funding

The authors would like to acknowledge the financial support given by the National Key Research and Development Program of China (Grant No. 2023YFC3805100) and the National Natural Science Foundation of China (Grant No. 52278164).

Data Availability Statement

All data, models, or code that support the findings of this study are available from the corresponding author upon reasonable request.

Conflicts of Interest

The authors declare no conflicts of interest. The funders had no role in the design of the study; in the collection, analyses, or interpretation of data; in the writing of the manuscript; or in the decision to publish the results.

References

  1. Ali, O.; Abbas, A.; Khalil, E.; Madkour, H. Numerical investigation of FRP-confined short square RC columns. Constr. Build. Mater. 2021, 275, 122141. [Google Scholar] [CrossRef]
  2. Hao, M.; Chang, W.; Zheng, W. Hysteresis performance and restoring-force model of RC columns jacketed by octagonal and spiral stirrups. J. Build. Eng. 2024, 82, 108280. [Google Scholar] [CrossRef]
  3. Huang, Y.; Grünewald, S.; Schlangen, E.; Luković, M. Strengthening of concrete structures with ultra high performance fiber reinforced concrete (UHPFRC): A critical review. Constr. Build. Mater. 2022, 336, 127398. [Google Scholar] [CrossRef]
  4. Murugan, K.; Sengupta, A.K. Seismic performance of strengthened reinforced concrete columns. Structures 2020, 27, 487–505. [Google Scholar] [CrossRef]
  5. Parvin, A.; Brighton, D. FRP composites strengthening of concrete columns under various loading conditions. Polymers 2014, 6, 1040–1056. [Google Scholar] [CrossRef]
  6. Heydari, P.; Mostofinejad, D.; Mostafaei, H.; Ahmadi, H. Strengthening of deep RC coupling beams with FRP composites: A numerical study. Structures 2023, 51, 435–454. [Google Scholar] [CrossRef]
  7. Ali, O. Structural reliability of biaxial loaded short/slender-square FRP-confined RC columns. Constr. Build. Mater. 2017, 151, 370–382. [Google Scholar] [CrossRef]
  8. Chen, J.-F.; Smith, S.; Lam, L.; Teng, J.G. Behaviour and strength of FRP-strengthened RC structures: A state-of-the-art review. Proc. Inst. Civ. Eng.-Struct. Build. 2003, 156, 51–62. [Google Scholar] [CrossRef]
  9. Wu, Y.-F.; Wei, Y.-Y. Effect of cross-sectional aspect ratio on the strength of CFRP-confined rectangular concrete columns. Eng. Struct. 2010, 32, 32–45. [Google Scholar] [CrossRef]
  10. Xiao, Y. Applications of FRP composites in concrete columns. Adv. Struct. Eng. 2004, 7, 335–343. [Google Scholar] [CrossRef]
  11. Wang, W.; Sheikh, M.N.; Al-Baali, A.Q.; Hadi, M.N.S. Compressive behaviour of partially FRP confined concrete: Experimental observations and assessment of the stress-strain models. Constr. Build. Mater. 2018, 192, 785–797. [Google Scholar] [CrossRef]
  12. Harajli, M.H. Axial stress-strain relationship for FRP confined circular and rectangular concrete columns. Cem. Concr. Compos. 2006, 28, 938–948. [Google Scholar] [CrossRef]
  13. Wang, Z.; Wang, D.; Smith, S.T.; Lu, D. CFRP-confined square RC columns. I: Experimental investigation. J. Compos. Constr. 2012, 16, 150–160. [Google Scholar] [CrossRef]
  14. Wang, Z.; Wang, D.; Smith, S.T.; Lu, D. CFRP-confined square RC columns. II: Cyclic axial compression stress-strain model. J. Compos. Constr. 2012, 16, 161–170. [Google Scholar] [CrossRef]
  15. Memon, M.S.; Sheikh, S.A. Seismic resistance of square concrete columns retrofitted with glass fiber-reinforced polymer. Struct. J. 2005, 102, 774–783. [Google Scholar] [CrossRef]
  16. Ilki, A.; Demir, C.; Bedirhanoglu, I.; Kumbasar, N. Seismic retrofit of brittle and low strength RC columns using fiber reinforced polymer and cementitious composites. Adv. Struct. Eng. 2009, 12, 325–347. [Google Scholar] [CrossRef]
  17. Wang, D.; Huang, L.; Yu, T.; Wang, Z. Seismic performance of CFRP-retrofitted large-scale square RC columns with high axial compression ratios. J. Compos. Constr. 2017, 21, 04017031. [Google Scholar] [CrossRef]
  18. Peng, S.; Xiong, Z.; Zeng, X. A restoring force model for CFRP seismic-damaged RACFST columns: Theoretical, experimental, and simulation analysis. Structures 2022, 40, 273–283. [Google Scholar] [CrossRef]
  19. Lu, X.; Yin, X.; Jiang, H. Restoring force model for steel reinforced concrete columns with high steel ratio. Struct. Concr. 2013, 14, 415–422. [Google Scholar] [CrossRef]
  20. Shao, Y.; Aval, S.; Mirmiran, A. Fiber-element model for cyclic analysis of concrete-filled fiber reinforced polymer tubes. J. Struct. Eng. 2005, 131, 292–303. [Google Scholar] [CrossRef]
  21. Zhu, Z.; Ahmad, I.; Mirmiran, A. Fiber element modeling for seismic performance of bridge columns made of concrete-filled FRP tubes. Eng. Struct. 2006, 28, 2023–2035. [Google Scholar] [CrossRef]
  22. Mazzoni, S.; McKenna, F.; Scott, M.H.; Fenves, G.L. OpenSees Command Language Manual; Pacific Earthquake Engineering Research Centre, University of California: Berkeley, CA, USA, 2006. [Google Scholar]
  23. Samaan, M.; Mirmiran, A.; Shahawy, M. Model of concrete confined by fiber composites. J. Struct. Eng. 1998, 124, 1025–1031. [Google Scholar] [CrossRef]
  24. Liu, H.; He, M.; Luan, Y.; Guo, J.; Liu, L. A modified constitutive model for FRP confined concrete in circular sections and its implementation with OpenSees programming. J. Zhejiang Univ. Sci. A 2013, 14, 856–866. [Google Scholar] [CrossRef]
  25. Lam, L.; Teng, J.G. Design-oriented stress-strain model for FRP-confined concrete. Constr. Build. Mater. 2003, 17, 471–489. [Google Scholar] [CrossRef]
  26. Teng, J.G.; Jiang, T.; Lam, L.; Luo, Y.Z. Refinement of a design-oriented stress–strain model for FRP-confined concrete. J. Compos. Constr. 2009, 13, 269–278. [Google Scholar] [CrossRef]
  27. Teng, J.G.; Lam, L.; Lin, G.; Lu, J.Y.; Xiao, Q.G. Numerical simulation of FRP-jacketed RC columns subjected to cyclic and seismic loading. J. Compos. Constr. 2016, 20, 04015021. [Google Scholar] [CrossRef]
  28. Menegotto, M.; Pinto, P.E. Method of analysis for cyclically loaded reinforced concrete plane frames including changes in geometry and nonelastic behavior of elements under combined normal force and bending. In Proceedings of the IABSE Symposium on the Resistance and Ultimate Deformability of Structures Acted on by Well Defined Repeated Loads, Lisbon, Portugal, 13–14 September 1973; International Association for Bridge and Structural Engineering (IABSE): Zurich, Switzerland; pp. 15–22. [Google Scholar]
  29. Scott, B.D.; Park, R.; Priestley, M.J.N. Stress-strain behavior of concrete confined by overlapping hoops at low and high strain rates. ACI J. Proc. 1982, 79, 13–27. [Google Scholar] [CrossRef]
  30. Guo, Z.H.; Zhang, X.Q.; Zhang, D.C.; Wang, R.Q. Experimental investigation of the complete stress-strain curve of concrete. J. Build. Struct. 1982, 3, 1–12. (In Chinese) [Google Scholar]
  31. Yang, H.; Xu, H.; Wang, Z. Seismic responses analysis of RC frame based on fiber model considering bar slippage at column bottom section. J. Build. Struct. 2009, 30, 130–137. (In Chinese) [Google Scholar]
  32. Wang, D. Axial constitutive relationship and seismic performance of FRP confined column. Master’s Thesis, Harbin Institute of Technology, Harbin, China, 2008. [Google Scholar]
  33. Wu, Y.-F.; Liu, T.; Wang, L. Experimental investigation on seismic retrofitting of square RC columns by carbon FRP sheet confinement combined with transverse short glass FRP bars in bored holes. J. Compos. Constr. 2008, 12, 53–60. [Google Scholar] [CrossRef]
  34. Kunnath, S.K.; Reinhorn, A.M.; Park, Y.J. Analytical modeling of inelastic seismic response of R/C structures. J. Struct. Eng. 1990, 116, 996–1017. [Google Scholar] [CrossRef]
  35. Ozcan, O.; Binici, B.; Ozcebe, G. Improving seismic performance of deficient reinforced concrete columns using carbon fiber-reinforced polymers. Eng. Struct. 2008, 30, 1632–1646. [Google Scholar] [CrossRef]
  36. Cai, Z.; Wang, D.; Smith, S.T.; Wang, Z. Experimental investigation on the seismic performance of GFRP-wrapped thin-walled steel tube confined RC columns. Eng. Struct. 2016, 110, 269–280. [Google Scholar] [CrossRef]
  37. Dai, K.; Yu, X.; Jiang, Z.; Wang, D.; Qian, K. Hysteretic model for corroded reinforced concrete columns retrofitted with FRP. Constr. Build. Mater. 2023, 380, 131207. [Google Scholar] [CrossRef]
  38. Pessiki, S.; Harries, K.A.; Kestner, J.T.; Sause, R.; Ricles, J.M. Axial behavior of reinforced concrete columns confined with FRP jackets. J. Compos. Constr. 2001, 5, 237–245. [Google Scholar] [CrossRef]
  39. Wang, D.Y.; Wang, Z.Y.; Smith, S.T.; Yu, T. Size effect on axial stress-strain behavior of CFRP-confined square concrete columns. Constr. Build. Mater. 2016, 118, 116–126. [Google Scholar] [CrossRef]
  40. Du, Y.; Zhang, Y.; Chen, Z.; Dong, S.; Deng, X.; Qian, K. Seismic behavior of CFRP confined rectangular CFST columns using high-strength materials: Numerical analysis and restoring force model. Structures 2021, 34, 4237–4253. [Google Scholar] [CrossRef]
Figure 1. Steel02 material.
Buildings 15 01523 g001
Figure 2. Concrete01 material.
Buildings 15 01523 g002
Figure 3. FRP-confined concrete material.
Buildings 15 01523 g003
Figure 4. Schematic diagram of FEM- of FRP-retrofitted square RC columns.
Buildings 15 01523 g004
Figure 5. Comparison between simulation results and test results: (a) S4C0A45 [17]; (b) N4C3A45 [17]; (c) N4C4A45 [17]; (d) N3C2A45 [17]; (e) N3C3A45 [17]; (f) C6 [33].
Buildings 15 01523 g005
Figure 6. Influence of FRP wrapping lengths.
Buildings 15 01523 g006
Figure 7. Schematic trilinear load–drift skeleton curve of FRP-retrofitted square RC columns.
Buildings 15 01523 g007
Figure 8. Energy method to obtain yield point.
Buildings 15 01523 g008
Figure 9. Influence of axial compression ratio on the characteristic point: (a) yield force Py; (b) peak force Pc; (c) elastic stiffness K1; (d) elastoplastic stiffness K2; (e) descent stiffness K3.
Buildings 15 01523 g009
Figure 10. Influence of shear/span ratio on the characteristic point: (a) yield force Py; (b) peak force Pc; (c) elastic stiffness K1; (d) elastoplastic stiffness K2; (e) descent stiffness K3.
Buildings 15 01523 g010
Figure 11. Influence of steel reinforcement ratio on the characteristic point: (a) yield force Py; (b) peak force Pc; (c) elastic stiffness K1; (d) elastoplastic stiffness K2; (e) descent stiffness K3.
Buildings 15 01523 g011
Figure 12. Influence of the number of layers of FRP wrap on the characteristic point: (a) yield force Py; (b) peak force Pc; (c) elastic stiffness K1; (d) elastoplastic stiffness K2; (e) descent stiffness K3.
Buildings 15 01523 g012aBuildings 15 01523 g012b
Figure 13. Influence of concrete strength on the characteristic point: (a) yield force Py; (b) peak force Pc; (c) elastic stiffness K1; (d) elastoplastic stiffness K2; (e) descent stiffness K3.
Buildings 15 01523 g013
Figure 14. Comparison between predicted and simulated characteristic points: (a) yield force Py; (b) peak force Pc; (c) elastic stiffness K1; (d) elastoplastic stiffness K2; (e) descent stiffness K3.
Buildings 15 01523 g014aBuildings 15 01523 g014b
Figure 15. Schematic unloading/reloading curves of FRP-retrofitted square RC columns.
Buildings 15 01523 g015
Figure 16. Comparison of predicted results of the hysteretic model with test results for columns: (a) N4C3A45 [17]; (b) N4C4A45 [17]; (c) N3C3A45 [17]; (d) N3C2A45 [17]; (e) C6 [33].
Buildings 15 01523 g016aBuildings 15 01523 g016b
Table 1. Material parameters of Steel02.
ParametersStrain-Hardening Ratio (b)R0CR1CR2
Parameter values0.0085200.9250.15
Table 2. Material parameters of stirrup-confined concrete.
ParametersEquation
Peak point stress (fcc)fcc = fc0 (1 + 0.5λt)
Peak point strain (εcc)εcc = εc0 (1 + 2.5λt)
Ultimate point stress (fcu)fcu = 0.8 fcc
Ultimate point stress (εcu)εcu = 3.5 εcc
Note: fc0 is the peak point stress of plain concrete; εc0 is the peak point strain of plain concrete.
Table 3. Material parameters of FRP-confined concrete.
ParametersEquation
Peak point stress (fcc)fcc = fc0(1 + 0.35λf + 0.5λh + 0.85λl)
Peak point strain (εcc)εcc = εc0(1 + 2.0λf + 2.5λh)
Ultimate point stress (fcu) f cu = f c 0 0.2 + 0.59 f ls f c 0 0.2 + 3.47 f lf f c 0 0.64
Ultimate point stress (εcu) ε cu = ε c 0 2 + 5.06 f ls f c 0 0.03 + 73.31 f lf f c 0 1.07
Table 4. Comparison of yield and peak load between experimental and numerical results.
Specimen LabelsPy,exp (kN)Pc,exp (kN)Py (kN)Pc (kN)Py/Py,expPc/Pc,exp
S4C0A45 [32]292.4346.9263.9307.650.900.89
N4C3A45 [32]296.7358.1296.4344.11.000.96
N4C4A45 [32]333.8383.9305.1353.950.910.92
N3C2A45 [32]169.05201.25188.85216.31.121.07
N3C3A45 [32]172202.1197.1225.251.151.11
C6 [33]5261.559.167.41.141.10
Note: The specimen labels are consistent with those used in references [32,33]. Py,exp, and Pc,exp are the experimental yield load and peak load, respectively; Py and Pc are the simulated yield load and peak load, respectively.
Table 5. Parametric analysis conditions.
ParametersParameter Variation
Section size B (mm)400, 500, 600, 700, 800
Axial compression ratio n0.25, 0.3, 0.35, 0.4, 0.45
Shear/span ratio λ3.0, 3.5, 4.0
Layers of FRP wrap L3, 4, 5, 6
Concrete strength (MPa)20, 25, 30, 35, 40
Diameter of longitudinal bar (mm)20, 23, 26, 29
Table 6. Regression coefficients.
Parametersa0a1a2a3a4a5a6a7a8Comment
Py−0.050.170.532.544.721.51----
Pc−0.170.552.308.5017.506.48----
K10.270.132.500.160.13−0.240.06−0.09--
K20.10−1.002.500.040.28−0.110.07−0.32-n ≤ 0.35
0.15−0.100.450.320.53−0.570.39−1.17-n > 0.35
K3−0.5032.37−6.621.20−1.53−0.0510.95−33.59−5.46-
Table 7. Comparison of yield and peak load between experimental and calculated results.
Specimen LabelsPy,exp (kN)Pc,exp (kN)Py (kN)Pc (kN)Py/Py,expPc/Pc,exp
N4C3A45 [32]296.7358.1318.1348.81.070.97
N4C4A45 [32]333.8383.9322.1354.20.960.92
N3C3A45 [32]172202.1194.4213.91.131.06
N3C2A45 [32]169.05201.25190.6208.91.131.04
C6 [33]5261.547.8855.850.920.91
Note: The specimen labels are consistent with those used in references [32,33]. Py,exp, and Pc,exp are the experimental yield load and peak load, respectively; Py and Pc are the simulated yield load and peak load, respectively.
Disclaimer/Publisher’s Note: The statements, opinions and data contained in all publications are solely those of the individual author(s) and contributor(s) and not of MDPI and/or the editor(s). MDPI and/or the editor(s) disclaim responsibility for any injury to people or property resulting from any ideas, methods, instructions or products referred to in the content.

