Article

Safety Risk Assessment of Jacking Renovation Construction for Aging Bridges Based on DBN and Fuzzy Set Theory

School of Civil Engineering, Shandong Jiaotong University, Jinan 250357, China
*
Author to whom correspondence should be addressed.
Buildings 2025, 15(9), 1493; https://doi.org/10.3390/buildings15091493
Submission received: 27 March 2025 / Revised: 21 April 2025 / Accepted: 27 April 2025 / Published: 28 April 2025
(This article belongs to the Special Issue Structural Safety Evaluation and Health Monitoring)

Abstract

The jacking renovation construction of aging bridges faces significant safety risks due to the complexity and uncertainty of their structures. Addressing the limitations of traditional risk assessment methods in handling dynamic changes and data scarcity, this study proposes a safety risk assessment approach based on dynamic Bayesian networks (DBN) and fuzzy set theory (FST). By using DBN to model the temporal evolution of risks, combined with the Leaky Noisy-OR Gate extension model and FST to quantify expert knowledge, this method overcomes the constraints of insufficient data. Taking an elevated bridge jacking renovation project in Qingdao, China, as a case study, a risk indicator system was established, incorporating factors such as personnel, equipment, and the environment. The results show that risks are higher in the early stages of construction and stabilize later on, with poor foundation conditions, instability of the substructure, and improper operations identified as key risk sources requiring focused control. Through forward reasoning, the study predicts risk trends, while backward reasoning identifies sensitive factors, providing a scientific basis for construction safety management.

1. Introduction

Since the end of World War II, major countries worldwide have continuously increased investments in infrastructure, resulting in a sharp rise in bridge construction. However, over time, these bridges have progressively entered an aging phase. According to a 2023 report by the American Road and Transportation Builders Association (ARTBA), approximately 220,000 bridges exist in the United States, of which about 6.9% (around 42,400) are classified as structurally deficient [1]. Globally, the maintenance and retrofitting of aging bridges have emerged as a critical challenge. Statistical data indicate that China has over 1 million bridges, with 40% having been in service for over 20 years, 30% categorized as technically deficient (Grades III and IV), and 15% (approximately 100,000) identified as hazardous. Consequently, the maintenance and retrofitting of aging bridges urgently require efficient and cost-effective solutions. Bridge jacking renovation technology, an innovative construction approach, has become a vital method to address this global challenge due to its advantages in minimizing traffic disruption, reducing costs, and preserving historical value.
Bridge jacking renovation construction is a technique that employs hydraulic equipment to lift a bridge wholly or partially, enabling the replacement or reinforcement of foundations, bearings, or other critical components. This method facilitates maintenance and retrofitting without demolishing the main bridge structure, thereby substantially reducing traffic impact. Furthermore, compared to traditional demolition and reconstruction methods, jacking renovation markedly reduces project costs. A case in point is the retrofitting of Shizilin Bridge in Tianjin, China, where the jacking approach was employed, incurring a total cost of 15.323 million RMB—considerably less than the estimated 41.965 million RMB for conventional retrofitting methods.
However, while bridge jacking renovation technology offers significant advantages, it also introduces additional risks that warrant special attention. First, during the jacking process, the constraints between the superstructure and substructure are released, rendering the superstructure in an unstable suspended state, prone to deformation or overturning. To prevent instability, the temporary support system must exhibit sufficient stability and load-bearing capacity. Second, the jacking process relies on hydraulic equipment to support the entire weight of the superstructure, necessitating precise control of lifting height and speed at each point to avoid stress concentration, which could cause structural cracking or permanent deformation under heavy loads. Third, bridges undergoing retrofitting are typically older structures with prolonged service lives, where material fatigue, corrosion, or other latent damage may exist. Unidentified defects could be exacerbated during jacking, resulting in irreversible structural harm. Fourth, as critical components of transportation networks, bridge retrofitting projects often entail traffic disruptions, impacting social operations, economic activities, and emergency response efficiency. Consequently, stringent project timelines impose additional challenges to construction safety. With the increasing application of jacking technology, the structural complexity and scale of retrofitted bridges continue to grow, underscoring the critical need for risk prediction and mitigation during construction.
Extensive research has been conducted by numerous scholars on risk analysis for traditional bridge construction. Henley and Kumamoto [2] introduced the Fault Tree Analysis (FTA) method, establishing a foundational theoretical framework for quantifying bridge construction risks, with their probabilistic risk assessment model remaining a cornerstone in engineering risk management. Saaty [3] developed the Analytic Hierarchy Process (AHP) to enable multi-criteria risk prioritization, which Fang et al. [4] applied to the cable force adjustment process in cable-stayed bridges, confirming its effectiveness in identifying systemic risks arising from construction process deviations. To address uncertainty in risk assessment, Zadeh’s fuzzy set theory [5] was extended by Lee [6] and Chen [7] to caisson construction. For dynamic risk evolution, Pearl’s [8] Bayesian network (BN) was integrated with Monte Carlo simulation by Zhang et al. [9], resulting in a real-time risk warning system for bridge incremental launching construction.
Building on traditional risk analysis tools, machine learning algorithms have markedly enhanced the intelligence of risk prediction. Breiman’s [10] random forest algorithm optimized evaluation metrics through feature importance analysis. Soleimani [11] employed statistical methods such as covariance analysis to evaluate the impact of common bridge parameters, including abutment types, on critical engineering demand parameters like beam displacement. Furthermore, Soleimani innovatively introduced a random forest ensemble learning algorithm to quantify the importance ranking of modeling parameters in predicting seismic demands. In the field of deep learning architectures, the pioneering work of LeCun [12] in convolutional neural networks (CNN) has provided significant inspiration for engineering applications. Zhao et al. [13] utilized CNN to develop a real-time early safety warning system for personnel intrusion behavior on construction sites, demonstrating the application of CNN in construction safety management. Sun et al. [14] developed a Hierarchical Convolutional Neural Network (HCNN) model, utilizing comprehensive load as a predictor for support displacement forecasting. Experimental results demonstrate that this method achieves a prediction accuracy exceeding 95.6%, surpassing traditional CNN, encoder–decoder, and U-Net models in both accuracy and computational efficiency. For time-series risk prediction, the LSTM network designed by Hochreiter and Schmidhuber [15] was employed by Guo et al. [16] to predict deformation safety risks in super-large and ultra-deep foundation pits, illustrating the effectiveness of deep learning in construction risk prediction. Xin et al. [17] proposed a bridge monitoring data repair method based on the synergistic integration of Time-Varying Filter Empirical Mode Decomposition (TVFEMD), Encoder–Decoder (ED), and Long Short-Term Memory (LSTM) neural networks. This hybrid approach transforms data repair problems into a series of predictive tasks, achieving an overall performance improvement of 33.90% compared to the baseline LSTM, demonstrating significant potential for practical engineering applications. Yue et al. [18] developed a digital regression model for the deflection of cable-stayed bridge girders under temperature field effects, utilizing an LSTM network. This model, driven by both mechanical principles and deep learning, achieves an average error of only 1.4% and a maximum error not exceeding 6%. Its output accuracy and stability significantly outperform traditional linear regression models, providing a more precise analytical tool for monitoring bridge temperature-induced deformations. Liao et al. [19] enhanced LSTM for learning dynamic response characteristics from limited training data and predicting bridge responses under unknown seismic actions. The study specifically designed an attention mechanism to improve the selection of information-rich components in time-series data, thereby enhancing learning efficiency with small-sample datasets.
With the deepening application of Building Information Modeling (BIM) technology, several scholars have explored the digital transformation of risk assessment [20,21]. Eastman et al. [22] in BIM Handbook systematically outlined the integration pathway of three-dimensional models with safety analysis. Liu et al. [23] demonstrated that the combination of 4D-BIM and finite element analysis enhances the visualization accuracy of construction risks for long-span bridges by 34%. Zou et al. [24] established a BIM-based risk information management system framework and developed a supporting prototype tool. Simulation validation using a steel bridge project case study showed that traditional risk management techniques (e.g., RBS) can be deeply integrated with BIM, optimizing the entire process from risk identification and visualization to information management. This integration improved risk identification efficiency by approximately 40% and enabled the detection of potential risks on critical paths 15% earlier through 4D simulation. Civera et al. [25,26,27,28,29] addressed the mechanical performance uncertainties in aging masonry bridges, often caused by local irregularities and internal structural heterogeneity. They proposed the Fast Relaxed Vector Fitting approach, which enables rapid, efficient, and reliable identification of bridge damage based on vibration test results of masonry structures.
Overall, current research in bridge construction risk management spans multiple dimensions, including the development of early warning models, the exploration of innovative risk identification and assessment techniques, and risk analysis methods integrating cost and schedule considerations. These findings offer valuable guidance for practical applications. However, existing studies have yet to adequately address the uncertainty and dynamic evolution of risk factors. Traditional safety risk analysis techniques in construction, such as reliability measure theory [30,31], structural equation modeling [32,33], grey clustering [34,35], and natural language [36,37], exhibit limited effectiveness in handling uncertainty. Moreover, in real-world operations, risk factors often interact in complex ways, yet current methods fall short in analyzing the interdependencies among these factors [38].
Given the current incomplete understanding of risks associated with bridge jacking renovation construction, this study applies dynamic Bayesian network (DBN) theory to the dynamic risk analysis of bridge jacking construction.
In the risk assessment of bridge jacking construction, the integration of DBN with fuzzy set theory demonstrates distinct advantages over other risk assessment methods, such as LSTM networks and hybrid machine learning approaches, particularly in scenarios characterized by data scarcity and dynamic uncertainty. Bridge jacking construction involves multiple risk factors (e.g., ground conditions, operational behaviors, and unforeseen events), with limited data and risks evolving throughout the construction process. DBN models the dynamic propagation of risks through explicit causal structures and temporal dependencies, while fuzzy set theory quantifies expert knowledge into probability distributions, effectively addressing data deficiencies and enhancing the handling of uncertainty. Its graphical representation intuitively reveals risk pathways, facilitating the identification of critical factors and guiding construction management decisions. In contrast, LSTM and hybrid machine learning methods rely heavily on large training datasets, and their “black-box” nature limits causal interpretability. Credibility measure theory, while capable of addressing uncertainty, lacks robustness in modeling dynamic evolution. Structural Equation Modeling (SEM) excels in static causal analysis but struggles to capture temporal changes during construction. Grey clustering is suitable for small-sample classification but underperforms in modeling complex causal relationships and dynamic predictions. Furthermore, the computational efficiency of DBN combined with fuzzy set theory makes it well-suited for real-time risk assessment. Therefore, this study adopts DBN integrated with fuzzy set theory, providing a more interpretable, flexible, and practical modeling framework for the complex risk scenarios in bridge jacking construction.
Using a bridge jacking project in Qingdao, China, as a case study, the bidirectional inference capabilities of DBN, integrated with expert prior knowledge and fuzzy set theory, are employed to systematically analyze the temporal evolution and trends of safety risks. This approach identifies critical risk points during construction, enabling rapid diagnosis and prediction of potential accidents, thereby enhancing the precision and effectiveness of risk analysis while providing a scientific foundation for safety risk management in bridge jacking construction.

2. Risk Analysis Methods

2.1. Bayesian Network and Dynamic Bayesian Network

A Bayesian network (BN) is a probabilistic graphical model-based inference tool that employs a Directed Acyclic Graph (DAG) to represent causal dependencies among variables. Its mathematical foundation lies in decomposing high-dimensional joint probability distributions into a product of local conditional probability distributions:
P ( X 1 , X 2 , , X n ) = i = 1 n P ( X i | P a ( X i ) )
Pa(Xi) denotes the set of parent nodes of node Xi, with each node’s conditional probability distribution explicitly defined via a Conditional Probability Table (CPT). The CPT quantifies the influence of parent node states on child nodes in tabular form, converting high-dimensional probability computations into local operations, thereby substantially reducing computational complexity. BN excels in uncertainty modeling, causal interpretability, and computational efficiency. By integrating prior knowledge (e.g., expert experience) with observational data (e.g., sensor information) through the CPT, it enables probabilistic inference under incomplete data conditions. The DAG intuitively depicts causal relationships among variables, facilitating bidirectional inference (prediction and diagnosis). However, as the number of nodes in the network increases, the storage requirements of the CPT grow exponentially, necessitating parameter compression techniques such as Noisy-OR gates or decision trees. Moreover, BN cannot directly model temporal dynamics, requiring extension into a dynamic Bayesian network (DBN).
A dynamic Bayesian network (DBN) extends BN by incorporating a temporal dimension, with its core centered on constructing a state transition model across time slices. Assuming time slices t = 1, 2, …, T, the joint probability distribution of a DBN is expressed as
P ( X 1 , X 2 , , X n ) = i = 1 n P ( X i | P a ( X i ) )
where P(XtXt−1) represents the state transition probability, capturing the temporal evolution of variables. DBN typically employs a two-layer structure comprising intra-slice and inter-slice networks: the intra-slice network delineates static dependencies among variables within a single time slice (e.g., the relationship between load and stress on a bridge at a given moment), while the inter-slice network connects identical variables across adjacent time slices via directed edges, modeling temporal dynamics (e.g., changes in concrete strength over curing time). DBN effectively captures temporal dependencies in complex systems, utilizing the forward-backward algorithm with dynamic programming to eliminate redundant computations, reducing time complexity from O(T2) to O(T). These foundational equations and algorithms provide the theoretical basis for DBN, enabling efficient processing and inference of time-varying data.
Compared to conventional new bridge construction, risk analysis for bridge jacking renovation construction encounters numerous challenges, rendering traditional analytical tools less effective. First, bridge structural forms (e.g., suspension bridges, arch bridges, steel truss bridges) exhibit significant heterogeneity, and jacking renovation is typically applied to existing bridges, where construction conditions vary due to design specifics, service life, and environmental factors. This heterogeneity hampers traditional random statistical experiments in determining state transition probabilities through repeated trials. Second, the application of jacking techniques in bridge retrofitting remains limited, resulting in incomplete or absent data (e.g., displacement monitoring, stress variations, equipment failure records), compounded by difficulties in data sharing due to regulatory or other constraints. Nevertheless, DBN can learn latent patterns from limited samples without relying on extensive repeated experimental data. By modeling historical cases and expert experience, DBN uncovers deep correlations between bridge structural characteristics and risks, making it an ideal tool for risk analysis in bridge jacking renovation construction.

2.2. Leaky Noisy-OR Gate Extension Model and Fuzzy Set Theory

The Leaky Noisy-OR Gate is an extension of the classic Noisy-OR Gate model, designed to characterize the causal dependencies between multiple binary cause variables (X1, X2, …, Xn) and a single binary outcome variable (Y). The classic Noisy-OR model assumes that Y = 1 is triggered independently by known causes, with its probability expressed as
P ( Y = 1 | X 1 , X 2 , , X n ) = 1 i : X i = 1 ( 1 p i )
Here, pi denotes the probability that each cause variable triggers Y = 1. However, in real-world scenarios, the outcome may be influenced by unmodeled factors. To address this, the Leaky Noisy-OR model introduces a “leakage” probability p0, representing the background probability that Y = 1 even when all Xi = 0. The extended probability is expressed as
P ( Y = 1 | X 1 , X 2 , , X n ) = 1 ( 1 p 0 ) i : X i = 1 ( 1 p i )
In sparse data scenarios, DBN leverage generative learning addresses data deficiencies, yet it cannot directly account for the influence of unmodeled variables. The Leaky Noisy-OR Gate model, by introducing the leakage probability p0, equips DBN with the capability to model unknown factors. When integrated with the Leaky Noisy-OR Gate, DBN not only relies on training data but also generalizes to unseen scenarios via the leakage term. This capability is particularly critical in data-scarce applications such as bridge jacking renovation, effectively mitigating overfitting issues arising from insufficient data.
Unlike traditional set theory, which employs binary membership values (0 or 1), fuzzy set theory (FST) permits elements to partially belong to a set with continuous membership degrees within the interval [0, 1]. For instance, the variable “high risk” might have a membership degree of 0.7, indicating partial alignment with the “high risk” concept. DBN relies on historical data to estimate conditional probabilities; however, in data-sparse conditions (e.g., limited cases of jacking construction), these parameters are challenging to determine precisely. FST enables the definition of fuzzy rules based on expert knowledge (e.g., “if displacement is large and wind speed is high, then risk is high”), generating pseudo-data or prior distributions through fuzzy membership degrees and inference to address data gaps. These outputs can serve as initial parameters or training samples for DBN, thereby enhancing model robustness. FST quantifies fuzzy concepts using membership functions (e.g., triangular, trapezoidal) and employs fuzzy logic for reasoning. Commonly used membership functions include triangular, trapezoidal, bell-shaped, S-shaped, and Z-shaped functions, each suited to different scenarios based on their shapes and parameter properties. Among these, the Gaussian membership function is expressed as
μ ( x ) = e ( x c ) 2 2 σ 2
Here, c represents the center point of the Gaussian membership function, while σ governs the width of the curve. The Gaussian membership function exhibits smooth and symmetric curve properties, making it well suited for modeling fuzzy concepts characterized by natural distributions or continuous variations. Its advantage lies in achieving high computational accuracy with fewer parameters, yielding results that closely align with real-world conditions. For instance, in equipment performance assessment, the “normal operation” state can be modeled using a Gaussian function, with the center point c set to an optimal value (e.g., 50) and σ reflecting the range of performance fluctuations.

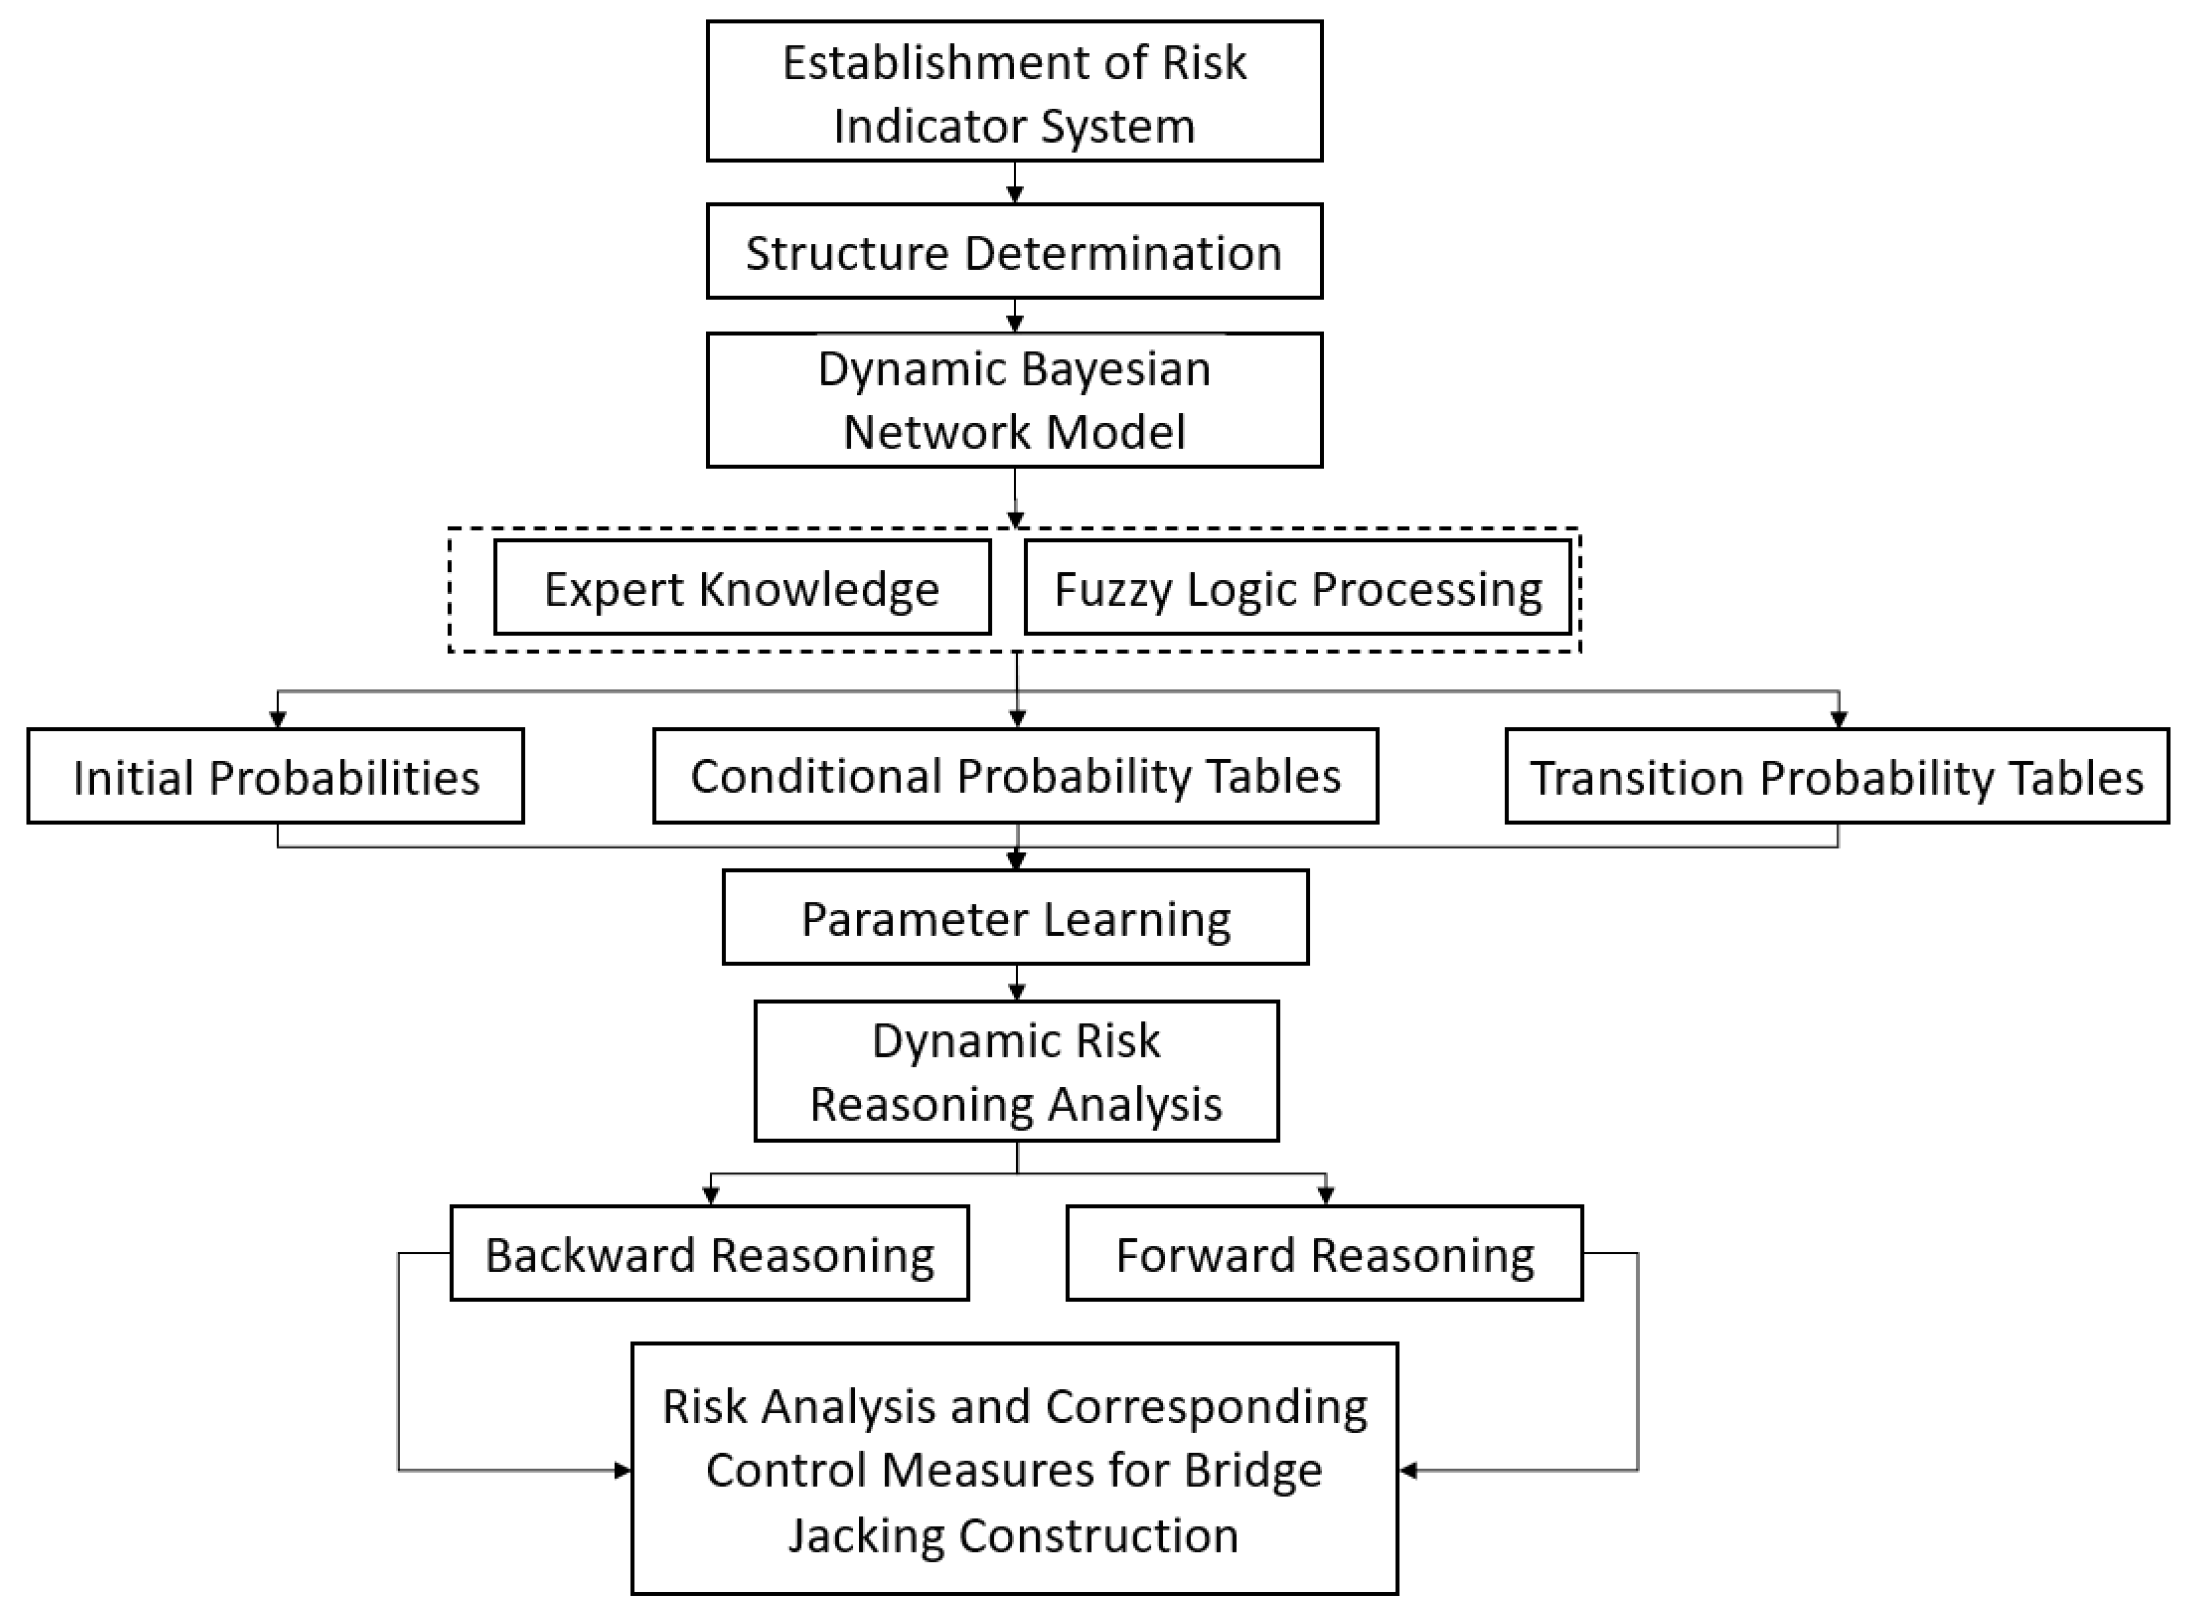
3. Safety Risk Analysis of Bridge Jacking Construction Based on DBN

For the jacking renovation construction of existing bridges, the DBN model serves as a tool for risk analysis, with the primary steps outlined in Figure 1.

3.1. Establishment of the Risk Indicator System

Currently, construction techniques for new bridges are relatively mature, with a clear understanding of potential risks and well-established countermeasures. However, bridge jacking renovation construction exhibits distinct risk characteristics compared to conventional bridge construction, rendering the direct application of traditional risk analysis findings inappropriate. Jacking renovation targets existing bridges, where structures may exhibit high initial state uncertainty due to aging or latent defects. Such construction typically occurs on active transportation routes, significantly influenced by surrounding traffic flow and environmental conditions, with limited time windows for execution. Furthermore, the jacking process involves lifting the bridge wholly or partially, necessitating precise control of synchronicity and stability, and imposing stringent demands on equipment performance and operational accuracy.
Bridge jacking renovation construction confronts multiple interrelated risks, with its complexity and uncertainty posing significant challenges to safety risk assessment. During the jacking process, operational errors, equipment failures, environmental changes, and ambiguous factors (e.g., sudden geological anomalies) may serve as primary triggers for accidents. These risks not only interact but may also be amplified by the unique conditions of existing bridges. To ensure construction safety, comprehensive risk management and rigorous control measures are imperative. This study adheres to principles of scientific rigor and rationality, referencing standards such as the AASHTO LRFD Bridge Construction Specifications [39], OSHA 29 CFR 1926 [40], Safety Inspection Standards for Construction Projects [41], and Technical Specifications for Bridge Jacking and Displacement Renovation [42]. By integrating expert opinions and on-site conditions, potential risk sources are systematically classified. Accident causation factors are summarized across five dimensions—personnel, equipment, management, environment, and unpredictable factors (Table 1)—and a comprehensive risk indicator system is developed based on accident causation theory (Table 2), providing a scientific foundation for risk prevention and control.
It is noteworthy that this study also employed the Leaky Noisy-OR model to account for potentially omitted risk factors. In the Leaky Noisy-OR model, the “leakage” parameter (p0) represents the background risk, indicating the probability of the target event (child node) occurring even when all known causes (parent nodes) are absent. This background probability reflects the influence of other latent factors not explicitly considered in the model. Typically, p0 is a small positive value, ensuring that the child node retains a minimal probability of occurrence even when all parent nodes are zero, thereby enhancing the model’s robustness.

3.2. DBN Network Model Construction

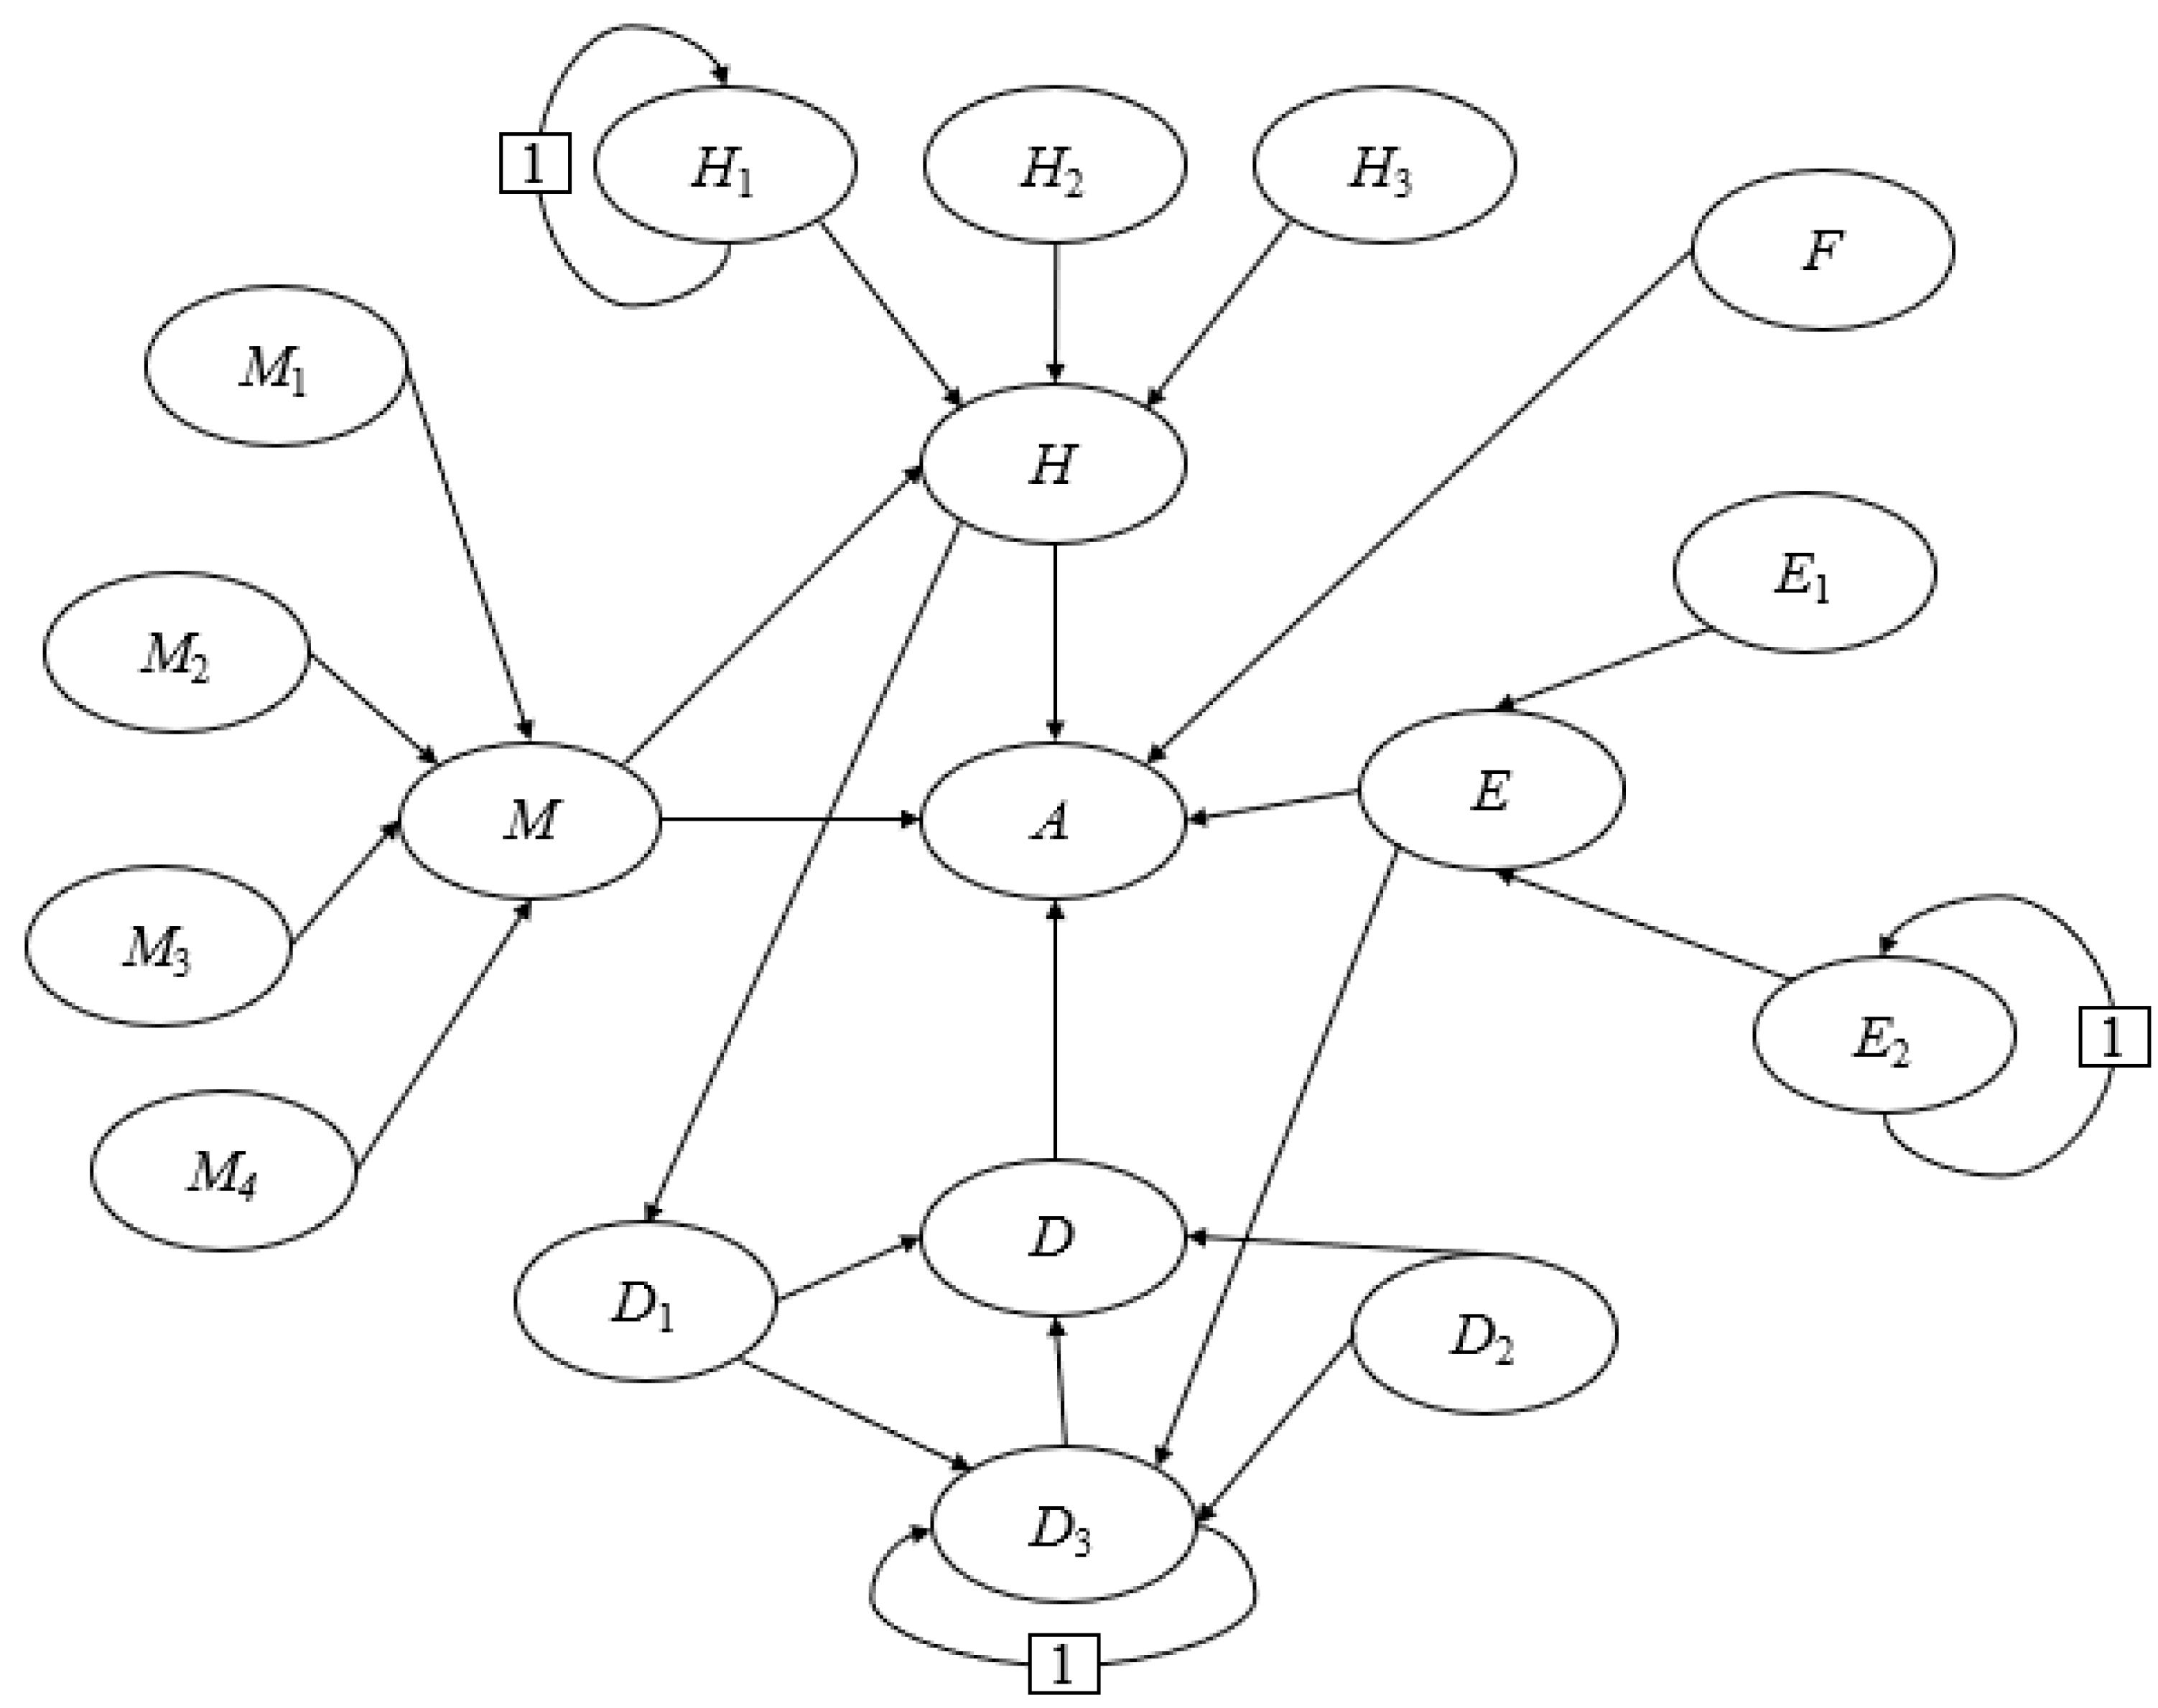
3.2.1. Network Structure Design

The modeling process for a DBN parallels that of a traditional BN, encompassing two core steps: network structure design and parameter assignment. The network structure design phase involves defining the causal dependencies among variables and their temporal evolution patterns, specifically by identifying key causal variables and establishing dynamic connections across time steps. The parameter assignment phase focuses on quantifying the conditional probability distributions of these dependencies, typically achieved through data-driven learning methods or expert judgment.
This study employs GeNIe Academic 4.1 software to construct a DBN model for assessing risks in bridge jacking renovation construction. GeNIe Academic is a specialized tool developed for the design, analysis, and inference of Bayesian networks and influence diagrams, offering efficient capabilities for network construction, data processing, probabilistic inference, and sensitivity analysis. It enables users to intuitively develop complex models and handle large-scale data, facilitating precise prediction and analysis.
Considering that risk factors exhibit complex interdependencies rather than complete independence, this study employs the DEMATEL (Decision Making Trial and Evaluation Laboratory) method to quantify the causal relationships among safety risk factors in bridge jacking construction identified in Table 2. The DEMATEL method is capable of dissecting dependencies and influence strengths among elements within complex systems. Through this approach, the study effectively identifies and elucidates the interactive effects among risk factors, enhancing the scientific rigor and transparency of decision-making while strengthening the systematic and proactive nature of risk management. The DBN structure designed based on DEMATEL analysis is presented in Figure 2.

3.2.2. Parameter Learning

Given the frequent difficulty in obtaining complete accident data for bridge jacking construction, this study employs an expert scoring method integrated with fuzzy theory to estimate the probabilities of risk indicators. This approach reduces reliance on historical data while incorporating expert experience to enhance analytical precision. The complexity and uncertainty of risk events, combined with data scarcity and the subjectivity of expert judgment, pose challenges to precise probability prediction. To address this, the study adopts a seven-level linguistic variable scale (e.g., “Very High unlikely”, “Moderately Low”) in place of specific probability values, quantified using a Gaussian membership function. Defined by mean (μ) and standard deviation (σ), the Gaussian membership function provides a smooth probability distribution, offering superior mathematical robustness and natural transition properties compared to triangular fuzzy numbers. The quantified values for each linguistic variable are presented in Table 3, with “High” defined as μ = 0.8, σ = 0.1, and “Moderately Low” as μ = 0.3, σ = 0.15. This method improves the transparency and scientific rigor of risk assessment, effectively meeting decision-making needs in data-scarce scenarios.
In the risk analysis of bridge jacking construction, this study engaged seven civil engineering experts to conduct a qualitative evaluation of risk indicators. To ensure the scientific rigor and rationality of the assessment, and accounting for variations in the experts’ professional backgrounds and experience, different weights were assigned to each expert’s scores based on factors such as academic qualifications, professional experience, and domain relevance, rather than assuming equal importance, as shown in Table 4. This approach more accurately reflects their contributions to risk judgment.
w i = j = 1 m a ij / m i = 1 n j = 1 m a ij / m
Here, aij denotes the score given by the i-th expert to the j-th indicator, m represents the total number of risk indicators, n signifies the number of experts, and wi indicates the normalized weight of the i-th expert.
The information for the seven experts involved in this project is presented in Table 5 below. The initial weights were calculated based on the mean scores of six evaluation indicators for each expert, using the equation
s i = j = 1 m a ij m
where aij represents the score of the i-th expert on the j-th indicator, and (m = 6) denotes the number of indicators. To comprehensively reflect the relative competence of each expert across multiple dimensions, the initial weights were derived from the average indicator scores. This mean-based calculation balances the contribution of each indicator, preventing any single dimension from dominating and ensuring the comprehensiveness of the weights.
For example, the initial weight for Expert 1 (s1) is calculated as
s1 = (0.4 + 0.5 + 0.3 + 0.3 + 0.3 + 0.3)/6 = 0.350
The initial weights for the remaining experts si are listed in Table 5. The sum of the initial weights for all experts is
S = i = 1 n s i = 0.350 + 0.267 + 0.383 + 0.233 + 0.250 + 0.250 + 0.150 = 1.883
Normalization transforms the initial weights into a probability distribution, ensuring that the sum of the relative importance of all experts equals 1. This standardization facilitates weighted calculations in subsequent fuzzy quantification and defuzzification processes, ensuring interpretability and mathematical consistency of the results. Additionally, normalization eliminates the impact of differences in scoring scales, making the weights applicable to expert groups of varying sizes. The normalization equation is
w i = s i S
where wi is the normalized weight of the i-th expert, and n is the number of experts (here, n = 7). For Expert 1, the calculation is as follows:
w i = 0.35 / 1.883 0.186
The final weights are summarized in Table 5. The results indicate that Expert 3 has the highest weight (0.203), attributed to their outstanding performance in years of experience, number of projects, and influence. Conversely, Expert 7 has the lowest weight (0.080), reflecting their relatively limited experience and relevance. These calculated results quantify the influence and competence of different experts, providing data support for subsequent analyses.
Subsequently, this study employs a Gaussian membership function to perform fuzzy quantification and defuzzification of expert opinions, converting linguistic variables into single real-valued numbers. The defuzzification process involves weighted aggregation of expert scores, with the composite mean calculated as the final risk probability value.
μ w = i = 1 n w i μ i
σ w = i = 1 n w i σ i
Here, μi and σi denote the fuzzy parameters of the i-th expert’s score, and μw represents the final defuzzied value, corresponding to the risk probability.
This approach effectively integrates multi-source expert knowledge, making it suitable for risk assessment in data-scarce scenarios and providing reliable input data for subsequent parameter learning in a DBN. Building on the initial data derived from the expert scoring method, this study further determines the Conditional Probability Tables (CPTs) for other nodes in the DBN model. The CPT serves as a critical component in the DBN, representing conditional dependencies among nodes and detailing how each node is influenced by the states of the others. Given the complexity and uncertainty inherent in real-world construction scenarios, this study additionally incorporates the Leaky Noisy-OR Gate extension model to refine and optimize the computation of the CPTs.

4. Application of the DBN Model in Bridge Jacking Construction

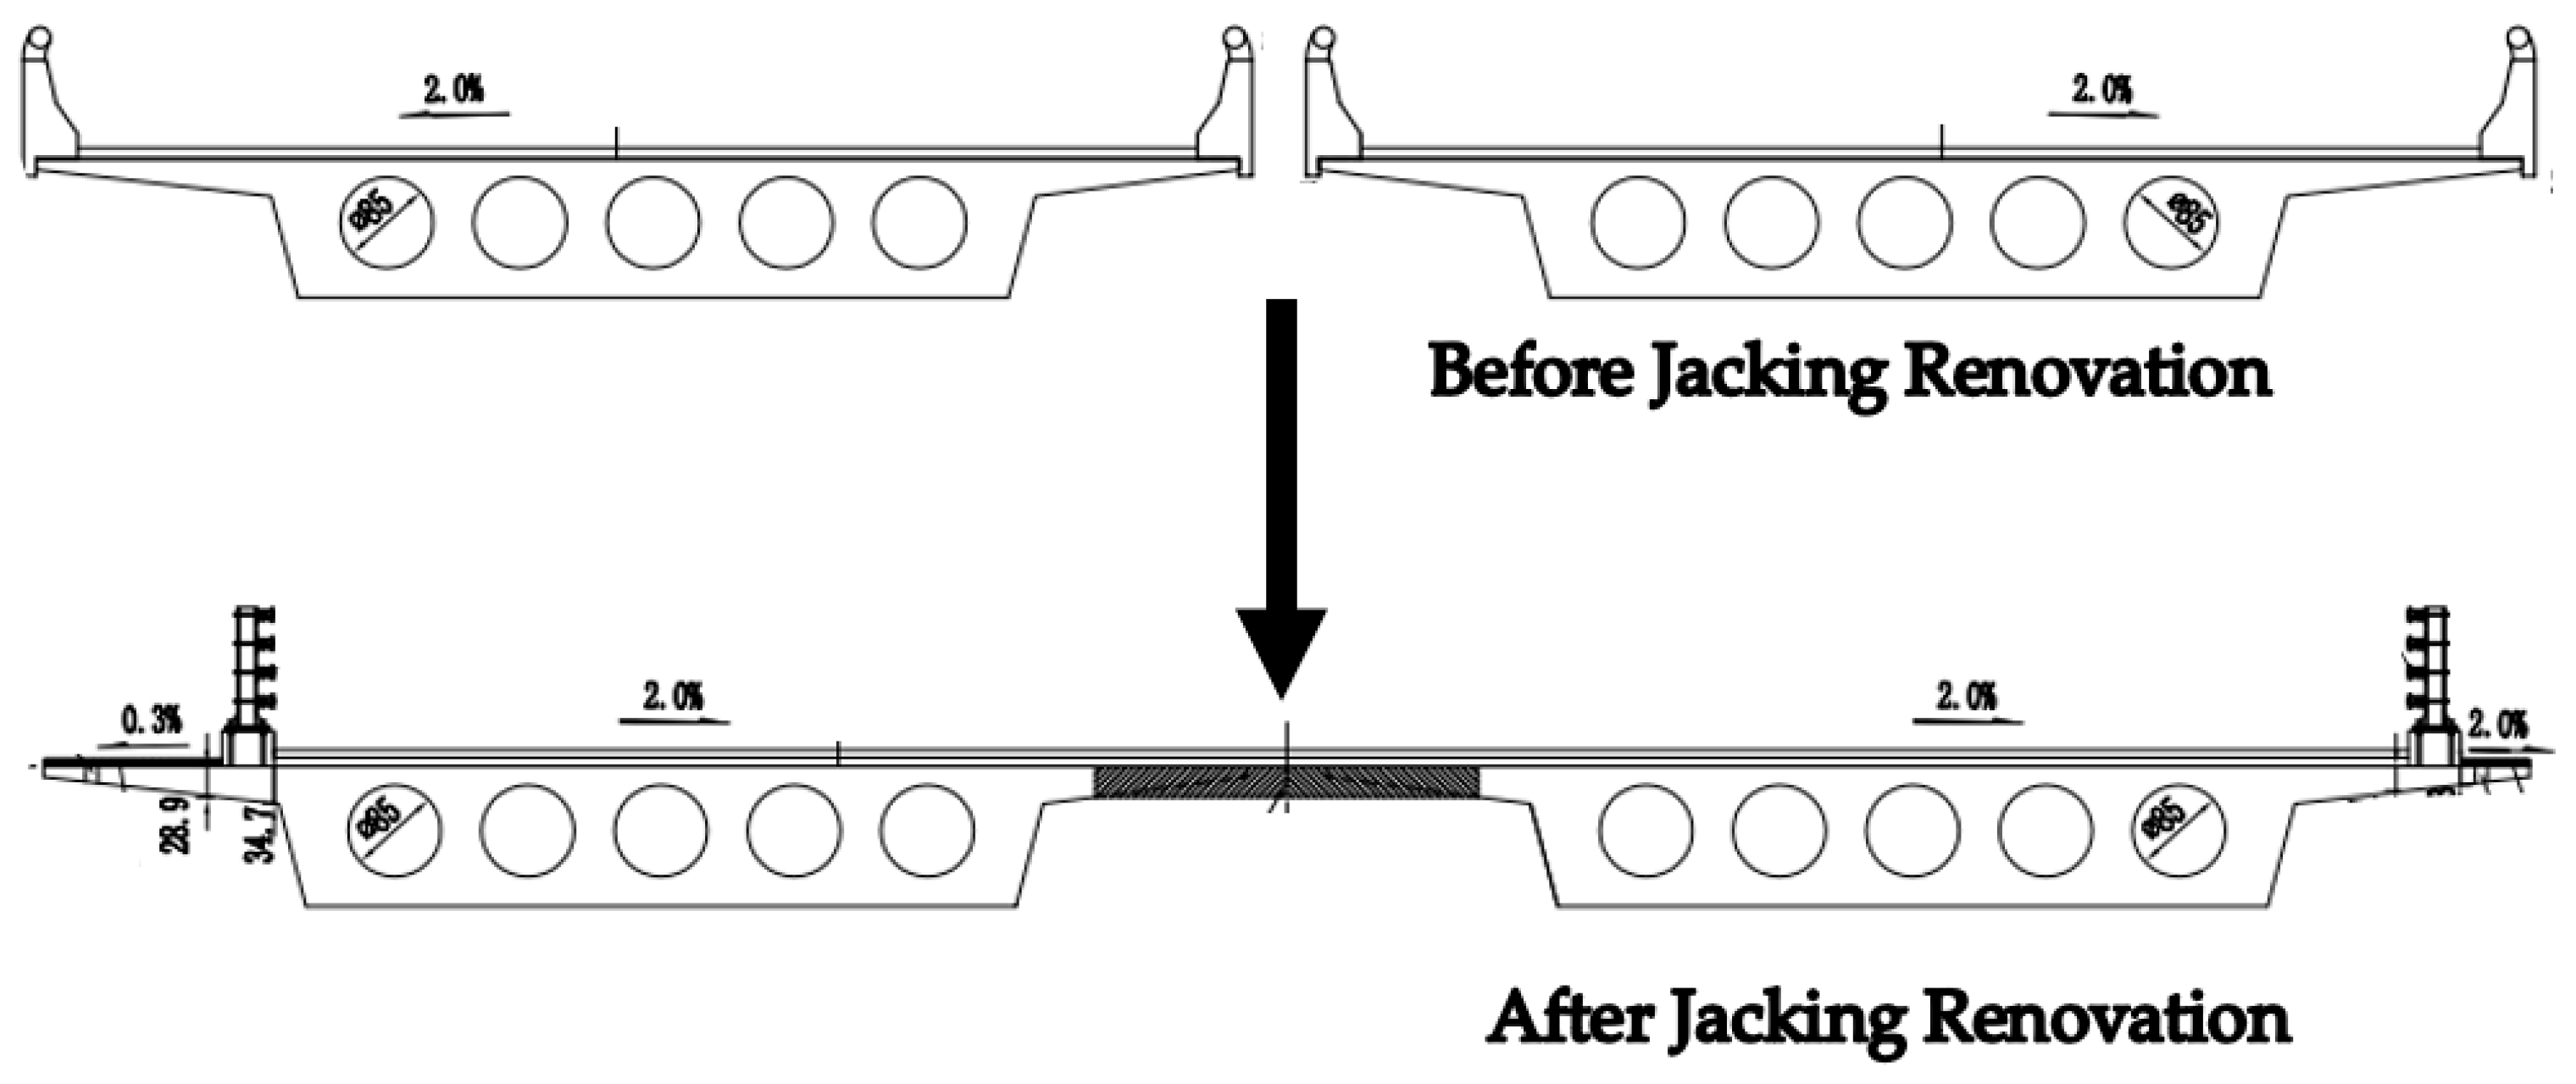
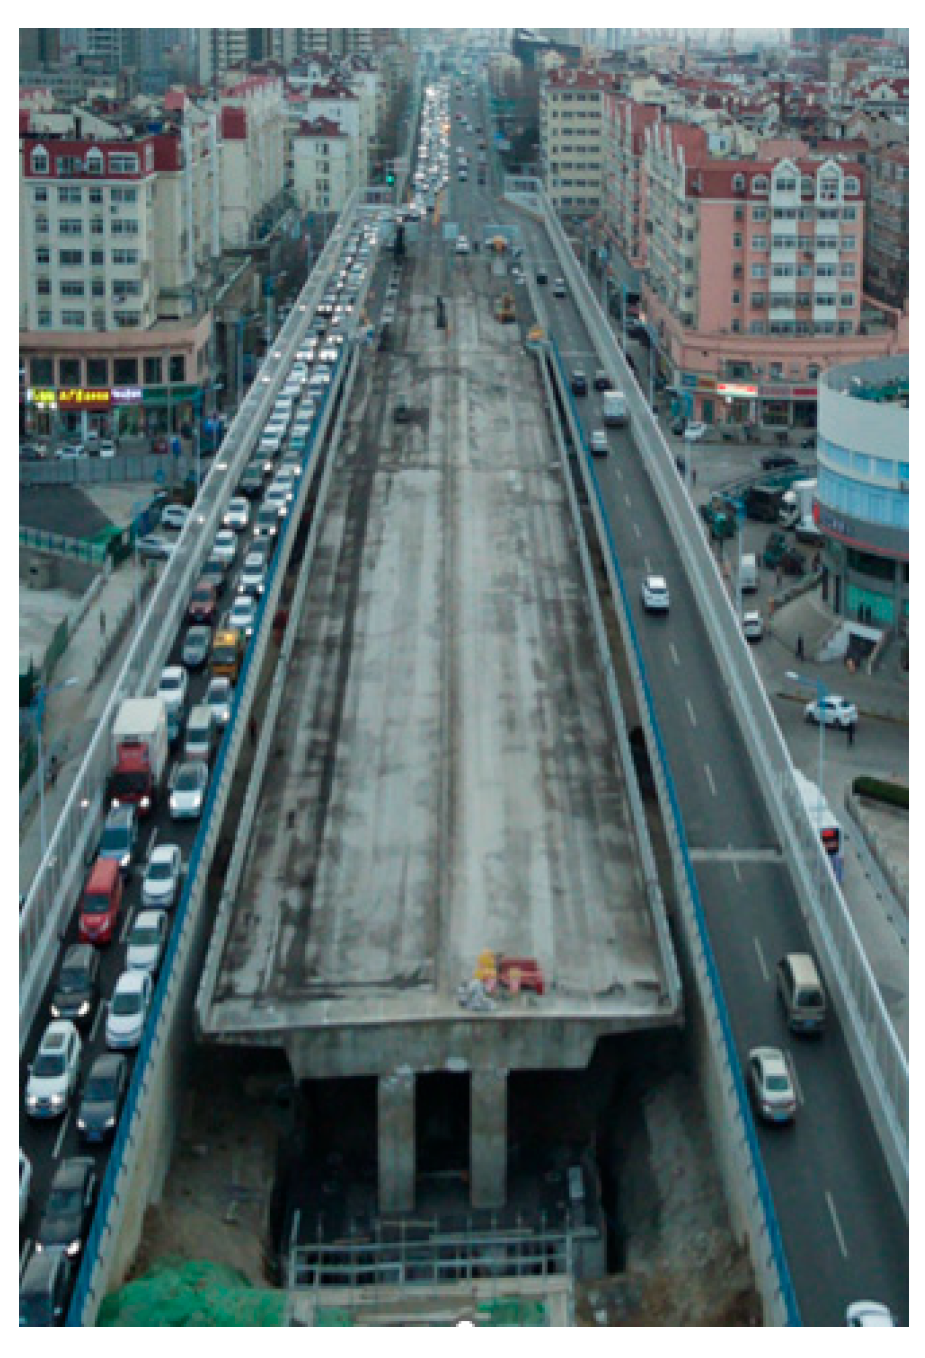
4.1. Project Overview

A viaduct bridge retrofitting project in Qingdao City involves the jacking and retrofitting of two bridges. The main bridge has a width of 25 m and a total length of 849 m. Bridge No. 46 has a span of 59 m (32 + 27 m) and weighs approximately 3421.6 tons, while Bridge No. 47 has a span of 100 m (27 + 41 + 32 m) and weighs approximately 5868.6 tons. The superstructure consists of prestressed concrete continuous box girders, while the substructure includes octagonal piers and spread foundations, with the bearing stratum being slightly weathered granite. Since the bridges opened to traffic in 2006, an inspection in 2019 revealed local cracks in Bridge No. 46 (maximum width of 0.1 mm, length of 65 cm), necessitating jacking retrofitting and reinforcement to enhance load-bearing capacity. This jacking operation adjusts the longitudinal slope of the bridges from a downhill gradient (−1.7% and −3%) to an uphill gradient (2.76%), with jacking heights ranging from 65.5 cm to 579.8 cm, as shown in Figure 3.
This project faces multiple challenges, including large-stroke jacking (requiring numerous jacks for precise synchronization), stringent stability demands on the support system, structural stress changes due to longitudinal slope adjustment, the risk of exacerbating existing cracks, and constraints on construction schedule and site availability in a densely trafficked urban area, as shown in Figure 4 and Figure 5. These challenges increase the complexity of equipment control and elevate the risk of potential instability. Consequently, risk analysis is required to systematically identify uncertainty factors (e.g., synchronization errors, support failures), ensuring that construction is completed efficiently and with minimal environmental impact.

4.2. Establishment and Parameter Determination of the DBN Model

During the construction of the DBN model, this study engaged seven experts with extensive experience in bridge construction-related fields. Based on a thorough review of project engineering documentation, these experts conducted qualitative assessments of the initial probabilities, conditional probabilities, and transition probabilities of nodes within the DBN network. The invited experts span domains including bridge design, construction technology, and project management, all holding titles of associate senior level or above and possessing substantial industry experience, thereby ensuring the comprehensiveness, professionalism, and authority of the evaluation. To address uncertainties arising from data scarcity and subjective judgment, this study employs a Gaussian membership function for fuzzy quantification and defuzzification of expert scores, with results presented in Table 6 and Table 7.
In the aforementioned calculations, the leakage parameter (p0) of the Leaky Noisy-OR model was incorporated to account for the background risk of the target event (e.g., accident occurrence A) occurring at a certain probability due to unmodeled external or unknown factors, even when all explicitly modeled parent nodes (e.g., poor foundation D, improper operation E, unpredictable factors F, etc.) are absent. During the DBN modeling process for risk analysis of bridge jacking construction, the initial probability of the F node (unpredictable factors) was set at 0.25, reflecting the experts’ overall estimation of potential unmodeled risks. However, as a leakage parameter in the CPT of the A node, p0 required independent determination to ensure the scientific rigor and interpretability of the model.
In the CPT of the result node A, p0 is defined as follows: when all parent nodes (D, E, H, M, F) are in the state of 0, (P(A = 1) = p0). Its value is typically small (e.g., 0.01–0.05) to avoid overshadowing the contributions of explicit nodes. Due to the scarcity of bridge jacking construction accident data, the accident probability when all parent nodes are absent cannot be directly derived statistically. Consequently, this study relied on expert experience, and the determination of p0 was also based on expert evaluations and defuzzification processes. Seven invited experts, based on the construction scenario and a seven-level linguistic variable evaluation, quantified their scores using a Gaussian membership function. A weighted average initially yielded an initial probability of 0.25 for the F node. However, to ensure the applicability of p0, it was further adjusted to a lower value to prevent masking the contributions of explicit parent nodes. Ultimately, the model was fitted using GeNIe software, with p0 initially set at 0.01. Through forward inference, the accident probability was validated against actual cases, and p0 was adjusted to 0.02 to balance the authenticity of background risk with the model’s interpretability. Additionally, incorporating domain knowledge, the probability of unmodeled factors in bridge jacking construction is generally low, supporting the conservative estimation of p0. This hybrid approach ensured that p0 not only reflected the background risk characteristics of the F node but also avoided overamplifying the influence of explicit risk factors, thereby providing reliable parameter support for the DBN model.

4.3. Risk Analysis

Using the DBN model for risk analysis in bridge jacking construction, forward inference leverages real-time inputs of risk factors (e.g., equipment status, environmental conditions) to predict the dynamic evolution trends of risk events through probabilistic reasoning, providing proactive warnings and intervention guidance for construction decisions. Conversely, backward inference starts from observed risk outcomes, tracing back critical causal chains (e.g., management deficiencies or operational errors) and quantifying the contribution of each factor to the risk, thereby facilitating precise identification of vulnerabilities and optimization of control strategies. This bidirectional synergy establishes a closed-loop system of “risk prediction-causal tracing”, enabling not only the preemptive mitigation of potential threats but also a deeper understanding of complex risk coupling mechanisms, thus enhancing the systematicity and adaptability of risk management.
During the forward inference process, to more accurately simulate and predict safety risks in bridge jacking renovation construction, the model’s time slice count is set to 10, enabling finer tracking and updating of risk probability changes across the time series. The dynamic probability variation curve of safety risk occurrence in bridge jacking renovation construction, derived from forward inference analysis, is presented in Figure 6. The DBN forward inference results indicate that the overall risk (node A) of bridge jacking construction decreases from a probability of 0.45 to 0.39 (a reduction of 13.3%) over t = 0 to t = 10, exhibiting a trend of rapid decline in the early phase (t = 0 to t = 2, from 0.45 to 0.41) followed by stabilization (t = 7 to t = 10, steady at 0.39). The elevated risk in the initial phase primarily stems from high probabilities associated with E2 (poor foundation), D3 (substructure instability), and H1 (improper operation). However, as construction progresses, the likelihood of these factors triggering safety incidents diminishes. The overall trend suggests that risks become manageable in the later stages of construction, though targeted reinforcement of the foundation, structural repairs, and enhanced operational training remain essential to effectively address sensitive factors.
Backward inference, by observing risk outcomes (e.g., safety incidents), traces potential causes and quantifies their contributions, integrating the temporal dimension to dissect critical causal chains within the risk evolution pathway. This approach enables precise identification of root causes, offering data-driven decision support for optimizing risk management strategies (e.g., enhancing training or resource allocation), thereby improving the systematicity and scientific rigor of risk response. In this study, it is first assumed that a risk event in bridge jacking construction has occurred, followed by the use of the DBN model’s structure to infer potential causes of these outcomes based on observed results. After determining the posterior probabilities of each node in the DBN through backward inference, the Relative Operating Value (ROV) is employed to quantify the degree of change in each factor relative to its baseline or expected level:
V R O ( C i ) = π ( C i ) θ ( C i ) θ ( C i )
Here, VRD(Ci) denotes the ROV value of node Ci, π(Ci) represents the posterior probability of node Ci, and θ(Ci) represents the prior probability of node Ci. The value of the ROV value reflects the sensitivity of a node; a higher ROV value indicates greater sensitivity, meaning that small changes in conditions can lead to significant changes in the node, marking it as a risk source requiring priority attention. In scenarios with limited resources, management resources should be preferentially allocated, preventive measures formulated, or interventions implemented for factors with the greatest impact or highest sensitivity to the target event (e.g., accident occurrence), thereby maximizing risk reduction effectiveness.
The ROV values of various risk factors in bridge jacking construction, as derived from the DBN, are presented in Table 8. Results from backward inference indicate that the most critical sensitive factors are poor foundation (E2), safety technical briefing and training (M3), instability of the substructure (D3), and improper operation (H1), while F (unpredictable incidents, ROV = 0.120) exhibits lower sensitivity. Taking E2 as an example, an ROV of 0.306 indicates a 30.6% increase in its probability following an accident, highlighting the significant driving effect of foundation issues on accident occurrence. In risk management, allocating resources to address E2 (e.g., through geological surveys and reinforcement) can substantially reduce overall risk (reducing A from 0.45 to 0.39, with E2 decreasing by 47% in forward analysis). Compared to other factors (e.g., F, ROV = 0.120), E2’s ROV is approximately 2.5 times higher, implying that the efficiency of resource allocation for E2 mitigation (i.e., the reduction in A’s probability per unit of resource) is about 2–3 times greater than that for F. This is because foundation issues directly impact structural stability, and their mitigation can prevent cascading effects.
During jacking construction, bridge loads are transmitted to the foundation through jacks and temporary supports. If the foundation soil contains weak underlying layers or exhibits collapsibility (e.g., expansion/contraction due to moisture changes), it is prone to causing support settlement or tilting. Particularly under rainfall or groundwater fluctuations, the bearing capacity of the foundation may drop sharply, potentially triggering cascading instability, making poor foundation a primary risk source.
The bridge substructure (e.g., piers, foundations) must bear the redistributed dynamic loads upon completion of jacking. If it exhibits cracks, material aging, or initial design flaws, the load-lowering process during jacking may induce stress concentration, exacerbating structural deformation or local failure, resulting in irreversible damage. Thus, substructure instability constitutes another primary risk source.
Jacking operations rely on high-precision coordinated actions (e.g., synchronous jacking with multiple jacks, millimeter-level displacement control). Deviations from standard procedures by operators (e.g., errors in jacking speed adjustment or alignment correction) may cause load imbalances or equipment overload, leading to abrupt structural stress changes. Furthermore, inadequate understanding of the complexity of jacking techniques (e.g., temporary support placement, emergency plan execution) among workers can result in misjudgments or delayed responses, making safety technical briefings and operational training potential risk points.
These four highly sensitive risk factors require targeted control measures during actual construction to minimize the probability of risk occurrence effectively. Specific preventive measures include the following: (1) Pre-construction detailed surveys using ground-penetrating radar and static load tests to identify foundation hazard zones, followed by targeted reinforcement (e.g., grouting, pile strengthening); during construction, real-time monitoring of foundation settlement and soil pressure changes with sensors, establishing early warning thresholds to ensure safe load transfer. (2) Incorporating a trial jacking phase before formal jacking to verify the normal operation of jacks and control systems, while increasing the number of temporary supports as a safety redundancy to prevent overload or failure of individual supports during jacking. (3) Strict adherence to relevant regulations and industry standards, ensuring adequate safety investments, enhancing supervisory staffing, and strengthening communication mechanisms to guarantee information flow and rapid issue resolution; conducting regular safety training and on-site audits to mitigate potential risks. (4) Intensifying monitoring of existing bridge piers to assess material degradation, reinforcement layout, and concrete damage relative to design values, refining computational models based on measured data; improving the quality of rebar planting and newly poured concrete, with attention to the interface between new and old concrete, ensuring cohesive performance between extended and original pier sections.

4.4. Discussion on DBN Model

The current DBN model was designed for a specific bridge jacking construction project, incorporating specific risk indicators, dependency relationships, and parameters (e.g., initial probabilities and transition probabilities). To achieve generalizability across different bridge types (e.g., beam bridges, arch bridges), locations (e.g., urban, mountainous), or project conditions (e.g., scale, duration), modifications are required in three aspects: structure, parameters, and data acquisition.
Regarding the DBN structure, the current model includes 13 root nodes and fixed dependency relationships, which are effective for analyzing the specific project but lack adaptability to other scenarios. For instance, bridges in mountainous areas may require greater emphasis on geological hazard risks, while urban bridges may be more affected by traffic disturbances. To enhance generalizability, the risk indicator system must be expanded to include universal factors such as earthquakes, flood impacts, and traffic vibrations. A modular structure should be designed, allowing users to add or remove nodes based on project characteristics (e.g., adding a “salt spray corrosion” node for coastal bridges). Dependency relationships should support dynamic adjustments, redefining causal links through methods like DEMATEL or expert consultation. For example, beam bridges may prioritize the influence of temporary supports (D2), while suspension bridges may focus on cable failures. Additionally, the fixed setting of 10 time slices should be modified to allow variable time steps, supporting 5 time slices for small-scale projects or 20 for large-scale projects to accommodate the dynamic evolution needs of different construction durations.
In terms of parameter settings, the model’s initial probabilities, transition probabilities, and expert weights are based on data specific to the project, making them unsuitable for direct application to other scenarios. For example, the foundation risk for urban bridges may be lower than for mountainous bridges. To improve generalizability, a probability database for bridge jacking risks should be established, categorically storing probability values for different bridge types, locations, and conditions. Transition probabilities should similarly be supported by such a database; for instance, the persistence probability of poor foundation in mountainous areas may be higher than in urban settings. Machine learning algorithms (e.g., Bayesian parameter estimation) should be introduced to dynamically optimize parameters using project data (e.g., geological reports, construction records). Additionally, a user-friendly parameter input interface should be designed, allowing adjustments to probabilities based on specific conditions (e.g., geological stability, construction scale). Expert weights should adopt standardized scoring rules (e.g., formulas based on project experience and domain relevance) to ensure consistency and comparability across different projects.
Regarding data, the current model relies on specific expert ratings and Gaussian membership functions, resulting in a singular data acquisition approach that struggles to adapt to varying expert resources and data conditions across projects. To achieve generalizability, a multi-source data fusion strategy should be adopted, integrating historical accident databases, real-time sensor data (e.g., foundation settlement, stress monitoring), and construction logs to reduce reliance on subjective expert input and ensure the model is grounded in objective evidence. The fuzzy quantification method should offer diverse options, supporting triangular fuzzy numbers, trapezoidal fuzzy numbers, and others, to accommodate the uncertainty representation needs of different projects.

5. Conclusions

This study addresses the challenges of dynamic risk evolution and data scarcity in bridge jacking construction by proposing an integrated risk assessment framework based on dynamic Bayesian networks (DBN) and fuzzy set theory. By combining theoretical modeling with empirical engineering validation, it elucidates the temporal dependencies of risk factors and their critical causal chains, providing a scientific theoretical foundation for construction safety management. The specific conclusions are as follows:
(1)
A dynamic risk assessment model was developed by integrating the temporal inference capabilities of DBN with the uncertainty handling mechanisms of fuzzy set theory. The DEMATEL method was employed to quantify interactions among risk factors, coupled with expert scoring and Gaussian membership functions, effectively addressing parameter learning challenges in data-scarce scenarios and enhancing the model’s robustness and adaptability.
(2)
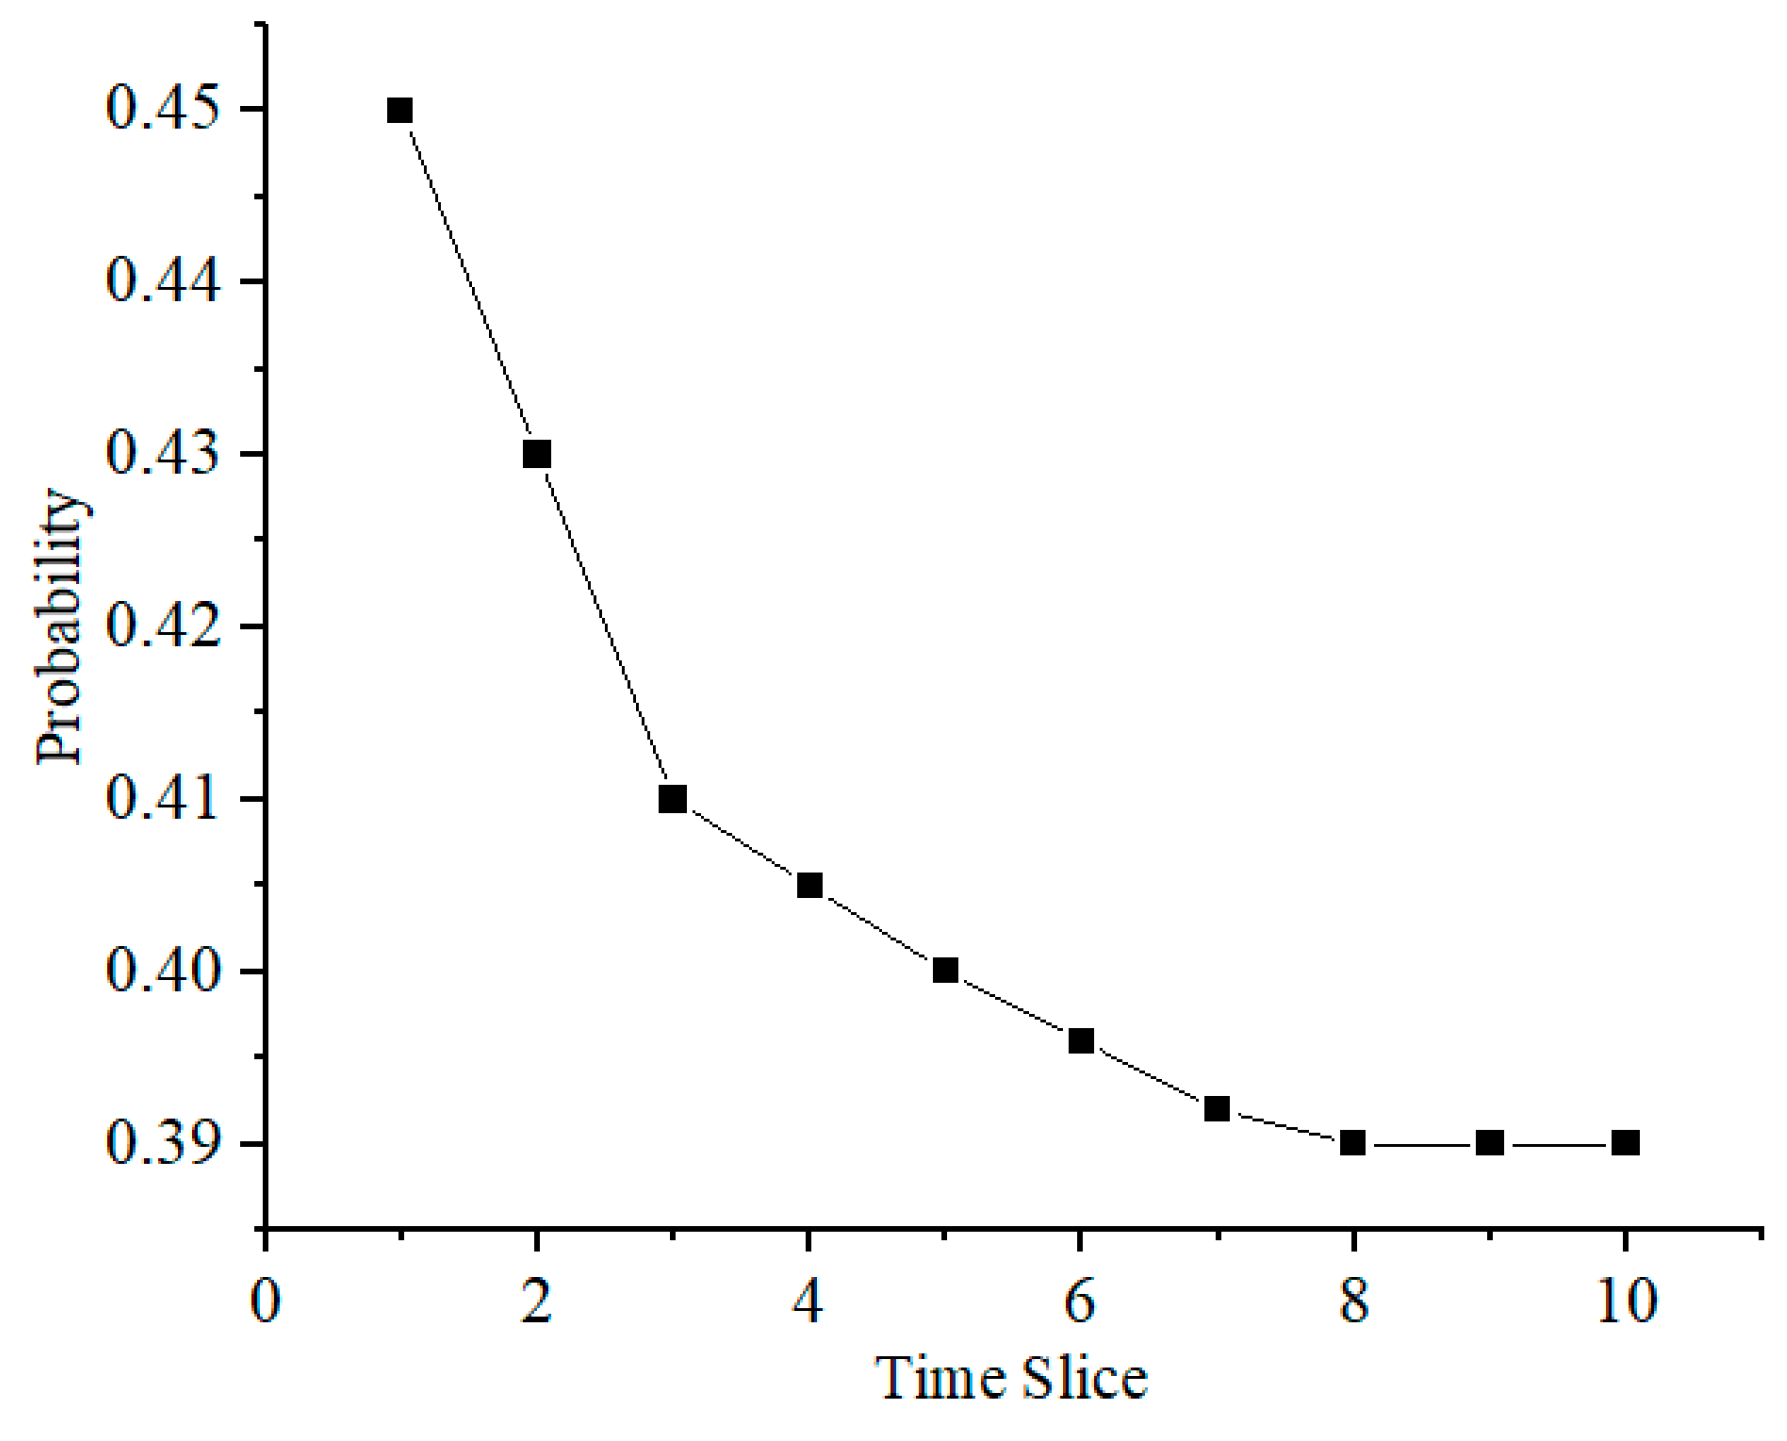
Using an elevated bridge jacking project in Qingdao, China, as a case study, the practical engineering value of the model was validated. Forward inference results show that the overall construction risk probability decreased from 0.45 to 0.39 (a reduction of 13.3%), highlighting the need to prioritize the high-risk initial phase. Backward inference precisely identified poor foundation (ROV = 0.306), inadequate safety technical briefing (ROV = 0.305), and substructure instability (ROV = 0.298) as critical sensitive factors, uncovering the dominant driving mechanisms in the dynamic evolution of risks.
(3)
Based on the analysis results, targeted risk prevention measures were proposed, encompassing detailed foundation surveys and reinforcement, redundant support system design, enhanced operational standardization, and integration of real-time monitoring technologies. Future research could incorporate digital twin technology to further optimize the model’s dynamic updating capabilities and explore collaborative decision-making frameworks under multi-risk coupling scenarios, thereby improving risk management efficiency in complex engineering environments.
(4)
The DBN model presented in this study was specifically designed for a particular bridge jacking construction project, effectively capturing project-specific risk factors. However, the fixed nature of its structure and parameters limits its applicability across different bridge types (e.g., arch bridges, suspension bridges), locations (e.g., urban, mountainous), or project conditions (e.g., scale, duration). To transform it into a universal risk analysis tool capable of accommodating diverse bridge jacking scenarios, systematic modifications are required in three key areas: model structure, parameter estimation, and data acquisition.

Author Contributions

Conceptualization, methodology, software, Y.Y.; validation, writing, supervision, Y.G. All authors have read and agreed to the published version of the manuscript.

Funding

This research was funded by Shandong Provincial Natural Science Foundation, grant numbers ZR2023QE324 and ZR2024ME215.

Data Availability Statement

The data presented in this study are available on request from the corresponding author. The data are not publicly available due to privacy.

Acknowledgments

The authors are grateful to the anonymous reviewers for their constructive comments.

Conflicts of Interest

The authors declare no conflicts of interest.

Abbreviations

The following abbreviations are used in this manuscript:
DBNDynamic Bayesian Network
BNBayesian Network
FSTFuzzy Set Theory
DEMATELDecision Making Trial and Evaluation Laboratory
CPTConditional Probability Table
ROVRelative Operating Value
TVFEMDTime-Varying Filter Empirical Mode Decomposition
EDEncoder–Decoder
LSTMLong Short-Term Memory
BIMBuilding Information Modeling
CNNConvolutional Neural Networks
AHPAnalytic Hierarchy Process
FTAFault Tree Analysis
SEMStructural Equation Modeling

References

  1. American Road & Transportation Builders Association (ARTBA). 2023 Bridge Report; ARTBA: Washington, DC, USA, 2023. [Google Scholar]
  2. Kumamoto, H.; Henley, E.J. Automated Fault Tree Synthesis by Disturbance Analysis. Ind. Eng. Chem. Fundam. 1986, 25, 233–239. [Google Scholar] [CrossRef]
  3. Saaty, T.L. Decision Making—The Analytic Hierarchy and Network Processes (AHP/ANP). J. Syst. Sci. Syst. Eng. 2004, 13, 1–35. [Google Scholar] [CrossRef]
  4. Fang, S.E.; Yu, Q.K. Bayesian Networks-Based Hierarchical Vulnerability Evaluation of Long-Span Structures. Eng. Struct. 2024, 306, 117867. [Google Scholar] [CrossRef]
  5. Zadeh, L.A.; Klir, G.J.; Yuan, B. Fuzzy Sets, Fuzzy Logic, and Fuzzy Systems: Selected Papers; World Scientific: Singapore, 1996. [Google Scholar]
  6. Lee, R.C.T. Fuzzy Logic and the Resolution Principle. J. ACM 1972, 19, 109–119. [Google Scholar] [CrossRef]
  7. Chen, S.M. A Fuzzy Reasoning Approach for Rule-Based Systems Based on Fuzzy Logics. IEEE Trans. Syst. Man Cybern. Part B 1996, 26, 769–778. [Google Scholar] [CrossRef]
  8. Pearl, J. Fusion, Propagation, and Structuring in Belief Networks. In Probabilistic and Causal Inference: The Works of Judea Pearl; ACM Books: New York, NY, USA, 2022; pp. 139–188. [Google Scholar] [CrossRef]
  9. Zhang, Y.R.; Wu, W.J.; Wang, Y.F. Bridge Life Cycle Assessment with Data Uncertainty. Int. J. Life Cycle Assess. 2016, 21, 569–576. [Google Scholar] [CrossRef]
  10. Breiman, L. Random Forests. Mach. Learn. 2001, 45, 5–32. [Google Scholar] [CrossRef]
  11. Soleimani, F. Analytical Seismic Performance and Sensitivity Evaluation of Bridges Based on Random Decision Forest Framework. Structures 2021, 32, 1234–1245. [Google Scholar] [CrossRef]
  12. LeCun, Y.; Bengio, Y.; Hinton, G. Deep Learning. Nature 2015, 521, 436–444. [Google Scholar] [CrossRef]
  13. Zhao, J.; Xu, Y.; Zhu, W.; Li, T.; Zhang, L. Real-Time Early Safety Warning for Personnel Intrusion Behavior on Construction Sites Using a CNN Model. Buildings 2023, 13, 2206. [Google Scholar] [CrossRef]
  14. Sun, Z.; Zhang, Y.; Wang, X.; Chen, L. Predicting Bridge Longitudinal Displacement from Monitored Operational Loads with Hierarchical CNN for Condition Assessment. Mech. Syst. Signal Process. 2023, 200, 110623. [Google Scholar] [CrossRef]
  15. Hochreiter, S.; Schmidhuber, J. Long Short-Term Memory. Neural Comput. 1997, 9, 1735–1780. [Google Scholar] [CrossRef] [PubMed]
  16. Guo, Y.; Li, C.; Yan, M.; Wang, J.; Zhang, K. Research on Deformation Safety Risk Warning of Super-Large and Ultra-Deep Foundation Pits Based on Long Short-Term Memory. Buildings 2024, 14, 1464. [Google Scholar] [CrossRef]
  17. Xin, J.; Li, H.; Wang, T.; Liu, Y. A Signal Recovery Method for Bridge Monitoring System Using TVFEMD and Encoder-Decoder Aided LSTM. Measurement 2023, 214, 112797. [Google Scholar] [CrossRef]
  18. Yue, Z.; Wang, J.; Li, X.; Zhang, K. Mechanics-Guided Optimization of an LSTM Network for Real-Time Modeling of Temperature-Induced Deflection of a Cable-Stayed Bridge. Eng. Struct. 2022, 252, 113619. [Google Scholar] [CrossRef]
  19. Liao, Y.; Chen, X.; Zhang, Q.; Liu, H. Attention-Based LSTM (AttLSTM) Neural Network for Seismic Response Modeling of Bridges. Comput. Struct. 2023, 275, 106915. [Google Scholar] [CrossRef]
  20. You, Y.; Zhang, Y.; Wang, X.; Chen, L. Postfire Performance of Thread-Anchored Blind-Bolted Connection. J. Struct. Eng. 2023, 149, 04023173. [Google Scholar] [CrossRef]
  21. You, Y.; Li, H.; Wang, T.; Liu, Y. Study on Tensile Behavior and Design Methods of Thread-Fixed One-Side Bolted Joints to Concrete-Filled Steel Tubes. J. Constr. Steel Res. 2024, 222, 108958. [Google Scholar] [CrossRef]
  22. Eastman, C.M. BIM Handbook: A Guide to Building Information Modeling for Owners, Managers, Designers, Engineers and Contractors, 2nd ed.; John Wiley & Sons: Hoboken, NJ, USA, 2011. [Google Scholar]
  23. Liu, J.; Ergan, S.; Zhang, Q. An AprilTags-Based Approach for Progress Monitoring and Quality Control in Modular Construction. Buildings 2024, 14, 2252. [Google Scholar] [CrossRef]
  24. Zou, Y.; Kiviniemi, A.; Jones, S.W. Developing a Tailored RBS Linking to BIM for Risk Management of Bridge Projects. Eng. Constr. Archit. Manag. 2016, 23, 727–750. [Google Scholar] [CrossRef]
  25. Civera, M.; Calamai, G.; Fragonara, L.Z. System Identification via Fast Relaxed Vector Fitting for the Structural Health Monitoring of Masonry Bridges. Structures 2021, 30, 1234–1245. [Google Scholar] [CrossRef]
  26. Civera, M.; Mugnaini, V.; Fragonara, L.Z. Machine Learning-Based Automatic Operational Modal Analysis: A Structural Health Monitoring Application to Masonry Arch Bridges. Struct. Control Health Monit. 2022, 29, e3028. [Google Scholar] [CrossRef]
  27. Mugnaini, V.; Fragonara, L.Z.; Civera, M. A Machine Learning Approach for Automatic Operational Modal Analysis. Mech. Syst. Signal Process. 2022, 170, 108813. [Google Scholar] [CrossRef]
  28. Civera, M.; Wang, Y.; Fragonara, L.Z.; Ceravolo, R. A DBSCAN-Based Automated Operational Modal Analysis Algorithm for Bridge Monitoring. Measurement 2023, 208, 112451. [Google Scholar] [CrossRef]
  29. Civera, M.; Fragonara, L.Z.; Ceravolo, R.; Surace, C. The Teager-Kaiser Energy Cepstral Coefficients as an Effective Structural Health Monitoring Tool. Appl. Sci. 2019, 9, 5064. [Google Scholar] [CrossRef]
  30. Li, Q.; Zhang, T.; Yu, Y. Evaluation of the Durability of Bridge Tension Cables Based on Combination Weighting Method-Unascertained Measure Theory. Sustainability 2022, 14, 7147. [Google Scholar] [CrossRef]
  31. Yue, J.; Lu, H.; Qian, R.; Tang, J. Application of Combined Weighting–Fuzzy Hierarchical Model in Condition Assessment of Concrete Continuous Girder Bridges. Buildings 2025, 15, 993. [Google Scholar] [CrossRef]
  32. Xu, J.; Li, Z.; Wang, H.; Chen, X.; Liu, Y. Construction Safety Influencing Factor Analysis of Bridge-Erecting Machines Based on Structural Equation Modeling. Heliyon 2024, 10, e25062. [Google Scholar] [CrossRef]
  33. Diez, A.; Khoa, N.L.D.; Makki Alamdari, M.; Wang, Y.; Chen, F.; Runcie, P. A Clustering Approach for Structural Health Monitoring on Bridges. J. Civ. Struct. Health Monit. 2016, 6, 429–445. [Google Scholar] [CrossRef]
  34. She, Y.; Pu, N.; Wang, Y.; Li, J.; Peng, X.; Lv, Q.; Ma, M. Drivers for the Acceptance of Green Housing Insurance from the Perspective of House Owners. Buildings 2025, 15, 1241. [Google Scholar] [CrossRef]
  35. Chen, Y.; Li, W.; Wang, X. An Investigation into the Risk Assessment of Building-Integrated Photovoltaic Residential Project Development Utilizing the DEMATEL-ANP Methodology: A Chinese Case Study. Buildings 2024, 14, 623. [Google Scholar] [CrossRef]
  36. He, C.; Yu, B.; Liu, M.; Guo, L.; Tian, L.; Huang, J. Utilizing Large Language Models to Illustrate Constraints for Construction Planning. Buildings 2024, 14, 2511. [Google Scholar] [CrossRef]
  37. Eker, H. Natural Language Processing Risk Assessment Application Developed for Marble Quarries. Appl. Sci. 2024, 14, 9045. [Google Scholar] [CrossRef]
  38. You, Y.; Wang, J.; Chen, X.; Zhang, Q. Post-Fire Behavior of Square Hollow Section Column Connections Using Thread-Anchored Blind Bolts. Structures 2024, 59, 1234–1245. [Google Scholar] [CrossRef]
  39. American Association of State Highway and Transportation Officials (AASHTO). AASHTO LRFD Bridge Construction Specifications, 3rd ed.; AASHTO: Washington, DC, USA, 2010. [Google Scholar]
  40. Neitzel, D.K. Electrical Safety Update—OSHA 29 CFR 1910.269 and NFPA 70E-2015 Revisions. IEEE Trans. Ind. Appl. 2016, 52, 2753–2758. [Google Scholar] [CrossRef]
  41. JGJ59-99; Standard for Construction Safety Inspection. China Architecture & Building Press: Beijing, China, 1999.
  42. GB/T51256-2017; Technical Code for Bridge Jacking-up and Reposition. China Standards Press: Beijing, China, 2017.
Figure 1. Safety risk analysis process for bridge jacking renovation construction based on the DBN method.
Buildings 15 01493 g001
Figure 2. DBN structure for safety risk analysis of bridge jacking renovation construction.
Buildings 15 01493 g002
Figure 3. Schematic diagram of jacking construction effects.
Buildings 15 01493 g003
Figure 4. Constrained construction environment.
Buildings 15 01493 g004
Figure 5. Substructure affected by environmental erosion and load-induced damage.
Buildings 15 01493 g005
Figure 6. Bridge jacking renovation construction safety risk probability.
Buildings 15 01493 g006
Table 1. Summary of potential risk sources in jacking construction.
Risk CategoryRisk Description
Structural Stability and Integrity Risks
  • Instability when the bridge is partially or fully suspended or reliant on temporary supports;
  • Hidden structural issues (e.g., cracks or corrosion) may become evident during jacking.
Complex Stress States and Mechanical Analysis
  • Requires precise calculation and management of the bridge’s weight and load distribution;
  • Selection and arrangement of jacking equipment must be based on the bridge’s specific structure and conditions.
Constraints and Risks of the On-Site Work Environment
  • Construction often occurs in confined or restrictive environments, such as within existing traffic networks;
  • Safety management of the construction area becomes complex, requiring consideration of surrounding environmental safety.
Technical and Operational Challenges
  • Demands high-precision engineering techniques and an experienced operational team;
  • Jacking renovation plans for each bridge require a high degree of customization.
Time and Economic Pressures
  • Accelerated construction schedules may increase the risk of errors;
  • Economic pressures may lead to compromises in safety measures and technical investments.
Unpredictable Incidents
  • Sudden earthquakes, low-probability equipment failures, or damage to unknown underground pipelines;
  • Discrepancies in understanding the bridge’s current condition among contractors, designers, and owners;
  • Public complaints or media pressure arising from construction activities.
Table 2. Safety Risk Indicator System.
CategoryCodeRisk Factor
Material FactorsD1Jack Failure
D2Temporary Support Failure
D3Substructure Instability
Environmental FactorsE1Adverse Weather
E2Poor Foundation Conditions
Human FactorsH1Improper Operation
H2Poor Communication
H3Low Safety Awareness of Construction Personnel
Management and Planning FactorsM1Risk Emergency Plan
M2On-Site Construction Management Level
M3Safety Technical Briefing and Training
M4Investment in Safety Measures
Unpredictable Incidents Ambiguous FactorsFFuzzy factor
Table 3. Grading of linguistic variables and corresponding mean and standard deviation.
Linguistic VariableMean (μ)Standard Deviation (σ)
1Very High0.950.05
2High0.80.10
3Moderately High0.70.15
4Medium0.50.15
5Moderately Low0.30.15
6Low0.20.10
7Very Low0.050.05
Table 4. Rules for calculating expert weights.
IndicatorDescriptionScoring Criteria
Educational Background (W1)Level of academic training and depth of theoretical knowledgePhD: 0.4,
Master’s: 0.3,
Bachelor’s: 0.2
Years of Experience (W2)Duration of practice in civil engineeringBaseline of 5 years: 0.2, +0.1 per additional 5 years, maximum 0.6
Number of Relevant Projects (W3) Experience in bridge jacking or similar projectsBaseline of 5 projects: 0.2, +0.1 per additional 5 projects, maximum 0.5
Professional Title (W4)Professional standing and technical authority in the industry Professor/Researcher: 0.3,
Senior Engineer: 0.2,
Engineer/Assistant Engineer: 0.1
Domain Relevance (W5) Alignment of expertise with jacking constructionDirectly relevant: 0.3,
Generally relevant: 0.2,
Indirectly relevant: 0.1
Influence (W6) Contributions to academic research or engineering practiceHigh (10 papers/major projects): 0.3,
Medium (5–10 papers/medium projects): 0.2,
Low (<5 papers/ordinary projects): 0.1
Table 5. Expert evaluation indicator results and weights.
ExpertAcademic
Degree
(W1)
Years of
Experience (W2)
Number of Projects
(W3)
Professional
Title
(W4)
Field
Relevance
(W5)
Influence
(W6)
Initial Weight
(Si)
Normalized Weight
(Wi)
Expert 1 0.4
(PhD)
0.5
(21 years)
0.3
(12 bridge projects)
0.3
(Professor)
0.3
(Bridge Structural Design Expert)
0.3
(Published over 10 papers)
0.3500.186
Expert 2 0.3
(Master’s)
0.4
(16 years)
0.2
(6 bridge projects)
0.2
(Senior Engineer)
0.3
(Construction Technology Expert)
0.2
(Published 7 papers)
0.2670.142
Expert 3 0.4
(PhD)
0.6
(33 years)
0.4
(18 bridge projects)
0.3
(Researcher)
0.3
(Geotechnical Engineering Expert)
0.3
(Published over 10 papers)
0.3830.203
Expert 4 0.3
(Master’s)
0.3
(14 years)
0.2
(7 bridge projects)
0.1
(Engineer)
0.3
(Equipment Management Expert)
0.2
(Published 5 papers)
0.2330.124
Expert 5 0.2
(Bachelor’s)
0.5
(24 years)
0.2
(10 bridge projects)
0.2
(Senior Engineer)
0.2
(Safety Management Expert)
0.2
(Published 5 papers)
0.2500.133
Expert 6 0.3
(Master’s)
0.4
(16 years)
0.2
(5 bridge projects)
0.2
(Senior Engineer)
0.2
(Project Management Expert)
0.2
(Published 6 papers)
0.2500.133
Expert 7 0.3
(Master’s)
0.2
(7 years)
0.1
(3 bridge projects)
0.1
(Assistant Engineer)
0.1
(Digital Technology Expert)
0.1
(Published 2 technical papers)
0.1500.080
Table 6. Expert assessment results.
Root NodesExpert 1Expert 2Expert 3Expert 4Expert 5Expert 6Expert 7
D1MediumModerately LowMediumModerately HighModerately LowMediumLow
D2Moderately LowMediumModerately LowMediumLowModerately LowModerately Low
D3Moderately HighMediumHighMediumModerately HighMediumMedium
E1MediumMediumModerately LowMediumModerately HighModerately LowMedium
E2HighModerately HighVery HighModerately HighMediumHighModerately High
H1Moderately HighMediumMediumHighMediumModerately HighModerately Low
H2Moderately LowLowModerately LowMediumModerately LowMediumLow
H3MediumModerately LowMediumModerately LowMediumModerately LowLow
M1MediumModerately HighMediumMediumModerately HighMediumMedium
M2Moderately LowMediumModerately LowMediumModerately LowMediumModerately Low
M3Moderately HighMediumModerately HighMediumMediumModerately HighMedium
M4MediumModerately LowMediumModerately LowMediumModerately LowMedium
FModerately LowLowModerately LowMediumLowModerately LowLow
Table 7. Fuzzy values, initial probabilities, and transition probabilities of root nodes.
Root NodesFuzzy ValuesInitial Probabilities P (X = 1)Fuzzy Values
tt − 1
10
D1(0.45,0.15)0.45
D2(0.32,0.14)0.32
D3(0.62,0.14)0.6210.750.25
00.220.78
E1(0.47,0.14)0.47
E2(0.77,0.12)0.7710.850.15
00.100.90
H1(0.58,0.14)0.5810.720.28
00.210.79
H2(0.29,0.13)0.29
H3(0.39,0.14)0.39
M1(0.54,0.15)0.54
M2(0.38,0.15)0.38
M3(0.59,0.15)0.59
M4(0.43,0.15)0.43
F(0.25,0.12)0.25
Table 8. ROV comparison of risk factors.
Root NodesRisk FactorPrior ProbabilityPosterior ProbabilityROV Value
E2Poor Foundation Conditions0.490.640.306
M3Safety Technical Briefing and Training0.590.770.305
D3Substructure Instability0.470.610.298
H1Improper Operation0.410.530.293
D2Temporary Support Failure0.320.360.125
FFuzzy factor0.250.280.12
M4Investment in Safety Measures0.430.480.116
D1Jack Failure0.450.50.111
M1Risk Emergency Plan0.540.60.111
E1Adverse Weather0.470.520.106
M2On-Site Construction Management Level0.380.420.105
H2Poor Communication0.290.320.103
H3Low Safety Awareness of Construction Personnel0.390.430.103
Disclaimer/Publisher’s Note: The statements, opinions and data contained in all publications are solely those of the individual author(s) and contributor(s) and not of MDPI and/or the editor(s). MDPI and/or the editor(s) disclaim responsibility for any injury to people or property resulting from any ideas, methods, instructions or products referred to in the content.

