
Implementation of a BIM-Based Collaboration System for Structural Damage Condition Assessment in an Asymmetric Butterfly Arch Bridge

Abstract
1. Introduction
1.1. Progress in Structural Health Monitoring (SHM) for Bridges
1.2. Building Information Modeling Technology in Structural Health Monitoring Systems
1.3. Butterfly Arch Bridge and Its Requirements for SHM
2. Requirements Analysis of the SHM System for Butterfly Arch Bridges
2.1. Requirement Analysis of Monitoring Items
2.1.1. Spatial Mechanical Properties of Butterfly Arch Bridges
- Highly statically indeterminate feature of the structure system.
- Obvious spatial force distribution of arch ribs. The arch ribs are not only subjected to tensile forces of suspenders and end cross beams, but also bear internal forces such as the biaxial bending moment, torsion, compressive axial force, shearing force, and out-of-plane bending moment under dead loads. Therefore, the eccentric center should be set between suspenders and the arch plane to balance arch ribs’ overturning moment.
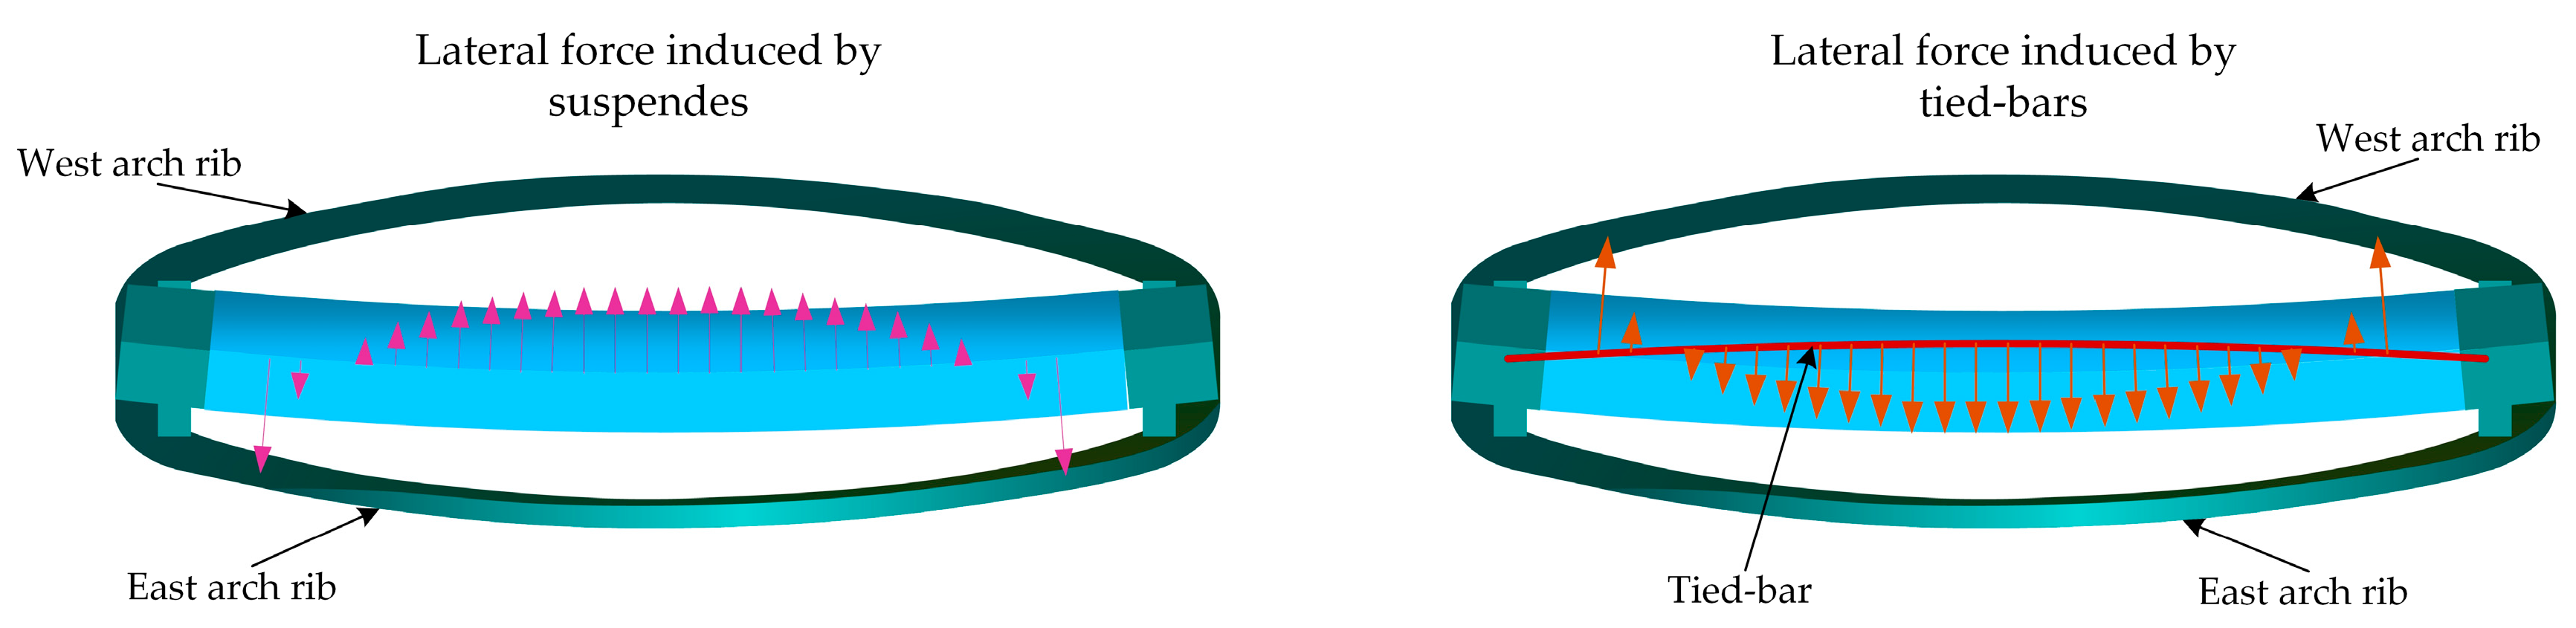
- Large lateral displacement of arch ribs. Large lateral displacement could appear when the outward-inclined arch ribs are subjected to external loads, leading to distinct changes in the geometrical shape of butterfly arch bridges. By and large, the spatial forces and lateral displacements depend on the arch geometric shape and the mutual matching relation of the gravity load and overall stiffness of bridge components (Figure 2). Hence, monitoring of the displacement and stress state becomes particularly important.
- Complicated mechanical characteristics of the main girder. In addition to the vehicle loads and pedestrian loads, the main girder will also bear the uneven lateral force component induced by axial forces in suspenders. Moreover, the pushing force and lateral force components of other loads also act on the main girder.
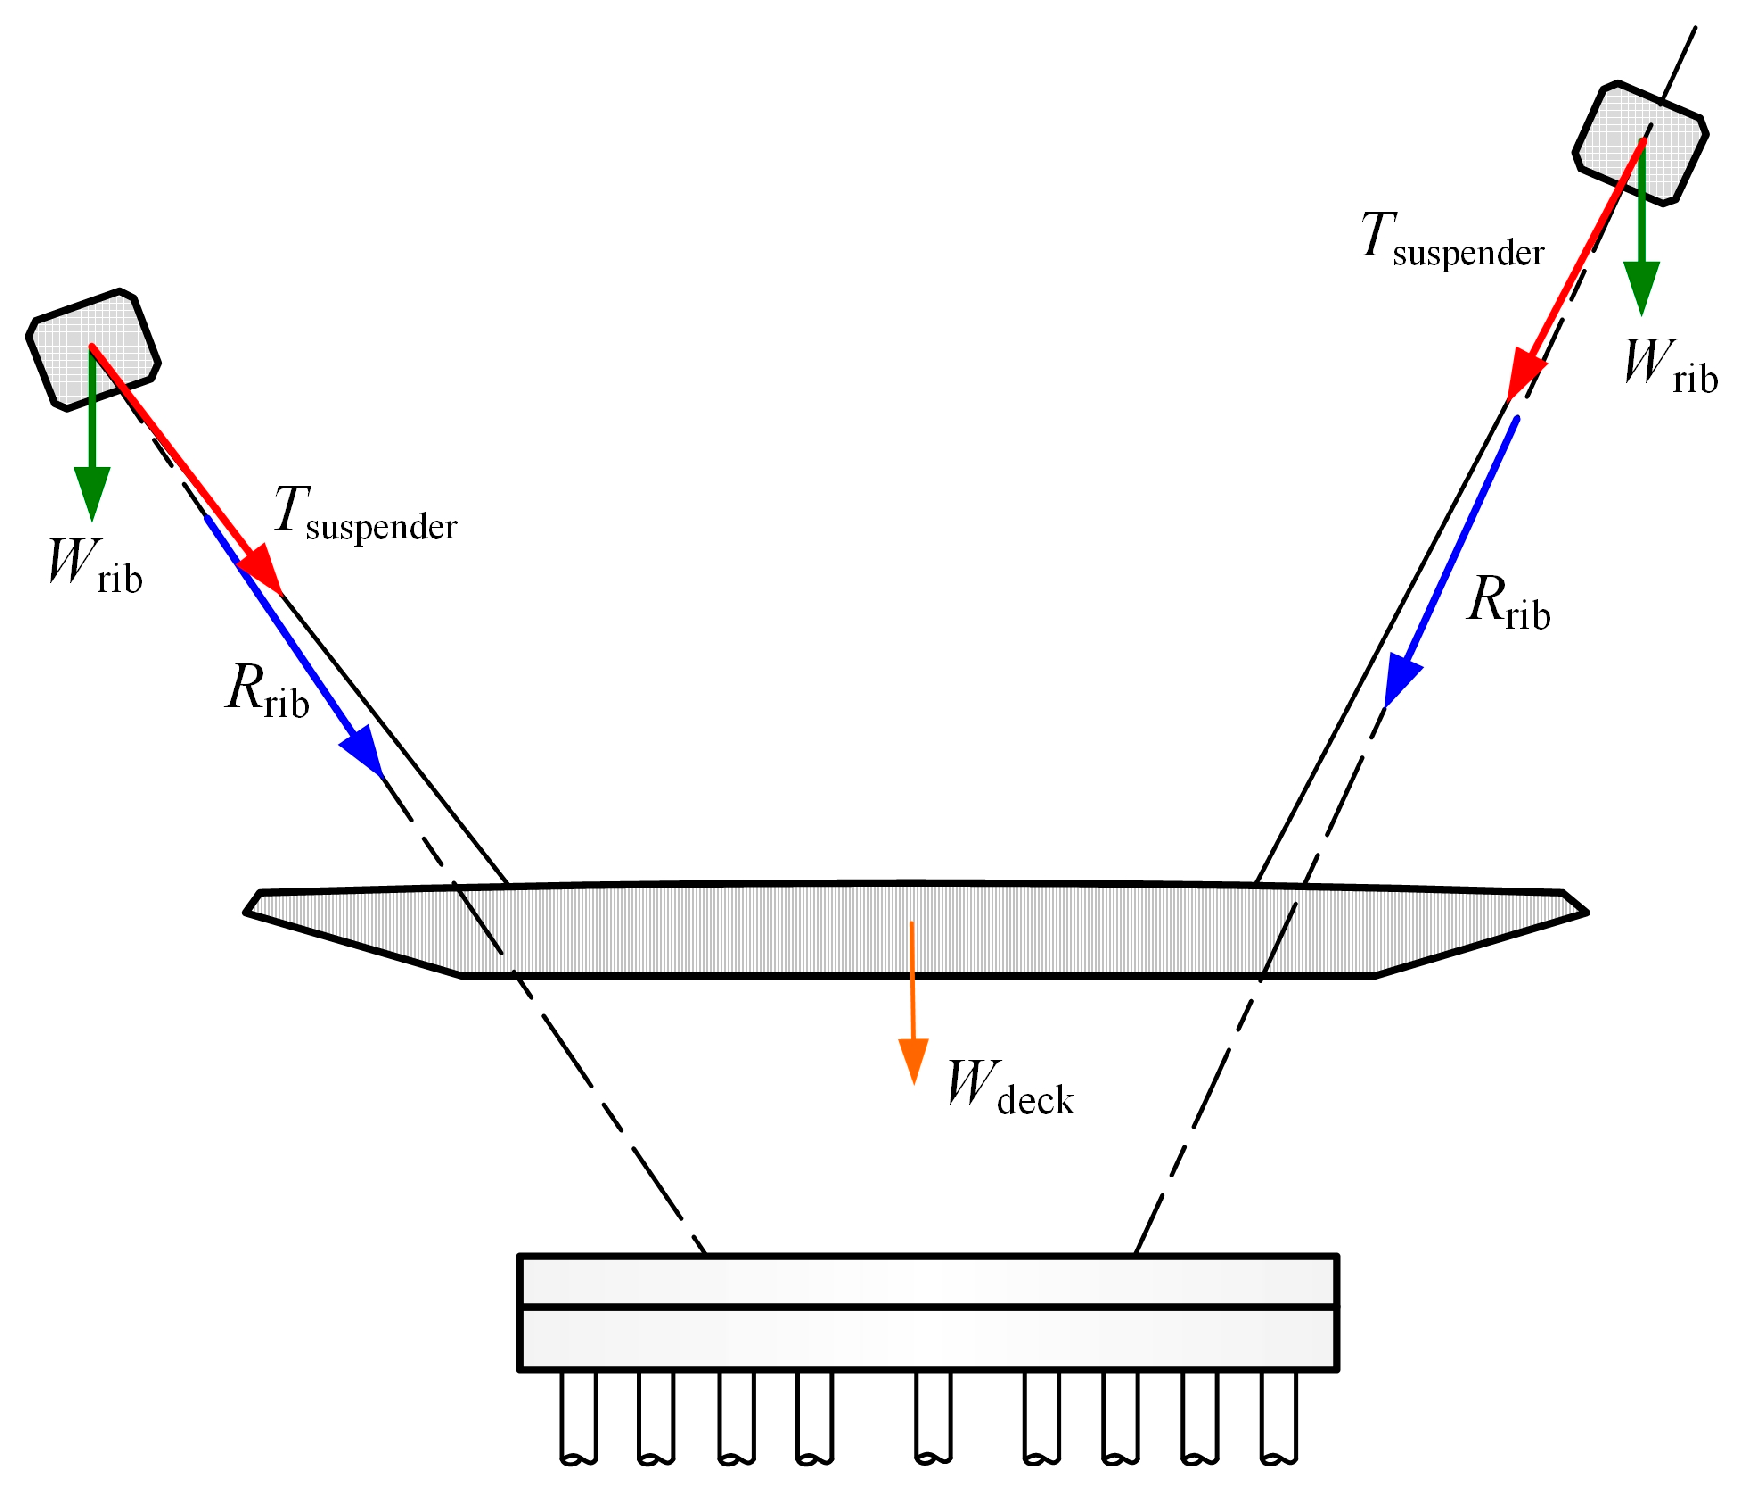
- Complicated mechanical characteristics of the suspender. The suspenders need to be spatially arranged to provide enough constraints to avoid the buckling of outward-inclined arch ribs. Since the vertical component is certain, the force of suspenders is closely related to the inclination angle of arch ribs, and all the equilibrium relationships (such as the out-of-plane equilibrium of the arch) differ from conventional ones (Figure 3).
2.1.2. Pivotal Monitoring Items
- Ambient Humidity Monitoring. The effect of alternate wetting and drying (AWD), in general, is quite detrimental to the durability of steel bridges.
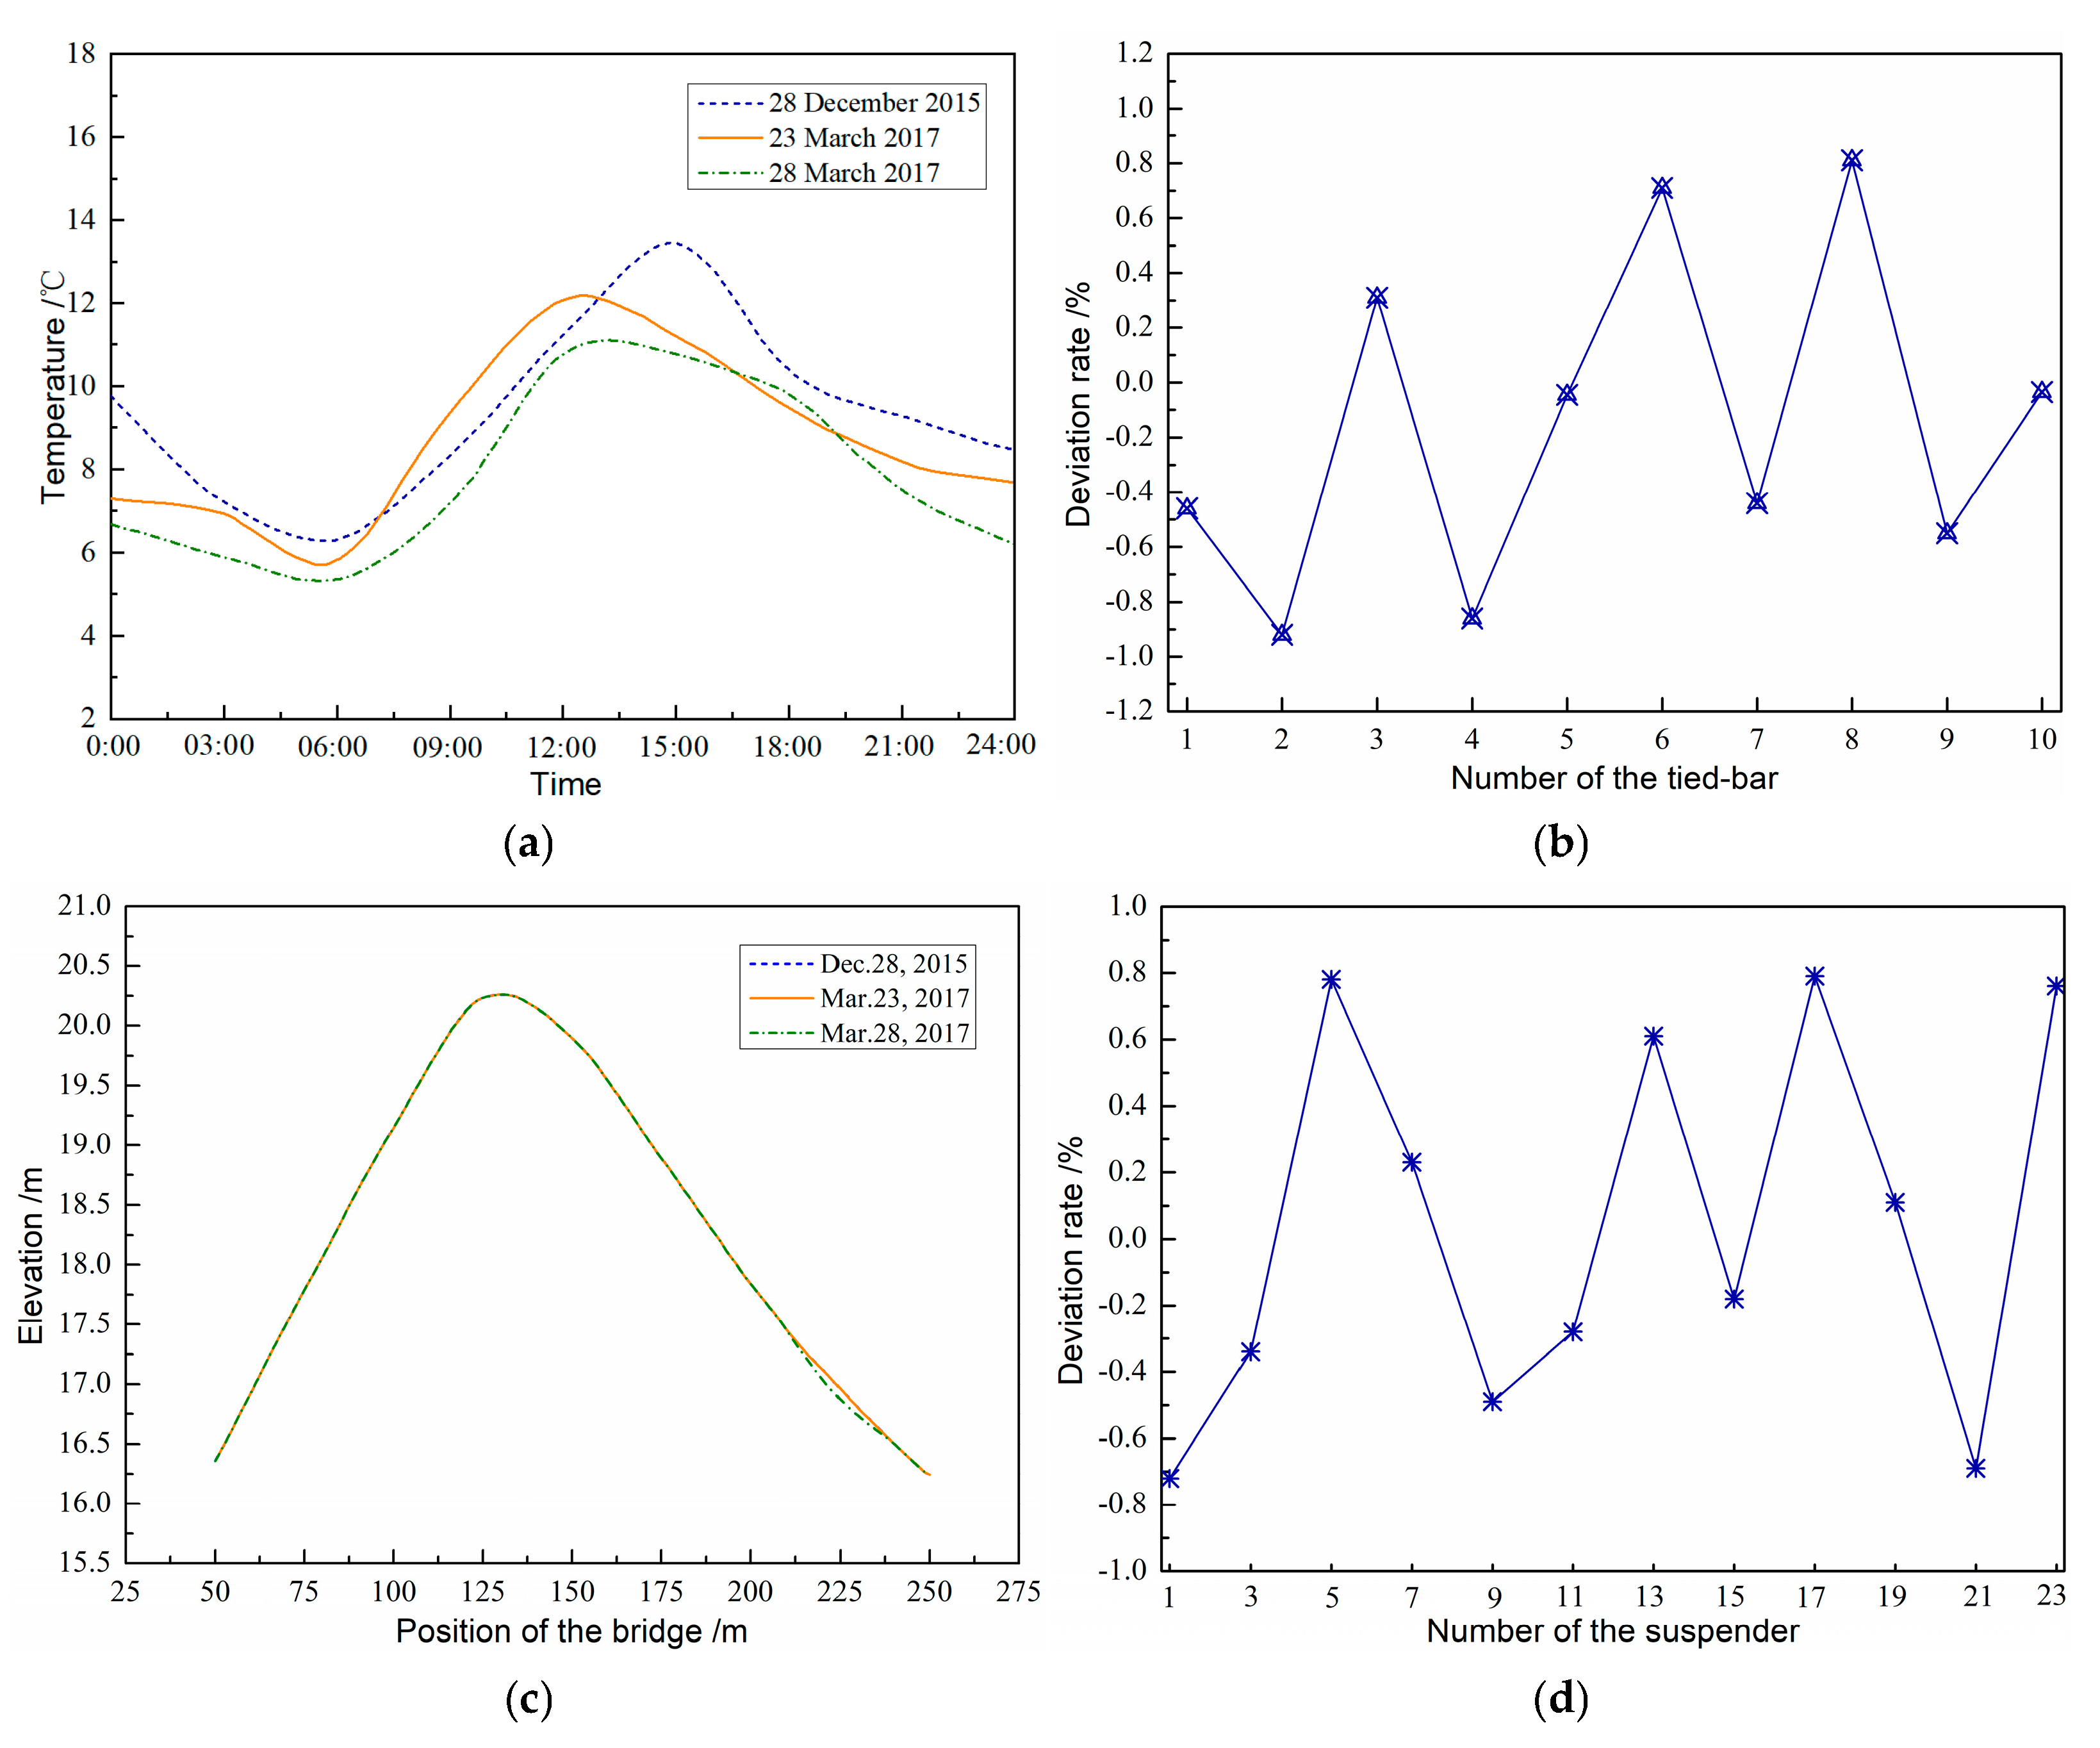
- Ambient Temperature Monitoring. The ambient temperature will give rise to the temperature difference and local temperature gradient among different components of the bridge structure, and then produce secondary internal forces in local member bars of the main girder. Of the above considerations, the structural temperature of cross-sections on main girder and arch ribs should be monitored meticulously.
- Geometric Alignment Monitoring. The bridge axial alignment is directly influenced by the concrete creep, support settlement, temperature variation, and the overall structural stiffness of the bridge. Hence, it is crucially important to monitor the static displacement, dynamic displacement, settlement, inclination and so on to guarantee the structural operation safety during service life.
- Structural Vibration Monitoring. Once the damage or other abnormal cases appear in bridge structures, dynamic properties will change with it accordingly. So, primary monitoring items of the structural vibration include dynamic deflection, dynamic strain, transverse acceleration, and so on.
- Load-carrying Member Monitoring. The monitoring of primary load-carrying members, such as the main girder stress and main arch rib stress, is very essential.
2.2. Requirement Analysis of SHM System Function
- Automatic continuous acquisition and remote transmission of monitoring data.
- Effective disposal and control management of mass data.
- Data analysis and structural health evaluation.
- Comprehensive display of user interface (UI).
- Information sharing and collaborative linkage.
2.3. Requirement Analysis of SHM System Capability for Butterfly Arch Bridges
2.4. Requirement for BIM-Based SHM Data Management System in Butterfly Arch Bridge
- Due to complicated loading states of butterfly arch bridges, it is difficult to carry out routine maintenance. Until now, there have only been a few studies on the SHM system for butterfly arch bridges domestically and overseas, and scarcely any studies concerning the developing and utilization of BIM-based SHM system on butterfly arch bridges.
- The large-scale SHM system of complicated bridges will produce mass monitoring data, which could result in the problem of poor interface interaction ability and ineffective data management. The powerful information management ability of BIM technology needs to be applied to accomplish 3D visualization and better disposal efficiency.
- The whole BIM model of bridge structures is generally large-sized. There still exist unavoidable problems such as low database query speed, bad display effect, and poor efficiency of user information sharing. Hence, the lightweight disposal of the BIM model is of great importance to achieve more convenient and efficient database querying.
- The function of video monitoring is usually not abundant for bridge SHM systems, and the exceedance event of monitoring data should be supervised through the linkage between the video monitoring system and SHM subsystem.
3. Implementation of the SHM System for Butterfly Arch Bridges in BIM Environment
3.1. General Description of the Butterfly Arch Bridge
- Geographical Location: The Fu River Bridge is located over the Fu River, which is to the east of the new Convention and Exhibition Center, Chengdu, China (Figure 4). The construction of this bridge was started in 2012 and finished within three years.
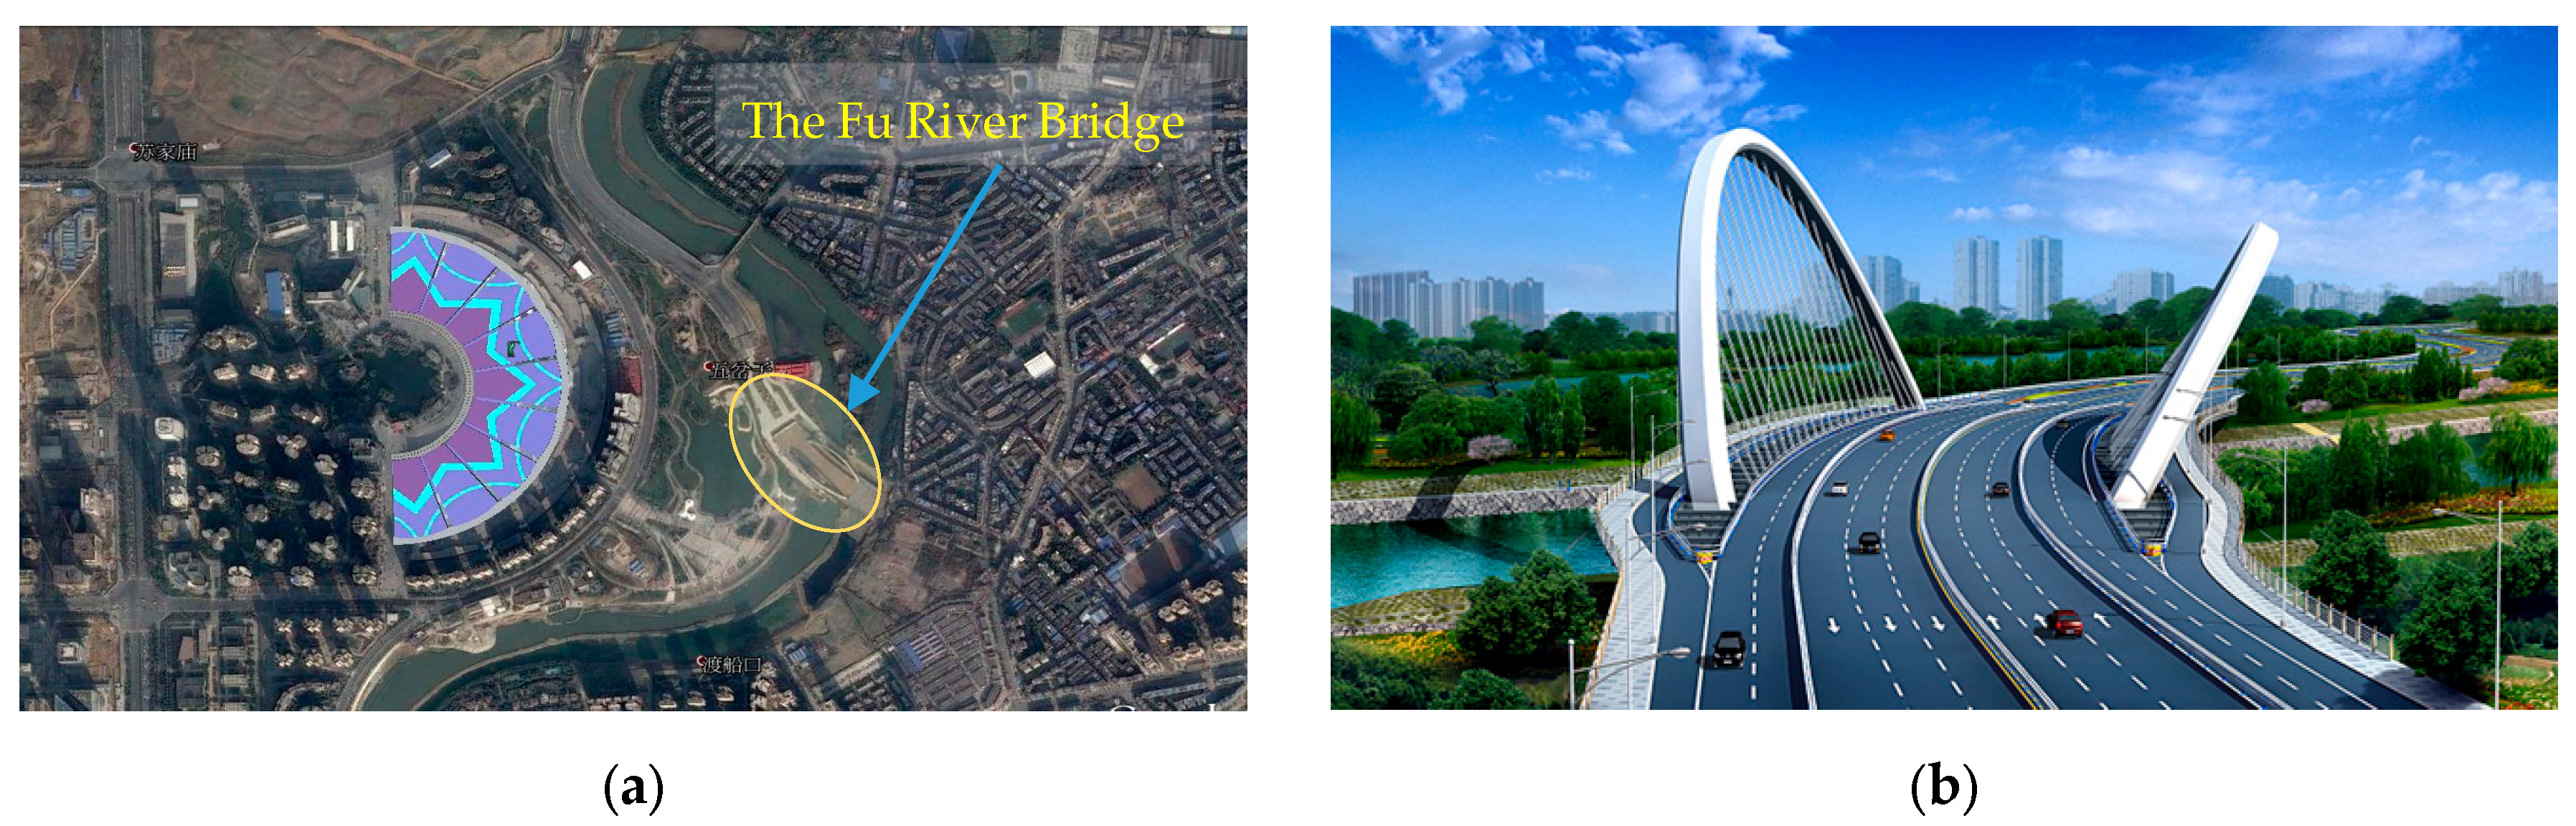
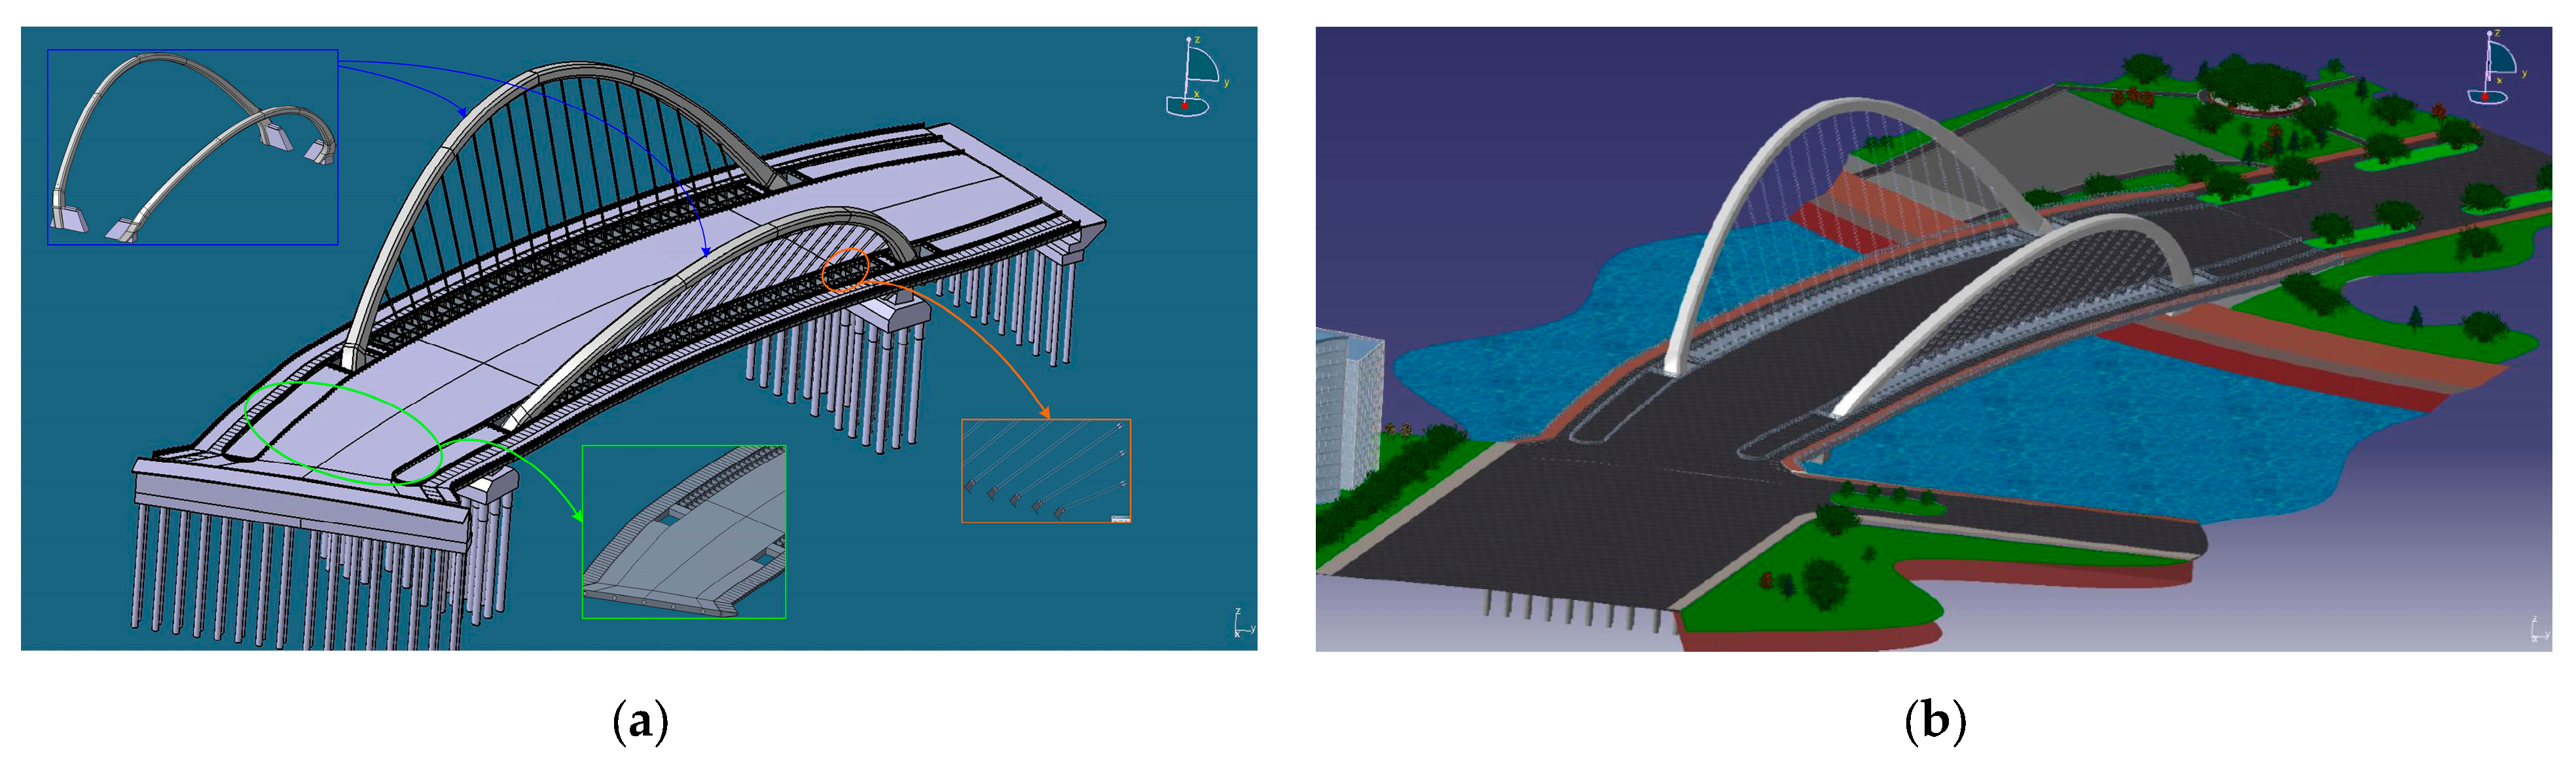
- General Layout: The bridge is designed as an asymmetric butterfly arch structure, with a span arrangement of 44.00 + 150.00 + 55.00 m and a total length of 264.65 m. The scheme of a two-way five-lane urban expressway is adopted, with a total width of 69.00 m (Figure 5). The main span is within the horizontal curve, with the northern and southern arch ribs located in their respective inclined planes. The two arch ribs have different inclined angles, bound up with each other under the main girder, and there are no transverse connections between the two arch ribs over the deck.

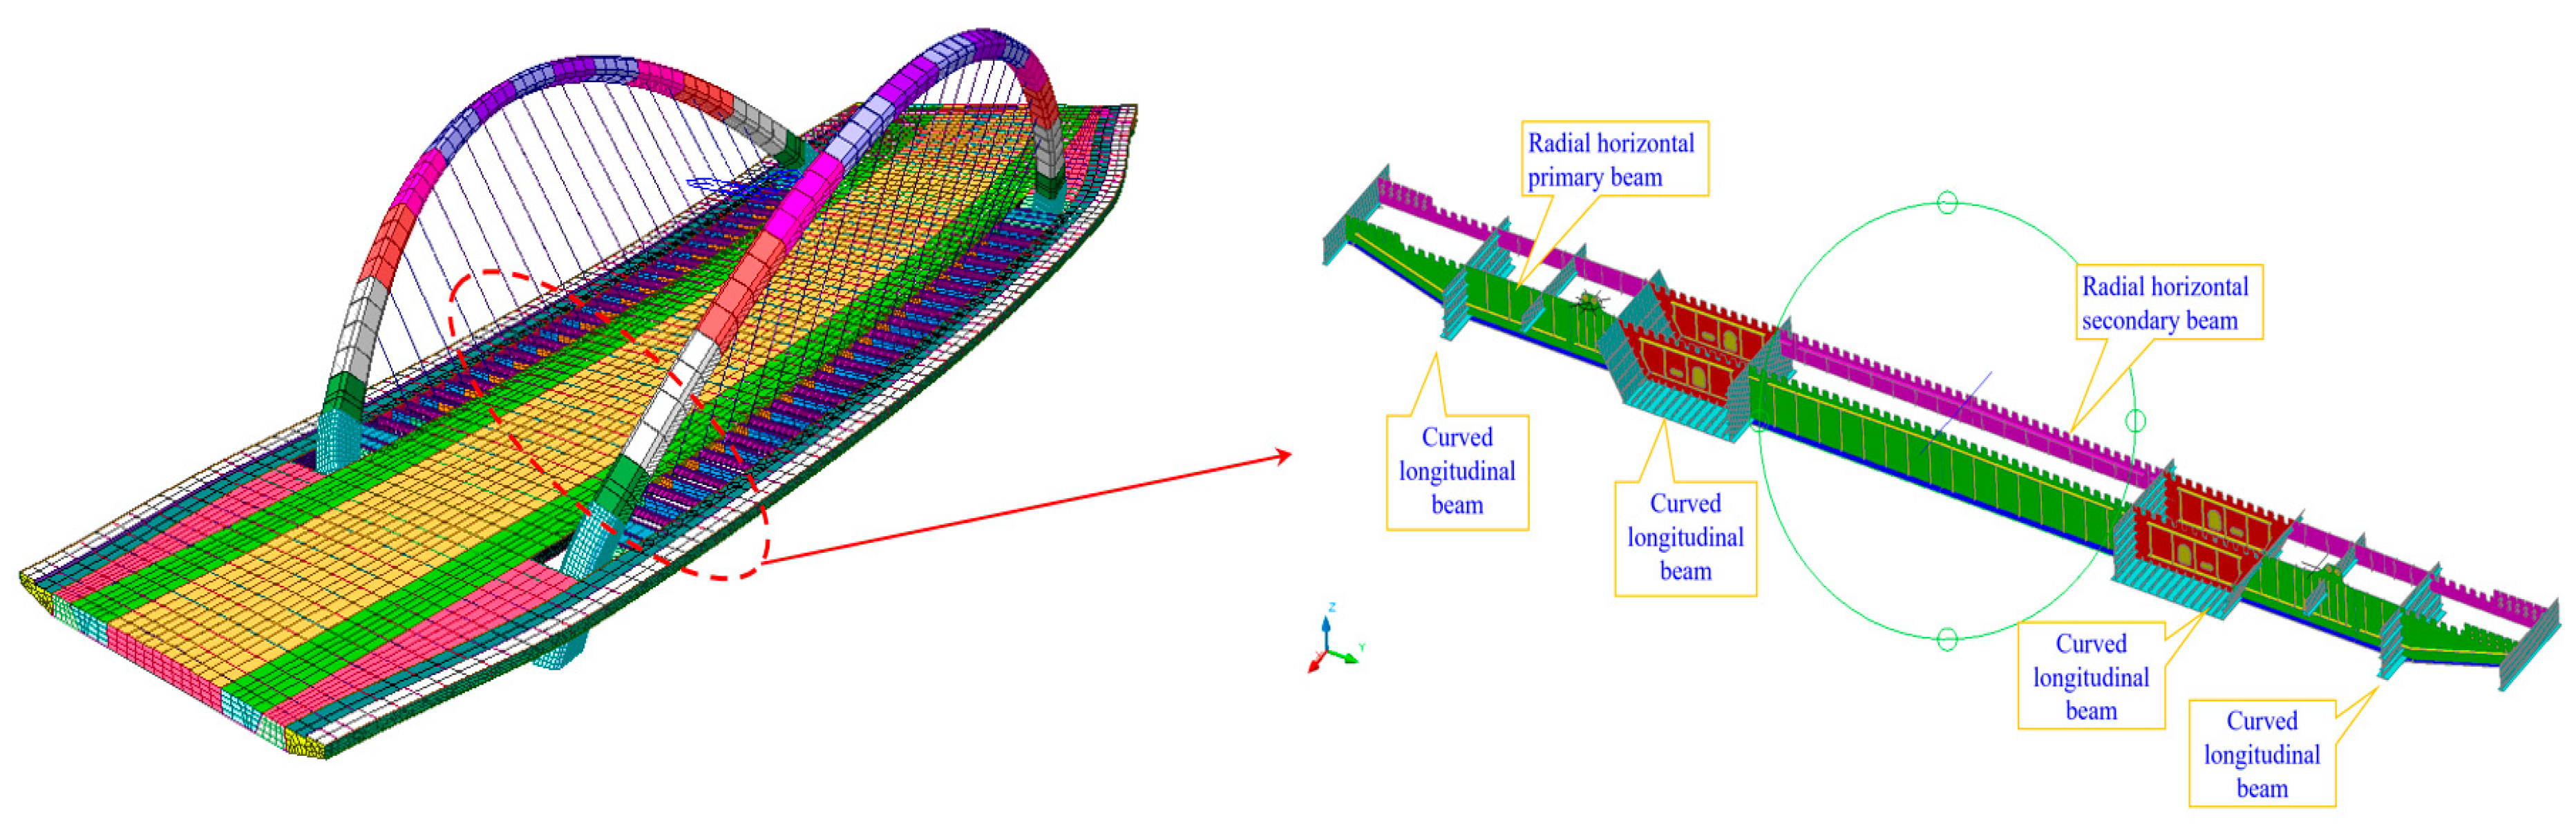
- Main Girder: The main girder consists of a three-span continuous beam and the cross-section is composed of a double longitudinal box-girder. The deck system is composed of the radial horizontal beam and curved longitudinal beam (see Figure 5a,b,d and Figure 6). The lateral force is dominant in the horizontal beam for the main span, while the longitudinal force is dominant for the side span. In addition, the orthotropic steel bridge deck is adopted in the design.
- Arch Rib: The arch ribs consist of the steel-box arch rib segment and concrete arch rib segment (see Figure 5b,d). In each arch plane, the arch axis of the steel-box arch rib is the catenary line, and that of the concrete arch rib is composed of the circular curve and straight line. The calculated span and calculated rise of the southern arch rib are 154.772 m and 57.706 m, respectively. Those of the northern ones are 145.951 m and 47.919 m, respectively. Furthermore, the angles between the planes of the south and north arch rib and the horizontal plane are 72° and 60°, respectively.
- Suspenders: The suspender projection is along the radial direction. There are 20 suspenders with intervals of 6 m along the arch length (see Figure 5a,b and Figure 6). The transverse double-cable system is adopted to make the cable replacement construction at the operation stage more convenient. The lengths of the suspenders range between 13.0 m and 42.0 m. The low-relaxation epoxy-coated strand and the extruded whole-bundle anchorage method are employed in the bridge.
- Abutments and Piers: The gravity abutment and the plate-type pier are adopted during the design of the abutments and piers, respectively (see Figure 5c).
- Tied-Bar Cables: There are 12 bundles of tie bar cables arranged on the bridge in total. They are divided into the south group and the north group. Each of them has six bundles. All the tied-bar cables are anchored on the anchor seat of the concrete arch rib by the steering gear, which is located at the bottom of the steel-box girder.
- Technical standard: The bridge design followed Chinese bridge design standards in general, supplemented with American Association of Highway and Transportation Officials (AASHTO) design criteria to better address the special features and requirements of this bridge. The road grade is designed to be an urban expressway, and the design speeds of the main lane and auxiliary lane are 60 km/h and 30 km/h, respectively. The design value of the vehicle load and pedestrian load are urban Level A and 3.0 kPa, respectively. The design flood level is 482.06 m (once in two centuries). The design basic wind speed is 24.5 m/s. The channel grade is VI, and the maximum navigable water level is 479.76 m. The design characteristic period of ground motion is 0.4 s and the basic seismic intensity is VII. In addition, the design reference period is 100 years and the design security level is Level I.
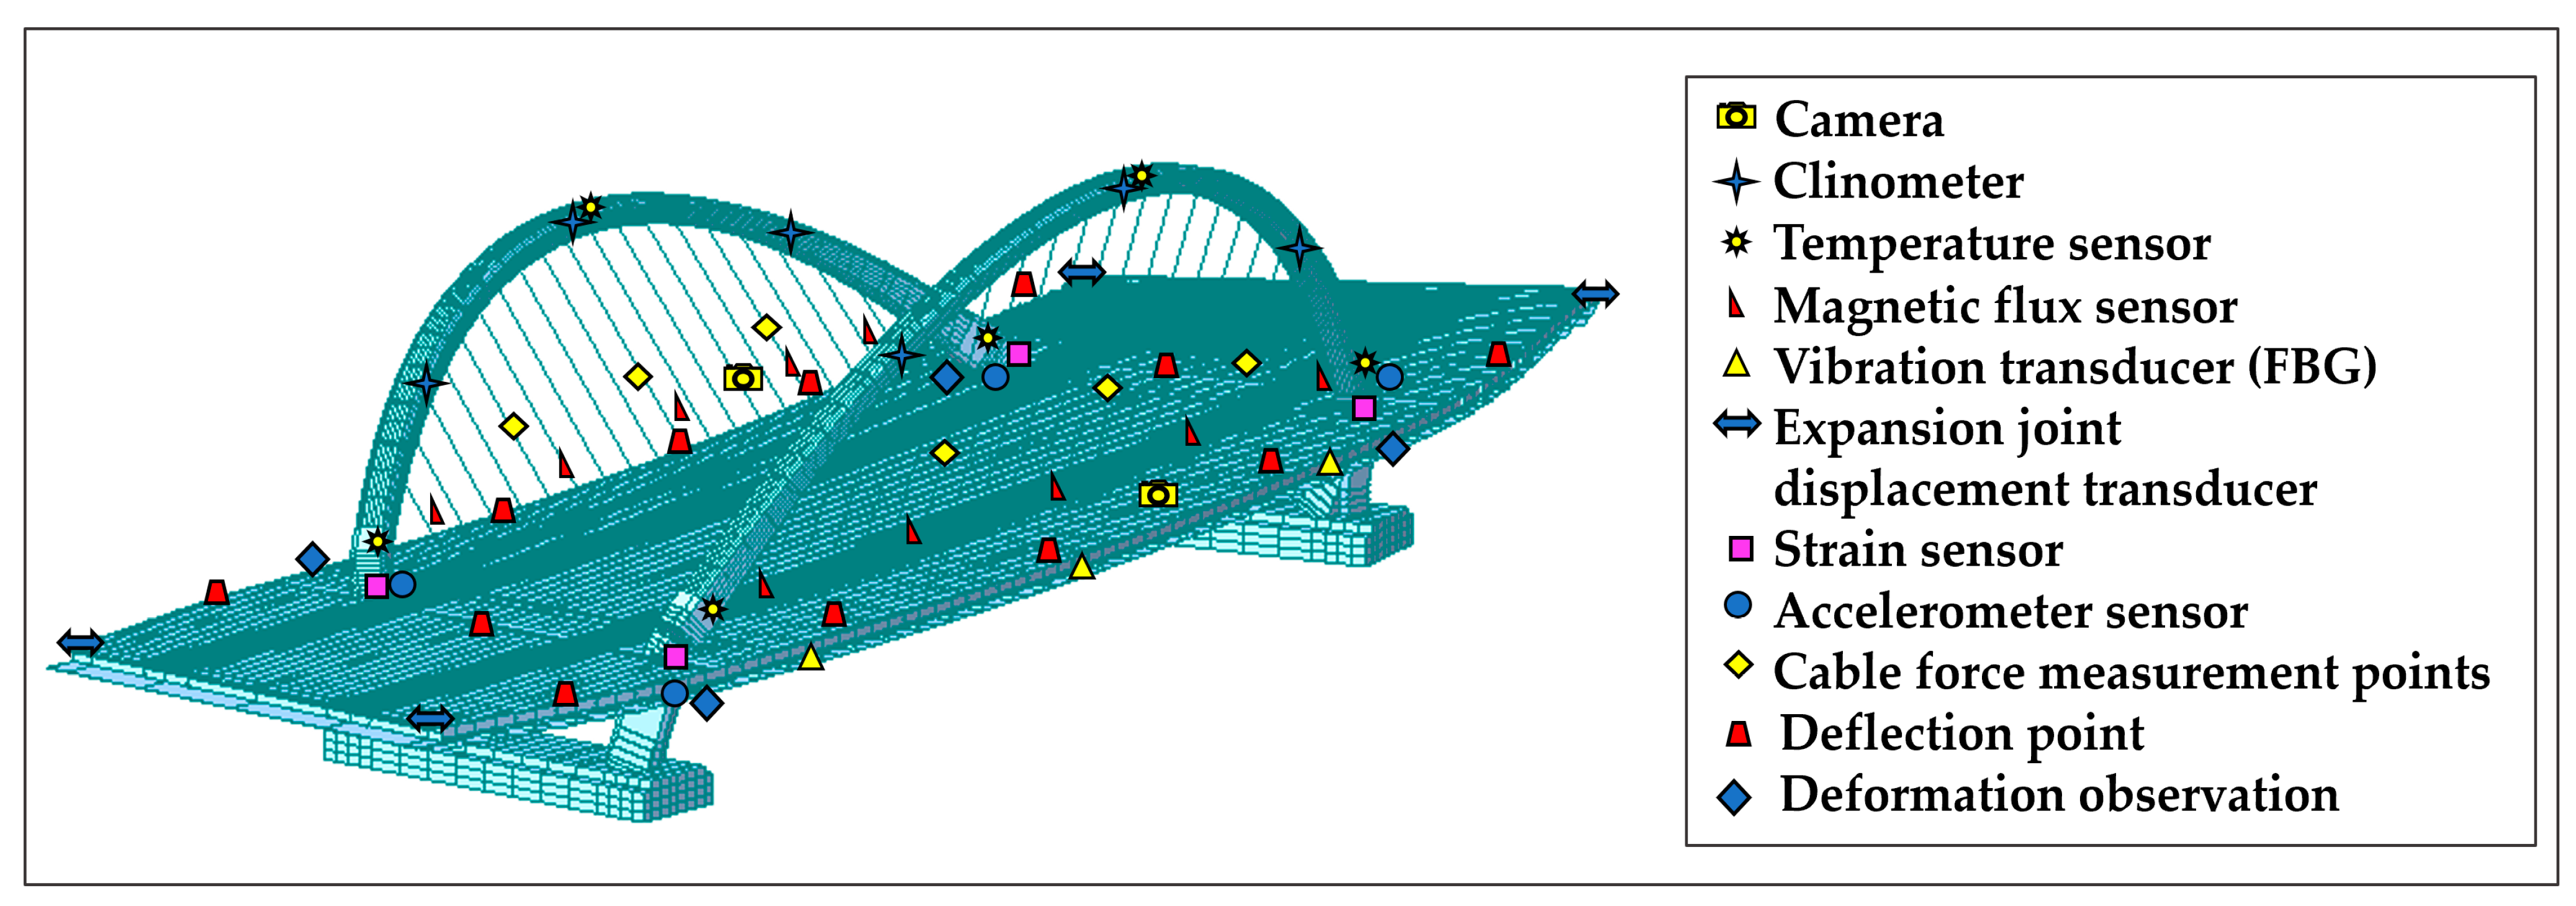
3.2. Location and Category Determining of Physical Transducers and Instruments
3.3. Integrated Design of the Structural Health Monitoring System in the Fu River Bridge
3.3.1. Data Information Acquisition and Transmission Module
3.3.2. Data Processing, Control and Database Administration Module
- Data Processing and Control: Due to the influence of various uncontrollable environmental factors, the raw monitoring data generally contain noisy ingredients, and sometimes even data leakage, fragmentation, and distortion, which is detrimental to the effective and accurate evaluation of the bridge condition. In view of this, the data cleaning method was adopted to distinguish and dispose of the raw monitoring data to obtain reliable data that could reflect the real service status of the bridge structure. In the practice of monitoring, the abnormal data mainly consist of the incredible data, empty channel data, white noise data, typical disturbed data, spiking data, repetitive data, and duplicate data. Aiming at these abnormal data, some indispensable data mending measures, such as elimination, makeup, noise immunization, smoothing, and resampling, were introduced to the monitoring data processing and control, and its flow diagram (Figure 10) is presented as follows.

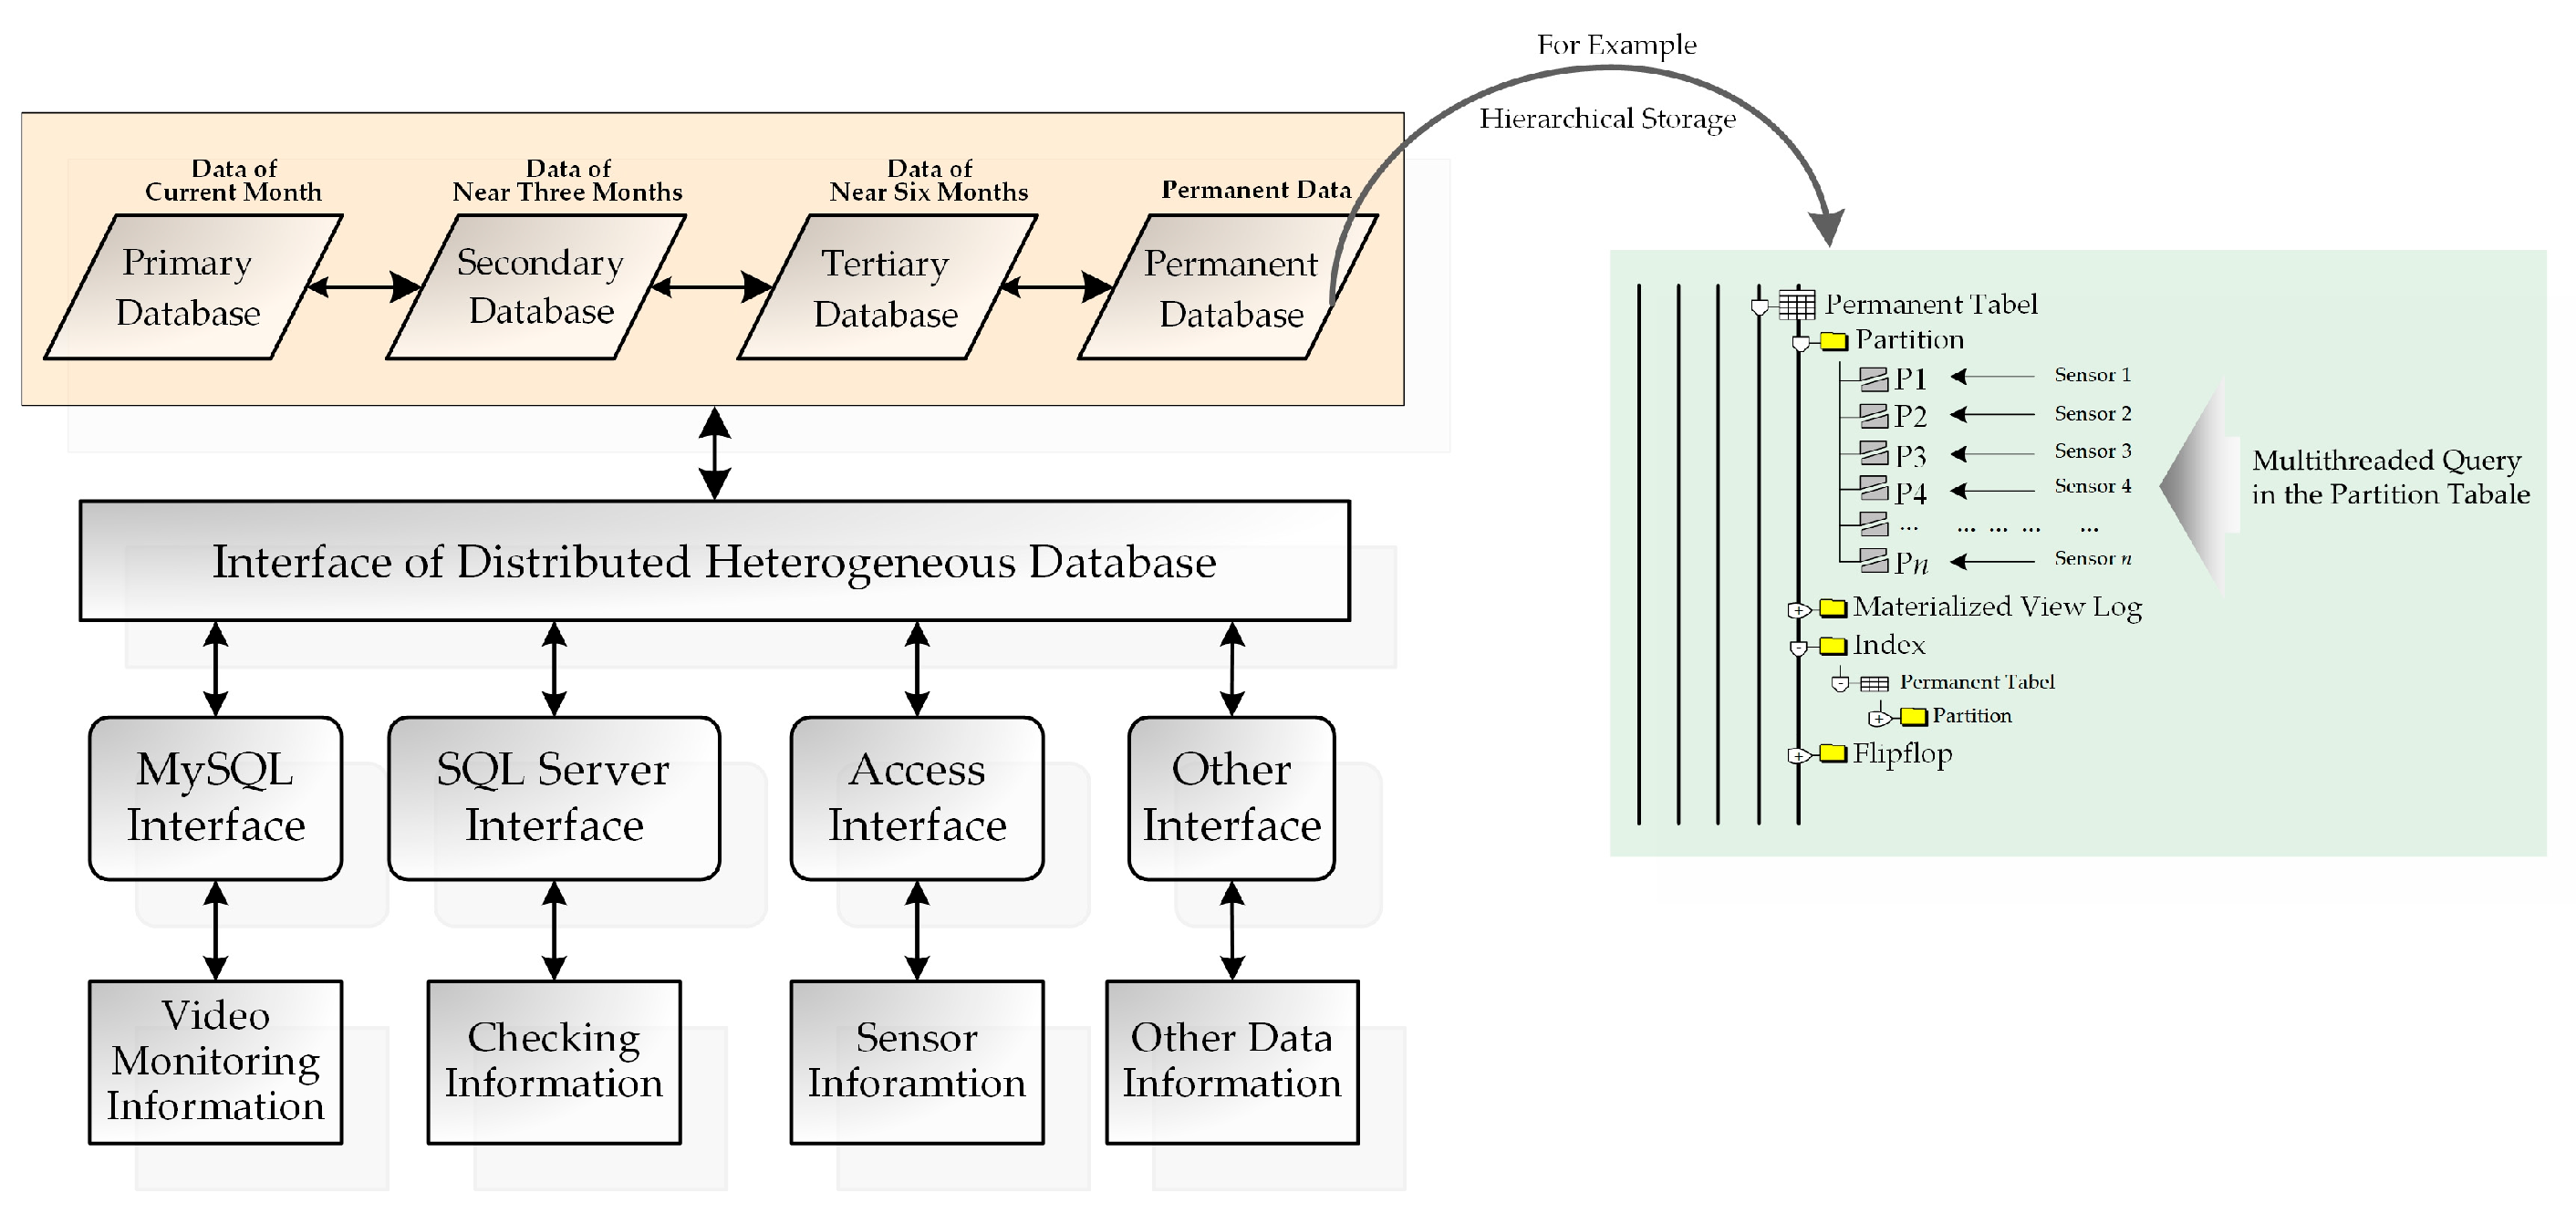
- Database Administration Module: The SHM system of the butterfly arch bridge will produce mass data through 24 h continuous online monitoring of numerous sensors. Due to diverse data sources and complex data formats, it is necessary to implement an integrated proper strategy of data reorganization before storage in the database. Therefore, seven databases are logically constructed, including the system parameter database, structural information database, raw database, processed database, structural health conditions database, suprathreshold event database, and system maintenance database. By means of modular design, the database tables could be stored on different hard disks, which will increase the access speed (Figure 11).

3.3.3. Monitoring Data Analysis and Structural Health Condition Evaluation Module
- Data Statistical Analysis: Based on the time-series data analysis, the statistical results of monitoring data, such as maximum and minimum value, mean value, mean square value, and aggregate value, will be properly stored in the database.
- Data Specific Analysis: This module consists of loads and environmental monitoring data analysis (vehicle load analysis, temperature analysis, etc.), whole structural response monitoring analysis (structural deformation analysis, beam end displacement, and acceleration analysis) as well as the local structural response monitoring analysis (strain time-history analysis, tied-bar force time-history analysis, etc.).
- Real-time Safety Prewarning: The safety prewarning system of this bridge consists of two levels: Yellow Alert and Red Alert. Yellow Alert indicates situations including a gross vehicle weight equal to or greater than the 150% of designed vehicle load, suspender, arch rib or main girder stress equal to or greater than 95% of designed stress, and displacement or deformation equal to or greater than 80% of the designed value. In the case of Yellow Alert, more focus and close observations should be implemented on the environment, loads, whole structural responses, and local structural responses. Red Alert indicates situations including a gross vehicle weight equal to or greater than 200% of designed vehicle load, suspender, arch rib or main girder stress equal to or greater than designed stress (or more than ten yellow alerts in one month), and displacement or deformation equal to or greater than 80% of the designed value (or more than ten yellow alerts in one month). In the case of Red Alert, more focus and closer observations should be implemented on the environment, loads, whole structural responses and local structural responses. And what is more, the alarm reasons need to be immediately traced, and emergency management and safety evaluation measures should be promptly taken to guarantee the safe operation of the bridge structure.
- Online Safety Evaluation: The bridge operation conditions are directly influenced by various factors, such as the design, construction technology, building materials, operation load, environment, and maintenance status, which also cause difficulty in assessing the bridge’s structural health because of the mutual interactions and effects among the above factors. In view of these facts, the fuzzy analytic hierarchy process (FAHP) is introduced to evaluate the raw data gathered from the various sensors of the SHM system. Based on the fuzzy relation synthesis, this method could realize quantification of those indicators which are hard to quantify, establish the weight vectors of different evaluation indices via building comparative judgment matrix and iterative computation, and then accomplish the quantitative calculation of various indices and the assessment of bridge health conditions. The assessment system of the butterfly arch bridge consists of the bottom index (to evaluate conditions of the foundation settlement, line shape of main girder, main girder stress, etc.), middle index (to evaluate the conditions of the substructure, main girder, arch rib, suspender and ancillary facilities) and top index (to evaluate the overall operation conditions of the bridge), in which the determination of every index weight plays a crucial role in the process of bridge condition assessment.
3.3.4. Bridge Monitoring Data Information Model Module
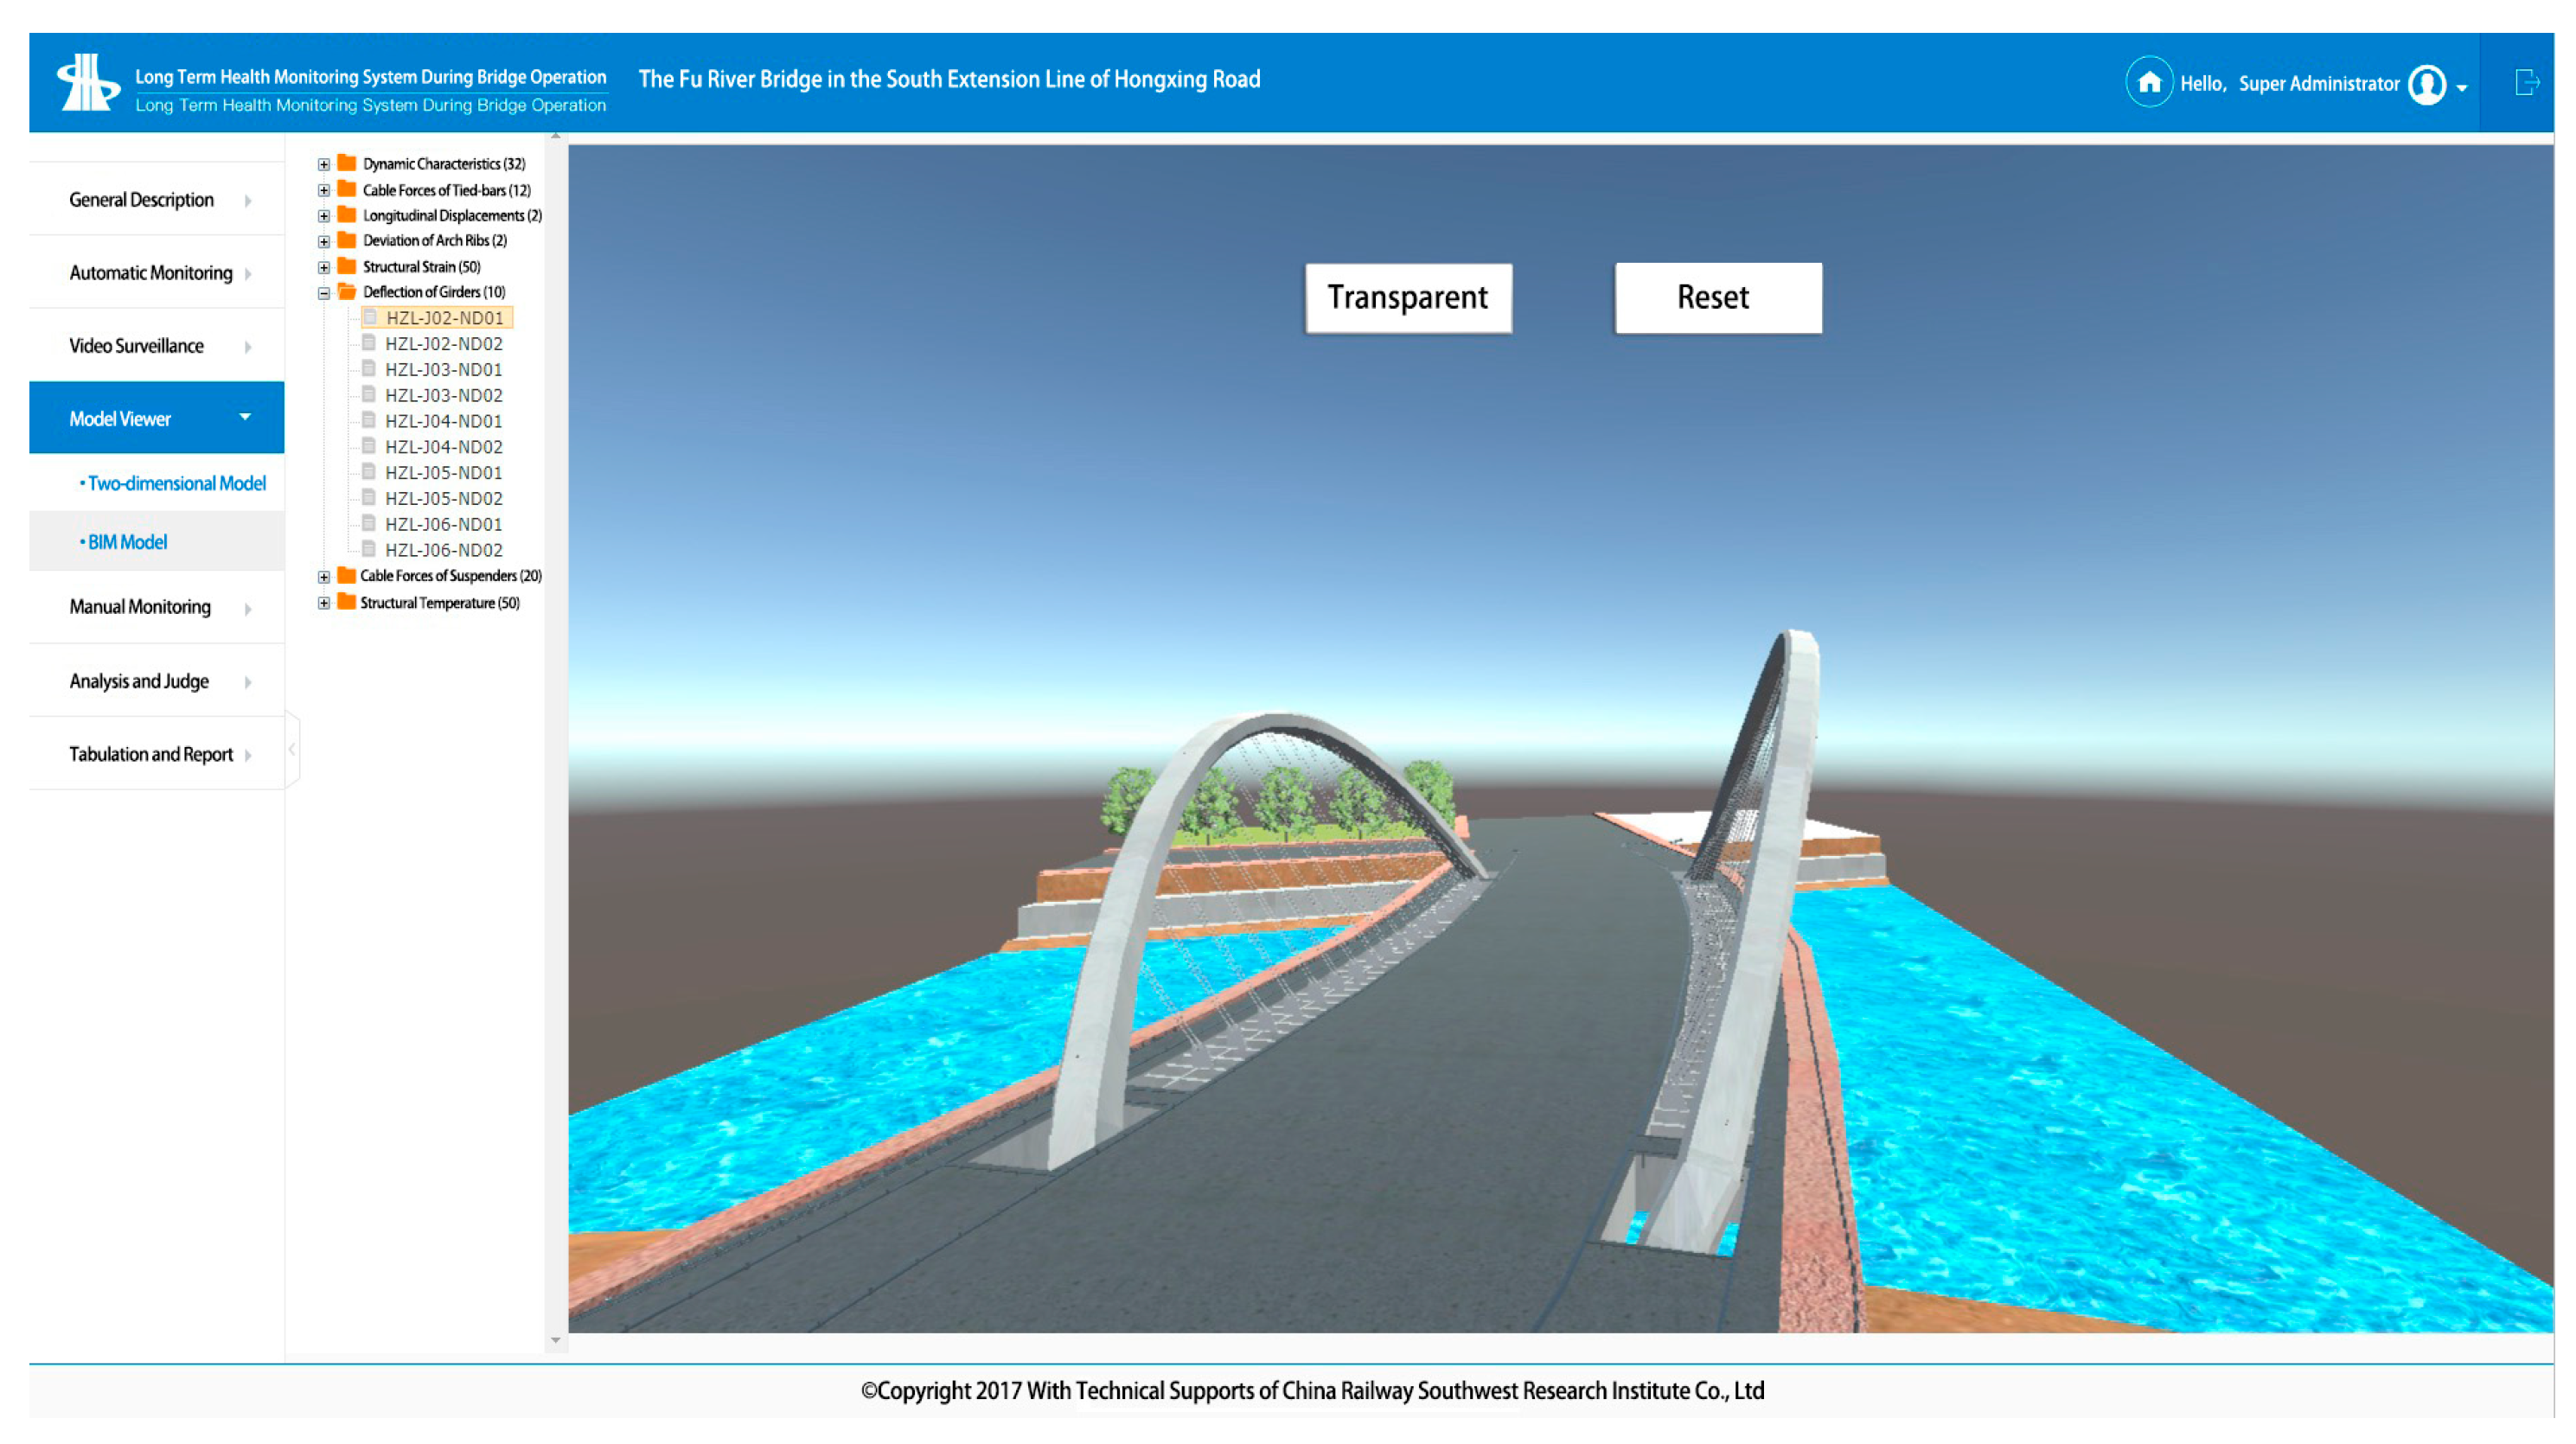
3.4. BIM Application in the SHM System of the Fu River Bridge
3.4.1. Establishment of the Bridge Skeleton
3.4.2. Parametric Design of the Modeling Template
3.4.3. Lightweight Disposal of the BIM Model
- Simplifying the Model Properties: Set the document template properties according to the actual demand of the web client side.
- Reducing the Model Resolution: Adopt low model resolution in the non-critical regions for the fast browsing of the model.
- Compressing the Normal Vector Data: Compress the normal vector data of the CATIA model.
- Constructing the Model Flows: Adopt the display mode of Model Flows, by which users could watch real-time data downloaded from the web, and those which have a large effect on the display will be preferentially downloaded and shown.
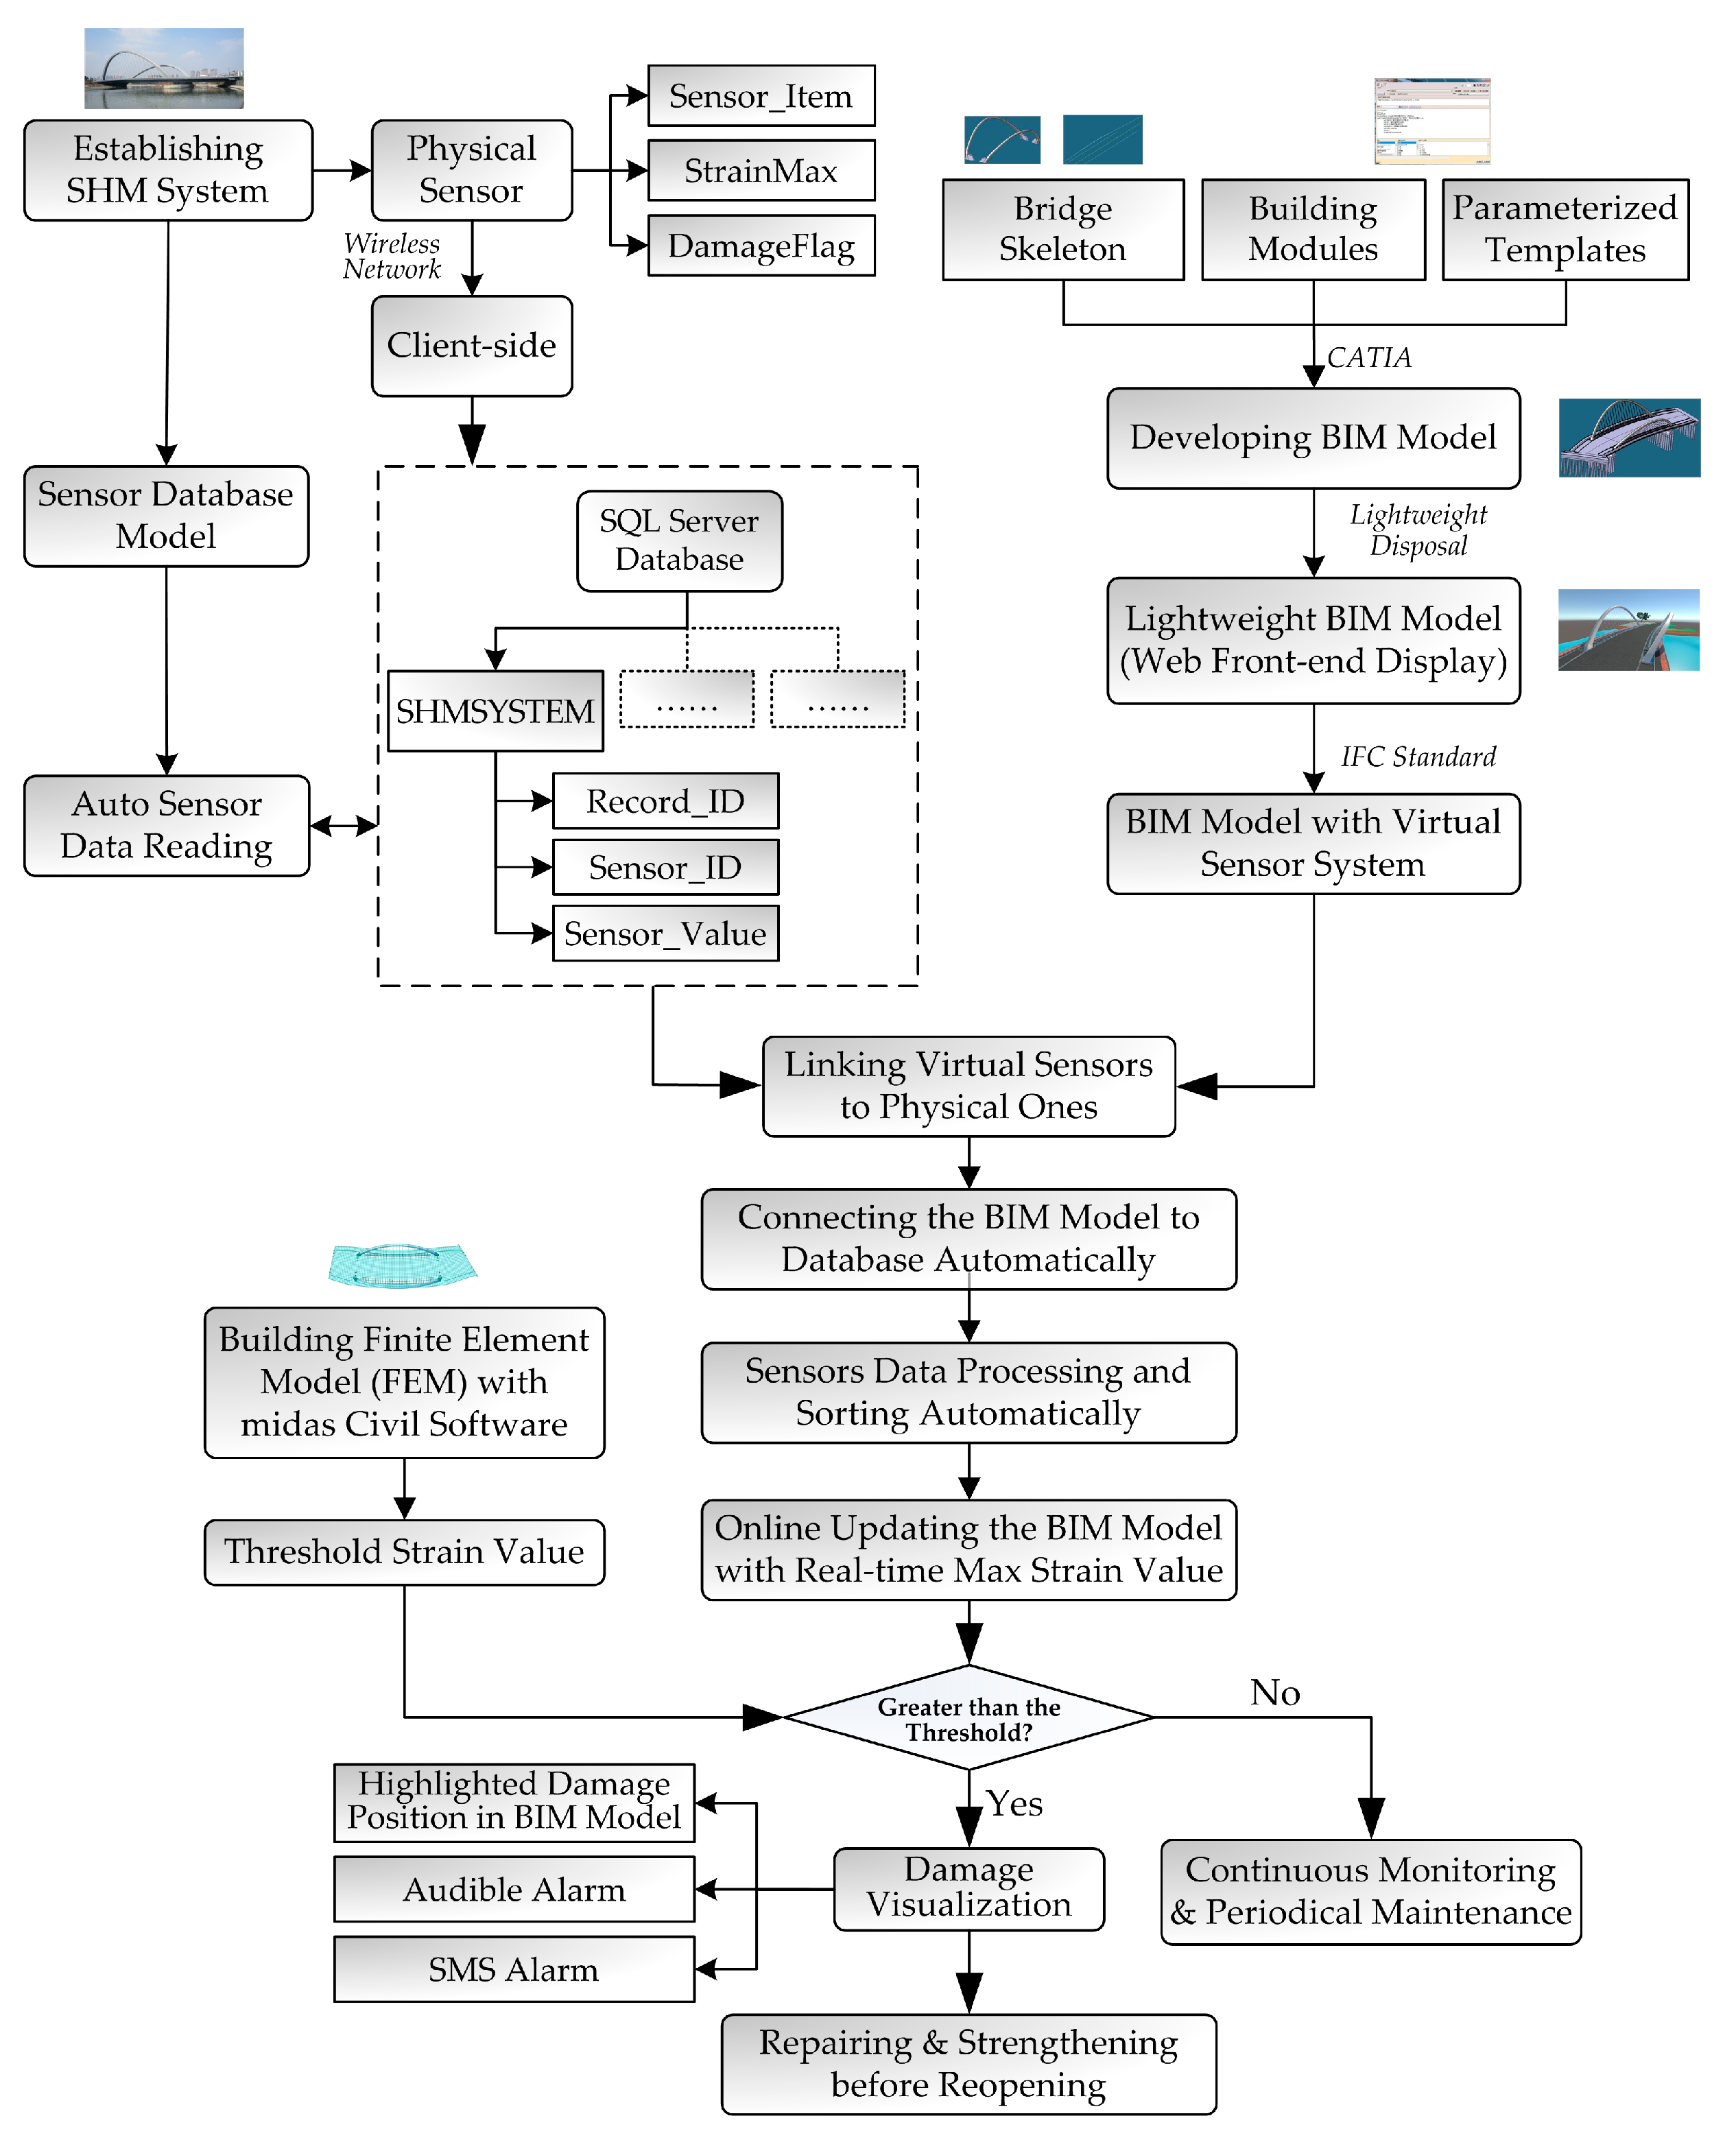
3.4.4. Interlinkage and Data Transmission Between BIM Model and SHM System
4. Monitoring Results Analysis of Butterfly Arch Bridges
4.1. Structural Operation Condition Analysis
4.1.1. Structural Condition Evaluation Under Dead Loads
4.1.2. Structural Dynamic Performance Evaluation Under Live Loads
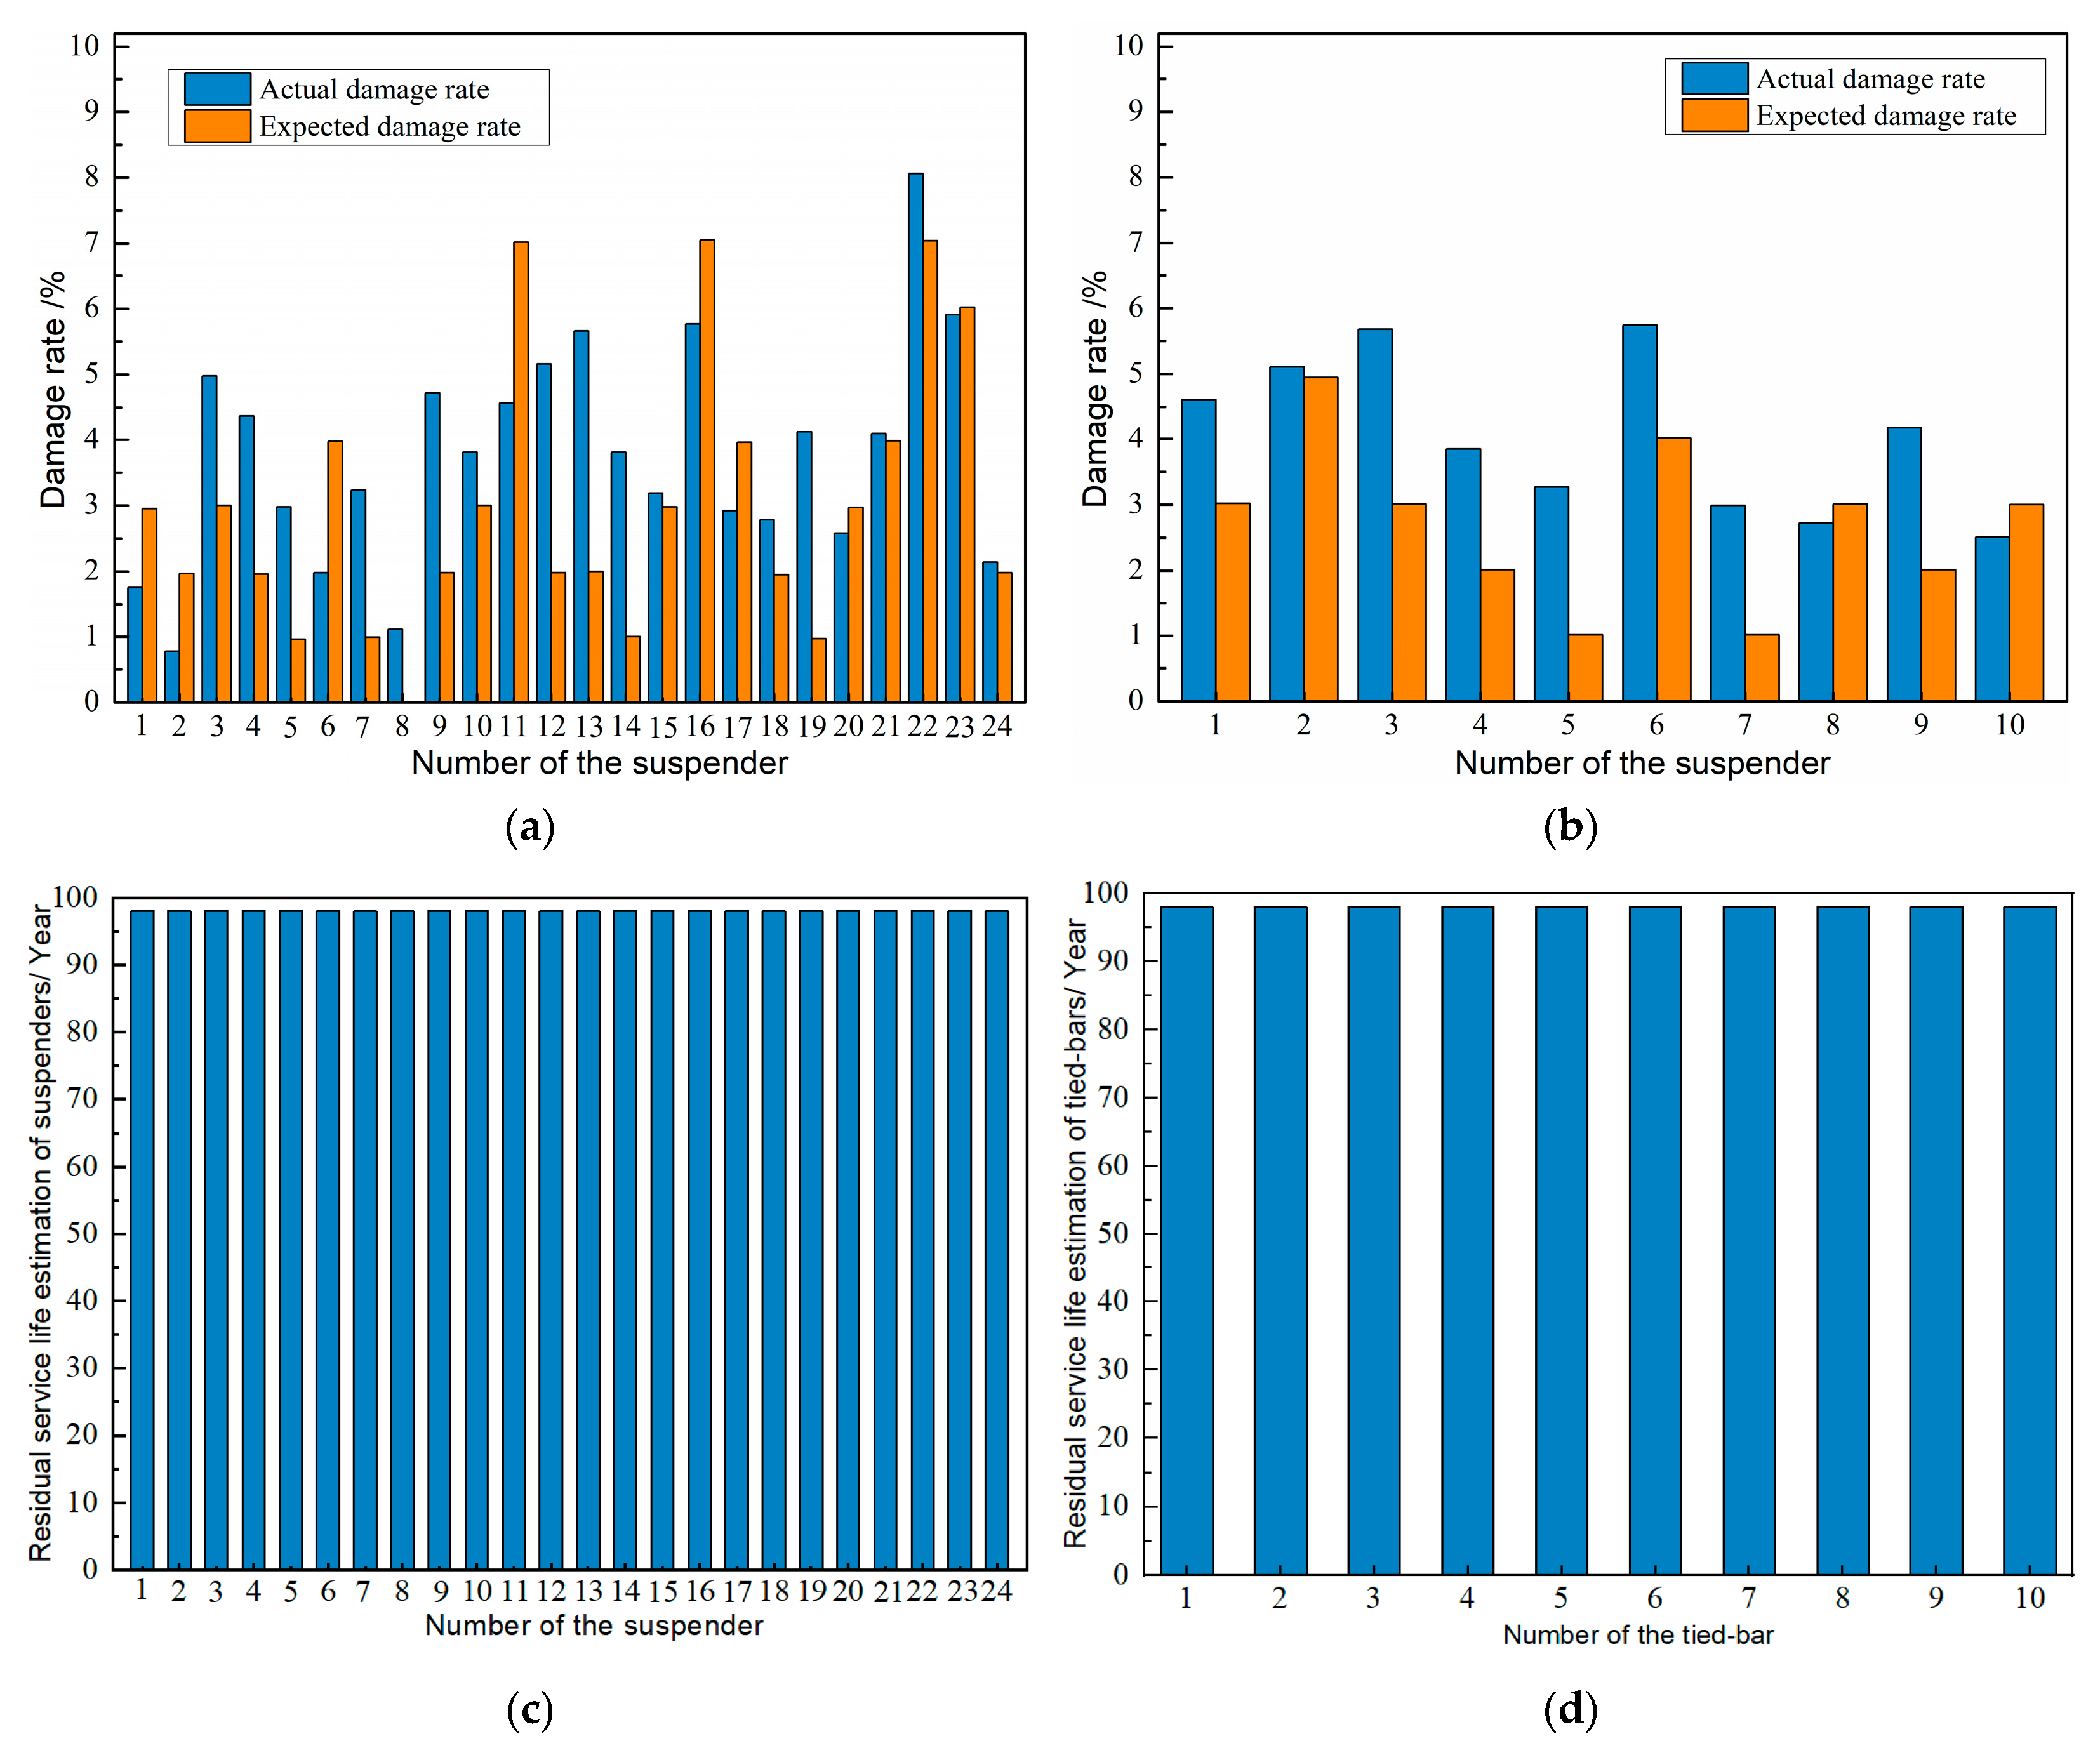
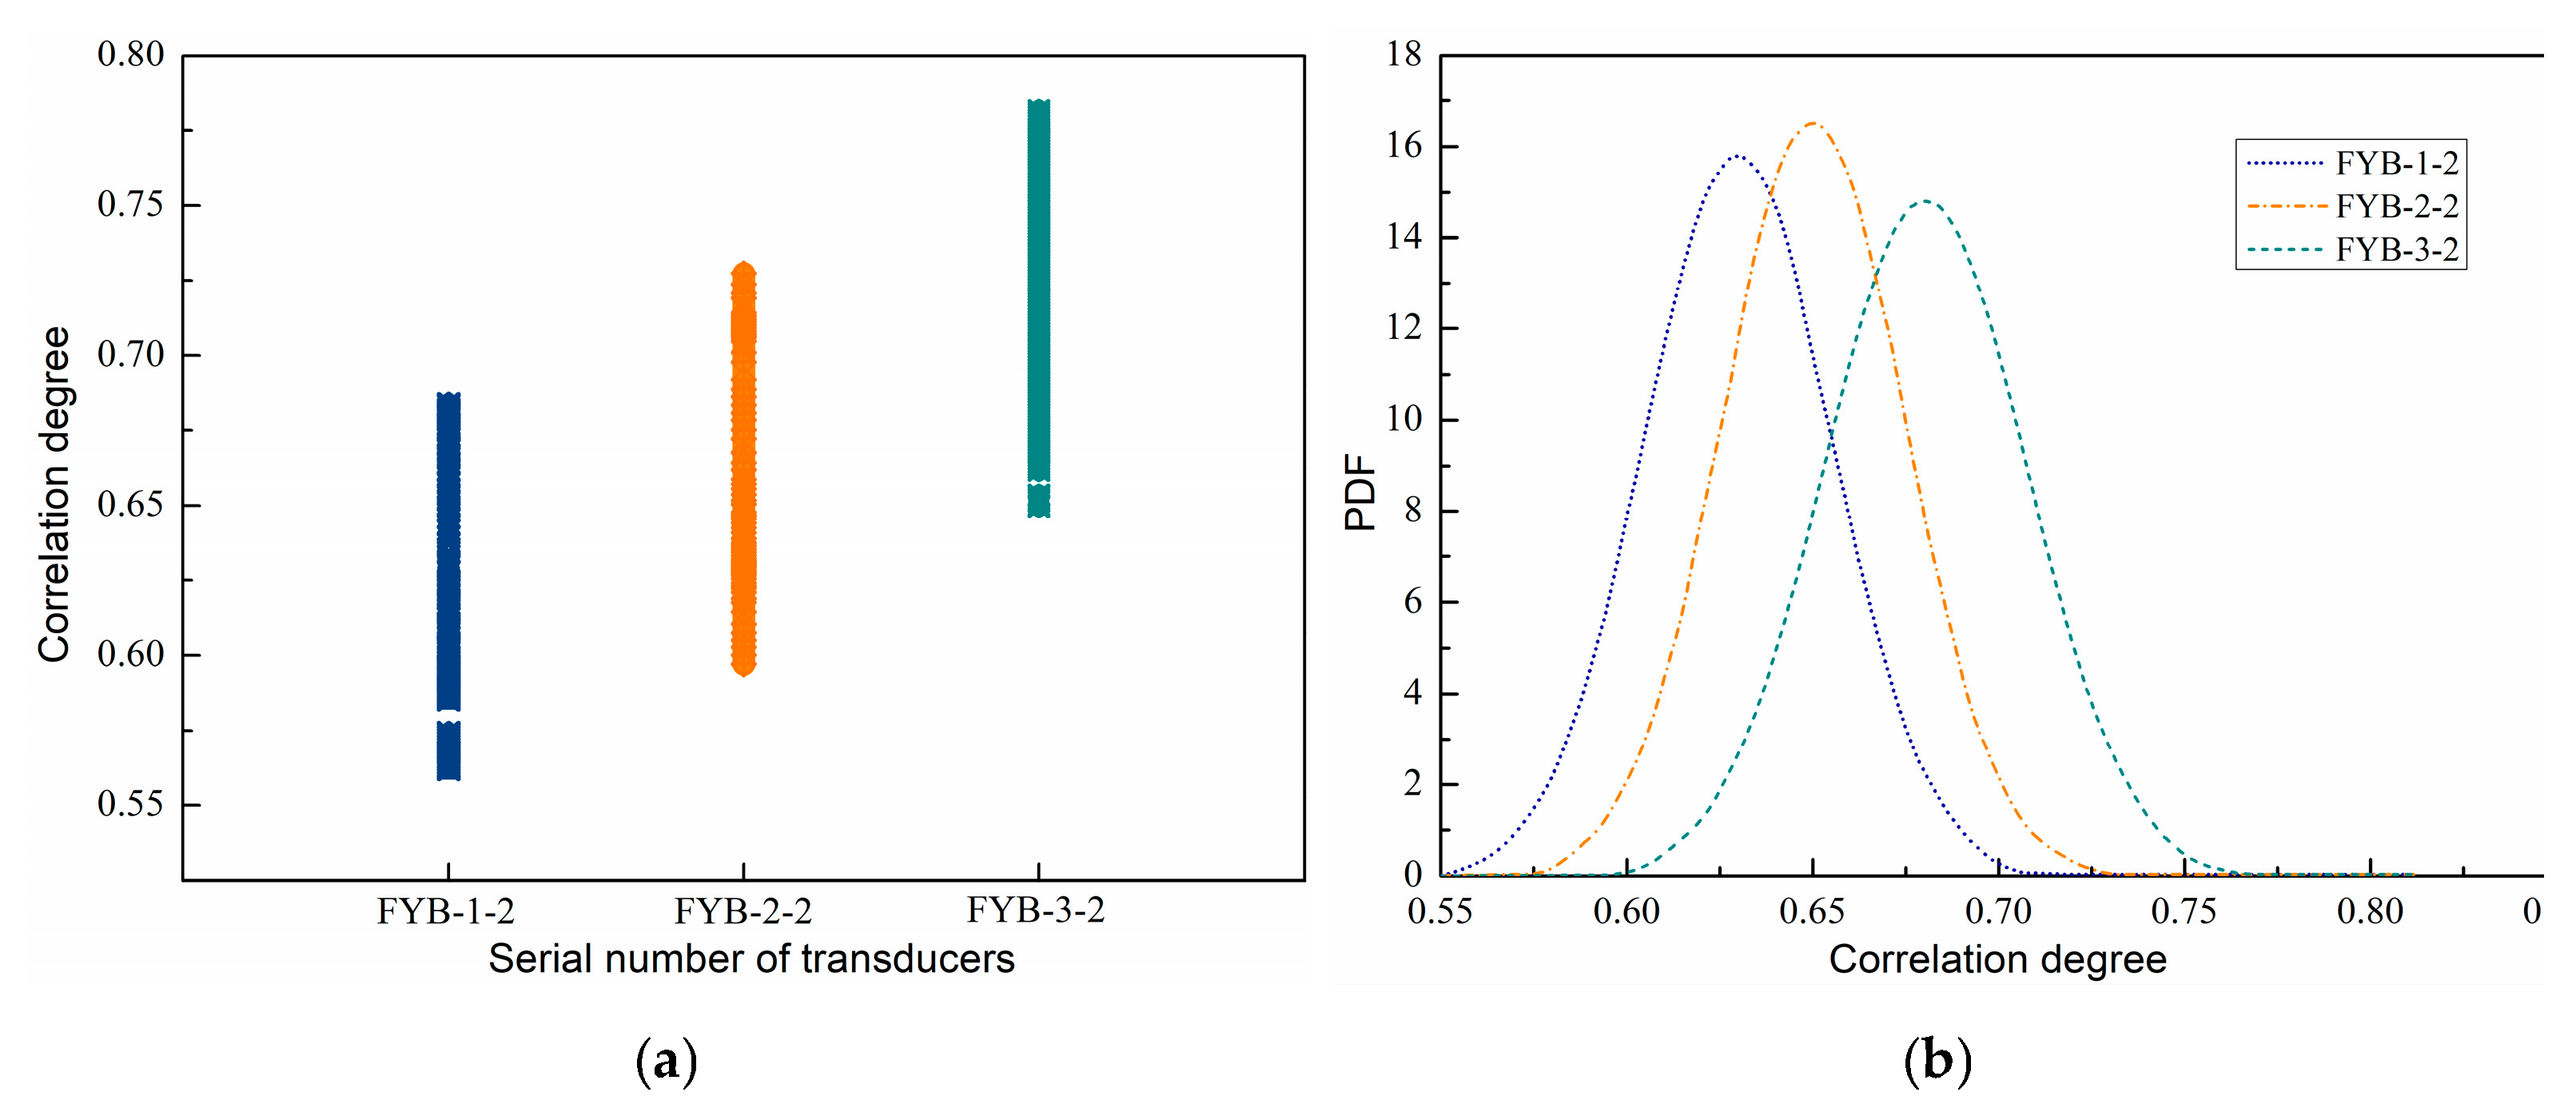
4.1.3. Fatigue Damage Estimation Analysis of the Suspender and Tied-Bar
4.2. Performance Evaluation of the BIM-Based SHM System
5. Challenges and Development Trends of BIM-Based SHM Systems for Long-Span Bridges
- The applications of BIM-based model establishment software remain immature. The construction of 3D and nD BIM models is mainly accomplished by means of 2D patterning imported into the BIM-related software, which always brings about the trouble of building conflict and format conversion problems. The entire process of the BIM model construction must be accomplished using a variety of software with a great deal of operation time and money. Furthermore, the evaluation of LoD (Levels of Detail) must be executed before model construction, which therefore requires more time, cost and staff.
- With regard to BIM application in long-span bridge SHM systems, there are still some obstacles or even resistance from quite a few project construction companies, contractor companies and maintenance companies. Most of them reckon that the introduction of BIM will lead to a reduction in work efficiency and productivity, and they also believe that the BIM will push them to spend more money and time on staff training, change their software use habits, and that BIM application in BIM is too arduous to make a stable return against its cost.
- The long-term real-time monitoring of long-span bridges in the BIM environment will still produce massive data, though some lightweight disposals are being explored and tried. Furthermore, during the data transmission and remote access to BIM models among different stakeholders through the internet, cybersecurity also poses a real challenge; it could become a serious concern considering the possibility of online unauthorized access and copyright infringement.
- A lack of standards and technical hurdles still exist in the implementation of BIM-based SHM systems. In the absence of uniform standards, new “isolated islands of information” will arise and cause the severe loss of information resources. BIM users in the SHM field may only use the BIM technology in pilot projects instead of applying BIM widely to achieve a ‘scale of economy’ under these circumstances. Furthermore, BIM users may unavoidably have to undertake extra R&D to develop the codes or standards from scratch, such as the relevant standards regarding how BIM and SHM evaluation can cooperate together, which cannot possibly be shared across the entire industry.
- Legal and contractual issues, associated with long-span BIM-based SHM system implementation, will be experienced during the pursuit of seamless collaboration between all stakeholders, which could obfuscate the responsibility level amongst individual stakeholders and their liability assignment. Furthermore, BIM application in long-span bridge SHM systems will also be affected by cultural challenges, such as different understandings of BIM programs and applications, especially for trans-provincial or transnational bridge projects.
6. Conclusions
- Based on spatial mechanical calculations and monitoring requirement analysis of the butterfly arch bridge, a comprehensive and feasible SHM system, including pivotal modules (such as Data Acquisition and Transmission Module, Data Process and Control Module, Data Analysis and Evaluation Module, etc.), could be built.
- As for the established BIM model, the utilization of lightweight disposal methods (such as simplifying the model properties, reducing the model resolution, compressing the normal vector data, etc.) could solve the problem of slow data access, poor display effects and inefficient and ineffective information sharing, and then promote the integrated management level of the BIM-based structural health monitoring system.
- The design of the specific databases is accomplished in the SQL Server environment to store and update the monitoring data collected from the physical sensors in the SHM system, to which the user-defined virtual sensor parameters in the BIM model could be correspondingly linked. Thus, real-time maximum values in the BIM environment could be automatically updated, and the damage location could be visualized exactly when safety alerts occur.
- The research results show that the overweight /oversize vehicle incident did not cause irreversible damage to this bridge. The bridge whole stiffness, internal force distribution and material properties do not vary noticeably. Furthermore, the structural responses under live loads do not exceed design threshold values, and the whole dynamic performances of the bridge are good. Moreover, induced fatigue damage of the suspenders and tied-bars are not present, and measuring results show that the BIM-based SHM system is valid and efficient in visualized assessment and early warning.
- The challenges of BIM technologies in long-span bridges, such as the immature establishing software, unstable return against its cost, massive data production, lack of standards, legal issues and so on, are systematically summarized. Meanwhile, some representative developing trends and important BIM-based techniques, which need to be developed and further explored, are discussed and investigated.
Author Contributions
Funding
Data Availability Statement
Conflicts of Interest
References
- He, X.H.; Wu, T.; Zou, Y.F.; Chen, Y.F.; Guo, H.; Yu, Z.W. Recent developments of high-speed railway bridges in China. Struct. Infrastruct. Eng. 2017, 13, 1584–1595. [Google Scholar] [CrossRef]
- Chu, X.; Cui, W.; Zhao, L.; Cao, S.; Ge, Y. Probabilistic flutter analysis of a long-span bridge in typhoon-prone regions considering climate change and structural deterioration. J. Wind Eng. Ind. Aerod. 2021, 215, 104701. [Google Scholar] [CrossRef]
- Pang, Y.T.; Wei, K.; Yuan, W.C. Life-cycle seismic resilience assessment of highway bridges with fiber- reinforced concrete piers in the corrosive environment. Eng. Struct. 2020, 222, 111120. [Google Scholar] [CrossRef]
- Liu, W.S.; Dai, G.L.; Yu, Z.W.; Chen, Y.F.; He, X.H. Interaction between continuous welded rail and long-span steel truss arch bridge of a high-speed railway under seismic action. Struct. Infrastruct. Eng. 2018, 14, 1051–1064. [Google Scholar] [CrossRef]
- Fan, W.; Zhong, Z.W.; Wang, J.J.; Xia, Y. Vessel-bridge Collisions: Accidents, Analysis, and Protection. China J. Highw. Transp. 2024, 37, 38–66. [Google Scholar]
- Chen, L.K.; Qin, H.X.; Jiang, L.Z.; Xu, L. A near fault vertical scenario earthquakes based generic simulation framework for elastoplastic seismic analysis of light rail vehicle viaduct system. Vehicle Syst. Dyn. 2020, 58, 181–207. [Google Scholar] [CrossRef]
- Hou, W.; Zhang, G.; He, S.H. Fire resistance tests on prestressed concrete box girder with intumescent fire-retardant coatings. Fire Technol. 2021, 58, 107–131. [Google Scholar] [CrossRef]
- Feldman, B.J. The Collapse of the I-35W Bridge in Minneapolis. Phys. Teach. 2010, 48, 541–542. [Google Scholar] [CrossRef]
- Lu, Y.E.; Zhang, L.M. Progressive collapse of a drilled-shaft bridge foundation under vessel impact. Ocean Eng. 2013, 66, 101–112. [Google Scholar] [CrossRef]
- Wang, J.J.; Wang, W. Estimation of vessel-bridge collision probability for complex navigation channels. J. Bridge Eng. 2015, 20, 608–614. [Google Scholar] [CrossRef]
- Emily Pollock. Italy’s Morandi Bridge Collapse—Why Do We Know? Available online: https://www.engineering.com/italys-morandi-bridge-collapse-what-do-we-know/ (accessed on 23 August 2018).
- Zhou, J.T.; Li, X.G.; Xia, R.C.; Yang, J.; Zhang, H. Health monitoring and evaluation of long-span bridges based on sensing and data analysis: A survey. Sensors 2017, 17, 603. [Google Scholar] [CrossRef] [PubMed]
- Ye, X.W.; Su, Y.H.; Xi, P.S. Statistical analysis of stress signals from bridge monitoring by FBG system. Sensors 2018, 18, 491. [Google Scholar] [CrossRef] [PubMed]
- Yi, T.H.; Li, H.N.; Gu, M. Clustering number determination for sparse component analysis during output-only modal identification. J. Eng. Mech-ASCE 2019, 145, 04018122. [Google Scholar] [CrossRef]
- Deng, L.; Yan, W.; Li, S. Computer Modeling and Weight Limit Analysis for Bridge Structure Fatigue Using OpenSEES. J. Bridge Eng. 2019, 24, 4019081. [Google Scholar] [CrossRef]
- Mario, S.; Ana, S.; Pablo, R.; Carlos, P.; Pedro, A.; Belén, R. Review of Laser Scanning Technologies and Their Applications for Road and Railway Infrastructure Monitoring. Infrastructure 2019, 4, 58. [Google Scholar]
- Sloan, T.D.; Thompson, A.; Kirkpatrick, J.; Boyd, J.W. Monitoring the Inservice Behaviour of the Foyle Bridge. Struct. Eng. 1992, 70, 130–134. [Google Scholar]
- Catbas, F.N.; Grimmelsman, K.A.; Aktan, A.E. Structural identification of Commodore Barry Bridge. In Nondestructive Evaluation of Highways, Utilities, and Pipelines IV; SPIE: Bellingham, WA, USA, 2000; Volume 3995. [Google Scholar]
- Butcher, A.M.; Newhook, J.P. Long-Term Monitoring of the Confederation Bridge. In Proceedings of the 4th International Conference on Structural Health Monitoring of Intelligent Infrastructure (SHMII-4), Zurich, Switzerland, 22–24 July 2009. [Google Scholar]
- Jang, S.; Jo, H.; Cho, S.; Mechitov, K.; Rice, J.A.; Sim, S.-H.; Jung, H.-J.; Yun, C.-B.; Spencer, B.F., Jr.; Agha, G. Structural health monitoring of a cable stayed bridge using smart sensor technology: Deployment and evaluation. Smart. Struct. Syst. 2010, 6, 439–459. [Google Scholar] [CrossRef]
- Xia, Y.; Chen, B.; Zhou, X.Q.; Xu, Y.L. Field monitoring and numerical analysis of Tsing Ma Suspension Bridge temperature behavior. Struct. Control Health Monit. 2013, 20, 560–575. [Google Scholar] [CrossRef]
- Rainieri, C.; Fabbrocino, G. Development and validation of an automated operational modal analysis algorithm for vibration-based monitoring and tensile load estimation. Mech. Syst. Signal Proc. 2015, 60, 512–534. [Google Scholar] [CrossRef]
- Zhou, G.D.; Yi, T.H. Recent developments on wireless sensor networks technology for bridge health monitoring. Math. Probl. Eng. 2013, 2013, 947867. [Google Scholar] [CrossRef]
- He, X.; Qin, H.; Tao, T.Y.; Liu, W.S.; Wang, H. Measurement of Non-Stationary Characteristics of a Landfall Typhoon at the Jiangyin Bridge Site. Sensors 2017, 17, 2186. [Google Scholar] [CrossRef] [PubMed]
- Ding, Y.; An, Y.; Wang, C. Field monitoring of the train-induced hanger vibration in a high-speed railway steel arch bridge. Smart Struct. Syst. 2016, 17, 1107–1127. [Google Scholar] [CrossRef]
- Wang, H.; Tao, T.; Li, A.; Zhang, Y. Structural health monitoring system for sutong cable-stayed bridge. Smart Struct. Syst. 2016, 18, 317–334. [Google Scholar] [CrossRef]
- He, X.H.; Shi, K.; Wu, T. An integrated structural health monitoring system for the Xijiang high-speed railway arch bridge. Smart Struct. Syst. 2018, 21, 611–621. [Google Scholar]
- Shi, Z.; Ji, F.; Yang, S.L.; Lv, D.C. Research on Risk Assessment during the Construction Phase of Wufengshan Yangtze River Bridge. Railw. Stand. Des. 2020, 64, 71–78. [Google Scholar]
- Sun, Z.; Santos, J.; Caetano, E. Data-driven prediction and interpretation of fatigue damage in a road-rail suspension bridge considering multiple loads. Struct. Control Health Monit. 2022, 29, e2997. [Google Scholar] [CrossRef]
- Ding, Y.; Ye, X.W.; Guo, Y. Data set from wind, temperature, humidity and cable acceleration monitoring of the Jiashao bridge. J. Civ. Struct. Health 2023, 13, 579–589. [Google Scholar] [CrossRef]
- Du, Q.; Li, D.D.; Jie, Z. Research on Health Status Assessment Method of Long span Bridges Based on Monitoring Data Analysis. Sci. Technol. Innov. 2023, 153–156. [Google Scholar] [CrossRef]
- Cetindemir, O.; Zuelfikar, A.C.; Apaydin, N.M. Dynamic Modal Identification of a Long-Span Suspension Bridge Using Measured Acceleration Data during a Storm. J. Struct. Eng. 2023, 149, 05023004. [Google Scholar] [CrossRef]
- Li, H.N.; Li, D.S.; Ren, L.; Yi, T.H.; Jia, Z.G.; Li, K.P. Structural health monitoring of innovative civil engineering structures in mainland China. Struct. Monit. Maint. 2016, 3, 1–32. [Google Scholar] [CrossRef]
- Michael, T.; Kay, S. IFC Monitor—An IFC schema extension for modeling structural health monitoring systems. Adv. Eng. Inform. 2018, 37, 54–65. [Google Scholar]
- Rafael Sacks, R.; Eastman, C.; Lee, G.; Teicholz, P. BIM Handbook: A Guide to Building Information Modeling for Owners, Designers, Engineers, Contractors, and Facility Managers, 3rd ed.; John Wiley & Sons, Inc.: Hoboken, NJ, USA, 2018; pp. 18–31. [Google Scholar]
- Seam, A.; Zheng, T.; Lu, Y.; Usmani, A.; Laurenson, D. BIM integrated workflow management and monitoring system for modular buildings. Int. J. 3-D Inf. Model. IJ3DIM 2013, 2, 17–28. [Google Scholar] [CrossRef]
- Rio, J.; Ferreira, B.; Pocas-Martins, J. Expansion of IFC Model with Structural Sensors. Inf. Constr. 2013, 65, 219–228. [Google Scholar] [CrossRef]
- Sternal, M.; Dragos, M. BIM-Based modeling of structural health monitoring systems using the IFC standard. In Proceedings of the 28th Forum Bauinformatik, Hanover, Germany, 19–21 September 2016; Leibniz Universität Hannover: Hanover, Germany, 2016. [Google Scholar]
- Smarsly, K.; Tauscher, E. Monitoring information modeling for semantic mapping of structural health monitoring systems. In Proceedings of the 16th International Conference on Computing in Civil and Building Engineering, Osaka, Japan, 6–8 July 2016; ICCCBE2016 Organizing Committee: Osaka, Japan, 2016. [Google Scholar]
- Wang, J.; Fu, Y.; Yang, X. An integrated system for building structural health monitoring and early warning based on an Internet of things approach. Int. J. Distrib. Sens. Netw. 2017, 13, 1–14. [Google Scholar] [CrossRef]
- Del Grosso, A.; Basso, P.; Ruffini, L.; Figini, F.; Cademartori, M. Infrastructure management integrating SHM and BIM procedures. In Proceedings of the SMAR 2017-4th Conference on Smart Monitoring Assessment and Rehabilitation of Civil Structures, Zurich, Switzerland, 13–15 September 2017; Istanbul Technical University: Istanbul, Turkey, 2017. [Google Scholar]
- Valinejadshoubi, M.; Bagchi, A.; Moselhi, O. Identifying at-risk non-structural elements in buildings using BIM: A case study application. J. Earthq. Eng. 2018, 24, 869–880. [Google Scholar] [CrossRef]
- Valinejadshoubi, M.; Bagchi, A.; Moselhi, O. Development of a BIM-Based Data Management System for Structural Health Monitoring with Application to Modular Buildings: Case Study. J. Comput. Civil Eng. 2019, 33, 05019003. [Google Scholar] [CrossRef]
- Shim, C.S.; Yun, N.R.; Song, H.H. Application of 3D bridge information modeling to design and construction of bridges. Procedia Eng. 2011, 14, 95–99. [Google Scholar] [CrossRef]
- Marzouk, M.M.; Hisham, M. Bridge information modeling in sustainable bridge management. In Proceedings of the ICSDC 2011: Integrating Sustainability Practices in the Construction Industry, Kansas City, MO, USA, 23–25 March 2011. [Google Scholar]
- Fanning, B. Impacts and Benefits of Implementing BIM on Bridge and Infrastructure Projects. Master’s Thesis, Colorado State University, Fort Collins, CO, USA, 2014. [Google Scholar]
- Chan, B.; Guan, H.; Hou, L.; Jo, J.; Blumenstein, M.; Wang, J. Defining a conceptual framework for the integration of modeling and advanced imaging for improving the reliability and efficiency of bridge assessments. J. Civ. Struct. Health 2016, 6, 703–714. [Google Scholar] [CrossRef]
- McGuire, B.M. Using Building Information Modeling to Track and Assess the Structural Condition of Bridges. Master’s Thesis, Colorado State University, Fort Collins, CO, USA, 2014. [Google Scholar]
- Delgado, J.M.D.; Brilakis, I.; Middleton, C. Modelling, management, and visualization of structural performance monitoring data on BIM. In Transforming the Future of Infrastructure through Smarter Information, Proceedings of the International Conference on Smart Infrastructure and Construction, Cambridge, UK, 27–29 June 2016; ICE Publishing: New York, NY, USA, 2016; pp. 543–549. [Google Scholar]
- Delgado, J.M.D.; Butler, L.J.; Gibbons, N.; Brilakis, I.; Elshafie, M.; Middleton, C. Management of structural monitoring data of bridges using BIM. Proc. Inst. Civ. Eng.-Bridge Eng. 2016, 170, 204–218. [Google Scholar] [CrossRef]
- Banfia, F.; Barazzettia, L.; Previtali, M.; Roncoronib, F. Historic BIM: A new repository for structural health monitoring. Int. Arch. Photogramm. Remote Sens. Spat. Inf. Sci. 2017, XLII-5/W1, 269–274. [Google Scholar]
- Boddupalli, C.; Sadhu, A.; Azar, E.R.; Pattyson, S. Improved visualization of infrastructure monitoring data using building information modeling. Struct. Infrastruct. Eng. 2019, 15, 1247–1263. [Google Scholar] [CrossRef]
- Moreira; José, C.F. Project for a Road Bridge Between the Cities of Porto and Gaia. Master’s Thesis, Universidade do Porto, Porto, Portugal, 2012. [Google Scholar]
- Dimelow, M.T. Temporary Uses, Critical Praxis and Urban Water Spaces: A Case Study. Ph.D. Thesis, The University of Manchester, Manchester, UK, 2023. [Google Scholar]
- Xu, Q. Construction Monitoring and Control of Tied Arch Bridge with Asymmetrical Arch Ribs. Master’s Thesis, Tianjin University, Tianjin, China, 2008. [Google Scholar]
- Cheng, K.M.; Ketchum, M.A.; Drouillard, F. Nanning butterfly tied arch bridge over the Yong River in China. Struct. Eng. Int. 2010, 20, 308–311. [Google Scholar] [CrossRef]
- Thomson, C.; Boehm, J. Automatic Geometry Generation from Point Clouds for BIM. Remote Sens. 2015, 7, 11753–11775. [Google Scholar] [CrossRef]
- Zou, Y.; Kiviniemi, A.; Stephen, W.J. Developing a tailored RBS linking to BIM for risk management of bridge projects. Eng. Constr. Archit Ma. 2016, 23, 727–750. [Google Scholar] [CrossRef]
- Xue, F.; Lu, W.S.; Chen, K.; Webster, C.J. BIM reconstruction from 3D point clouds: A semantic registration approach based on multimodal optimization and architectural design knowledge. Adv. Eng. Inform. 2019, 42, 100965. [Google Scholar] [CrossRef]
- Zheng, L.; Lu, W.S.; Chen, K.; Chau, W.K. Benefit sharing for BIM implementation: Tackling the moral hazard dilemma in inter-firm cooperation. Int. J. Proj. Manag. 2017, 35, 393–405. [Google Scholar] [CrossRef]


| Sensor Type | Sensor Specification | Quantity | |
|---|---|---|---|
Fiber Bragg grating (FBG) vibration transducer ( ) ) |  |
| 20 |
FBG clinometer ( ) ) |  |
| 2 |
Expansion joint displacement transducer ( ) ) |  |
| 2 |
FBG strain sensor ( ) ) |  |
| 50 |
FBG temperature sensor ( ) ) |  |
| 50 |
Magnetic flux sensor ( , ,  ) ) |  |
| 12 |
FBG acceleration sensor ( ) ) | 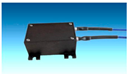 |
| 32 |
HD camera ( ) ) | 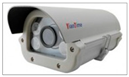 |
| 2 |
| Evaluation Criteria | Evaluation Interval | Evaluation Conclusion | Evaluation Grade |
|---|---|---|---|
| Vmeasured maximum acceleration/Vcalculated maximum acceleration | (0, 0.4) | Small | A |
| [0.4, 0.6) | Common | B | |
| [0.6, 1.0) | Big | C | |
| [1.0, +∞) | Intense | D |
| Monitoring Subsystem | Missing Rate/% | Distortion Rate/% | Recurrence Rate/% | Abnormal Rate/% | Operation Evaluation |
|---|---|---|---|---|---|
| Wind Load | 0.00 | 2.12 | 2.36 | 1.49 | Fine |
| Stress | 1.14 | 5.21 | 2.32 | 2.89 | Fine |
| Deflection of Arch Apex | 1.59 | 7.21 | 1.63 | 3.48 | Fine |
| Girder Alignment | 3.15 | 2.16 | 0.00 | 1.77 | Fine |
| Vehicle Load | 1.11 | 1.23 | 0.00 | 0.78 | Fine |
| Humiture | 0.00 | 6.21 | 5.26 | 3.82 | Fine |
| Vibration | 3.21 | 3.62 | 0.00 | 2.28 | Fine |
| Earthquake | 1.20 | 4.26 | 4.12 | 3.19 | Fine |
| Transverse Deflection | 1.17 | 3.26 | 2.54 | 2.32 | Fine |
| Overall System | 1.40 | 3.92 | 2.03 | 2.45 | Fine |
Disclaimer/Publisher’s Note: The statements, opinions and data contained in all publications are solely those of the individual author(s) and contributor(s) and not of MDPI and/or the editor(s). MDPI and/or the editor(s) disclaim responsibility for any injury to people or property resulting from any ideas, methods, instructions or products referred to in the content. |
© 2025 by the authors. Licensee MDPI, Basel, Switzerland. This article is an open access article distributed under the terms and conditions of the Creative Commons Attribution (CC BY) license (https://creativecommons.org/licenses/by/4.0/).
Share and Cite
Qin, H.; Liu, X.; Deng, C.; Chen, Y.; Zou, C.; Hu, A.; Tang, A. Implementation of a BIM-Based Collaboration System for Structural Damage Condition Assessment in an Asymmetric Butterfly Arch Bridge. Buildings 2025, 15, 1211. https://doi.org/10.3390/buildings15081211
Qin H, Liu X, Deng C, Chen Y, Zou C, Hu A, Tang A. Implementation of a BIM-Based Collaboration System for Structural Damage Condition Assessment in an Asymmetric Butterfly Arch Bridge. Buildings. 2025; 15(8):1211. https://doi.org/10.3390/buildings15081211
Chicago/Turabian StyleQin, Hongxi, Xuan Liu, Changjun Deng, Yang Chen, Chunrong Zou, Anqing Hu, and Ao Tang. 2025. "Implementation of a BIM-Based Collaboration System for Structural Damage Condition Assessment in an Asymmetric Butterfly Arch Bridge" Buildings 15, no. 8: 1211. https://doi.org/10.3390/buildings15081211
APA StyleQin, H., Liu, X., Deng, C., Chen, Y., Zou, C., Hu, A., & Tang, A. (2025). Implementation of a BIM-Based Collaboration System for Structural Damage Condition Assessment in an Asymmetric Butterfly Arch Bridge. Buildings, 15(8), 1211. https://doi.org/10.3390/buildings15081211