1. Introduction
Rapid modernization in Saudi Arabia has shifted towards Western architectural styles, often neglecting indigenous designs’ traditional and socio-cultural context. This has resulted in questionable urban development patterns and a construction boom focused on client preferences over environmental considerations. Consequently, most houses suffer from poor insulation and a heavy reliance on air conditioning, exacerbating the energy challenges imposed by Saudi Arabia’s harsh, hot, and dry climate [
1]. The building sector, responsible for nearly 44% of the nation’s energy consumption, presents a significant opportunity for efficiency improvements. With a rapidly growing population and ambitious homeownership goals outlined in Saudi Vision 2030, the residential sector remains at the forefront of this challenge. However, conventional housing designs prioritize client preferences over energy performance, creating a need for innovative solutions.
Glazing in windows significantly affects the energy needed for cooling in buildings in hot, arid regions. Numerous advanced materials for building envelopes have been explored and introduced to reduce energy consumption. Among these, nanomaterials such as silica aerogels have garnered significant attention due to their unique properties [
2,
3,
4,
5]. Simultaneously, PC multi-panels have become increasingly popular in commercial and industrial building applications owing to their lightweight design, durability, and resistance to fire, weather, and UV radiation. These air-filled structural units, composed of multiple layers of PC sheets, are valued for their thermal insulation properties, ability to diffuse light, and ease of installation. The incorporation of interlock junctions in their design further enhances their thermal and optical performance, making them a versatile and efficient choice for modern construction needs [
6]. These panels are increasingly used in fenestration systems, continuous windows, roofs, and walls, offering various geometric configurations, colors, and thicknesses. Notably, PC panels are more cost effective than traditional glazing systems and, when properly designed, can significantly enhance thermal performance, reducing energy costs in public buildings [
7].
In a prior study [
8], the thermal and optical behavior of these panels was evaluated. The results showed that while the optical properties of PC panels exhibit stronger angular dependence than conventional glass units, they still provide effective light diffusion, reducing glare and improving visual comfort. The joints between panels were found to impact performance, with variations depending on the number of layers and sample characteristics. Although PC panels exhibit lower light transmittance (approximately 30% less than double glazing units, DGUs), their thermal performance remains competitive, with U-values ranging from 1.2 to 1.9 W/m
2 K—comparable to DGUs [
8].
For applications requiring higher thermal insulation, granular silica aerogels can be incorporated into the air gaps of PC panels. Aerogels are nanostructured materials characterized by high porosity (>90%) and low density (80–200 kg/m
3), with thermal conductivity ranging from 0.012 to 0.023 W/m K depending on granule size [
9,
10]. These properties make aerogels a “superinsulation” material, suitable for various energy-efficient building solutions, including opaque applications like concrete and plasters [
11], flexible blankets [
12], and translucent systems such as high-performance windows [
13,
14,
15]. However, granular aerogels in glazing systems prevent direct visibility, offering only diffuse light transmittance, which helps reduce glare. While the thermal, optical, and acoustic performances of aerogel-based glazing systems have been extensively studied [
16,
17,
18], research on aerogel-filled PC systems remains limited.
Buratti et al. [
19] investigated the thermal and optical properties of a double-glazing system (DGUs) with a 15 mm layer of granular silica aerogel. The results showed a 63% reduction in thermal transmittance (U-value of 1.0–1.1 W/m
2 K) compared to air-filled DGUs, alongside a light transmittance of 0.57, representing a 30% reduction. Increasing the aerogel thickness to 60 mm further improved the U-value to 0.3 W/m
2 K [
19]. However, light transmittance decreases by approximately 20% for every 10 mm increase in aerogel thickness [
14]. The particle size of aerogel granules also significantly influences optical and thermal performance [
9,
12,
17].
In humid subtropical climates, Huang and Niu [
20] demonstrated that aerogel glazing systems could reduce the annual space cooling load by about 4% in commercial buildings in Hong Kong, comparable to shading-type low-emissive glazing. Similarly, Ihara et al. [
21] found that granular aerogel glazing used as spandrels reduced energy demand in cooling-dominated climates like Tokyo and Singapore. However, in heating-dominated climates such as Oslo, aerogel glazing systems underperformed compared to triple glazing, suggesting that a combination of aerogel and triple glazing could be more effective. Buratti et al. [
22] further confirmed the energy-saving potential of aerogel glazing systems, achieving 60–70% energy savings in refurbishing a building in Perugia, Italy. Dowson et al. [
23] conducted an experimental study on two prototype PC panels filled with granular aerogel (6 mm and 10 mm thicknesses). Installed in an office building in London, the panels demonstrated a 73% heat flux reduction for the 6 mm aerogel panel and 80% for the 10 mm panel. Light transmittance values were 58% and 51% for the 6 mm and 10 mm panels, respectively, compared to 73% for single glazing. These findings highlight the potential of aerogel-filled PC panels in retrofit applications.
Despite extensive research on façade design and energy performance, there remains a significant gap in the evaluation of the application of advanced materials, such as PC panels integrated with nanogel technology, in Saudi Arabia. This study bridges this gap by employing dynamic simulations to optimize glazing assembly designs incorporating these innovative materials. Focusing on a typical residential building in Jeddah—a city characterized by high cooling demands—this research aims to assess the effects of various nanogel-filled PC glazing configurations on annual cooling loads, energy consumption, and CO2 emissions. The study also endeavors to determine the optimal glazing designs that reduce cooling requirements, enhance thermal comfort, and improve energy efficiency while minimizing carbon emissions. Furthermore, the research aims to provide detailed performance data and design recommendations to support adopting PC–nanogel glazing systems in future residential developments across Saudi Arabia. The anticipated outcomes of this research hold significant potential to influence building design strategies in Saudi Arabia, promoting the reduction of thermal discomfort and energy use in residential buildings. Aligning with the sustainability goals outlined in Saudi Vision 2030, this research may pave the way for adopting innovative facade technologies, ultimately transforming modern housing and contributing to a more sustainable future for the Kingdom.
2. Materials and Methods
2.1. Study Area
Jeddah City, located in the western region of Saudi Arabia, is characterized by a hot and humid climate. Geographically, the city lies at a latitude of 27.5° N, approximately 600 km northwest of Riyadh, the capital of Saudi Arabia, as depicted in
Figure 1. The climate in Jeddah is classified as BWh, according to the Köppen–Geiger system, indicating a hot desert climate [
24]. Jeddah City is in the hot–dry maritime subzone, characterized by a hot and dry climate. This climate zone exhibits several distinct features: the summers are notably hot and dry, with dry bulb temperatures (DBTs) often exceeding 43 °C, and the average maximum DBT reaches approximately 40 °C. The average monthly DBT is around 33 °C, while the wet-bulb temperature (WBT) averages 16.5 °C. The average relative humidity hovers around 19%. Additionally, Jeddah experiences an annual mean wind speed of 3.39 m/s, contributing to generally calm weather conditions throughout the year. Seasonal variations in climatic conditions are evident, with June recording peak average high temperatures of 33.5 °C, compared to cooler average lows of 25.7 °C in January. Annual precipitation levels are minimal, ranging from 1 mm to 19 mm, with the least rainfall occurring in June and the most during winter [
25].
These severe climate conditions require heavy reliance on air conditioning systems to maintain indoor comfort, emphasizing the need for energy-efficient building designs. However, window glazing systems in buildings across Saudi Arabia often lack sufficient insulation, a shortfall rooted in conventional construction practices. Given the critical impact of climatic factors on building energy performance, analyzing glazing systems must account for these variables. The poor thermal performance of glazing systems in Jeddah contributes to increased cooling energy demands and highlights the necessity for improvements in building envelopes. Enhancing glazing configurations with advanced materials offers an opportunity to address this challenge by reducing energy consumption while improving thermal comfort.
2.2. Study Model Characteristics
Environmental factors, particularly temperature and humidity, significantly influence building energy demands. In regions with hot and arid climates like Jeddah, Saudi Arabia, cooling requirements dominate energy consumption. Therefore, selecting window glazing materials with enhanced thermal insulation properties is essential in reducing energy usage for cooling and heating purposes.
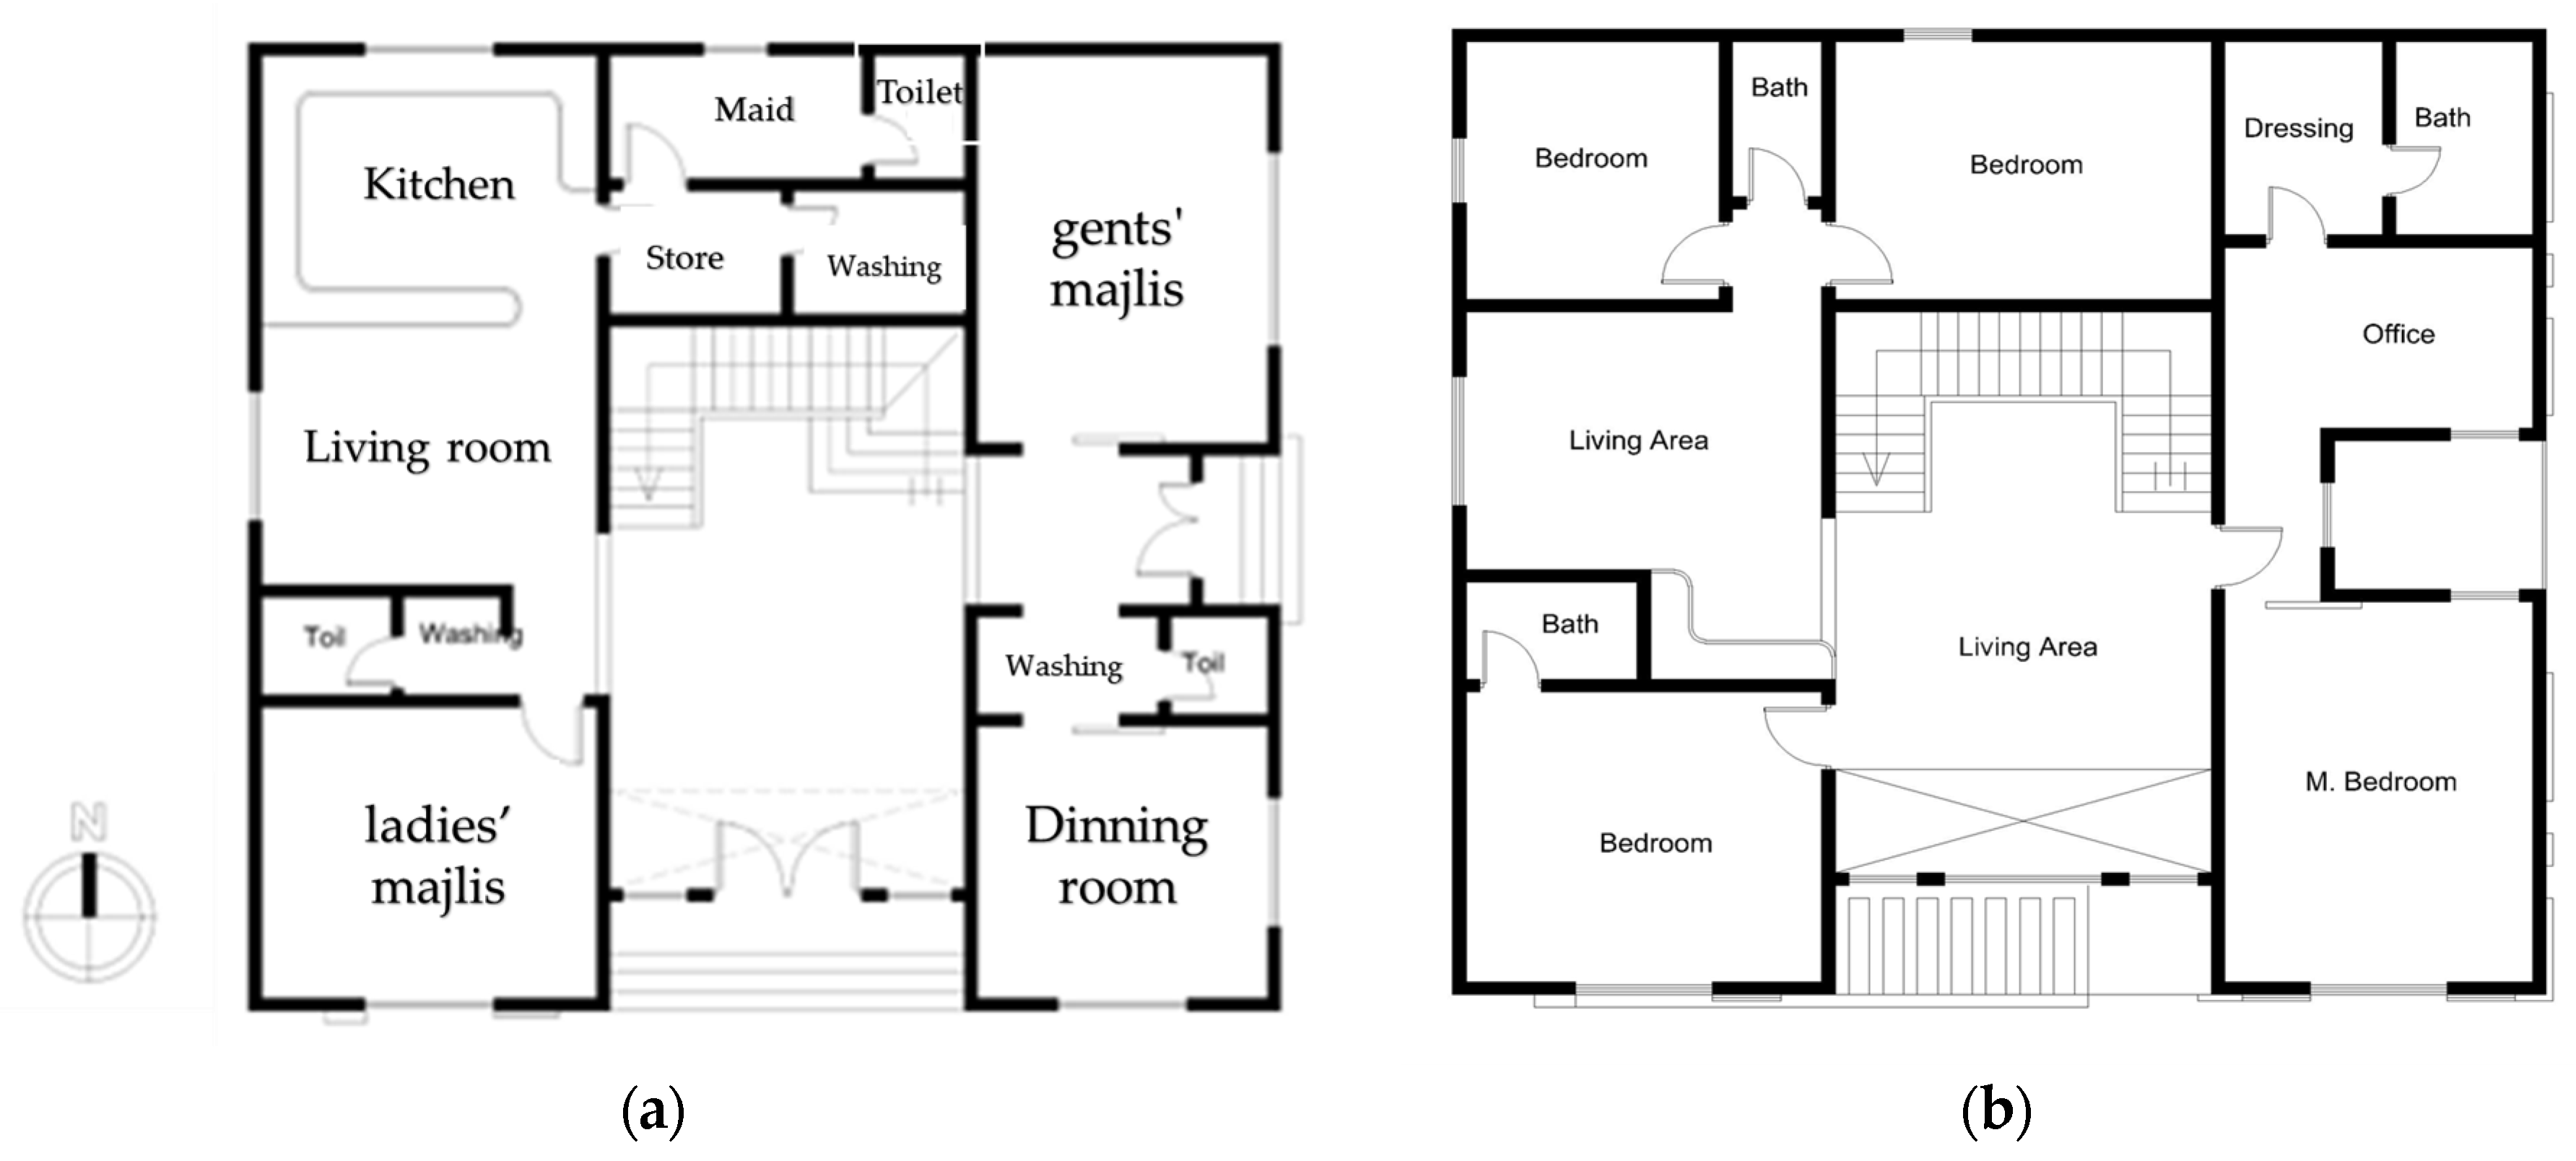
To address this issue, the current research focuses on assessing cooling energy requirements for a typical family residence in Jeddah, Saudi Arabia, utilizing innovative, advanced PC windows. The residential model chosen for evaluation represents a two-story building with a total floor area of 240 m
2, designed to accommodate a family of up to ten individuals. The architectural design of the model is represented in
Figure 2. It is important to note that this model is representative of the prevalent housing structures found throughout Jeddah and adheres to the construction techniques specified in the Saudi Building Code (SBC), which includes guidelines for achieving thermal insulation [
27]. The building model incorporates characteristic construction elements, including 30 cm brick walls with a 2 cm cement plaster layer on each side, achieving a thermal transmittance (U-value) of 1.61 W/m
2 K. The roof structure consists of 12 cm of insulated slabs layered with 2 cm of bitumen, 5 cm of insulated foam, 7 cm of sloped ordinary concrete, 6 cm of sand, 2 cm of cement mortar, and 2 cm of cement tiles, resulting in a U-value of 0.47 W/m
2 K. The baseline glazing comprises single-pane windows with a U-value of 5.6 W/m
2 K and a Solar Heat Gain Coefficient (SHGC) of 0.85, configured at a 14% window-to-wall ratio.
2.3. Modeling and Simulation Steps
Throughout the evaluation process, consideration was given to Jeddah’s hot desert climate, designated as BWh according to the Köppen–Geiger climate classification. The specific geographical coordinates of Jeddah City (16°54′34.8588″ N and 42°34′4.4472″ E) were considered. A detailed simulation was developed, which precisely accounted for the thermal conductivity of each building material and the composition of the window layers. The building’s design was input as 2D DXF files, enabling the software to generate a comprehensive 3D model.
Accurate weather data are a cornerstone of reliable building energy simulations. While Design Builder software (version 5.0.0.105) offers a default 2002 EPW (EnergyPlus Weather) file for Jeddah’s climate zone obtained from the U.S. Department of Energy’s (DOE) website, this study prioritized the use of more recent and localized data to ensure model precision. Following the recommended practices established in previous research [
28,
29,
30,
31], we utilized weather data from 2024 obtained from the King Abdullah University of Science and Technology (KAUST) weather station. While typical meteorological year (TMY) data are commonly used for building performance simulations as they represent long-term climate patterns, we selected a single-year dataset for this study to capture recent climatic trends and potential anomalies that may not be reflected in standardized TMY files. This approach was adopted because (1) the study focuses on evaluating current thermal performance under potentially changing climate conditions and (2) the selected year exhibited weather patterns consistent with the region’s observed climate shifts in recent years. The dataset was carefully validated against historical records to ensure its representativeness despite the shorter timeframe.
The data acquisition and processing procedures adhered to the following steps:
EPW File Conversion: The original EPW file from the DOE website was first converted to a CSV (comma-separated values) format to extract the necessary data seamlessly.
Data Retrieval from Weather Station: Key meteorological variables, including dry-bulb temperature, relative humidity, global radiation, wind speed, and wind direction, were extracted from the CSV file, representing actual measurements from the local weather station.
Dew Point and Direct Radiation Calculation: To complement the acquired data, dew point and direct radiation values were calculated using Element software (version 1.0.6).
EPW File Generation: The final step involved incorporating the extracted and calculated data into a newly generated EPW file, adhering to the EnergyPlus weather file format.
Integration into Design Builder: The updated EPW file was subsequently imported into Design Builder, serving as the foundation for weather data within the simulation environment.
This meticulous approach to weather data handling ensures the model’s alignment with the specific climate conditions of Jeddah in 2024, fostering more accurate and meaningful energy performance predictions. Using contemporary and site-specific data mitigates the potential discrepancies that could arise from relying on outdated or generalized weather datasets, ultimately enhancing the reliability and relevance of the simulation results.
Multiple outputs were derived using various performance metrics, including reductions in cooling load (kWh), annual energy consumption (kWh/year), CO
2 emissions mitigation (kg/year), monthly energy savings, and overall improvement rates relative to conventional glazing systems. The simulation was enhanced by adding data related to the PC windows and the building’s operational dynamics, encompassing heating, airflow, and lighting.
Table 1 thoroughly outlines the input parameters and building characteristics employed in the calculations.
2.4. Field Measurements
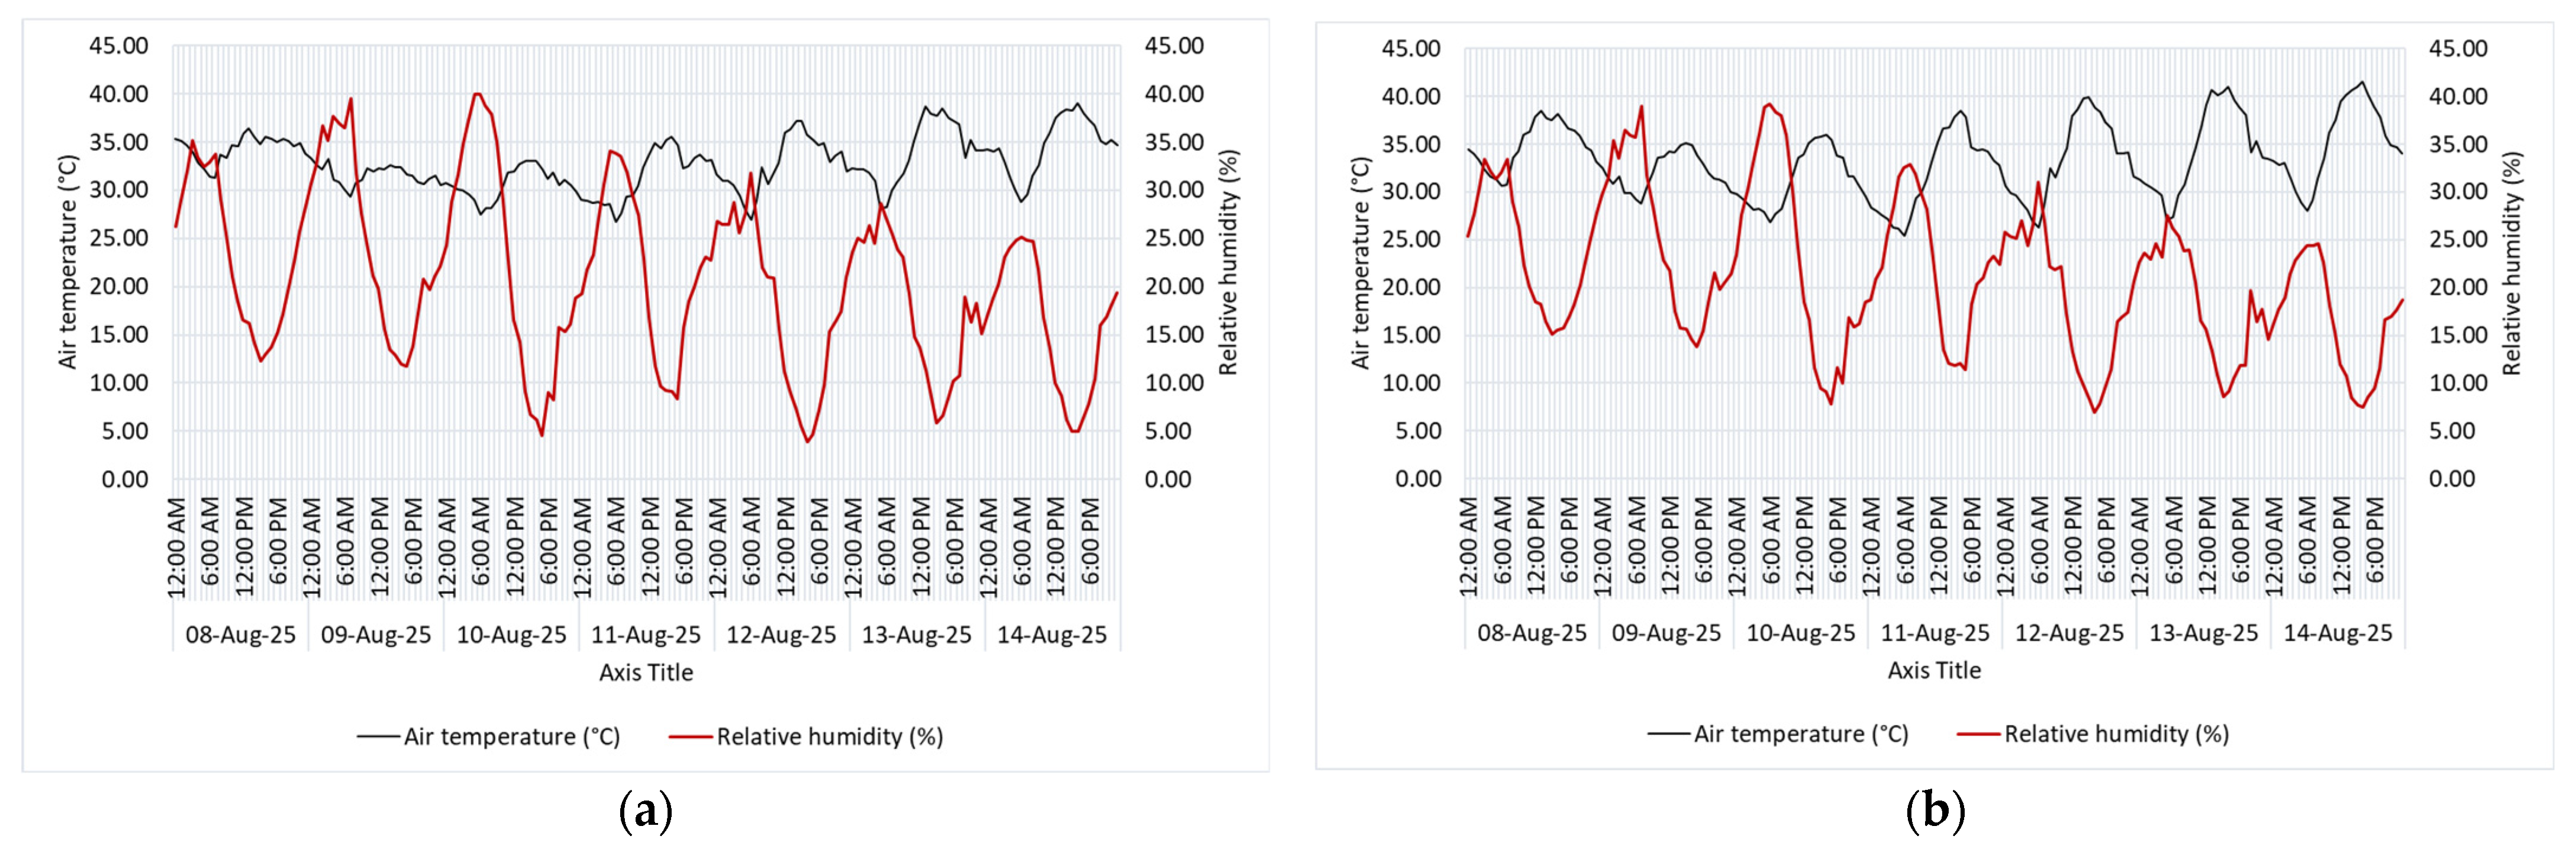
Figure 3 illustrates the variations in air temperature and relative humidity over seven days in two different settings. In
Figure 3a, representing the gents’ majlis, air temperature fluctuates between approximately 23 °C during the early morning and 44 °C during midday, reflecting the impact of solar radiation on indoor conditions. Correspondingly, relative humidity ranges from about 15% at midday to 40% in the early morning, showing a strong inverse relationship with air temperature. The observed decrease in humidity during peak temperatures can be attributed to the increased air capacity to hold moisture at higher temperatures. At the same time, the reverse trend during cooler hours is likely due to reduced evaporation and lower moisture-holding capacity.
Figure 3b, representing the ladies’ majlis, demonstrates similar trends but with slight differences in magnitude. Air temperatures range from approximately 24 °C to 43 °C, and relative humidity varies between 16% and 39%, indicating a marginally narrower range of variation compared to the gents’ majlis. These differences could be linked to variations in insulation, ventilation, or the proximity of the space to external heat sources. The diurnal nature of the fluctuations in both spaces underscores the influence of external climatic conditions and solar radiation.
2.5. Model Validation
Validating the model is a critical step before advancing to further analyses, as it ensures reliability and minimizes discrepancies between predicted and actual performance. Verifying the house model’s accuracy involved comparing simulated outputs against measured data. This validation was carried out in two distinct steps: first, a check of thermal performance, and second, an analysis of energy use. The thermal validation specifically examined how closely the model’s temperature forecasts matched actual indoor temperatures during occupancy periods. Meanwhile, energy consumption validation examined the accuracy of the modeled energy use by comparing the predicted total energy consumption with actual electricity bill data. The thermal validation was carried out in August 2023 when the ladies’ and gents’ majlis were used. To record indoor temperature variations, iButton data loggers (DS1921H-F5 Thermochron) (Analog Devices, CA, USA) were deployed, capturing hourly temperature readings throughout the study period.
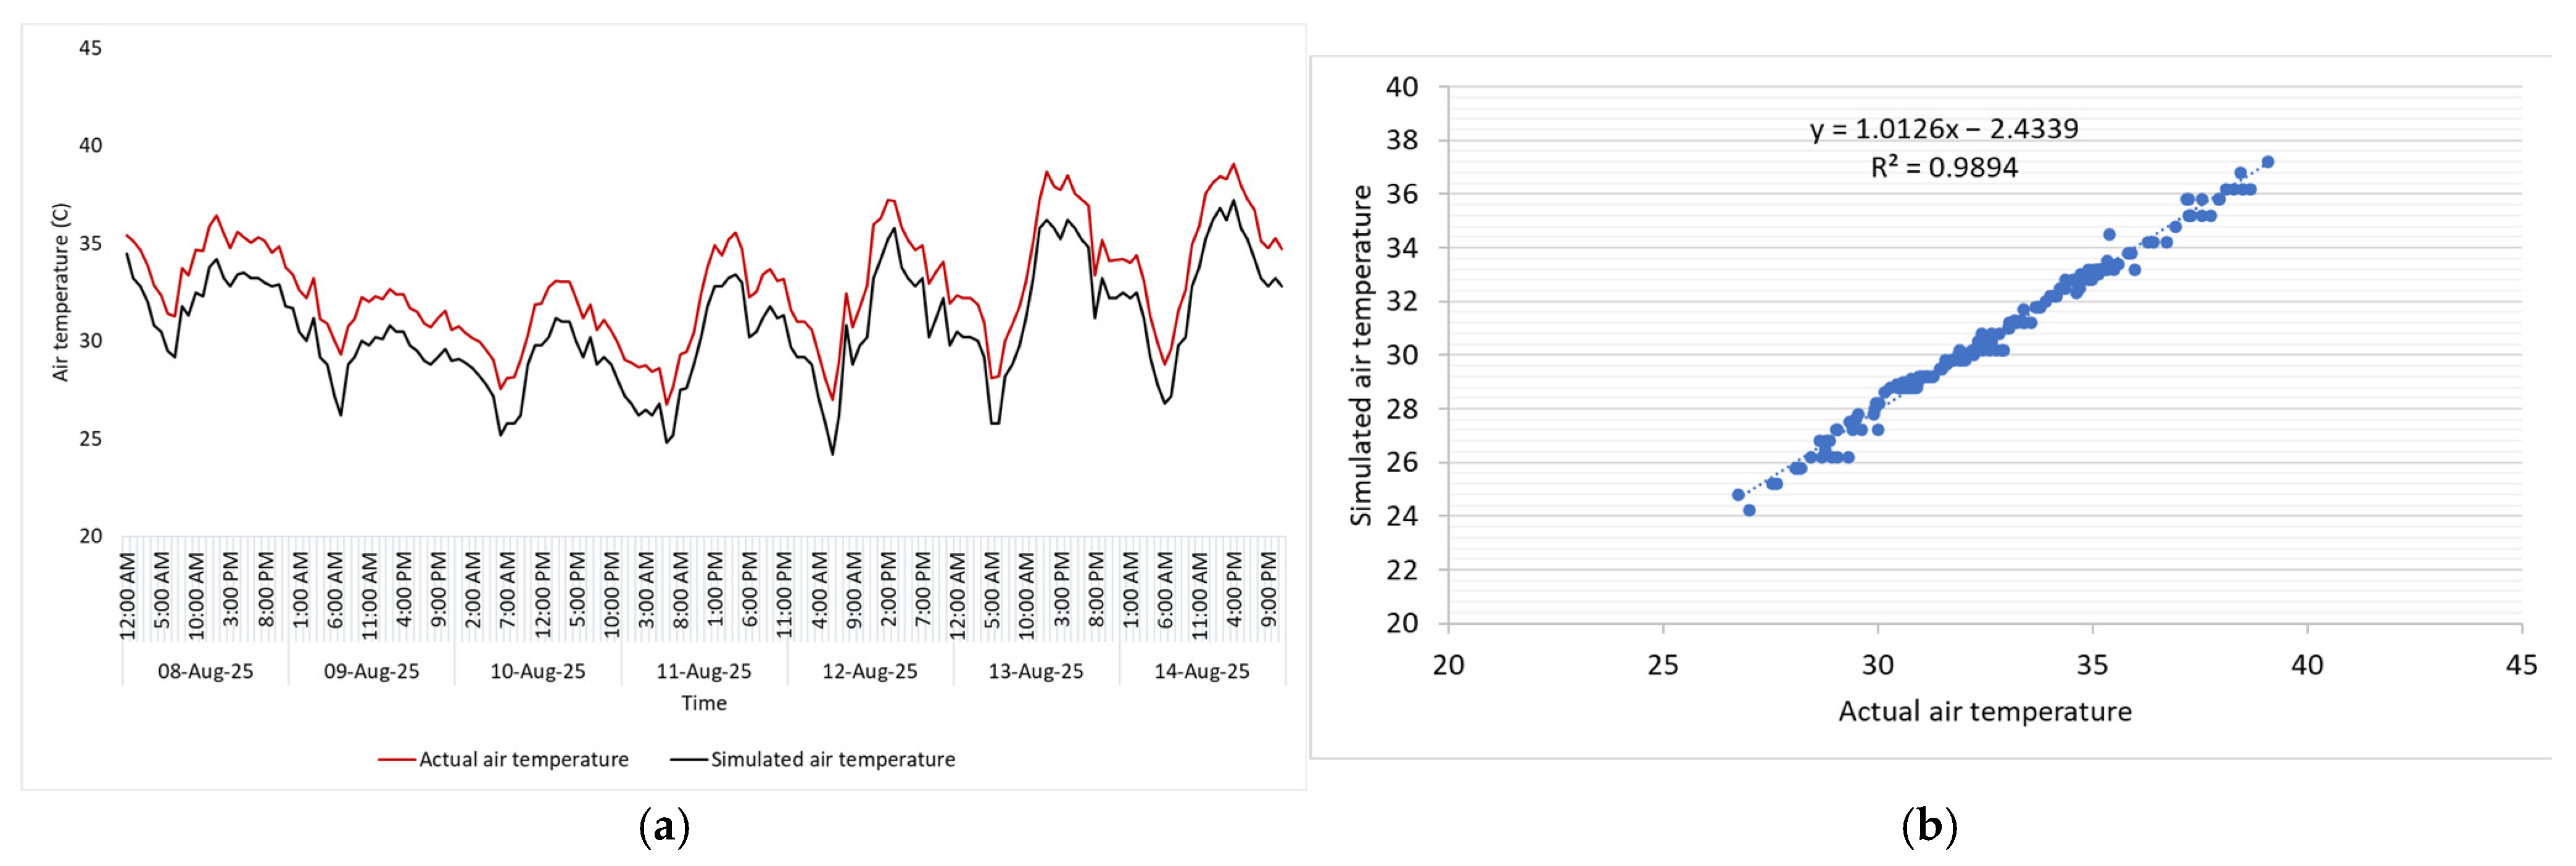
The validation results demonstrate the robust performance of the temperature simulation model for both the gents’ and ladies’ majlis. In the gents’ majlis (
Figure 4), the simulated and observed temperature profiles exhibit strong agreement throughout the validation period. The model accurately captures peak and trough variations, with minimal deviations occurring only under extreme thermal conditions. Statistical analysis reveals an exceptionally high coefficient of determination (R
2 = 0.9894), confirming near-perfect predictive accuracy. The regression equation (
y = 1.0126
x − 2.4339) indicates a marginal overprediction at lower temperatures but maintains high reliability across the operational range.
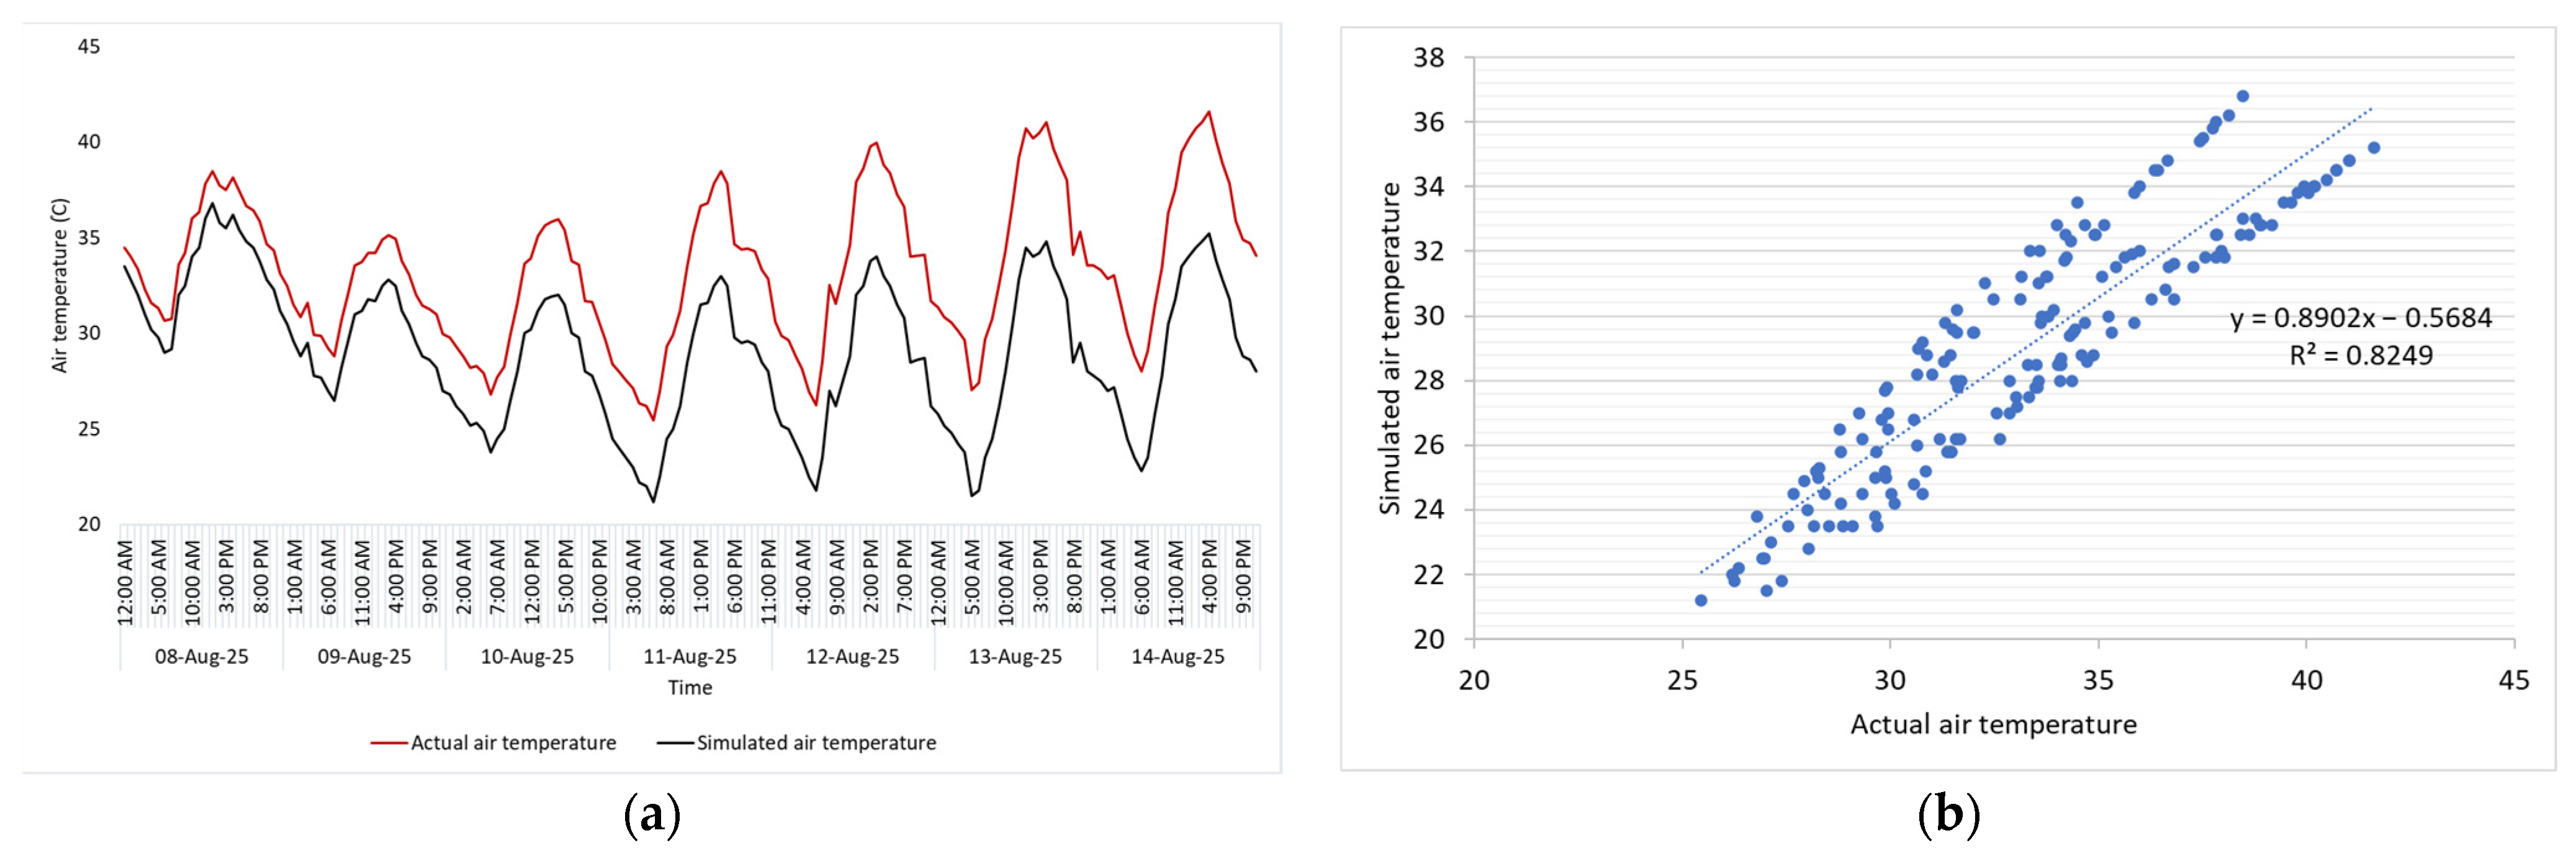
For the ladies’ majlis (
Figure 5), the model similarly achieves strong agreement, though minor discrepancies arise during periods of significant thermal fluctuation. The scatter plot yields an R
2 of 0.8249, indicating slightly reduced but still robust predictive performance compared to the gents’ majlis. The regression relationship (
y = 0.9802
x − 0.5684) suggests a slight underestimation at higher temperatures. The performance variation between the two spaces may stem from differences in occupancy dynamics, thermal load distribution, or ventilation characteristics.
Figure 6 compares the simulated indoor temperatures with actual measurements for the ladies’ and gents’ majlis. The results indicate a strong alignment between the two datasets. A statistical evaluation was conducted to quantify the differences, revealing R
2 values of 0.72 for the ladies’ majlis and 0.874 for the gents’ majlis. The notable discrepancy observed in the thermal performance of the ladies’ majlis can be attributed to its southern and western orientation, which is more exposed to solar heat gain compared to the northern and eastern orientation of the gents’ majlis. This difference in exposure results in higher thermal loads on the ladies’ majlis facades, contributing to greater deviations between measured and simulated temperatures. Despite being subjected to identical external weather conditions, the orientation of the ladies’ majlis amplifies its vulnerability to solar radiation, particularly during peak afternoon hours when the west-facing facade experiences direct sunlight.
Furthermore, the model’s energy efficiency, which considered the combined consumption of HVAC, lighting, and miscellaneous equipment, was validated by comparing the simulated energy totals against real-world electricity bill data. The estimated energy consumption was derived from the building’s lighting system, material properties, climate control settings, and environmental conditions. Following ASHRAE Guideline 14 standards, the model’s accuracy was validated using the Coefficient of Variation of Root Mean Square Error CV(RMSE) and Normalized Mean Bias Error (NMBE). These metrics were chosen for their reliability as standardized performance indicators. The guideline recommends thresholds of 30% for CV(RMSE) and 10% for NMBE for monthly calibration, ensuring the model’s calibration aligns with established accuracy criteria [
32].
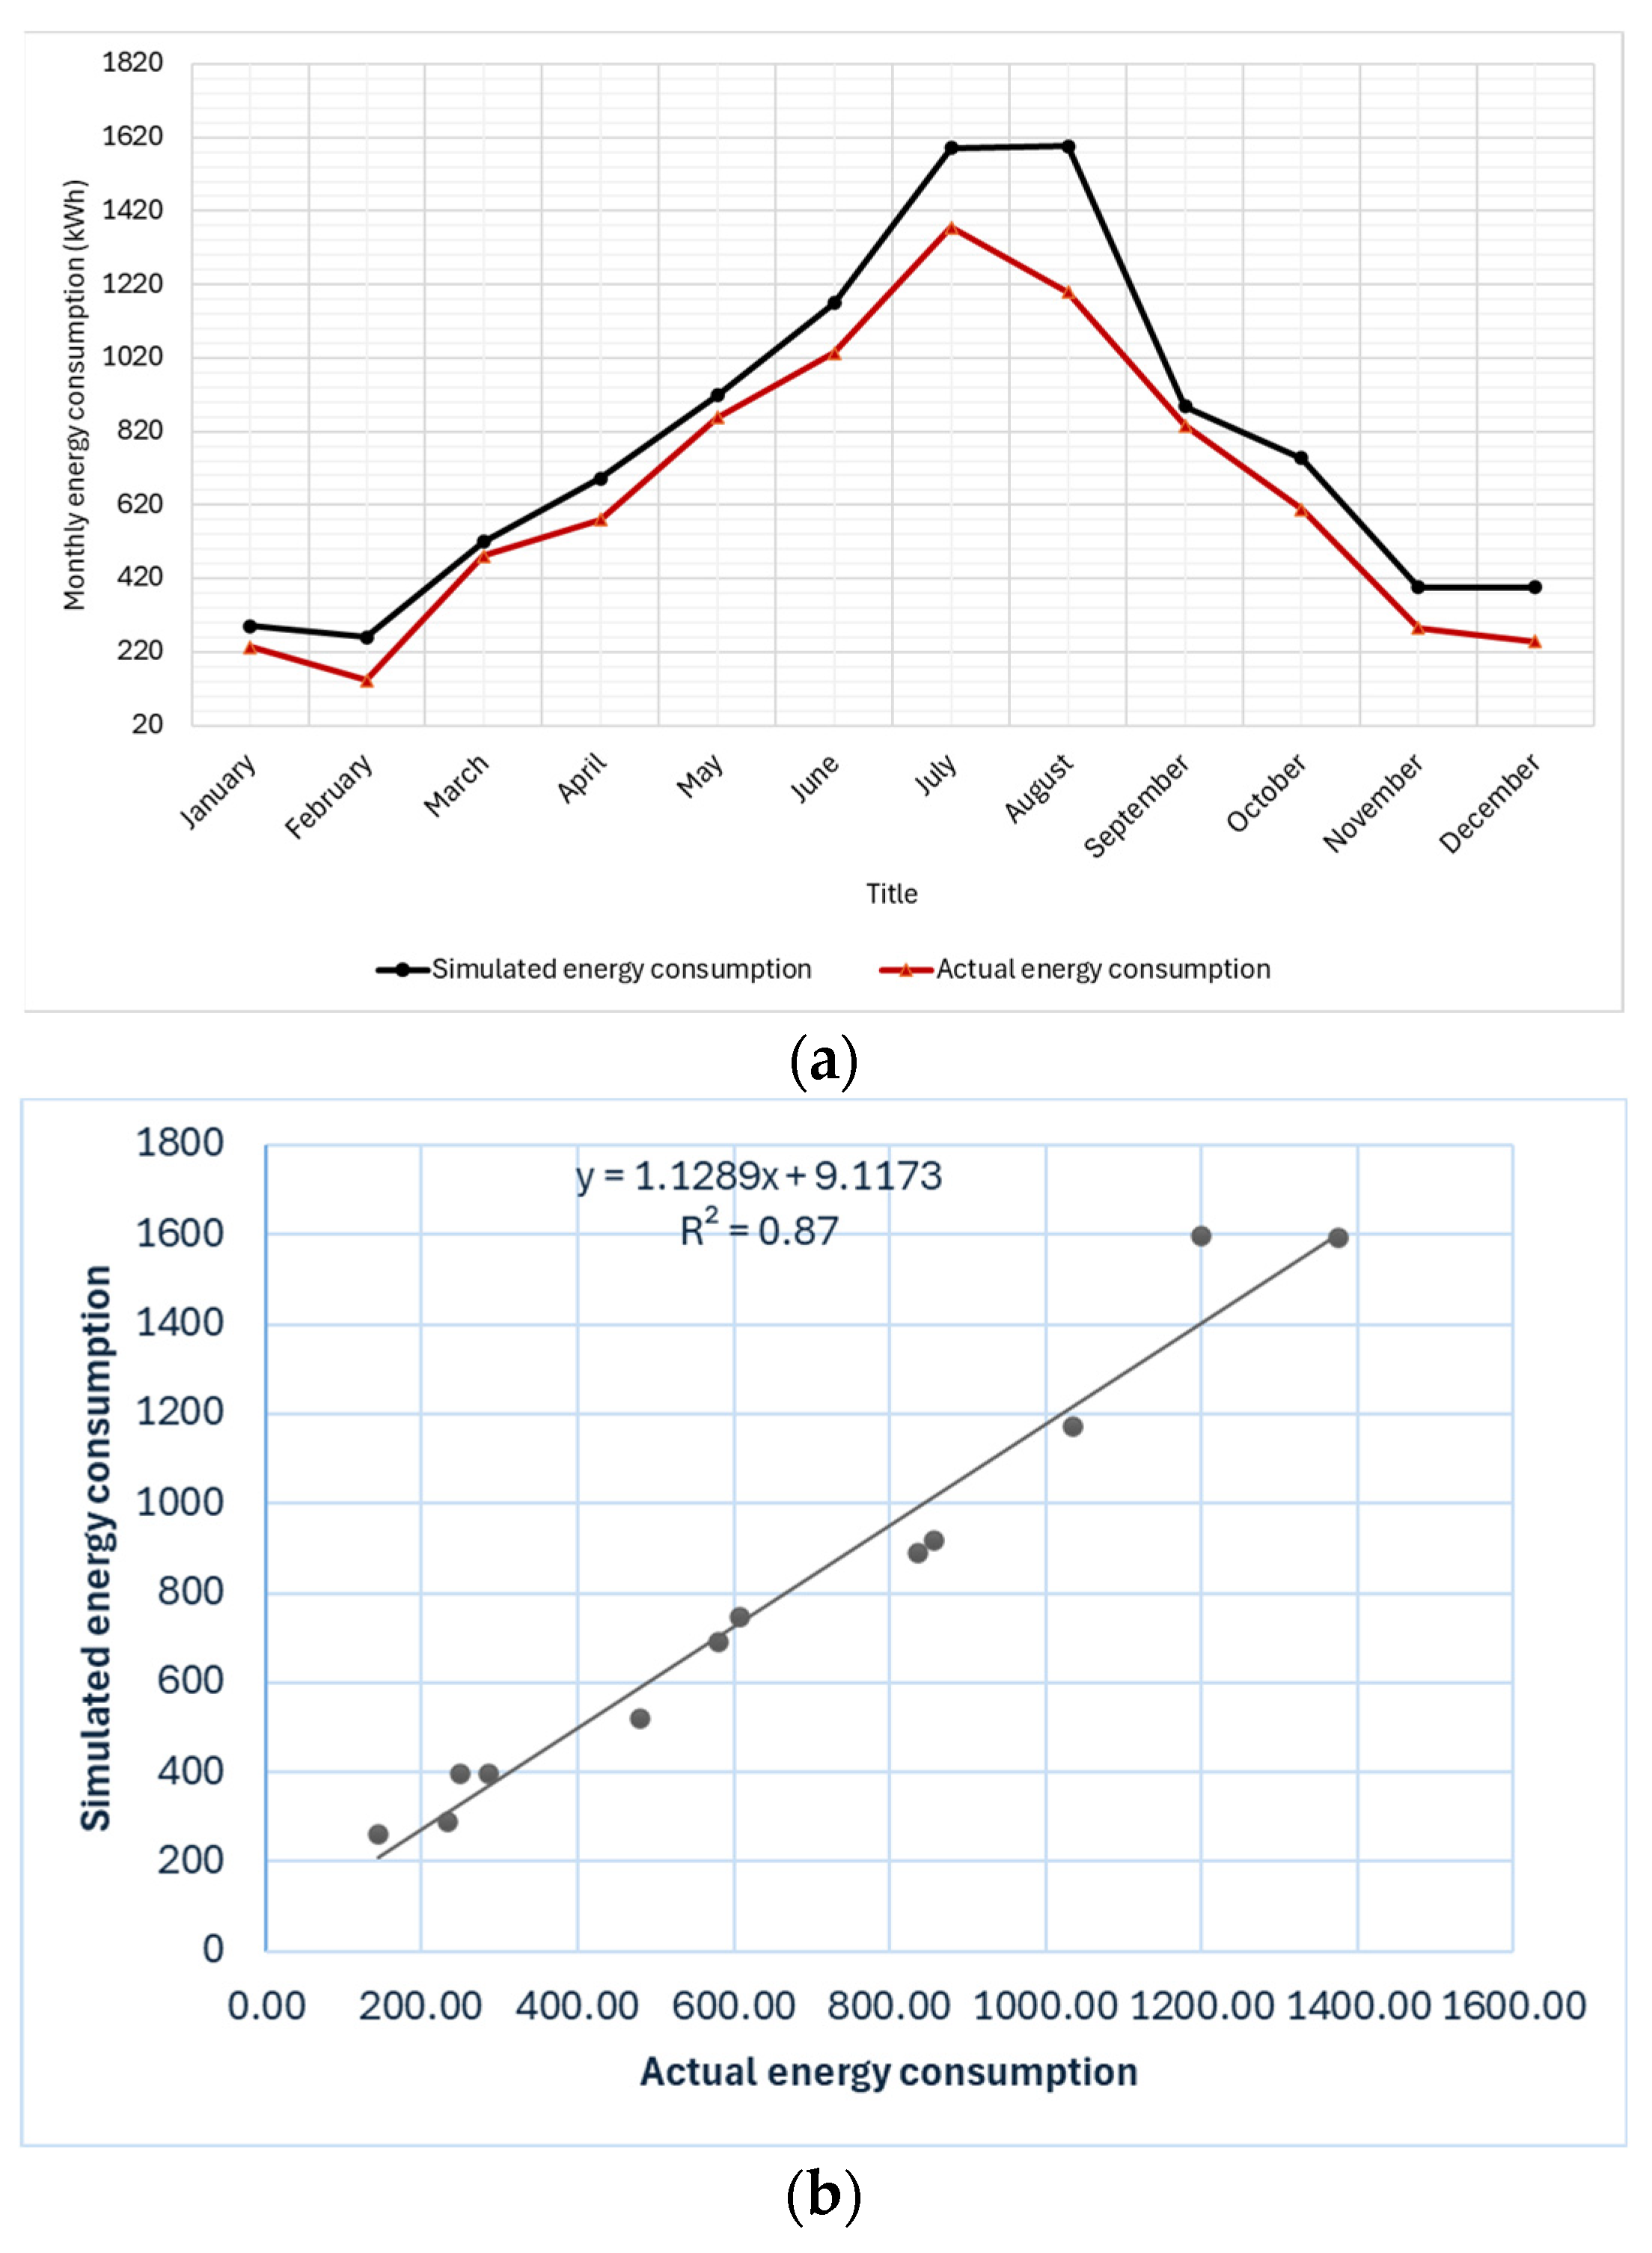
Monthly energy consumption values from the simulation were then compared with recorded electricity usage, as illustrated in
Figure 6a. The model’s performance was assessed following ASHRAE Guideline 14, utilizing CV(RMSE) and NMBE as evaluation metrics. The CV(RMSE) was determined to be 22.4%, well within the recommended threshold of 30% for monthly calibration, indicating an acceptable level of variability in prediction errors. In contrast, the NMBE was calculated at −18.6%, surpassing the guideline’s 10% benchmark and indicating a systematic trend of overprediction. This bias was particularly evident during winter months, such as February and December, potentially reflecting an overestimation of heating loads or infiltration rates. Despite the deviation in NMBE, the model demonstrated a robust R
2 value of 0.87 and compliance with the CV(RMSE) criterion, affirming its overall reliability for energy performance evaluation (
Figure 6b). The differences between actual and simulated energy consumption can largely be attributed to assumptions made in the simulation model, particularly regarding occupancy schedules. These assumptions were based on typical Saudi household routines but may not fully reflect actual occupant behavior. Further refinement of thermal assumptions could help mitigate the identified bias.
2.6. Thermal Properties of the Proposed Advanced Glazing Options
This research investigates the effect of various glazing configurations on the cooling energy requirements of a typical residential building in Jeddah. The thermal characteristics of the construction materials used in the simulations were obtained from the guidelines outlined in the Saudi Building Code (SBC-602) [
33]. The specifications of the nanogel were derived from the previous literature [
2] with slight adjustments.
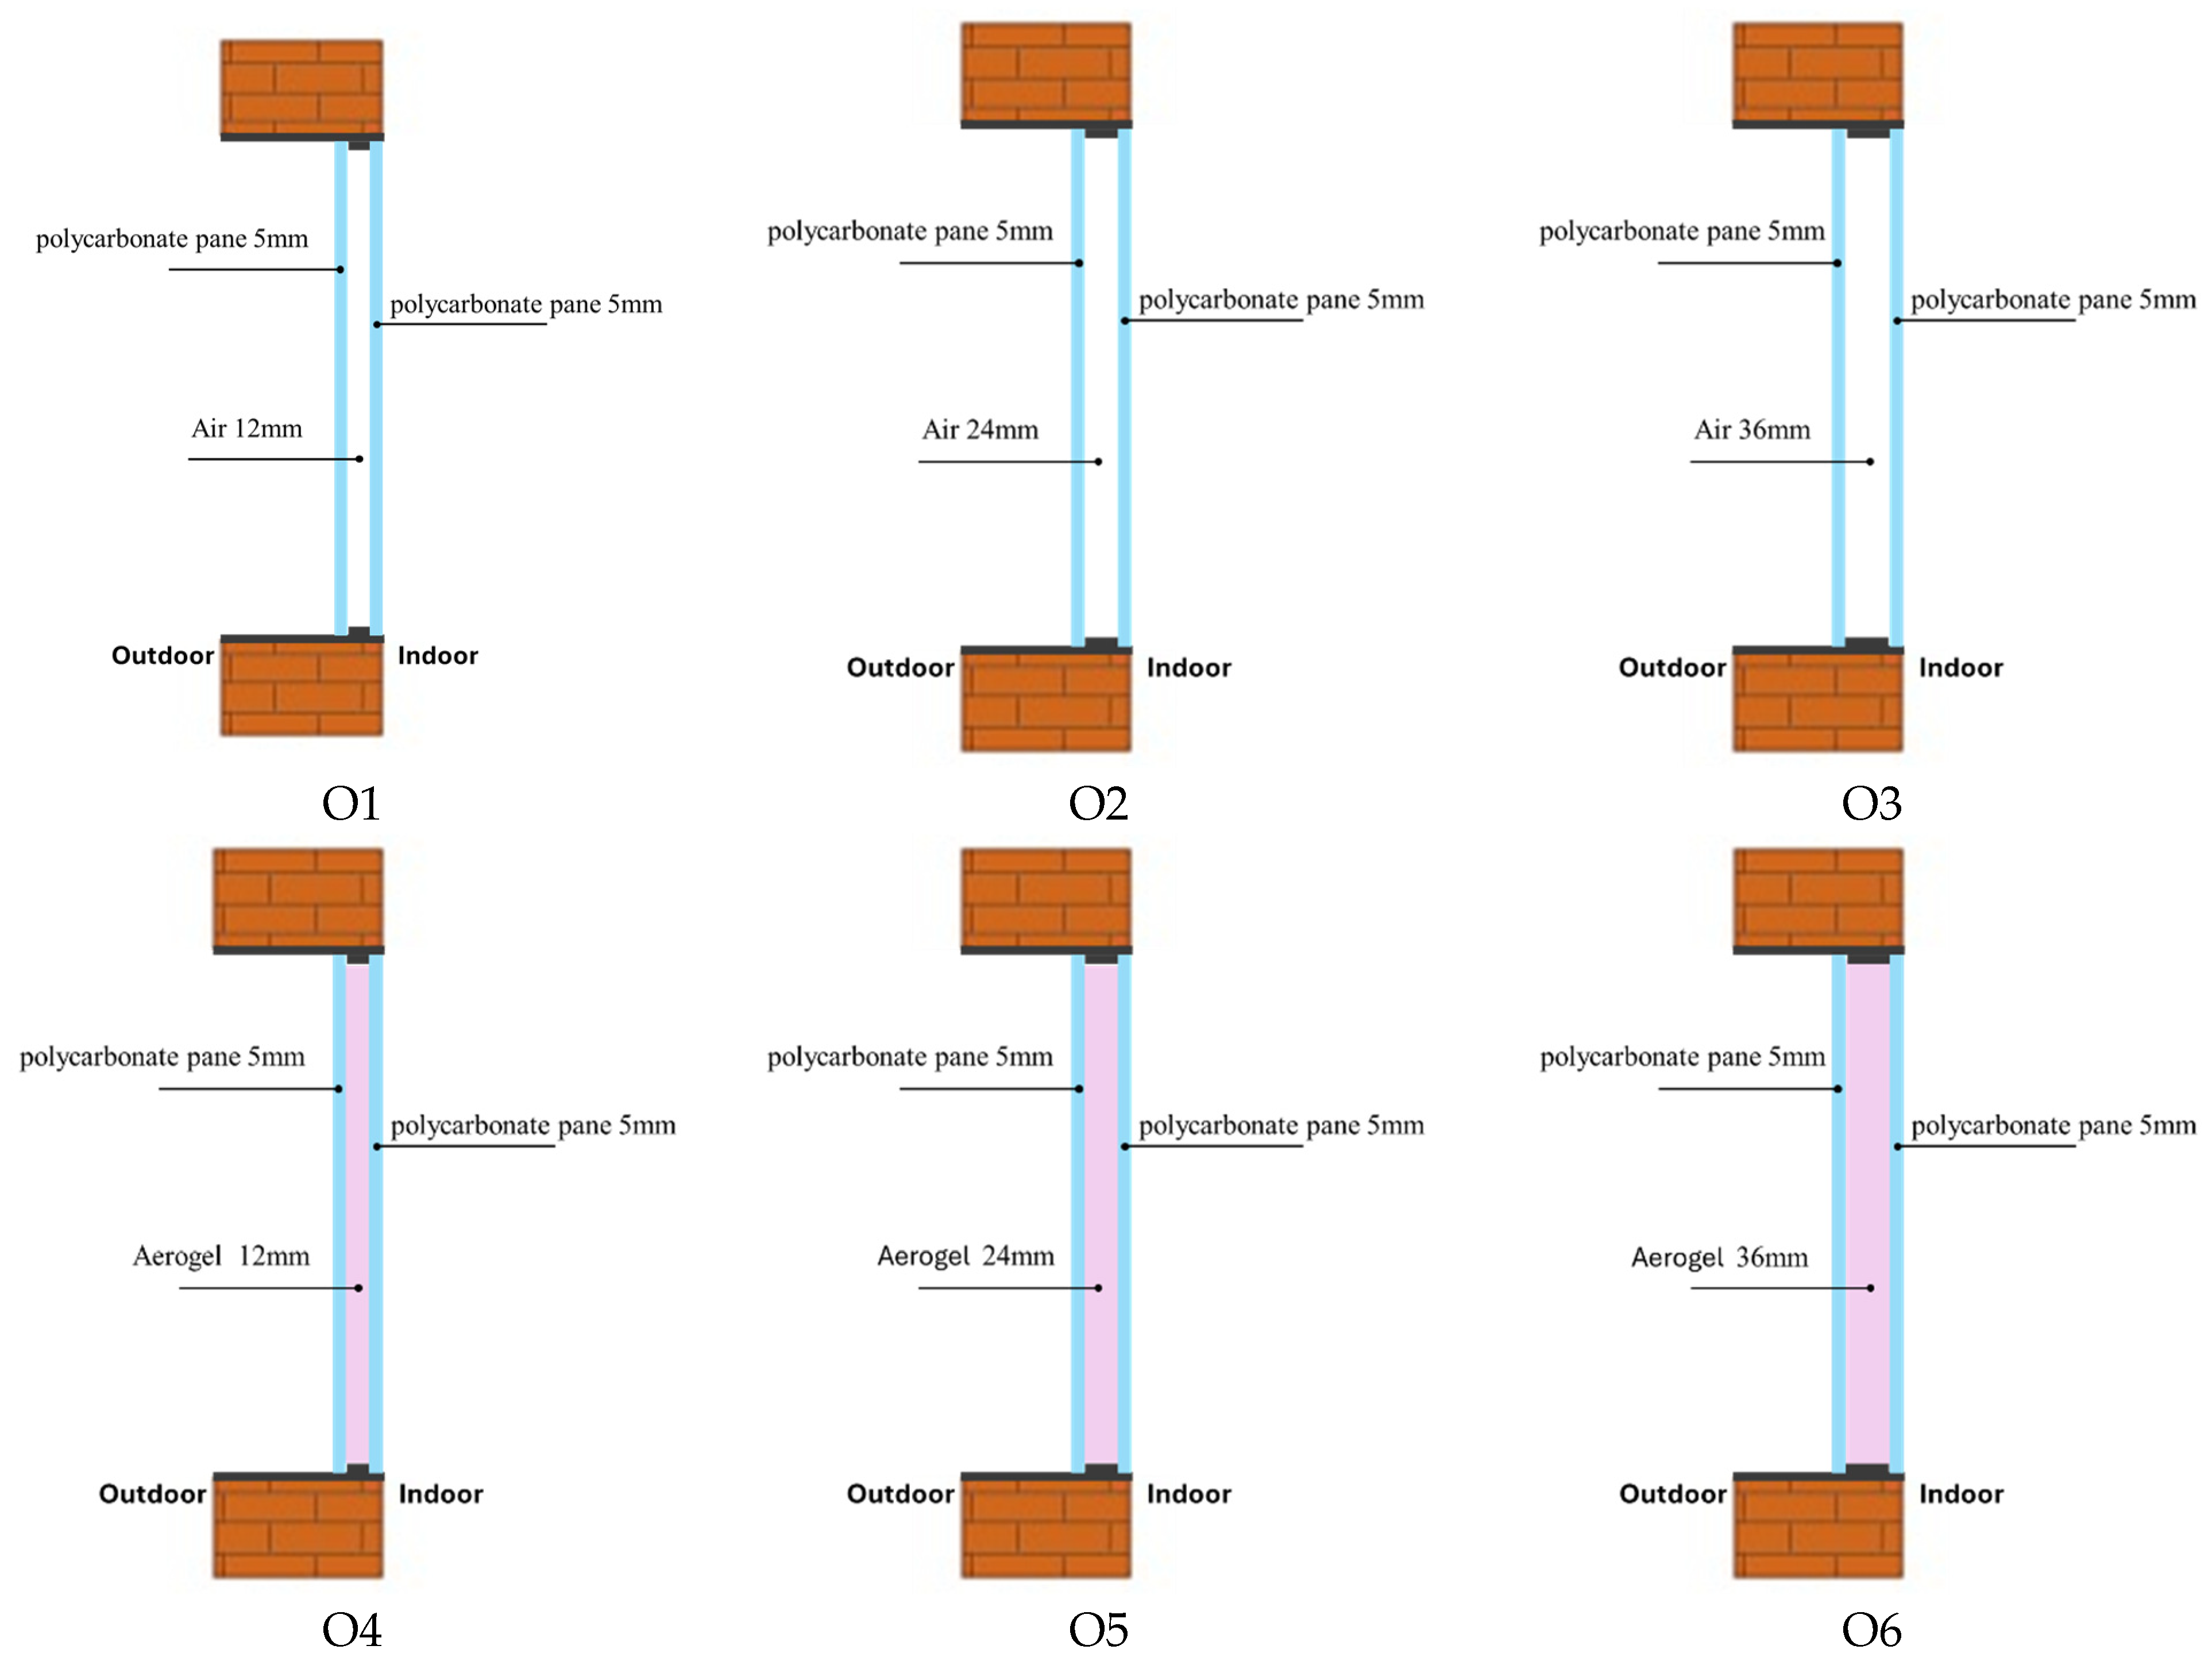
Figure 7 illustrates cross-sectional diagrams of the six analyzed PC window configurations. The configurations analyzed include a baseline case (BC) featuring standard clear glass and six optimized options (O1–O6), which integrate advanced technologies such as PC glazing with air gaps and aerogel-based glazing.
Table 2 provides a comprehensive overview of the specifications for each configuration, outlining their thermal properties and design features. The BC serves as a reference point, utilizing standard clear glass without any advanced thermal insulation features. This glazing type is characterized by high thermal transmittance and a high SHGC, making it less effective at mitigating heat gains. It is used as the benchmark to evaluate the thermal performance enhancements offered by the other configurations. The PC glazing configurations (O1–O3) are designed to improve thermal performance by incorporating two layers of PC separated by air gaps of varying thickness. These air gaps function as insulating layers, reducing heat transfer through the glazing. O1 incorporates a 12 mm air gap, resulting in modest improvements in thermal insulation compared to the baseline case. O2 features a 24 mm air gap, which provides enhanced insulation and greater energy savings. O3 utilizes the largest air gap (36 mm), delivering the most effective thermal insulation among the PC options.
The aerogel-based glazing configurations (O4–O6) utilize aerogel, a highly porous material known for its extremely low thermal conductivity, to maximize thermal insulation. These configurations demonstrate superior energy performance compared to the baseline case and the PC alternatives. O4 features a 12 mm aerogel layer, significantly improving insulation compared to the baseline case and PC configurations. O5 doubles the aerogel thickness to 24 mm, further enhancing insulation and achieving substantial energy savings throughout the year. O6 represents the most advanced configuration, with a 36 mm aerogel layer offering the highest level of insulation and the lowest cooling energy requirements. Each glazing configuration was evaluated based on its thermal transmittance (U-value), SHGC, and visible light transmission (VLT). These parameters determine the glazing’s ability to regulate heat transfer, minimize solar heat gain, and maintain adequate natural light levels indoors. Advanced configurations, particularly O5 and O6, are likely enhanced with low-emissivity coatings and optimized insulation properties, enabling superior thermal performance. This systematic analysis provides valuable insights into the potential of advanced glazing technologies to improve energy efficiency and reduce cooling loads in hot climates like Jeddah.
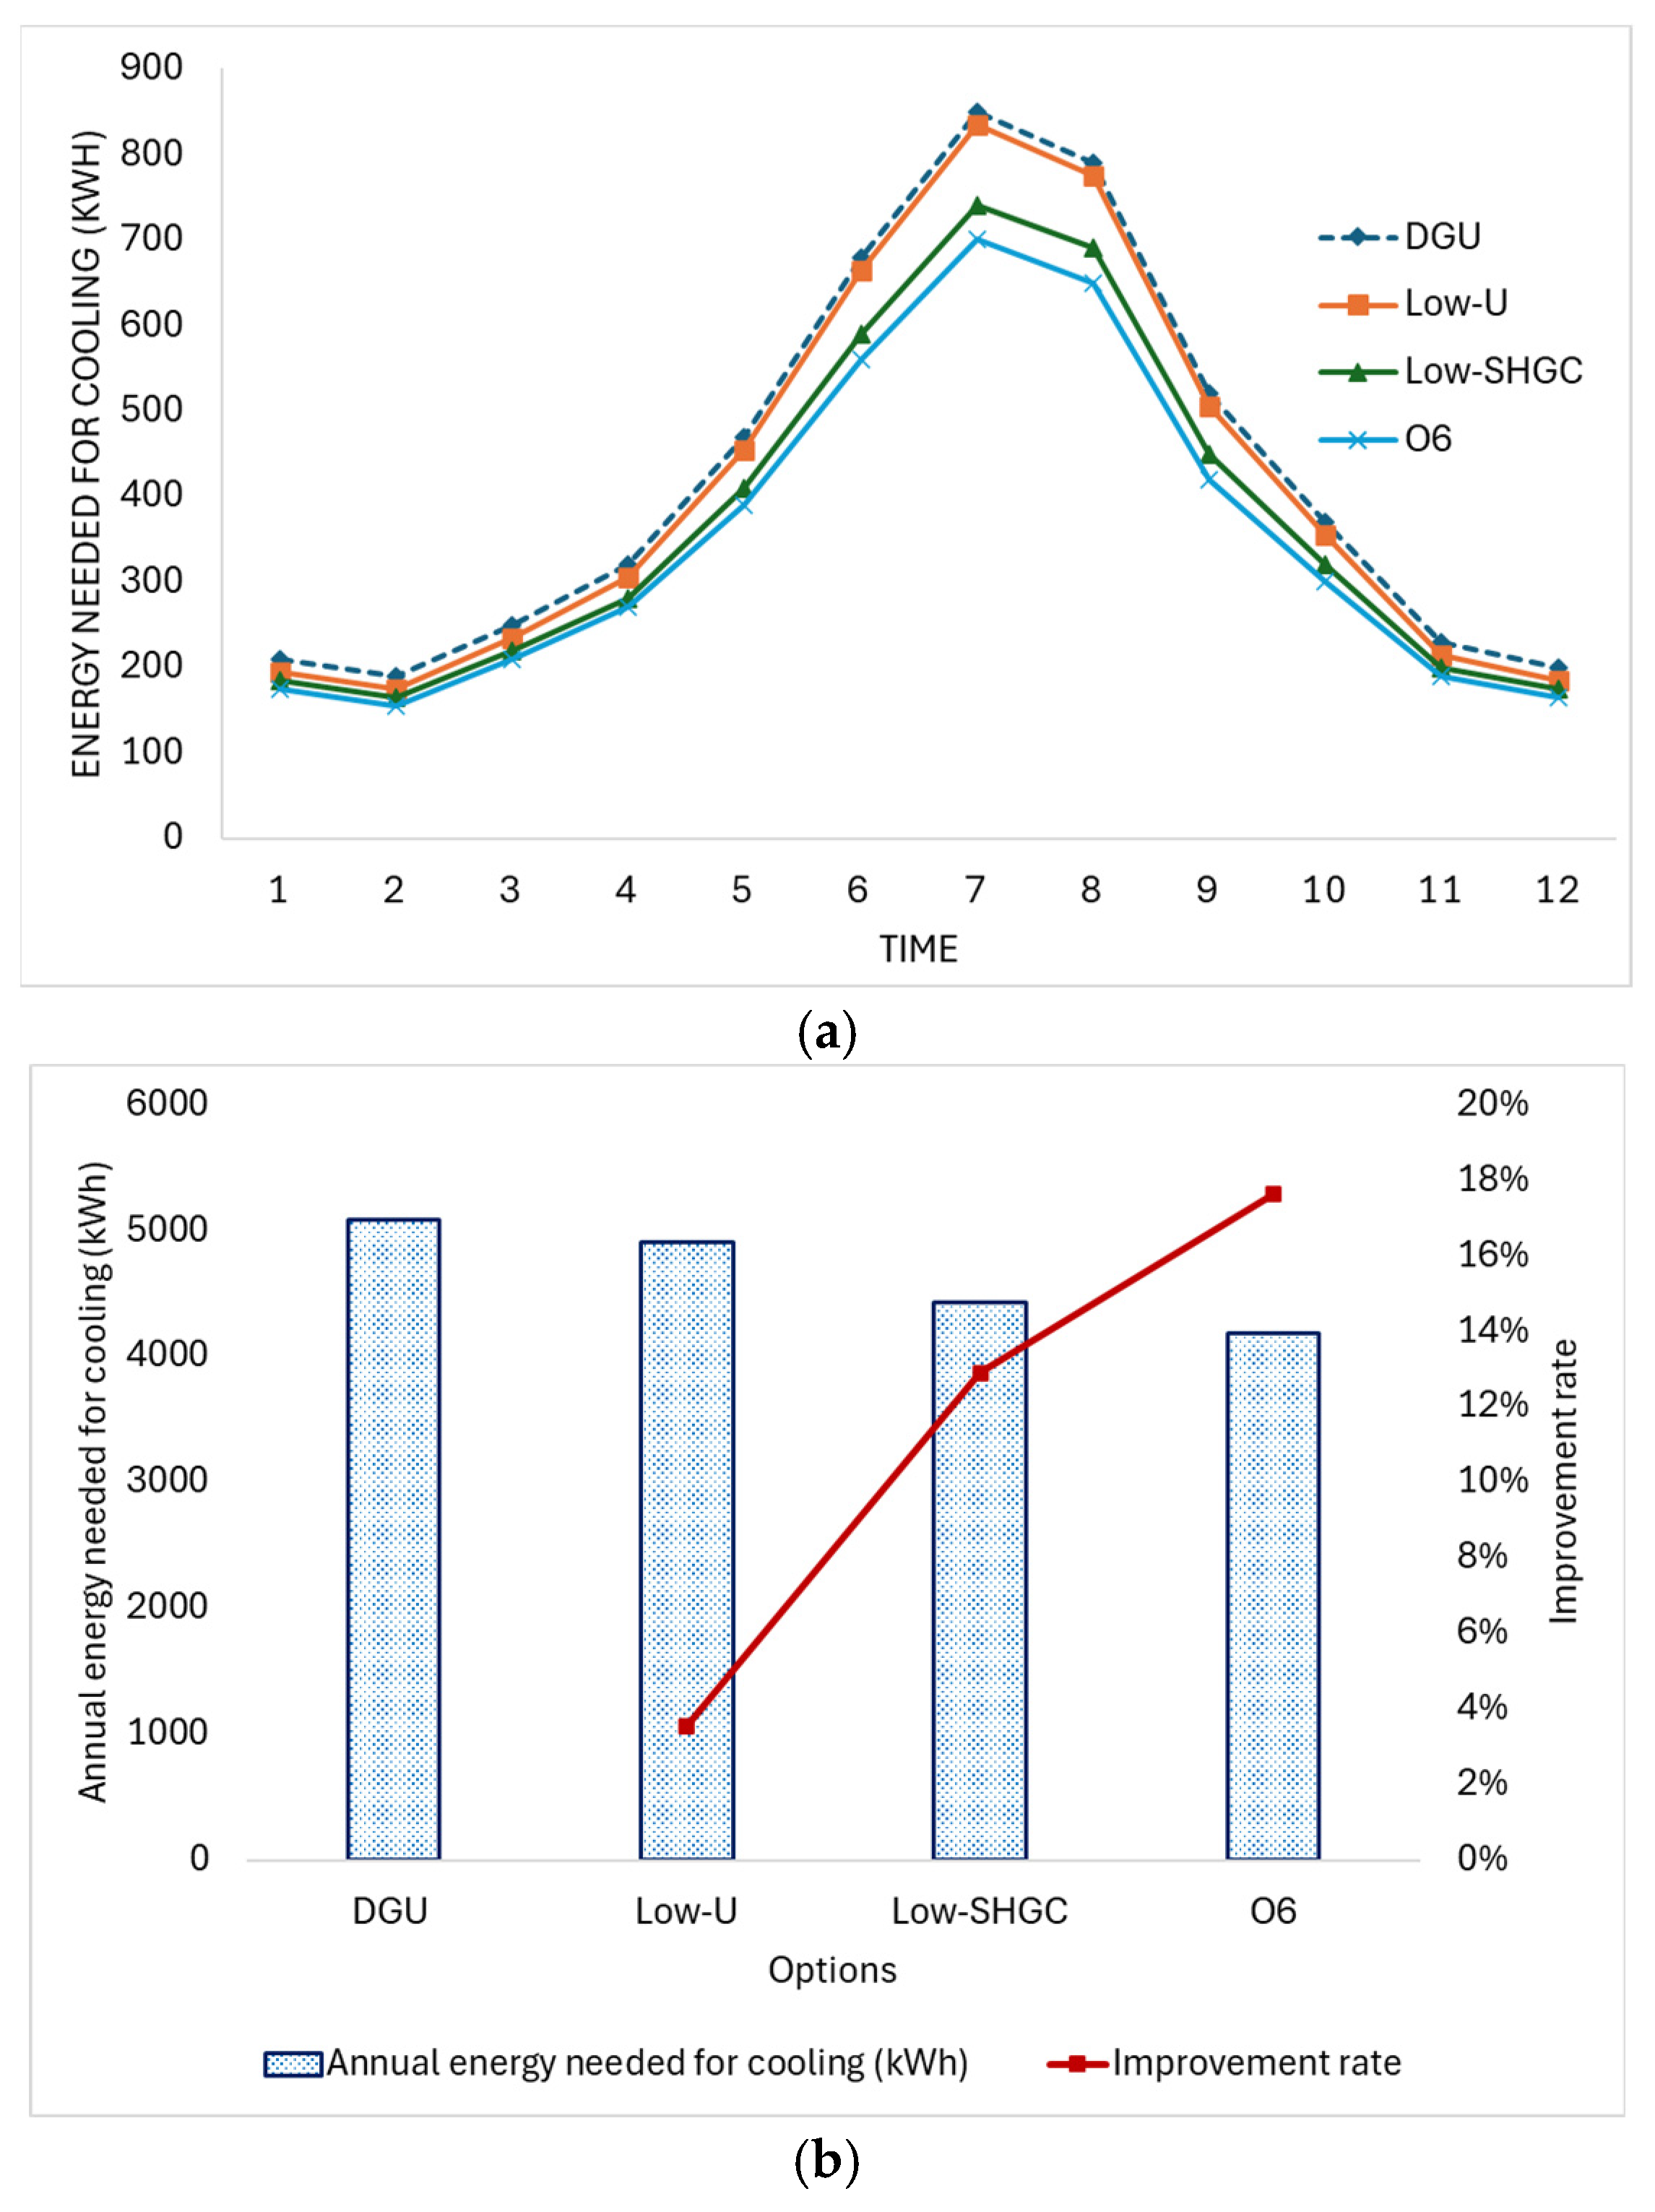
Then, further investigation has been conducted to explore the effect of both U-value and SHGC on cooling energy demand separately. In this regard, a selective double-glazed unit (DGU) (U = 1.5 W/m2·K, SHGC = 0.35) has been set as a baseline benchmark to be compared to a low-U configuration (U = 0.7 W/m2·K, SHGC = 0.35) and a low-SHGC configuration (U = 1.5 W/m2·K, SHGC = 0.25). All these alternatives were evaluated in comparison to the most optimal solution identified during the initial phase of the investigation.
3. Results
A representative Saudi residential building in Jeddah was simulated to evaluate the thermal performance of PC window glazing. The case of BC is employed as a reference for comparative analysis. Subsequent investigations isolated the effects of U-value and solar heat gain coefficient (SHGC) on cooling energy demand. A selective DGU served as the baseline, against which two variations were tested: (1) a low-U configuration and (2) a low-SHGC configuration. These were compared to the optimal solution identified in preliminary simulations.
3.1. The Influence of the Proposed Advanced Glazing Options on Indoor Air Temperature
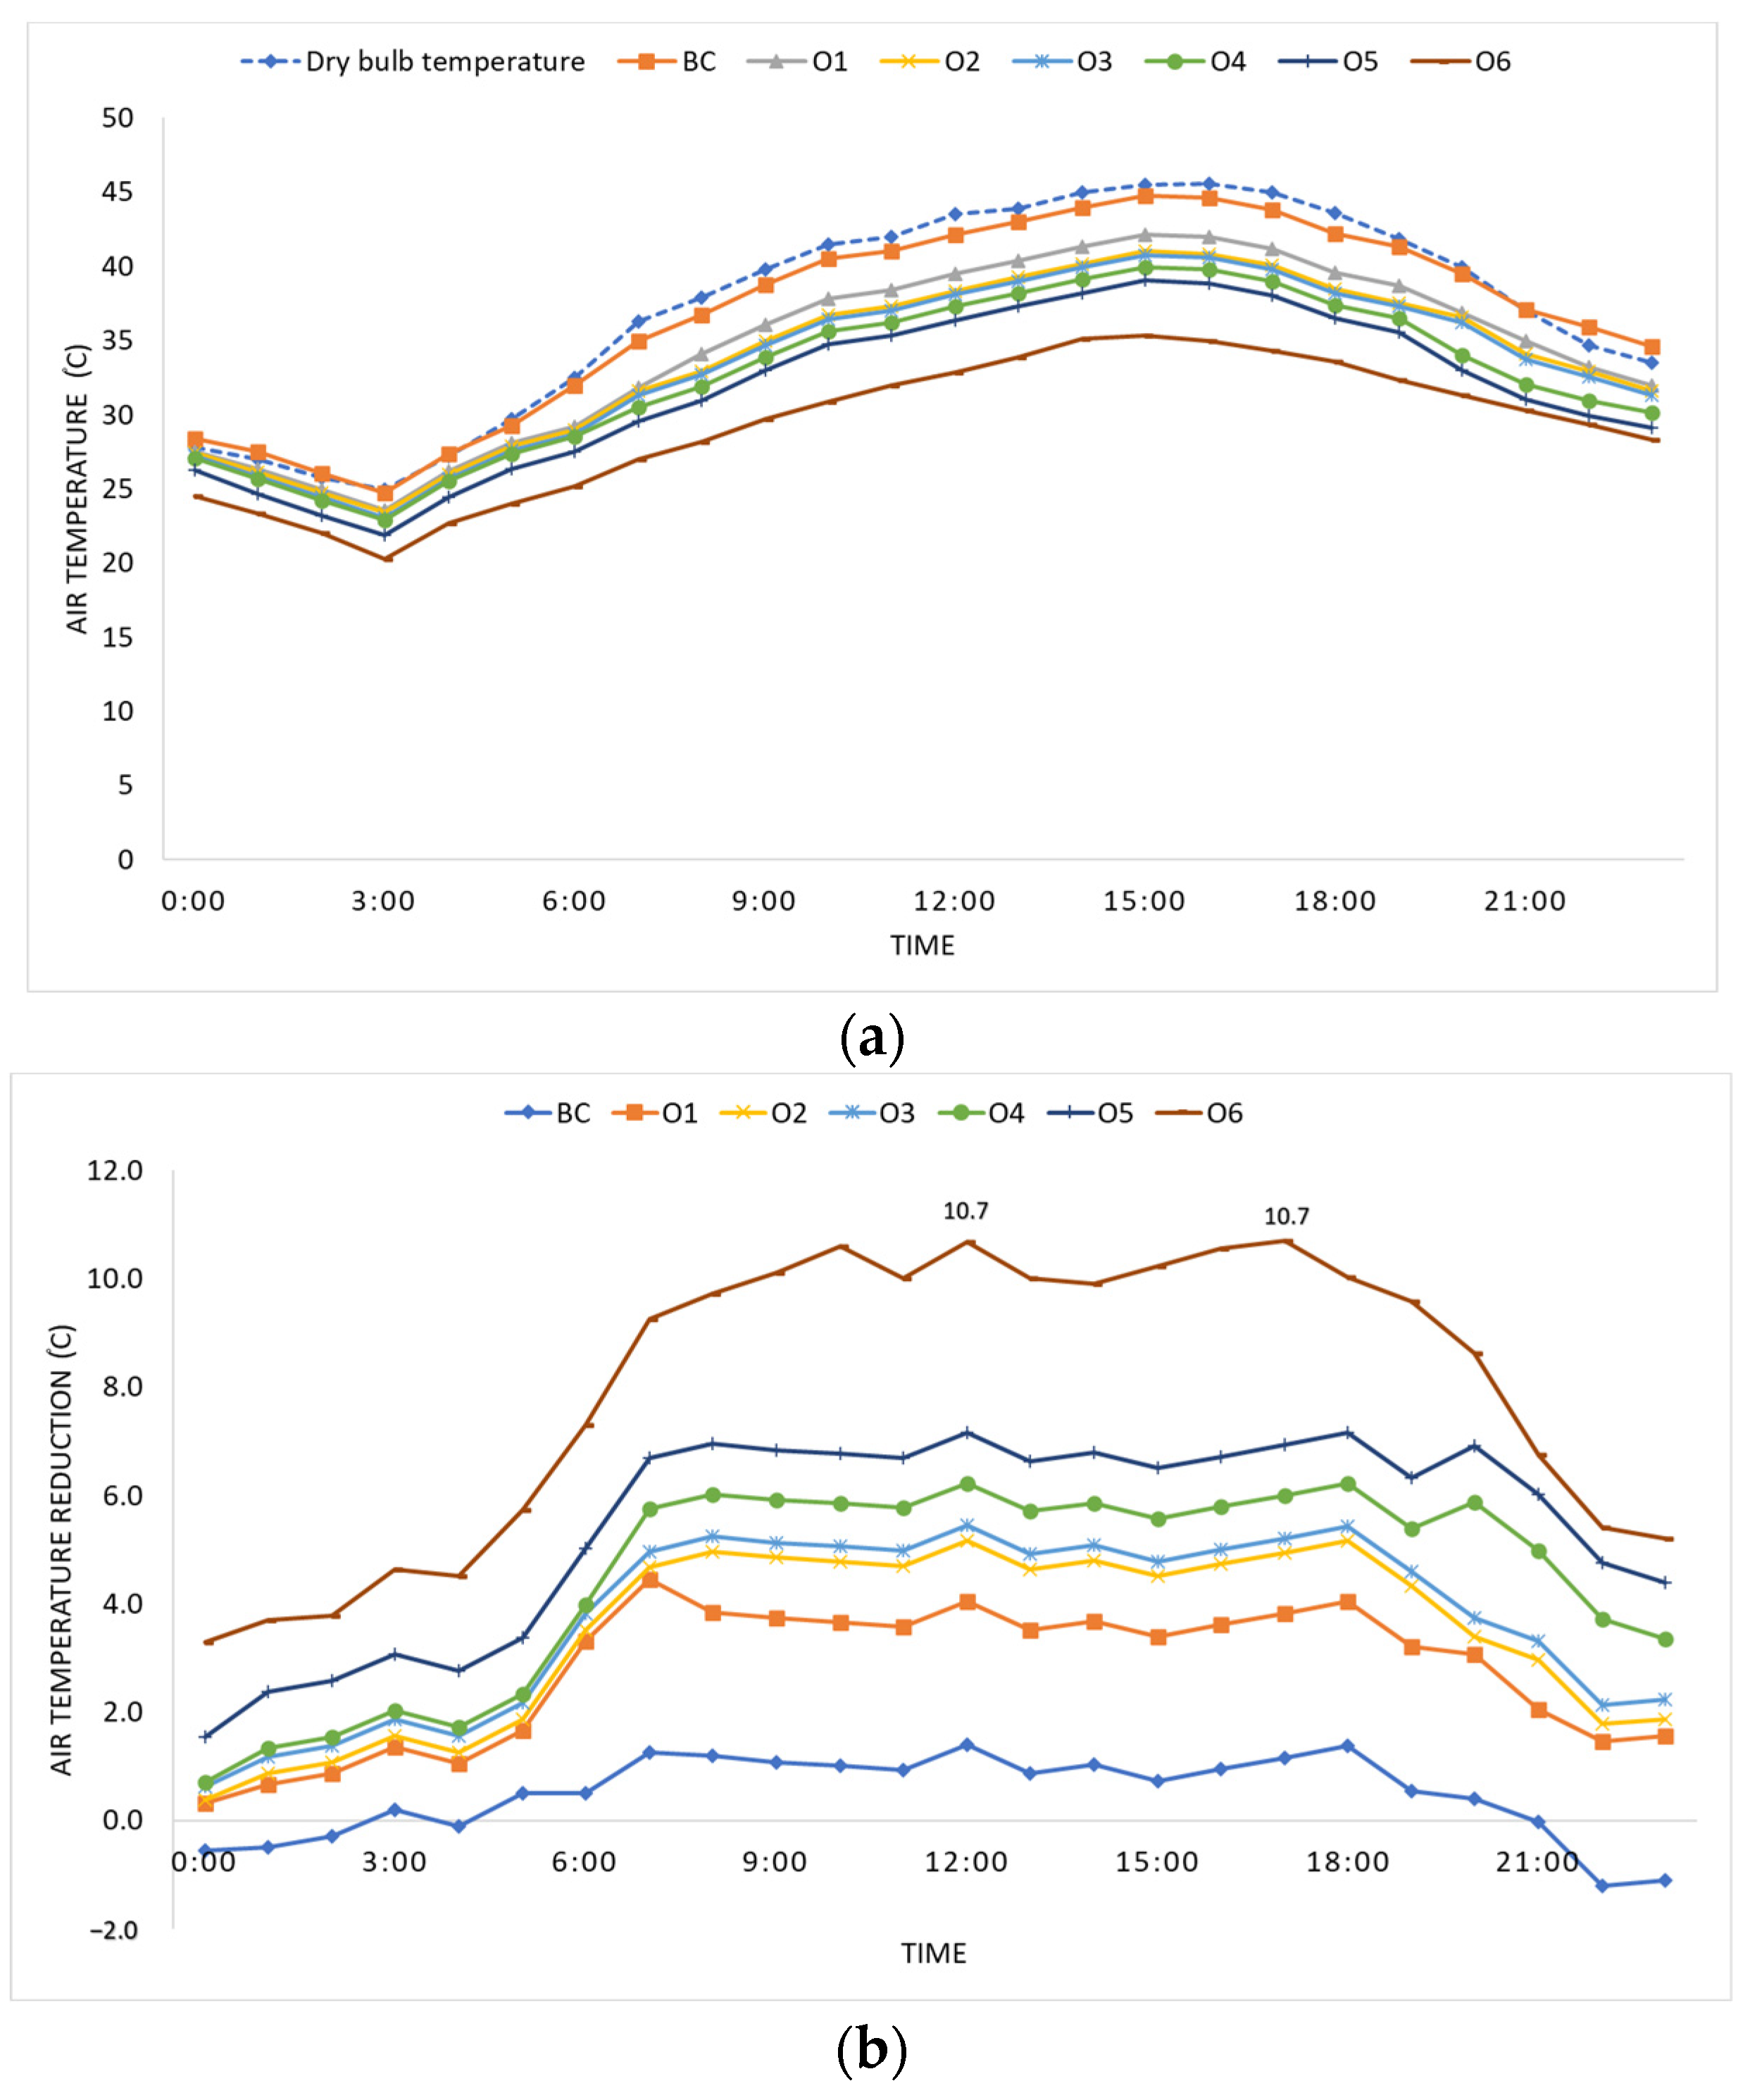
The ladies’ majlis was selected to examine the impact of the proposed glazing options due to its high occupancy during daytime compared to other spaces. Additionally, its southern orientation results in continuous exposure to direct solar radiation throughout the day, making it a suitable candidate for evaluating thermal performance and glazing effectiveness. The results demonstrate significant improvements in indoor thermal performance for all investigated glazing options (O1–O6) compared to the base case (BC), as shown in
Figure 8a. The base case, featuring a standard clear PC, exhibits the highest indoor air temperatures across all hours, reflecting its high U-value and SHGC. Optimized options, however, progressively reduce indoor temperatures, with the most substantial reductions achieved by the aerogel-based configurations (O4–O6). At peak outdoor temperature (around 15:00), the base case records an indoor air temperature of 45.53 °C. O1 reduces this to 44.81 °C (0.72 °C reduction), while the maximum temperature reduction of 10.7 °C was recorded for O6, occurring at 12:00 and 17:00 (
Figure 8b). During early morning (03:00), when outdoor temperatures are lower, O6 still shows a notable improvement, reducing indoor temperatures from 24.94 °C (BC) to 20.30 °C, a 4.64 °C reduction (18.6%). Over the day, BC’s average indoor air temperature is approximately 38.43 °C. In contrast, O6 achieves an average temperature of 30.09 °C, translating to a daily reduction of 8.34 °C, or approximately 21.7%. PC options (O1–O3) also offer meaningful improvements, with daily average reductions ranging from 2.86 °C for O1 (7.4%) to 4.73 °C for O3 (12.3%).
PC glazing with air gaps (O1–O3) provides incremental enhancements, with larger air gaps (e.g., 36 mm in O3) yielding more effective insulation. This results in temperature reductions of up to 5.47 °C at specific hours. Aerogel-based glazing (O4–O6) significantly outperforms PC options owing to its superior thermal insulation properties. For instance, O6 consistently maintains indoor temperatures below 33 °C throughout the late afternoon, a critical period for occupant comfort. The data underscores the critical role of advanced glazing systems in mitigating indoor heat gains during hot summer days. While PC options provide moderate enhancements, aerogel-based glazing demonstrates the highest efficacy, with O6 showing an average temperature reduction exceeding 20% relative to the base case. These results highlight the potential of advanced glazing technologies in enhancing indoor thermal comfort in hot climates like Jeddah.
3.2. Evaluating the Impact of PC Windows on Cooling Energy Consumption
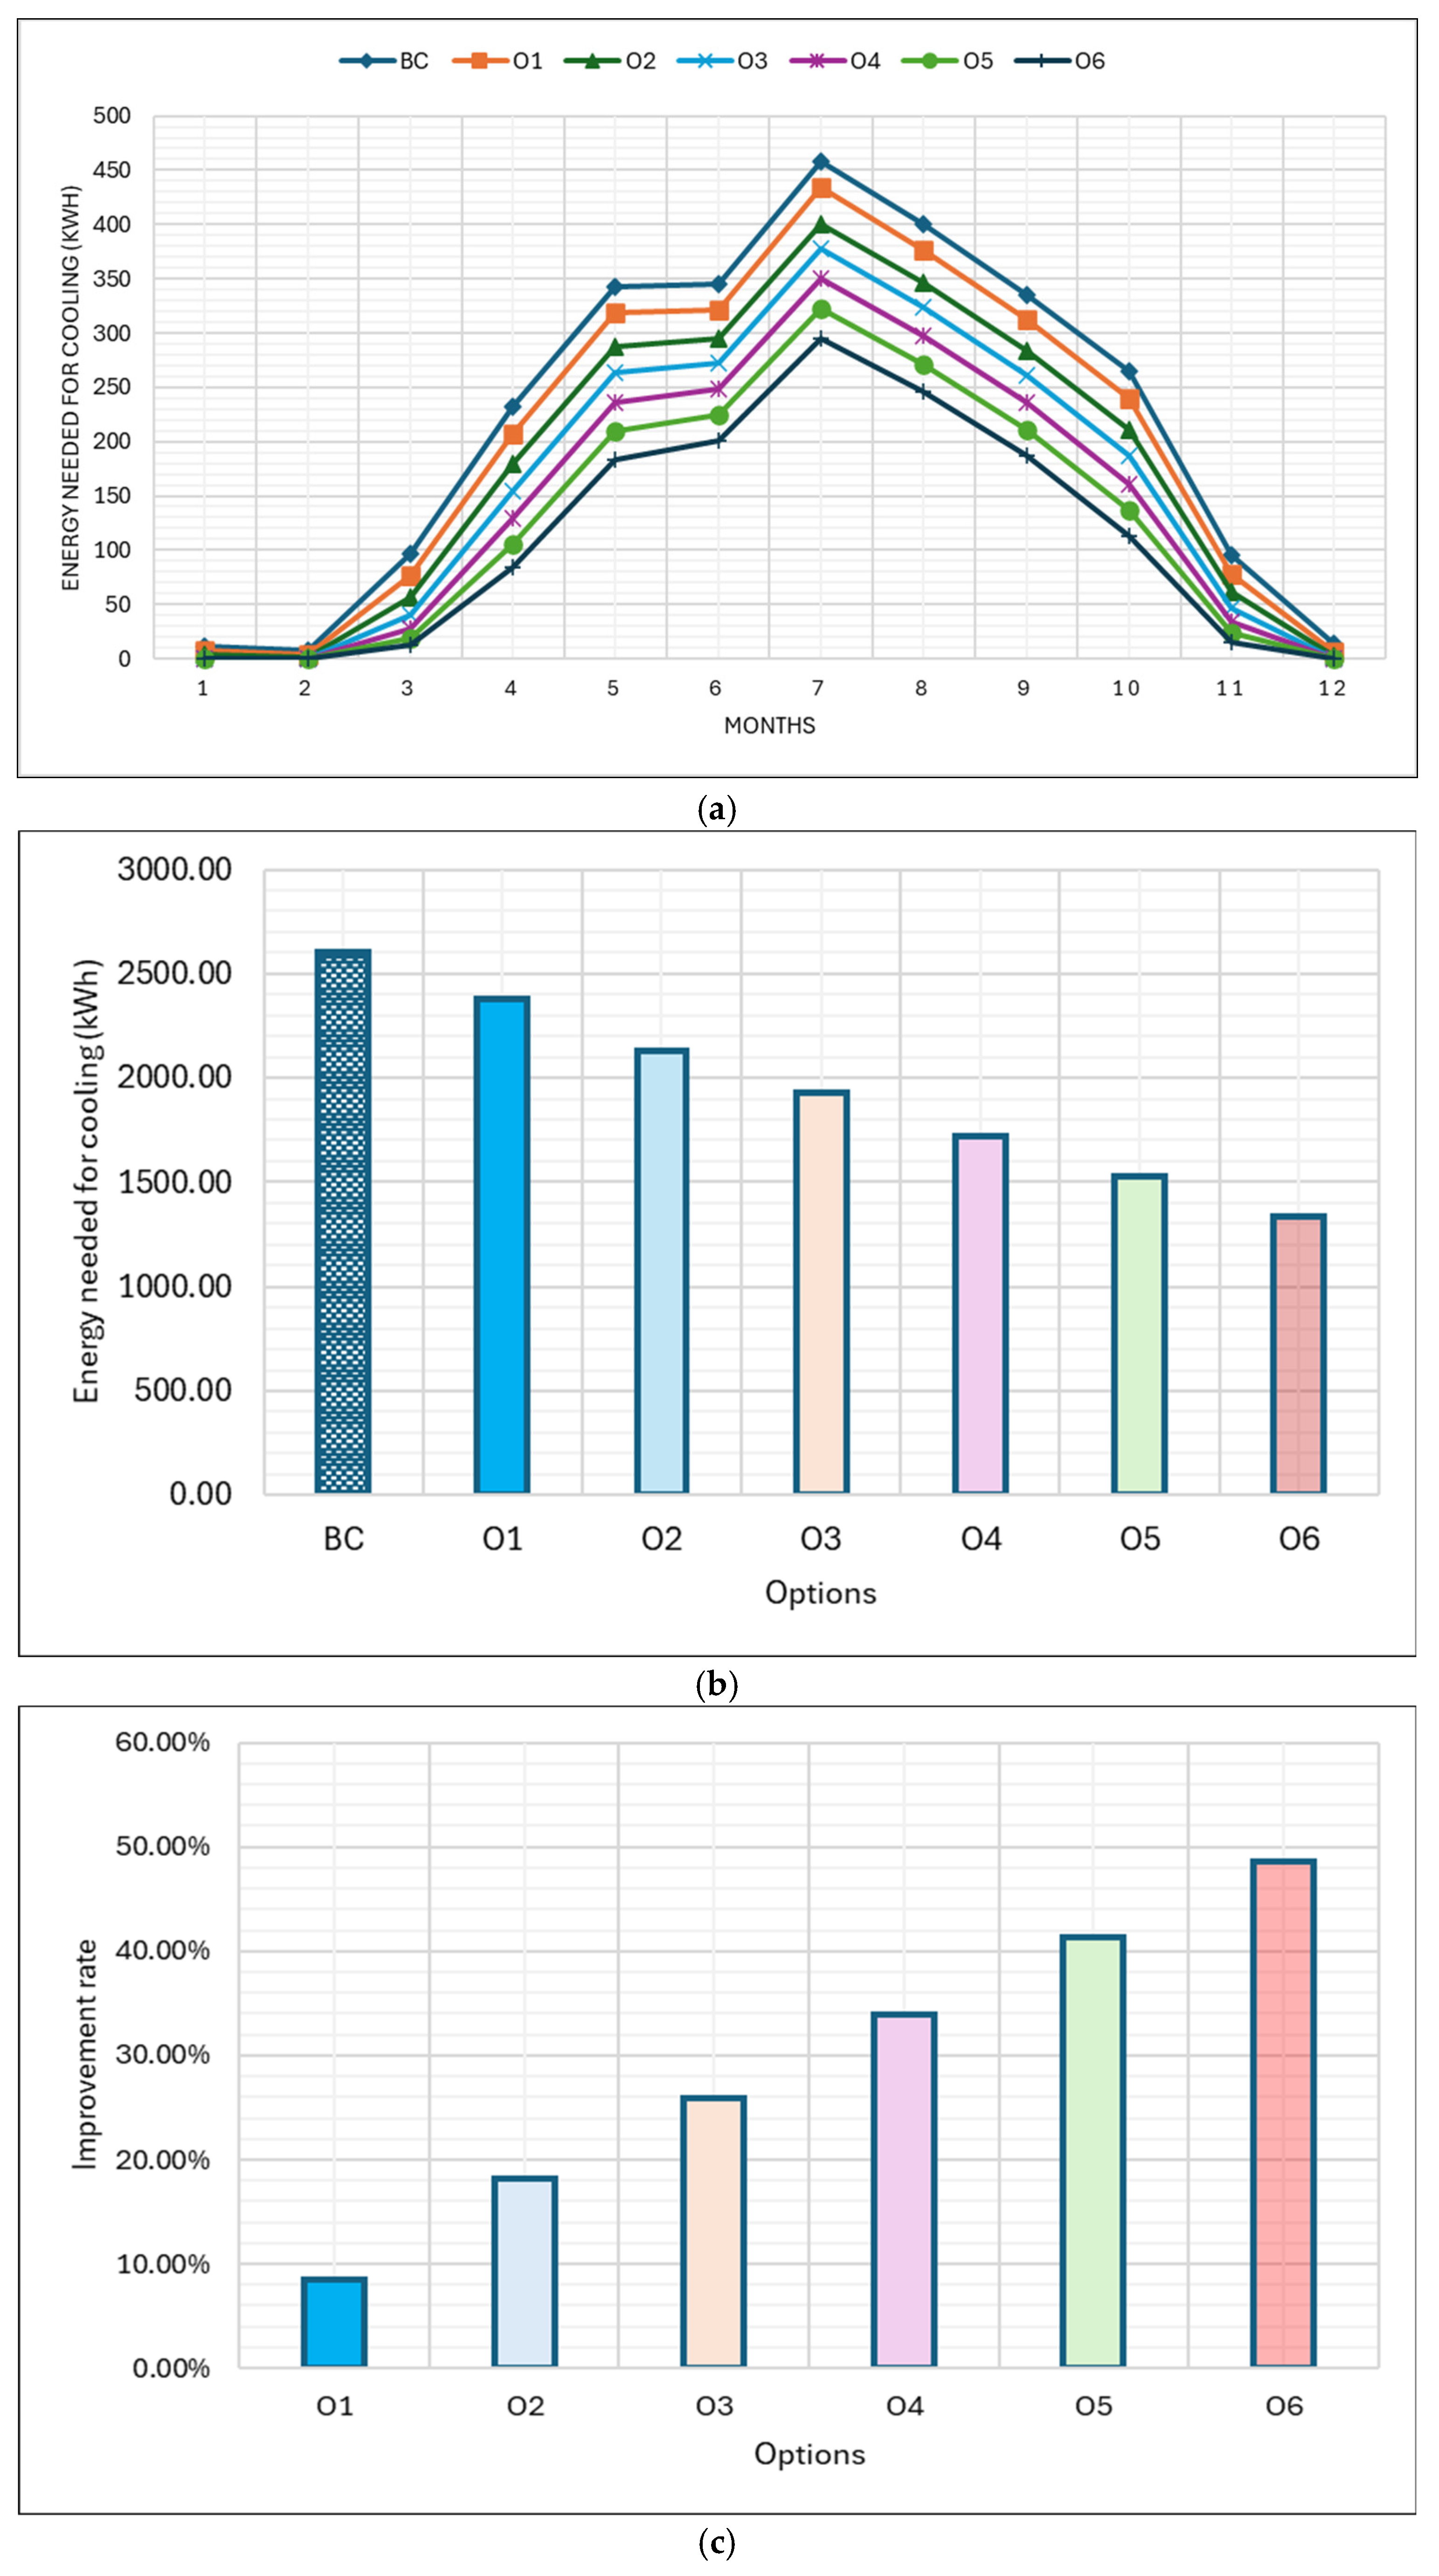
The study examines the impact of different glazing configurations (BC, O1–O6) on the cooling energy requirements of a typical family residence in Jeddah, highlighting their performance across monthly and annual scales. Cooling energy demand exhibits substantial variation throughout the year, with peak values observed during the summer months (May to August) and minimum levels during winter (November to February), as shown in
Figure 9a. Using standard clear glass, the base case (BC) consistently records the highest energy demand, reaching approximately 458 kWh in July. This indicates the limitations of traditional clear glass in reducing solar heat gains in Jeddah’s hot climate.
PC glazing (O1–O3), featuring air gaps of different thicknesses, shows noticeable energy efficiency improvements compared to the base case. O1, which has a 12 mm air gap, reduces monthly energy demand by 5–10%, while O2 (24 mm air gap) and O3 (36 mm air gap) provide reductions of up to 20–25% during the summer. These findings emphasize the importance of increasing air gap thickness to enhance thermal insulation. Superior performance is observed in aerogel-based glazing configurations (O4–O6), which outperform the PC alternatives. O6, with a 36 mm aerogel layer, achieves the lowest cooling energy demand, reducing peak summer consumption by approximately 35% compared to the base case.
On an annual scale, cooling energy demand consistently decreases as glazing configurations advance from BC to O6. The base case registers the highest annual cooling energy requirement at 2602.27 kWh, while O6 demonstrates the most significant reduction, requiring only 1337.63 kWh (
Figure 9b). This substantial decrease underscores the effectiveness of advanced glazing technologies in mitigating heat gain through windows, thereby reducing cooling loads throughout the year. Aerogel-based options consistently maintain the lowest energy requirements, even during winter when cooling demands are naturally lower.
The improvement rate, expressed as the percentage reduction in energy demand relative to the base case, highlights the progressive benefits of optimized glazing technologies. O1 achieves a modest improvement rate of 8.47%, indicating limited thermal performance enhancement compared to BC. Improvement rates increase with advanced configurations, with O2, O3, and O4 achieving 18.22%, 25.93%, and 33.84%, respectively. Aerogel-based options O5 and O6 exhibit the highest improvement rates, achieving reductions of 41.37% and 48.60%, respectively (
Figure 9c). These results emphasize the significant energy savings associated with high-performing glazing systems.
The superior performance of advanced glazing options can be attributed to their ability to regulate solar heat gain, thermal transmittance (U-value), and visible light transmission. The considerable difference between BC and O6 reflects the combined optimization of these parameters. O5 and O6 likely incorporate low-emissivity coatings and advanced insulation layers, which minimize energy transfer and enhance thermal comfort. While premium solutions like O5 and O6 align with energy-efficient design principles, their feasibility depends on initial costs, material availability, and local climatic conditions. Intermediate options (O2–O4) provide cost-effective alternatives, demonstrating that incremental enhancements in glazing specifications contribute to measurable energy savings while reducing operational costs and carbon emissions.
To elucidate the individual contributions of U-value and SHGC to cooling energy demand, this study expanded its analysis by comparing the most effective option (O6) with four critical window configurations. These include a baseline selective DGU (U = 1.5 W/m
2·K, SHGC = 0.35), representing commercially available low-emissivity glazing; a low-U configuration (U = 0.7 W/m
2·K, SHGC = 0.35), designed to evaluate thermal insulation effects; a low-SHGC configuration (U = 1.5 W/m
2·K, SHGC = 0.25), which isolates the influence of solar heat gain reduction; and an aerogel-enhanced glazing system O6 (U = 0.9 W/m
2·K, SHGC = 0.3) that combines both attributes. As illustrated in
Figure 10a, the analysis revealed distinct trends in monthly and annual cooling energy requirements.
The results demonstrate that SHGC is the dominant factor influencing thermal performance in hot climates. The low-SHGC configuration achieved cooling energy savings of 12–18% compared to the baseline DGU, closely matching the performance of the aerogel system despite the latter’s superior U-value (
Figure 10b). This finding underscores that SHGC reduction accounts for approximately 80% of the total cooling energy savings, with U-value improvements contributing a modest 2–5% increment. The baseline selective DGU delivers 80% of the energy benefits of the aerogel glazing at a substantially lower cost, establishing it as a practical and cost-effective solution for most applications.
Nevertheless, the aerogel glazing exhibits a notable trade-off. Its lower U-value leads to a 25% reduction in nocturnal cooling capacity compared to conventional glazing, potentially increasing mechanical cooling demand during early morning hours. These results affirm that prioritizing SHGC optimization has the most significant impact on energy savings in hot climates, while U-value enhancements provide secondary benefits.
3.3. The Effects of Proposed Advanced Glazing Options on the Operational CO2 Emissions
Figure 11a showcases monthly CO
2 emissions for the base case (BC) and six optimized options (O1–O6) across all months for the investigated building in Jeddah. The annual emissions for BC total 37,859 kg CO
2, serving as the reference point for assessing the improvements achieved by the optimized options. Across all options, a consistent reduction in emissions is observed, with O6 achieving the highest improvement rate of 33.7%, corresponding to an annual CO
2 reduction of 12,754.3 kg compared to BC.
Examining the monthly performance, the optimized options demonstrate varying levels of effectiveness. For January, the CO2 reduction ranges from 39.90 kg in O1 (a 4.47% reduction) to 342.61 kg in O6 (a 38.42% reduction). In July, a peak cooling demand month, BC emits 5451.36 kg CO2, whereas O6 achieves a substantial reduction of 1795.59 kg (32.96% reduction), underscoring the effectiveness of O6 in high-demand months. The improvement trend remains consistent throughout the summer, with August showing reductions from 187.7 kg in O1 (3.27% improvement) to 1946.71 kg in O6 (33.9% improvement). These figures highlight the superior performance of O6 in minimizing emissions during critical periods of cooling demand.
On an annual scale, all options achieve significant cumulative reductions, as shown in
Figure 11b. O1 reduces emissions by 1447.87 kg (3.8% improvement), indicating modest gains over BC. Meanwhile, O4, with an annual reduction of 8144.28 kg, achieves a notable 21.5% improvement. The impact of O6 is particularly noteworthy, as it combines efficiency enhancements across all months to deliver the most pronounced reductions (
Figure 11c). These results reflect the scalable benefits of each option and emphasize the substantial potential of advanced strategies like those employed in O6.
The analysis demonstrates a clear hierarchy of CO2 emission reductions across the six options. While all options achieve meaningful improvements over the base case, O6 stands out as the most effective solution, offering the highest monthly and annual reductions. The results highlight the critical role of adopting advanced energy efficiency measures to mitigate CO2 emissions in high-demand climates like Jeddah’s, contributing to sustainable environmental goals. These findings underscore the importance of scaling up interventions such as those exemplified by O6 to maximize emissions reduction potential across diverse contexts.
The analysis of annual energy consumption and CO
2 emissions across various glazing configurations reveals significant improvements in energy efficiency and environmental impact. The base case (BC) exhibited the highest energy consumption at approximately 2602.27 kWh and CO
2 emissions of 37,859.27 kg, underscoring the inefficiency of standard glazing in hot climates. In contrast, advanced options (O1 to O6) demonstrated progressively lower energy needs and emissions, with O6 achieving a remarkable energy saving of 1264.65 kWh (48.60% improvement) and a CO
2 reduction of 12,754.30 kg (33.69%). The regression analysis indicated a strong correlation between energy savings and CO
2 reduction, with an R-squared value of 0.9863, suggesting that 98.63% of the variability in CO
2 reductions can be attributed to energy savings (
Figure 12). The derived regression equation showed that each kilowatt-hour saved corresponds to an approximate reduction of 11.25 kg in CO
2 emissions, emphasizing the effectiveness of advanced glazing technologies. These findings support the integration of innovative glazing materials in residential buildings, particularly in regions like Jeddah, Saudi Arabia, aligning with the sustainability goals outlined in Saudi Vision 2030. Future research should focus on the long-term performance of these technologies and their combined effectiveness with other energy-saving measures.
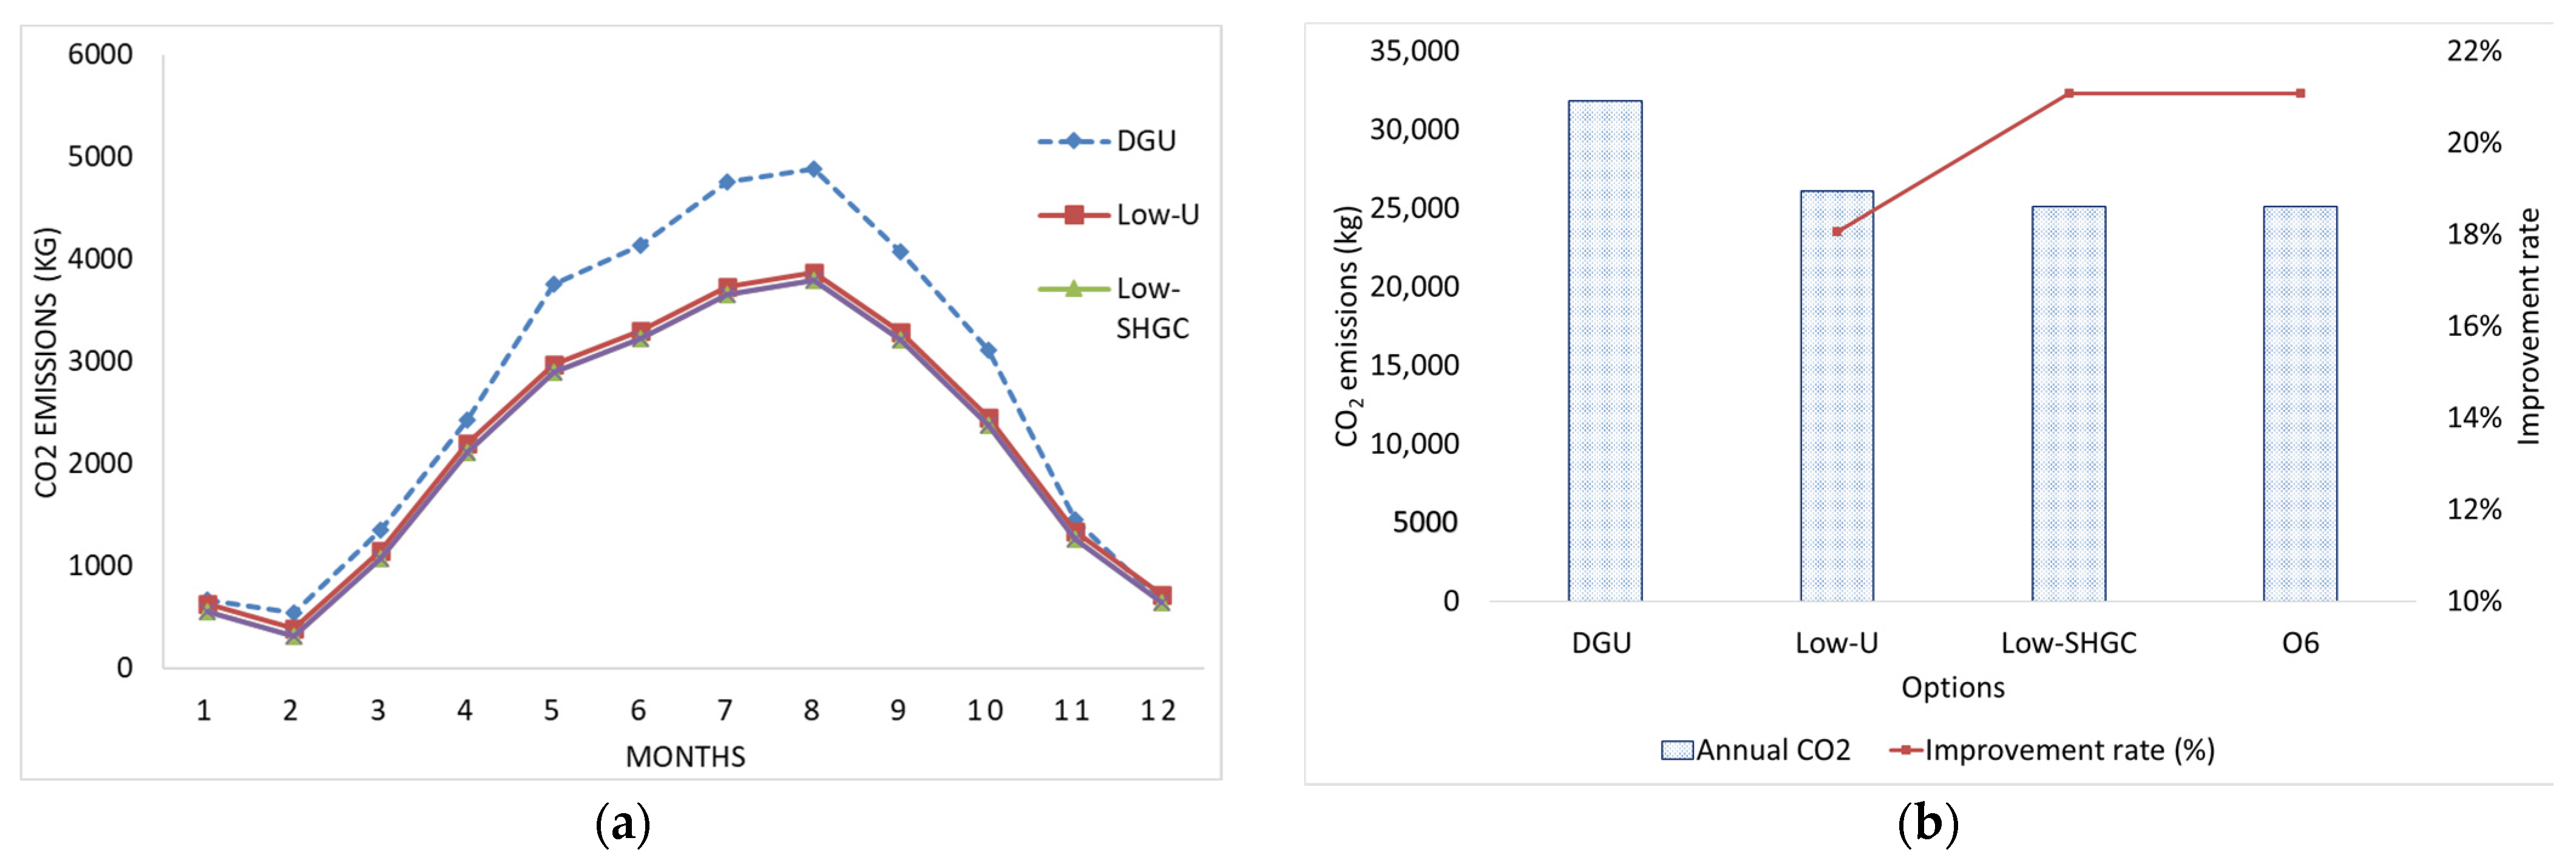
To enhance the study and provide more nuanced insights, a comparative analysis of CO
2 emissions was conducted to isolate the individual contributions of U-value and SHGC. The comparative CO
2 emissions analysis (
Figure 13) reveals critical insights into the monthly and annual glazing performance in Jeddah’s climate. The findings demonstrate that SHGC reduction drives the majority of performance gains in hot climates. The low-SHGC configuration achieved a 21.08% annual reduction in emissions, closely matching the performance of the aerogel-enhanced glazing, while the low-U configuration achieved a lower reduction of 18.06%. This 3.02 percentage point difference underscores the diminishing returns of U-value improvements below 1.5 W/m
2·K, particularly during cooling-dominated periods when SHGC contributes approximately 87% of emissions reductions. The baseline selective DGU emerges as a practical and cost-effective benchmark. It delivers 85% of the annual CO
2 emissions savings attributed to the aerogel glazing at a significantly lower cost. Moreover, its moderate U-value facilitates nocturnal heat dissipation, an essential factor for buildings located in climates with significant diurnal temperature variations.
4. Discussion
This study thoroughly assesses advanced glazing technologies and their influence on the energy performance of residential buildings in Jeddah, Saudi Arabia. The results indicate a distinct advantage of using innovative glazing solutions compared to conventional methods in this hot climatic region. Analysis of indoor air temperatures revealed a significant reduction in heat gain when employing advanced glazing systems, particularly those integrating aerogels. A decrease of more than 20% in average daily indoor temperature, relative to the base case, was observed with the most efficient configuration (O6), highlighting the effectiveness of aerogel as a high-performance insulation component. This superior performance directly results from aerogel’s unique nanostructure, which effectively minimizes all three heat transfer mechanisms while maintaining adequate visible light transmission [
34]. These findings align with prior research confirming aerogel’s effectiveness in reducing cooling loads in hot climates [
2,
35,
36,
37,
38]. While PC glazing with air gaps (O1–O3) also improved thermal performance, the temperature reduction was less pronounced, suggesting that increasing air gap thickness enhances insulation but not to the extent achieved by aerogel.
Further evaluation of cooling energy consumption reinforced the benefits of advanced glazing. A progressive reduction in monthly and annual cooling energy demand was observed as configurations advanced from the base case to optimized solutions. Notably, O6 exhibited the highest energy savings, highlighting its potential to significantly lower cooling energy requirements in residential buildings. This result aligns with broader research advocating advanced materials to enhance energy efficiency [
37,
38,
39,
40]. The observed improvement in energy efficiency with increased air gap thickness in PC glazing is consistent with thermal insulation principles, where air gaps act as barriers to heat transfer. Additionally, the study quantified the effect of advanced glazing on CO
2 emissions, a crucial factor in climate change mitigation. The findings revealed a direct correlation between energy savings and CO
2 emission reductions, with O6 achieving the most substantial annual decrease in emissions. The high R-squared value confirms this relationship, emphasizing the environmental advantages of energy-efficient glazing technologies. The derived regression equation, which estimates CO
2 reduction per kWh saved, is a valuable metric for evaluating the environmental impact of energy conservation strategies in buildings. For Saudi Arabia’s oil-dependent electricity sector, where each kWh saved prevents approximately 0.7 kg of CO
2 emissions [
41], these findings underscore the critical role of building technologies in national climate mitigation strategies. Model validation using field measurements and electricity bill data enhances the reliability of the study’s conclusions. Minor discrepancies between simulated and actual energy consumption were primarily due to assumptions regarding occupancy schedules, a standard limitation in building energy simulations.
Additionally, this study conclusively demonstrates that in Jeddah’s hot, arid climate, SHGC optimization yields substantially greater energy and emissions savings than U-value improvements, with SHGC reductions accounting for 87% of cooling energy savings. The selective double-glazed baseline configuration (U = 1.5 W/m2 K, SHGC = 0.35) delivered 85% of the aerogel glazing’s performance at a lower cost, while the low-SHGC option (U = 1.5 W/m2 K, SHGC = 0.25) achieved comparable CO2 reductions (21.08%) to the aerogel system, confirming SHGC’s dominant role in thermal performance. Notably, the aerogel glazing’s superior U-value (0.9 W/m2 K) reduced nocturnal cooling capacity by 25%, revealing an important trade-off for naturally ventilated designs. These findings establish that for cooling-dominated climates, glazing specifications should prioritize SHGC reduction below 0.3 while maintaining U-values around 1.5 W/m2 K for optimal cost-performance balance, providing critical guidance for energy codes and sustainable building design in alignment with Saudi Vision 2030 objectives.
The socio-economic feasibility of implementing these advanced glazing solutions in Jeddah requires careful consideration of cost, maintenance, and market readiness. While aerogel-integrated glazing (O6) demonstrates exceptional thermal performance, its high initial cost and specialized installation requirements may limit widespread adoption to high-budget or government-supported projects. DGU presents a balanced middle-ground option, offering substantial energy savings at relatively moderate costs and with familiar installation protocols that align with local construction practices. Polycarbonate (PC) glazing systems with air gaps (O1–O3) emerge as the most immediately viable solution for mass-market adoption, given their competitive pricing, ease of maintenance, and established supply chains in the region. However, our findings suggest that the long-term energy savings of aerogel solutions could justify their higher upfront costs, particularly for projects targeting net-zero energy performance. Strategic policy interventions, such as subsidies for high-performance glazing or green building certification requirements, could accelerate market acceptance of these technologies while supporting Saudi Arabia’s Vision 2030 sustainability objectives.
Despite its robust findings, this study has certain limitations. The analysis was restricted to a specific residential building model in Jeddah, potentially limiting the generalizability of results to other building types or climates. Furthermore, the long-term durability and economic viability of advanced glazing technologies were not explicitly examined. Future research could expand on these aspects by investigating diverse building typologies, conducting long-term energy performance monitoring, and performing comprehensive cost-benefit analyses. This study provides strong evidence supporting the efficacy of advanced glazing technologies in enhancing energy efficiency and reducing CO2 emissions in Jeddah’s residential buildings. The findings hold significant implications for building design and policy, particularly in alignment with Saudi Vision 2030’s sustainability objectives. Implementing such innovations can contribute to a more sustainable built environment while mitigating the environmental impact of the construction sector.


