Article

Influence of Water Temperature on Mist Spray Effectiveness for Thermal Comfort in Semi-Outdoor Spaces in Extremely Hot and Arid Climates

by
Ashraf Mohamed Soliman
1,2,*,
Dilshan Remaz Ossen
3,
Abbas Alwarafi
1 and
Amir Goli
3
1
College of Engineering and Design, Kingdom University, Riffa 3903, Bahrain
2
Faculty of Engineering, Minia University, Minia 61519, Egypt
3
School of Architecture and Design, University of Kansas, Lawrence, KS 66045, USA
*
Author to whom correspondence should be addressed.
Buildings 2025, 15(9), 1410; https://doi.org/10.3390/buildings15091410
Submission received: 16 March 2025 / Revised: 16 April 2025 / Accepted: 20 April 2025 / Published: 22 April 2025
(This article belongs to the Special Issue Climate-Responsive Architectural and Urban Design)

Abstract

:
The escalating summer heat in the Middle East and Northern Africa (MENA) region, particularly in Bahrain, poses a significant threat to human health, prompting the use of water mist systems for immediate heat stress relief and heat stroke treatment. Although these systems are known for their rapid cooling effects, the impact of varying water temperatures on their efficiency is not well understood. This research addressed this gap by investigating the effects of different water temperatures on cooling performance and user comfort in a semi-outdoor environment in Bahrain. Field experiments, comparing mist fan system (MFS) zones with non-misted areas, were conducted alongside user surveys to assess perceived thermal comfort. The findings revealed that lower water temperatures significantly enhanced cooling, with a 7.7 °C water temperature achieving a 4 °C temperature reduction and improving perceived comfort. The MFS effectively shifted participant perceptions from “Hot” or “Slightly Warm” to “Natural” or “Slightly Cool”, confirming its rapid heat mitigation capabilities. Notably, 54.5% of participants preferred the system using the coldest water, citing immediate relief. Despite the substantial cooling benefits, achieving standard thermal comfort during peak heat remained challenging. Future research should explore nozzle optimization, wind effects, water usage, solar-powered system efficiency, and the impact of clothing on thermal comfort.

1. Introduction

The Earth’s climate has shifted dramatically over time, with the arid and semi-arid regions of the Middle East and Northern Africa (MENA) experiencing the most significant changes [1]. The vulnerability of cities in the MENA region to the effects of climate change, such as rising temperatures, water scarcity, and extreme weather events, is frequently highlighted in studies [2,3]. Research has focused on the urban heat island phenomenon in cities like Dubai, Abu Dhabi, Qatar, and Bahrain emphasizing the role of urbanization, land use change, and heat mitigation strategies [4,5]. Apart from that urban areas experience significant heat island effects exacerbated by factors such as lack of green spaces, extensive use of concrete and asphalt, and high energy consumption [6,7]. They are likely to persist in a warming climate, and rapid population growth will aggravate the negative effects of increased anthropogenic emissions on society [8]. If current trends continue, temperatures could rise to nearly 50 °C by the end of the century [9]. The above literature indicates that climate change will raise air temperatures in the Middle East to levels that are intolerable to the human body and societal well-being.
Bahrain, an island country with a semi-arid, humid subtropical climate in the MENA region, had a seasonal average maximum temperature of 40 °C in summer and an average minimum temperature of 14 °C in winter over the period from 1991 to 2020 [10]. Bahrain has one of the highest per capita CO2 emissions in the world and an energy-intensive economy. Several initiatives have been launched to lower CO2 emissions, mostly through mitigation techniques by stakeholders in the public and private sectors [11]. A study [12] conducted highlighted the importance of implementing large-scale grid-connected photovoltaic (PV) system in Bahrain. The integration of a PV system into any demanding project in Bahrain is recommended to reduce power generation costs and diversify electrical energy sources. Moreover, there is considerable concern about how temperature changes affect Bahrain’s human health. Notably, compared to respiratory mortality, cardiovascular mortality increases significantly more during heat waves [13]. In this way, evaporative and immersion cooling are the recommended immediate treatments for heat stress. Evaporative cooling involves spraying a mist of cool water (15 °C) on the patient’s skin and fanning warm air (45 °C) over the body [14]. However, it is recommended to cool patients outside the hospital using any available means [15].
Combining with PV systems, water mist systems have emerged as a highly potential solution for the immediate treatment of heat stress, particularly in the hot and arid climates of the MENA region, where passive cooling technologies often fall short [16,17]. Unlike shading systems, cool roofs, and green infrastructure, water mist systems utilize high-pressure water injectors to pulverize water into fine droplets of just a few tens of microns, allowing for rapid and efficient cooling of specific areas [18]. The finely atomized water droplets quickly evaporate, creating a cooling effect that significantly reduces the surrounding air temperature, thus providing immediate relief from heat stress. A study comparing various thermal environment improvement methods across hundreds of projects worldwide highlighted the superior cooling effects of spray-based evaporative cooling [19]. Another study demonstrated that these systems could reduce skin temperature by 1–3 °C within just 10 s, which is crucial for alleviating thermal stress [20]. Beyond immediate cooling, water misting systems enhance outdoor environmental quality by suppressing heat and consuming modest amounts of water without the need for custom-fit hydraulic systems. They are non-toxic, expel dust and pollutants, attenuate harmful solar radiation, and repel insects like mosquitoes and flies [21,22]. Moreover, water nebulization is recognized not only as a preventive measure against heat stress but also as an emergency treatment for heat stroke [16]. In this way, water mist systems have a high potential for providing immediate relief from heat stress in areas such as Bahrain. However, the design of water mist systems must be adapted to the specific needs and contextual conditions of the MENA region, ensuring they effectively address the physiological responses and thermal interactions between the environment and the human body.
To be more specific, these systems are flexible and effective in reducing extreme temperatures by lowering air temperature (Ta) and increasing relative humidity (RH). Atieh and Al Shariff [23] demonstrated that solar-powered misting systems could cool the air by 10 °C in a sub-tropical desert climate, with a maximum RH gain of about 25%. Additionally, Huang et al. [24] developed a quantitative model that showed mist spray systems could reduce Ta by 5–7 °C in hot environments, particularly when conditions are hot, dry, and wind still (Ta > 30 °C and RH < 70%). Considering the thermal perception of the human body, one study [21] found that 83% of participants felt uncomfortably hot outside the spraying area between 12:00 PM and 14:00 PM, and this percentage dropped to 4% upon entering the mist. Another study [25] compared subjects’ thermal perceptions before and after spending 2–10 min in the mist, demonstrating a reduction of 2–3 in thermal sensation in hot and humid extreme regions. Zhang [26] found that after 10 min in the mist on typical hot summer days in Qingdao, China, subjects’ thermal sensation decreased from between hot and slightly hot (+1.44) to near to neutral (+0.33), and thermal comfort increased from almost slightly uncomfortable (−1.13) to near to slightly comfortable (+0.76).
In fact, mist systems’ performance and human comfort are significantly affected by various environmental factors beyond Ta, such as humidity, radiation, and air velocity. For instance, while Huang et al. [27] concluded that the cooling efficiency of spray systems is better represented in dry and hot environments, Desert et al. [25] found that these systems also perform well in hot and humid conditions without significantly increasing ambient humidity. Higher Ta and lower RH accelerate droplet evaporation, suggesting that the initial environmental conditions significantly influence spray cooling efficiency [28,29]. Huang et al. [24] indicated that local humidity had a more significant cooling effect than temperature, achieving a cooling efficiency of 65% and reducing Ta by 5–7 °C at around 35 °C and 45% RH, while maintaining RH below 70%. Moreover, solar radiation is another critical factor, as it can accelerate water evaporation. Ulpiani [21,30] found that the intensity of solar radiation was negatively correlated with the drop in temperature during spray experiments, with 80% of subjects feeling pleasant warmth in the mist, indicating its suitability for highly irradiated regions. Oh et al. [31] reported that high evaporation intensity occurs when temperatures exceed 27 °C under strong solar radiation. Furthermore, wind or fan speed influences spray cooling efficiency by enhancing water evaporation but can displace droplets, reducing cooling effectiveness [24,32]. However, studies usually focus on calm or breezy conditions due to the difficulty of controlling wind speed during operations. Ulpiani [33] concluded that spray cooling effects were more apparent and measurable in still air conditions. Another study [34] simulated fine water mist in an outdoor setting mimicking a hot summer urban environment with variable wind patterns, finding that temperature drops reached 6.7 °C experimentally, while numerical simulations suggested reductions of over 10 °C in downwind conditions. Therefore, it is crucial to consider the actual context, such as the specific climatic and environmental conditions of regions like MENA, to understand the performance and optimize the effectiveness of water mist systems.
Furthermore, equipment setup is critical for optimizing efficiency, as water pressure, droplet size, and nozzle height all have a significant impact on cooling performance and outdoor thermal comfort [21,24,28]. Nozzle height and density are significant as they affect the cooling range and the wetting effects on pedestrians and roads [35,36]. Adjusting nozzle density by altering the number of nozzles and modifying nozzle height to control the distance from the user can fine-tune the system’s effectiveness. Studies [37,38] have demonstrated that higher pressure combined with smaller nozzles enhances cooling. Montazeri et al. [39] examined the effects of varying water flow rates and nozzle heights, finding that both factors significantly influence performance. The optimal water pressure for high-pressure spraying is from 2 MPa to 7 MPa, with a spray volume between 20 mL/min and 50 mL/min [27,40,41,42]. Additionally, Farnham et al. [36] found that nozzle diameter had a direct correlation with RH levels, though RH increased had a minimal effect on thermal comfort. Smaller droplet diameters are essential, as finer droplets remain airborne longer due to frictional forces, enhancing evaporation rates and cooling efficiency [43,44]. Fine droplets also better attenuate radiation, providing additional protection from harmful UV rays [22]. Moreover, Zhou et al. [45] highlighted that the gravity angle of nozzles affects heat transfer efficiency, with 30° or 120° being the most effective, and 180° being the least effective. Although these findings were often obtained under ideal conditions, they offer valuable insights for improving mist spray system operations and constructing effective setups. However, there is potential for further research exploration of these setups in actual contexts, especially in the MENA region, to understand the role of these and other factors like water temperature.
In particular, only one study has explored the effect of water temperatures on water mist performance. Zheng et al. [46] evaluated the cooling effect of a double-flow pneumatics spray nozzle installed in a climatic chamber to simulate different climates, ranging from temperate (Tokyo-inspired) to tropical (Singapore-inspired). The system used 7–9 µm water droplets with a nominal volume flow rate of about 1 L/h at a pressure of 3 bar. Tests were carried out with various combinations of wet bulb depression, pressure, and water temperature. The study found that the system could effectively cool even in high-Ta and -RH conditions, with the optimal spray cooling efficiency observed at a water pressure of 0.35 Mpa. The results indicated that water temperature had no significant impact on the cooling performance. Moreover, this result has been cited as justification for holding water temperature constant in simulation optimization cooling studies [47]. This finding, while informative, raises questions about its applicability in diverse outdoor environments. Applying these results to outdoor settings is challenging due to the controlled conditions of the climate chamber. Hence, there is a clear need for further research to understand the impact of water temperatures on water mist performance in real-world settings, particularly in the MENA region.
Therefore, this study aims to bridge the gap in existing research by focusing on the role of water temperature in enhancing the performance and effectiveness of water mist systems for rapid cooling. While the benefits of water misting for immediate heat stress mitigation are well documented, there is a lack of comprehensive studies on how varying water temperatures, such as ice water and other options, can further improve these systems. This research will explore the effects of different water temperatures on cooling efficiency and user thermal comfort. Research involving user samples will help to determine how temperature variations in water sprays might efficiently reduce heat and increase user comfort in outdoor surroundings. The study intends to provide empirical evidence on optimal water temperatures for misting systems, demonstrating how such modifications can improve their utility under hot, arid climates like in Bahrain and similar climates in the MENA region. The findings are expected to offer valuable insights into implementing more effective water mist cooling solutions in the MENA region, contributing to better heat stress management and overall environmental quality.

2. Materials and Methods

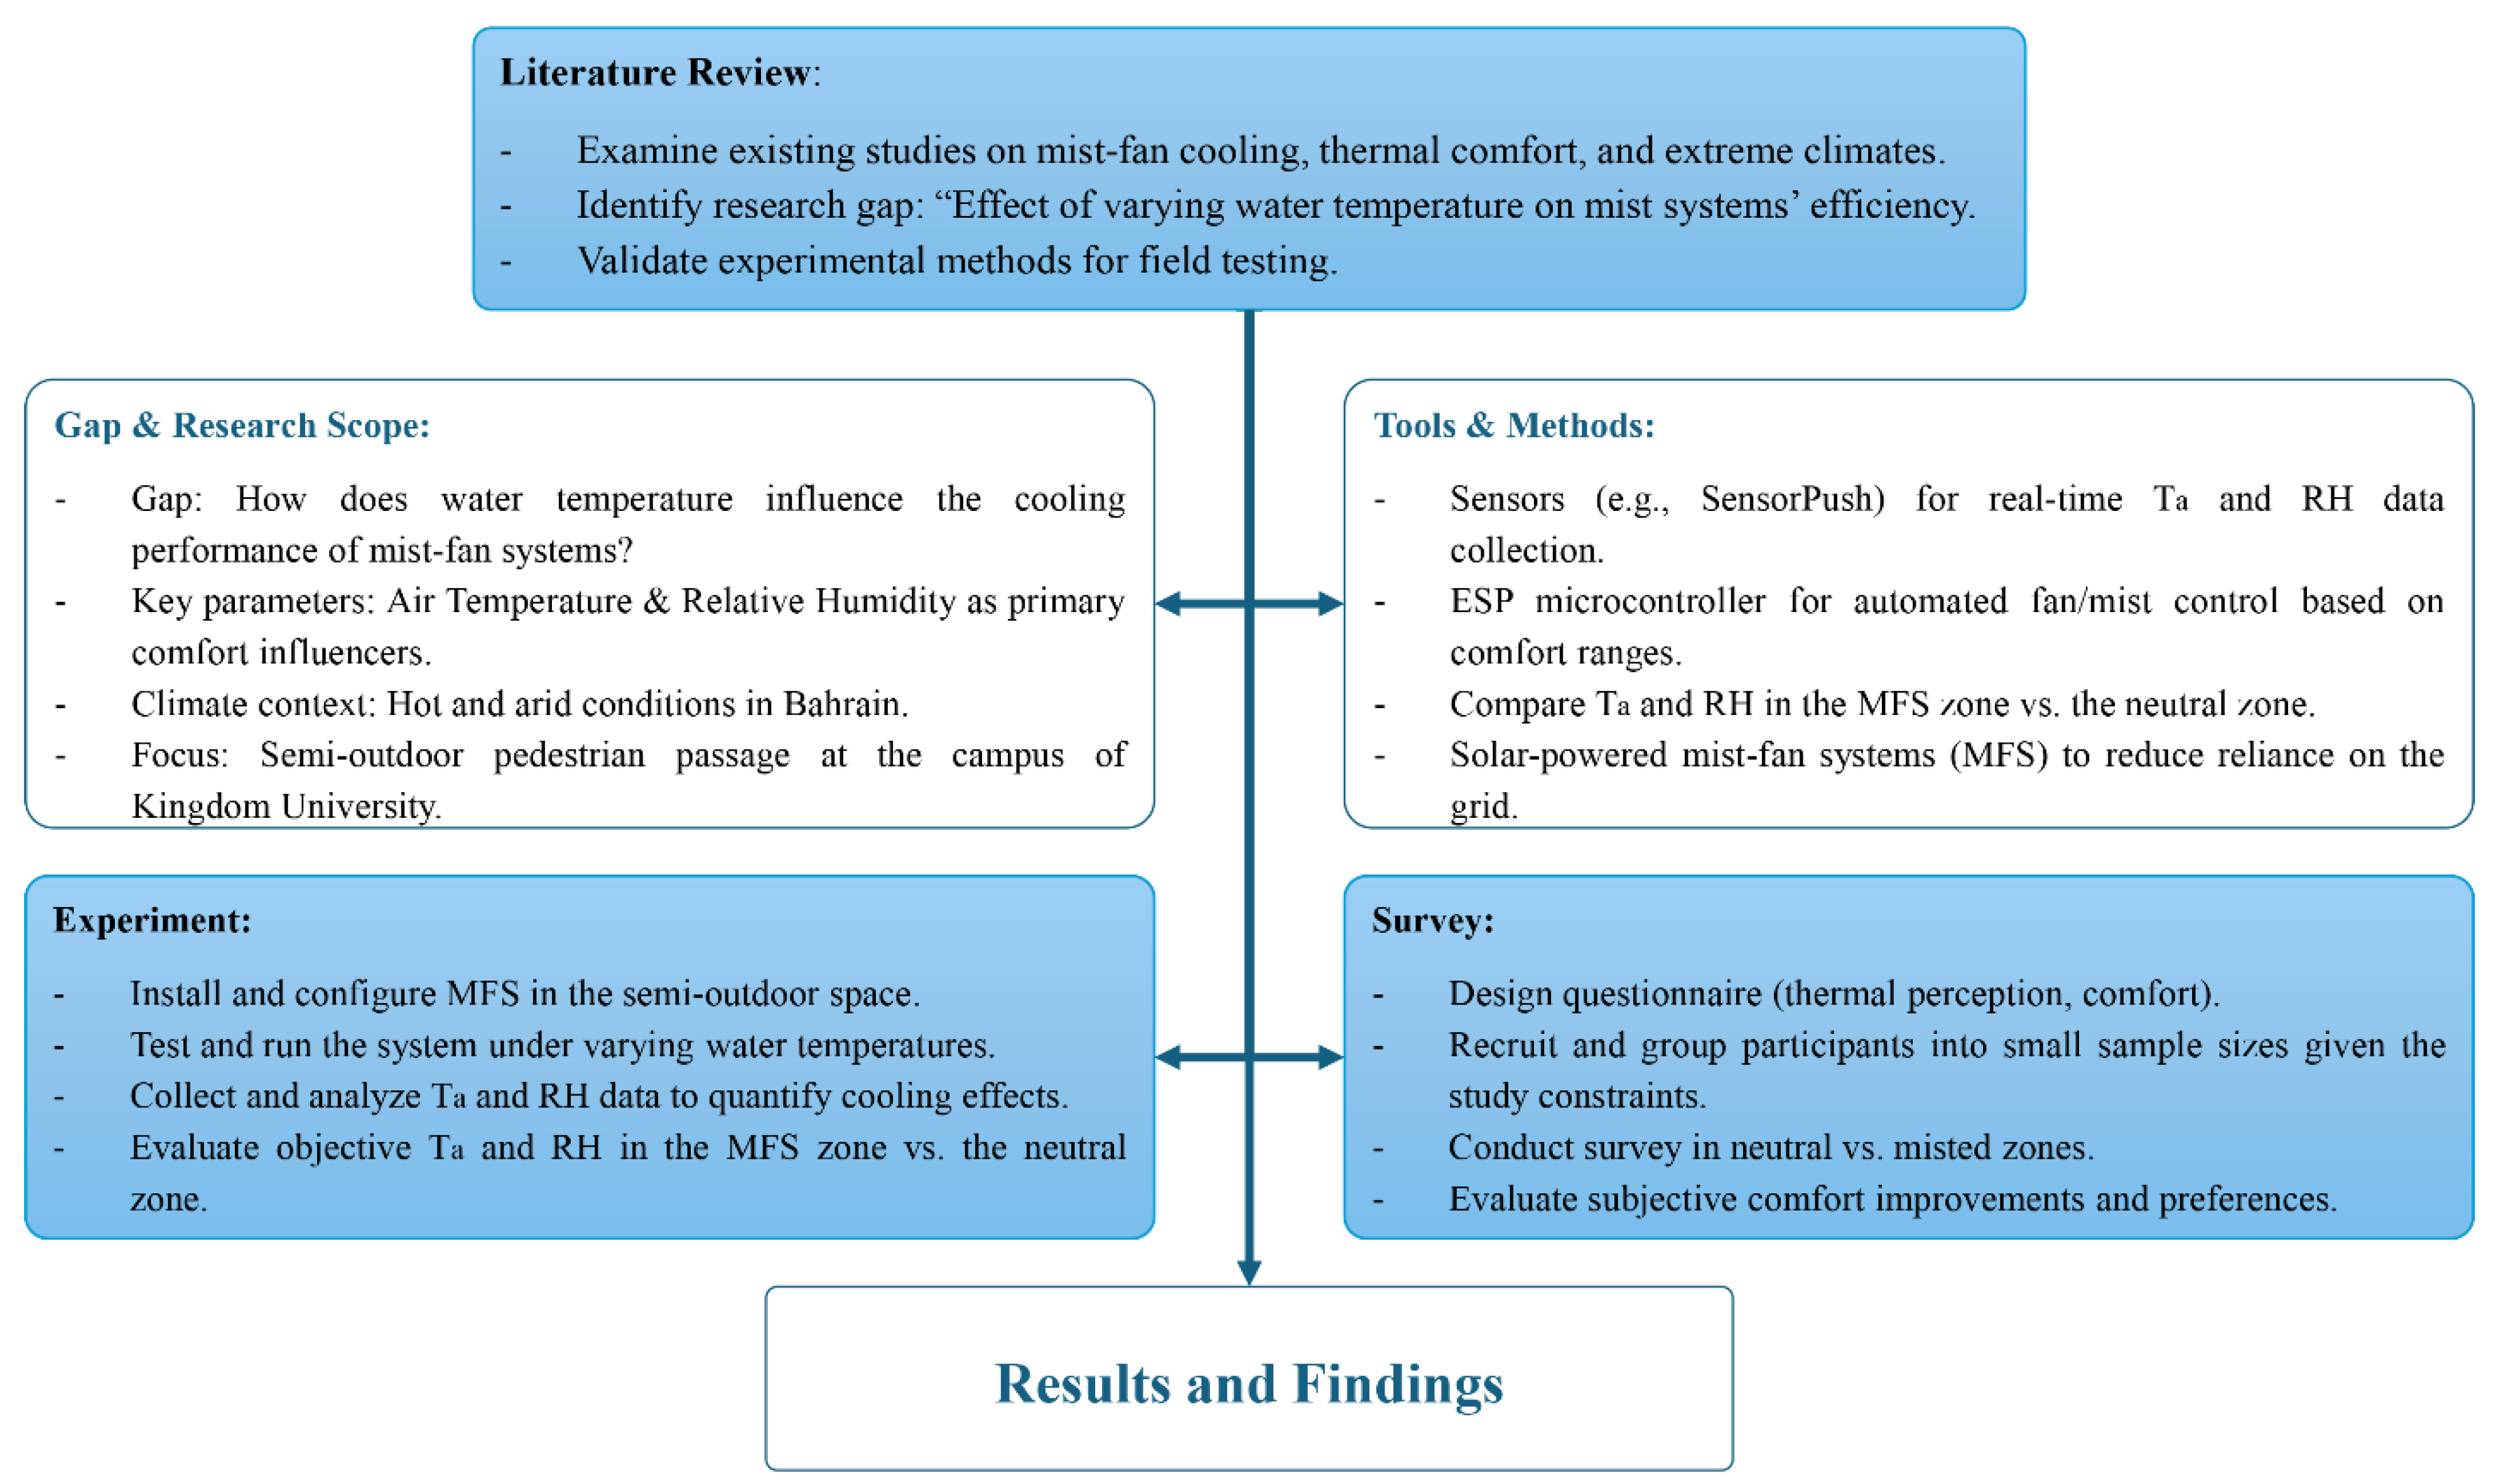
2.1. Research Methodology Workflow

This study employed a multi-method approach comprising three interrelated phases. First, a comprehensive literature review of over 50 articles and technical reports was conducted to identify research gaps, particularly regarding the influence of water temperature on mist spray systems, and to validate the experimental design and selected variables. Second, an experimental investigation was carried out through a comparative analysis of Ta and RH between two zones: a neutral zone (Zone 1) without cooling intervention, and a controlled zone (Zone 2) equipped with an automated mist fan system (MFS) programmed to enhance thermal comfort. This phase aimed to assess the real-world performance of the MFS under extreme climatic conditions. Finally, a participant-based survey was conducted in both zones to capture subjective thermal comfort responses and evaluate the system’s effectiveness from the users’ perspective. The integrated methodology is illustrated in the research workflow diagram (Figure 1).

2.2. Study Site

This study was conducted in a semi-outdoor pedestrian passage on the campus of Kingdom University in Bahrain (26°8′9″ N, 50°35′1″ E). Bahrain, located on the southwestern coast of the Gulf region, has a semi-arid, humid subtropical climate classified as BWh (tropical and subtropical desert) under the Köppen system [48]. The region experiences hot, humid summers and mild winters. Average annual temperatures are around 25 °C, with summer highs frequently exceeding 40 °C from June to September and winter lows ranging between 14 °C and 20 °C [49]. High RH, especially in summer, ranges between 70% and 80%, intensifying the heat [7]. The island’s monthly average humidity hovers around 65%, peaking at 88% in January and dipping to 39% in June. Predominantly northeasterly winds blow at speeds of 4.1–5.1 m/s throughout the year. In addition, Bahrain receives about 5.18 kWh/m2 of solar radiation daily and enjoys 9.2 h of sunshine per day on average. This harsh climate, with over six months of oppressive heat and humidity, often confines residents to air-conditioned interiors, accounting for more than 70% of household electricity use [50]. Taken together, these factors make Bahrain an ideal setting for investigating the effectiveness of mist spray systems, as its extreme heat and humidity pose significant challenges for cooling and energy management.

2.3. Experimental Setup

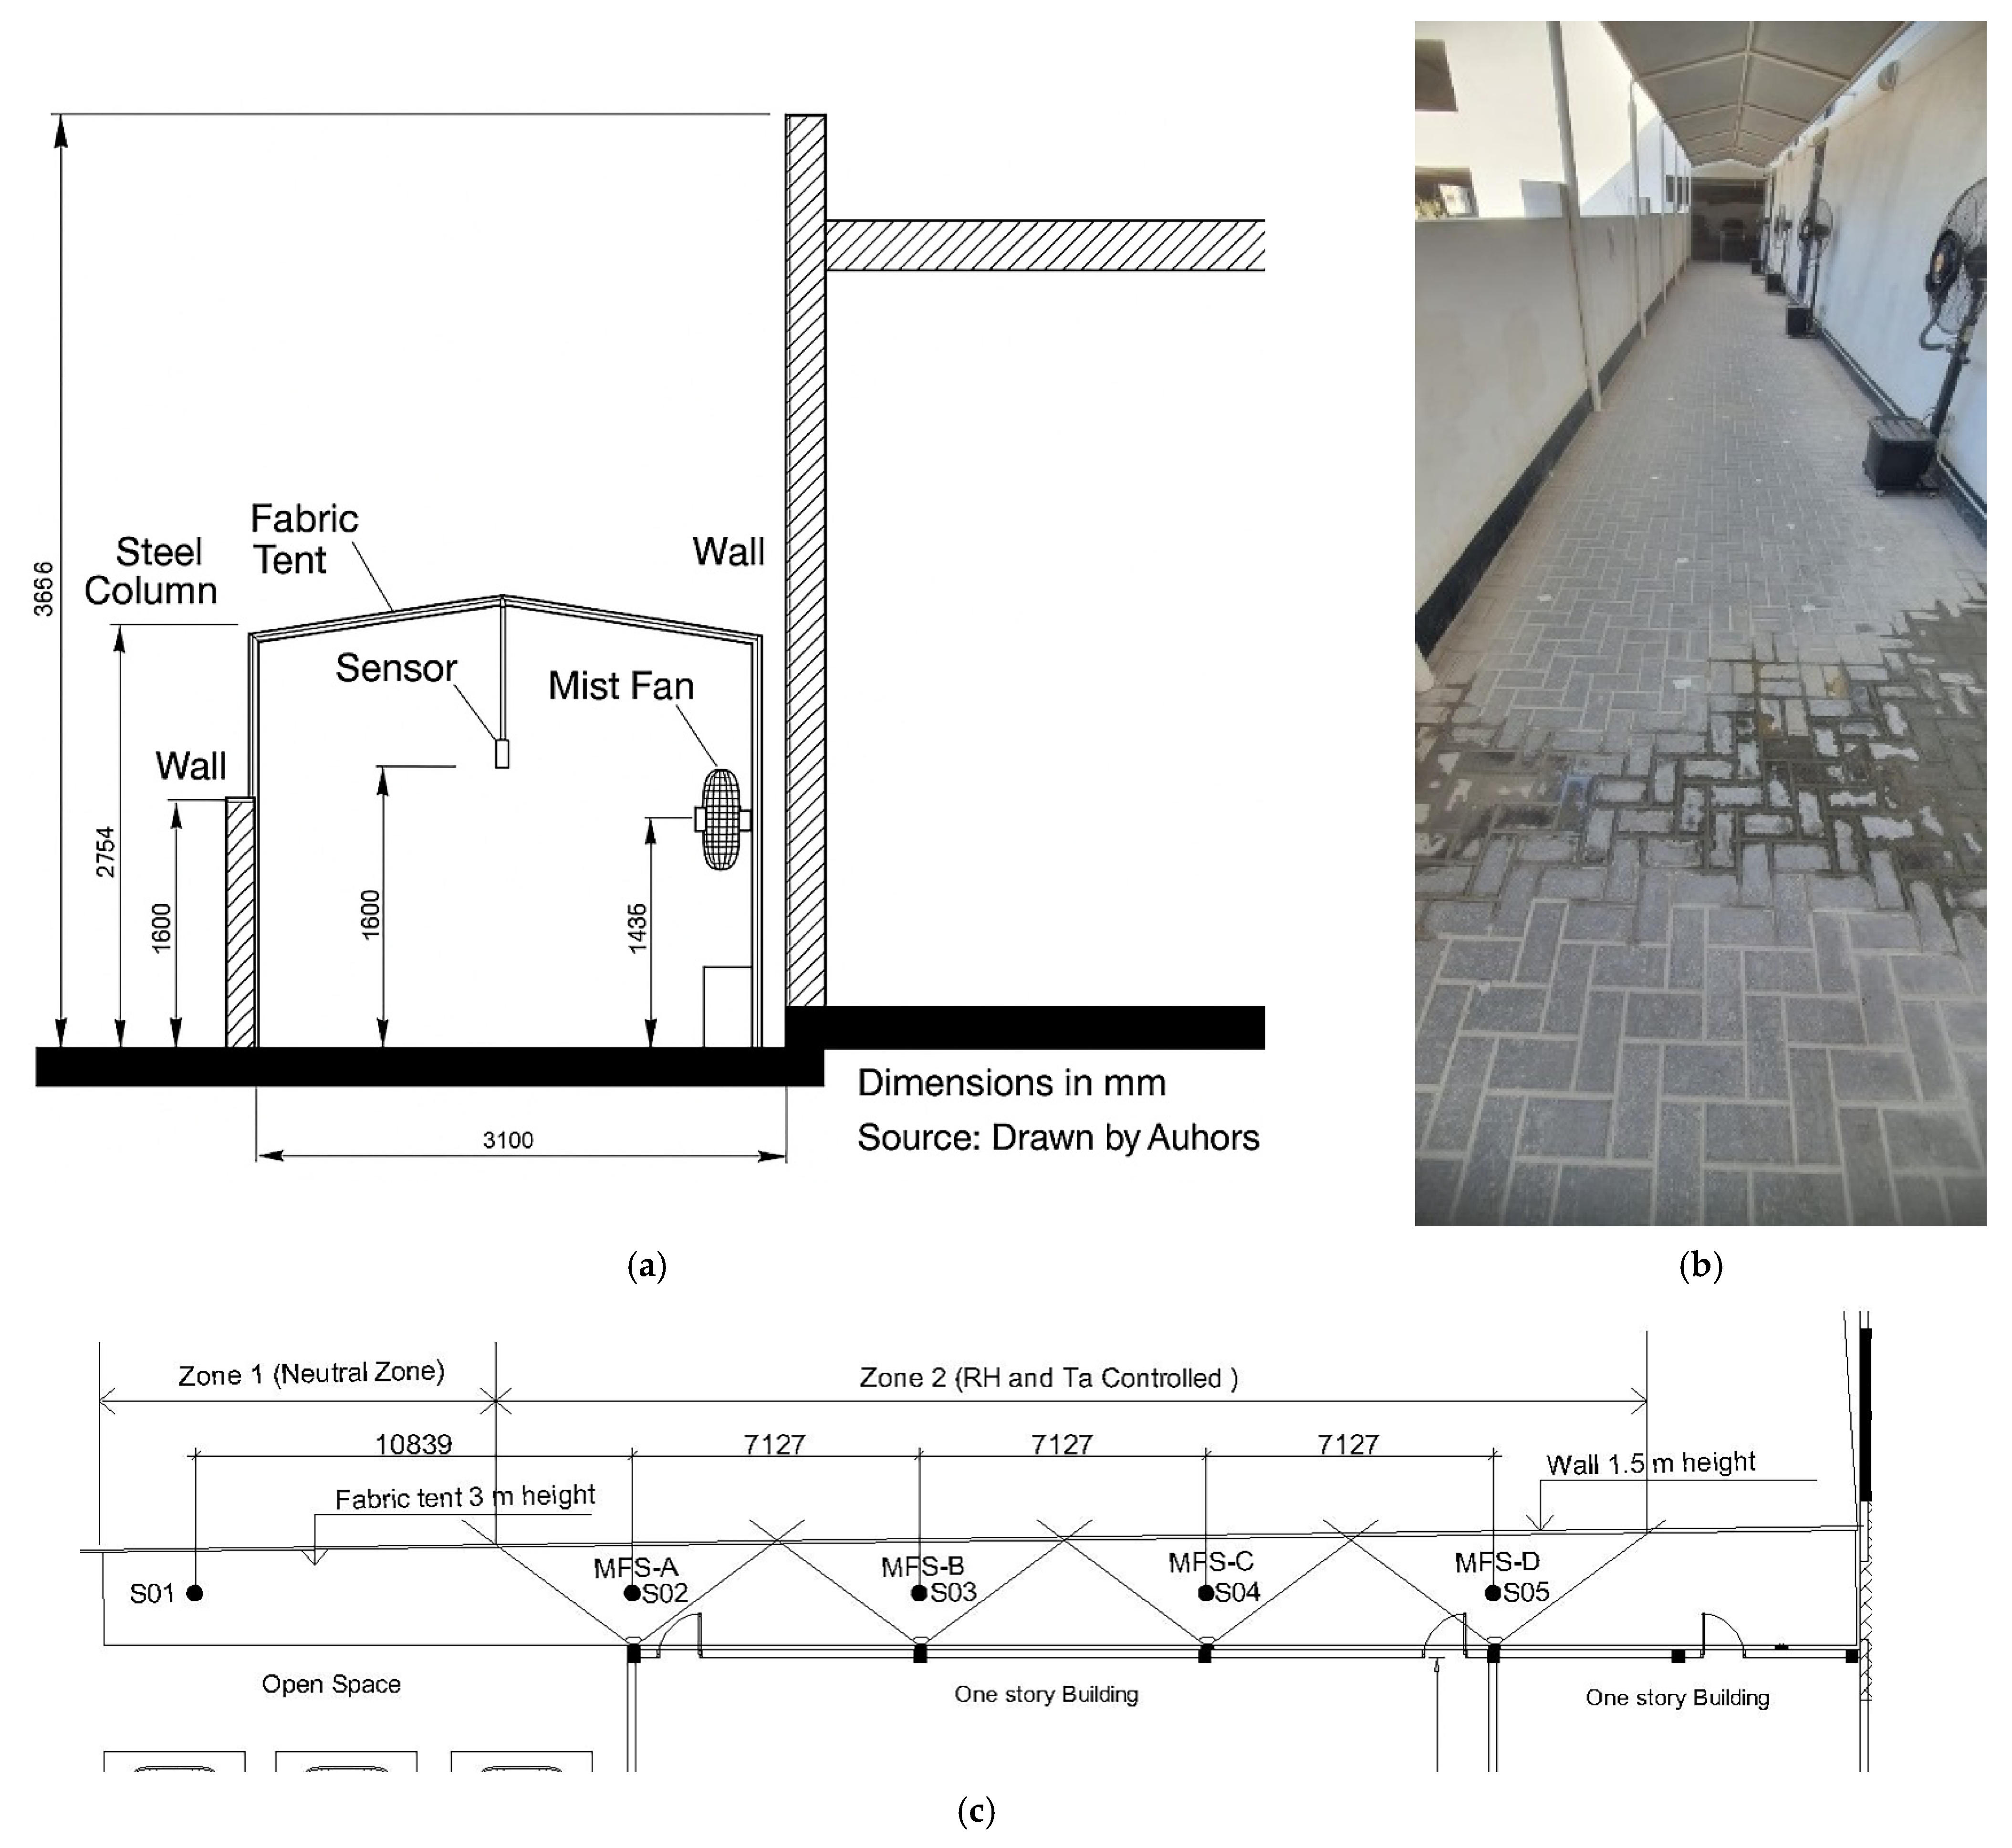
In this study, the experiment was conducted in a semi-outdoor pedestrian passage on the campus of Kingdom University, measuring 3.1 m in width and 38 m in length (see Figure 2). A fabric tent covered the passage, providing partial shading while still allowing exposure to ambient outdoor conditions. On one side, a 1.6 m-high wall bounded the area, while open spaces and single-story buildings flanked the other side, creating a controlled yet semi-enclosed setting suitable for the experiment.
The passage was divided into two main zones. Zone 1, located at the northern end, spanned the initial portion of the passage and included a sensor (S01) to monitor environmental parameters—specifically Ta and relative RH—without any active cooling, considered as a neutral zone. Zone 2 covered the remaining length of the passage and featured four MFSs: MFS-A, MFS-B, MFS-C, and MFS-D. Each system operated under different parameters to evaluate performance and identify the most comfortable configuration. The rotation mode of the MFSs was fixed to ensure that the airflow from all fans remained parallel. This configuration was established to prevent any single fan from affecting the surrounding area.
Prior to the installation of the MSFs, the authors calibrated all four fans to ensure uniform wind speed and consistent water consumption in the mist. All mist fans were equipped with a full tank of water and operated for one hour in a room with stable climatic conditions. The wind speed was measured in front of each fan at a constant distance from the center of the fan blades. After one hour, all fans were turned off, and the water consumption from each mist fan tank was recorded. No significant differences in wind speed or water consumption were observed among the mist fan systems.
Every MFS was installed at a height of 1.425 m (no rotation) and equipped with 192 nozzles. These nozzles had a diameter of 0.3 mm, a discharge radius of 0.15 mm, an average droplet size of 4.34 µm, and a flow rate of 0.05 L/min. Moreover, each MFS was monitored by a dedicated sensor (S02, S03, S04, and S05) for real-time Ta and RH readings, which informed the programming and control of the mist fans. The sensors (Sensor Push brand) followed the specifications detailed in Table 1.
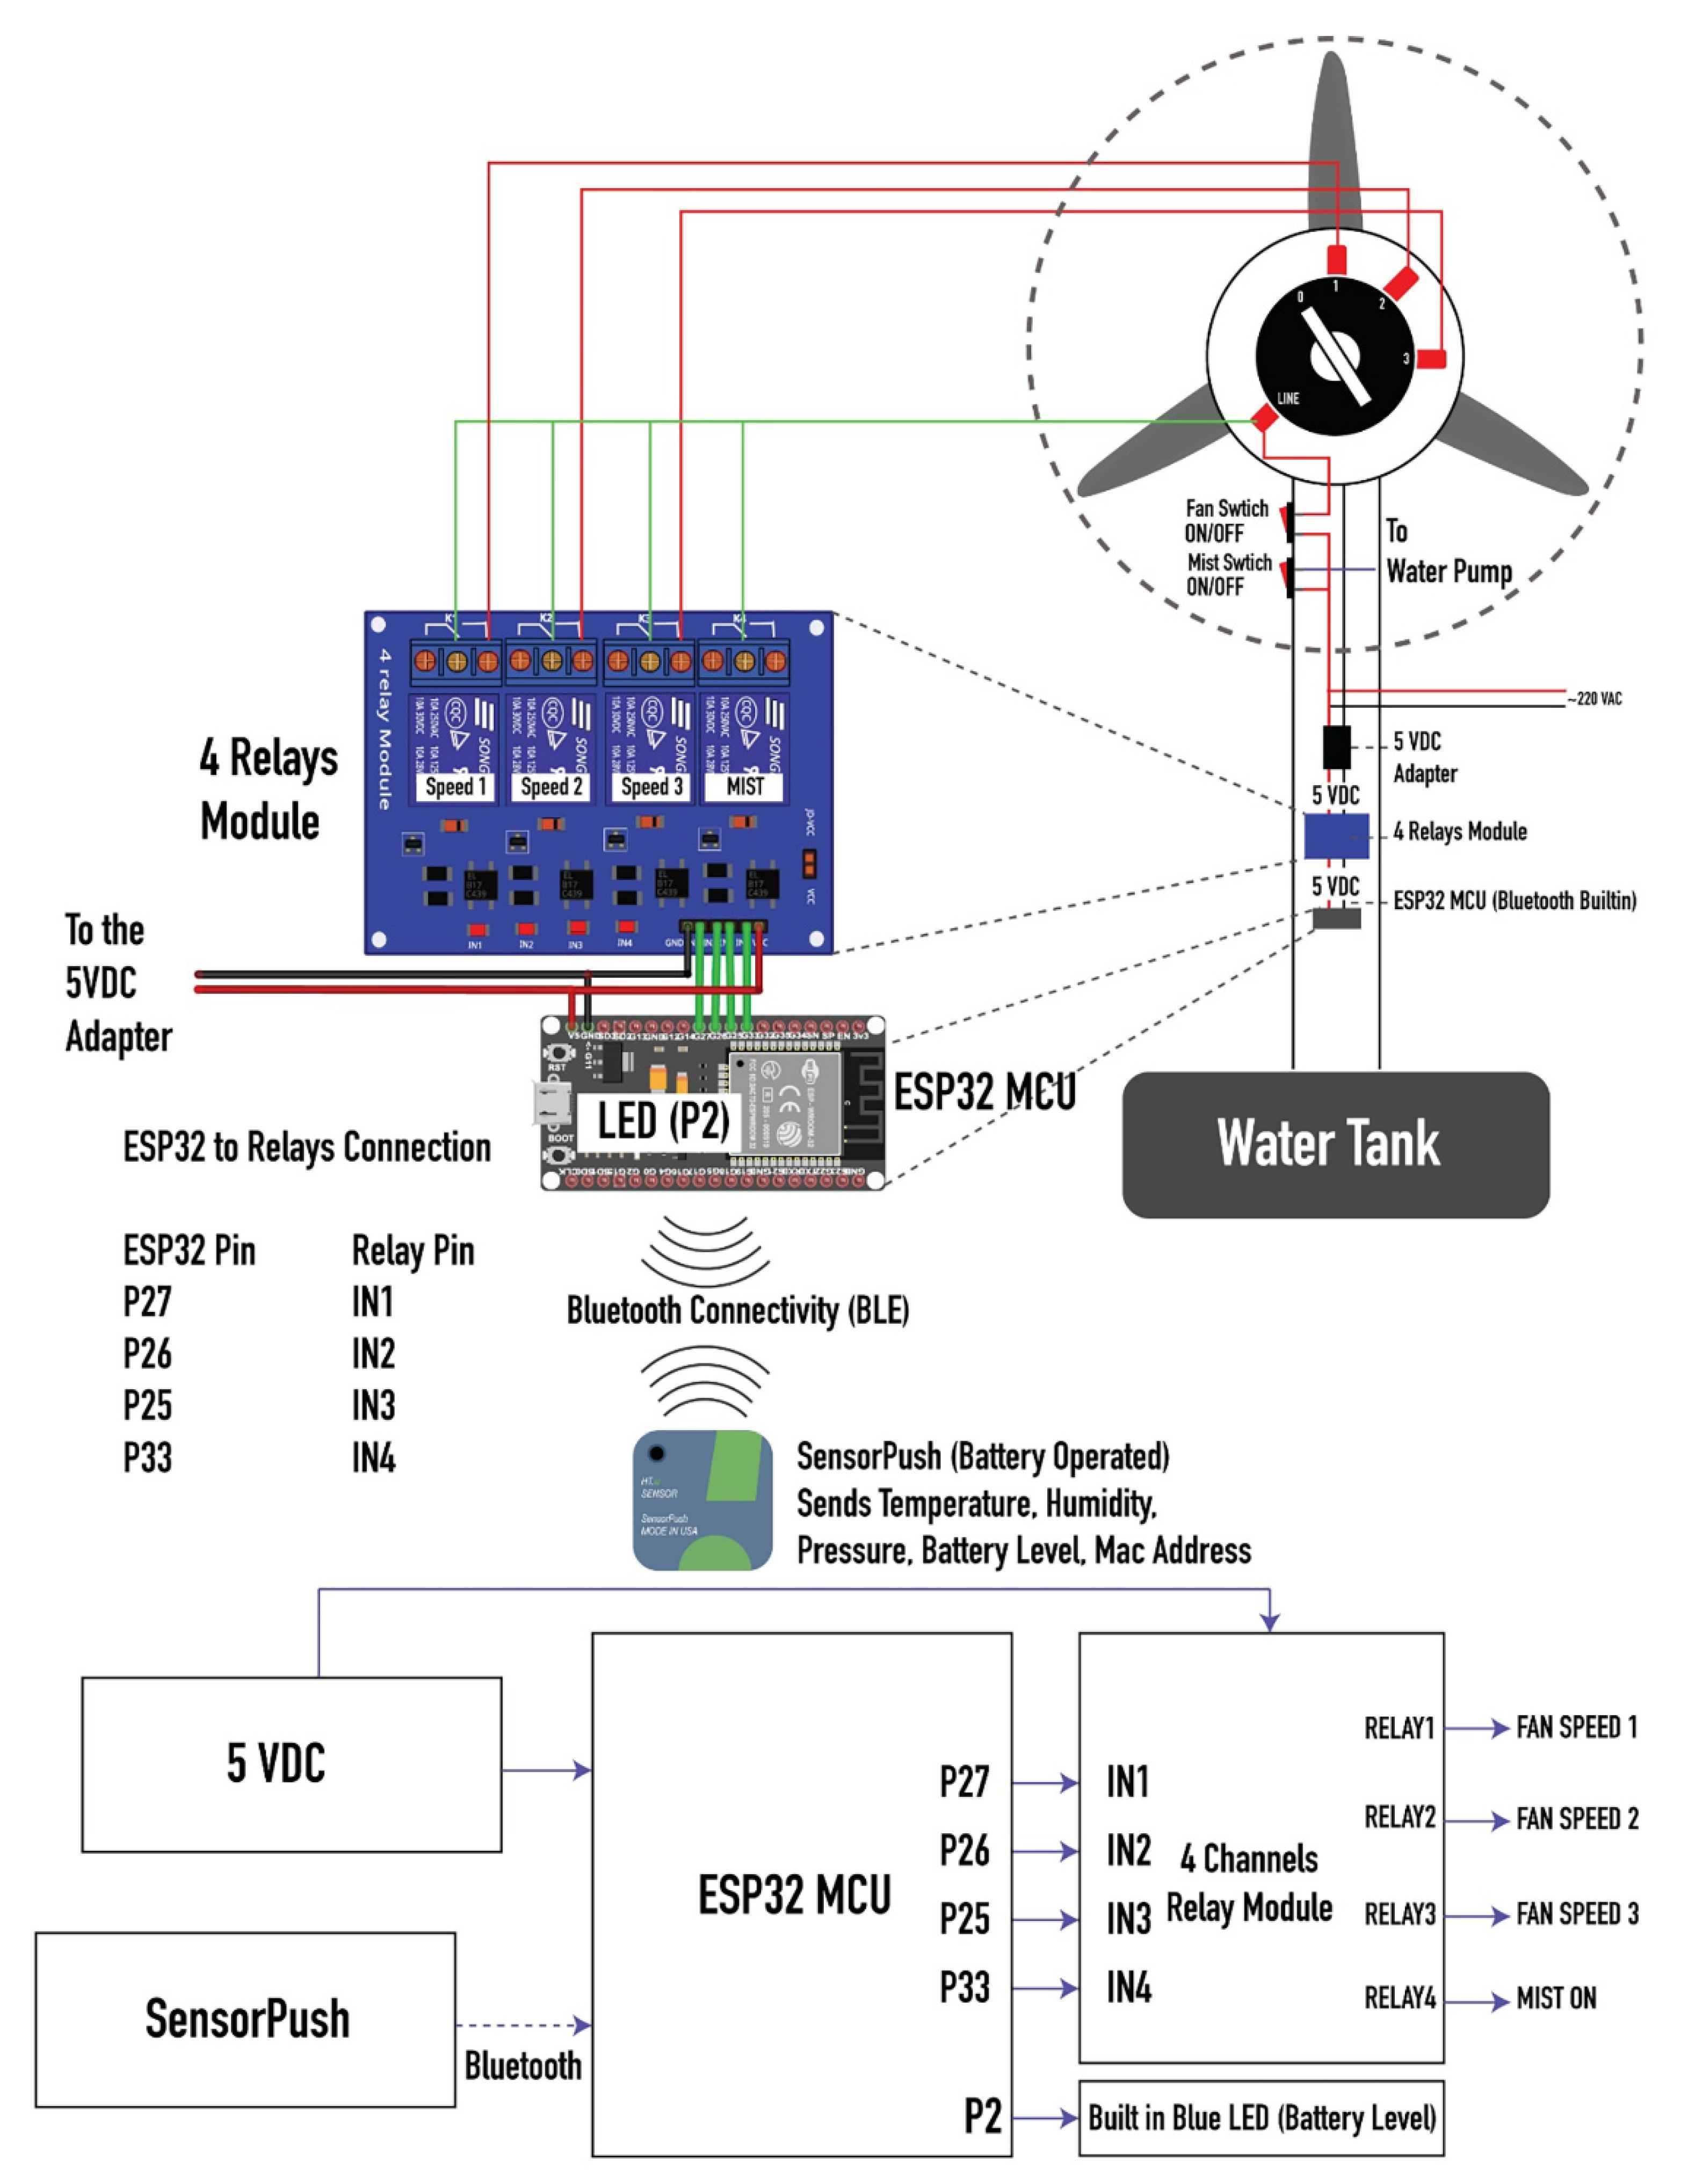
To minimize reliance on the power grid and address Bahrain’s high electricity demand in a sustainable way, a 2.4 kWh PV system was installed to power the water mist system during daytime. Each MFS, operating at a maximum capacity of 300 watts, was equipped with Event Stream Processing (ESP) units and 4-relay modules. ESP is a software-based technique that processes continuous streams of device data in real time, enabling dynamic control of fan speeds and water pumps based on actual Ta and RH readings. These readings were obtained via Bluetooth from SensorPush devices placed near each mist fan (see Figure 3).
The control system functions by sending periodic data requests from the ESP to the SensorPush device. In response, the sensor transmitted current environmental data back to the ESP, which analyzed them according to nine pre-defined conditions. Based on these conditions, the ESP sent commands to the 4-channel relay module, regulating fan speeds and mist output. This entire cycle repeated every 10 s, ensuring efficient energy use and maintaining a comfortable thermal environment. The ESP units were programmed to automate mist operation, with the goal of keeping the area within the human thermal comfort zone while minimizing unnecessary energy consumption.

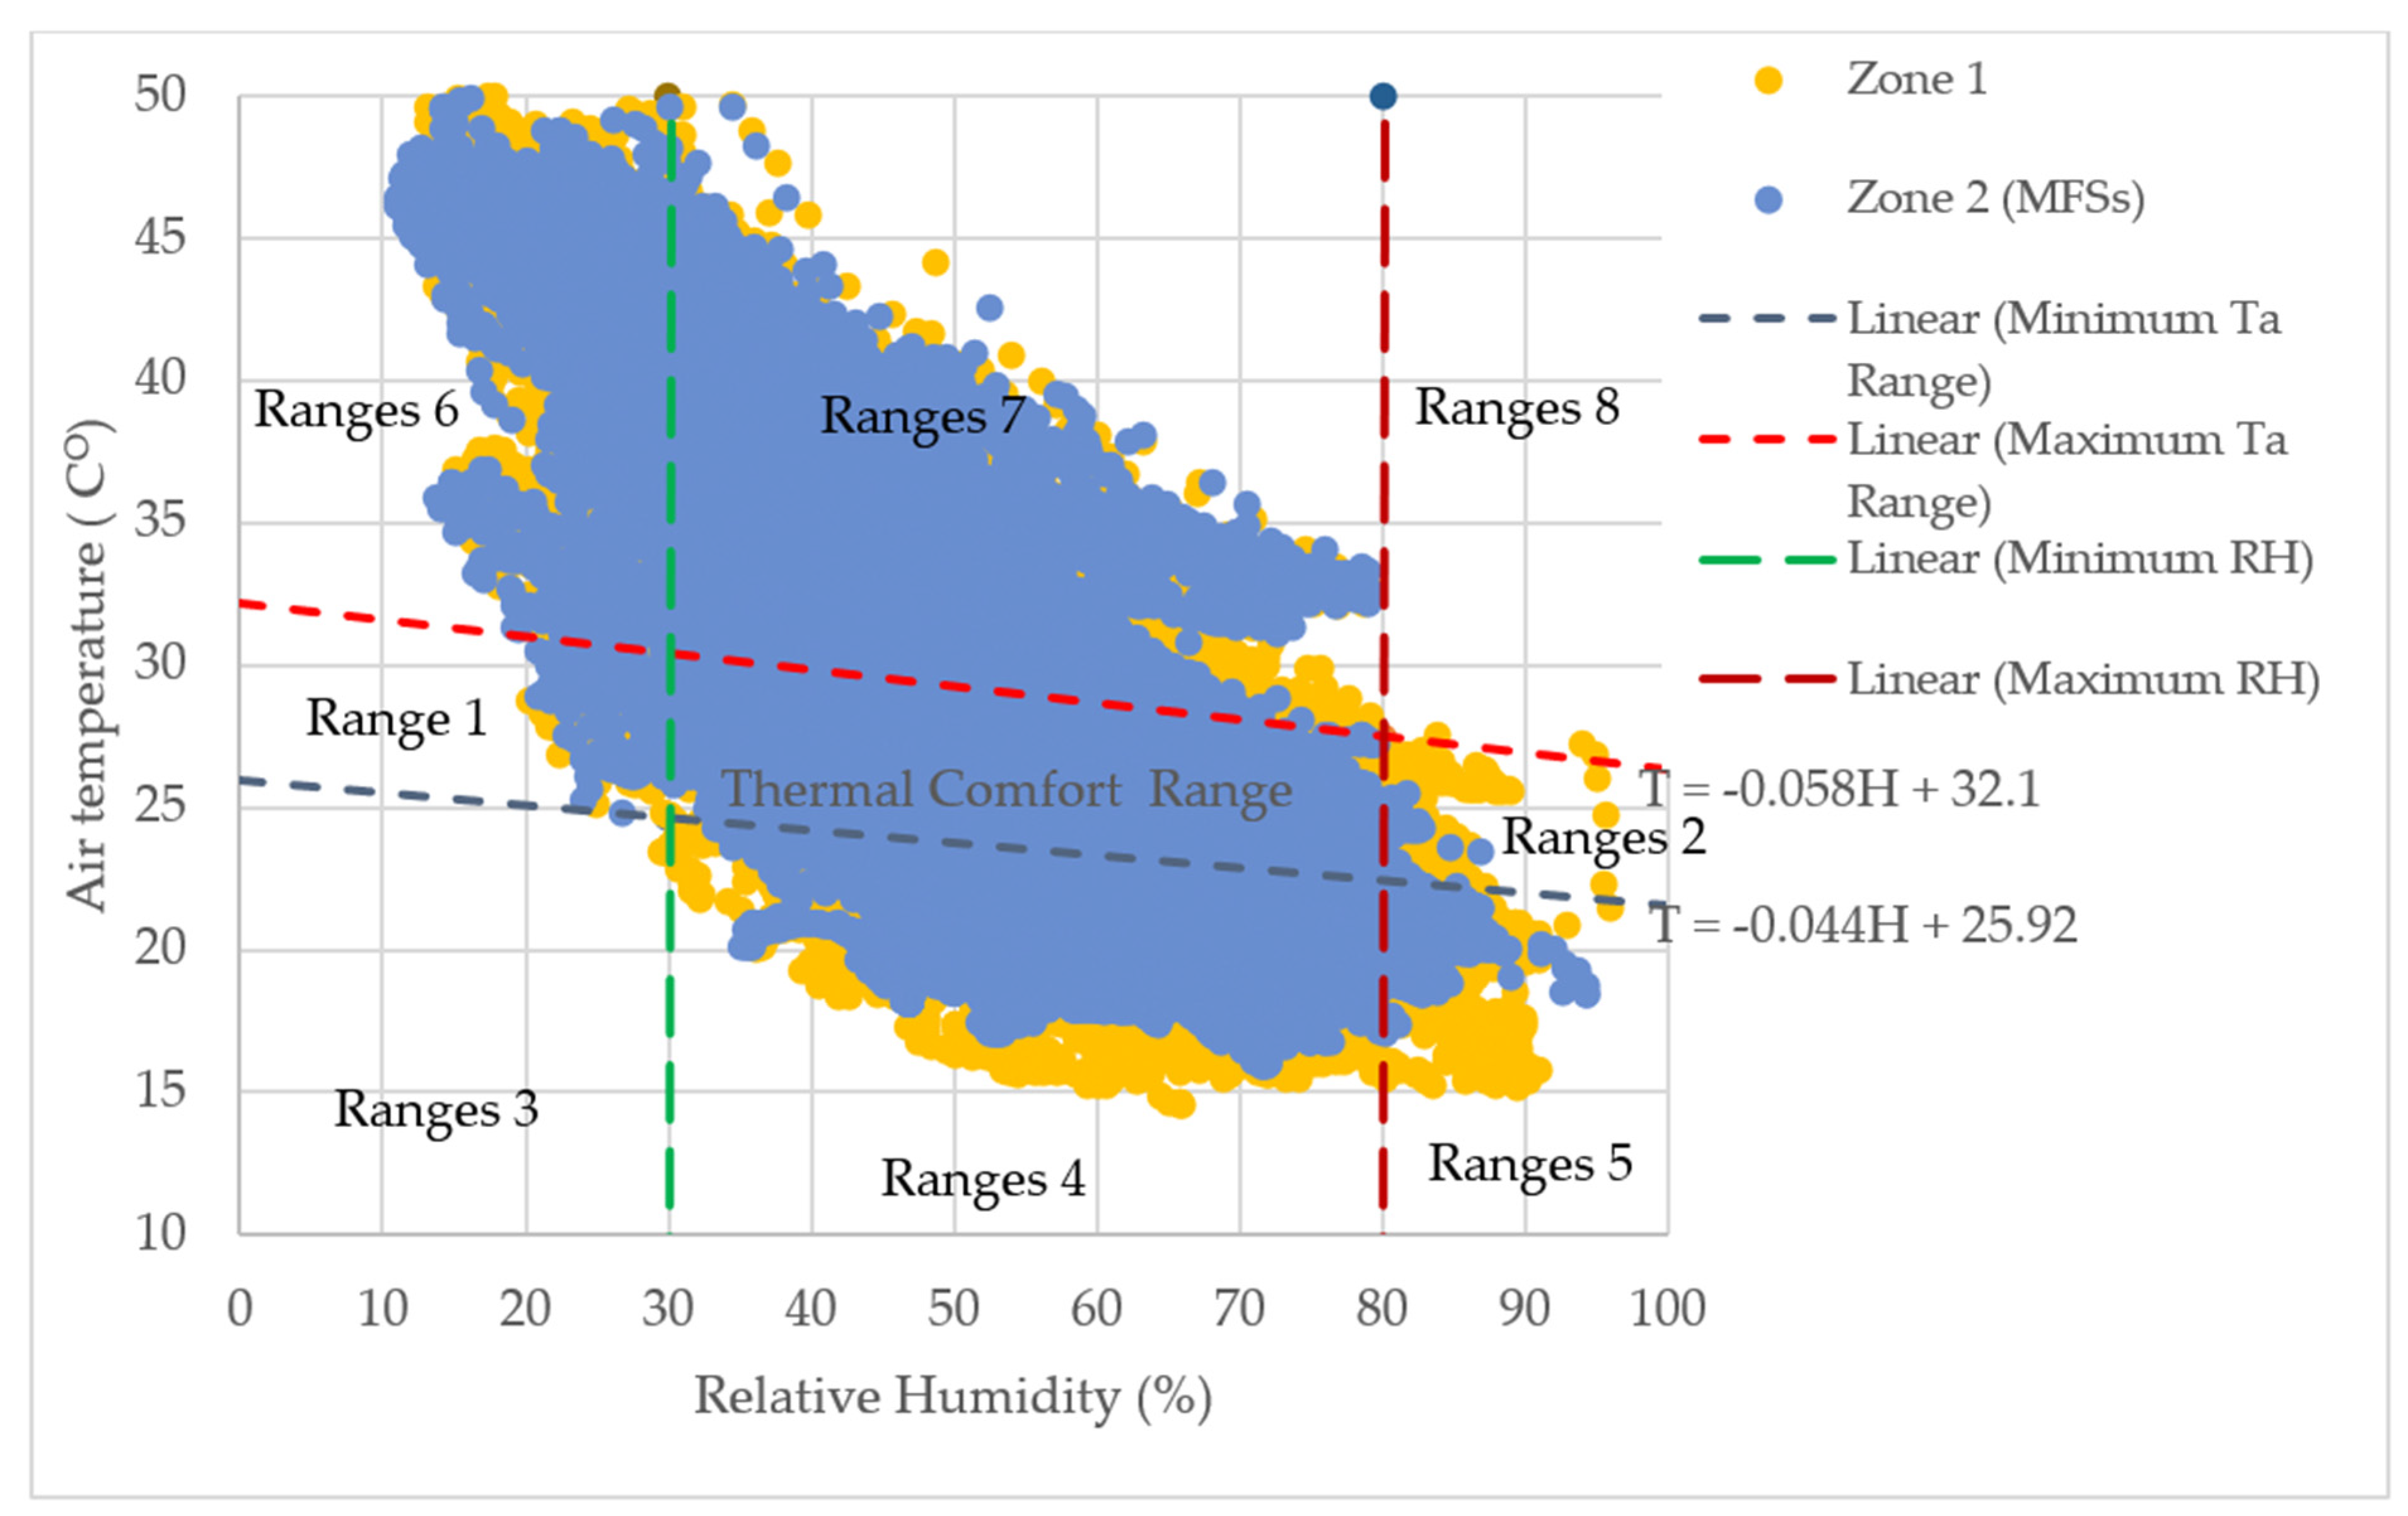
2.4. The Selection of Indicators of Thermal Performance

Because comfort standards vary widely, the authors examined multiple factors from the existing literature to define suitable comfort zones for users. They drew on guidelines from the American Society of Heating, Refrigerating, and Air-Conditioning Engineers (ASHRAE), which recommends temperature ranges from 20 °C to 26.67 °C and RH levels between 30% and 60%. Additional studies have suggested that human thermal comfort generally falls between 22 °C and 27 °C, with RH between 40% and 60%. In light of these variations, the authors adopted a specific comfort range based on ASHRAE 55 [51] and ISO 7730:2005 (PMV) [52] guidelines [53]. Using psychrometric charts, they determined that thermal comfort in this study corresponded to Ta between 22.4 °C and 30.4 °C, with RH ranging from 30% to 80% (Figure 4 and Table 2). These parameters informed the programming of the ESP controllers in the MFSs, enabling each subzone to maintain conditions within the target comfort range. Figure 4 depicts the thermal comfort ranges and their eight adjacent ranges, illustrating how the system adjusts Ta and RH accordingly.
A system was designed to regulate environmental conditions by adjusting the fan speed and mist activation based on the measured RH and Ta. Specifically, the system operated in different modes depending on whether the RH and Ta fell within pre-defined comfort ranges: fan speed two with active mist for non-comfort range 1, fan speed three with inactive mist for non-comfort range 2, fan speed one with active mist for non-comfort range 3, fan off with inactive mist for non-comfort range 4, fan speed one with inactive mist for non-comfort range 5, fan speed three with active mist for non-comfort range 6, fan speed three with inactive mist for non-comfort range 7, and fan speed three with active mist for non-comfort range 8. When RH and Ta were within the target comfort ranges, both the fan and mist were deactivated. In this setup, the mist system was consistently operated using room temperature water maintained within a range of 22–25 °C.
To evaluate the effectiveness of the MFSs in transitioning from non-comfort to comfort conditions, a longitudinal study was conducted from 30 October 2023 to 16 July 2024. Environmental data were collected via SensorPush devices installed in both the neutral zone (Zone 1) and the misted zone (Zone 2), resulting in a total of 24,954 logged readings. These readings were processed using Microsoft Excel to assess the frequency with which Ta and RH fell within the defined comfort boundaries. The analysis applied the following conditional formulas:
  • Zone 1 Comfort Range=IF(AND(Ta1 >= (−0.044*RH1 + 25.92), Ta1 <= (−0.058*RH1 + 32.1), RH1 >= 30, RH1 <= 80), TRUE, FALSE)
    where Ta1 and RH1 represent the air temperature and relative humidity recorded by the SensorPush device in Zone 1.
  • Zone 2 Comfort Range=IF(AND(Ta2 >= (−0.044*RH2 + 25.92), Ta2 <= (−0.058*RH2 + 32.1), RH2 >= 30, RH2 <= 80), TRUE, FALSE)
    where Ta2 and RH2 represent the average air temperature and relative humidity in Zone 2.
  • Change from Non-Comfort to Comfort=IF(AND(Zone1_Comfort = FALSE, Zone2_Comfort = TRUE), TRUE, FALSE)
  • Total Transitions Counted Using=COUNTIF(Transition_Range, TRUE)
This analysis allowed the research team to quantify the number of instances where the mist fan system successfully shifted the environmental conditions from non-comfort to comfort, offering insight into its overall performance and efficiency.
Moreover, experimental conditions were adjusted to investigate the influence of water temperature on the MFSs’ performance. First, the research team varied the amount of ice in the water tanks of the four MFSs, then monitored the resulting temperatures via thermometer (S02–S05). Table 3 presents the water temperatures measured for each MFS (in °C). Next, two fan-speed modes were tested across the MFSs—speeds of 3, 3, 2, and 3 for MFS-A, MFS-B, MFS-C, and MFS-D, respectively—while an anemometer recorded an average air velocity of about 2 m/s for all systems.

2.5. Participant Selection and Experiment Condition

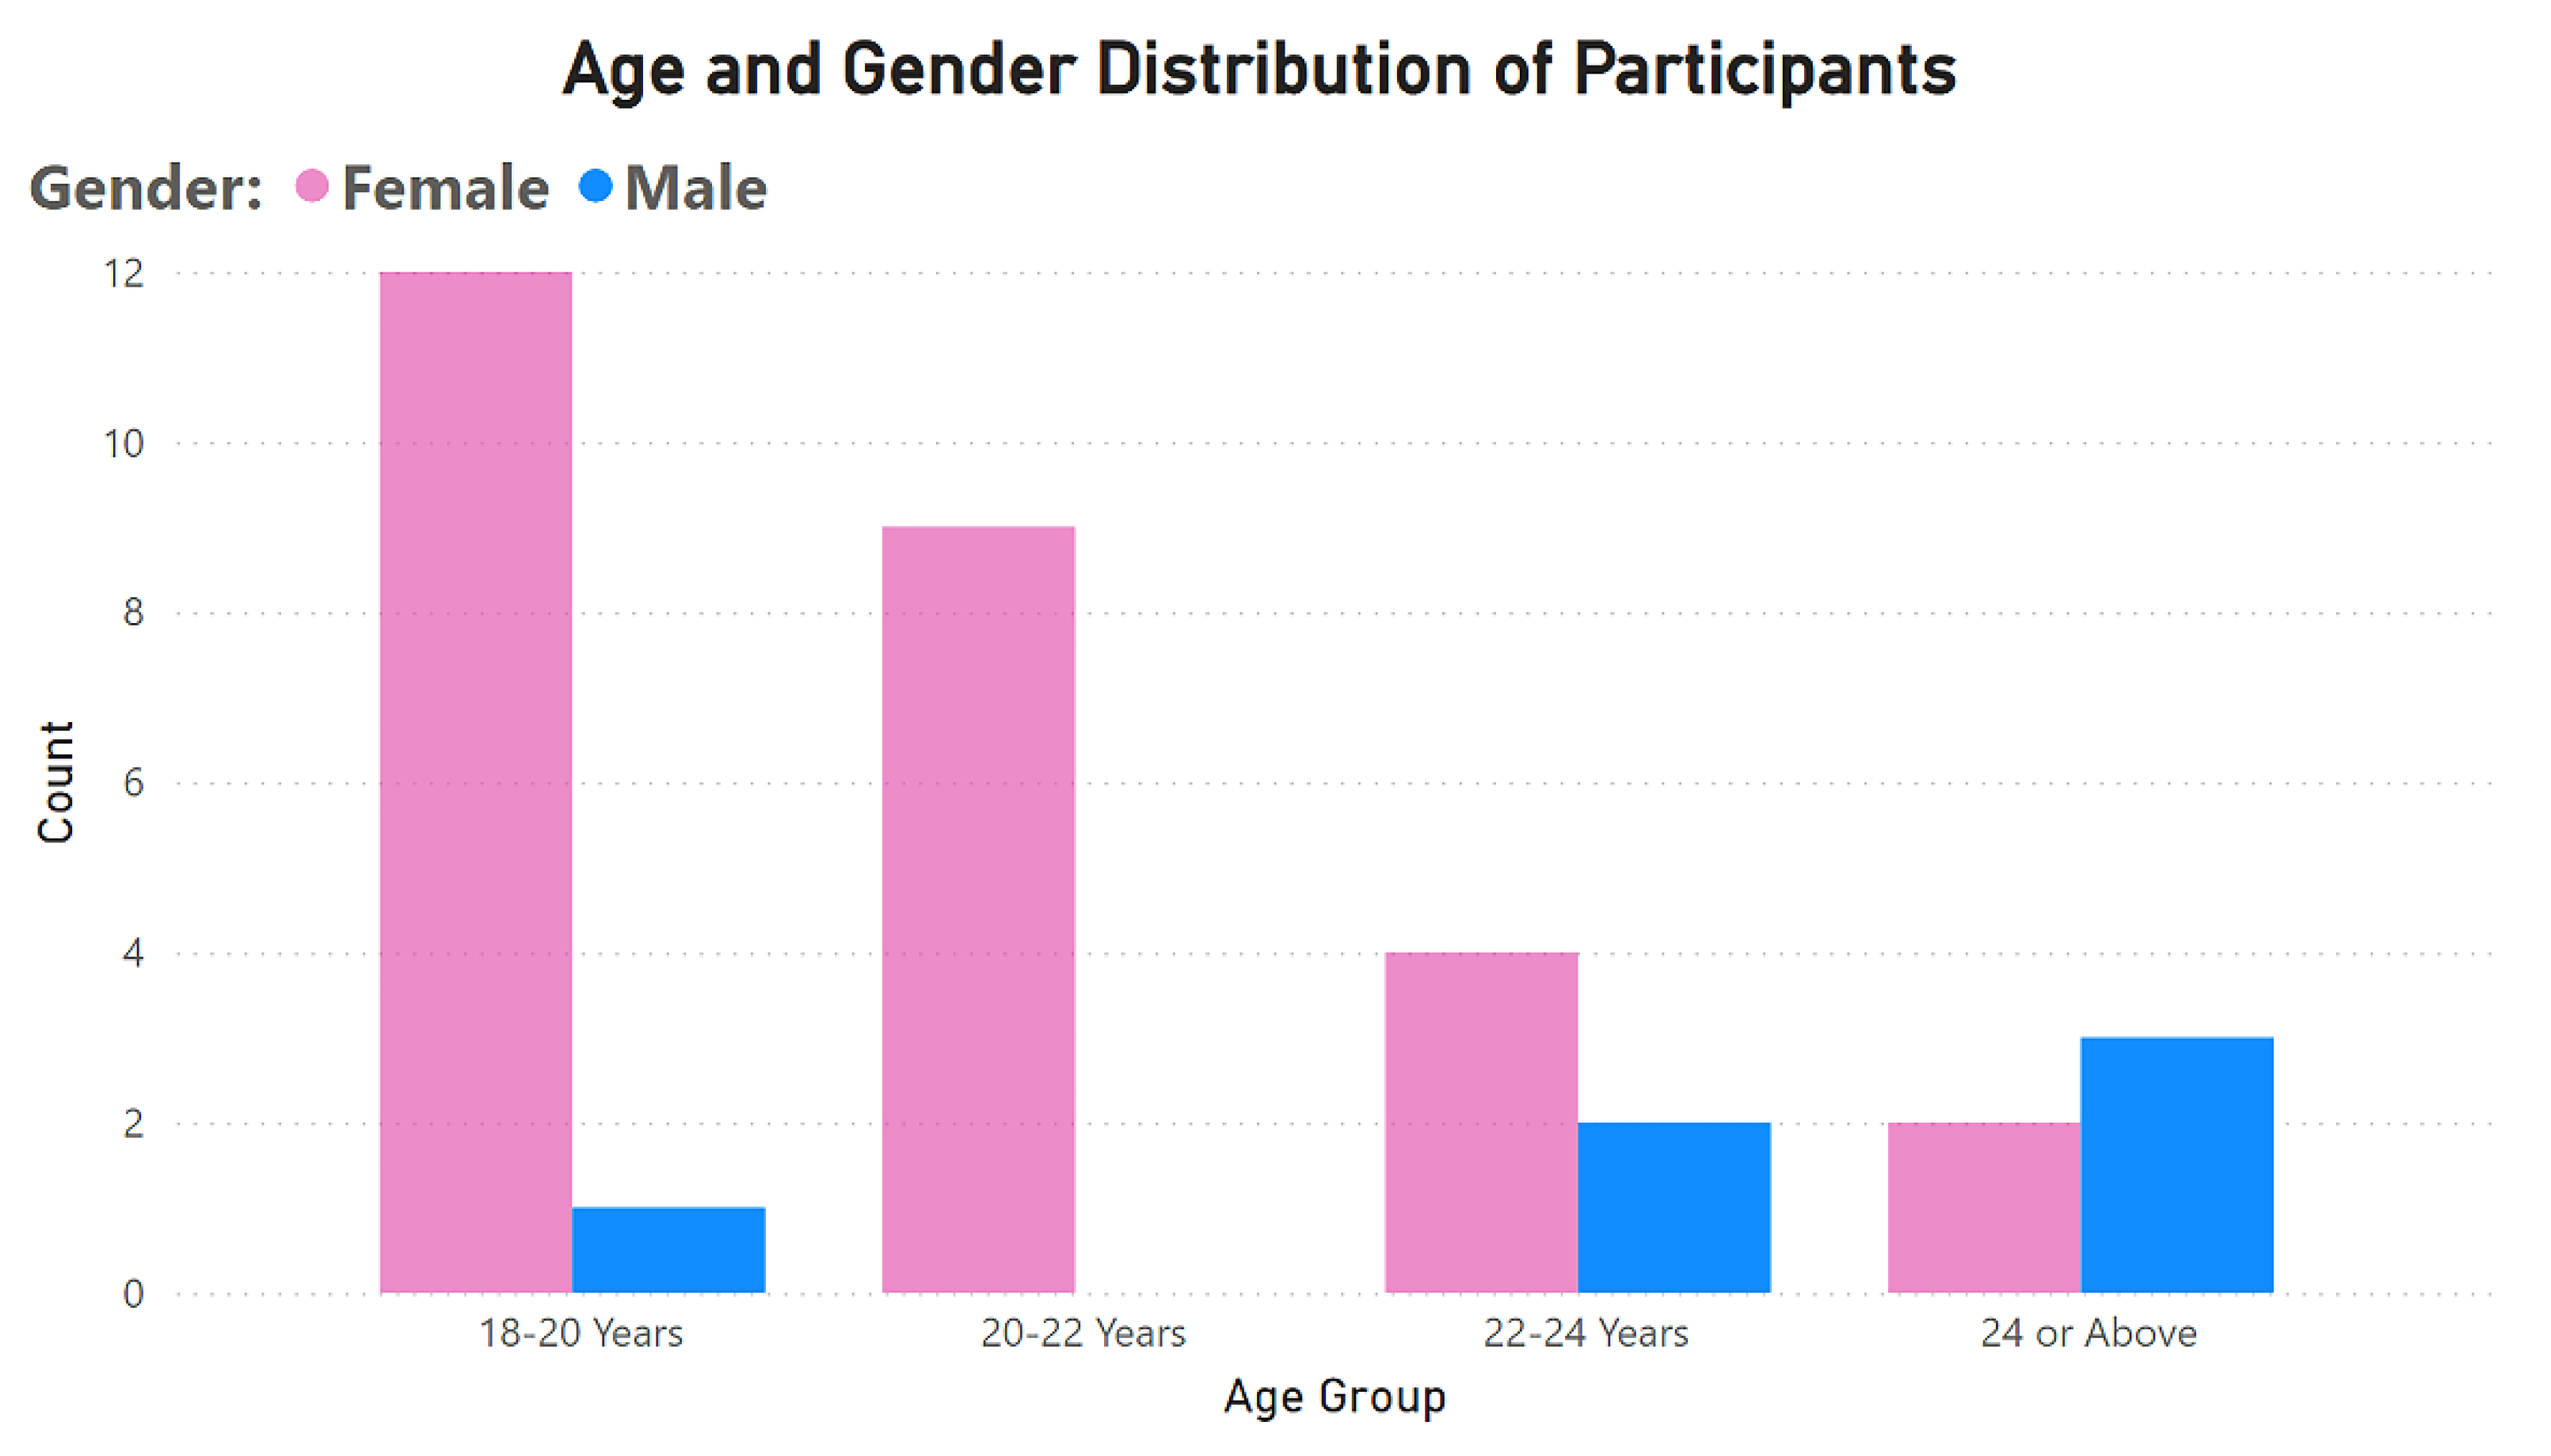
To assess the MFSs and survey scenario, the authors conducted a mock scenario one day before the survey, adopting the roles of participants. They observed the thermal comfort conditions by spending 5 min in Zone 2 in front of the MFS and 10 min in the neutral zone, accounting for the time taken to transition between Zone 1 and Zone 2. Thus, the authors were firmly convinced of the appropriate time to predict changes in comfort status. The study participants were selected through random sampling, focusing on students from Kingdom University, and the authors conveyed the research project objectives to the students. The authors employed two methodologies to verify the sample size of 33 respondents to the survey of the participants: benchmarking, which was based on prior research, and the statistical method.
In total, 33 students took part, of whom 82% were female and 18% male, with ages ranging from 18 to 26 years (mean age: 22). The thermal comfort survey conducted by the scholar referenced in [25] and [54] utilized 20 and 16 participants, respectively, to assess thermal comfort conditions. In their investigations into indoor thermal comfort, studies [55,56,57] have utilized a priori sample size analysis to ensure the robustness and reliability of their findings. This method necessitates the determination of the required number of participants before data collection commences. Notably, these studies opted for sample sizes of fewer than 20 individuals. For the selected sample size, the Margin of Error (MoE) was calculated using the following formula [58].
M o E = Z × p ( 1 p ) n
M o E = 1.96 × 0.5 ( 1 0.5 ) 33
M o E = 0.17
where:
Z = Z-Score, equal to 1.96 for 95% of confidence;
p = estimated proportion of confidence (0.5 is used for most conservative cases);
n = sample size.
Based on the validation provided above, and due to limited MFS zone capacity and the need for consistent climate conditions, a survey of 33 participants was conducted in a limited timeframe. To ensure participant comprehension and accuracy, a pre-survey induction explained the study’s requirements, time allocation for each group, and questionnaire distribution.
To evaluate the impact of MFSs on student thermal comfort during peak summer heat, an experiment was conducted on 26 June 2024, between 3:00 and 4:30 PM. The study utilized two zones: a neutral zone (Zone 1) and an MFS zone (Zone 2), which included MFS-A, MFS-B, MFS-C, and MFS-D. Students were divided into five groups, each following a specific schedule to ensure thorough exposure to the MFSs. Participants spent 10 min in the neutral zone before moving sequentially through each MFS area. This initial period in the neutral zone aimed to allow participants to return to a baseline thermal comfort state, minimizing the carryover effect from previous MFS exposures. The division into five groups was necessary due to space constraints, as each MFS area could comfortably accommodate a maximum of seven people, while the neutral zone could accommodate up to fourteen. The time management of the survey, including the group schedules, is detailed in Table 4, which presents all times as PM.
Finally, a questionnaire was administered to evaluate how the varying water temperatures and fan speeds affected human thermal comfort. The questionnaire was prepared in English and divided into three parts to capture different dimensions of thermal comfort and environmental perception. Part 1 collected demographic information such as age, gender, clothing type, and color. Part 2 documented students’ thermal and humidity perceptions in Zone 1 using a seven-point scale adapted from ASHRAE standards [51]. This scale assessed thermal perception (−3 cold, −2 cool, −1 slightly cool, 0 neutral, 1 slightly warm, 2 warm, and 3 hot) and humidity perception (−3 very dry, −2 dry, −1 slightly dry, 0 neutral, 1 slightly humid, 2 humid, 3 very humid). Part 3 extended these assessments to Zone 2 in comparison to Zone 1, where the MFSs operated under varying water temperatures, allowing the researchers to compare subjective comfort levels between the two zones.
In order to assess the respondents’ agreements, the authors used RStudio 2024.12.0 software to compute the Kendall’s coefficient and Chi-square value for three groups of data: the respondents’ feelings of Ta in Zone 1 (Neutral Zone) and Zone 2 (mist zone); the respondents’ feelings of RH in Zone 1 (Neutral Zone) and Zone 2 (mist zone); and the respondents’ comfort among the four MFSs. Then, the result was compared to the standards where the literature has interpreted of respondents’ agreements based on Kendall’s coefficient (W) as W = 0: no agreement among raters; W = 1: complete agreement among raters; 0.1 ≤ W < 0.3: weak agreement; 0.3 ≤ W < 0.5: moderate agreement; 0.7 ≥ W ≥ 0.5: strong agreement, W > 0.7: very strong agreement [59,60,61]. Kendall’s coefficient of concordance (W) was computed as follows:
W = 12   i = 1 n ( R i R ) 2 m 2   ( n 3 n )
The formula for calculating Chi-square X 2 is:
X 2 = n ( m 1 ) W
where:
  • W   i s   K e n d a l l s   C o e f f i c i e n t   o f   C o n c o r d a n c e ;
  • X 2   i s   t h e   C h i s q u a r e ;
  • n = n u m b e r   o f   s u b j e c t s ;
  • m = n u m b e r   o f   r a t e r s   ( r e s p o n d a n t s ) ;
  • R i = S u m   o f   r a n k s   f o r   i t e m   i ;
  • R   = mean of R i .
Critical Chi-square values at a 95% confidence level were derived from standard statistical tables: 3.84 for datasets involving two comparative conditions (Subjects 1 and 2), and 7.81 for the dataset involving four comparative conditions (Subject 3) [62].

3. Results

3.1. The Effectiveness of Mist Systems

The statistical analysis revealed that the MFSs successfully transitioned the combined Ta and RH readings from non-comfort to comfort ranges 825 times out of a total of 28,565 readings. This translated to an efficiency of approximately 2.9%.
Analysis of Ta and RH data revealed that Zone 1 and Zone 2 exhibited readings within the comfort range for 25.94% and 25.23% of the time, respectively. During periods when the outdoor temperature was within the comfort range, the MFSs remained inactive, automatically shutting off. The majority of recorded data fell within Range 4 (low Ta, high RH, primarily at night) and Range 7 (high Ta, low RH, primarily during the day) for both zones (Figure 5 and Table 5).
For the purpose of focusing on the most critical period for outdoor thermal comfort, this study considered the time interval between 08:00 AM and 08:00 PM and between 22 June and 7 July 2024. This period represents the hours when the intensity of solar radiation is at its peak, directly affecting Ta and RH in the experimental zones, and subsequently impacting human comfort during workdays. As shown in the Ta graph (Figure 6a), none of the zones consistently met the thermal comfort parameters specified a target temperature range from 22.4 °C to 30.4 °C. The temperature trends between Zone 1 (without mist fans) and Zone 2 (with mist fans) exhibited clear variations throughout the day. In the early morning, both zones started with relatively similar temperatures, with only a small difference observed. However, as the day progressed, the cooling effect of the MFSs became more noticeable, especially during the late morning and early afternoon hours, when ambient temperatures peaked. The largest temperature difference was observed between 12:00 PM and 3:00 PM, when Zone 1 reached its highest temperatures, often exceeding 45 °C, while Zone 2 remains 2–4 °C lower on average. This period corresponded to the peak solar radiation hours, when mist evaporation was most effective in countering heat accumulation. However, this difference was not consistent throughout the entire day. During the morning hours (08:00 AM–10:00 AM), the temperature gap remained small, often within 1–2 °C, as ambient temperatures were still relatively moderate. Similarly, in the late afternoon (5:00 PM onwards), the temperature difference narrowed again, stabilizing around 1–3 °C, likely due to reduced solar intensity and an overall cooling trend in both zones.
Regarding RH (Figure 6b), none of the zones consistently met the thermal comfort parameters specified in the target comfort range between 30% and 80%. In the early morning hours (08:00 AM–10:00 AM), both zones exhibited relatively similar humidity levels, with only minor variations, as ambient conditions remained stable. However, as the temperature rose, a clear divergence emerged. Between 10:00 AM and 3:00 PM, when solar radiation and ambient temperatures peaked, RH in Zone 1 tended to drop significantly, often falling below 30%, which was outside the lower threshold of the targeted comfort zone. In contrast, Zone 2 maintained a higher RH, typically ranging 5–10% higher than Zone 1, indicating the moistening effect of mist evaporation. The most pronounced RH difference was observed between 12:00 PM and 3:00 PM, coinciding with the period of peak temperature difference, when mist fans maximized water atomization and evaporation. However, as the afternoon progressed, the gap began to close. After 5:00 PM, as the solar intensity weakened, RH levels in both zones gradually converged, with Zone 2 still maintaining a slightly higher RH due to residual moisture. Despite fluctuations throughout the day, the mist systems successfully prevented extreme dryness in Zone 2, ensuring RH close to the recommended comfort range, unlike in Zone 1, where RH frequently dropped below 30% during midday.

3.2. Evaluation of Water Temperature on MFS Performance

The temperature trends observed across MFS-A, MFS-B, MFS-C, and MFS-D revealed the impact of varying water temperatures and fan speeds on cooling efficiency (Figure 7a). At 8:00 AM, temperatures in all mist zones were relatively close to Zone 1, ranging between 40.5 °C and 42.5 °C, reflecting minimal early-morning cooling effects. However, as the day progressed, differences became more pronounced. By 12:00 PM, Zone 1 temperatures exceeded 45 °C, whereas MFS-A and MFS-B maintained temperatures around 43.5–44 °C, and MFS-C and MFS-D achieved lower temperatures, averaging 42–42.8 °C. Notably, MFS-D, which operated with the lowest water temperature (7.7 °C), consistently recorded the most significant temperature reduction, remaining 3–4 °C cooler than Zone 1 at peak hours. Between 12:00 PM and 3:00 PM, when solar radiation was at its highest, the largest temperature differentials were recorded, with MFS-D maintaining a temperature gap of up to 4 °C compared to Zone 1, while MFS-A and MFS-B showed smaller reductions of around 2–3 °C. The box plot analysis (Figure 7b) of indoor ∆T (all MFSs compared to Zone 1) further highlights these differences. The median ∆T for MFS-D was −1.45 °C, with a 25th percentile reaching −2.85 °C, indicating that MFS-D consistently provided the strongest cooling effect. In comparison, MFS-C had a median ∆T of −1.00 °C, while MFS-B and MFS-A exhibited median values of −0.79 °C and −0.16 °C, respectively. The maximum cooling effect observed was −3.91 °C for MFS-D, confirming its superior cooling performance at 13:55 PM. However, MFS-A displayed the least variation, with its interquartile range suggesting a more stable but weaker cooling effect compared to other MFSs.
The RH trends observed across MFS-A, MFS-B, MFS-C, and MFS-D demonstrate how varying water temperatures and fan speeds influence humidity regulation within the target comfort range (Figure 8a). At 8:00 AM, RH levels in all mist zones were relatively close to Zone 1, ranging between 31% and 33%, indicating minimal early-morning differences. However, as temperatures rose throughout the day, a clear divergence emerged, particularly during peak heat hours. By 12:00 PM, RH in Zone 1 dropped below 25%, falling outside the comfort range, while mist zones successfully maintained RH between 27% and 31%, preventing excessive dryness. Among the mist systems, MFS-D, operating with the lowest water temperature (7.7 °C), exhibited the highest RH levels, peaking at 32% during midday, whereas MFS-A and MFS-B, with the higher water temperature, maintained lower RH values, fluctuating between 27% and 29%. Between 12:00 PM and 3:00 PM, when solar radiation and evaporation were at their peak, Zone 1’s RH fell as low as 20%, reinforcing the lack of moisture retention in the absence of misting. In contrast, MFSs stabilized RH within the 25–35% range, preventing extreme dryness. Notably, MFS-D and MFS-C exhibited the highest RH retention, maintaining RH levels 3–6% higher than Zone 1. The box plot analysis (Figure 8b) of indoor ∆RH (all MFSs compared to Zone 1) supports this observation, revealing that the median ∆RH for MFS-B was 2.02%, the highest among all MFSs, followed by MFS-C (which used colder water and lower fan speeds) at 1.12%, MFS-D at 0.58%, and MFS-A at 0.38%. The maximum recorded RH difference was 3.53% for MFS-B, highlighting its strong humidity-retaining capacity, while MFS-D exhibited a lower peak increase of 2.91%, but with greater stability. However, MFS-A, with the highest water temperature, showed the least overall humidity gain, with some instances of negative ∆RH values, suggesting that its water temperature effect was weaker compared to other systems. As the afternoon progressed, RH levels in all zones began to rise naturally due to declining temperatures, with the gap narrowing by 5:00 PM. By 7:00 PM, RH levels across all mist systems converged toward 35–38%, reflecting reduced mist evaporation effects as ambient cooling took over.
Regarding fan speed, the MFSs revealed key differences, particularly between MFS-B (speed: 3, water temperature: 12.3 °C) and MFS-C (speed: 2, water temperature: 13.1 °C), where MFS-C exhibited superior overall cooling performance. During peak hours (12:00 PM–3:00 PM), MFS-B recorded an average temperature of 43.1 °C, whereas MFS-C maintained a lower average of 42.8 °C, with a consistent 0.3 °C advantage. The difference became more pronounced around 1:00 PM, when MFS-B reached 44.5 °C, while MFS-C remained at 44.0 °C, reinforcing the superior cooling impact of MFS-C’s higher water temperature (13.1 °C) compared to MFS-B (12.3 °C). While MFS-B’s higher fan speed increased air circulation, it also shortened mist residence time, limiting full evaporative cooling potential. In contrast, MFS-C’s slightly lower fan speed allowed mist droplets to linger longer in the air, maximizing cooling through extended evaporation. This effect was also reflected in RH trends, where MFS-C exhibited slightly higher RH levels during the same period, maintaining an average RH of 30.4%, compared to MFS-B at 28.9%. The most pronounced difference occurred around 1:00 PM, when MFS-B recorded 28.5% RH, while MFS-C retained 30.8% RH, marking a 2.3% advantage. This trend suggests that lower fan speeds allow mist droplets to linger longer in the air, enhancing moisture retention and gradual evaporation, which leads to higher humidity levels. Conversely, higher fan speeds accelerate airflow but can reduce mist persistence, limiting the overall RH increase. The box plot findings (Figure 8b) further confirm that MFS-C maintained a more stable balance of temperature reduction and humidity retention, reinforcing the importance of adjusting fan speed to optimize both cooling and moisture distribution.

3.3. Survey Result

The experiment was conducted in a semi-outdoor pedestrian passage at Kingdom University on 26 June 2024, one of the hottest summer days, when temperatures peaked at 47.39 °C in non-misted areas (Zone 1). The study took place in the afternoon, between 13:55 and 16:10, under extreme heat conditions, with temperatures remaining above 46 °C in Zone 1 for most of the experiment. RH in Zone 1 was critically low, starting at 19.1% and reaching only 25% by the end of the experiment, highlighting the harsh conditions. Participants first stayed in Zone 1 for five minutes to acclimate to the baseline environmental conditions before completing a questionnaire and proceeding through four different MFSs (A, B, C, and D) in Zone 2. Each MFS operated under varying water temperatures and fan speeds, allowing participants to experience different cooling conditions. The study distributed 40 questionnaires, collecting 33 valid responses, representing an 82.5% participation rate. Of the respondents, 82% were female, and 18% were male (Figure 9). Notably, 96% of female participants wore traditional black dresses (Abaya), in alignment with local cultural norms, whereas male participants showed more variation in clothing color, with 17% wearing black, 33% wearing white, and 50% wearing other colors. Overall, 79% of participants addressed their dresses as normal clothing, 18% as light clothing, and only 3% as heavy clothing.
Figure 10 shows the environmental conditions measured by sensors during the experiment; Zone 1, without mist cooling, experienced severe thermal stress, with Ta consistently exceeding 46 °C and peaking at 47.39 °C. RH in Zone 1 remained critically low, starting at 19.1% and increasing only to 25% by the end of the experiment, emphasizing the harsh and dry climate conditions. In contrast, the MFSs demonstrated significant cooling effects, with temperatures gradually decreasing as misting was applied. Among them, MFS-D (with the lowest water temperature at 7.7 °C) exhibited the most effective temperature reduction, maintaining up to a 4 °C lower temperature than Zone 1 at peak hours. The RH heatmap further highlights the effect of misting, as MFS zones maintained higher humidity levels, with MFS-B reaching the highest RH at 29.06%, reinforcing the role of misting in moisture retention and thermal relief. These results confirm that while Zone 1 remained unbearably hot and dry, misting systems provided a clear advantage in reducing heat stress and maintaining more favorable humidity levels.
Participants were asked to rate their perception of temperature and humidity in two distinct experimental zones. The temperature perception results revealed a substantial improvement in thermal comfort when mist cooling was introduced (Figure 11a). In Zone 1, 39.4% of participants reported feeling “Hot”, while the majority (51.5%) felt “Slightly Warm”, and only 9.1% perceived the temperature as “Natural”. These findings indicate that, in the absence of active cooling, most participants experienced discomfort, with nearly 91% reporting some level of warmth or heat stress. The introduction of mist cooling in Zone 2 significantly altered these perceptions, with the “Hot” category dropping drastically from 39.4% to just 6.1%, a nearly 84% reduction in extreme heat perception. Furthermore, the “Slightly Warm” category also saw a decrease from 51.5% in Zone 1 to 39.4% in Zone 2, suggesting that a notable portion of participants experienced relief from excessive warmth. Most importantly, the proportion of participants feeling “Natural” more than quadrupled, rising from 9.1% in Zone 1 to 45.5% in Zone 2, highlighting a significant shift toward comfortable thermal conditions. Additionally, 9.1% of participants reported feeling “Slightly Cool” in Zone 2, whereas no participants experienced this sensation in Zone 1. These shifts underscore the effectiveness of mist cooling not just in reducing extreme heat stress but also in promoting thermal neutrality and mild cooling sensations (Figure 11b).
To be more specific, before the mist condition, a substantial portion of participants (8 out of 13) who felt “Hot” transitioned to “Slightly Warm”, while two individuals moved to “Slightly Cool”, and one felt “Natural” after experiencing mist cooling (Figure 10b). This suggests that misting had a strong impact on reducing the severity of heat perception. In addition, 12 out of 17 participants who initially described their environment as “Slightly Warm” reported a shift to “Natural”, indicating a transition to a thermally neutral state, which is considered optimal for comfort. Only one participant moved from “Slightly Warm” to “Slightly Cool”, reflecting the mist’s cooling effect but not leading to extreme cold sensations. In addition, no participants reported shifts to “Cool” or “Cold”, reinforcing that misting provided relief without overcooling, which is crucial in maintaining an outdoor-friendly thermal environment. Additionally, the data suggest that while mist cooling did not entirely eliminate perceptions of warmth, it played a crucial role in mitigating the most uncomfortable conditions, creating a more balanced thermal environment. The ability of the mist system to reduce both the intensity and prevalence of heat stress is particularly important in hot, arid climates, where even small reductions in perceived temperature can significantly enhance outdoor comfort.
Furthermore, the analysis of humidity perception before and after mist exposure indicates a notable shift in participants’ comfort levels (Figure 12a). Prior to the mist experience, 39.4% of participants reported feeling “Slightly Humid”, 33.3% perceived “Natural” humidity, 12.1% felt “Slightly Dry”, and 15.2% perceived the air as “Humid”. After exposure to the mist, the proportion of participants reporting “Slightly Humid” decreased to 30.3%, while the “Natural” perception increased to 39.4%. Meanwhile, the “Slightly Dry” perception rose slightly to 15.2%, and “Humid” remained unchanged at 15.2%. Although the overall percentage of participants reporting “Humid” remained 15.2% before and after misting, the transition matrix (Figure 12b) shows that individual perceptions still shifted. One participant moved from “Humid” to “Slightly Humid”, while another went from “Slightly Humid” to “Humid”, offsetting each other and leaving the same final percentage for “Humid”. Among those who initially felt “Slightly Humid”, five participants maintained that perception, whereas five others shifted to “Natural”, suggesting an improvement in perceived moisture balance. Six participants who started at “Natural” remained there, while three moved to “Slightly Dry” and two to “Slightly Humid”, indicating that the mist did not uniformly raise humidity for everyone. Despite these movements, no one reported “Very Dry” or “Very Humid” at any point, highlighting that the mist system moderated humidity levels without creating extremes. Hence, these results suggest that the mist system helped shift the overall humidity perception from “Slightly Humid” toward a more “Natural” level, without creating excessive dampness.
Participants evaluated their preferred mist fan system (MFS) setup for thermal comfort on a scale from 1 (low) to 5 (high), with Figure 13 displaying the highest rating received for each system. The results demonstrated a clear preference for MFS-D, which was rated highest by 18 participants (54.5%). This majority preference indicates that MFS-D was perceived as providing the highest level of comfort and the most effective cooling, likely due to its combination of lower water temperature and optimized fan speed, resulting in superior heat stress mitigation. Following MFS-D, MFS-B was the second most favored option, receiving high ratings from six participants (18.2%).
Moreover, the number of votes for MFS-B over MFS-C suggests that fan speed played a more significant role in enhancing participants’ thermal comfort than water temperature alone. Between MFS-B (speed: 3, water temperature: 12.3 °C) and MFS-C (speed: 2, water temperature: 13.1 °C), participants found MFS-B more effective, with six participants selecting B compared to four for C. This indicates that the higher fan speed of MFS-B contributed more to perceived cooling than the slightly lower water temperature of MFS-C. One possible explanation is that higher fan speeds improve air circulation, increasing the rate of evaporative cooling on the skin. Faster-moving air enhances heat dissipation from the body, making participants feel cooler even if the mist’s initial temperature is slightly higher. In contrast, MFS C’s lower fan speed may have allowed for longer mist suspension, but if the air movement was insufficient, the cooling effect might not have been felt as intensely. Additionally, the distribution of mist droplets might have been more efficient with MFS B’s higher speed, leading to better coverage and a more noticeable cooling sensation. If mist lingers too long without adequate dispersion, it may not provide the same immediate relief. The results suggest that while lower water temperature contributes to cooling efficiency, it is not the only determining factor—the interaction between water temperature and air velocity plays a crucial role in achieving optimal comfort.
Interestingly, MFS-A had only one participant’s vote (3%), indicating that it was the least effective among the four systems, possibly due to higher water temperatures or suboptimal fan settings, resulting in a less noticeable cooling effect. Notably, four participants (12.1%) selected “None”, implying that they did not perceive any of the MFS setups as significantly improving their thermal comfort. This could have been to individual differences in heat sensitivity, variations in clothing insulation, or the mist’s effectiveness being insufficient under extreme heat conditions for some individuals. Overall, the data suggest that MFS-D significantly outperformed the other systems in providing a comfortable cooling effect, reinforcing the importance of water temperature and fan speed optimization in mist-based cooling strategies. The varied preferences also highlight the subjective nature of thermal comfort, emphasizing the need for adaptive cooling solutions that can cater to a broader range of individual comfort preferences.
To evaluate the consistency of participants’ perceptions regarding temperature, relative humidity, and comfort among MFSs, Kendall’s coefficient of concordance (W) and Chi-square tests were performed. The statistical outcomes are presented in Table 6.
The analysis of subject 1—the respondents’ feelings of “Ta” in Zone 1 (neutral zone) and Zone 2 (mist zone)—revealed a positive and strong agreement between participants. Specifically, Kendall’s W (coefficient of concordance) was calculated to be 0.566, indicating this significant level of agreement. Furthermore, a Chi-square value of 18.688 was obtained, which exceeded the critical Chi-square value of 3.84. This result demonstrates statistical significance, confirming the consistency in the respondents’ reported feelings of “Ta” across the two zones.
For subject 2, the analysis of respondents’ feelings regarding “RH” in Zone 1 (neutral zone) and Zone 2 (mist zone) showed a strong agreement among participants. This was supported by a Kendall’s W (coefficient of concordance) of 0.626. Additionally, the calculated Chi-square value of 20.658 significantly exceeded the critical Chi-square value of 3.84, confirming the statistical significance of the observed agreement.
In subject 3, the analysis of respondents’ comfort levels across the four MFSs revealed a strong consensus. This was evidenced by a Kendall’s W (coefficient of concordance) of 0.687, indicating a high degree of agreement. Furthermore, the calculated Chi-square value of 68.013 significantly surpassed the critical Chi-square value of 7.81, confirming the statistical significance of the agreement in comfort feelings among the participants.

4. Discussion

As highlighted in recent review papers [33], misting systems are particularly advantageous in arid and warm climates, though they have also performed admirably in hot, humid, and temperate regions. Most experiments were conducted during the summer or mild winter seasons, where optimal thermohydrometric conditions typically ranged from 70% relative humidity to 30–35 °C ambient temperature. In contrast, our current study was conducted under extreme summer conditions in a hot, arid, and humid climate, with thermohydrometric conditions averaging 20–65% humidity and daytime temperatures reaching 35–45 °C.

4.1. The Effectiveness of the Mist Fan System

Experimental studies have indicated that misting systems can achieve local temperature reductions ranging from 1–2 °C to over 15 °C [33]. The average temperature drop is typically 7–8 °C, with variations attributed to factors like nozzle design, operating pressure, system layout, misting duration, local microclimate, and the type of cooled area (open outdoor, semi-enclosed, or indoor). Notably, only a single study [
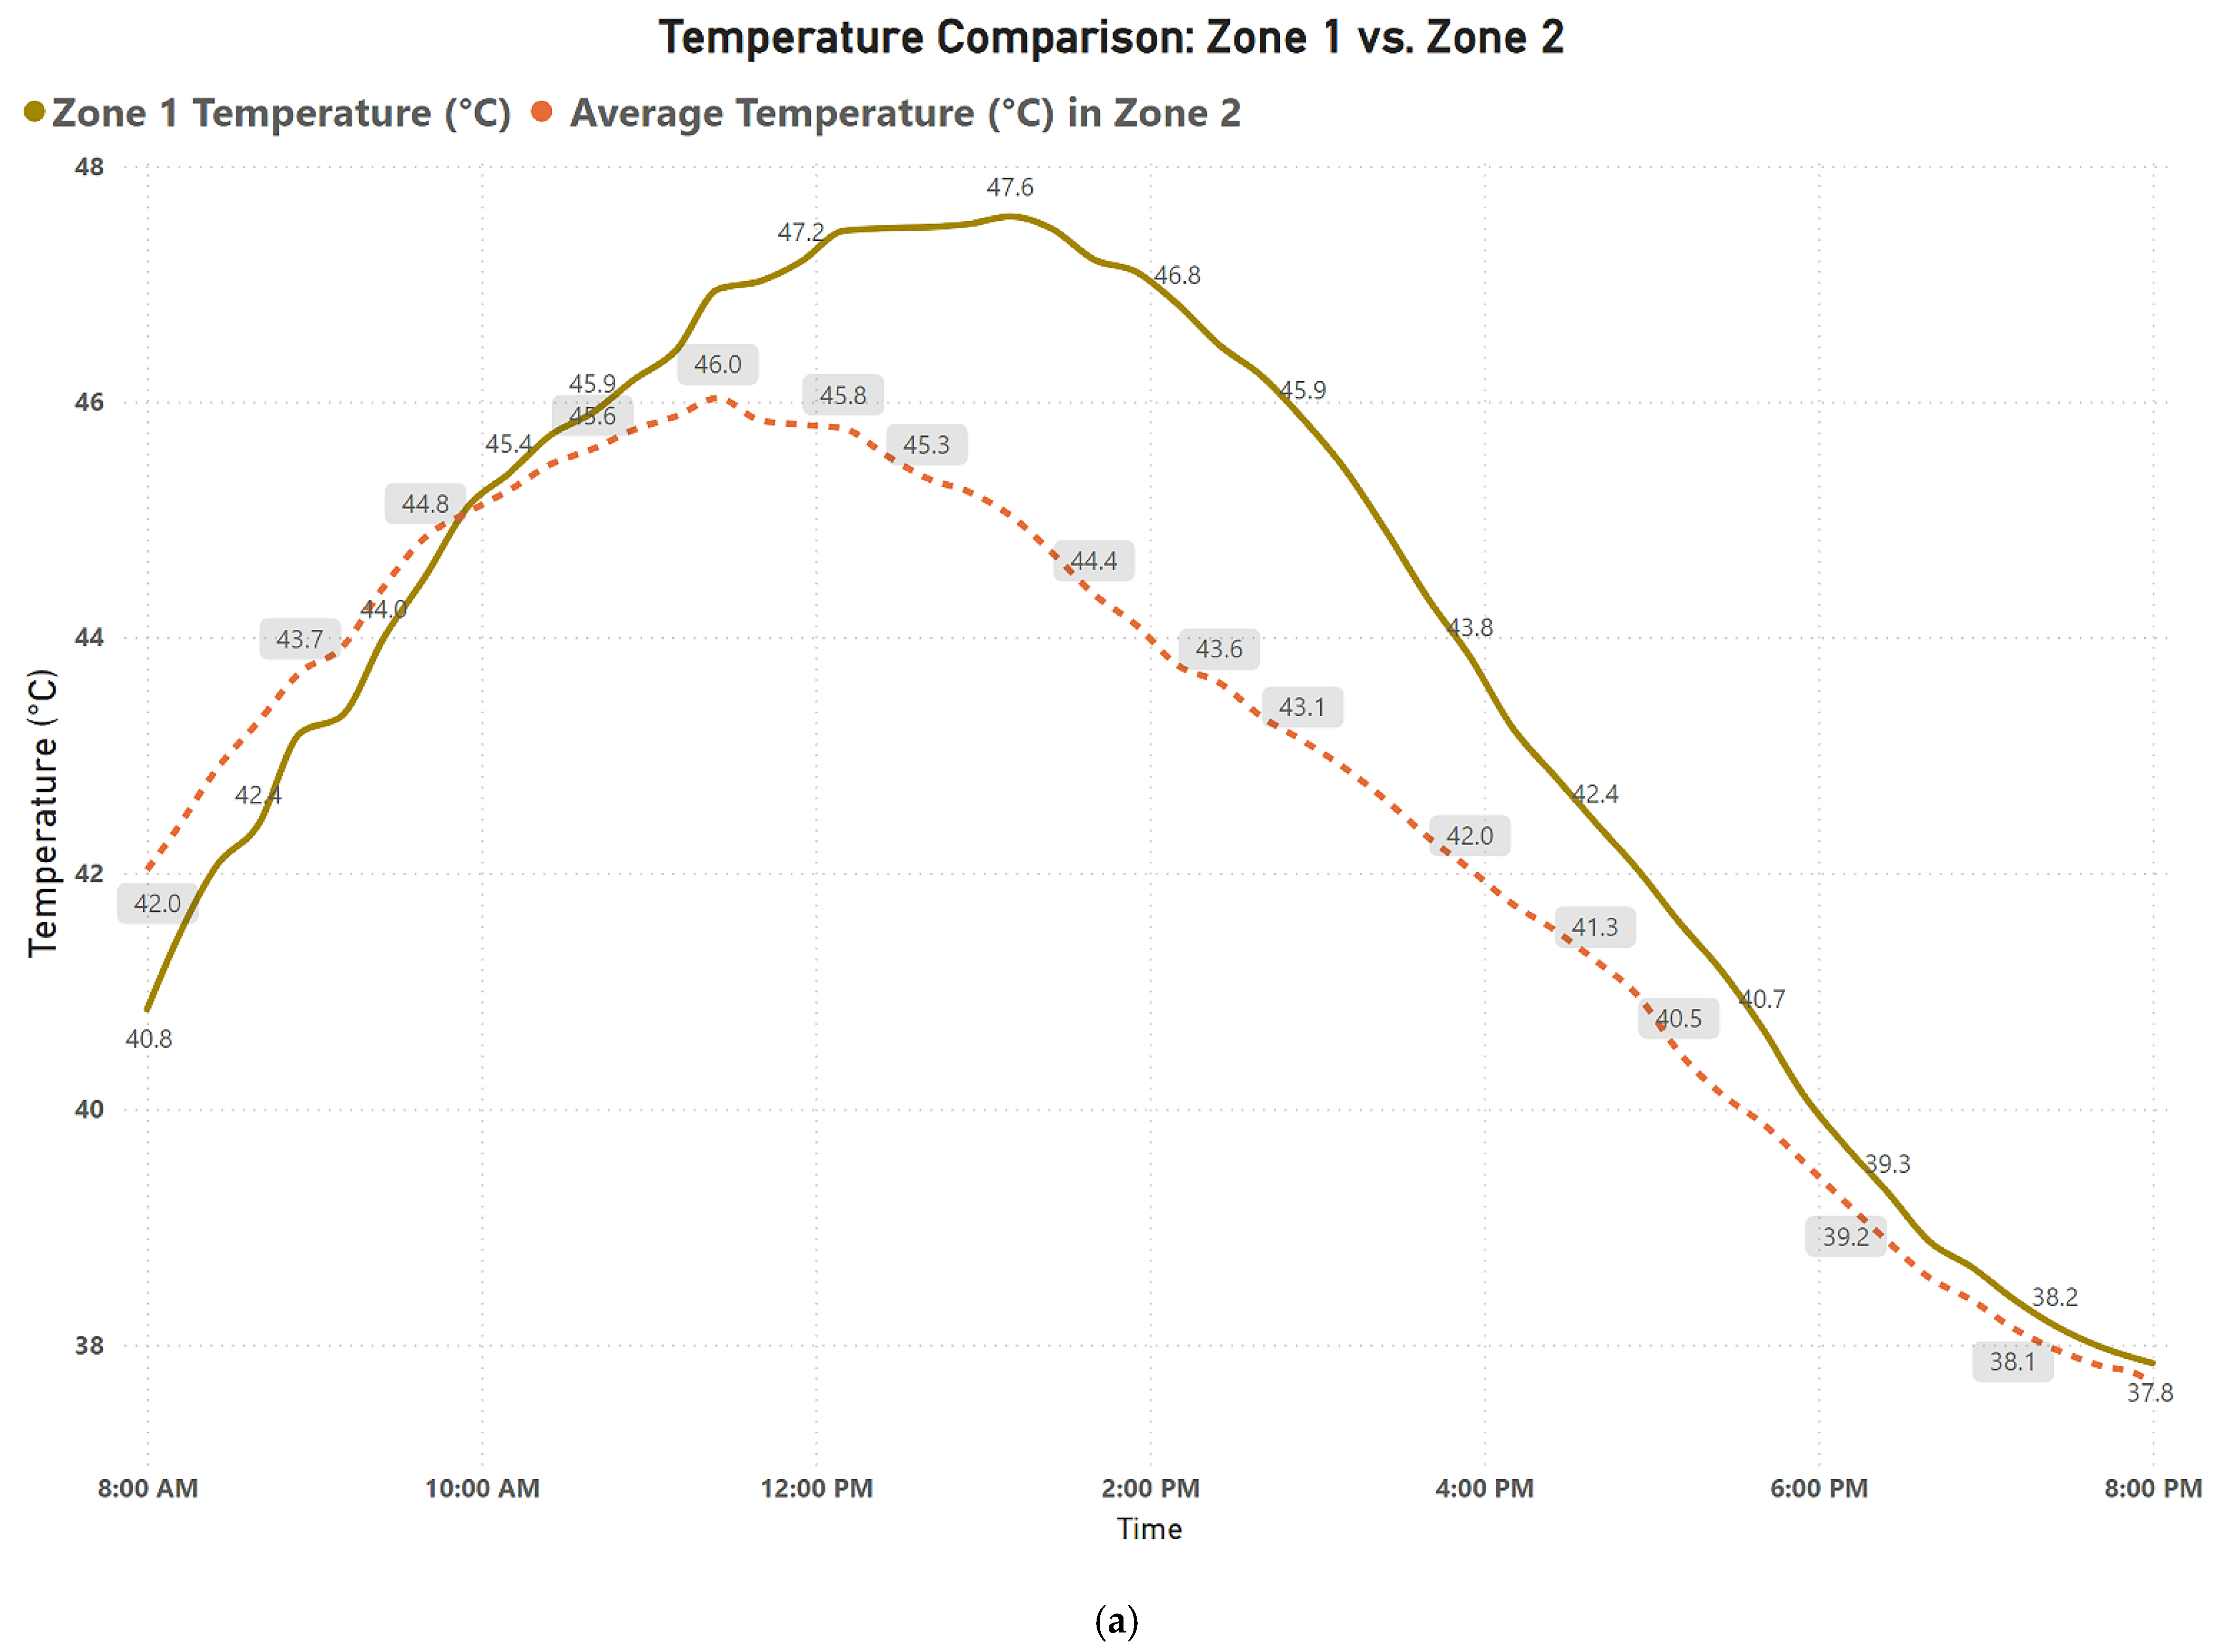
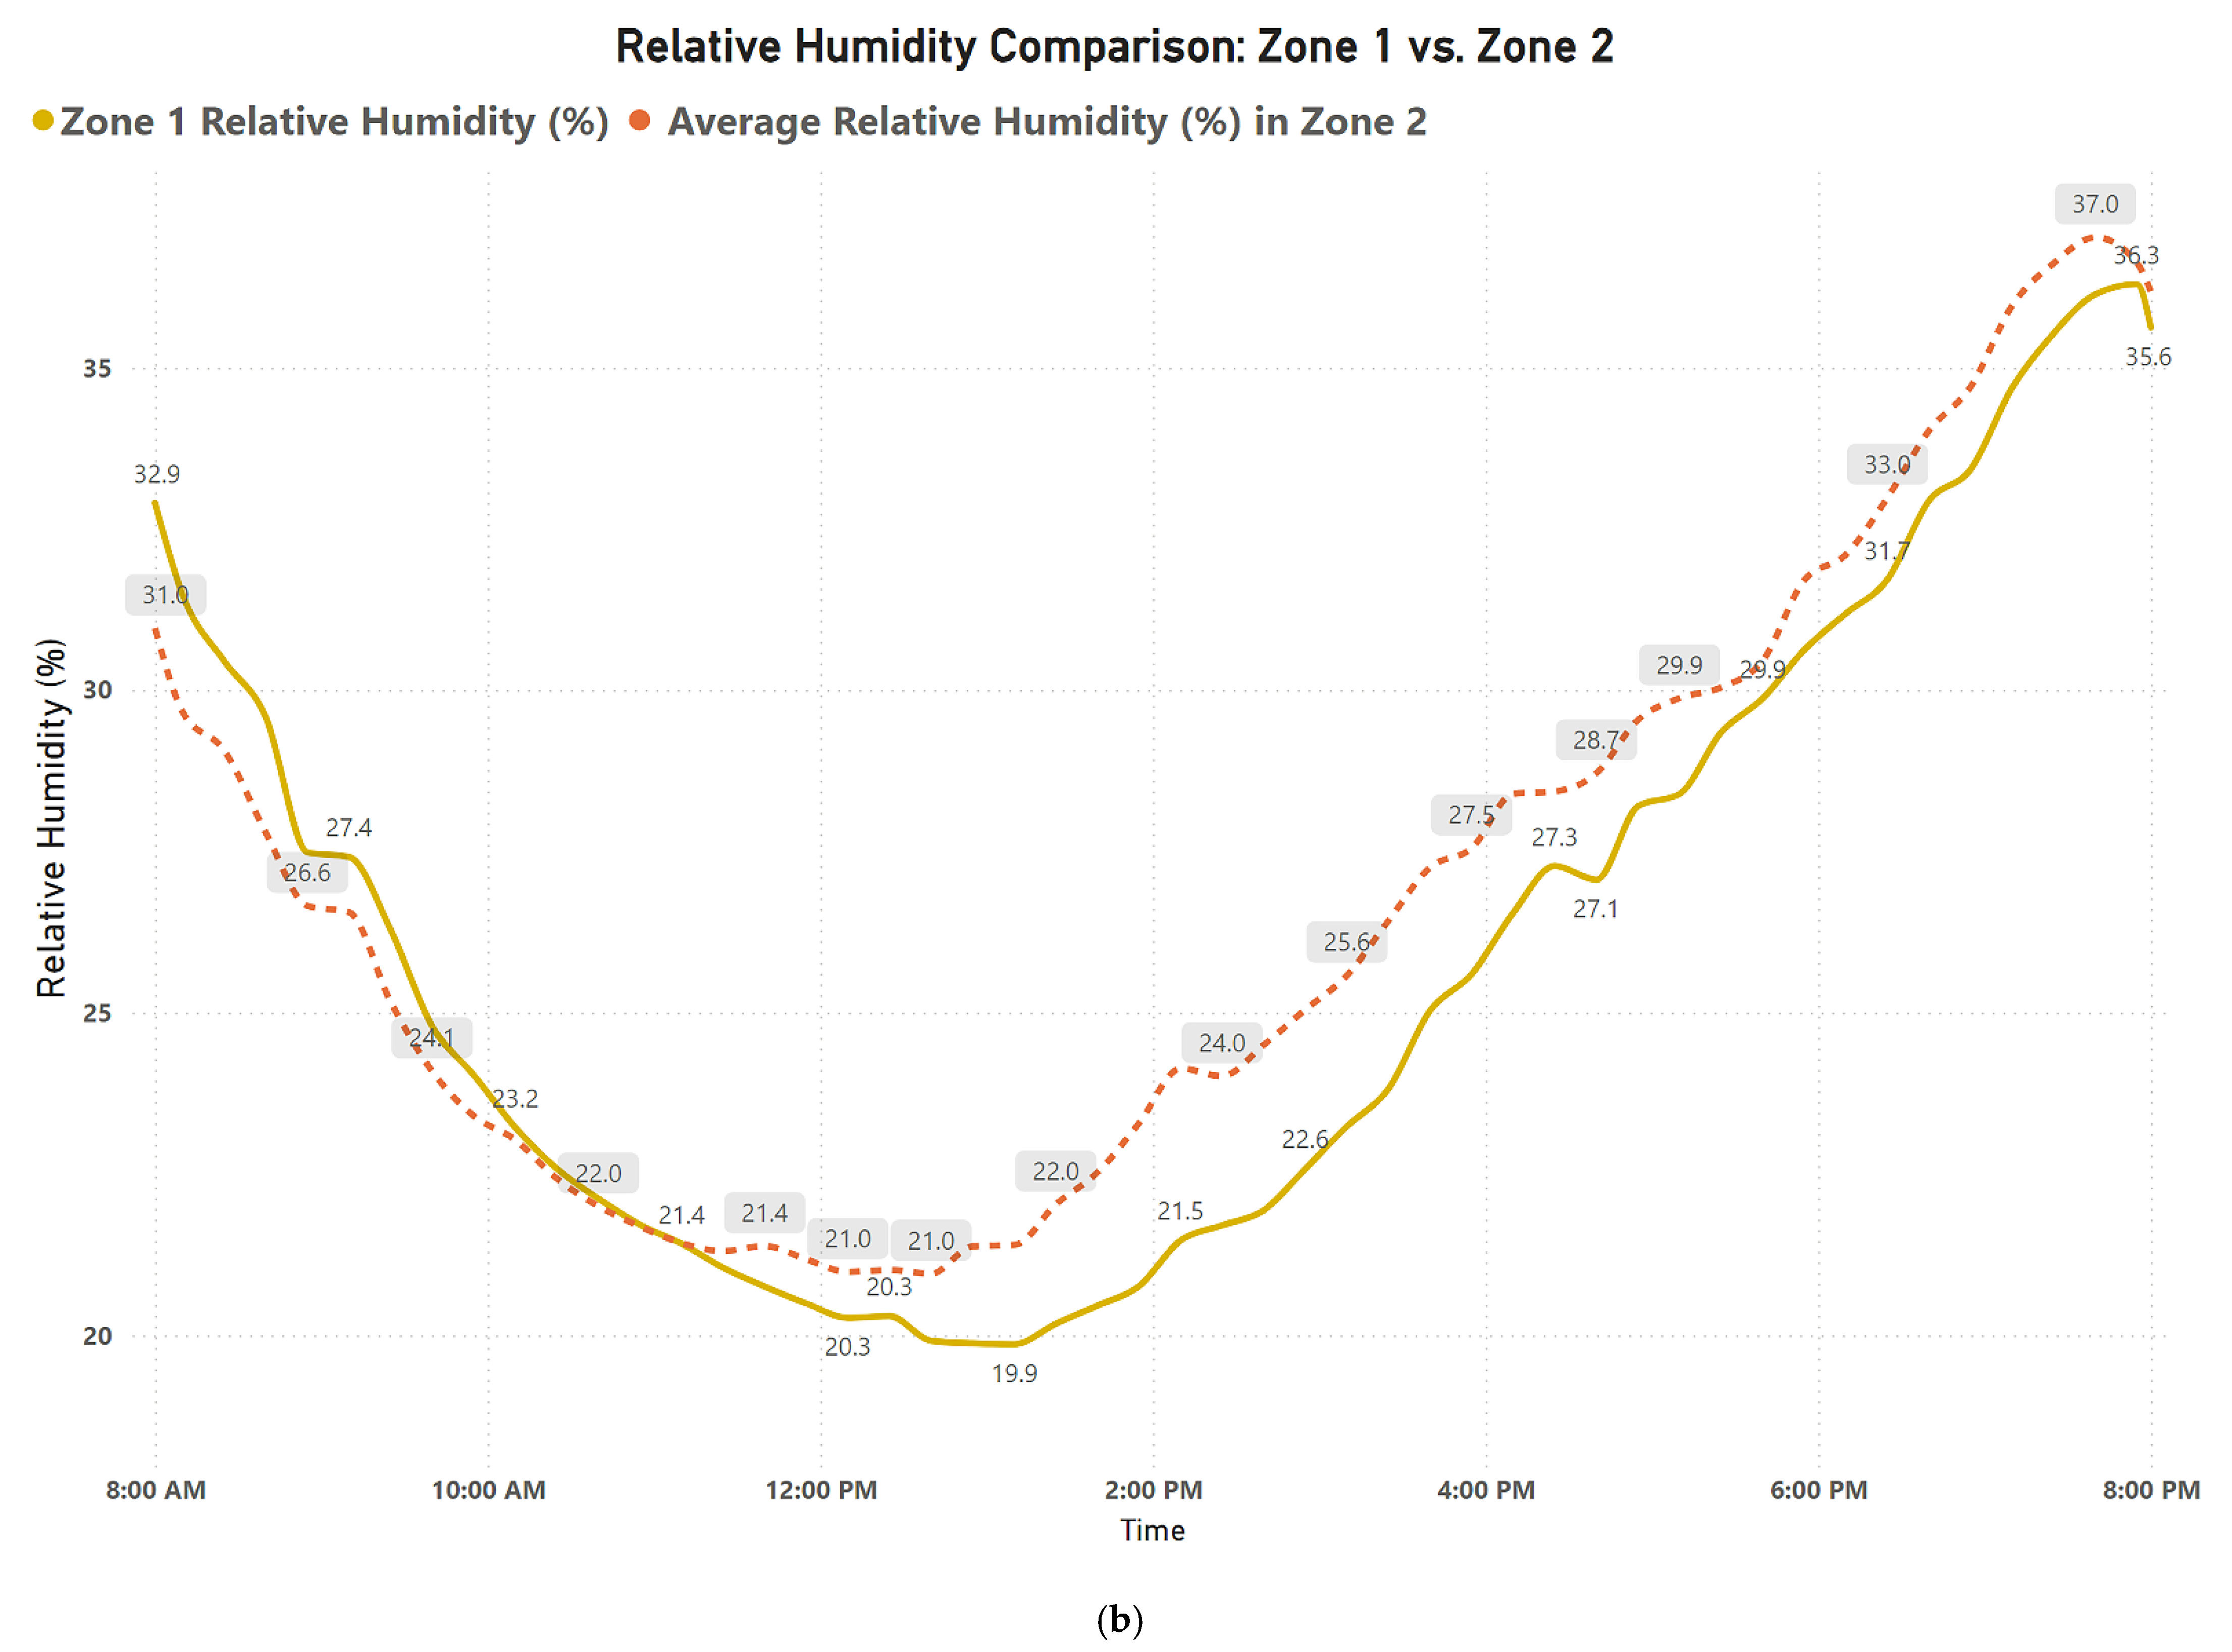
46] examined the impact of water temperature on misting systems using room temperature water. The study found a minimal temperature reduction of approximately 0.1 °C across water temperatures ranging from 18.5 °C to 29 °C. In contrast, our current experiment explored the use of significantly lower water temperatures, ranging from 19.3 °C to 7.7 °C, representing slightly chilled to cold water conditions, integrated into a mist fan system. The study generally operated within thermohydrometric boundaries of 20–70% relative humidity and 30–35 °C ambient temperature. In contrast, our current study observed a 2–4 °C temperature reduction within the MFS zone compared to the non-MFS zone, specifically in a semi-outdoor setting during peak summer temperatures of 40–45 °C.
According to the current experimental results, the RH frequently fell below 30% during daytime summer hours, putting the subject outside of the desired comfort range. However, the MFSs kept RH levels 5–10% higher than ambient, demonstrating the moistening effect of mist evaporation. While the MFS may not have a significant impact on overall environmental conditions, they do immediately reduce heat stress by moderating peak temperatures and maintaining humidity levels closer to the comfort range. These findings highlight the potential of MFS as a heat mitigation strategy in extreme climates, particularly in urban areas where direct sunlight and high temperatures exacerbate thermal discomfort.

4.2. The Effectiveness of the Water Temperature on the Outdoor Thermal Environment

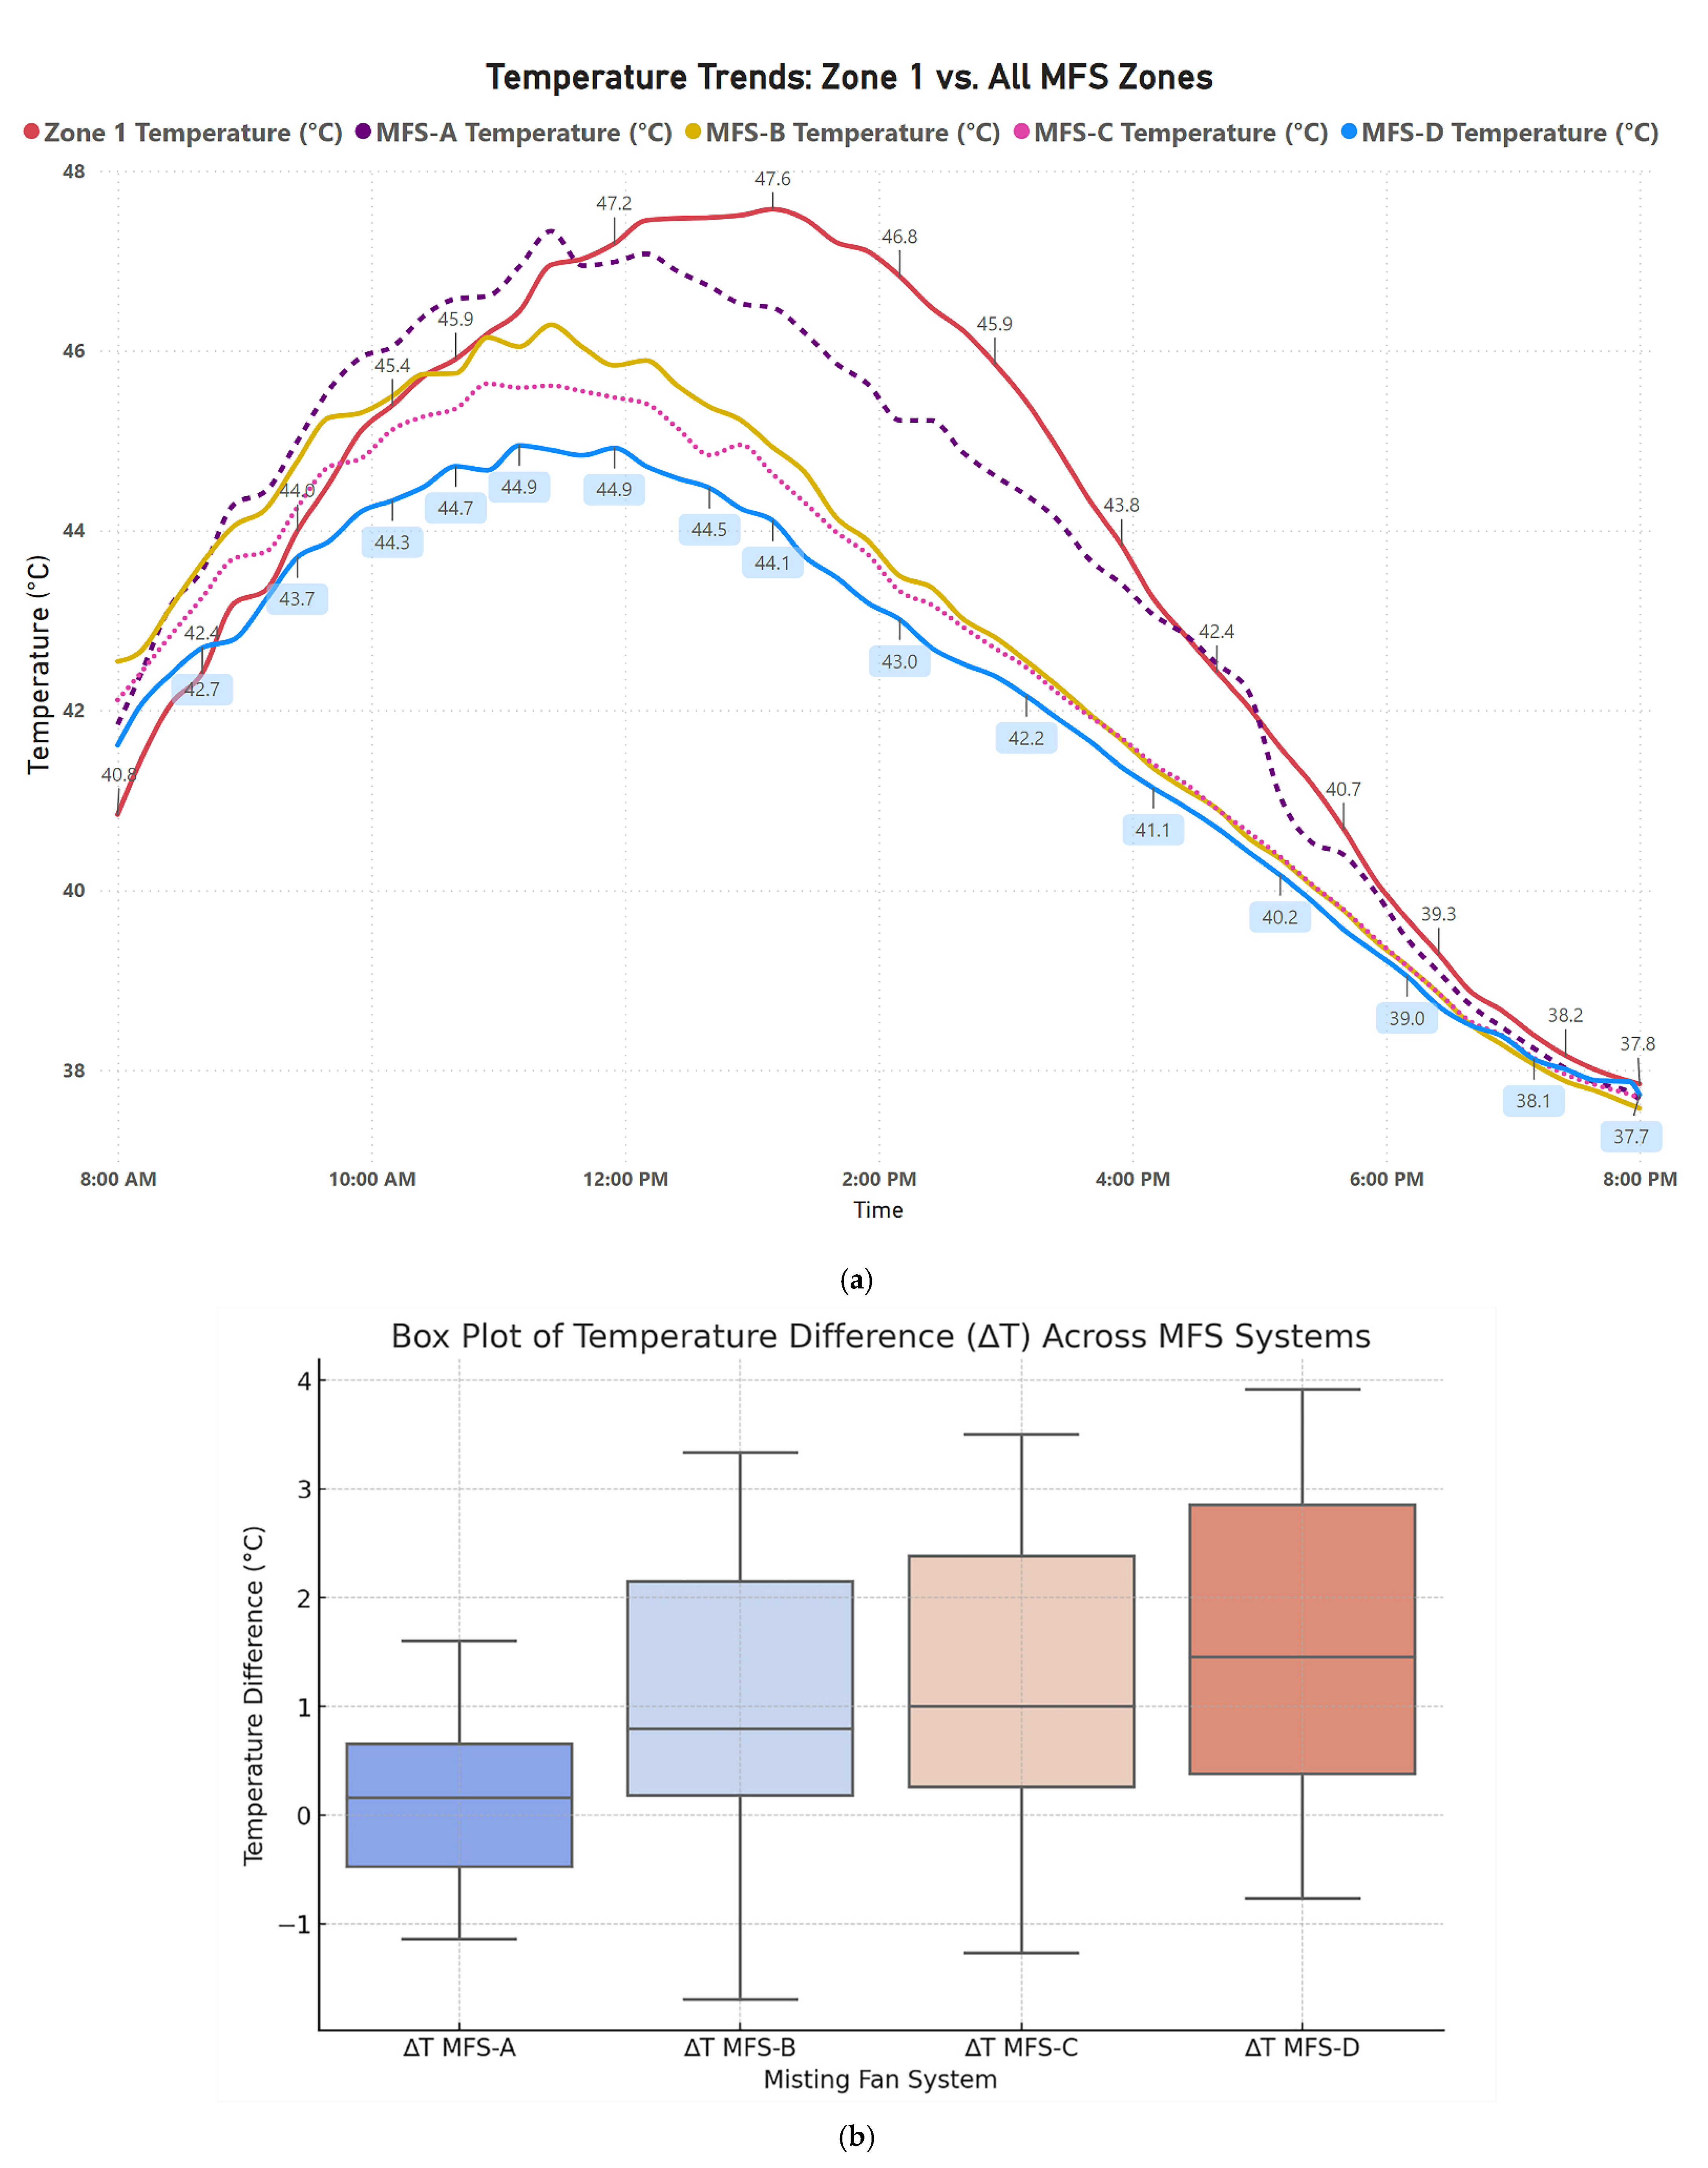
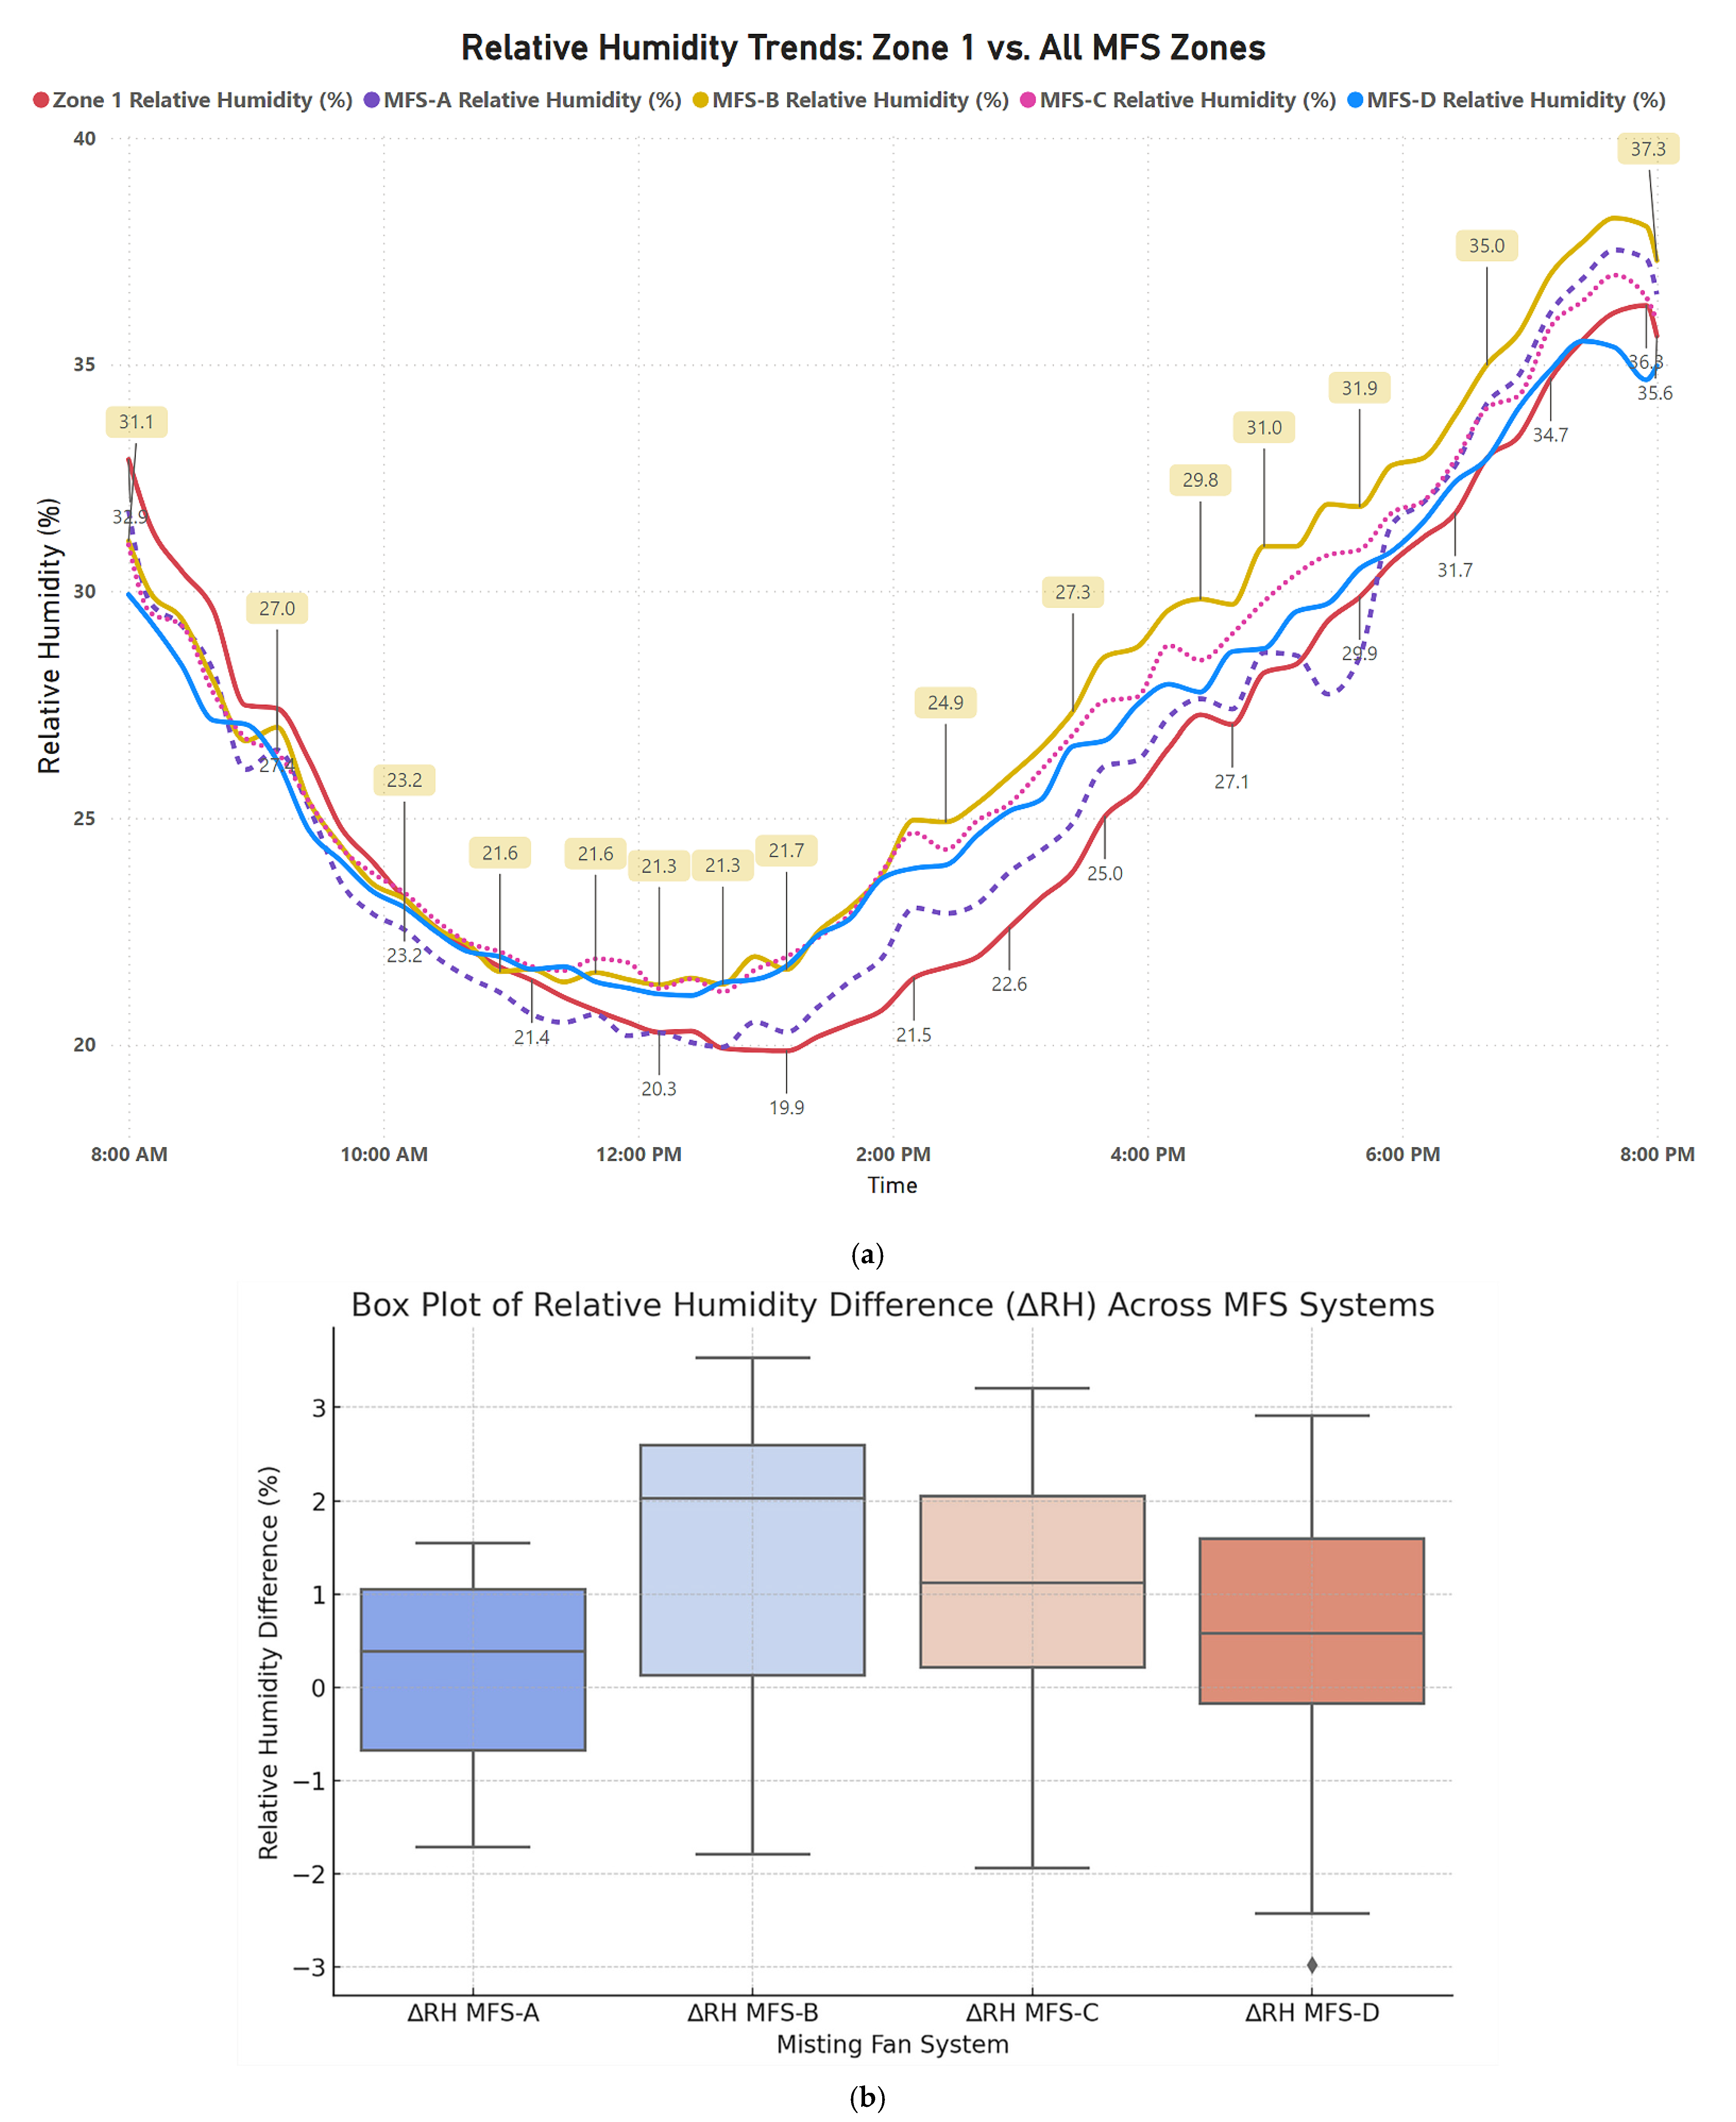
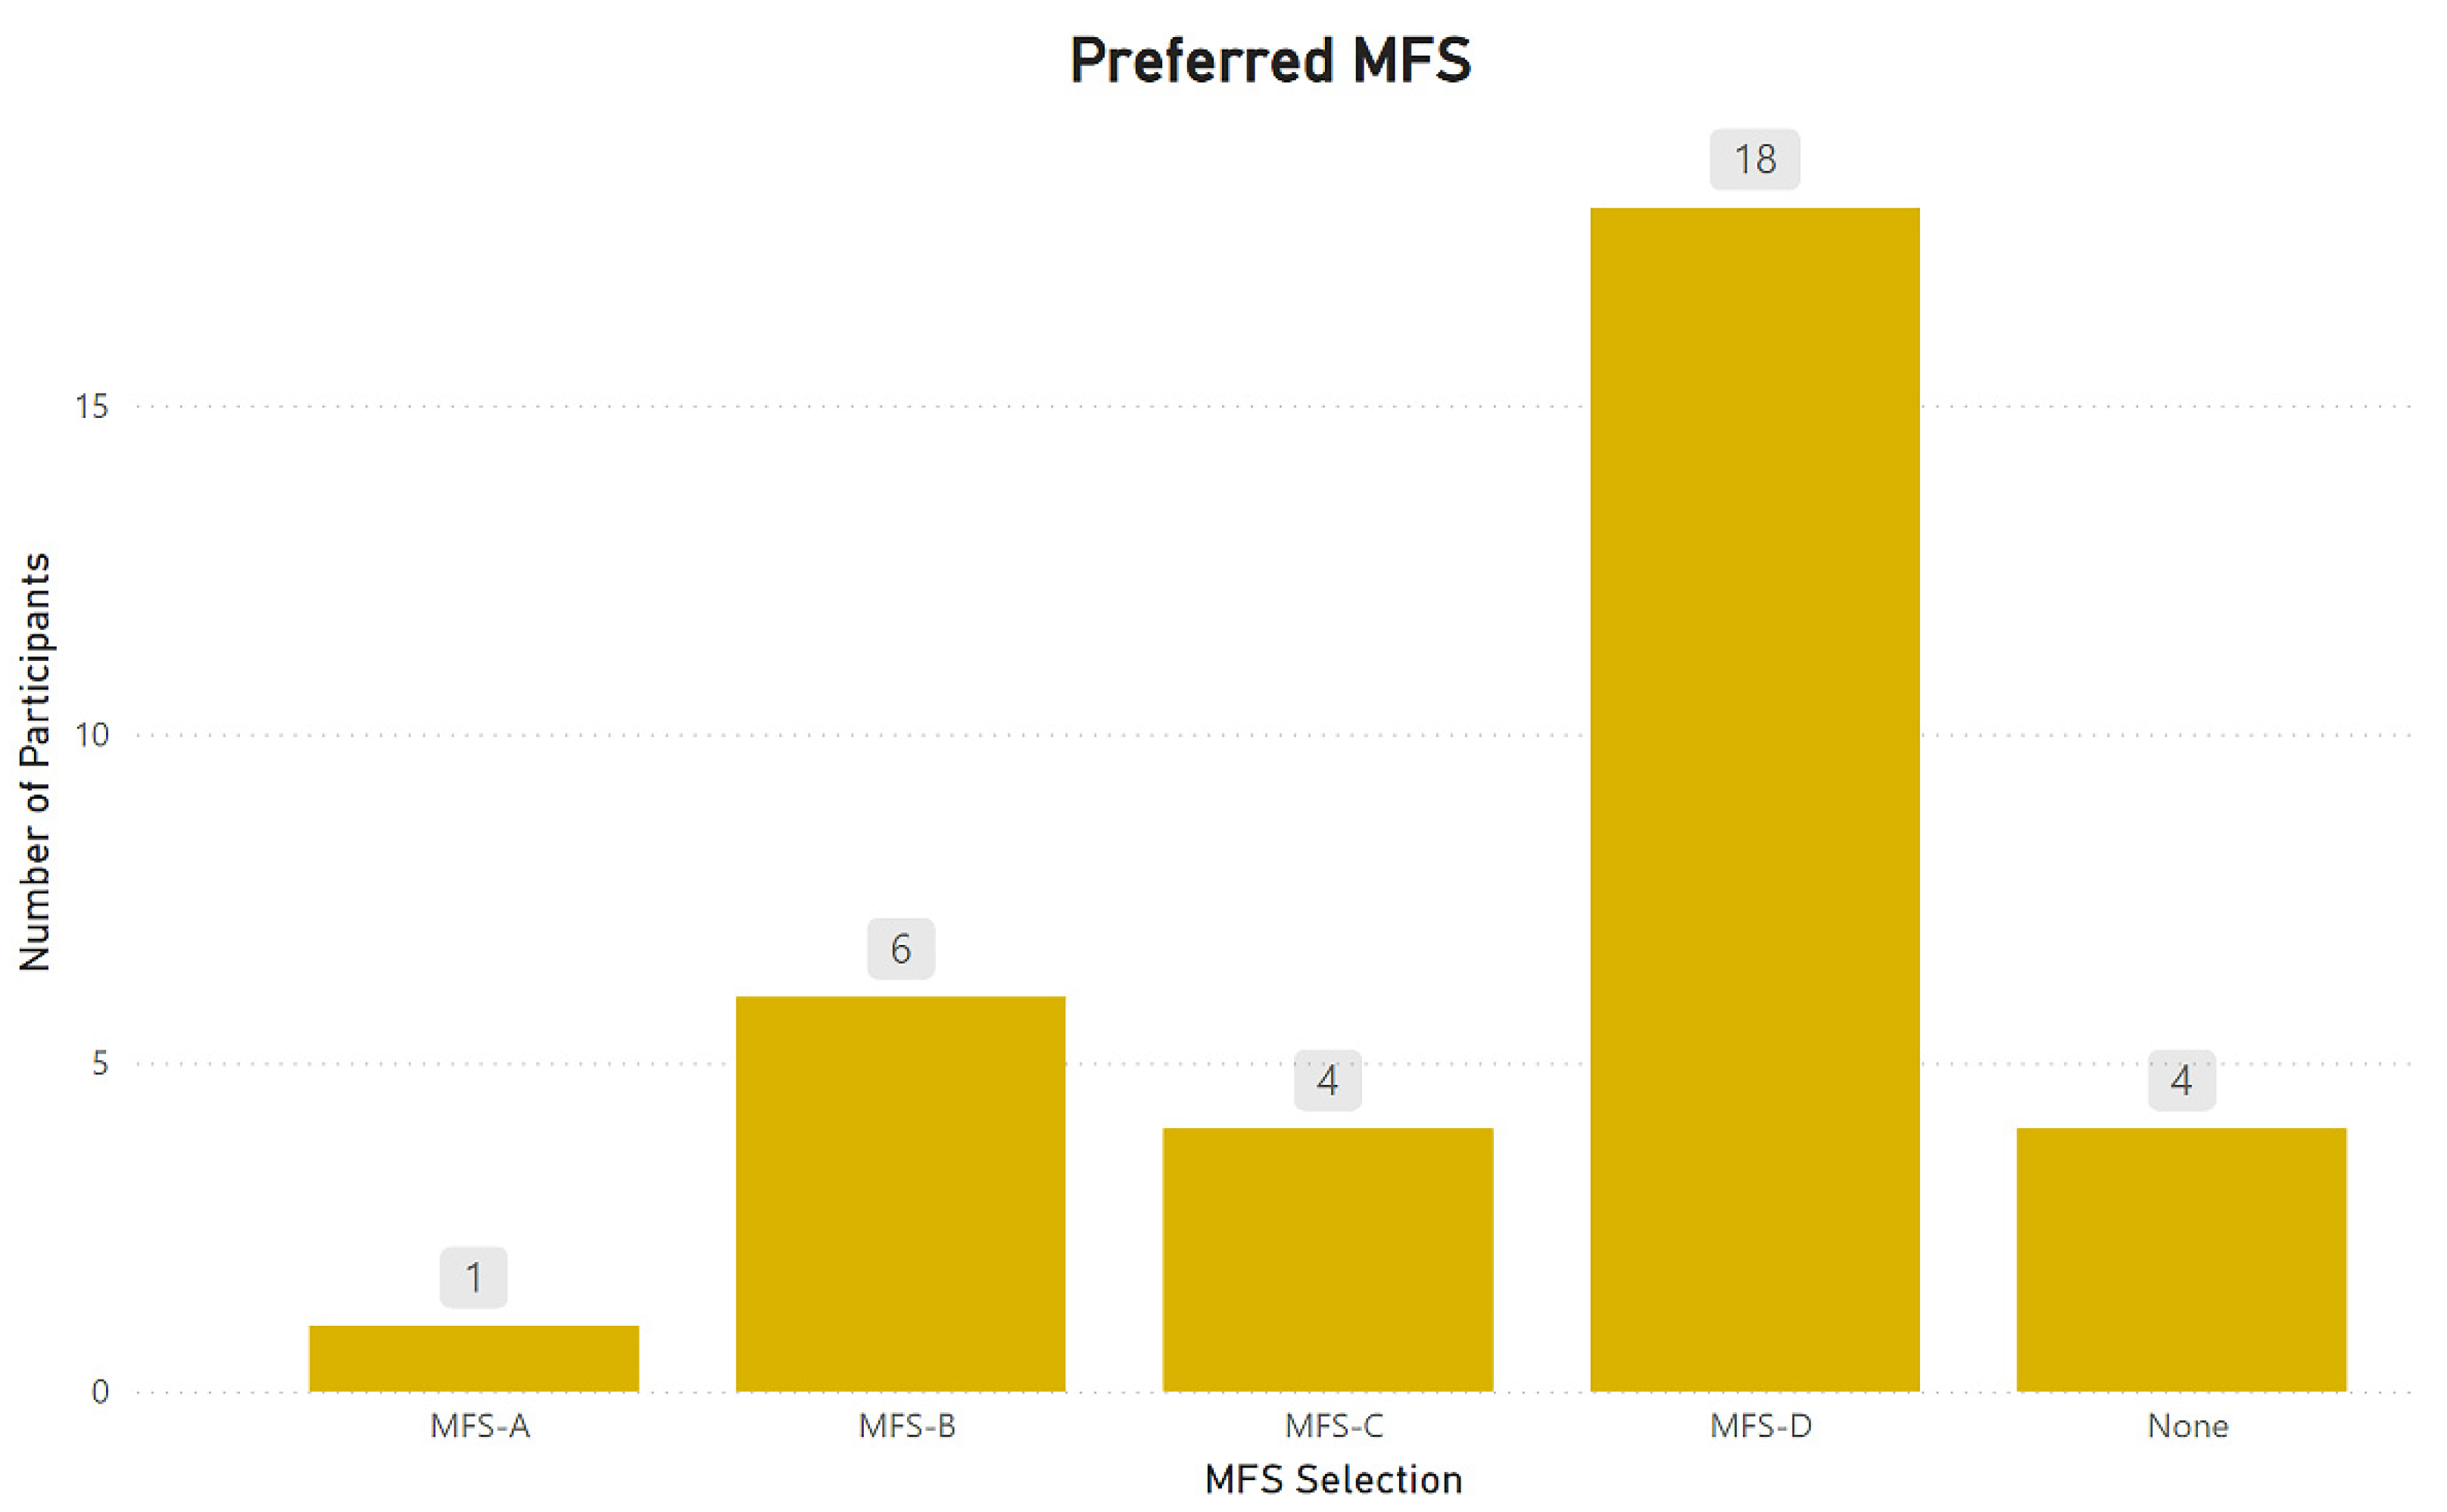
The evaluation of water temperature and fan speed in MFS performance highlights the significant role of cooler misting temperatures and optimized airflow in improving outdoor thermal comfort. The findings confirm that lower water temperatures, particularly in MFS-D (7.7 °C), resulted in the most substantial temperature reductions, with an average cooling effect of up to 4 °C compared to Zone 1. Conversely, higher water temperatures, such as in MFS-A (19.3 °C), had the least cooling impact, emphasizing the importance of utilizing colder water for effective mist cooling in extreme heat conditions. Similarly, the ∆RH analysis underscores that misting systems counteract excessive dryness, with MFS-B and MFS-C achieving the highest RH gains, peaking at 3.53% and 3.20%, respectively. However, while higher fan speeds (MFS-B) improved air circulation, they also reduced mist persistence, limiting full evaporative potential. In contrast, the MFS-C’s fan speed allowed for longer mist suspension, leading to greater RH retention and improved cooling stability. This balance between fan speed, evaporation rate, and water temperature suggests that mist cooling efficiency can be maximized through a carefully controlled combination of lower water temperatures and optimized air velocity. In this way, these findings reinforce that water temperature is the primary determinant of cooling effectiveness, while fan speed plays a crucial role in regulating mist dispersion and moisture retention.
The study’s findings showed a smaller impact than those of earlier studies [33], which was caused by the intense summer weather that persisted during the investigation. The findings also indicate that, in severe conditions like those in Bahrain and the broader MENA region, lowering the water temperature further is essential for optimal cooling. However, the mist spray systems demonstrated certain limitations in achieving the desired thermal comfort conditions across all MFSs in Bahrain’s extreme conditions. In fact, the average Ta across the experimental zones remained significantly above the upper comfort limits during the midday hours, particularly between 10 AM and 4 PM, when the influence of solar radiation was most intense. Despite the operation of mist systems, which effectively reduced temperatures by close to 4 degrees in MFS-D, the cooling effect was insufficient to bring the temperatures consistently within the desired thermal comfort range during this peak period. The inability of the mist systems to provide sufficient cooling under these extreme conditions may be linked to the limitations of evaporative cooling mechanisms, which are less effective when RH levels are high, which is characteristic of Bahrain’s summer climate. With average RH levels oscillating between 20% and 40% during the experimental period, the latent cooling effect achieved by water mist sprays was mitigated, reducing the system’s overall effectiveness.

4.3. The Effect of the MFS on User Comfort

The findings from the survey results suggest that mist cooling enhanced thermal comfort by reducing “Hot” and “Slightly Warm” perceptions while maintaining humidity within an optimal range. The observed improvements in thermal comfort—particularly the dramatic reduction in “Hot” perceptions—echo the findings of other investigations into mist-based cooling. A study [25] reported that just a few minutes of mist exposure in hot, humid environments can lower thermal sensation levels by 2–3 points, mirroring the shifts seen in our participants. Similarly, another study [26] demonstrated that 10 min in a mist-cooled space could bring individuals’ thermal sensation close to neutral and boost comfort ratings from slightly uncomfortable to slightly comfortable. These congruent outcomes reinforce our results, underscoring the consistency of mist cooling’s positive impact on subjective thermal experience. Moreover, the strong preference for MFS-D may stem from its ability to cool effectively without significantly raising humidity levels. In hot climates, higher temperatures and lower RH can speed up the evaporation of mist droplets [28,29], preventing the air from becoming muggy. Since MFS-D used the lowest water temperature and showed lower RH compared to MFS-B and MFS-C, it provided a refreshing sensation while also taking advantage of the rapid evaporation rate. The survey recorded the comfort of occupants within different MFS settings. The exploration of the cooling effect in space demonstrates that mist creates a gradient of conditions, rather than a homogeneous environment, allowing occupants to elect their level of comfort and experience thus curating a variety of atmospheres. Hence, the result supports the effectiveness of mist cooling in creating a more thermally neutral outdoor environment, helping individuals experience relief from heat without excessive humidity buildup. This balance is particularly important in hot and arid climates, where heat stress and dehydration risks are high, and mist cooling provides a viable solution for mitigating extreme conditions while maintaining comfort.
Moreover, the Chi-square critical value is a crucial element in statistical hypothesis testing, particularly in scenarios involving categorical data. When comparing two related subjects, such as temperature in two distinct zones or relative humidity in those same zones, a Chi-square critical value of 3.84 at a 95% confidence level indicates the threshold for statistical significance with one degree of freedom. This value is used to determine if observed differences between the two zones are likely to be due to chance or represent a genuine relationship. Conversely, when examining comfort ratings across multiple areas (MFSs), the complexity increases, leading to a higher critical value of 7.81. This elevated value reflects the increased degrees of freedom associated with analyzing more categories or variables. The Chi-square distribution, with its critical value tables, plays a vital role in both goodness-of-fit tests, assessing how well observed data align with expected distributions, and tests for independence, determining whether two categorical variables are related or independent.

4.4. The Effect of the Mist Fan Automated System

The MFSs demonstrated their on-demand utility, proving unnecessary for continuous operation due to fluctuating comfort levels throughout the day. To mitigate energy consumption associated with mist generation, fan operation, and water cooling, a solar-powered MFS is a viable solution. Furthermore, implementing an automated control system, responsive to ambient conditions, can optimize resource utilization by activating the MFS only when needed, thereby enhancing comfort while minimizing water and energy consumption and preventing excessive heat and humidity buildup.
The observed low transition efficiency of 2.9% appeared to be significantly influenced by extreme summer conditions, indicating the MFS’s limited ability to shift environmental conditions from non-comfort to comfort ranges. The finding suggests that the current system configuration is insufficient to counteract the high temperatures and humidity experienced during these periods. Consequently, further experimentation is crucial to optimize the system’s performance under such demanding circumstances. Specifically, investigations should focus on evaluating the impact of increased fan speeds and the utilization of chilled water to enhance the cooling capacity and facilitate a more effective transition toward comfortable environmental ranges.

5. Limitations of the Experiment

Despite these positive outcomes, the study also identified limitations. Even with optimal misting conditions, the extreme ambient temperatures during peak hours were not consistently reduced to within the standard thermal comfort zone, highlighting the inherent challenges posed by severe climatic conditions. This highlights the need for further research to optimize cooling strategies. Specifically, future studies should investigate (i) the impact of varying nozzle layouts, droplet sizes, and water pressures, coupled with lower water temperatures, on enhancing cooling and RH for improved user comfort; (ii) the effects of real-time wind variability, prolonged exposure periods, and diverse water temperatures, including environments with varying solar radiation levels; (iii) the study’s focus on a vertically mounted MFS also suggests a need to explore the impact of horizontal and combined horizontal–vertical configurations on mist distribution and cooling effectiveness; (iv) to comprehensively evaluate the mist fan system’s long-term effectiveness in achieving thermal comfort, future research should conduct multi-day studies spanning typical and extreme summer conditions; (v) while clothing choices were documented, an in-depth analysis of clothing type and color on thermal comfort is an area for exploration; and (vi) given that the MFS uses energy for mist generation, fan operation, and water cooling, a solar-powered system could significantly reduce reliance on electricity consumption. Assessing the potential energy savings achieved by incorporating solar power while maintaining a comfortable thermal environment is an important area for future research.

6. Conclusions

The MENA region, including Bahrain, faces severe climate change impacts such as rising temperatures, water scarcity, and urban heat island effects, with projections indicating extreme heat conditions nearing 50 °C by the end of the century. Bahrain, with one of the highest per capita CO2 emissions, is adopting mitigation strategies, including large-scale PV systems to reduce energy costs and diversify power sources. To combat heat stress, evaporative cooling and water mist systems are increasingly recommended, with their integration into PV-powered infrastructure offering a promising solution for sustainable cooling in harsh environments. In this way, this study set out to investigate the influence of water temperature on the performance of water mist spray systems in Bahrain’s extreme climates, using a field experiment. The experimental results and participant surveys consistently demonstrated that lowering water temperature markedly enhances the cooling effectiveness of mist systems. In particular, MFS-D—operating with water at 7.7 °C—achieved up to a 4 °C reduction in ambient temperature relative to non-misted conditions during peak solar radiation hours, and it maintained higher, more stable relative humidity levels that helped counteract the dryness experienced in the absence of mist cooling.
Subjective assessments from participants further corroborated the objective measurements. The introduction of mist cooling significantly shifted thermal perceptions away from discomfort; a majority of participants reported a transition from feeling “Hot” or “Slightly Warm” to “Natural” or even “Slightly Cool” upon exposure to mist. This positive feedback, alongside the environmental data, validates the potential of water mist systems as an immediate and effective heat stress mitigation strategy in hot, arid regions. Moreover, more than half of the participants (54.5%) identified MFS-D as their top choice, citing immediate relief from “hot” and “slightly warm” sensations. This alignment with objective measurements underscores that lowering water temperature can significantly enhance both measured cooling outcomes and perceived comfort in extreme heat. By contrast, the differences in MFS-B and MFS-C illuminate the delicate balance between water temperature and fan speed: MFS-B deployed a slightly cooler mist (12.3 °C) with a higher fan speed, which accelerated air movement but may have reduced the droplet “hang time” needed for thorough evaporation. Meanwhile, MFS-C used marginally warmer water (13.1 °C) at a lower fan speed, allowing droplets to linger and evaporate more gradually, thereby preserving RH more effectively. Objectively, MFS-C maintained marginally lower temperatures and higher humidity than MFS-B, but subjectively, more participants preferred MFS-B over MFS-C—suggesting that the sensation of stronger airflow can sometimes outweigh the benefits of slightly higher mist temperatures. Such nuances highlight that while cooler water is pivotal for optimal performance, a harmonious interplay between mist temperature, droplet residence time, and air circulation is essential to maximize both objective cooling metrics and subjective comfort.
The gathered data reveal a statistically significant and robust positive correlation among participants’ responses across multiple assessed variables. There was a significant concordance between reported Ta feelings in two separate zones, as well as a strong correlation in RH feelings within those same zones. Moreover, participant comfort levels across various MFS domains demonstrated significant consistency. The findings, supported by statistical significance testing, indicate that the observed correlations were unlikely to result from random chance. Thus, the authors considered the survey results to be reliable and representative, given the relatively small sample size. This consistency suggests that individuals generally evaluated the zones similarly, and that differences in perceived comfort within one zone may have forecasted perceptions in others. Consequently, the authors viewed the survey results as valid and reflective of the participants’ experiences.
Hence, the findings reveal that water temperature is a key factor in cooling efficiency for mist systems, with lower temperatures facilitating faster evaporation and enhanced thermal relief. However, the study also underscored the importance of balancing water temperature with fan speed. While higher fan speeds can improve air circulation, they may inadvertently reduce the residence time of mist droplets, limiting their evaporative potential. Thus, optimizing the interplay between water temperature and fan speed—evidenced by the performance differences between MFS-B and MFS-C—is crucial for maximizing cooling benefits.

Author Contributions

Conceptualization, A.M.S. and D.R.O.; Methodology, A.M.S.; Validation, D.R.O.; Formal analysis, A.G.; Investigation, D.R.O., A.A. and A.G.; Resources, A.M.S.; Data curation, D.R.O., A.A. and A.G.; Writing—original draft, D.R.O., A.A. and A.G.; Writing—review & editing, A.M.S.; Supervision, A.M.S.; Project administration, A.M.S.; Funding acquisition, A.M.S. All authors have read and agreed to the published version of the manuscript.

Funding

This research work was partially financed by Kingdom University, Bahrain, from the research grant number KU-SRU-2024-11.

Data Availability Statement

The data presented in this study are available on request from the corresponding author on reasonable request.

Acknowledgments

The authors gratefully acknowledge the support and encouragement provided by Nader Mohammed Al-Bastaki, Academic Affairs and Scientific Research, and Hassan Rafdan AlHajhoj, Kingdom University, for their instrumental role in facilitating the research funding.

Conflicts of Interest

The authors declare no conflict of interest.

References

  1. Fonseca, R.; Francis, D. Satellite Derived Trends and Variability of CO2 Concentrations in the Middle East during 2014–2023. Front. Environ. Sci. 2024, 11, 1289142. [Google Scholar] [CrossRef]
  2. Pérez-Carramiñana, C.; González-Avilés, Á.B.; Castilla, N.; Galiano-Garrigós, A. Influence of Sun Shading Devices on Energy Efficiency, Thermal Comfort and Lighting Comfort in a Warm Semi-Arid Dry Mediterranean Climate. Buildings 2024, 14, 556. [Google Scholar] [CrossRef]
  3. Lee, H.; Calvin, K.; Dasgupta, D.; Krinner, G.; Mukherji, A.; Thorne, P.; Trisos, C.; Romero, J.; Aldunce, P.; Barret, K. IPCC, 2023: Climate Change 2023: Synthesis Report, Summary for Policymakers. Contribution of Working Groups I, II and III to the Sixth Assessment Report of the Intergovernmental Panel on Climate Change; Core Writing Team, Lee, H., Romero, J., Eds.; IPCC: Geneva, Switzerland, 2023. [Google Scholar]
  4. Pal, J.S.; Eltahir, E.A. Future Temperature in Southwest Asia Projected to Exceed a Threshold for Human Adaptability. Nat. Clim. Chang. 2016, 6, 197–200. [Google Scholar] [CrossRef]
  5. Rajeswari, J.R.; Fountoukis, C.; Siddique, A.; Moosakutty, S.; Mohieldeen, Y.; Ayoub, M.A.; Alfarra, M.R. Urban Heat Island Phenomenon in a Desert, Coastal City: The Impact of Urbanization. Urban Clim. 2024, 56, 102016. [Google Scholar] [CrossRef]
  6. Rashtian, Z.; Manesh, M.T.; Tahsildoost, M.; Zomorodian, Z.S. Data-Driven Real-Time Visualization of Urban Heat Islands Using Mean Radiant Temperature for Urban Design. Energy Build. 2025, 333, 115470. [Google Scholar] [CrossRef]
  7. Radhi, H.; Sharples, S.; Taleb, H.; Fahmy, M. Will Cool Roofs Improve the Thermal Performance of Our Built Environment? A Study Assessing Roof Systems in Bahrain. Energy Build. 2017, 135, 324–337. [Google Scholar] [CrossRef]
  8. Zhu, S.; Ma, C.; Wu, Z.; Huang, Y.; Liu, X. Exploring the Impact of Urban Morphology on Building Energy Consumption and Outdoor Comfort: A Comparative Study in Hot-Humid Climates. Buildings 2024, 14, 1381. [Google Scholar] [CrossRef]
  9. Lelieveld, J.; Proestos, Y.; Hadjinicolaou, P.; Tanarhte, M.; Tyrlis, E.; Zittis, G. Strongly Increasing Heat Extremes in the Middle East and North Africa (MENA) in the 21st Century. Clim. Chang. 2016, 137, 245–260. [Google Scholar] [CrossRef]
  10. World Bank Climate Change Knowledge Portal. Available online: https://climateknowledgeportal.worldbank.org/ (accessed on 14 March 2025).
  11. Alsabbagh, M.; Alnaser, W.E. Transitioning to Carbon Neutrality in Bahrain: A Policy Brief. Arab Gulf J. Sci. Res. 2022, 40, 25–33. [Google Scholar] [CrossRef]
  12. Pillai, G.; Naser, H.A.Y. Techno-Economic Potential of Largescale Photovoltaics in Bahrain. Sustain. Energy Technol. Assess. 2018, 27, 40–45. [Google Scholar] [CrossRef]
  13. Liu, C.; Yavar, Z.; Sun, Q. Cardiovascular Response to Thermoregulatory Challenges. Am. J. Physiol.-Heart Circ. Physiol. 2015, 309, H1793–H1812. [Google Scholar] [CrossRef]
  14. Gauer, R.; Meyers, B.K. Heat-Related Illnesses. Am. Fam. Physician 2019, 99, 482–489. [Google Scholar]
  15. O’Connor, J.P. Simple and Effective Method to Lower Body Core Temperatures of Hyperthermic Patients. Am. J. Emerg. Med. 2017, 35, 881–884. [Google Scholar] [CrossRef]
  16. Biddinger, P.D. Emergency Medicine; Lippincott Williams & Wilkins: Philadelphia, PA, USA, 2002; ISBN 0-7817-3551-3. [Google Scholar]
  17. Oropeza-Perez, I.; Østergaard, P.A. Active and Passive Cooling Methods for Dwellings: A Review. Renew. Sustain. Energy Rev. 2018, 82, 531–544. [Google Scholar] [CrossRef]
  18. Wang, P.; Lu, S.; Wu, X.; Tian, J.; Li, N. Mist Spraying as an Outdoor Cooling Spot in Hot-Humid Areas: Effect of Ambient Environment and Impact on Short-Term Thermal Perception. Buildings 2024, 14, 336. [Google Scholar] [CrossRef]
  19. Santamouris, M.; Ding, L.; Fiorito, F.; Oldfield, P.; Osmond, P.; Paolini, R.; Prasad, D.; Synnefa, A. Passive and Active Cooling for the Outdoor Built Environment—Analysis and Assessment of the Cooling Potential of Mitigation Technologies Using Performance Data from 220 Large Scale Projects. Sol. Energy 2017, 154, 14–33. [Google Scholar] [CrossRef]
  20. Farnham, C.; Emura, K.; Mizuno, T. Evaluation of Cooling Effects: Outdoor Water Mist Fan. Build. Res. Inf. 2015, 43, 334–345. [Google Scholar] [CrossRef]
  21. Ulpiani, G.; Di Giuseppe, E.; Di Perna, C.; D’Orazio, M.; Zinzi, M. Thermal Comfort Improvement in Urban Spaces with Water Spray Systems: Field Measurements and Survey. Build. Environ. 2019, 156, 46–61. [Google Scholar] [CrossRef]
  22. Dombrovsky, L.A.; Solovjov, V.P.; Webb, B.W. Attenuation of Solar Radiation by a Water Mist from the Ultraviolet to the Infrared Range. J. Quant. Spectrosc. Radiat. Transf. 2011, 112, 1182–1190. [Google Scholar] [CrossRef]
  23. Atieh, A.; Al Shariff, S. Solar Energy Powering up Aerial Misting Systems for Cooling Surroundings in Saudi Arabia. Energy Convers. Manag. 2013, 65, 670–674. [Google Scholar] [CrossRef]
  24. Huang, C.; Cai, J.; Lin, Z.; Zhang, Q.; Cui, Y. Solving Model of Temperature and Humidity Profiles in Spray Cooling Zone. Build. Environ. 2017, 123, 189–199. [Google Scholar] [CrossRef]
  25. Desert, A.; Naboni, E.; Garcia, D. The Spatial Comfort and Thermal Delight of Outdoor Misting Installations in Hot and Humid Extreme Environments. Energy Build. 2020, 224, 110202. [Google Scholar] [CrossRef]
  26. Zhang, M.; Xu, C.; Meng, L.; Meng, X. Outdoor Comfort Level Improvement in the Traffic Waiting Areas by Using a Mist Spray System: An Experiment and Questionnaire Study. Sustain. Cities Soc. 2021, 71, 102973. [Google Scholar] [CrossRef]
  27. Huang, C.; Ye, D.; Zhao, H.; Liang, T.; Lin, Z.; Yin, H.; Yang, Y. The Research and Application of Spray Cooling Technology in Shanghai Expo. Appl. Therm. Eng. 2011, 31, 3726–3735. [Google Scholar] [CrossRef]
  28. Montazeri, H.; Blocken, B.; Hensen, J.L.M. CFD Analysis of the Impact of Physical Parameters on Evaporative Cooling by a Mist Spray System. Appl. Therm. Eng. 2015, 75, 608–622. [Google Scholar] [CrossRef]
  29. Ishii, T.; Tsujimoto, M.; Yoon, G.; Okumiya, M. Cooling System with Water Mist Sprayers for Mitigation of Heat-Island. In Proceedings of the Seventh International Conference on Urban Climate, Yokohama, Japan, 29 June–3 July 2009; Volume 29. [Google Scholar]
  30. Ulpiani, G.; di Perna, C.; Zinzi, M. Mist Cooling in Urban Spaces: Understanding the Key Factors behind the Mitigation Potential. Appl. Therm. Eng. 2020, 178, 115644. [Google Scholar] [CrossRef]
  31. Oh, W.; Ooka, R.; Nakano, J.; Kikumoto, H.; Ogawa, O. Environmental Index for Evaluating Thermal Sensations in a Mist Spraying Environment. Build. Environ. 2019, 161, 106219. [Google Scholar] [CrossRef]
  32. Ye, D.; Wu, L.; Liang, T.; Huang, C.; Zhao, H.; Yang, Y. Research and Application of High-Pressure Spray-Cooling Technology to World Expo Axis. Heat. Vent. Air Cond 2010, 40, 86–90. [Google Scholar]
  33. Ulpiani, G. Water Mist Spray for Outdoor Cooling: A Systematic Review of Technologies, Methods and Impacts. Appl. Energy 2019, 254, 113647. [Google Scholar] [CrossRef]
  34. Jun-feng, W.; Xin-cheng, T. Experimental Study and Numerical Simulation on Evaporative Cooling of Fine Water Mist in Outdoor Environment. In Proceedings of the 2009 International Conference on Energy and Environment Technology, Guilin, China, 16–18 October 2009; Volume 1, pp. 156–159. [Google Scholar]
  35. Nouri, A.S.; Costa, J.P. Addressing Thermophysiological Thresholds and Psychological Aspects during Hot and Dry Mediterranean Summers through Public Space Design: The Case of Rossio. Build. Environ. 2017, 118, 67–90. [Google Scholar] [CrossRef]
  36. Farnham, C.; Nakao, M.; Nishioka, M.; Nabeshima, M.; Mizuno, T. Study of Mist-Cooling for Semi-Enclosed Spaces in Osaka, Japan. Procedia Environ. Sci. 2011, 4, 228–238. [Google Scholar] [CrossRef]
  37. Wang, J.; Meng, Q.; Yang, C.; Ren, P.; Santamouris, M. Spray Optimization to Enhance the Cooling Performance of Transparent Roofs in Hot-Humid Areas. Energy Build. 2023, 286, 112929. [Google Scholar] [CrossRef]
  38. Sureshkumar, R.; Kale, S.R.; Dhar, P.L. Heat and Mass Transfer Processes between a Water Spray and Ambient Air—II. Simulations. Appl. Therm. Eng. 2008, 28, 361–371. [Google Scholar] [CrossRef]
  39. Su, M.; Hong, B.; Su, X.; Liu, A.; Chang, J. How the Nozzle Density and Height of Mist Spraying Affect Pedestrian Outdoor Thermal Comfort: A Field Study. Build. Environ. 2022, 215, 108968. [Google Scholar] [CrossRef]
  40. Oh, W.; Ooka, R.; Nakano, J.; Kikumoto, H.; Ogawa, O. Evaluation of Mist-Spraying Environment on Thermal Sensations, Thermal Environment, and Skin Temperature under Different Operation Modes. Build. Environ. 2020, 168, 106484. [Google Scholar] [CrossRef]
  41. Ulpiani, G.; di Perna, C.; Zinzi, M. Water Nebulization to Counteract Urban Overheating: Development and Experimental Test of a Smart Logic to Maximize Energy Efficiency and Outdoor Environmental Quality. Appl. Energy 2019, 239, 1091–1113. [Google Scholar] [CrossRef]
  42. Di Giuseppe, E.; Ulpiani, G.; Cancellieri, C.; Di Perna, C.; D’Orazio, M.; Zinzi, M. Numerical Modelling and Experimental Validation of the Microclimatic Impacts of Water Mist Cooling in Urban Areas. Energy Build. 2021, 231, 110638. [Google Scholar] [CrossRef]
  43. Barrow, H.; Pope, C.W. Droplet Evaporation with Reference to the Effectiveness of Water-Mist Cooling. Appl. Energy 2007, 84, 404–412. [Google Scholar] [CrossRef]
  44. Haeussermann, A.; Hartung, E.; Jungbluth, T.; Vranken, E.; Aerts, J.-M.; Berckmans, D. Cooling Effects and Evaporation Characteristics of Fogging Systems in an Experimental Piggery. Biosyst. Eng. 2007, 97, 395–405. [Google Scholar] [CrossRef]
  45. Zhou, N.; Chen, F.; Cao, Y.; Chen, M.; Wang, Y. Experimental Investigation on the Performance of a Water Spray Cooling System. Appl. Therm. Eng. 2017, 112, 1117–1128. [Google Scholar] [CrossRef]
  46. Zheng, K.; Ichinose, M.; Wong, N.H. Parametric Study on the Cooling Effects from Dry Mists in a Controlled Environment. Build. Environ. 2018, 141, 61–70. [Google Scholar] [CrossRef]
  47. Li, C.; Mao, R.; Wang, Y.; Zhang, J.; Lan, J.; Zhang, Z. Experimental Study on Direct Evaporative Cooling for Free Cooling of Data Centers. Energy 2024, 288, 129889. [Google Scholar] [CrossRef]
  48. Abulibdeh, A. Analysis of Urban Heat Island Characteristics and Mitigation Strategies for Eight Arid and Semi-Arid Gulf Region Cities. Environ. Earth Sci. 2021, 80, 1–26. [Google Scholar] [CrossRef]
  49. Taki, A.; Alsheglawi, B. Toward Energy-Efficient Houses Considering Social Cultural Needs in Bahrain: A New Framework Approach. Sustainability 2022, 14, 6842. [Google Scholar] [CrossRef]
  50. Krarti, M.; Dubey, K. Benefits of Energy Efficiency Programs for Residential Buildings in Bahrain. J. Build. Eng. 2018, 18, 40–50. [Google Scholar] [CrossRef]
  51. ANSI/ASHRAE Standard 55; Thermal Environmental Conditions for Human Occupancy. ASHRAE: Peachtree Corners, GA, USA, 1992; p. 5.
  52. ISO 7730:2005; Ergonomics of the Thermal Environment-Analytical Determination and Interpretation of Thermal Comfort Using Calculation of the PMV and PPD Indices and Local Thermal Comfort Criteria. ISO: Geneva, Switzerland, 2005.
  53. Smallcombe, J.W.; Hodder, S.; Kuklane, K.; Młynarczyk, M.; Loveday, D.; Petersson, J.; Halder, A.; Havenith, G. Updated Database of Clothing Thermal Insulation and Vapor Permeability Values of Western Ensembles for Use in ASHRAE Standard 55, ISO 7730, and ISO 9920. ASHRAE Trans. 2021, 127, 773–799. [Google Scholar]
  54. Beizaee, A.; Firth, S.; Vadodaria, K.; Loveday, D. Assessing the Ability of PMV Model in Predicting Thermal Sensation in Naturally Ventilated Buildings in UK. In Proceedings of the 7th Windsor Conference: The Changing Context of Comfort in an Unpredictable World, London, UK, 12–15 April 2012. [Google Scholar]
  55. Lan, L.; Pan, L.; Lian, Z.; Huang, H.; Lin, Y. Experimental Study on Thermal Comfort of Sleeping People at Different Air Temperatures. Build. Environ. 2014, 73, 24–31. [Google Scholar] [CrossRef]
  56. Lan, L.; Xia, L.; Tang, J.; Zhang, X.; Lin, Y.; Wang, Z. Elevated Airflow Can Maintain Sleep Quality and Thermal Comfort of the Elderly in a Hot Environment. Indoor Air 2019, 29, 1040–1049. [Google Scholar] [CrossRef]
  57. Yang, B.; Liu, P.; Liu, Y.; Jin, D.; Wang, F. Assessment of Thermal Comfort and Air Quality of Room Conditions by Impinging Jet Ventilation Integrated with Ductless Personalized Ventilation. Sustainability 2022, 14, 12526. [Google Scholar] [CrossRef]
  58. Taherdoost, H. Determining Sample Size; How to Calculate Survey Sample Size. Int. J. Econ. Manag. Syst. 2017, 2, 237–239. [Google Scholar]
  59. Kendall, M.G.; Smith, B.B. The Problem of m Rankings. Ann. Math. Stat. 1939, 10, 275–287. [Google Scholar] [CrossRef]
  60. Siegel, S. Nonparametric Statistics for the Behavorial Sciences; McGraw-Hill: New York, NY, USA, 1956. [Google Scholar]
  61. Legendre, P. Species Associations: The Kendall Coefficient of Concordance Revisited. J. Agric. Biol. Environ. Stat. 2005, 10, 226–245. [Google Scholar] [CrossRef]
  62. Wackerly, D.D. Mathematical Statistics with Applications; Thomson Brooks/Cole: Pacific Grove, CA, USA, 2008; ISBN 0-495-38508-5. [Google Scholar]
Figure 1. A diagram illustrates the research methodology workflow.
Buildings 15 01410 g001
Figure 2. Schematic cross-section and plan of the semi-outdoor pedestrian passage at Kingdom University (a,c), and a photograph of the experimental setup (b). The images illustrate the fabric-covered structure, wall boundaries, and positions of the sensors and mist fans used in the study.
Buildings 15 01410 g002
Figure 3. Schematic diagram of the mist fan control system, illustrating the ESP microcontroller, 4-channel relay module, SensorPush unit for real-time Bluetooth data, and connections to the fan and water pump.
Buildings 15 01410 g003
Figure 4. Targeted human thermal comfort ranges and the eight adjacent non-comfort ranges.
Buildings 15 01410 g004
Figure 5. Comparison of the thermal comfort ranges of Zone 1 and the average thermal comfort ranges of all MFSs in Zone 2.
Buildings 15 01410 g005
Figure 6. Comparison of the temperature and relative humidity between Zone 1 (without mist) and Zone 2 (with mist): (a) temperature variation and (b) relative humidity trends.
Buildings 15 01410 g006aBuildings 15 01410 g006b
Figure 7. Comparison of temperature trends and cooling efficiency among MFSs: (a) temperature trends across Zone 1 and all MFS zones and (b) box plot of temperature differences (ΔT) across MFSs.
Buildings 15 01410 g007
Figure 8. Comparison of relative humidity trends and ΔRH across misting systems: (a) relative humidity trends in Zone 1 and all MFSs and (b) box plot of relative humidity difference (ΔRH) across MFSs.
Buildings 15 01410 g008
Figure 9. Age and gender distribution of participants.
Buildings 15 01410 g009
Figure 10. Heatmaps showing temperature (a) and relative humidity (b) variations across Zone 1 and MFSs during the experiment.
Buildings 15 01410 g010
Figure 11. Comparison of participants’ temperature perception before and after mist cooling: (a) temperature perception before and after mist exposure and (b) transition matrix showing shifts in thermal perception before and after misting.
Buildings 15 01410 g011
Figure 12. Comparison of participants’ humidity perception before and after mist cooling: (a) humidity perception before and after mist exposure and (b) transition matrix showing changes in humidity perception before and after misting.
Buildings 15 01410 g012
Figure 13. Participant preferences for MFS setups based on thermal comfort.
Buildings 15 01410 g013
Table 1. Technical specifications of the SensorPush devices used for monitoring Ta and RH.
BrandSensorPush
Power SourceBattery-Powered
Are Batteries IncludedYes
Upper Temperature Rating140 °F (60 °C)
Temperature Range−40–60 °C/(−40–140 °F)
Temperature Accuracy(0–60 °C/32–140 °F): ±0.2 °C/±0.36 °F
(Full Range): ±0.6 °C/±1.08 °F typical, 1 °C/±1.8 °F max
Humidity Range0–100%
Humidity Accuracy(@25 °C/77 °F, from 10–90% RH): ±2%
typical, ±4.5% maximum
Table 2. The four coordinates of the targeted comfort zone.
ParametersMinimum Temperature RangeMaximum Temperature Range
Ta24.622.430.427.5
RH30803080
Table 3. Water temperature settings for each MFS during the user survey.
ZoneMistWater Temperature (°C)
MFS-AON19.3
MFS-BON12.3
MFS-CON13.1
MFS-DON7.7
Table 4. Time Schedule of survey participants’ experiment.
Group no10 min at Zone (1) Neutral5 min MFS-A10 min at Zone (1) Neutral5 min MFS-B10 min at Zone (1) Neutral5 min MFS-C10 min at Zone (1) Neutral5 min MFS-D
G13:00–3:103:10–3:153:15–3:253:25–3:303:30–3:403:40–3:453:45–3:553:55–4:00
G23:10–3:203:20–3:253:25–3:35 3:35–3:403:40–3:503:50–3:553:55–4:054:05–4:10
G33:20–3:303:30–3:353:35–3:453:45–3:503:50–4:004:00–4:054:05–4:154:15–4:20
G43:30–3:403:40–3:453:45–3:553:55–4:004:00–4:104:10–4:154:15–4:254:25–4:30
G53:40–3:403:40–3:453:45–3:553:55–4:004:00–4:104:10–4:154:15–4:254:25–4:30
Table 5. Compilation of Ta and RH readings obtained within each comfort range in Zone 1 and 2 from 30 October 2023 to 16 July 2024.
RangesZone 1Zone 2
No of Readings Within RangesPercentage (%)No of Readings Within RangesPercentage (%)
Comfort Ranges741125.94720925.23
Non-Comfort Ranges11620.571440.50
22050.72330.12
320.0100.00
4860630.12892831.25
58943.135082.82
627169.5120887.31
7856930.00936132.77
830.0100.00
Table 6. Kendall’s coefficient of concordance (W) and Chi-square test results.
SubjectNo. of SubjectsRatersKendall’s WChi-SquareChi-Square Critical Values with 95% Confidence
Subject 1—feeling of Ta2330.56618.6883.84
Subject 2—feeling of RH2330.62620.6583.84
Subject 3—feeling of Comfort among MFSs 4330.68768.0137.81
Disclaimer/Publisher’s Note: The statements, opinions and data contained in all publications are solely those of the individual author(s) and contributor(s) and not of MDPI and/or the editor(s). MDPI and/or the editor(s) disclaim responsibility for any injury to people or property resulting from any ideas, methods, instructions or products referred to in the content.

