Article

Seismic Vulnerability Assessment of Residential RC Buildings in Yemen Using Incremental Dynamic Analysis (IDA)

School of Civil Engineering, Chang’an University, 75 Chang’an Middle Rd, Xi’an 710064, China
*
Author to whom correspondence should be addressed.
Buildings 2025, 15(8), 1336; https://doi.org/10.3390/buildings15081336
Submission received: 17 March 2025 / Revised: 10 April 2025 / Accepted: 15 April 2025 / Published: 17 April 2025
(This article belongs to the Special Issue Study on Concrete Structures—2nd Edition)

Abstract

Traditional buildings constructed in Yemen during the 20th century often lacked adequate seismic protection. Today, most reinforced concrete (RC) residential buildings in the country are designed with beam–column systems that primarily carry gravity loads without considering lateral seismic forces. As a result, these structures are potentially vulnerable to earthquakes and require further investigation. This study aims to develop analytical seismic fragility curves for residential RC buildings in Yemen with varied heights. Three building heights were considered, namely three, five, and seven stories. While in most studies, the infill walls are regarded as non-structural elements, and their contributions to resisting earthquake actions are ignored, in this study, the contribution of the infill wall was taken into account by utilizing a compression strut modeling of the infill wall. In addition, an investigation was conducted to study the effect of soft stories on the seismic vulnerability of residential RC buildings. Finite element models were developed, and 900 Incremental Dynamic Analyses (IDAs) were conducted. Three damage limit states were defined: Immediate Occupancy (IO), Life Safety (LS), and Collapse Prevention (CP). Based on these results, cumulative distribution functions (CDFs) were calculated to derive the seismic fragility curves. The findings indicate that taller buildings are more likely to reach or exceed the defined damage states, making them more vulnerable to earthquakes. Infilled frame structures demonstrate better seismic performance due to the contribution of infill walls to lateral resistance. In contrast, buildings with soft stories are more vulnerable due to abrupt changes in stiffness, resulting in greater deformation concentration in the soft story. The developed fragility curves provide a quantitative basis for assessing seismic damage in Yemeni RC residential buildings and offer a foundation for future seismic risk evaluations.

1. Introduction

Yemen is located in a seismically active zone between the Arabian and African tectonic plates, which are diverging. The western and southern regions of the country, particularly near the Red Sea rift and the Gulf of Aden, are characterized by volcanic mountains formed above tectonic ruptures [1]. These areas represent the most seismically active zones, experiencing moderate to strong earthquakes and posing significant seismic risks [2,3]. The vulnerability assessment of RC types was developed worldwide using different analysis methods, including IDAs. Among others, Florin Pavel [4] introduced a seismic fragility assessment of high-rise RC. This research deals with buildings designed in Romania after the mid-depth earthquake in the Greater Valensa (Vrancea) on 4 March 1977. IDA have been employed for both high-rise RC shear wall structures and high-rise RC frame structures due to their wide use for residential purposes. The ground motions were selected to suit the seismic conditions of Romania. In the results, it has been noted that an increase of 30–40% of the median peak ground acceleration (PGA) corresponding to various damage states for post-1977 RC shear walls and RC frames structures, as compared to the pre-1977 ones, De Risi et al. and Di Domenico in Italy [5,6], Liel et al. and Haselton et al. in the USA [7,8], Noh et al. in Canada [9].
Figure 1 illustrates both historical and recent seismic activities in Yemen. One of the most notable events occurred on 13 December 1982, when a devastating earthquake struck Dhamar Province. The earthquake caused widespread destruction and considerable loss of life. As shown in Figure 1b, the seismic intensity map of the Dhamar earthquake [10] highlights the affected areas. This relatively shallow earthquake occurred approximately 70 km south of Sana’a in a densely populated region. It resulted in over 2500 deaths, 1500 injuries, and the destruction or damage of more than 70,000 homes. Most recorded magnitudes in the region range between 4.2 and 6.2 [11,12], although the population reportedly felt earthquakes with magnitudes lower than 4.2 [13].
Figure 1. Historical earthquakes map [5]. (a) 742–1900, (b) 1900–2007.
Buildings 15 01336 g001
In light of the region’s seismic vulnerability and historical earthquake events, assessing existing buildings’ structural integrity and compliance with seismic design standards is essential. Many RC buildings in Yemen were constructed without proper seismic considerations and are at significant risk of severe damage under strong ground motion. This concern is not unique to Yemen, as numerous studies worldwide have been conducted to evaluate and mitigate potential earthquake damage using different methodologies.
For instance, Hueste and Bai [14] evaluated the seismic fragility of RC frame buildings constructed in the 1980s in the central U.S., developing fragility curves for un-retrofitted and retrofitted structures using three retrofit techniques and multiple performance levels. Their study relied on FEMA 356 global performance criteria [15]. Similarly, Kappos and Panagopoulos [16] proposed a methodology to estimate direct earthquake losses for RC buildings in Greece, utilizing hybrid approaches to derive capacity and fragility curves based on peak ground acceleration (PGA) and spectral displacements. Su and Lee [17] adopted a coefficient-based method for seismic fragility assessment of regular low-rise RC buildings with masonry infill, offering a simplified approach that does not require complex finite element models. To achieve moderate ductility and increased design acceleration, Ulrich et al. [18] developed fragility curves for conventional three-story RC buildings designed according to Eurocode 2 [19] and Eurocode 8 [20].
Despite the growing body of research, a gap remains in systematically evaluating the structural response of RC buildings under increasing seismic intensity and generating corresponding fragility curves to predict failure probabilities across various performance levels. To address this issue, Vamvatsikos and Cornell [21] introduced Incremental Dynamic Analysis (IDA), a methodology that comprehensively evaluates a structure’s seismic performance, particularly for RC buildings.
IDA provides a more detailed and accurate understanding of structural behavior under earthquake loading by subjecting the building model to ground motion records scaled to different intensity levels [22,23]. This approach captures complex nonlinear responses such as higher mode effects, cyclic degradation, and collapse mechanisms, often oversimplified in traditional static analysis methods. Furthermore, IDA facilitates probabilistic evaluation [24] by producing multiple response scenarios [25], making it a powerful tool in performance-based seismic design.
A key strength of IDA lies in its ability to evaluate structural collapse capacity and generate fragility curves over various seismic intensities. Systematically scaling multiple ground motions helps quantify the probability of exceeding defined damage states [26,27]. This makes IDA particularly useful for seismic risk assessment, retrofit decision-making, and refining building codes to enhance resilience. The resulting IDA curves provide insight into the likelihood of different damage levels, offering valuable information to engineers, policymakers, and emergency planners for developing disaster response strategies, insurance models, and safety regulations [25,28]. Seismic vulnerability assessments of RC buildings originally designed without seismic provisions are essential for ensuring structural safety and reducing earthquake risks. In areas with low to moderate seismic activity or where seismic codes were not historically enforced, these structures are often at risk of damage or collapse due to inadequate detailing, weak load paths, and poor ductility. A thorough assessment identifies critical deficiencies, evaluates potential failure mechanisms, and quantifies expected performance under seismic loads [29,30].
This study aims to (1) develop seismic fragility curves for low- and mid-rise reinforced concrete residential buildings in Yemen, including Bare Frames (BF), Infilled Frames (IF), and Soft-Story Frames (SSF), and (2) evaluate the influence of building height, infill walls, and soft-story configurations on their seismic performance.

2. Building Types and Methodology

This study utilized multiple software tools to ensure accurate modeling and analysis. ETABS was used to design all representative RC buildings according to the ACI 318 code [31], which is widely adopted in Yemen due to the absence of a national design code. SeismoStruct [32] was employed for detailed modeling and nonlinear dynamic analysis, while SeismoSignal [33] and SeismoMatch [34] were used to process and match ground motion records with the target response spectrum. Finally, Microsoft Excel was used for data extraction and graphical representation. From the fragility curves, we can evaluate and compare the performance of the building.

2.1. Representative Buildings

Three types of building models were analyzed and designed, each with three height categories: 3 stories, 5 stories, and 7 stories (Figure 2 with a summary of the building types in Table 1). The first type, the bare frame (BF), is a structural system consisting solely of beams, columns, and slabs without any structural infill walls or partitions. The second type, a frame with an infill wall (IF), includes structural walls constructed between the structural elements (columns and beams) of a bare frame. The third type, a frame with a soft story (SSF), features one story significantly weaker or more flexible than the stories above, often due to the absence of or reduction in infill walls, large openings, or inadequate bracing. This irregularity makes the building vulnerable to disproportionate damage during earthquakes, as it experiences concentrated lateral displacements in the weak story.
Table 1. Classification of the buildings.
Frame TypeLow RiseMedium Rise
3 Stories5 Stories7 Stories
Bare Frame (BF)BF3BF5BF7
Infill Frame (IF)IF3IF5IF7
Frame with Soft-Story (SSF)SSF3SSF5SSF7
These are typical reinforced concrete buildings and represent residential RC buildings in Sana’a and surrounding areas (Figure 2). There are main common geometric characteristics between the frames: the number of bays in X is 5, the number of bays in Y direction is 3, the typical width of the bays is 4 m, and the typical height of each floor is 3 m, 3-storey, 5-storey, and 7-story building are considered. The reinforcement details for the frame structures considered in the analysis are shown in Figure 3. All vertical members have almost the same cross-section dimensions and reinforcement details due to the minimum requirements of the code.
Figure 2. Typical buildings.
Buildings 15 01336 g002
Figure 3. Structural design of the buildings: (a) structural floor plan of residential reinforced concrete buildings; (b) reinforcement detailing for three-story buildings; (c) reinforcement detailing for five-story buildings; (d) reinforcement detailing for the seven-story buildings.
Buildings 15 01336 g003aBuildings 15 01336 g003bBuildings 15 01336 g003c

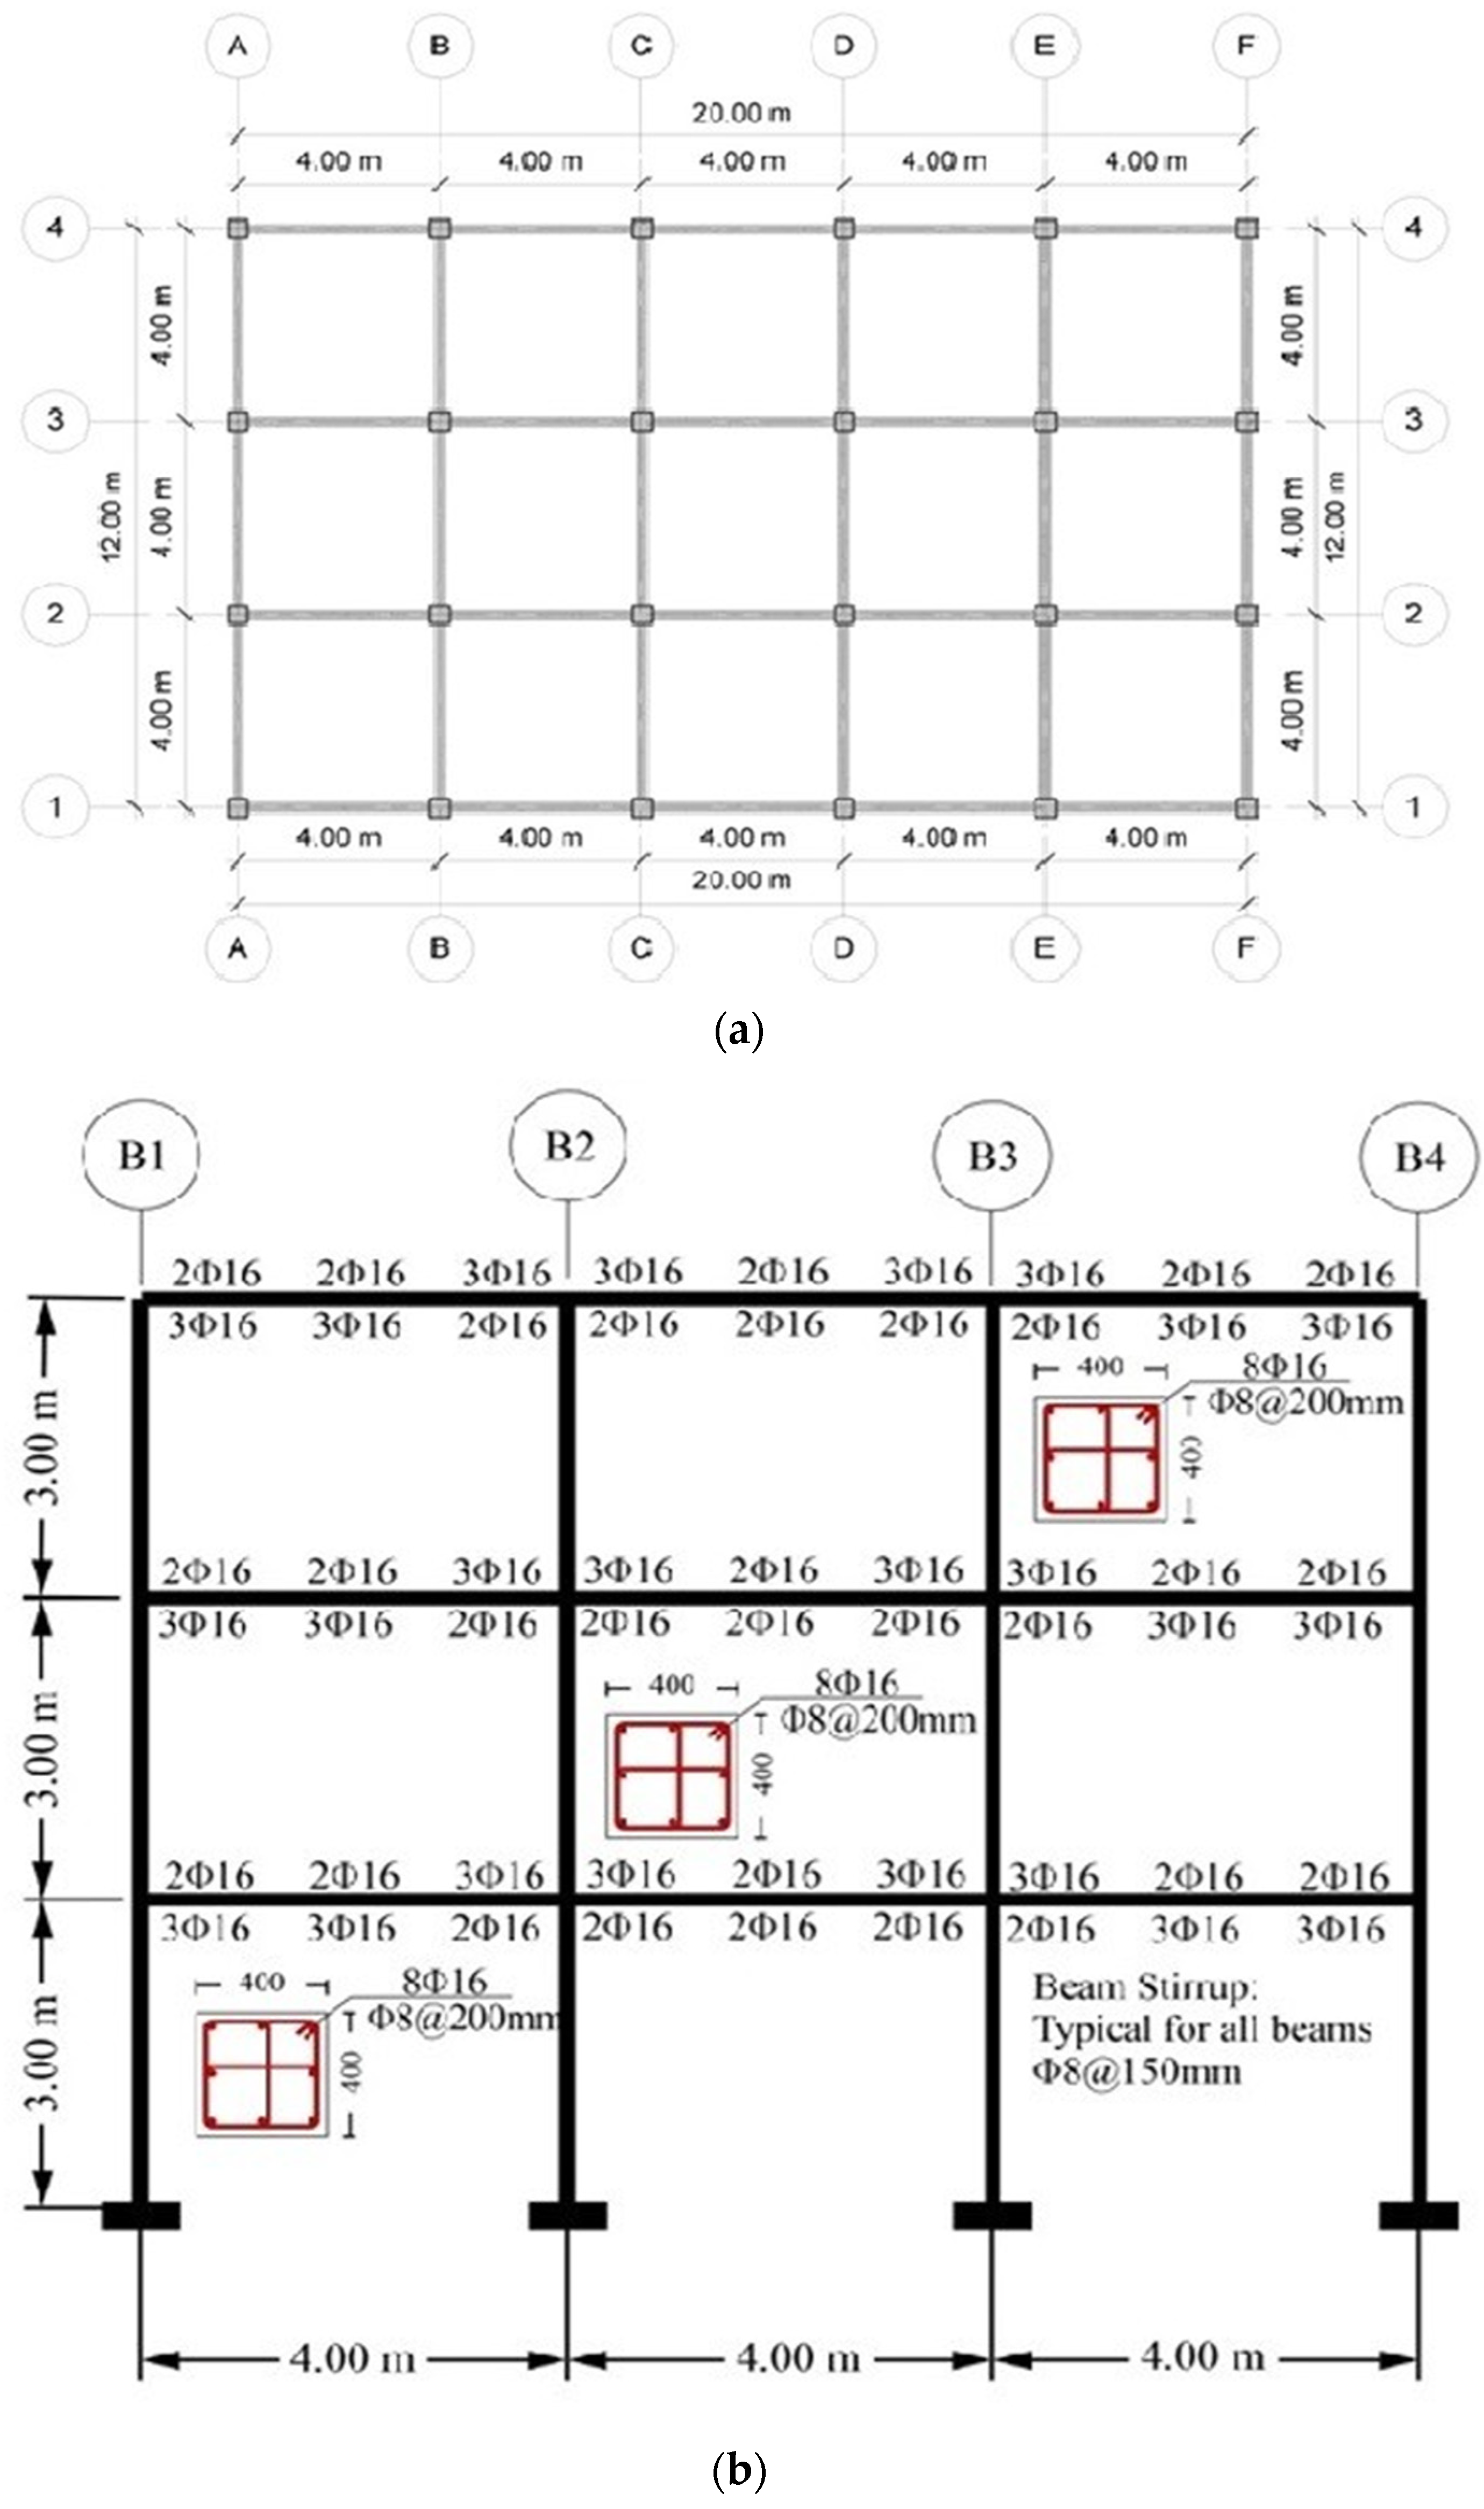
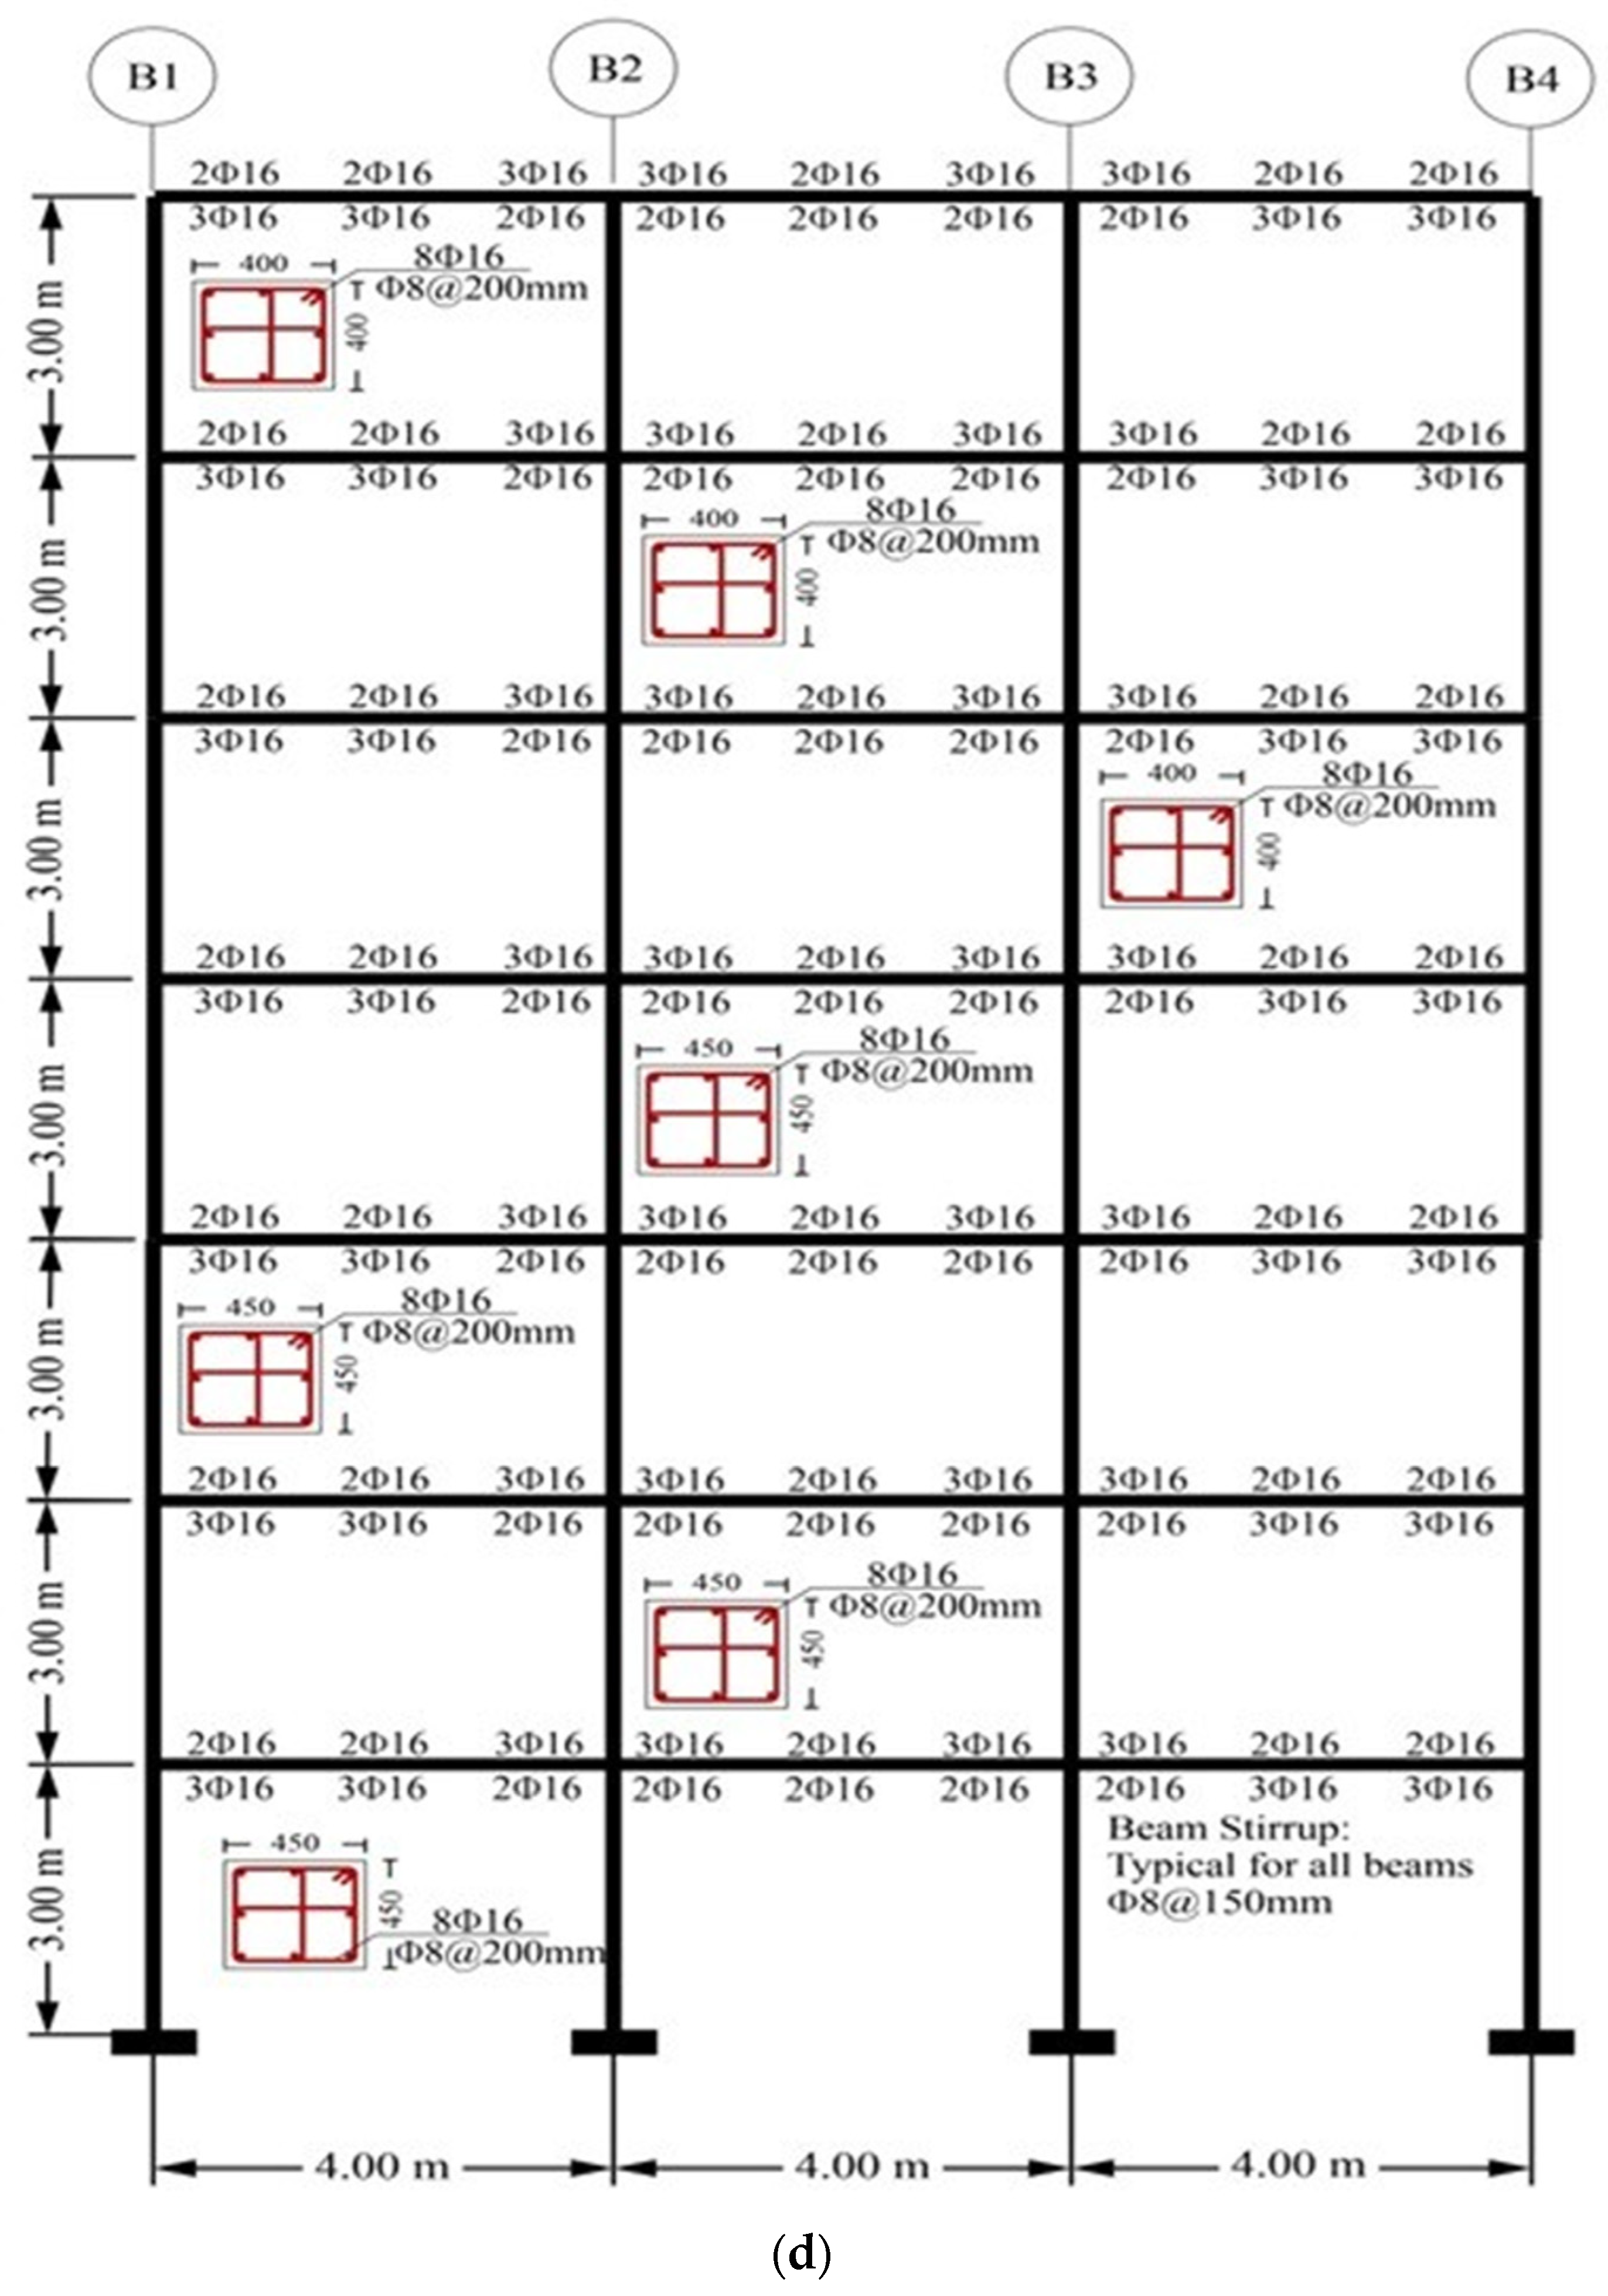
2.2. Structural Design of the Buildings

Before conducting the Incremental Dynamic Analysis (IDA), the following assumptions were made:
  • Torsional effects are neglected,
  • The buildings are modeled as beam–column skeletons (ordinary frames) with 200 mm thick hollow concrete blocks for all infill walls,
  • In the Bare Frame (BF) model, infill walls are not considered structural elements, but their weight is included in the building’s total weight for the IDA. In the Infilled Frame (IF) and Soft-Story Frame (SSF) models, the infill walls are considered structural elements. Infill walls have traditionally been viewed as non-structural elements meant to enclose spaces, provide thermal and acoustic insulation, and enhance architectural aesthetics. However, modern construction practices increasingly recognize infill walls as structural components that contribute to the overall stability and performance of buildings. When properly designed and integrated, infill walls can improve structural stiffness, resist lateral loads, and enhance seismic performance. This shift in perspective underscores the need to consider infill walls integral to the structural system, requiring careful analysis and design to ensure their compatibility with the primary load-bearing framework. This paper examines the structural role of infill walls, their interaction with the main structural system, and their implications for building performance under various loading conditions.
  • The slab is assumed to behave as a rigid diaphragm; consequently, the lateral load in each of the main directions is distributed to the vertical elements (i.e., columns) in accordance with its stiffness ratio.
Due to the absence of a design code in Yemen, engineers typically use the ACI 318 code for designing reinforced concrete (RC) buildings. As a result, this code governs the design process in this study, with all structural elements designed to resist gravity loads in accordance with ACI 318. In Yemen, typical floor slabs consist of solid slabs that are 150 mm thick and supported by reinforced concrete (RC) beams. These beams transfer gravity loads to the RC columns, which then convey the loads to the foundations. The yield strength of steel reinforcement varies according to national standards, material grades, and seismic design requirements. Different codes specify limits on the properties and testing procedures for steel rebar based on each country’s regulations. Globally, the most commonly used grades include ASTM A615, BS4449, ISO 6935-2, and EN 10080 [35]. Many developing countries adopt and adapt one of these standard codes to fit their needs. In Yemen, the standards agency has adopted ISO 6935-2 for reinforcing bars, designating it as Compulsory Grade 60 and Grade 40. Grade 40 steel is frequently used in residential construction, with a yield strength of 280 MPa.
This study considers dead loads, including self-weight and a floor finishing load of 2.5 kN/m2. According to ACI 318, live loads of 2 kN/m2 are assumed for RC residential buildings, and a uniform wall load of 9 kN/m is applied to all beams. The typical structural floor plan of residential RC structures in Yemen, with a common span of 4 m, is adopted for this study. Table 2 presents typical properties used in Yemeni construction practices.
The natural periods of the representative buildings are listed in Table 3.
Table 2. Material properties.
Material PropertiesValues
Typical concrete compressive strength—fc25 MPa
Typical longitudinal reinforcements yield strength—fy280 MPa
Typical transverse reinforcements yield strength—fyv280 MPa
Table 3. Natural period of the representative buildings.
Building NameVibration Period (s)
X-DirectionY-Direction
BF30.4260.433
IF30.1700.178
SSF30.2760.280
BF50.5830.596
IF50.2710.286
SSF50.3890.398
BF70.8100.834
IF70.3740.399
SSF70.4970.514

2.3. Incremental Dynamic Analysis (IDA)

This study used Incremental Dynamic Analysis (IDA) methods to assess the seismic vulnerability of residential reinforced concrete buildings in Yemen that were designed according to the ACI code. A set of scaled ground motions was employed to analyze three building models of varying heights. Ten earthquake ground motion records were selected and applied to the buildings, as shown in Table 4. Nonlinear Dynamic Time History Analysis (NDTHA) was conducted with the ground motions scaled to specific intensity levels [36,37,38], and IDA curves were generated. The maximum inter-story drift ratio served as the damage measure (DM), while the 5% damped first mode spectral acceleration [Sa(T1.5%)] was utilized as the intensity measure (IM). SeismoStruct, a fiber-based finite element program, was used for the IDA, incorporating geometric nonlinearities and material inelasticity [32]. The findings will aid in quantifying collapse risks and contribute to the region’s seismic design recommendations. In addition, a nonlinear dynamic analysis is crucial for accurately evaluating the seismic performance of buildings because it accounts for material yielding, large deformations, and hysteretic energy dissipation. The building being analyzed is modeled to include both material nonlinearities (such as concrete and reinforcement steel) and geometric nonlinearities (including P-delta effects, buckling of reinforcement bars, beams, columns, shear walls, slabs, and diaphragms) to simulate realistic behavior under seismic loads. Additionally, the nonlinear model incorporates distributed plasticity, cyclic degradation, and significant deformation effects to assess seismic performance comprehensively. The inter-story drift ratio (IDR) is the ratio between the relative translational displacement between two consecutive floors and the story height [39] and is an important parameter for the structural health of buildings under earthquake or wind loads [40].
Table 4. Characteristics of earthquake records used for IDA.
Earthquake NameYearStation NameMagnitudePGA
(%g)
MechanismRjb (km)Vs30 (m/s)
Northwest Calif1938Ferndale City Hall5.50.42strike-slip52.73219.31
Imperial Valley1940El Centro Array #96.950.34strike-slip6.09213.44
Central Calif1960Hollister City Hall50.25strike-slip7.28198.77
Parkfield1966Cholame—Shandon Array #56.190.32strike-slip9.58289.56
Hollister1974Hollister City Hall5.140.34strike-slip8.85198.77
Oroville1975Pacific Heights Rd (OR4)4.70.32Normal8.7352.22
Coyote Lake1979Gilroy Array #25.740.34strike-slip8.47270.84
Westmorland1981Niland Fire Station5.90.29strike-slip15.16212
Borrego1942El Centro Array #96.50.32strike-slip56.88213.44
Nicaragua1972Managua-ESSO6.240.30strike-slip3.51288.77
In the SeismoStruct modeling of beams and columns, the structural elements were divided into three types of fibers [41]: (1) fibers used to model the longitudinal steel reinforcing bars, (2) fibers defining the nonlinear behavior of confined concrete, including core concrete, and (3) fibers representing unconfined concrete, which consists of the cover concrete. This study uses core concrete, cover concrete, and steel materials for the fiber model of the reinforcement concrete elements. The nonlinear model for the material typical fiber model of the reinforced concrete element is presented in Figure 4.
Figure 4. Nonlinear models for materials are typical fiber models of the reinforced concrete element.
Buildings 15 01336 g004

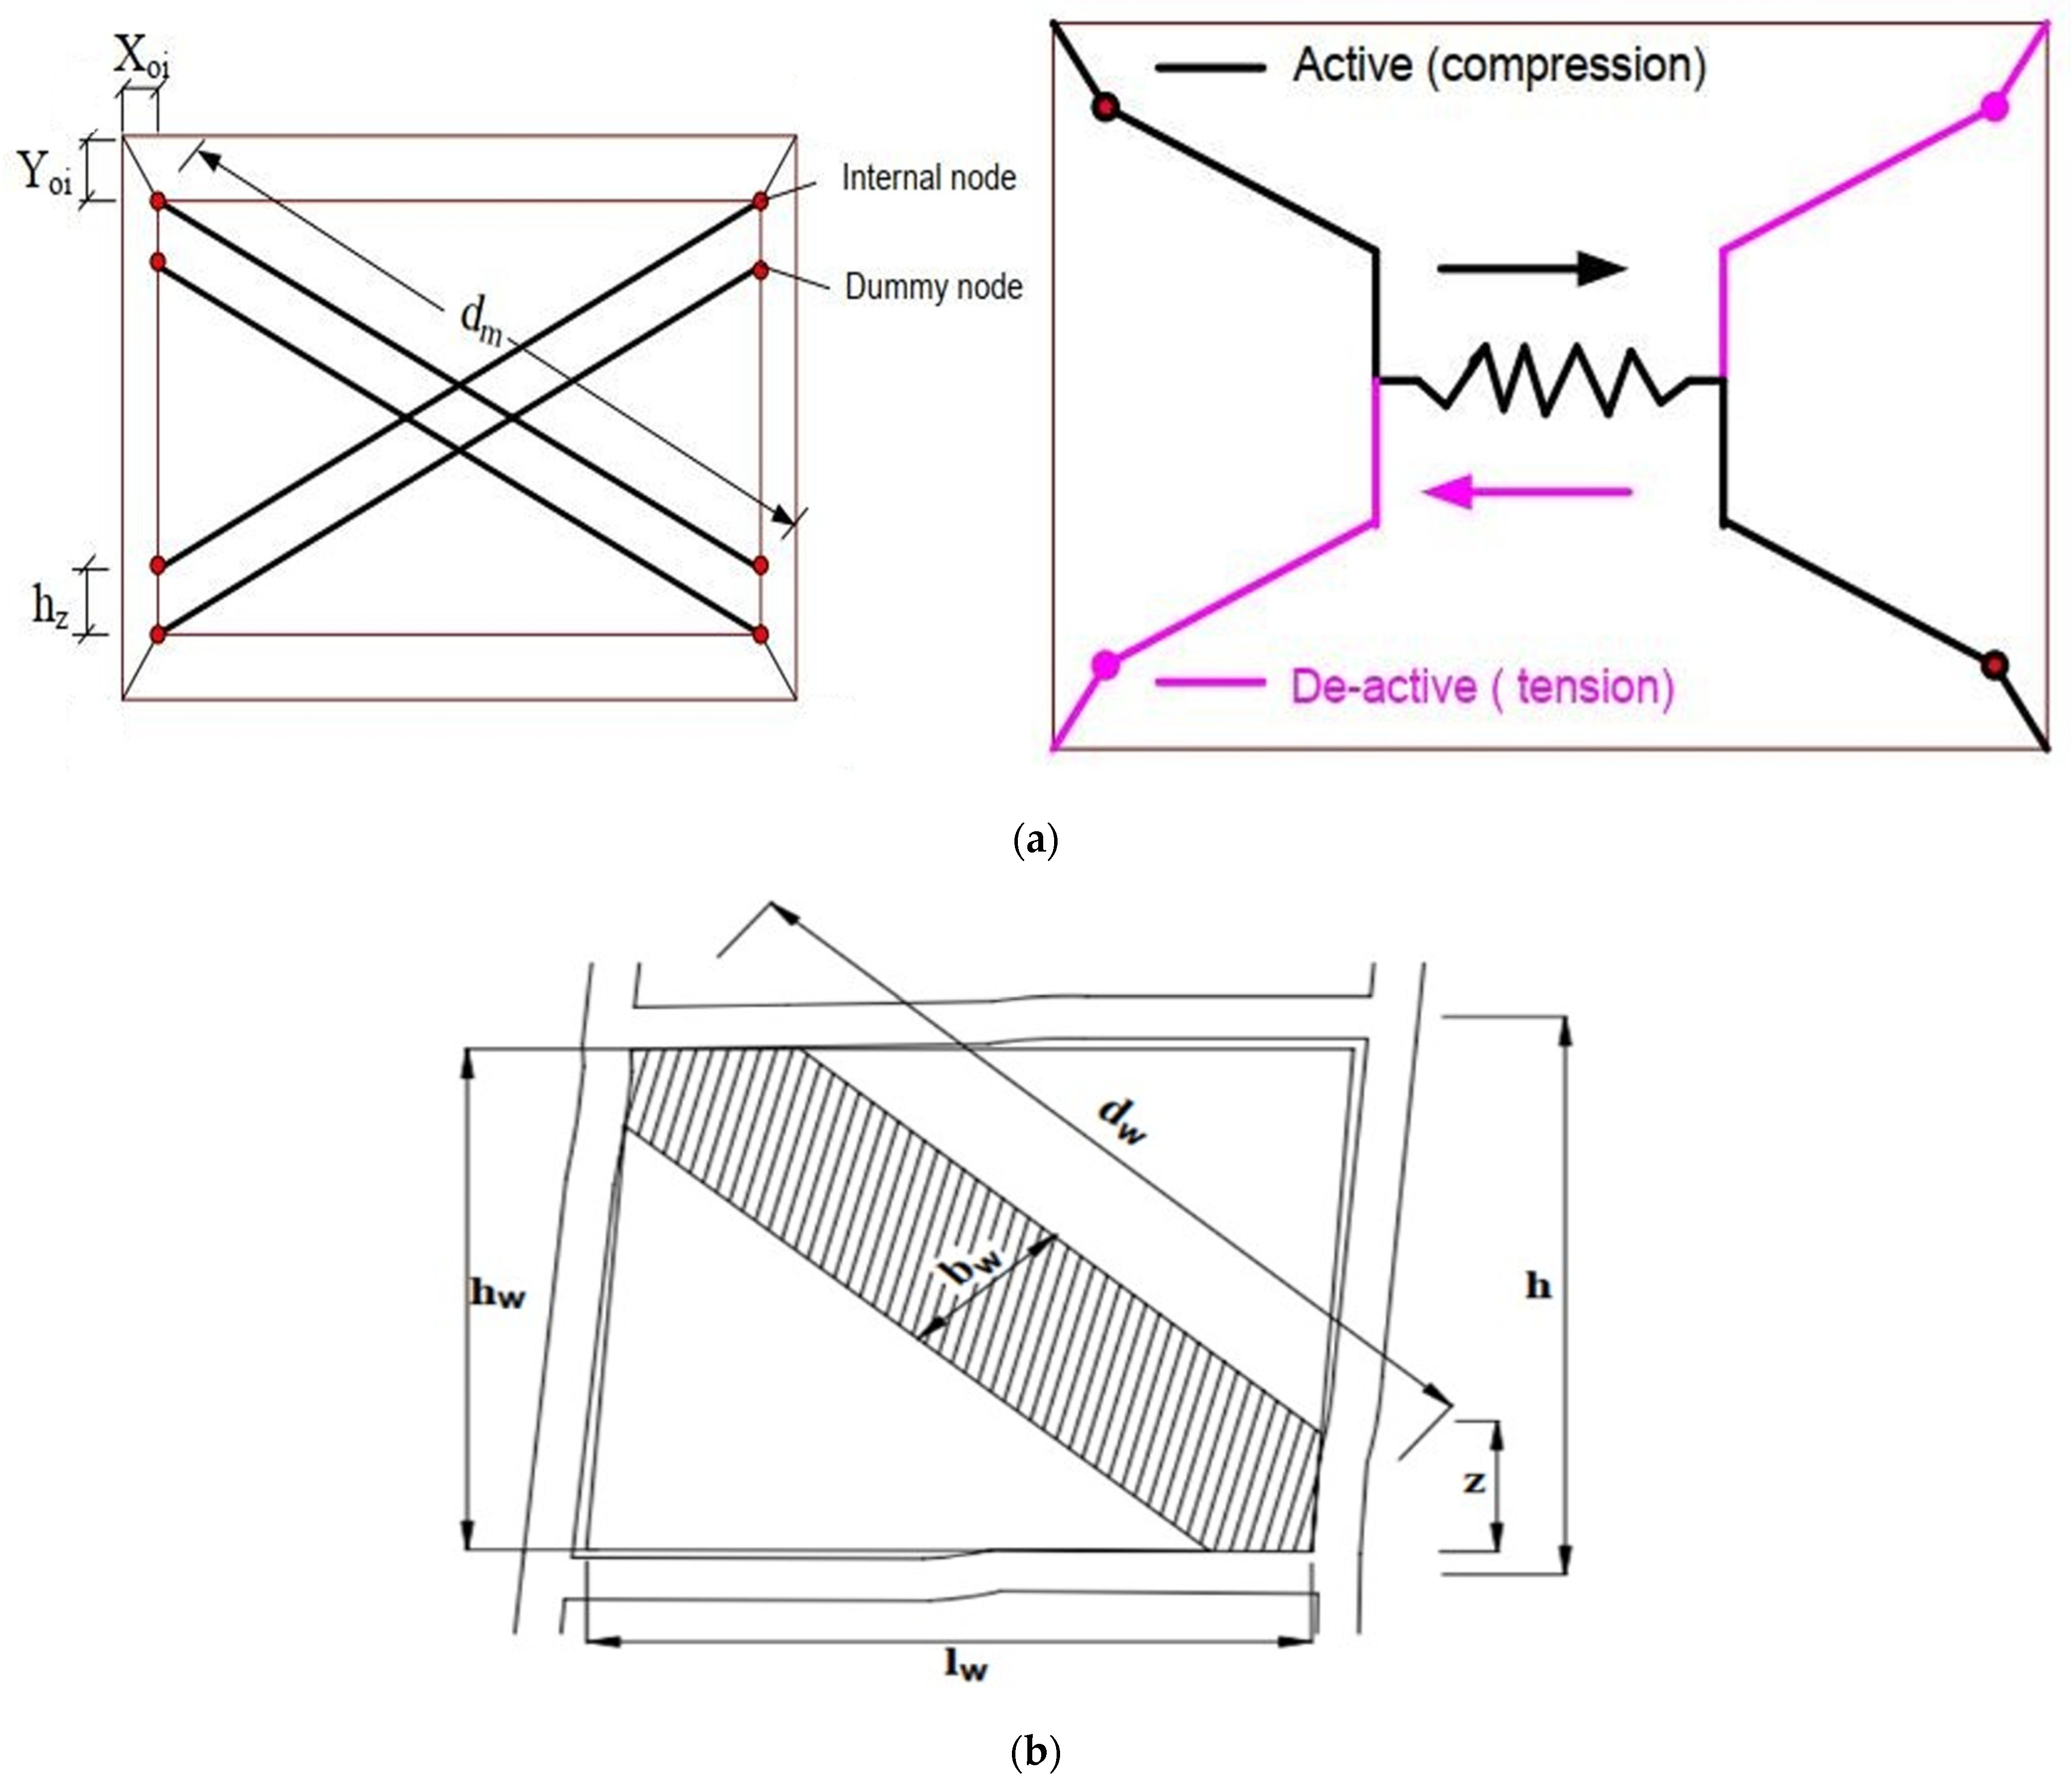
2.3.1. Modeling of Infill Wall

In SeismoStruct, infill walls are modeled using an equivalent compression strut approach [42], assuming diagonal compression failure. The infill panel is represented by six strut members, two parallel struts bearing axial load on opposite diagonals, and a third parallel strut transferring shear force from top to bottom [42]. Infill walls, usually constructed from masonry (such as brick or concrete blocks) or lightweight panels, serve as non-structural elements occupying RC or steel building frames. While they are not integral to the primary load-bearing system, infill walls are crucial in influencing the structural behavior under seismic and wind loads, thanks to their contributions to stiffness and strength. Accurate modeling of these walls is vital for reliable nonlinear dynamic analyses, particularly during seismic assessments. This modeling helps enhance the lateral stiffness of frames, modifies natural periods and seismic responses, and enables resistance to lateral loads, resulting in diagonal compression forces. Figure 5 displays the modeling of the infill walls.
Figure 5. The modeling of infill walls of the study: (a) equivalent strut model for infill panel, and (b) configuration with the geometrical properties of infill wall.
Buildings 15 01336 g005

2.3.2. Gravity Loads

The wall loads were calculated and distributed as a uniformly distributed load on the beam. The dead loads considered in this study are self-weight, which is automatically calculated by the software in addition to a floor finishing load of 2.00 kN/m2. Wall load as a uniform distributed load of 9 kN/m is applied to all beams. 1.2 (D.L. + F + Te) +1.6 (L.L. + H) + 0.5 (Lr or S or R) is a load combination according to ACI 318-02. This study focuses solely on dead loads (D.L.) and live loads (L.L.). Other loads are often overlooked when designing residential concrete buildings in Yemen, with only dead and live loads considered. This is primarily due to the prevalence of a specific type of load in the region. In this context, S represents snow loads, H denotes horizontal earth pressure, Lr indicates roof live load, R signifies rain load, F denotes load due to fluids with well-defined pressures and maximum heights, and Te signifies the thermal effects (including expansion or contraction due to temperature changes).

2.3.3. Seismic Loads

Since Yemen lacks ground motion records, data were obtained from the PEER database of the Pacific Earthquake Engineering Research Center [43]. Ten ground motion records, with magnitudes ranging from 4.5 to 7, were selected for the nonlinear time history analysis (as shown in Table 4). The fault types were chosen as Strike-slip and Normal strike, with a soil shear wave velocity (VS30) between 180 and 360 m/s and soil type SD. These ground motions were matched with the response spectrum for the area in which the buildings are located. Yemen has not yet developed a design response spectrum for seismic analysis and structural design. Therefore, the available seismic information in the studied area is used to design the response spectrum of the area where the buildings are located. Based on the seismic hazard study [44] and UBC [45] provisions, the studied area is located in a moderate seismic region (2B), and the seismic zone factor (Z) is 0.2 since it is not yet possible to fully understand the soil characteristics to determine the soil profile type, according to UBC 97, the soil profile type (SD) should be used; accordingly, shear wave velocity VS30 is 180–360 m/s, important seismic factor (I) is 1, a damping ratio of 5% is assumed, and for an ordinary moment-resisting concrete frame system, the over-strength and global ductility capacity (R) is taken as 3.5, while seismic coefficients (Ca, Cv) are taken as 0.28 and 0.4, respectively. Figure 6a shows the design response spectrum for the specified zone and soil type, and Figure 6b illustrates the matching of the selected ground motions with the response spectrum. After matching, different scale factors were applied to adjust the PGA of each record.
Figure 6. (a) Design response spectrum, (b) the matched response spectrum.
Buildings 15 01336 g006

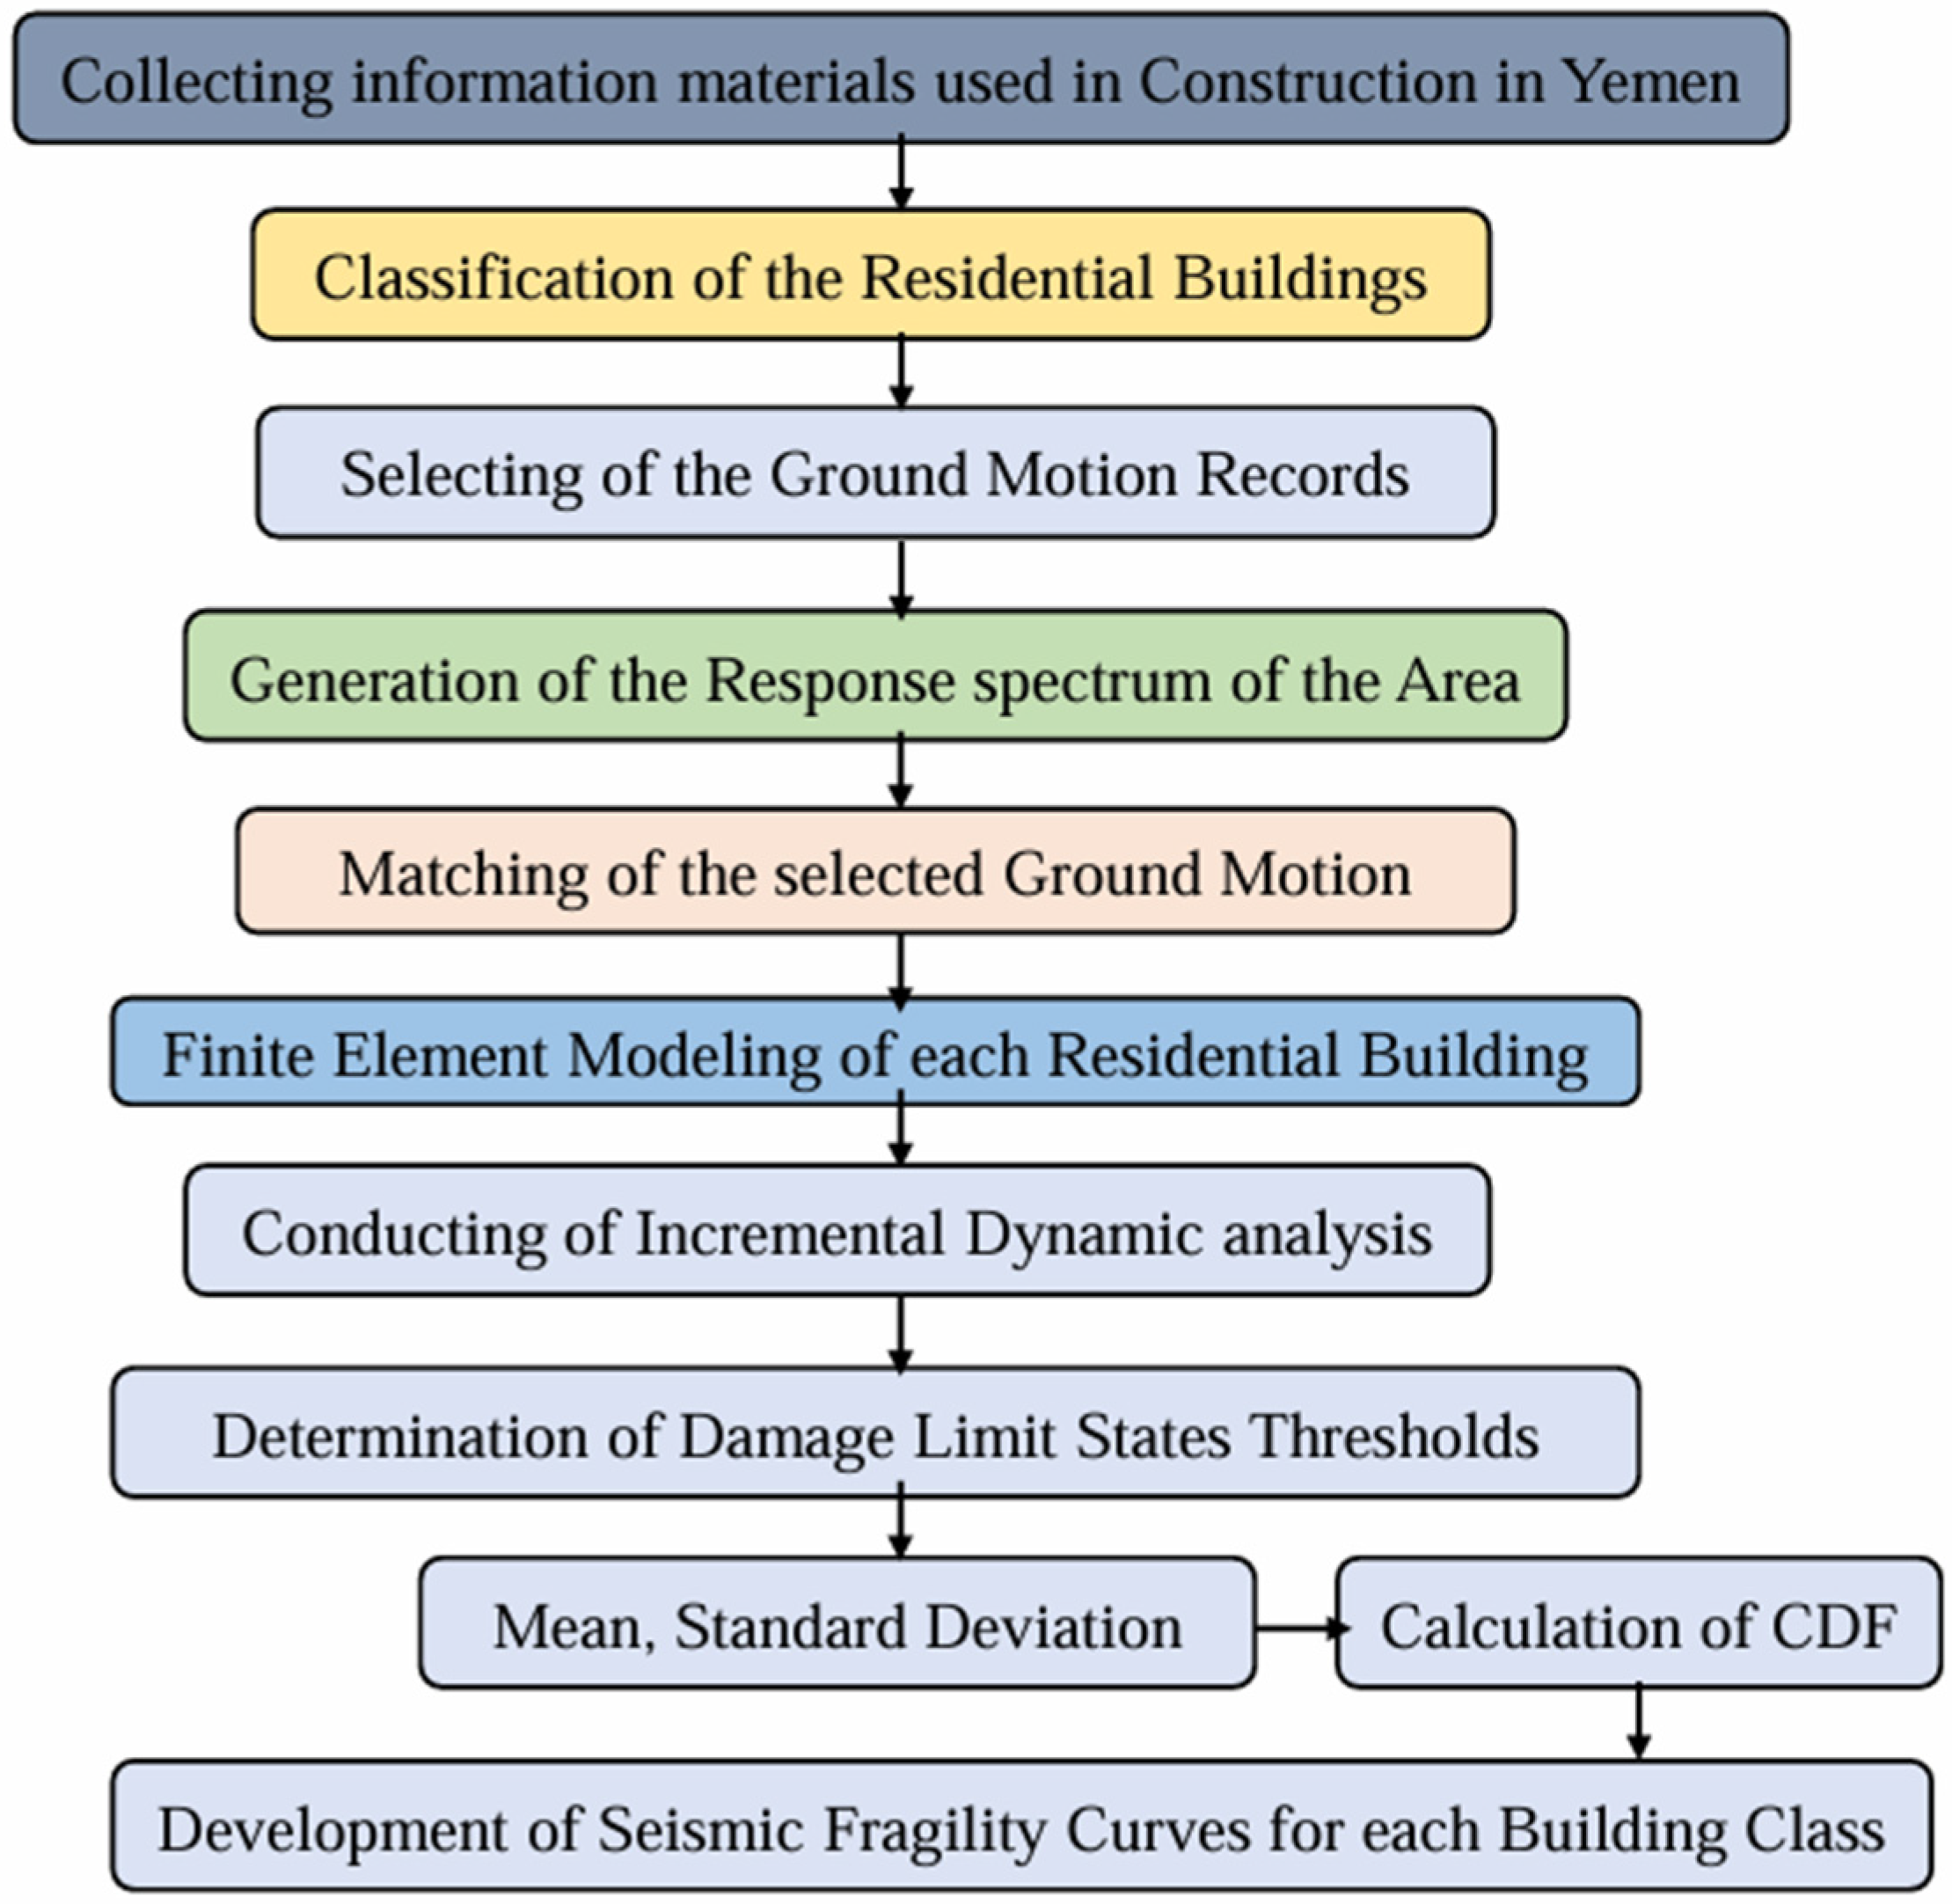
2.4. Development of Seismic Fragility Curves

The buildings were modeled using Seismobuild-2018 Software and then sent to Seismostruct-2020 for analysis. In Seismostruct-2020, one type of analysis can be run directly to perform the Incremental Dynamic Analysis, and the following steps are performed to run the analysis: the first step is to load the time history files of the matched records and apply these loads in the base of the building in the Y direction because this direction has the longer fundamental time period and it means that the building is more vulnerable in this direction; after that, the user is asked to enter incremental scaling factors, and then the analysis can be run. The fundamental time period of a structure is a crucial dynamic property that indicates how the building reacts to lateral loads, such as those from earthquakes. A longer time period in the Y direction signifies that the building is more flexible and has lower lateral stiffness in that direction. This reduced stiffness results in larger displacements under dynamic loading, making the structure more prone to damage. In seismic analysis, the direction with the longer time period is often deemed more vulnerable, as it is likely to experience amplified responses when ground motion contains energy at similar frequencies. Consequently, applying lateral loads at the base of the building in the Y direction enables engineers to evaluate the structural response under the most critical conditions, ensuring that the building’s design effectively addresses potential weaknesses in its most flexible and vulnerable direction.
After finishing the Incremental Dynamic Analysis, the result was taken from the Seismostruct, and using Excel, the maximum inter-story drift was calculated, and the spectra acceleration was calculated for every record; these values were used to generate IDA curves for the nine types of building for the ten-time histories.
The threshold values for the various damage states will be calculated using the damage states, and three damage states were regarded as Immediate Occupancy (IO), Life Safety (LS), and Collapse Prevention (CP).
The seismic fragility curve is described as a log-normal cumulative distribution function, which represents the probability of reaching or exceeding the structural and non-structural damage limit state and gives the certainty of the spectral response (Median) estimated value.
Take the natural logarithm Ln (IM) as the ground motion parameter, and then calculate the average value and standard deviation of Ln (IM) according to Formulas (1) and (2) to obtain the fragility curve. Finally, by using Equation (3), the probability P [ D I M ] can be calculated.
μ = i 1 n L n I M i n
σ = i 1 n L n I M i μ 2 n 1
P D I M = L n I M μ σ
where Φ is the standard normal distribution function, D is the damage state (performance level), IM is the corresponding ground motion Intensity Measure Sa(T1.5% ), μ is the mean, and σ is the standard deviation of the natural logarithm of Sa(T1.5% ) at which the building reaches the specific damage state (performance level), D.
The Intensity Measure (IM) values derived from the analysis are used to develop the seismic fragility curve [46]. By taking the natural logarithm Ln (IM) as the ground motion parameter, the average and standard deviation of Ln (IM) are calculated using Formulas (2) and (3) to generate the fragility curve.
Figure 7 demonstrates the flowchart of the proposed methodology.
Figure 7. Flowchart of the proposed methodology.
Buildings 15 01336 g007

2.5. Definition of Damage Limit States

2.5.1. Immediate Occupancy (IO)

This level means that the damaged states are still retained. It can still be safely occupied after the earthquake, retaining the design strength and stiffness of the structure before the earthquake, and complies with the acceptance criteria specified in this standard for this Structural Performance Level. It means the state of damage after the earthquake in which only very limited structural damage occurred. The building’s basic anti-vertical and lateral force system retains almost all the strength and stiffness before the earthquake. The risk of life-threatening injuries due to structural damage is very low. Although some minor structural repairs may have been carried out, these repairs are usually not required before re-occupancy.

2.5.2. Life Safety (LS)

This level represents the state of damage after the earthquake, including damage to structural components, but reserves the margin to resist local damage or total collapse in compliance with the acceptance criteria specified in this standard for this Structural Performance Level. Significant damage to the structure has occurred, but there is still a margin against partial or total structural collapse. Certain structural elements and components were severely damaged, but this did not cause the hazards of large amounts of debris falling inside or outside the building. Personal injury may be caused during an earthquake; however, the overall risk of life-threatening due to structural damage is expected to be reduced. It should be possible to repair the structure; however, for economic reasons, this may not be practical.

2.5.3. Collapse Prevention (CP)

In this level, the post-earthquake damage state includes damage to structural components such that the structure continues to support gravity loads but retains no margin against a collapse in compliance with the acceptance criteria specified in this standard for this Structural Performance Level. The building is on the verge of partial or total collapse. Substantial damage to the structure has occurred, potentially including significant degradation in the stiffness and strength of the lateral-force resisting system, large permanent lateral deformation of the structure, and to a more limited extent-degradation in vertical-load-carrying capacity. However, all significant components of the gravity load-resisting system must continue to carry their gravity load demands. A significant risk of injury due to falling hazards from structural debris may exist. The structure may not be technically practical to repair and is unsafe for re-occupancy, as aftershock activity could induce collapse.

3. Results and Discussion

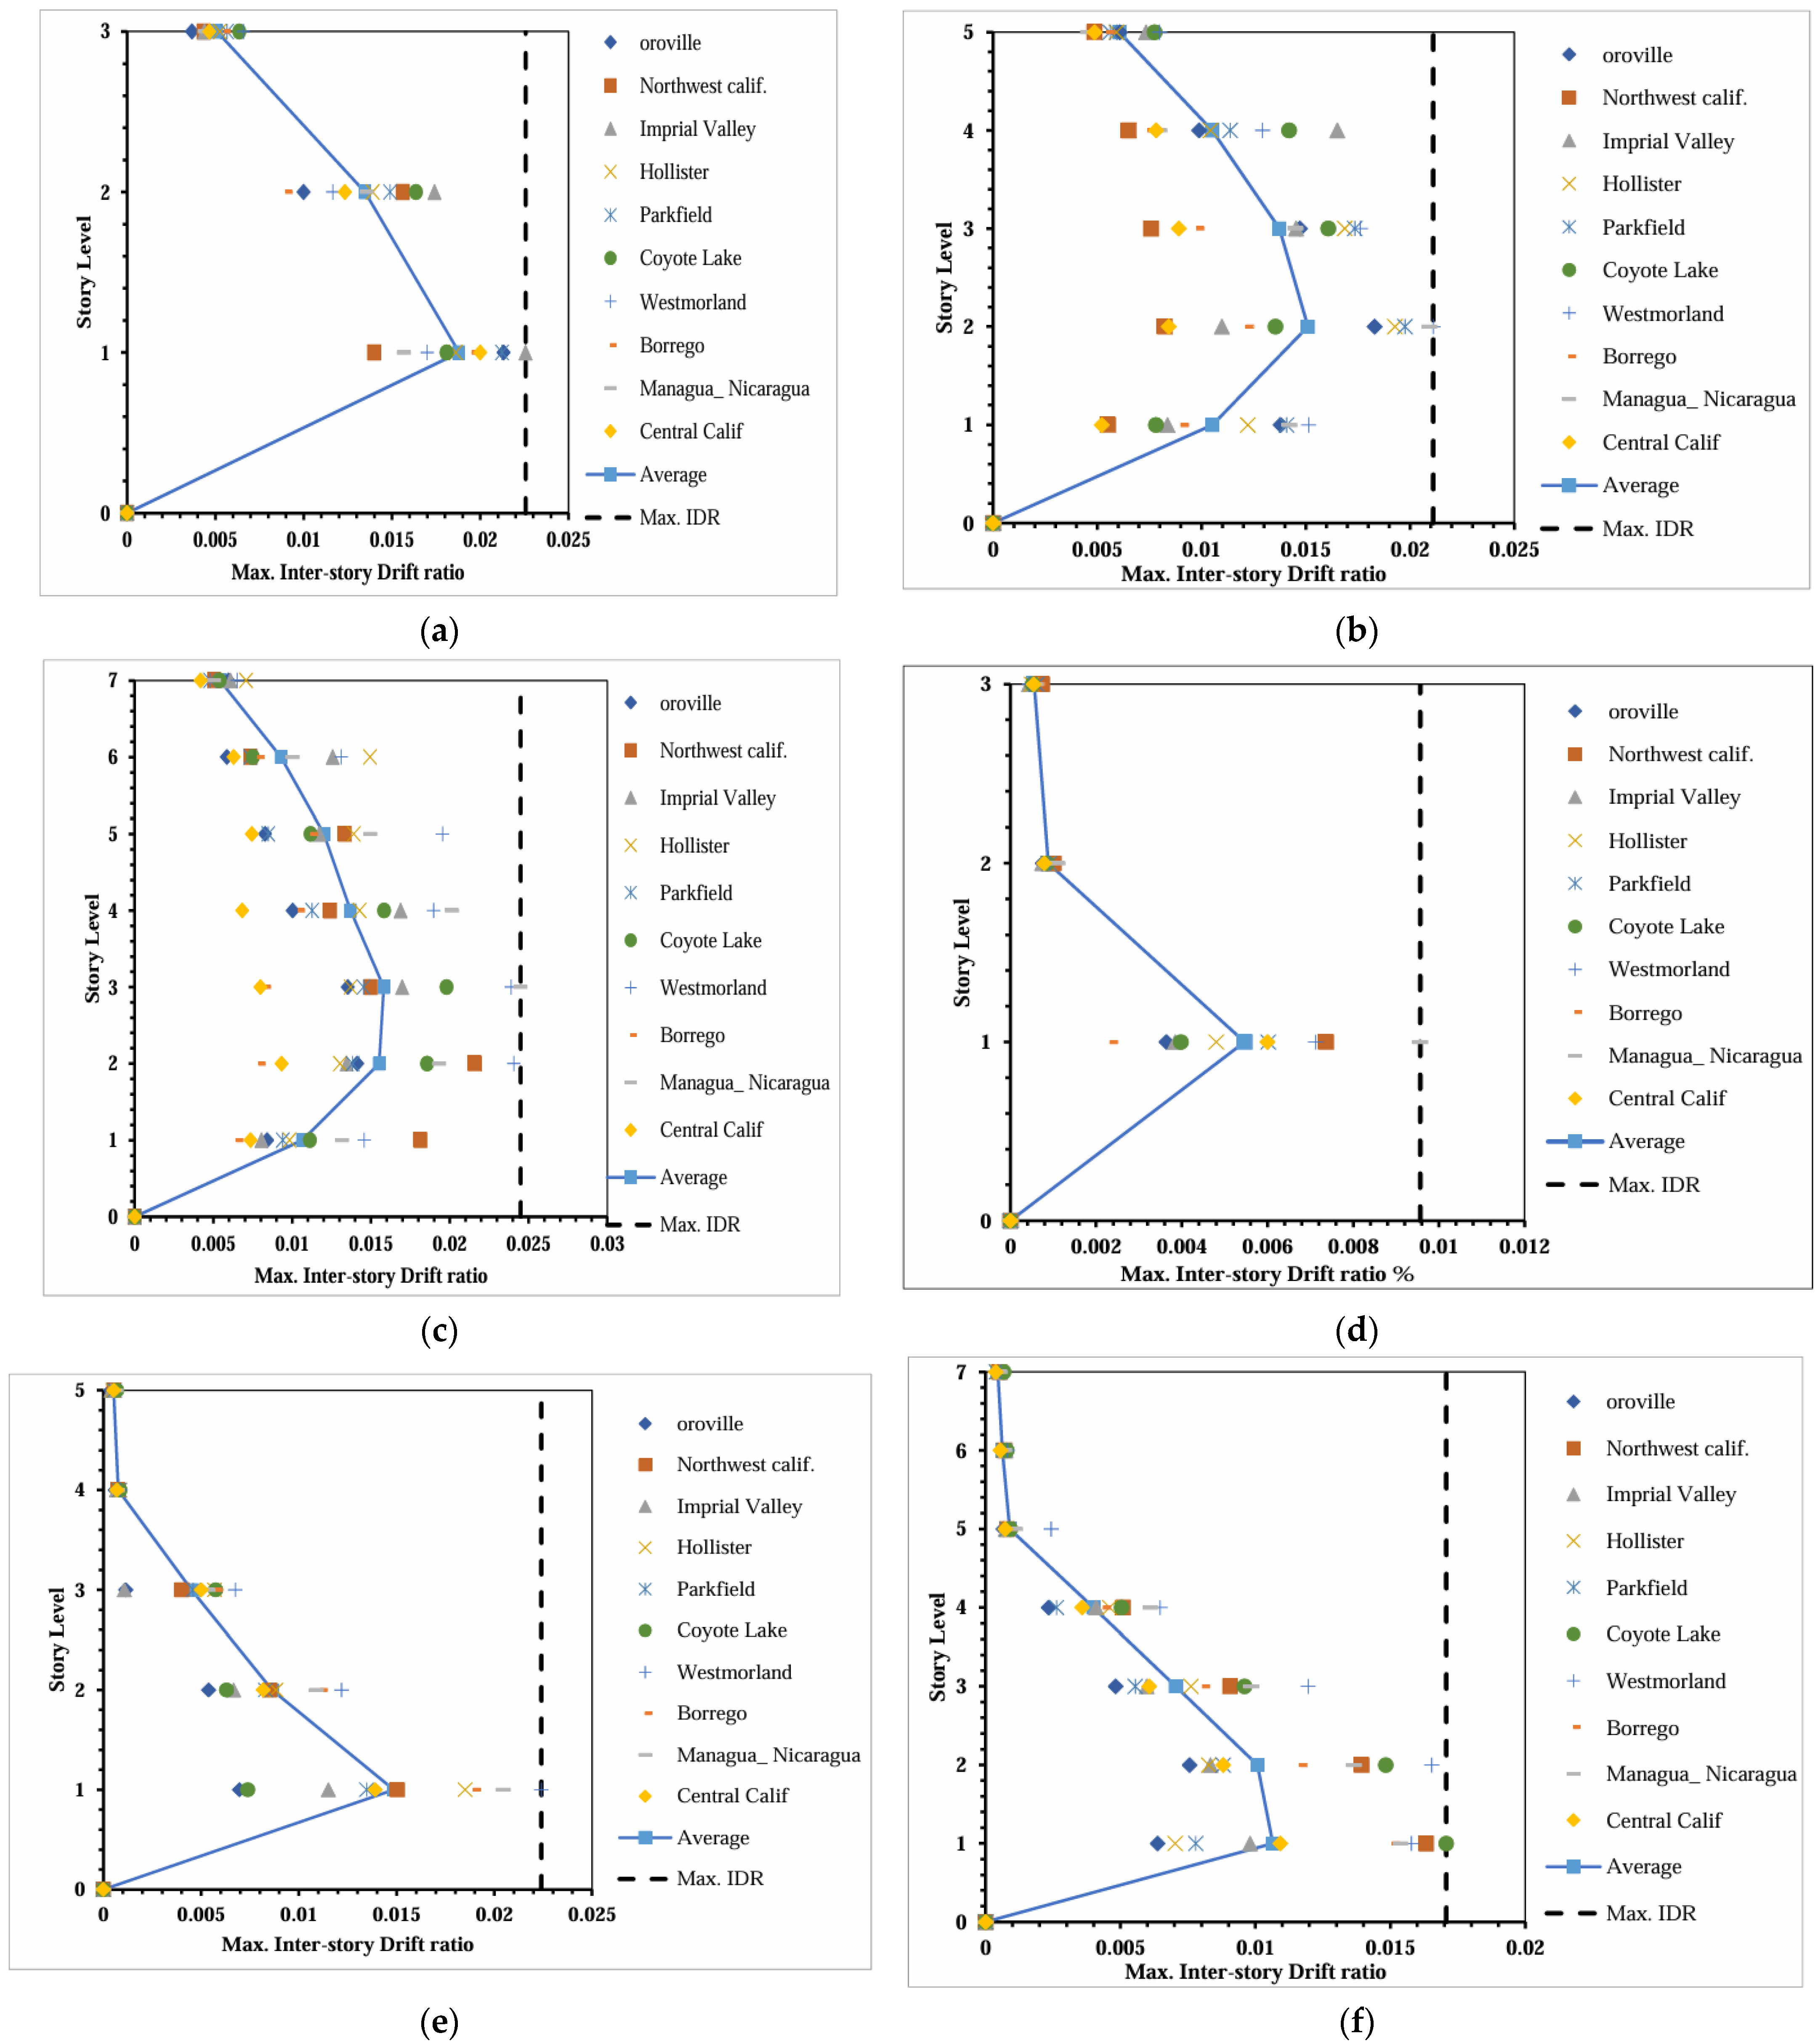
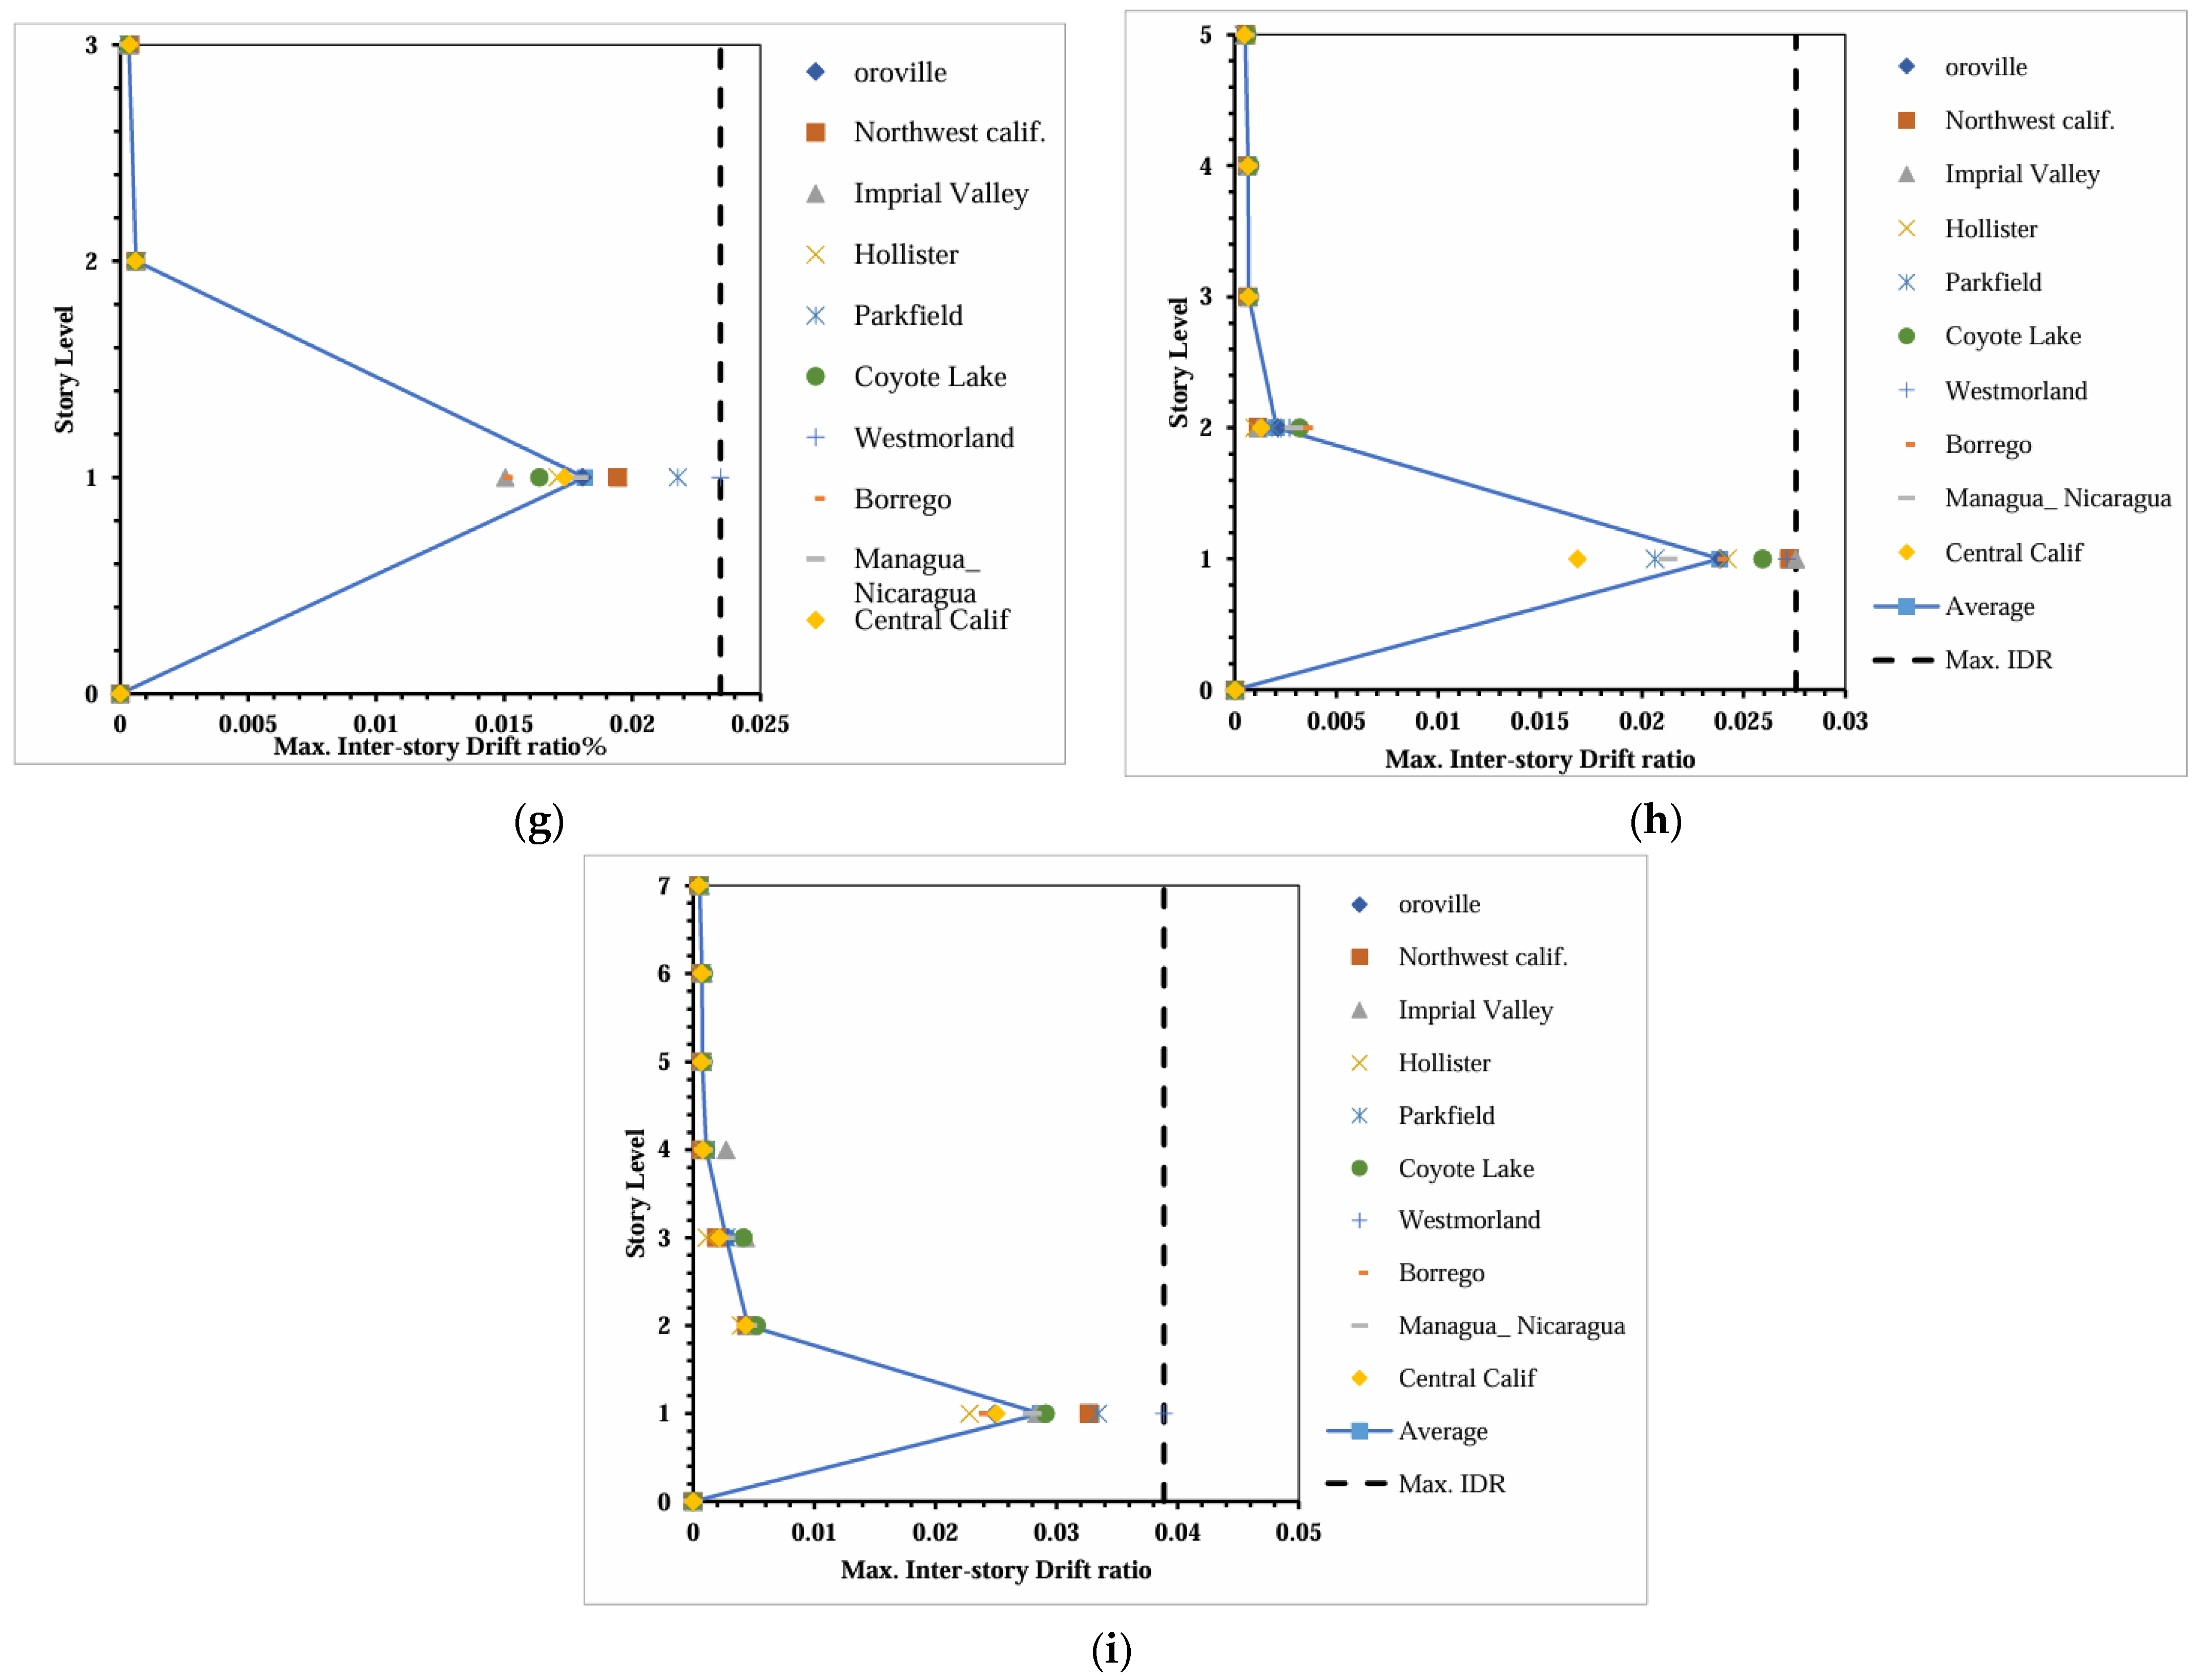
3.1. Nonlinear Response over the Height of the Structures

The main goal of studying the nonlinear response of a structure’s height is to understand how buildings and other tall constructions react to extreme loads, such as earthquakes, strong winds, or blast effects, during inelastic deformations. Unlike linear analysis, which assumes that materials remain elastic, nonlinear analysis considers plasticity, cracking, yielding, and large displacements. This approach offers a more realistic structural performance assessment under severe loading conditions. The responses of each story, measured in terms of the maximum inter-story drift ratio, were generated by applying the matched, unscaled time histories of the selected ground motions. This was performed to investigate the influence of earthquake intensity on the distribution of inelasticity across the height of the buildings. The maximum PGA values of the selected earthquakes were 0.42 g, 0.34 g, 0.25 g, 0.32 g, 0.34 g, 0.32 g, 0.34 g, 0.29 g, 0.32 g, and 0.30 g. Figure 6 shows the response of each story for the nine buildings with matched unscaled seismic records. Figure 8a–c illustrate the behavior of the stories in the BF3, BF5, and BF7 buildings, respectively, showing the impact of each ground motion on every story. By comparing the bare-framed buildings with the fully infilled-framed buildings in Figure 8d–f, it is evident that infill walls reduce the maximum inter-story drift ratio across the entire building, significantly increasing its stiffness and lateral load resistance. The inclusion of infill walls alters the building’s performance under lateral loads.
Figure 8g–i depict the behavior of the stories in the SSF3, SSF5, and SSF7 buildings, showing the effects of the soft-story in infill-framed buildings. By comparing the sharp change in stiffness between stories, it is clear that the drift ratio [47,48] of the first story is larger than that of the adjacent stories in the infill frame buildings. This indicates that the first story is more flexible, creating a soft layer significantly reducing the structure’s load-bearing capacity [49,50].
Figure 8. Inter-story drift ratios for: (a) BF3, (b) BF5, (c) BF7, (d) IF3, (e) IF5, (f) IF7, (g) SSF3, (h) SSF5, (i) SSF7.
Buildings 15 01336 g008aBuildings 15 01336 g008b

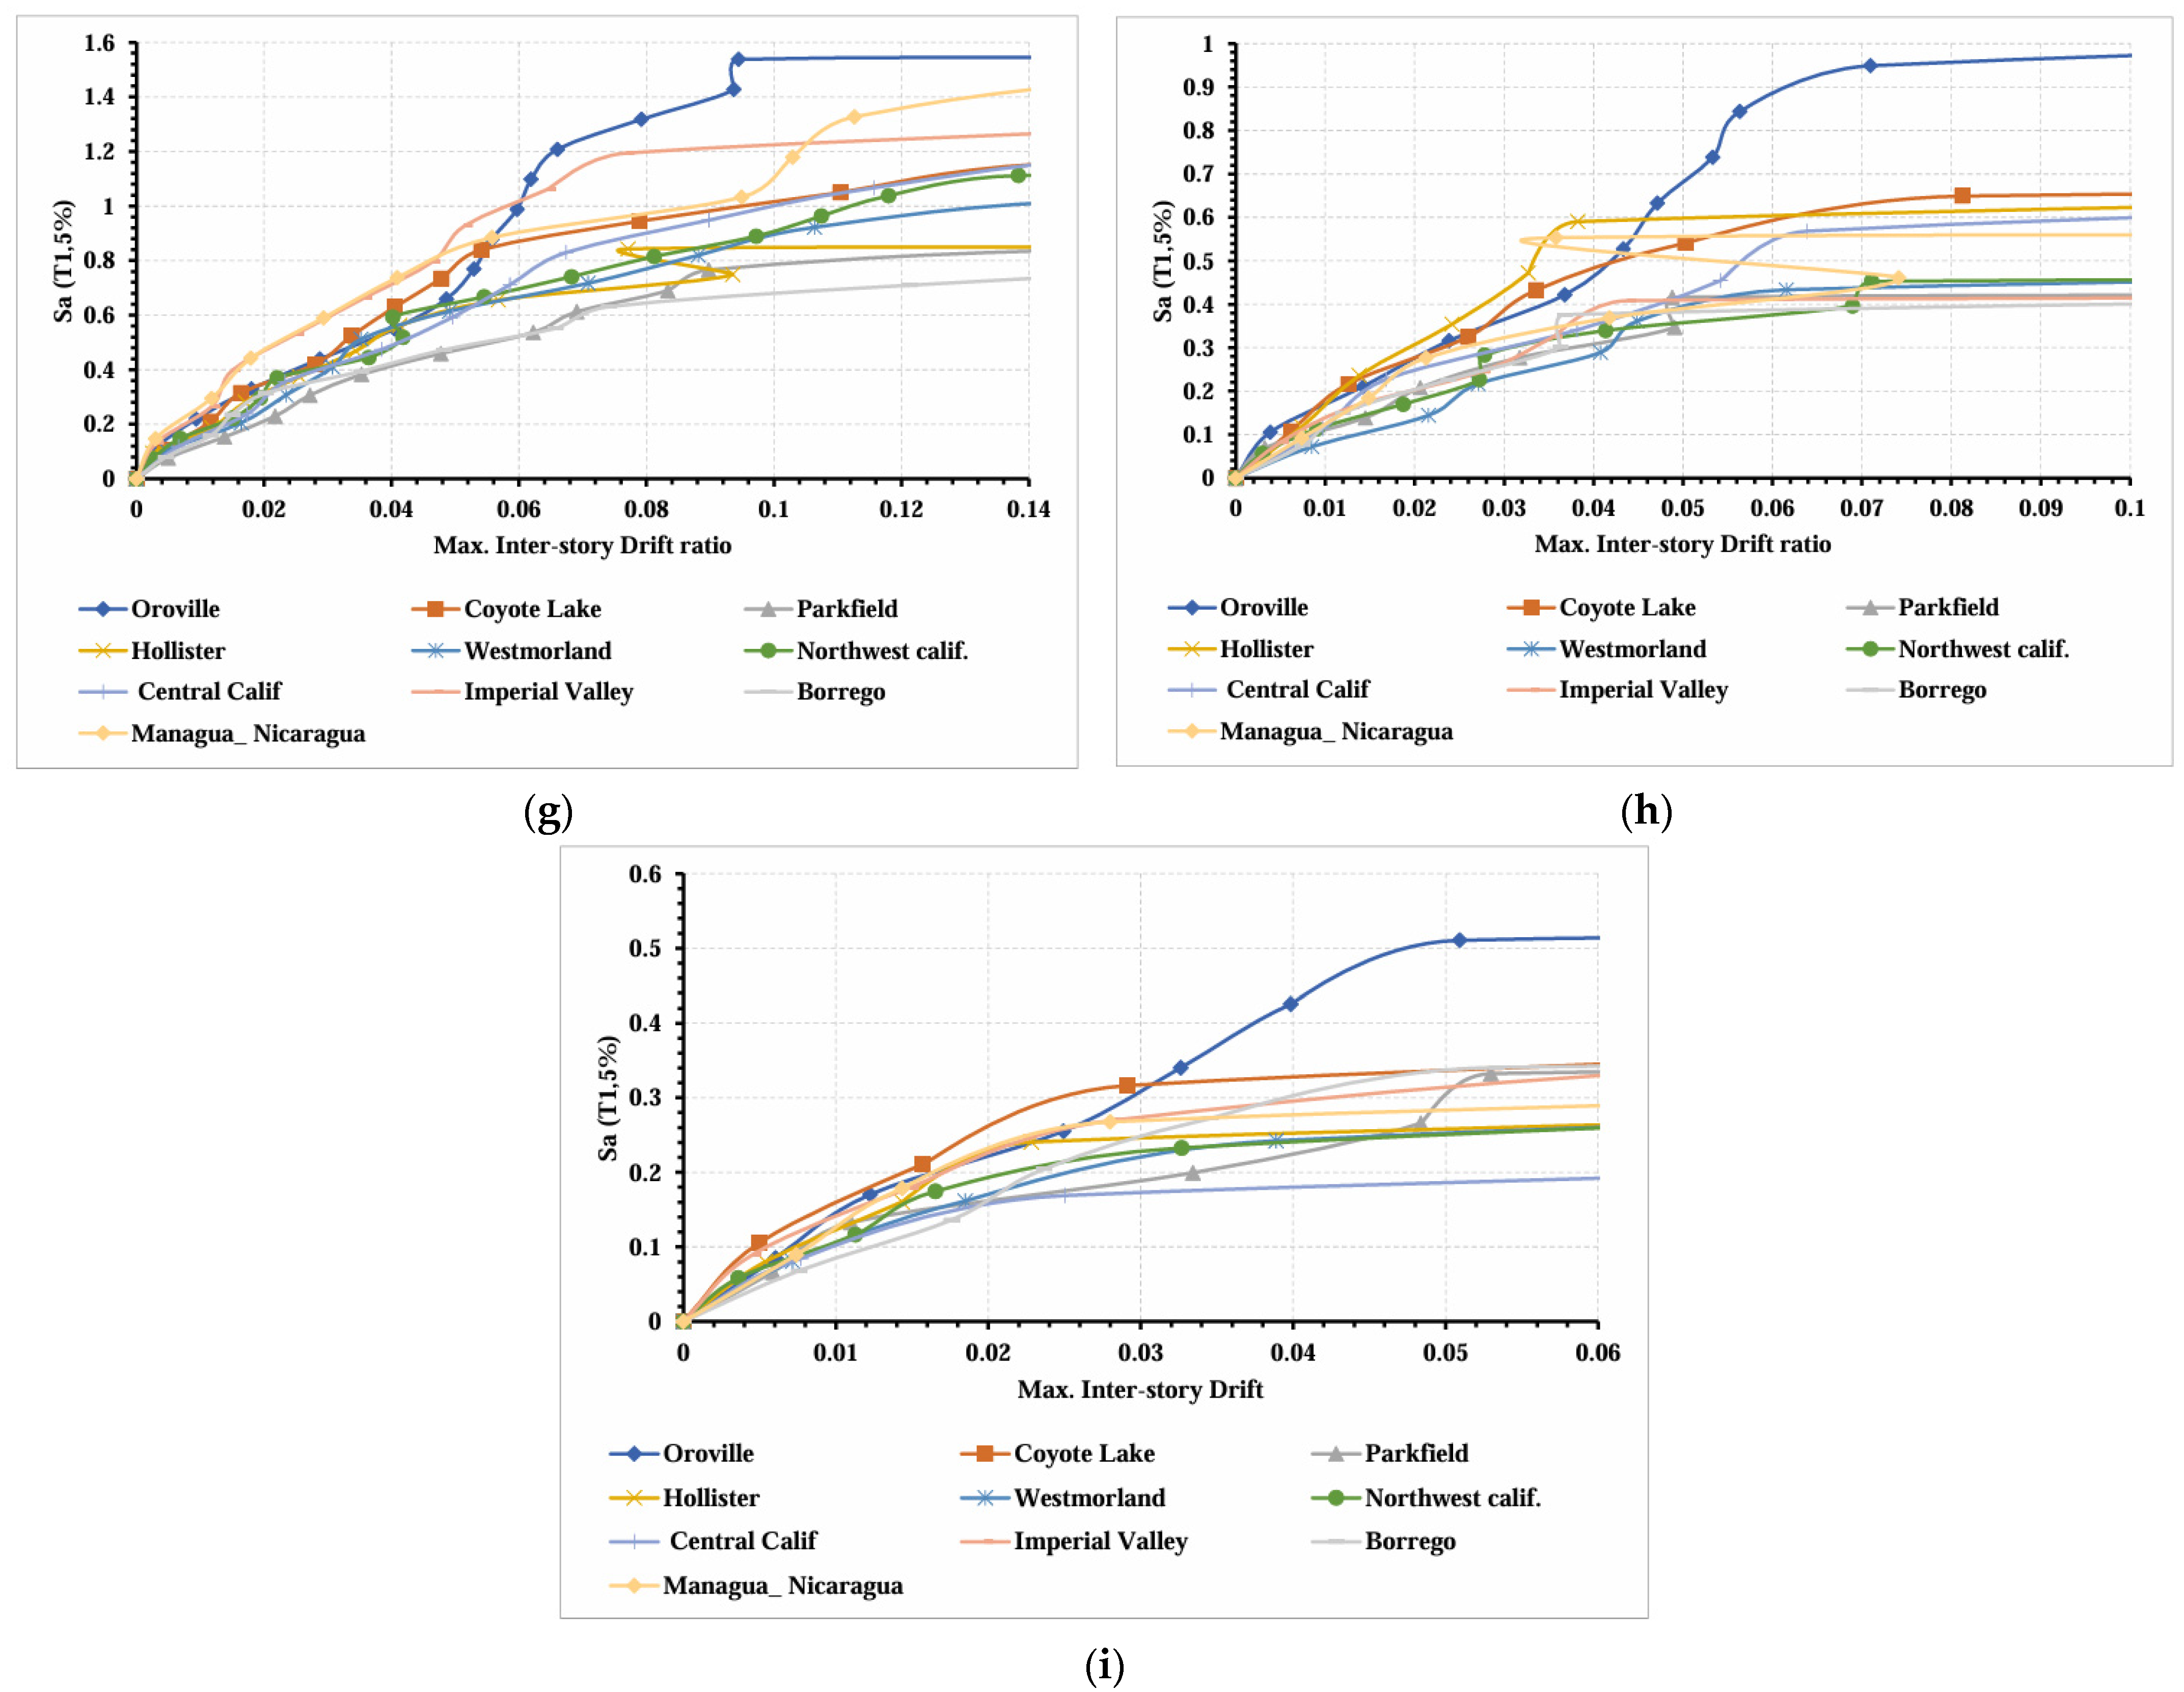
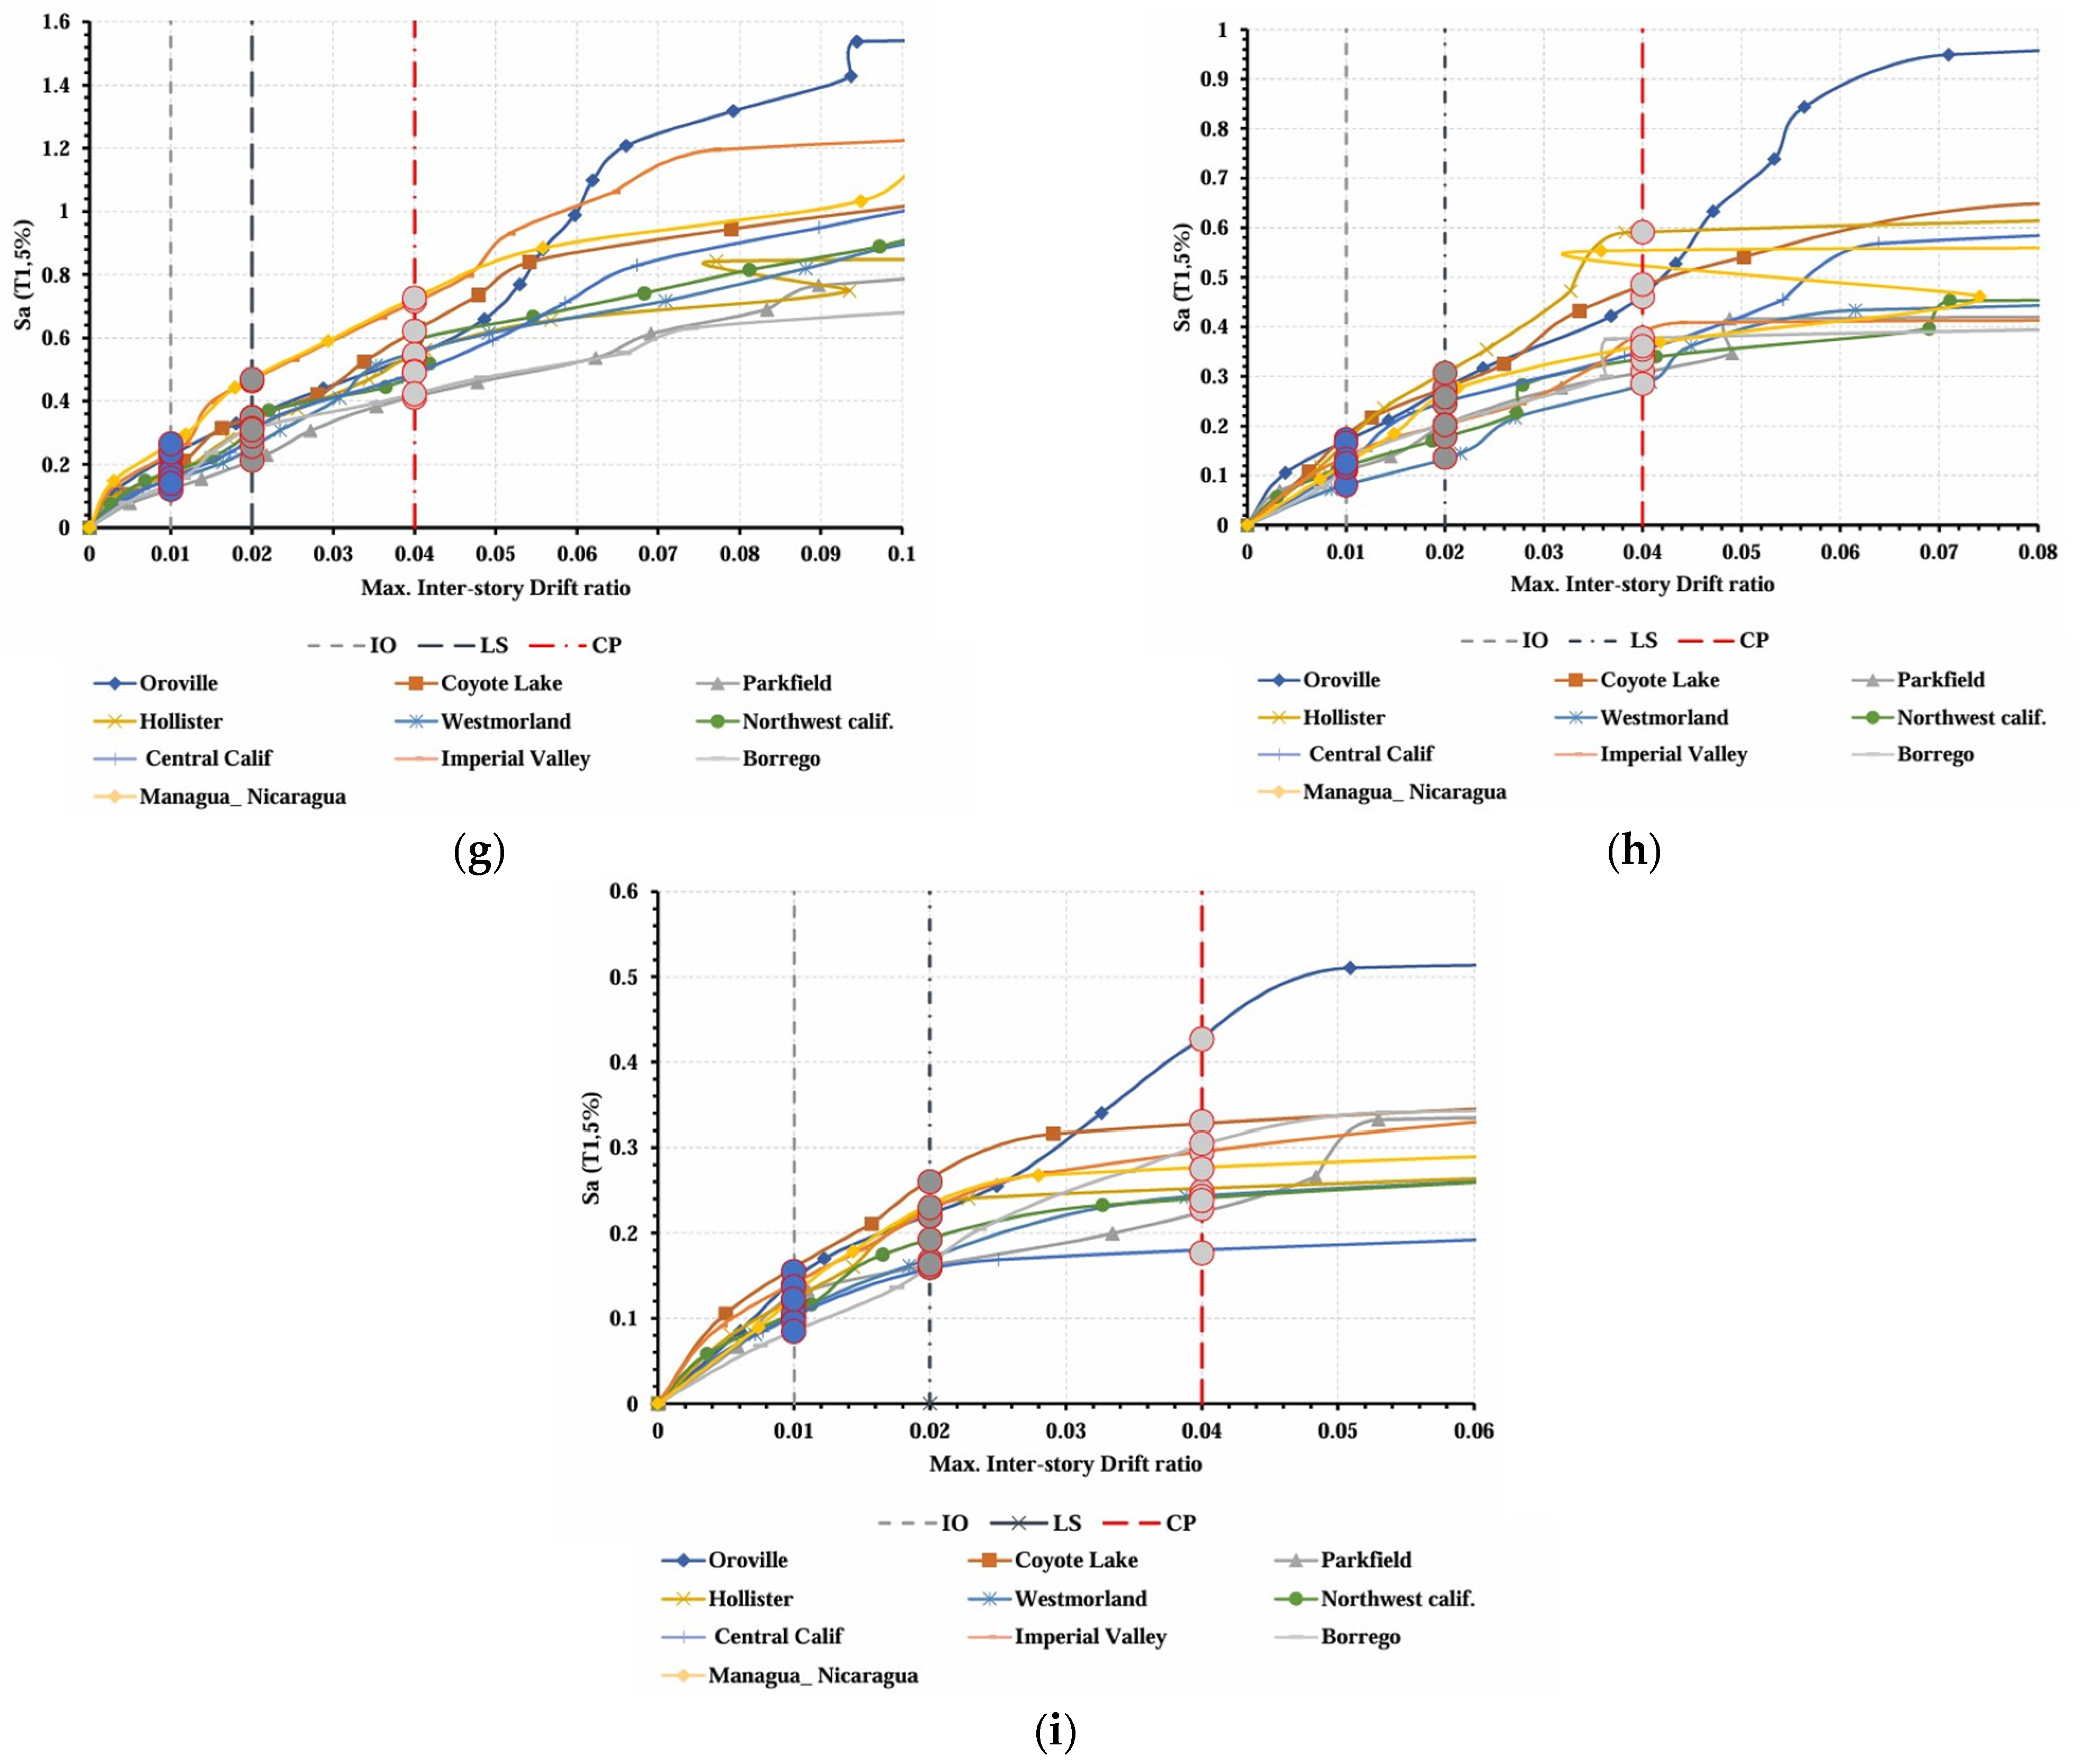
3.2. Incremental Dynamic Analysis Curves

As observed in Figure 9, the IDA curves vary with each ground motion, leading to a broad range of responses for each structure. The IDA curve reflects the structural response and illustrates how the structure behaves under different ground motions. Each building exhibits a unique IDA curve shape based on its capacities (i.e., strength, stiffness, ductility) to resist seismic loads and the characteristics of the ground motions. Intensity Measures (IM) and Damage Measures (DM) variations also result in different IDA curve shapes.
The flat section at the end of the curve is used to assess the collapse of IDA curves with hardening properties. The seismic capacity of a building model is determined by the IM values at collapse and corresponding damage values. In the case of softening, the building collapses at a lower IM value and exhibits a higher DM, such as maximum inter-story drift [51,52]. Conversely, hardening indicates that the IDA curve oscillates in the nonlinear region, meaning that as IM increases, the DM value rises and then decreases. For instance, in Figure 6, the IDA curves for the Oroville earthquake show the highest IM values compared to the others, while the IDA curve for the Parkfield earthquake shows the lowest IM values. This suggests that the building’s capacity against Oroville is greater than its capacity against Parkfield.
A common feature of all curves is that, at lower scale factors, the data points form a linear region. As the scale factor increases, the curve starts to bend, indicating the structure begins to yield. In the nonlinear region, the curves become wavy, indicating that the building reaches hardening. The best seismic performance appears to be associated with IF3.
Figure 9. IDA Curves: (a) BF3, (b) BF5, (c) BF7, (d) IF3, (e) IF5, (f) IF7, (g) SSF3, (h) IDA SSF5, (i) SSF7.
Buildings 15 01336 g009aBuildings 15 01336 g009b

3.3. Damage Limit States

After implementing the damage limit on the IDA curves for every building, the corresponding spectra acceleration (Sa) values were found from the vertical axes of the curves by interpolating them to every point. Figure 10 shows the damage limits on the IDA curves of each type of representative building with the damage limits and the corresponding values of the spectra acceleration. According to FEMA 356-2000 [53] for RC frame without any shear walls, the (IO) is defined when the inter-story drift ratio reaches 1% of the floor height. Similarly (LS) is defined at θ m a x = 0.02 and finally (CP) is considered for θ m a x = 0.04.
Figure 10. Damage limits on the IDA curves for: (a) BF3, (b) BF5, (c) BF7, (d) IF3, (e) IF5, (f) IF7, (g) SSF3, (h) SSF5, (i) SSF7.
Buildings 15 01336 g010aBuildings 15 01336 g010b

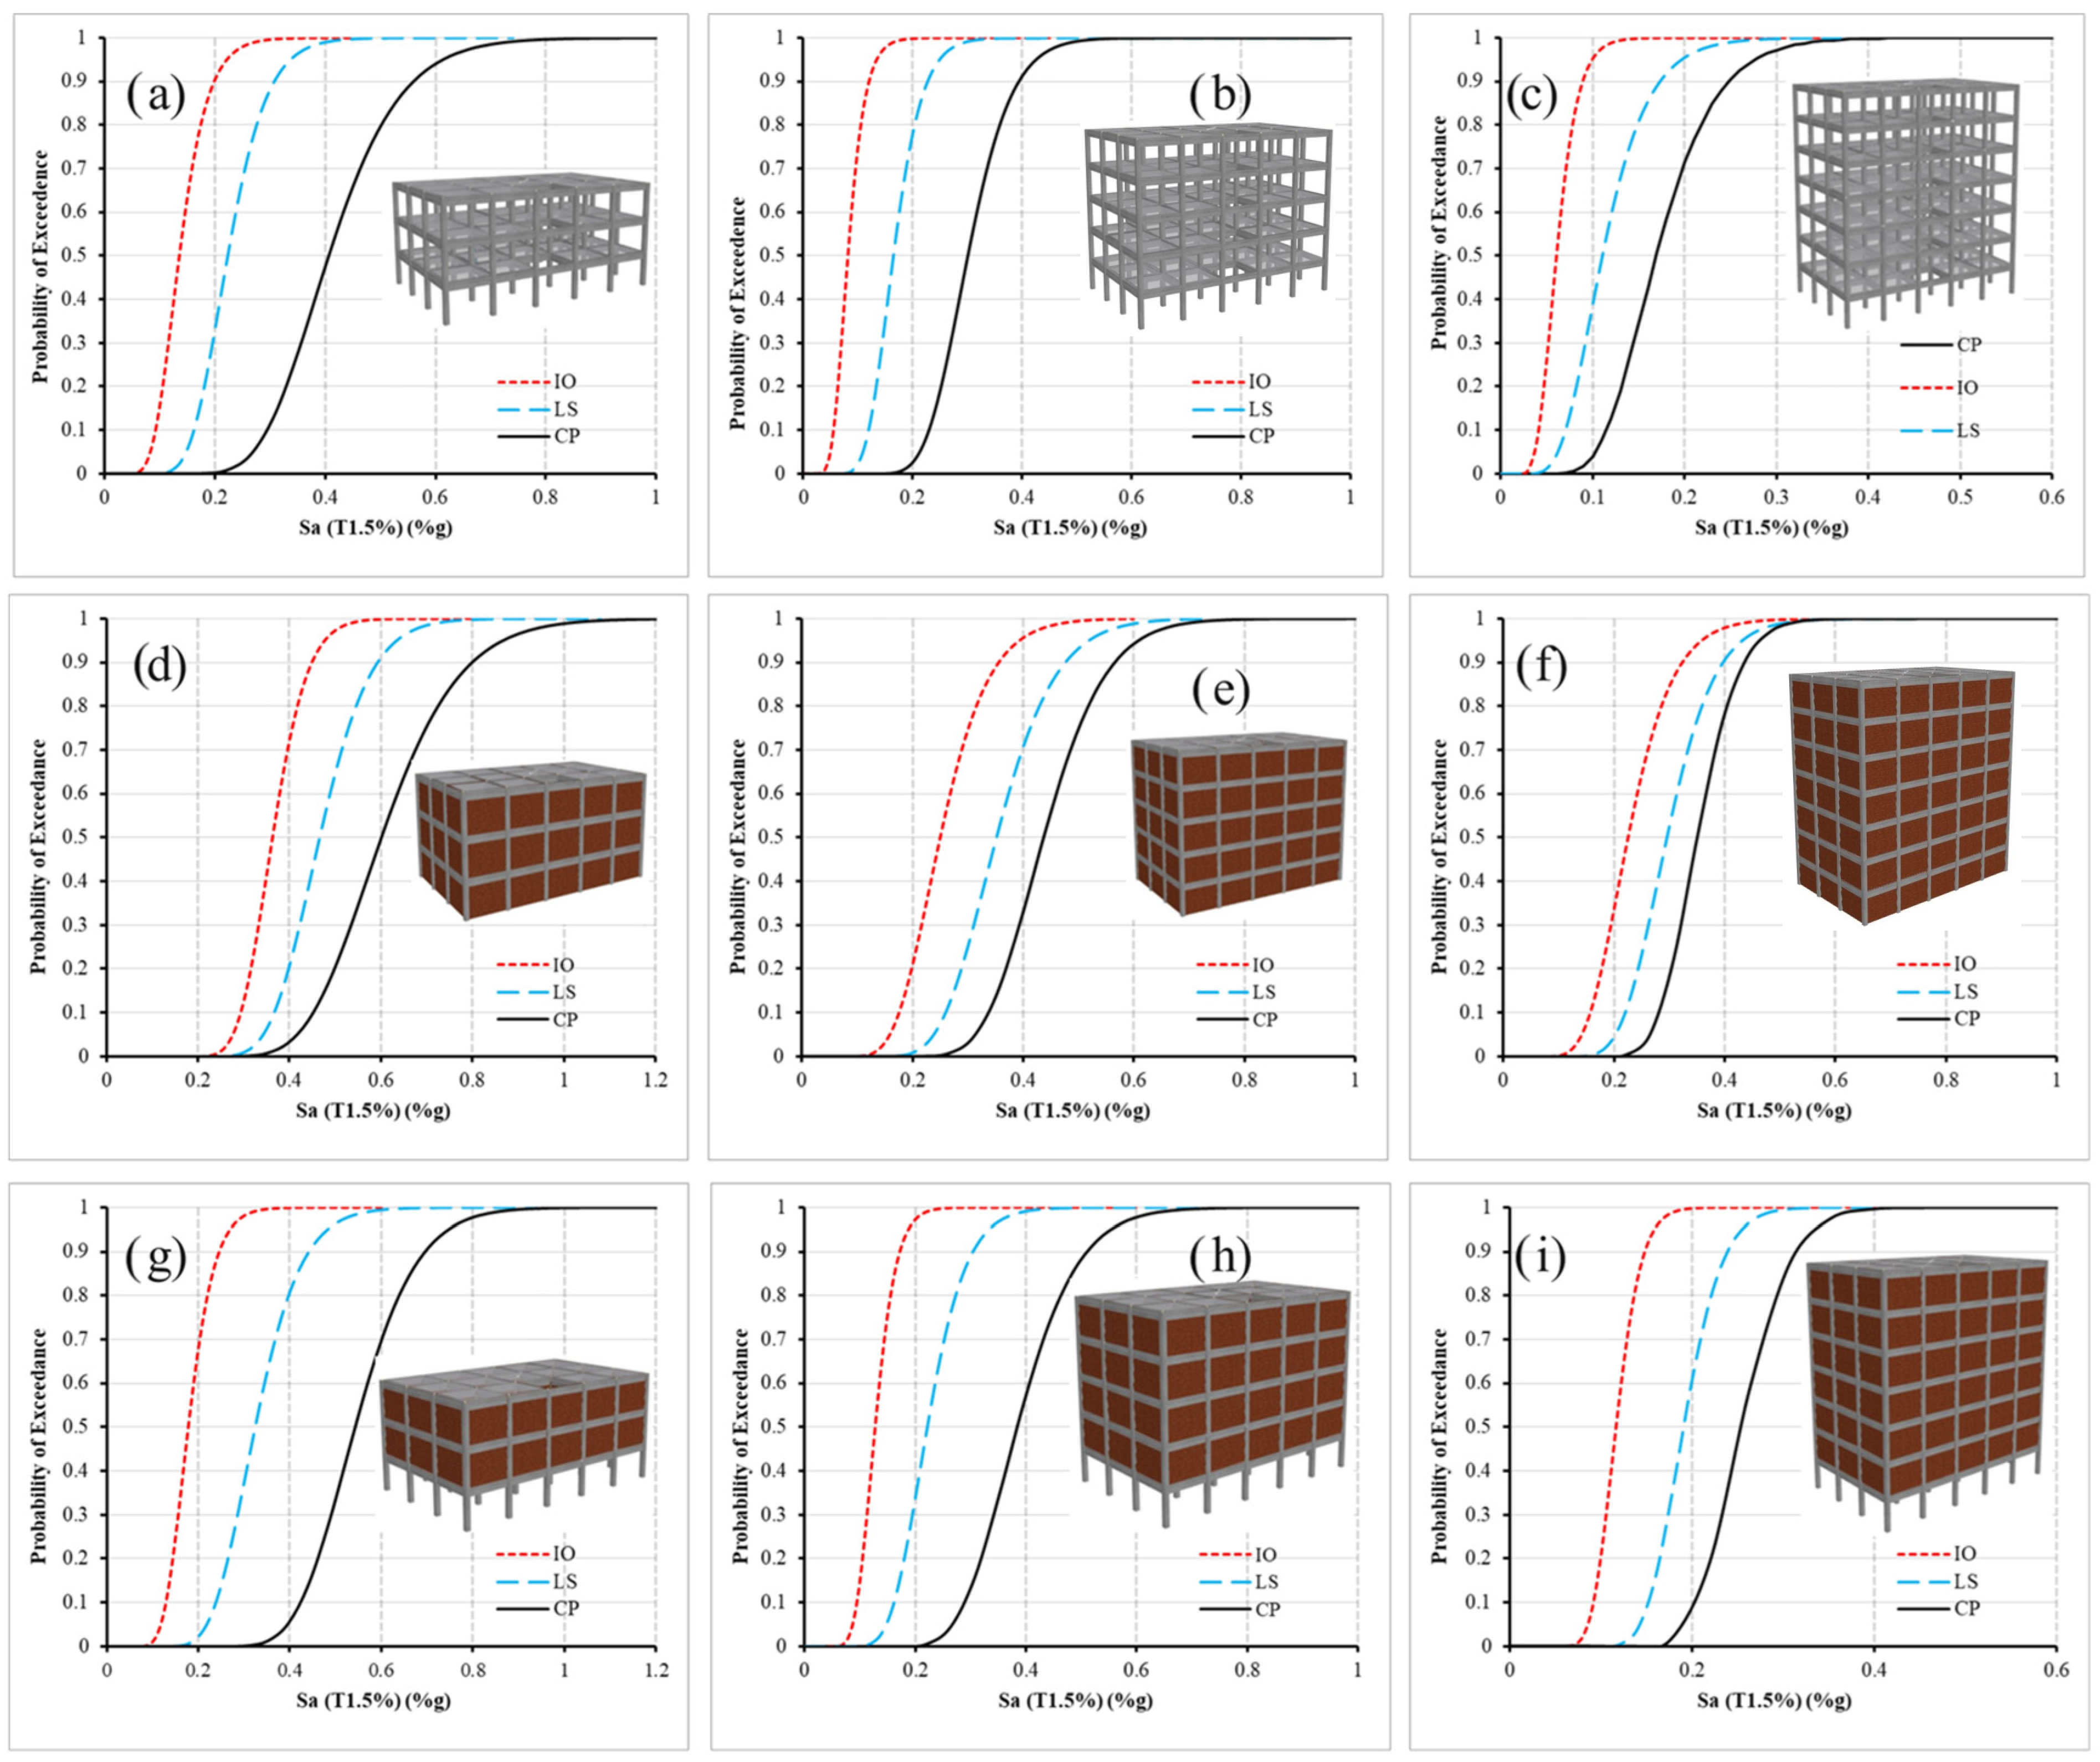
3.4. Fragility Curves

Figure 11 shows the developed seismic fragility curves for the nine representative buildings.
Figure 11. Seismic fragility curves of: (a) BF3, (b) BF5, (c) BF7, (d) IF3, (e) IF5, (f) IF7, (g) SSF3, (h) SSF5, (i) SSF5.
Buildings 15 01336 g011

3.5. The Effect of Different Parameters According to Fragility Curves

Various parameters, including building height, infill walls, and soft-story features, were compared in this study to evaluate the building’s performance. This comparison helps assess the seismic vulnerability of the buildings and determine the probability of exceeding the damage limits for different building types.

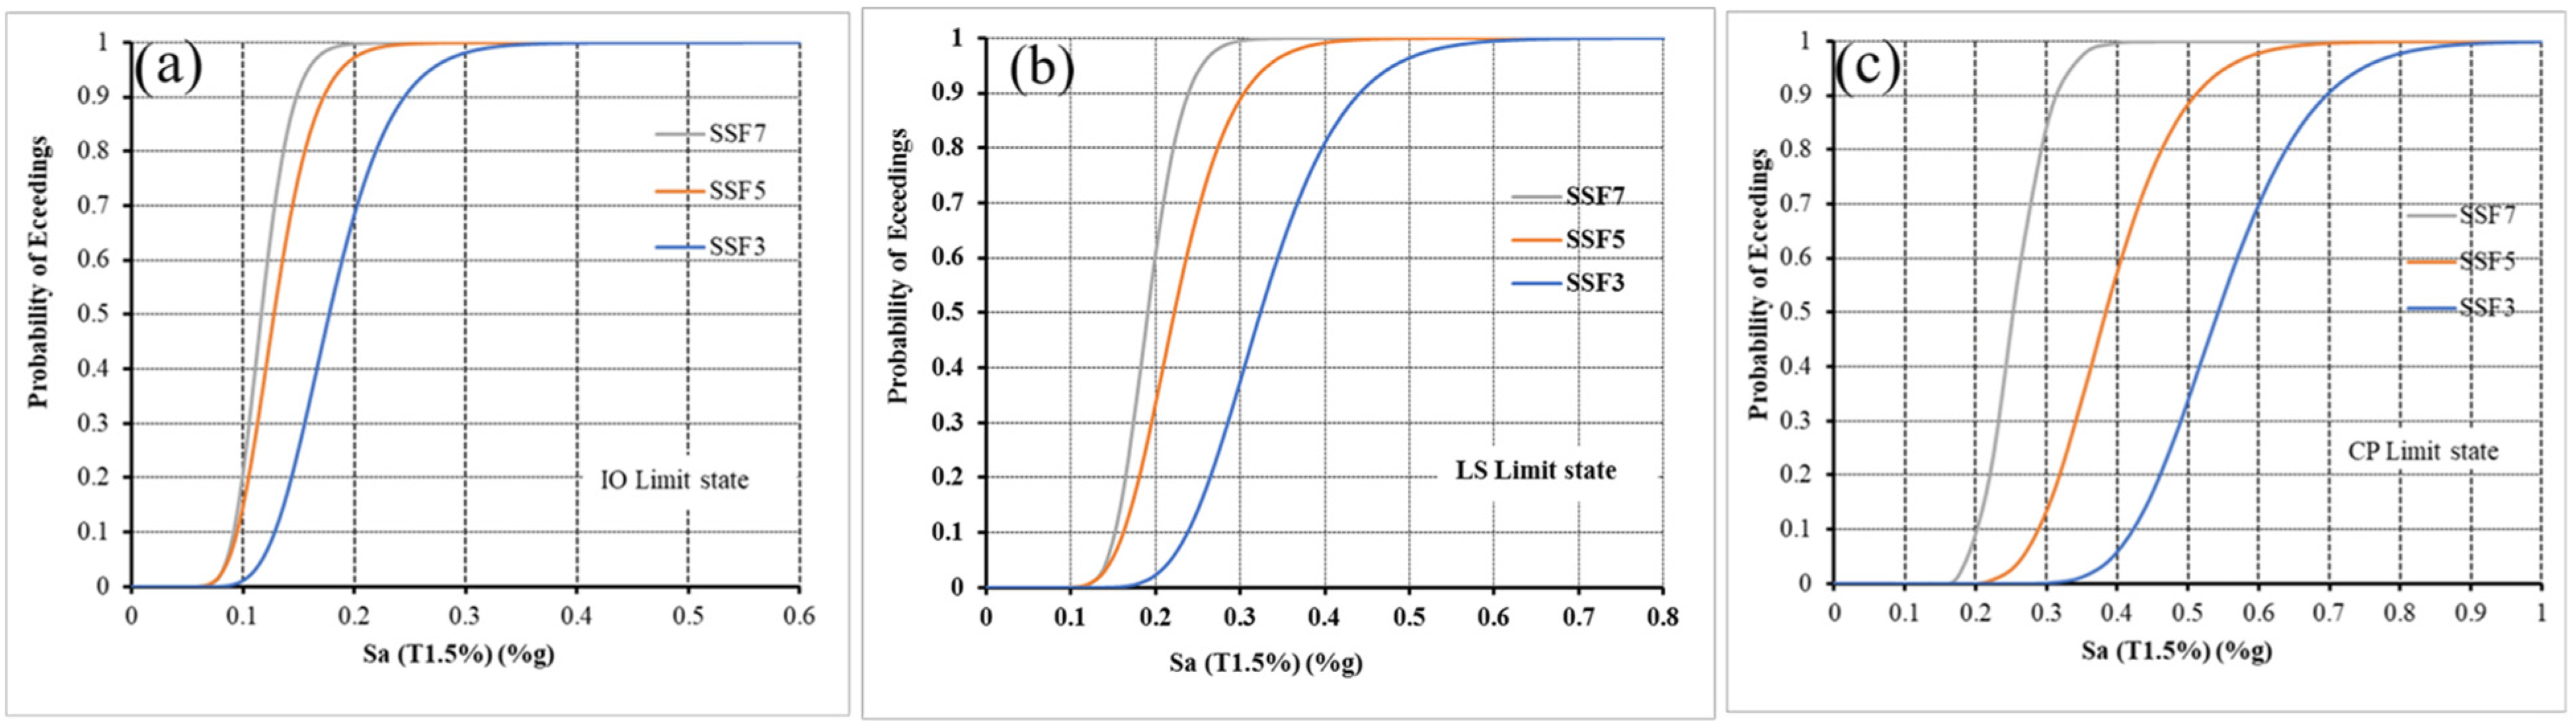
3.5.1. The Effect of the Height on the Performance

Figure 12 compares the fragility curves for different building heights (3, 5, and 7 stories) and types (Bare Frame (BF), Fully In-filled Frame (IF), and Infilled Frame with Soft-Story (SSF)). The probability of exceeding performance levels at specific Sa values is summarized in Table 5, Table 6, Table 7, Table 8, Table 9, Table 10, Table 11, Table 12 and Table 13.
For BF buildings, the probability of reaching or exceeding various damage states is as follows: for Sa = 0.3 g, the probability of exceeding the IO state is 100% for all buildings, while the probability of reaching LS is 88%, 99%, and 100% for BF3, BF5, and BF7, respectively. The probability of reaching CP is 11% for BF3, 49% for BF5, and 97% for BF7.
The IO limit state for Sa < 0.1 g is unlikely for BF3, while it is almost certain for Sa > 0.2 g. For BF5, the IO state is unlikely for Sa < 0.05 g and certain for Sa > 0.12 g. For BF7, IO occurs when Sa < 0.03 g, with near certainty above 0.1 g. For LS, the threshold for BF3, BF5, and BF7 is 0.13 g, 0.1 g, and 0.05 g, respectively, with near certainty above 0.4 g, 0.3 g, and 0.25 g. Finally, for CP, the thresholds for BF3, BF5, and BF7 are 0.25 g, 0.2 g, and 0.1 g, respectively, with near certainty above 0.65 g, 0.46 g, and 0.28 g.
Figure 12. Seismic fragility curves for BF3, BF5, and BF7 for different limits state: (a) immediate occupancy (IO), (b) life safety (LS), (c) collapse prevention (CP).
Buildings 15 01336 g012
Table 5. The probability of exceeding performance levels at certain Sa for BF3, BF5, and BF7 buildings.
Sa
(%g)
IOLSCP
BF3BF5BF7BF3BF5BF7BF3BF5BF7
0000000000
0.10.160.740.9500.020.38000.04
0.20.9110.330.780.9500.030.71
0.31110.880.9910.110.490.97
0.41110.99110.470.911
0.51111110.80.991
0.61111110.9411
0.71111110.9911
0.8111111111
0.9111111111
1111111111
Figure 13 compares the fragility curves for IF3, IF5, and IF7. At Sa = 0.4 g, the probability of exceeding the IO damage limit is 72% for IF3, 96% for IF5, and 98% for IF7. The probability of exceeding the LS damage limit is 21%, 71%, and 91% for IF3, IF5, and IF7, respectively, while for CP, it is 3%, 33%, and 78%.
For Sa < 0.25 g, 0.15 g, and 0.13 g, the IO limit state is unlikely for IF3, IF5, and IF7, respectively, but becomes almost certain above 0.5 g, 0.42 g, and 0.4 g. Similarly, the LS limit state does not occur if Sa < 0.3 g for IF3, 0.2 g for IF5, and 0.17 g for IF7 but becomes almost certain above 0.7 g, 0.55 g, and 0.45 g. Finally, the CP limit state is unlikely for Sa < 0.37 g, 0.3 g, and 0.25 g for IF3, IF5, and IF7 but almost certain for Sa > 0.9 g, 0.6 g, and 0.45 g, respectively.
Figure 14 compares the fragility curves for SSF3, SSF5, and SSF7. At Sa = 0.4 g, the probability of exceeding the IO damage limit is 100% for all SSF3, SSF5, and SSF7. The probability of exceeding the LS damage limit is 81%, 99%, and 100% for SSF3, SSF5, and SSF7, respectively, while for CP, it is 6%, 57%, and 100%.
The IO limit state occurs when Sa < 0.1 g for SSF3 and 0.08 g for SSF5, and SSF7 becomes almost certain for Sa > 0.27 g, 0.17 g, and 0.1 g. The LS limit state will not occur if Sa < 0.2 g for SSF3, 0.15 g for SSF5, and 0.13 g for SSF7 but becomes almost certain for Sa > 0.45 g, 0.3 g, and 0.25 g. The CP limit state starts to occur when Sa < 0.35 g, 0.25 g, and 0.18 g and becomes almost certain for Sa > 0.7 g, 0.52 g, and 0.32 g.
These results show that buildings with greater height are more likely to reach or exceed damage limits. As building height increases, the probability of reaching damage limits rises, and the damage states occur at smaller Sa values. This highlights the important role of height in influencing structural behavior and the fragility curve pattern.
Figure 13. Seismic fragility curves for IF3, IF5, and IF7 for different limits state: (a) immediate occupancy (IO), (b) life safety (LS), (c) collapse prevention (CP).
Buildings 15 01336 g013
Table 6. The probability of exceeding performance levels at certain Sa for IF3, IF5, and IF7 buildings.
Sa
(%g)
IOLSCP
IF3IF5IF7IF3IF5IF7IF3IF5IF7
0000000000
0.1000000000
0.200.210.3300.010.04000
0.30.130.740.840.010.250.5200.030.18
0.40.720.960.980.210.710.910.030.330.78
0.50.970.9910.650.930.990.20.750.98
0.61110.910.9910.50.941
0.71110.99110.750.991
0.81111110.911
0.91111110.9711
11111110.9911
Figure 14. Seismic fragility curves for SSF3, SSF5, and SSF7 for different limits state: (a) Immediate occupancy (IO), (b) Life safety (LS), (c) Collapse prevention (CP).
Buildings 15 01336 g014
Table 7. The probability of exceeding performance levels at certain Sa for SSF3, SSF5, and SSF7 buildings.
Sa
(%g)
IOLSCP
SSF3SSF5SSF7SSF3SSF5SSF7SSF3SSF5SSF7
0000000000
0.10.010.150.21000000
0.20.680.9710.020.340.61000.08
0.30.98110.380.89100.130.84
0.41110.810.9910.060.571
0.51110.96110.340.881
0.61110.99110.70.981
0.71111110.9111
0.81111110.9811
0.9111111111
1111111111

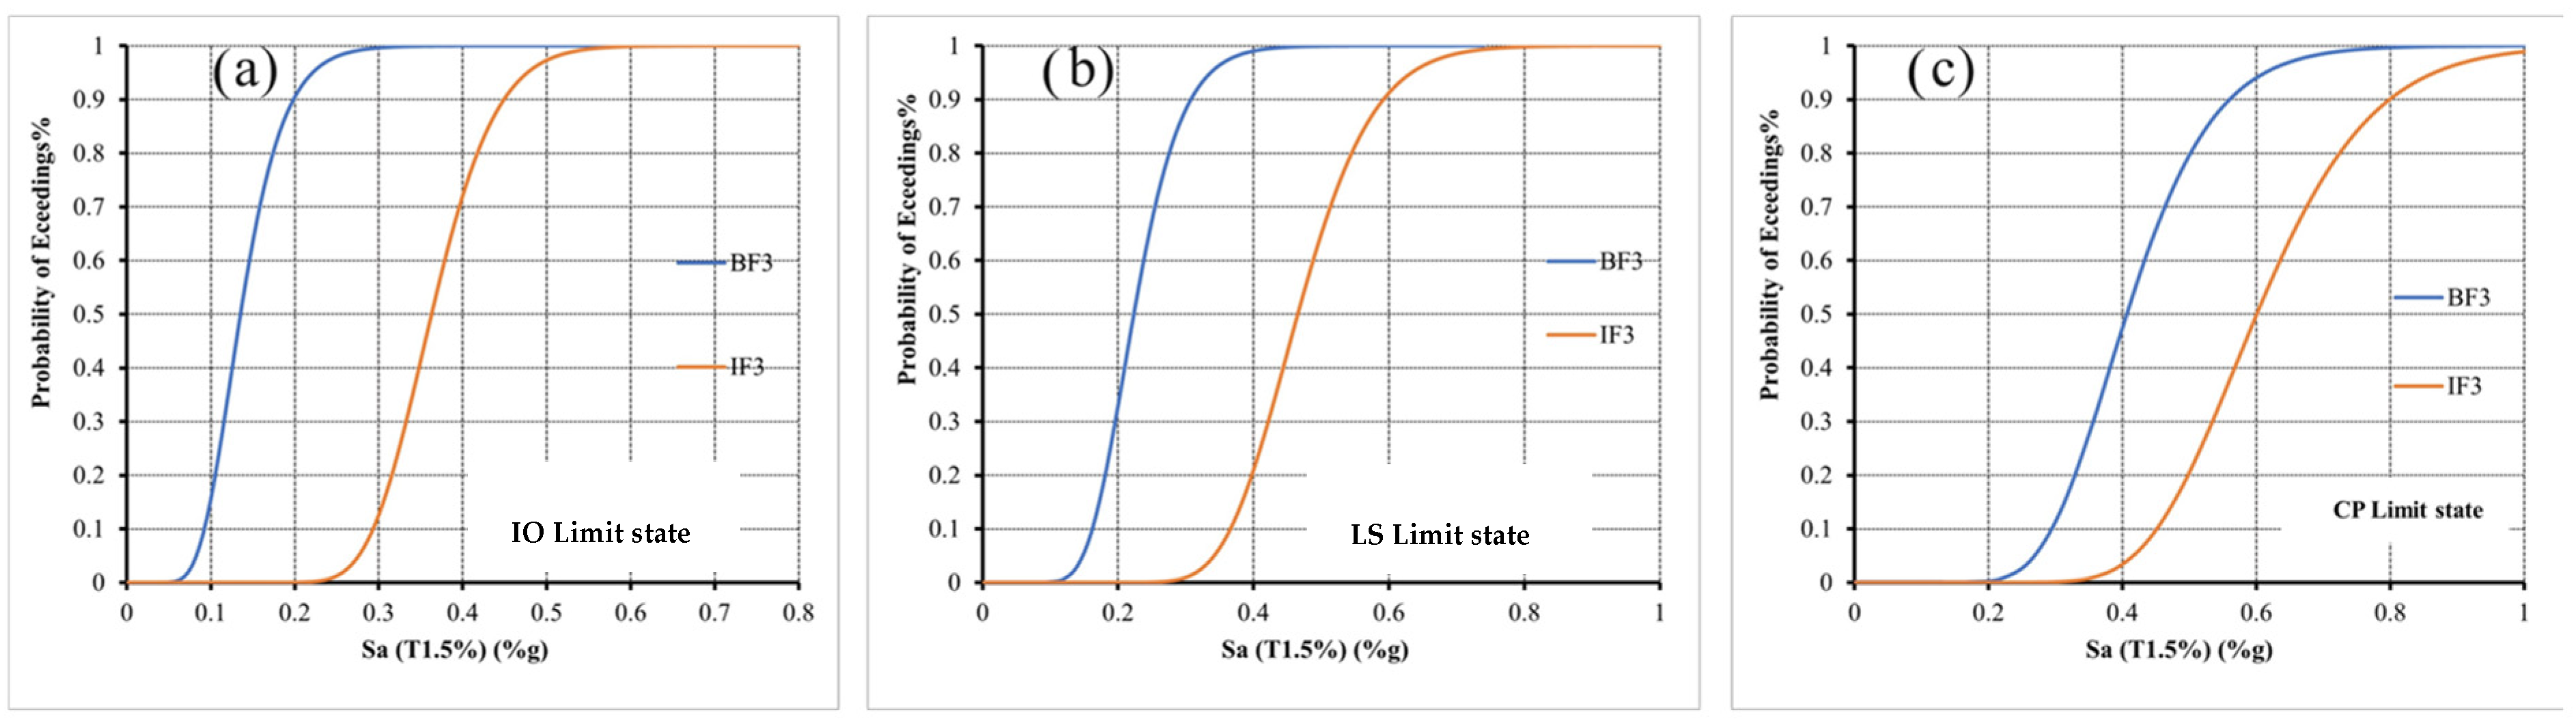
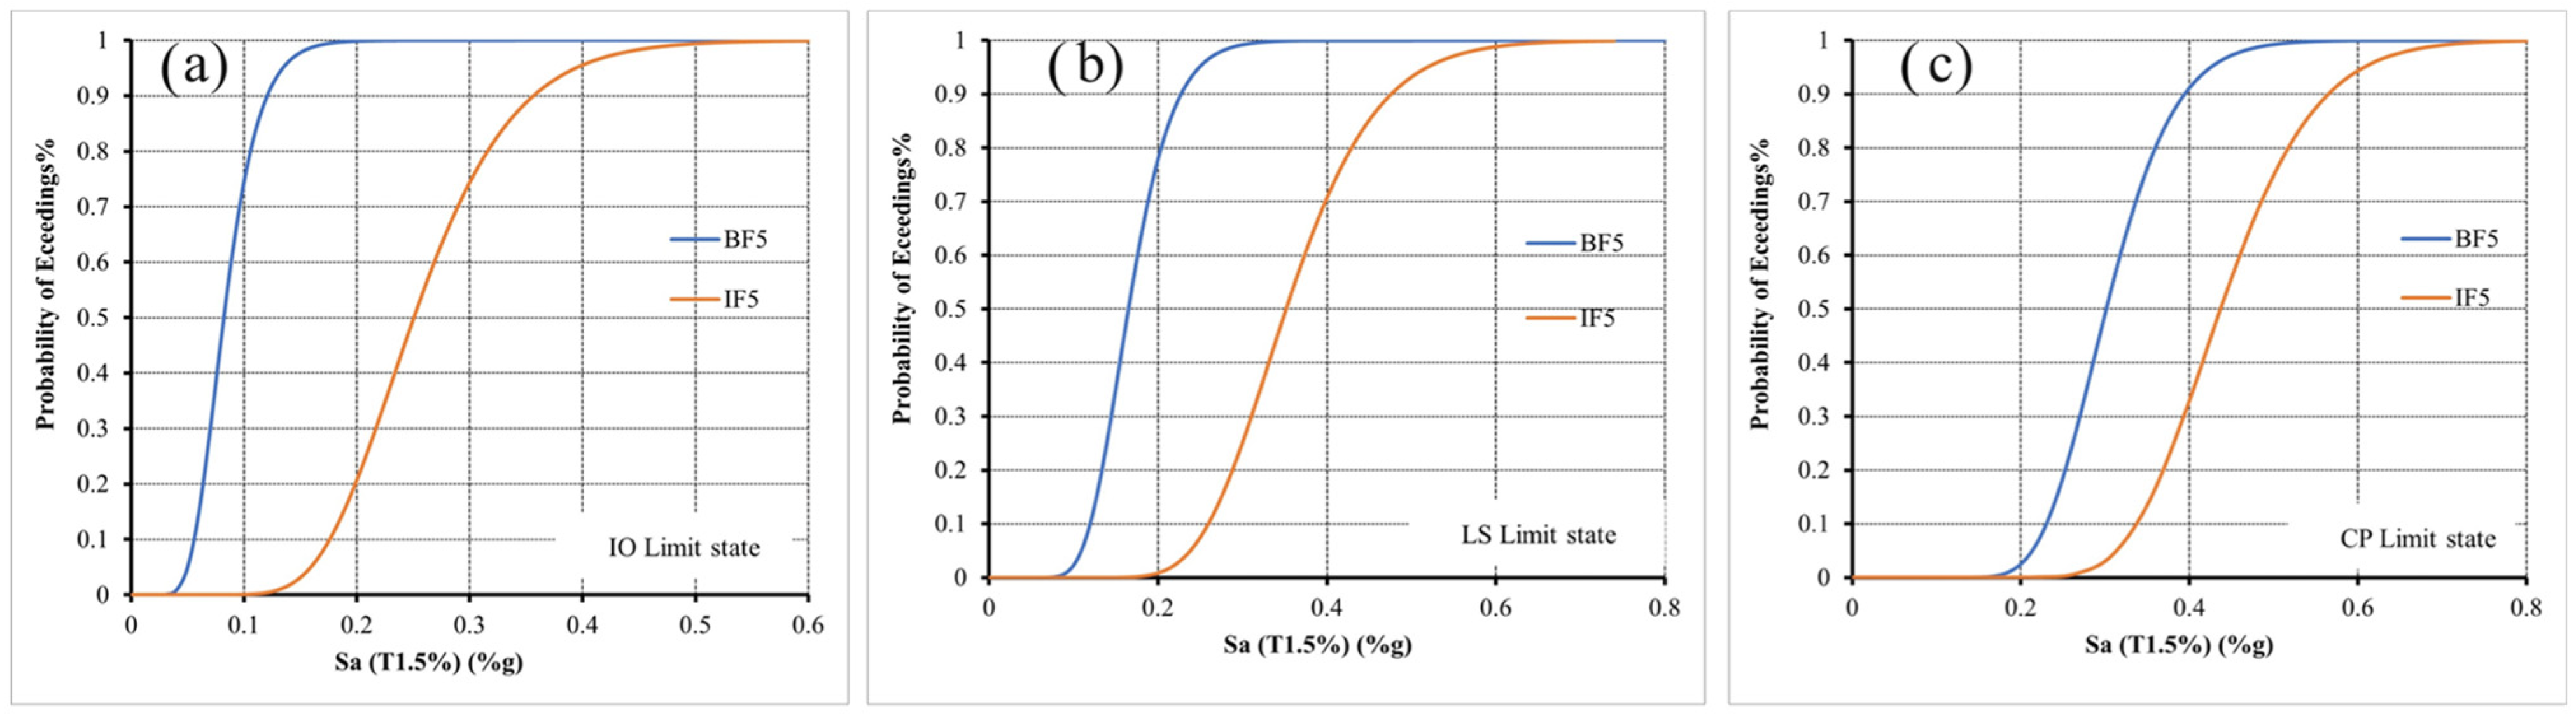
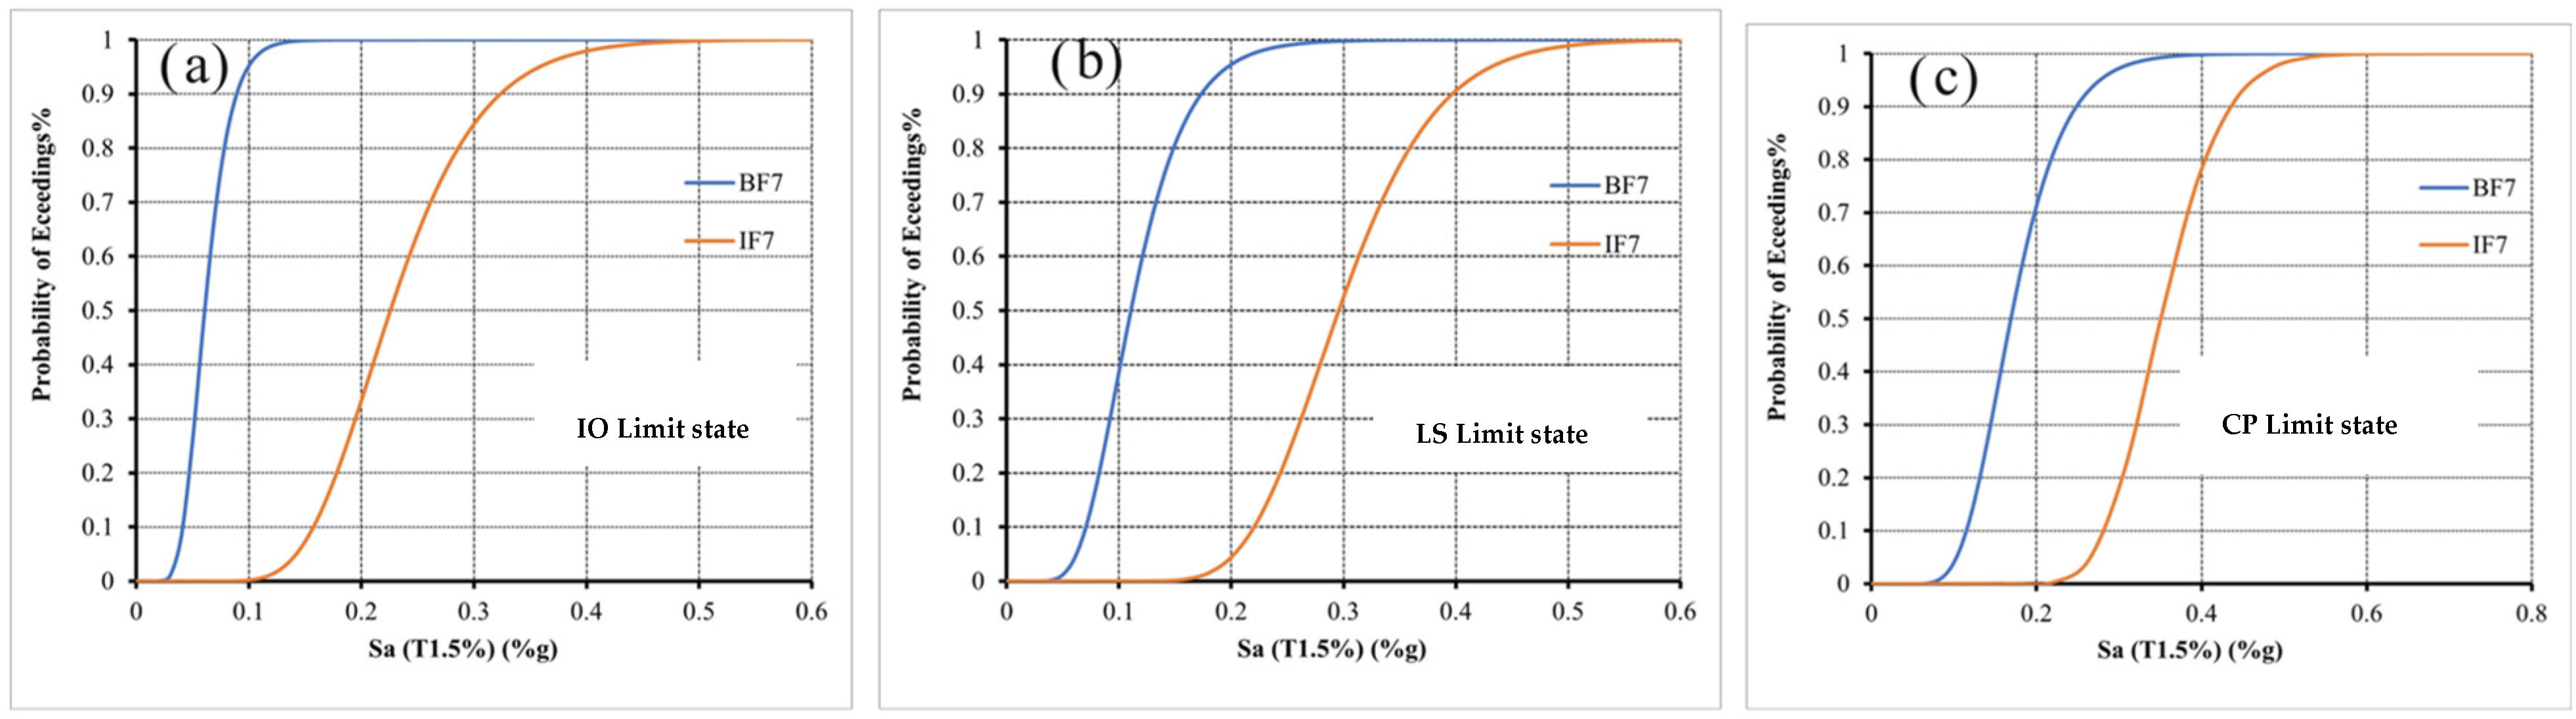
3.5.2. The Effect of the Infill Wall on the Performance

Figure 15, Figure 16, Figure 17, Figure 18, Figure 19 and Figure 20 compare the fragility curves for different types of buildings, including Bare frame (BF) and Fully Infilled frame (IF) with varying heights (three, five, and seven stories). The probabilities of exceeding performance levels at specific Sa values for BF3-5-7 and IF3-5-7 are summarized in Table 8, Table 9 and Table 10.
Figure 15 compares the fragility curves for BF3 and IF3. As shown in Table 8, when the buildings are exposed to ground motion with Sa = 0.4 g, the probability of exceeding the IO damage limit is 100% for BF3 and 72% for IF3. The probability of exceeding the LS damage limit is 99% for BF3 and 21% for IF3, while the probability of exceeding the CP damage limit is 47% for BF3 and 3% for IF3.
The IO limit state is unlikely for Sa < 0.1 g for BF3 and <0.25 g for IF3, becoming almost certain for Sa > 0.2 g for BF3 and >0.5 g for IF3. Similarly, the LS limit state does not occur for Sa < 0.13 g for BF3 and <0.3 g for IF3. The CP limit state begins when Sa < 0.25 g for BF3 and <0.37 g for IF3, with a near-certain occurrence when Sa > 0.65 g for BF3 and >0.9 g for IF3. It is also observed that the maximum probability for CP is nearly reached at Sa = 0.7 g for BF3 and at Sa = 1 g for IF3, indicating that IF3 requires a higher Sa to reach the CP damage limit.
Figure 16 compares the fragility curves of BF5 and IF5, with Table 9 showing the probability of exceeding damage limits at specific Sa values.
At Sa = 0.4 g, the probability of exceeding the IO damage limit is 100% for BF5 and 96% for IF5, the LS limit is 100% for BF5 and 71% for IF5, and the CP limit is 91% for BF5 and 33% for IF5. The IO limit occurs when Sa > 0.12 g for BF5 and >0.42 g for IF5, the LS limit when Sa > 0.1 g for BF5 and >0.2 g for IF5, and the CP limit when Sa > 0.46 g for BF5 and >0.6 g for IF5. The CP limit for IF5 requires a higher Sa to be reached, with its maximum probability at Sa = 0.8 g, compared to Sa = 0.6 g for BF5.
Figure 15. Seismic fragility curves for 3-story (bare frame and fully infilled frame) buildings for different limits states: (a) immediate occupancy (IO), (b) life safety (LS), (c) collapse prevention (CP).
Buildings 15 01336 g015
Table 8. The probability of exceeding performance levels at certain Sa for 3-story (BF and IF) buildings.
Sa
(%g)
IOLSCP
BF3IF3BF3IF3BF3IF3
0000000
0.10.1600000
0.20.900.33000
0.310.130.880.010.110
0.410.720.990.210.470.03
0.510.9710.650.80.2
0.61110.910.940.5
0.71110.990.990.75
0.8111110.9
0.9111110.97
1111110.99
Figure 16. Seismic fragility curves for 5-story (bare frame and fully infilled frame) buildings for different limits states: (a) immediate occupancy (IO), (b) life safety (LS), (c) collapse prevention (CP).
Buildings 15 01336 g016
Table 9. The probability of exceeding performance levels at certain Sa for 5-story (BF and IF) buildings.
Sa
(%g)
IOLSCP
BF5IF5BF5IF5BF5IF5
0000000
0.10.7400.02000
0.210.210.780.010.030
0.310.740.990.250.490.03
0.410.9610.710.910.33
0.510.9910.930.990.75
0.61110.9910.94
0.7111110.99
0.8111111
0.9111111
Figure 17 compares the fragility curves of BF7 and IF7, with Table 10 showing the probability of exceeding performance levels at certain Sa values.
At Sa = 0.3 g, the probability of exceeding the IO damage limit is 100% for BF7 and 84% for IF7, the probability of reaching or exceeding the LS limit is 100% for BF7 and 52% for IF7, and the CP limit is 97% for BF7 and 18% for IF7. The IO limit state occurs when Sa > 0.1 g for BF7 and >0.4 g for IF7, the LS limit when Sa > 0.05 g for BF7 and >0.17 g for IF7, and the CP limit when Sa > 0.28 g for BF7 and >0.45 g for IF7. The CP limit for IF7 requires a higher Sa to be reached, with the maximum probability at Sa = 0.6 g for IF7, compared to Sa = 0.2 g for BF7.
These results indicate that infilled frames reduce the likelihood of reaching or exceeding damage limits. Infill walls increase the Sa required for limit states to occur and delay the collapse, suggesting that buildings with infilled frames perform better than bare-frame buildings. This demonstrates the significant role of infill walls in structural behavior and fragility.
Figure 17. Seismic fragility curves for 7-story (bare frame and fully infilled frame) buildings for different limit states: (a) immediate occupancy (IO), (b) life safety (LS), (c) collapse prevention (CP).
Buildings 15 01336 g017
Table 10. The probability of exceeding performance levels at certain Sa for 7-story buildings.
Sa
(%g)
IOLSCP
BF7IF7BF7IF7BF7IF7
0000000
0.10.9500.3800.040
0.210.330.950.040.710
0.310.8410.520.970.18
0.410.9810.9110.78
0.51110.9910.98
0.6111111
0.7111111
0.8111111
0.9111111
1111111

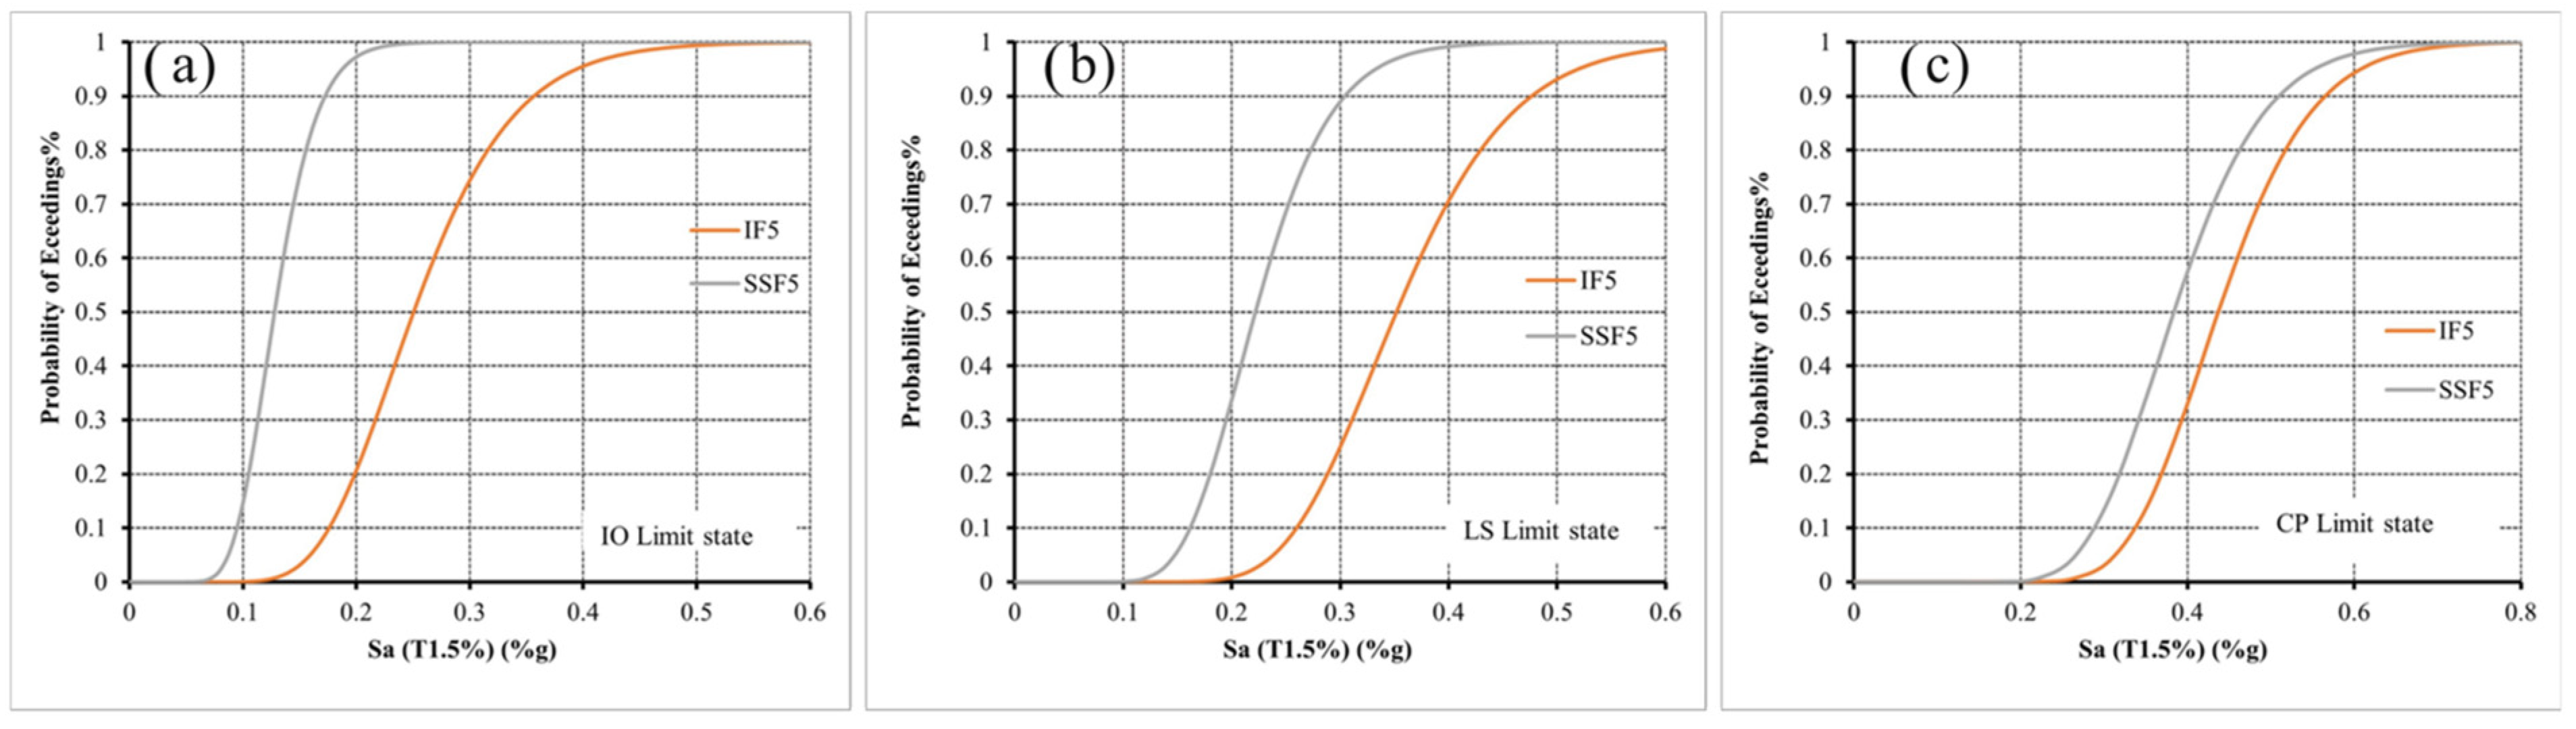
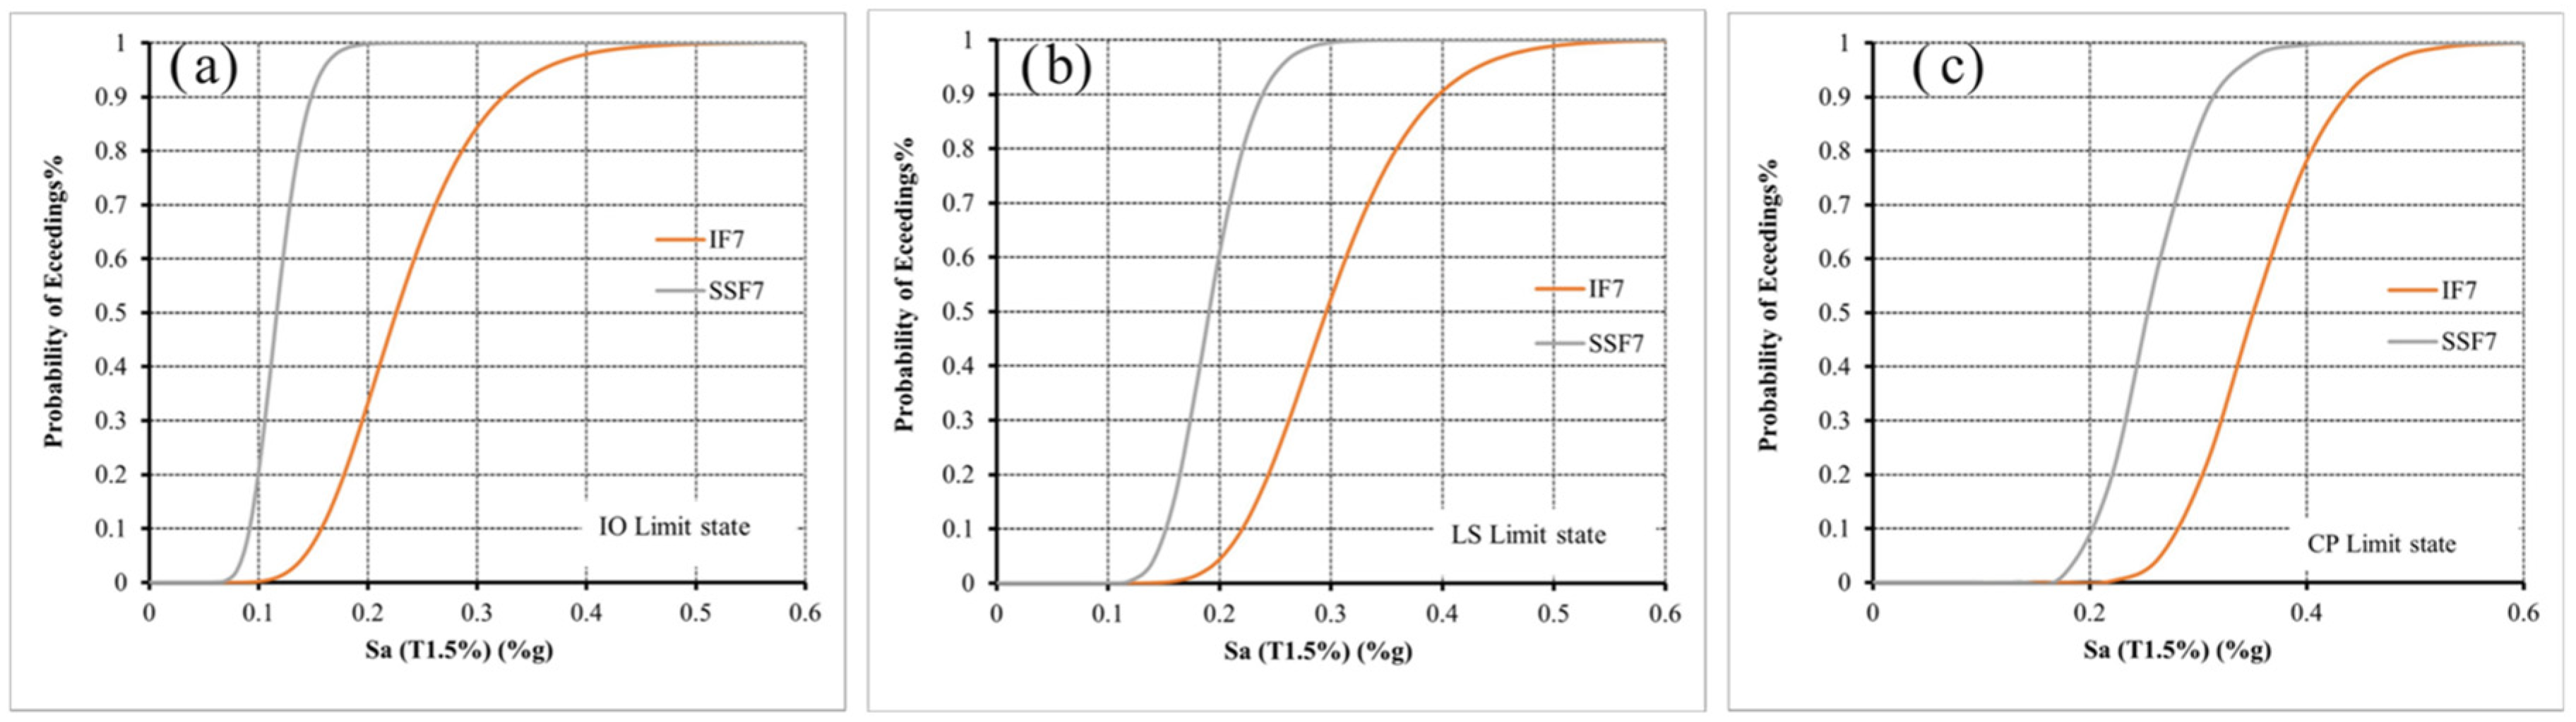
3.5.3. The Effect of the Soft-Story on the Performance

Figure 18 compares the fragility curves of IF3 and SSF3, with Table 11 showing the probability of exceeding performance levels at certain Sa values. At Sa = 0.4 g, the probability of reaching or exceeding the IO damage limit is 100% for SSF3 and 72% for IF3. The probability of exceeding the LS limit is 81% for SSF3 and 21% for IF3; for the CP limit, it is 6% for SSF3 and 3% for IF3. The IO limit occurs at Sa values smaller than 0.25 g for IF3 and 0.1 g for SSF3, while it is almost certain to happen when Sa exceeds 0.5 g for IF3 and 0.27 g for SSF3.
For LS, it will not occur if Sa is smaller than 0.3 g for IF3 and 0.2 g for SSF3, but it will almost certainly happen when Sa exceeds 0.7 g for IF3 and 0.45 g for SSF3. The CP limit will not occur if Sa is less than 0.37 g for IF3 and 0.35 g for SSF3, and it will almost certainly happen when Sa exceeds 0.9 g for IF3 and 0.7 g for SSF3. IF3 requires a higher Sa value to reach the CP damage limit compared to SSF3, with the maximum probability for CP reached at Sa > 1 g for IF3.
Figure 18. Seismic fragility curves for 3-story (frame with soft-story and fully infilled frame) buildings for different limits states: (a) immediate occupancy (IO), (b) life safety (LS), (c) collapse prevention (CP).
Buildings 15 01336 g018
Table 11. The probability of exceeding performance levels at certain Sa for 3-story buildings.
Sa
(%g)
IOLSCP
SSF3IF3SSF3IF3SSF3IF3
0000000
0.10.0100000
0.20.6800.02000
0.30.980.130.380.0100
0.410.720.810.210.060.03
0.510.970.960.650.340.2
0.6110.990.910.70.5
0.71110.990.910.75
0.811110.980.9
0.9111110.97
1111110.99
Figure 19 compares the fragility curves of IF5 and SSF5, with Table 12 showing the probability of exceeding performance levels at various Sa values. At Sa = 0.3 g, the probability of exceeding the IO limit is 100% for SSF5 and 74% for IF5, the LS limit is 89% for SSF5 and 25% for IF5, and the CP limit is 13% for SSF5 and 3% for IF5.
The IO limit is unlikely for IF5 if Sa < 0.15 g and SSF5 if Sa < 0.08 g, but becomes almost certain at Sa > 0.42 g for IF5 and 0.08 g for SSF5. The LS limit is unlikely for IF5 if Sa < 0.2 g and SSF5 if Sa < 0.15 g, but almost certainly at Sa > 0.55 g for IF5 and 0.3 g for SSF5. The CP limit occurs when Sa > 0.6 g for IF5 and 0.25 g for SSF5.
The CP limit reaches its maximum at Sa = 0.7 g for SSF5 and 0.8 g for IF5, indicating that IF5 requires a higher Sa to reach the CP damage limit.
Table 12. The probability of exceeding performance levels at certain Sa for 5-story buildings.
Sa
(%g)
IOLSCP
SSF5IF5SSF5IF5SSF5IF5
0000000
0.10.1500000
0.20.970.210.340.0100
0.310.740.890.250.130.03
0.410.960.990.710.570.33
0.510.9910.930.880.75
0.61110.990.980.94
0.7111110.99
0.8111111
0.9111111
1111111
Figure 19. Seismic fragility curves for 5-story (frame with soft-story and fully infilled frame) buildings for different limits states: (a) immediate occupancy (IO), (b) life safety (LS), (c) collapse prevention (CP).
Buildings 15 01336 g019
Figure 20 compares the fragility curves of IF7 and SSF7, with Table 13 showing the probability of exceeding performance levels at various Sa values. At Sa = 0.3 g, the probability of exceeding the IO limit is 100% for SSF7 and 84% for IF7, the LS limit is 100% for SSF7 and 52% for IF7, and the CP limit is 84% for SSF7 and 18% for IF7.
The IO limit is unlikely for IF7 if Sa < 0.13 g and SSF7 if Sa < 0.08 g, but becomes almost certain at Sa > 0.4 g for IF7 and 0.1 g for SSF7. The LS limit is unlikely for IF7 if Sa < 0.17 g and SSF7 if Sa < 0.13 g, but it is almost certain at Sa > 0.45 g for IF7 and 0.25 g for SSF7. The CP limit occurs when Sa > 0.45 g for IF7 and 0.32 g for SSF7.
The CP limit reaches its maximum at Sa = 0.4 g for SSF7 and 0.6 g for IF7, showing that IF7 requires a higher Sa to reach the CP damage limit. These results indicate that buildings with a soft story have a higher probability of exceeding damage limits, with the soft story causing damage limits to occur at smaller Sa values compared to fully infilled frames. Thus, buildings with a soft story perform worse than those with fully infilled frames, emphasizing the important role of the soft story in structure behavior and fragility.
Table 13. The probability of exceeding performance levels at certain Sa for 7-story buildings.
Sa
(%g)
IOLSCP
SSF7IF7SSF7IF7SSF7IF7
0000000
0.10.2100000
0.210.330.610.040.080
0.310.8410.520.840.18
0.410.9810.9110.78
0.51110.9910.98
0.6111111
0.7111111
0.8111111
0.9111111
1111111
Figure 20. Seismic fragility curves for 7-story (frame with soft-story and fully infilled frame) buildings for different limits states: (a) immediate occupancy (IO), (b) life safety (LS), (c) collapse prevention (CP).
Buildings 15 01336 g020

4. Conclusions

According to the research aim of conducting a seismic assessment and developing seismic fragility curves for residential RC buildings, this study investigated the nonlinear seismic performance of low and mid-rise reinforced concrete buildings with varying heights, infill wall configurations, and soft-story irregularities through Incremental Dynamic Analysis (IDA) and fragility assessment. The key findings are summarized as follows:
  • As building height increases, structures become more susceptible to damage under lower spectral acceleration (Sa) values. For instance, in bare-frame buildings (BF), the probability of exceeding the Collapse Prevention (CP) limit at Sa = 0.3 g rises from 11% in BF3 to 97% in BF7. Similar trends are observed for fully infilled frames (IF) and soft-story frames (SSF), indicating that taller buildings exhibit lower damage thresholds and higher fragility.
  • Infill walls significantly improve seismic performance by increasing lateral stiffness and reducing inter-story drifts. For example, at Sa = 0.4 g, the probability of exceeding CP in BF3 is 47%, while it drops to only 3% in IF3. Similarly, BF5 and IF5 show CP exceedance probabilities of 73% and 33%, respectively. This demonstrates that infill walls can delay structural damage and collapse under seismic loading.
  • The soft story notably weakens seismic resilience, concentrating damage in the first story. In SSF7, the probability of exceeding CP at Sa = 0.4 g reaches 100%, in contrast to 78% in IF7 and 97% in BF7. The soft-story effect also leads to higher inter-story drift ratios at the lower levels, posing a critical failure risk.
  • IDA curves show structures enter nonlinear behavior at moderate Sa levels and may exhibit hardening or softening responses. Buildings subjected to the Oroville earthquake exhibit higher IM values before the collapse, while Parkfield results in earlier failure. The IF3 building showed the most robust seismic response among all typologies.
  • Across all configurations, the immediate occupancy (IO), life safety (LS), and collapse prevention (CP) states were reached at progressively lower Sa values with increasing building height and the presence of soft stories. For example, BF7 reached CP at Sa ≈ 0.28 g, IF7 at 0.45 g, and SSF7 at just 0.32 g.
Overall, the study emphasizes the critical importance of infill wall configurations and height in seismic design. Incorporating infill walls and avoiding soft-story mechanisms effectively reduce seismic vulnerability and enhance structural resilience under strong ground motions.
Future seismic vulnerability studies should consider structural irregularities in plan and elevation and investigate various infill wall materials. Given the limited data on RC buildings in Yemen, experimental tests such as cyclic and shaking table analyses are essential to evaluate bare, fully infilled, and soft-story frames under local construction conditions. The resulting fragility curves would facilitate seismic loss estimations for residential RC buildings, thereby supporting risk reduction efforts.

Author Contributions

Conceptualization, B.L.; investigation, A.A.R.A., L.L. and B.L.; validation, A.A.R.A., B.L., W.B. and F.M.A.A.-D.; resources, L.L.; writing—original draft preparation, A.A.R.A.; writing—review and editing, A.A.R.A., L.L. and B.L.; project administration, L.L.; funding acquisition, L.L. All authors have read and agreed to the published version of the manuscript.

Funding

This research received no external funding.

Data Availability Statement

The original contributions presented in the study are included in the article; further inquiries can be directed to the corresponding author.

Conflicts of Interest

The authors declare that they have no conflicts of interest.

References

  1. Lemenkova, P. Seismicity in Yemen and the Gulf of Aden in a Geological Context. Rev. RISCURI SI Catastr. 2021, 28, 43–57. [Google Scholar] [CrossRef] [PubMed]
  2. Sultan, B. Modern/Traditional Buildings in Yemen and Sustainability. In Proceedings of the First Engineering Conference of Yemeni Architecture and the Challenges of the Age—Aden University, Aden, Yemen, 28–30 January 2008; pp. 1–10. [Google Scholar]
  3. Alwathaf, A.H. Structural Condition Assessment and Retrofit of Reinforced Concrete Columns. Acad. J. Sci. CD-ROM 2014, 3, 85–97. [Google Scholar]
  4. Pavel, F. Collapse assessment for code-conforming reinforced concrete frame structures in Romania. Front. Built Environ. 2018, 4, 50. [Google Scholar] [CrossRef]
  5. De Risi, M.T.; Di Domenico, M.; Manfredi, V.; Terrenzi, M.; Camata, G.; Mollaioli, F.; Noto, F.; Ricci, P.; Franchin, P.; Masi, A.; et al. Modelling and seismic response analysis of Italian pre-code and low-code reinforced concrete buildings. Part I: Bare frames. J. Earthq. Eng. 2023, 27, 1482–1513. [Google Scholar] [CrossRef]
  6. De Risi, M.T.; Di Domenico, M.; Manfredi, V.; Terrenzi, M.; Camata, G.; Mollaioli, F.; Noto, F.; Ricci, P.; Franchin, P.; Masi, A.; et al. Modelling and seismic response analysis of Italian pre-code and low-code reinforced concrete buildings. Part II: Infilled frames. J. Earthq. Eng. 2023, 27, 1534–1564. [Google Scholar]
  7. Liel, A.B.; Haselton, C.B.; Deierlein, G.G. Seismic collapse safety of reinforced concrete buildings. II: Comparative assessment of nonductile and ductile moment frames. J. Struct. Eng. 2011, 137, 492–502. [Google Scholar] [CrossRef]
  8. Haselton, C.B.; Liel, A.B.; Deierlein, G.G.; Dean, B.S.; Chou, J.H. Seismic collapse safety of reinforced concrete buildings. I: Assessment of ductile moment frames. J. Struct. Eng. 2011, 137, 481–491. [Google Scholar] [CrossRef]
  9. Noh, N.M.; Tesfamariam, S. Seismic collapse risk assessment of code-conforming RC moment resisting frame buildings designed with 2014 Canadian Standard Association Standard A23.3. Front. Built Environ. 2018, 4, 53. [Google Scholar] [CrossRef]
  10. Arya, A.S.; Srivastava, L.S.; Gupta, S.P. Survey of Damages during the Dhamar Earthquake of 13 December 1982 in the Yemen Arab Republic. Bull. Seism. Soc. Am. 1985, 75, 597–610. [Google Scholar] [CrossRef]
  11. Hughes, R.; Collings, A. Seismic and Volcanic Hazards Affecting the Vulnerability of the Sana’a Area of Yemen. In The Archaeology of Geological Catastrophes; Geological Society of London: London, UK, 2000; Volume 171, pp. 355–372. [Google Scholar] [CrossRef]
  12. Zaid, H.A.H.; Jamaluddin, T.A.; Arifin, M.H. Overview of Slope Stability, Earthquakes, Flash Floods and Expansive Soil Hazards in the Republic of Yemen. Bull. Geol. Soc. Malays. 2021, 71, 71–78. [Google Scholar] [CrossRef]
  13. Al-masni, M.A. Earthquake Building Risk Assessment in Sana’a City, Yemen; Asian Disaster Reduction Center: Kobe, Japan, 2012; Volume 2012. [Google Scholar]
  14. Hueste, M.B.D.; Bai, J.W. Seismic Retrofit of a Reinforced Concrete Flat-Slab Structure: Part II—Seismic Fragility Analysis. Eng. Struct. 2007, 29, 1178–1188. [Google Scholar] [CrossRef]
  15. Agency, F.E.M.; Washington, D. Commentary for the Seismic Rehabilitation of Buildings (FEMA356); Federal Emergency Management Agency: Washington, CA, USA, 2000. [Google Scholar]
  16. Kappos, A.J.; Panagopoulos, G. Fragility Curves for Reinforced Concrete Buildings in Greece. Struct. Infrastruct. Eng. 2010, 6, 39–53. [Google Scholar] [CrossRef]
  17. Su, R.K.L.; Lee, C.L. Development of Seismic Fragility Curves for Low-Rise Masonry Infilled Reinforced Concrete Buildings by a Coefficient-Based Method. Earthq. Eng. Eng. Vib. 2013, 12, 319–332. [Google Scholar] [CrossRef]
  18. Ulrich, T.; Negulescu, C.; Douglas, J. Fragility Curves for Risk-Targeted Seismic Design Maps. Bull. Earthq. Eng. 2014, 12, 1479–1491. [Google Scholar] [CrossRef]
  19. EC2; Eurocode 2: Design of Concrete Structures. European Commitee for Standardization: Brussels, Belgium, 1992.
  20. EC8; Standardization for Eurocode 8: Design of Structures for Earthquake Resistance. European Committee for Standardization: Brussels, Belgium, 1998; Volume 3.
  21. Vamvatsikos, D.; Allin Cornell, C. Incremental Dynamic Analysis. Earthq. Eng. Struct. Dyn. 2002, 31, 491–514. [Google Scholar] [CrossRef]
  22. Chowdhury, S.; Banerjee, A.; Adhikari, S. Optimal Design of Inertial Amplifier Base Isolators for Dynamic Response Control of Multi-Storey Buildings. Int. J. Struct. Stab. Dyn. 2023, 23, 2350047. [Google Scholar] [CrossRef]
  23. Huang, Z.K.; Pitilakis, K.; Argyroudis, S.; Tsinidis, G.; Zhang, D.M. Selection of Optimal Intensity Measures for Fragility Assessment of Circular Tunnels in Soft Soil Deposits. Soil Dyn. Earthq. Eng. 2021, 145, 106724. [Google Scholar] [CrossRef]
  24. Kassem, M.M.; Nazri, F.M.; El-Maissi, A.M. The Influence of Slope Angle Variation on Structures Resting on Hilly Region Considering Soil–Structure Interaction Under Earthquake Loadings Using Capacity Curves and Probabilistic Approach. J. Earthq. Eng. 2024, 28, 1818–1836. [Google Scholar] [CrossRef]
  25. Raj, D.; Singh, Y.; Kaynia, A.M. Seismic Fragility Analysis of Coupled Building-Slope Systems. Earthq. Eng. Struct. Dyn. 2024, 53, 116–137. [Google Scholar] [CrossRef]
  26. Zhong, Z.; Shen, Y.; Zhao, M.; Li, L.; Du, X.; Hao, H. Seismic Fragility Assessment of the Daikai Subway Station in Layered Soil. Soil Dyn. Earthq. Eng. 2020, 132, 106044. [Google Scholar] [CrossRef]
  27. Jiang, J.; El Naggar, M.H.; Huang, W.; Xu, C.; Zhao, K.; Du, X. Seismic Vulnerability Analysis for Shallow-Buried Underground Frame Structure Considering 18 Existing Subway Stations. Soil Dyn. Earthq. Eng. 2022, 162, 107479. [Google Scholar] [CrossRef]
  28. Huang, Z.; Cheng, Y.; Zhang, D.; Yan, D.; Shen, Y. Seismic Fragility and Resilience Assessment of Shallowly Buried Large-Section Underground Civil Defense Structure in Soft Soils: Framework and Application. Tunn. Undergr. Space Technol. 2024, 146, 105640. [Google Scholar] [CrossRef]
  29. Valente, M. Seismic upgrading strategies for non-ductile plan-wise irregular R/C structures. Procedia Eng. 2013, 54, 539–553. [Google Scholar] [CrossRef]
  30. Valente, M.; Gabriele, M. Alternative retrofitting strategies to prevent the failure of an under-designed reinforced concrete frame. Eng. Fail. Anal. 2018, 89, 271–285. [Google Scholar] [CrossRef]
  31. ACI 318-02; Building Code Requirements for Structural Concrete and Commentary. American Concrete Institute: Farmington Hills, MI, USA, 2002.
  32. Seismosoft. SeismoStruct—A Computer Program for Static and Dynamic Nonlinear Analysis of Framed Structures; SeismoSoft: Pavia, Italy, 2020; Available online: http://www.seismosoft.com (accessed on 13 January 2025).
  33. SeismoSignal—A Computer Program for Signal Processing of Strong-Motion Data; ver.3.1.0; SeismoSoft: Pavia, Italy, 2004; Available online: http://www.seismosoft.com (accessed on 13 January 2025).
  34. Seismosoft. SeismoMatch, version 2.0.0; SeismoSoft: Pavia, Italy, 2012. Available online: http://www.seismosoft.com (accessed on 13 January 2025).
  35. Eniyew, T.; Asmare, A.; Dewulf, W. Yield strength and ductility analysis on steel reinforcing bars used in Ethiopian construction industry. In Advances of Science and Technology, Proceedings of the 8th EAI International Conference, ICAST 2020, Bahir Dar, Ethiopia, 2–4 October 2020; Proceedings, Part II 8; Springer International Publishing: Cham, Switzerland, 2021; pp. 302–314. [Google Scholar]
  36. Khan, N.M. Evaluation of Seismic Performance of RC Frame Structures by Pushover and Time History Analyses. Bachelor’s Thesis, Bangladesh University of Engineering and Technology, Dhaka, Bangladesh, 2013. [Google Scholar]
  37. Koupaei, A.E.; Saffari, H.; Ardakani, R.R. Investigating the Effect of Earthquake Duration on Concrete Structures by Analyzing the Frequency Content of Acceleration Time History. J. Rehabil. Civ. Eng. 2021, 9, 21–40. [Google Scholar] [CrossRef]
  38. Bhavnani, M.S.; Sheth, R.K. A Comparative Study of Seismic Performance of RC Frame-Wall Structures Designed as Per Various International Codes. In Symposium in Earthquake Engineering; Springer Nature: Singapore, 2023; Volume 329, pp. 195–217. [Google Scholar] [CrossRef]
  39. Loads, M.D. Minimum Design Loads and Associated Criteria for Buildings and Other Structures; American Society of Civil Engineers: Reston, VA, USA, 2017. [Google Scholar]
  40. Bariker, P.; Kolathayar, S. Dynamic Soil Structure Interaction of a High-Rise Building Resting over a Finned Pile Mat. Infrastructures 2022, 7, 142. [Google Scholar] [CrossRef]
  41. Ciaponi, C. Design Verification of a Displacement-Based Designed Three Dimensional Wall-Steel Frame Building. Master’s Thesis, European School for Advanced Studies in Reduction of Seismic Risk, Rose School, Pavia, Italy, 2008. [Google Scholar]
  42. Crisafulli, F.J. Seismic Behaviour of Reinforced Concrete Structures with Masonry Infills. Ph.D. Thesis, University of Canterbury, Christchurch, New Zealand, 1997. [Google Scholar]
  43. PEER Technical Report for the Ground Motion Database Web. Available online: http://peer.berkeley.edu/peer_ground_motion_database (accessed on 13 January 2025).
  44. Mohindra, R.; Nair, A.K.S.; Gupta, S.; Sur, U.; Sokolov, V. Probabilistic seismic hazard analysis for Yemen. Int. J. Geophys. 2012, 2012, 304235. [Google Scholar] [CrossRef]
  45. UBC97, Uniform Building Code; Council Code International: Washington, DC, USA, 1997.
  46. Du, X.; Jiang, J.; El Naggar, M.H.; Xu, C.; Xu, Z. Interstory Drift Ratio Associated with Performance Objectives for Shallow-Buried Multistory and Span Subway Stations in Inhomogeneous Soil Profiles. Earthq. Eng. Struct. Dyn. 2021, 50, 655–672. [Google Scholar] [CrossRef]
  47. Asgarkhani, N.; Kazemi, F.; Jankowski, R. Machine Learning-Based Prediction of Residual Drift and Seismic Risk Assessment of Steel Moment-Resisting Frames Considering Soil-Structure Interaction. Comput. Struct. 2023, 289, 107181. [Google Scholar] [CrossRef]
  48. Manos, G.C.; Katakalos, K.; Soulis, V.; Melidis, L. Earthquake Retrofitting of Soft-Story RC Frame Structures with RC Infills. Appl. Sci. 2022, 12, 11597. [Google Scholar] [CrossRef]
  49. Wang, F.; Zhao, K.; Zhang, J.; Yan, K. Influence of Different Types of Infill Walls on the Hysteretic Performance of Reinforced Concrete Frames. Buildings 2021, 11, 301. [Google Scholar] [CrossRef]
  50. Kazemi, F.; Mohebi, B.; Jankowski, R. Predicting the Seismic Collapse Capacity of Adjacent SMRFs Retrofitted with Fluid Viscous Dampers in Pounding Condition. Mech. Syst. Signal Process. 2021, 161, 107939. [Google Scholar] [CrossRef]
  51. Ruggieri, S.; Porco, F.; Uva, G.; Vamvatsikos, D. Two Frugal Options to Assess Class Fragility and Seismic Safety for Low-Rise Reinforced Concrete School Buildings in Southern Italy. Bull. Earthq. Eng. 2021, 19, 1415–1439. [Google Scholar] [CrossRef]
  52. Andreotti, G.; Lai, C.G. Use of Fragility Curves to Assess the Seismic Vulnerability in the Risk Analysis of Mountain Tunnels. Tunn. Undergr. Space Technol. 2019, 91, 103008. [Google Scholar] [CrossRef]
  53. FEMA356; Prestandard and Commentary for the Rehabilitation of Buildings. Fedral Emergency Management Agency: Washington, DC, USA, 2000.
Disclaimer/Publisher’s Note: The statements, opinions and data contained in all publications are solely those of the individual author(s) and contributor(s) and not of MDPI and/or the editor(s). MDPI and/or the editor(s) disclaim responsibility for any injury to people or property resulting from any ideas, methods, instructions or products referred to in the content.

