Article

A Numerical Investigation of the Performance of Damaged Concrete Barriers Under Sequential Vehicular Impacts

by
Ashesh Pokhrel
1,
Andrew D. Sorensen
2 and
Mohsen Zaker Esteghamati
1,*
1
Department of Civil & Environmental Engineering, Utah State University, Logan, UT 84322, USA
2
Department of Multidisciplinary Engineering, Texas A&M University, College Station, TX 77843, USA
*
Author to whom correspondence should be addressed.
Buildings 2025, 15(8), 1271; https://doi.org/10.3390/buildings15081271
Submission received: 6 March 2025 / Revised: 31 March 2025 / Accepted: 8 April 2025 / Published: 12 April 2025
(This article belongs to the Section Building Materials, and Repair & Renovation)

Abstract

Concrete median barriers are prone to damage from low-velocity impacts. However, there is a limited understanding of how damage from initial impacts affects barriers’ long-term performance and whether they maintain safe continued service or must be replaced. Therefore, this paper evaluates the performance of the concrete barriers under sequential low-velocity impact using finite-element analysis. Crash test simulations were performed by impacting the concrete barrier twice with an 80,000 lb (36-ton) tractor-trailer at a target impact velocity and angle. The first impact’s velocities varied between 30 mph (48 kmph) and 54 mph (87 kmph) at 10°, 15°, and 20° crash angles, and the damaged barrier was subsequently subjected to the second impact conforming to the American Association of State Highway and Transportation Officials’ (AASHTO) Manual for Assessing Safety Hardware (MASH) for Test Level 5 criteria (i.e., representative velocity of 52.7 mph (85 kmph) at 15°). Therefore, a total of 78 impact simulations were conducted, and statistical analysis was performed to investigate the relationship between the peak impact forces of the first and second impacts and the crash angle and velocity across distinct phases of the crash simulation and over the entire crash history. The results show that while the peak impact force of the first impact was linearly related to both velocity and angle, the maximum impact force at the second impact did not follow the same trend. However, when considering the localized peak forces in each phase of the crash, the peak forces from the later stages of the second impact (i.e., rebound and final interaction phases) were highly correlated with the initial impact’s velocity and angle, substantially reducing the barrier’s capability to resist vehicular impact loads. In particular, for initial velocities above 46 mph (74 kmph) at angles of 15° and 20°, barriers formed shear cracks traversing across their cross-section, which resulted in excessive fragmentation during the second impact and consequent failure to meet the MASH criteria in terms of structural adequacy.

1. Introduction

According to the National Highway Traffic Safety Administration (NHTSA), 9.3% of fatal vehicle crashes in the USA in 2021 were due to large trucks over 10,000 lb (5 tons), where tractor-trailers accounted for 60% of these crashes (i.e., 5.6% of all fatal crashes) [1]. The effective placement of barriers can reduce these incidents by preventing head-on collisions and protecting pedestrians, cyclists, and construction crews. Nevertheless, these barriers should be evaluated for their crashworthiness (i.e., the ability to redirect a vehicle safely without significant structural degradation) to ensure that they meet adequate safety standards. The American Association of State Highway and Transportation Officials’ (AASHTO) Manual for Assessing Safety Hardware (MASH) mandates full-scale crash tests to evaluate barrier performance, but conducting these tests is costly and logistically challenging, particularly for large vehicles such as tractor-trailers, making it impractical to test every barrier configuration [2]. Therefore, finite-element analysis (FEA) has been proposed to evaluate the crashworthiness of barriers, leading to improved designs that meet safety standards while reducing development costs and time before full-scale physical testing is carried out [3,4].
Roadside rigid safety barriers are broadly categorized into portable concrete barriers (PCBs) and fixed concrete barriers. PCBs are designed for temporary deployment and can be relocated as needed, whereas fixed barriers are permanently installed and anchored into a position. Both barrier types are classified according to AASHTO’s MASH into different test levels (TL), including TL-1 through to TL-6, based on their capability to safely redirect or contain vehicles of varying sizes and weights under specified impact conditions. Lower test levels (e.g., TL-3) primarily address smaller passenger vehicles such as cars and pick-up trucks, while higher test levels (e.g., TL-5) are designed to safely redirect heavier vehicles, including tractor-trailers and large trucks [5,6,7]. Barriers are also used for various purpose; for example, Figure 1a represents an 813 mm (32 in)-tall PCB generally used to contain small vehicles in construction zones, whereas Figure 1b represents a cast-in-place, fixed, single-sloped, 1372 mm (54 in) barrier used to protect bridge piers.
Extensive research has been conducted on new barrier designs and the crashworthiness of existing ones, aided by guidelines worldwide, including the European Standard EN 1317—Road Restraint Systems in Europe and Australian/New Zealand Standard AS/NZS 3845—Road Safety Barrier Systems [10]. However, there is a significant gap in understanding the impact behavior of damaged barriers currently in service. In real-world scenarios, barriers might face various types of non-destructive low-velocity impacts, such as by vehicles skidding on icy roads or by snow removal equipment [11]; nonetheless, the extent of resulting damage varies. For example, full-scale crash tests performed using a 42 in (1067 mm)-tall longitudinal barrier with a 22,000 lb (10 tons) truck and a 45 in (1143 mm)-tall median barrier and an 80,000 lb (36-ton) tractor-trailer resulted in only minor esthetic damage, suggesting that low-velocity impacts cause minimum damage to barriers [12,13]. Such observations often lead to a dilemma for the Departments of Transportation (DOTs) and relevant authorities in deciding whether to repair or replace barriers. In a survey conducted by the Texas Transportation Institute, in more than 27 states in the US in 2020, only 13 DOTs have concrete barrier evaluation guidelines, and eight states have repair guidelines [14]. While repair and evaluation guidelines mostly focus on PCBs, only a few DOTs, such as the Pennsylvania DOT, have evaluation and repair guidelines for permanent barriers [14]. As shown in Figure 2, the framework for barrier evaluation and acceptance created by most DOTs is based on the measurement of concrete cracks and spalls and reinforcement exposure. For example, the barriers in Figure 2a,b are unacceptable because long cracks travel across the barrier. In contrast, the barrier in Figure 2c shows only local crushing and is deemed acceptable [15].
Low-velocity impacts from vehicles can cause various damage patterns to barriers, ranging from minor concrete spalling to hairline cracks, raising safety concerns regarding their capacity to withstand future impact loads. However, the existing literature is limited in evaluating the crashworthiness of concrete barriers damaged by low-velocity impacts. Dobrovolny et al. performed a MASH test on two different damaged F-shaped PCB installations containing cracks and spalling on the concrete and showed that the damaged PCBs met the MASH requirements for safety [16]. They subsequently performed FE analysis on the damaged F-shaped and single-sloped PCB installation, where concrete spalling was incorporated in the model by removing the concrete elements, as shown in Figure 3a,b. Although the size of these removed elements exceeded the DOT guidelines (i.e., barriers are unacceptable if spalling is 12 in (305 mm) or larger than the clear cover of concrete), the barriers were observed to adhere to the MASH criteria even at higher damage levels [17]. While existing numerical studies often use the element removal technique to account for the reduction in the overall strength of damaged barriers, this method does not account for crack propagation, the localized crushing of concrete, and reinforcement de-bonding, which occur in low-velocity impacts [18,19]. Performing repeated pendulum impacts on normal and rubberized concrete F-shaped barriers showed that repeated impacts cause a progressive decrease in the peak impact at low velocities [20]. Additionally, the displacement field contours for normal concrete barriers indicated primarily localized damage, where the impact region was separated from its surroundings [20].
Although the existing literature on the repeated impact of reinforced concrete (RC) barriers is limited, the dynamic response and failure mechanisms of RC slabs under low-velocity repeated impacts have been widely investigated using both experimental tests and FEAs. Overall, these studies have suggested that repeated impacts cause cumulative damage, characterized by reduced peak impact forces and increased displacements [21,22]. Recently, energy-based analysis has been proposed to investigate the dynamic responses and progressive damage mechanisms of RC structures under repeated low-velocity impacts. This approach includes tracking internal energy changes and energy dissipation during impacts and suggests that repeated low-velocity impacts on concrete structures reduce energy absorption capacity, which can be correlated with energy-based metrics, primarily internal energy [23,24]. Lastly, several authors discussed the pseudo-shakedown phenomenon, where ductile metal plates under repeated mass impacts stabilize in permanent displacement after initial plastic deformation, primarily elastically absorbing subsequent impacts [25]. Similar behavior has been observed with steel plates under ice [26] and cladding under hail [27]. Among the studies focused on the energy analysis of barriers, Fang et al. employed internal energy as a key metric to assess energy absorption during impact and observed that a barrier with greater erosion and damage absorbed more internal energy. Nevertheless, these energy-based studies are predominantly limited to scenarios involving single-impact scenarios [28].
This study aimed to evaluate the response of cast-in-place, fixed, damaged concrete barriers under sequential impacts and, subsequently, their compliance with MASH standards for continued service. A TL-5 concrete barrier was specifically selected for this representative study due to its rigorous design standards aimed at effectively redirecting heavy vehicles, such as tractor-trailers [29]. The TL-5 barrier is a vertical-faced design specifically intended to reduce the risk of vehicle rollover by preventing vehicle climbing and enhancing vehicle stability during impact, thus ensuring robust performance and structural adequacy in high-impact scenarios typical of highway environments. The objectives of this study are as follows: (1) to investigate the performance of a median Test Level 5 (TL-5) concrete barrier under a wide range of low-velocity impact scenarios using numerical modeling techniques, (2) to incorporate an energy-based perspective into the analysis of sequential impact scenarios with barriers, and (3) to understand whether damaged barriers can retain their functionality for subsequent impacts based on MASH guidelines. Therefore, this study addresses a critical gap in the literature regarding the performance of damaged barriers, often dismissed as causing minimal damage. The results of this study will improve the current practices in the treatment of damaged barriers under low-velocity impacts for future impact scenarios, providing a computational basis for decisions related to the necessity of repair activity or replacement. Unlike previous studies primarily focusing on single impacts on undamaged barriers, this research’s novelty lays in its comprehensive analysis of sequential impacts on concrete barriers, particularly addressing the knowledge gap in understanding barriers that sustain minor to moderate damage during initial impacts.
This paper is organized as follows: Section 2 provides detailed descriptions of the FEM development and validation for accurately simulating sequential impacts on concrete barriers. Section 3 presents a sensitivity analysis of the phases and dynamics of tractor-trailer collisions with barriers with respect to initial impact angle and velocity. This section provides the results from the numerical simulations regarding damage patterns, peak impact forces, and the energy-based evaluation of barrier performance. Lastly, Section 4 summarizes this paper’s findings and discusses their significance for practical applications.

2. Finite-Element Model Development and Validation

This section discusses the development and validation of a finite-element model (FEM) for the tractor-trailer, concrete model, and impact simulation setup.

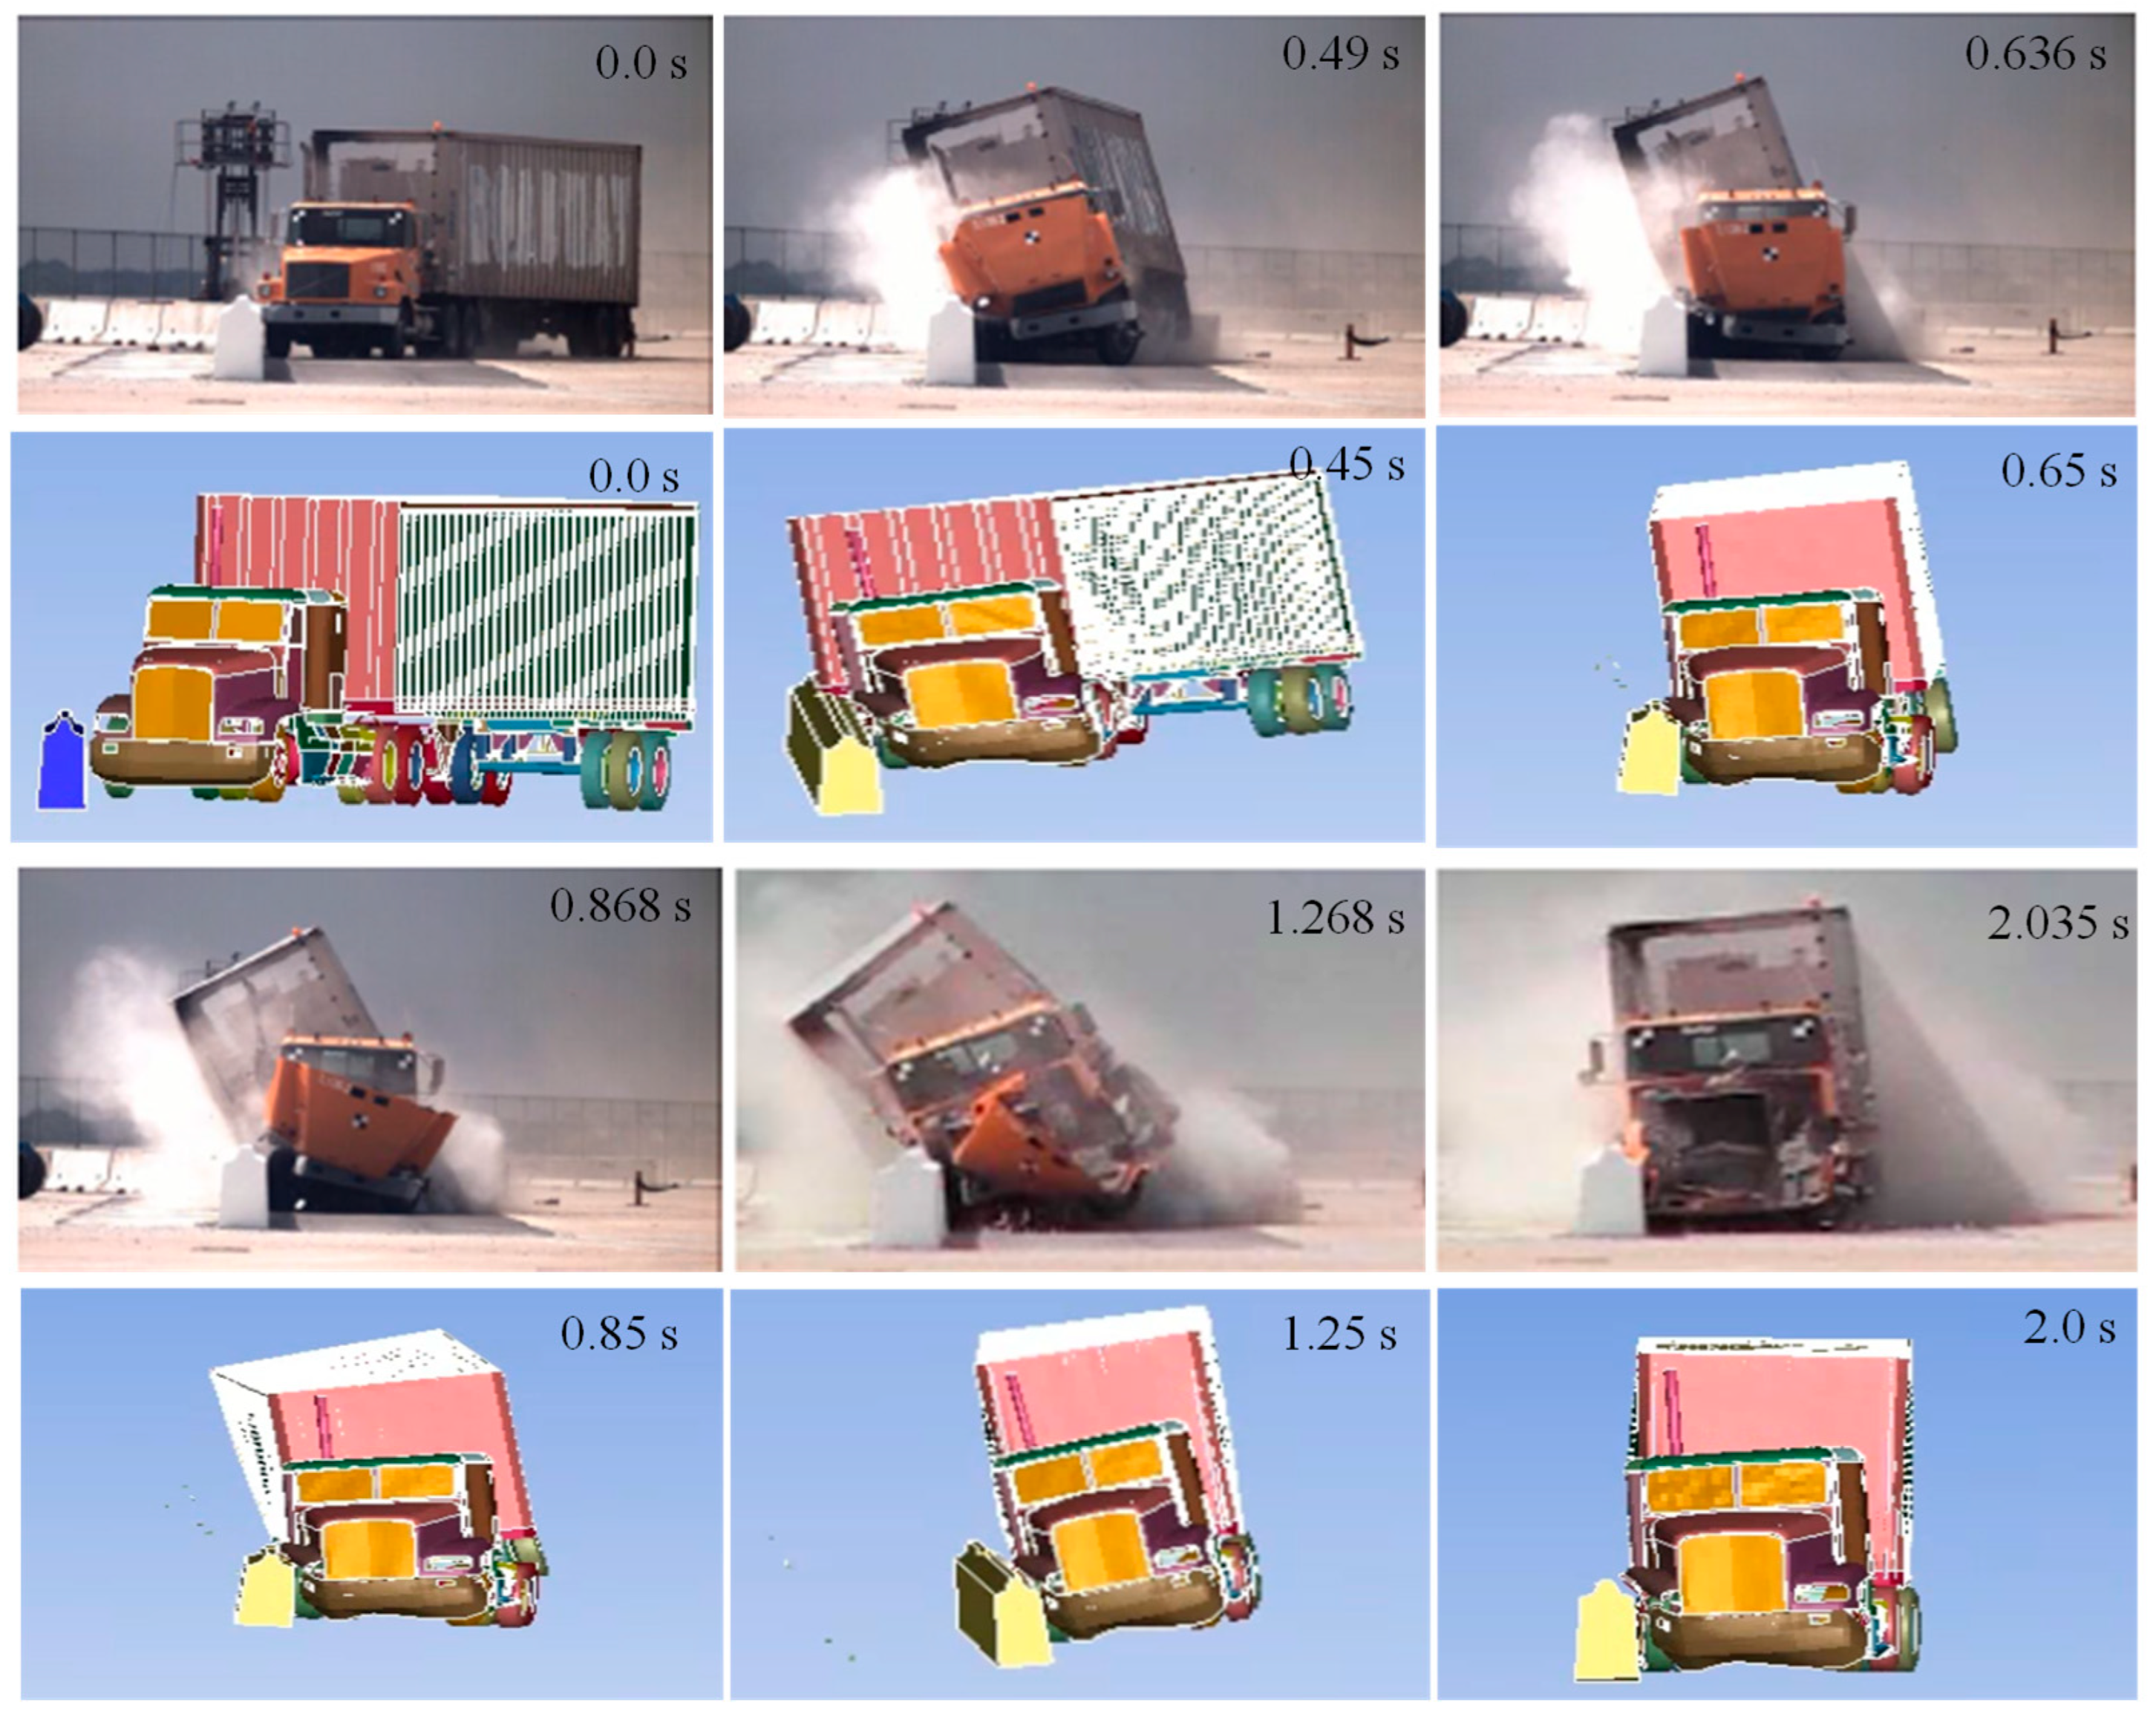
2.1. Tractor-Trailer Model Validation

The tractor-trailer model used in this study was developed by the National Crash Analysis Center (NCAC) and made publicly available by Oak Ridge National Lab [30]. This tractor-trailer model was selected because it closely matched the specifications of a tractor-trailer used in a real crash test (i.e., Test No. 429730-2) performed at the Texas Transportation Institute [31]. As shown in Figure 4a, in this experiment, a tractor-trailer weighing 80,000 lb (36 tons) crashed into an instrumented rigid pier, and the extorted impact forces were measured. The pier diameter and height were 36 in (914.40 mm) and 14 ft (4.27 m). The pier was supported from 2 ft (0.61 m) away at each end with fixed support instrumented with load cells which measured the support reaction force. The total impact force was measured by summation of the measured reaction forces.
The tractor-trailer FEM shown in Figure 4b was calibrated to match the measured impact forces from the experiment. The calibration process involved re-meshing the quad elements of a channeled shell section to triangular elements for the part that connects the fifth wheel of the tractor to the frame rails. In addition, the material formulation of this part was changed from *MAT024-Piecewise-Linear-Plasticity to *MAT123-Modified_Piecewise_Linear_Plasticity to incorporate strain failure. Figure 4c compares the impact force obtained from the FEM at the contact surface between the tractor-trailer and the rigid pier to the contact force measured by the load cell in the experiment. The peak impact force obtained from the simulation was 4355 KN, compared to 4241 KN from the experiment, with only a 2.7% difference. It should be noted that the contact force data from the experiment were smoothed using the Society of Automotive Engineers (SAE) 60 filter in LS-DYNA [32].

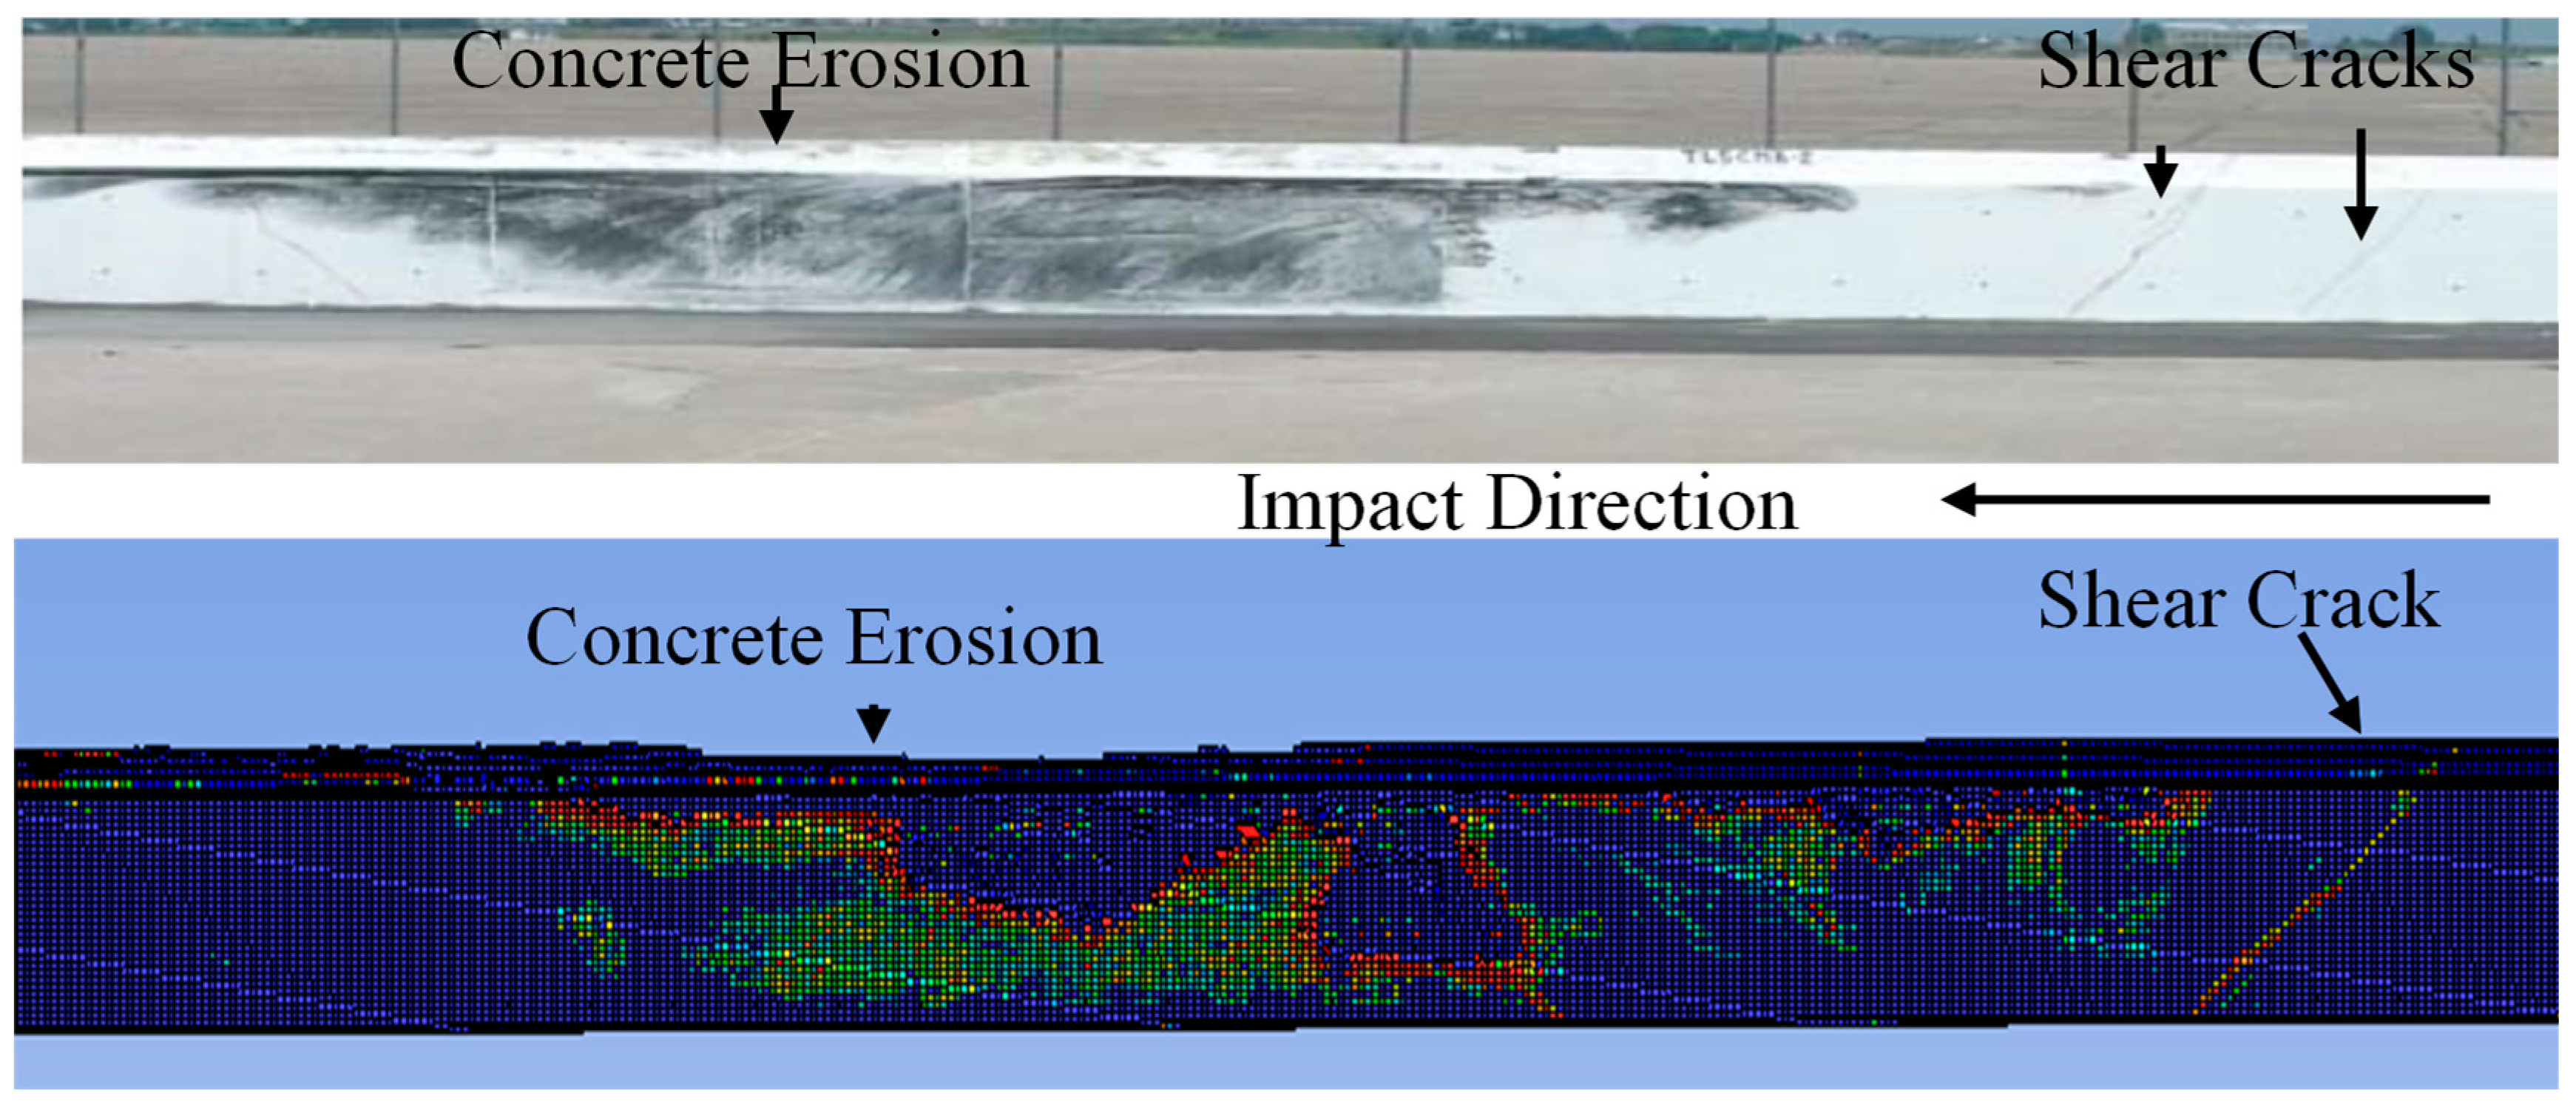
2.2. Reinforced Concrete Model Validation for Sequential Impact

Previous research has studied impact forces and resulting damages in RC members during impacts [33,34]. Therefore, this section details how we validated concrete’s material behavior under repeated impacts using an experiment by Othman et al. [22]. They conducted repeated drop-weight impact tests on six 1950 mm × 1950 mm × 100 mm high-strength RC slabs, where the slabs were subjected to repeated impacts by a 475 kg drop hammer released from a height of 4.15 m. In addition, the slabs were supported at the corners with a tie-down steel frame. Among the six slabs, this study used the results of a doubly reinforced slab with 10 M bars with 210 mm spacing at the top and 10 M bars with 100 mm spacing at the bottom to validate the sequential impact.
The concrete was modeled using eight-noded solid elements with a continuous surface cap model, *MAT-159_CSCM, which requires density, compressive strength, and the average aggregate size to generate detailed material properties based on CEB-FIP Model Code 1990 [34]. The reinforcement was modeled by single-point integrated Hughes–Liu beam element using *MAT-24-Linear_Piecewise_Plasticity. The main inputs for this material model were Young’s modulus (E), yield stress (σy), and the stress–strain curve. The piecewise feature allowed the stress–strain curve to be defined in multiple linear segments, enabling the accurate modeling of strain-hardening or other nonlinear behaviors beyond the yield limit. The rebar in the concrete was modeled using the *Constrained_Beam_In_Solid method. A two-stage simulation process was performed, where the hammer was dropped on the slab, causing damage to the rear face of the slab where eroded elements and effective plastic strain caused the formation of cracks (Figure 5a). The deformed geometry and final stresses and strains in the concrete solids and reinforcement beams were then exported using the *INTERFACE_SPRINGBACK feature in LS-DYNA [35,36]. As shown in Figure 5b, during this second stage of the simulation, more damage was observed in the slab. Figure 5c,d compare the impact forces between the experiment and the simulation, where the peak force from the simulation and experiment show a 4% (1091 KN versus 1050 KN) and 12% difference (739 KN versus 830 KN) for the first and second impact, respectively. As shown in Figure 5, the simulation captured general trends and magnitudes for both the first and sequential impacts.

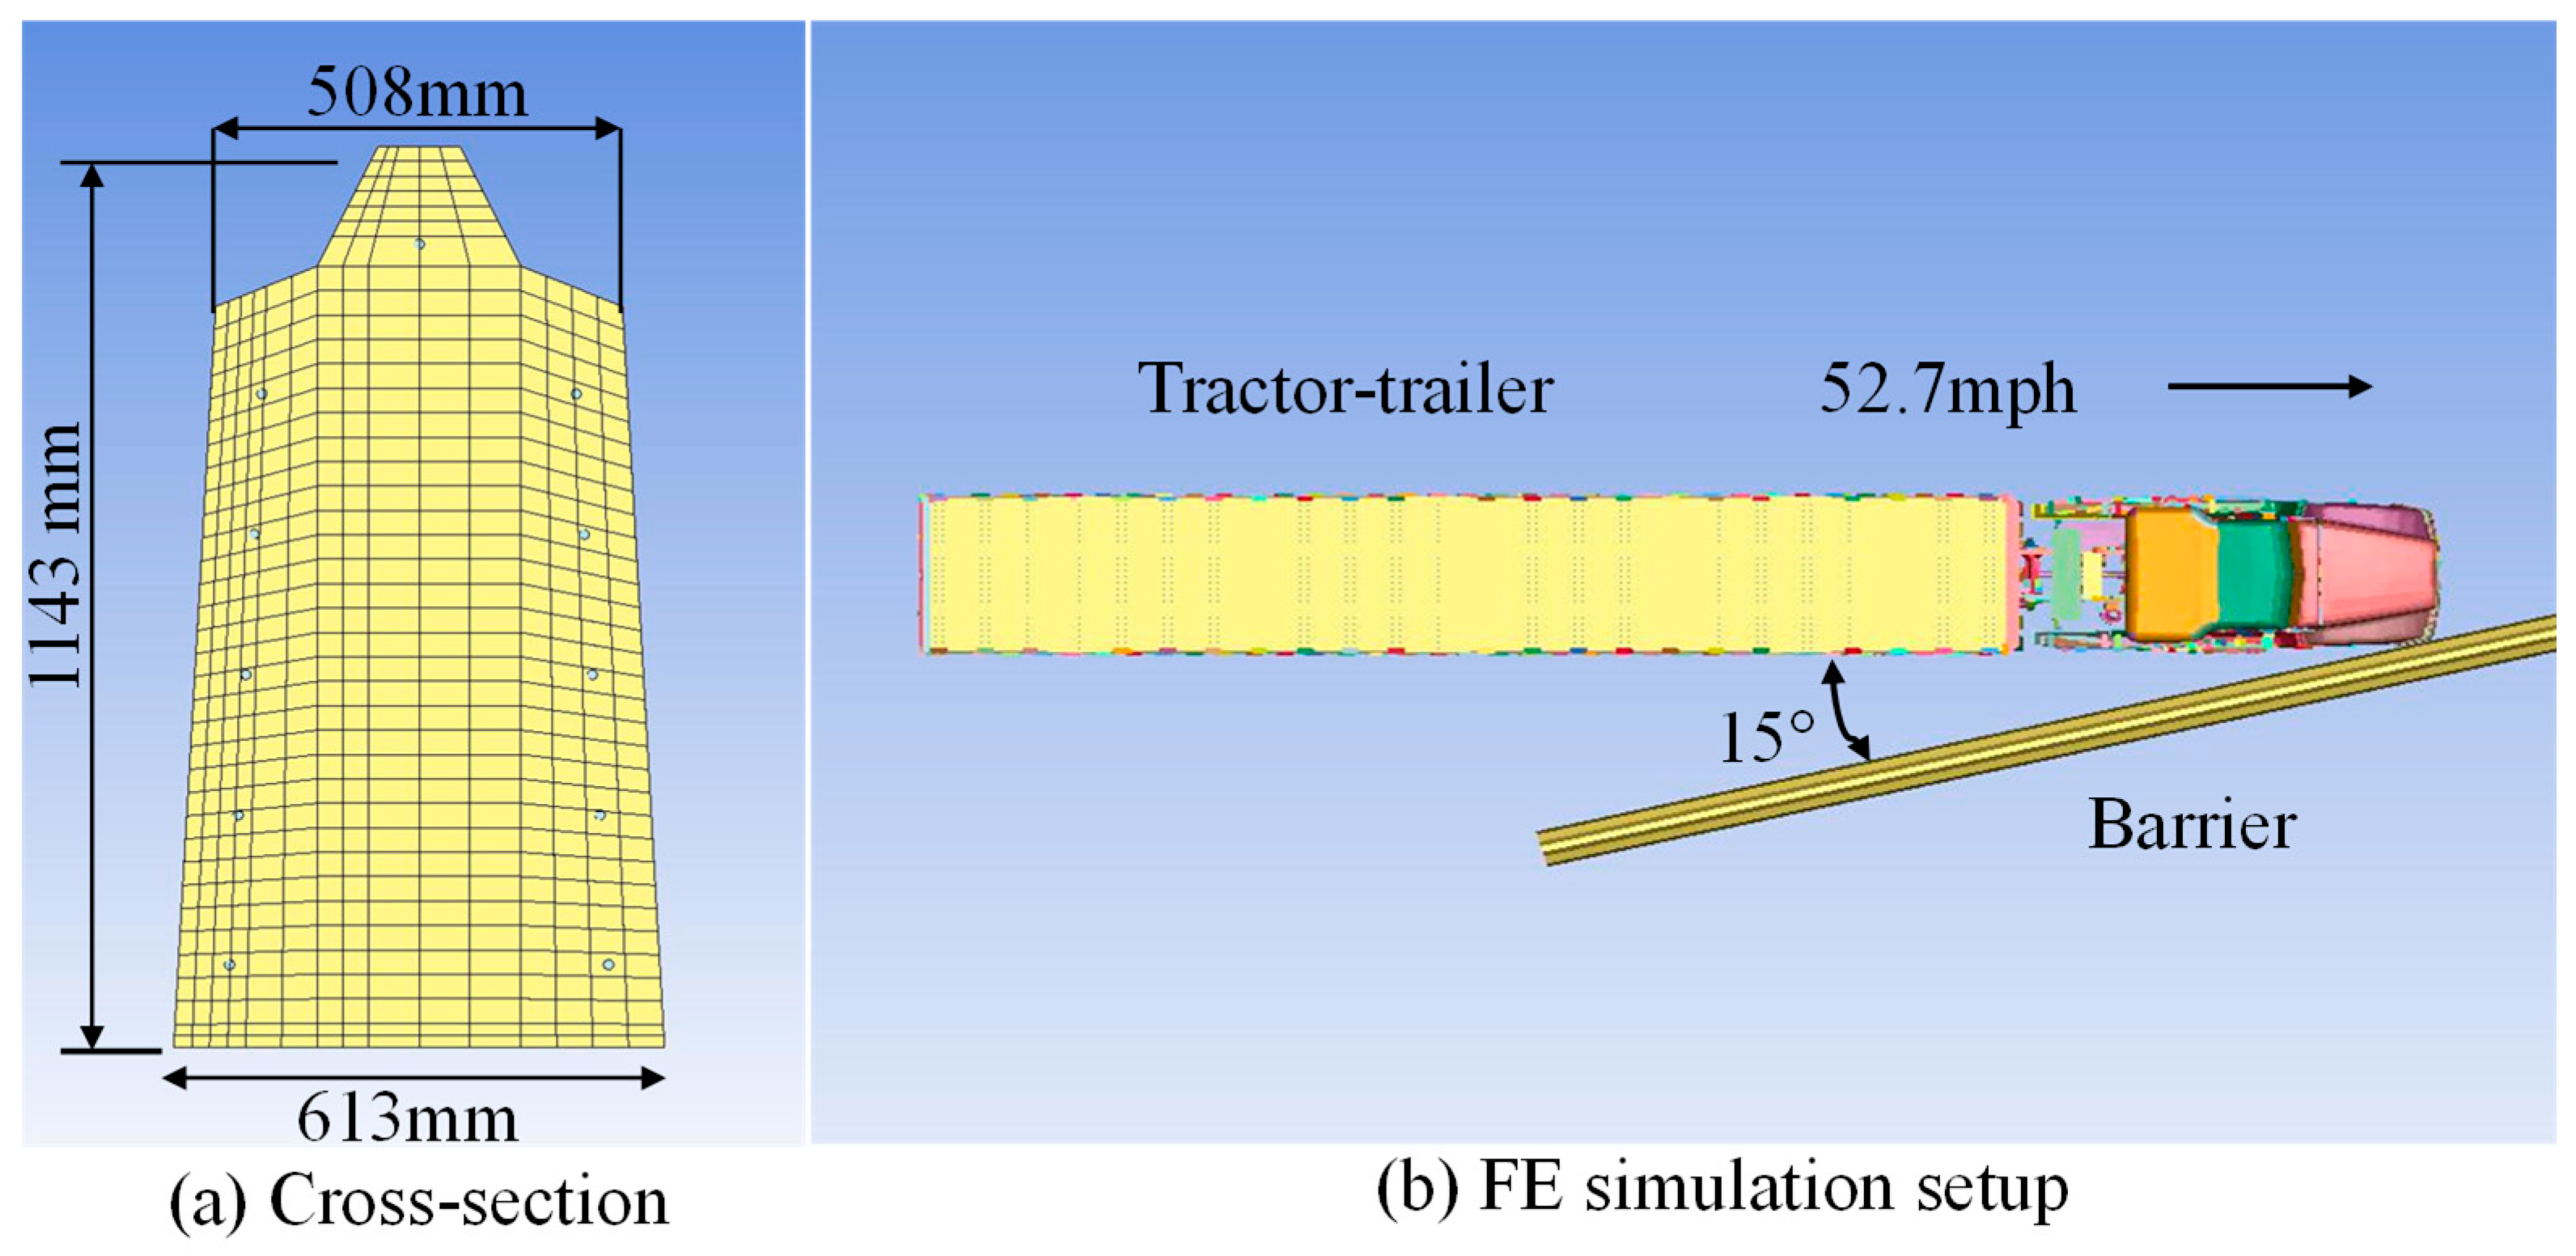
2.3. Modeling Tractor-Trailer Impact on Concrete Barrier

A TL-5 concrete median barrier was selected in this study to investigate the effect of sequential impact. TL-5 is a vertical-faced barrier designed by the Midwest Roadside Safety Facility (MWRSF) to reduce vehicle rollovers [29]. The geometry of the TL-5 barrier, with its vertical and sloped faces, plays a critical role in how impact loads are transferred and distributed. Sloped surfaces cause vehicle rollovers, while vertical-shaped barriers may cause concentrating forces. The designed ultimate capacity of the barrier is 211 kips (941 KN) and it is designed to redirect MASH TL-5 vehicles [27]. For impact analysis, a 200 ft (61 m) section of the barrier was used to crash an 80,000 lb (36-ton) tractor-trailer as described in Section 2.1, where the barrier was 45 in (1143 mm) tall, with 42 in (1067 mm) above the road surface, while the bottom 3 in (76 mm) was covered with asphalt keyways, as per the NCHRP Report 350 criteria [29]. At each end section, a 12 ft (3.65 m)-long structure was constructed on an independent concrete foundation, while the remaining mid-section was anchored on compacted soil with dowel bars. The designed barrier’s ultimate strength capacity was 1000 KN.
A FEM of the TL-5 barrier with a 175 ft (53,349 mm) length was developed. The concrete was modeled with eight-nodded solid elements with *MAT-159_CSCM material in LS-DYNA. The rebars and stirrups were also modeled with a single-point integrated Hughes-Liu beam element using *MAT-24_Linear_ Piecewise_ Plasticity material. As shown in Figure 6a, the size of the concrete elements along the barrier length was 1.49 in (38 mm), whereas the same element size varied between 1.10 in (29 mm) in less critical areas and 0.55 in (14 mm) at the bottom and the top of the barrier along the height. Lastly, the elements’ size along the cross-section varied where the size of the elements that came directly in contact with the tractor-trailer was 0.80 in (21 mm). A rigid wall plane was used to model the ground level at 3 in (75 mm) from the bottom of the barrier. Fixed boundary conditions were applied at the base of the barrier to simulate the restraint effects provided by the concrete footers at the end sections, asphalt keyways, and dowel bars. The nodes of the barriers were exempted from the rigid wall section so that no boundary conditions were applied at the road surface level.
To ensure the accuracy of the FEM setup (Figure 6b), a simulation was performed to measure the impact of a 1991 White GMC Tractor with a 1988 Pines 48′ trailer crashed into the modeled TL-5 barrier at the speed of 52.7 mph (85 kmph) at 15.4°. This impact location was strategically chosen to maintain adequate spacing from the fully anchored end while allowing sufficient length for effective vehicle redirection toward the other end. The simulated crash was then compared to the experiment performed by [29] on a frame-by-frame basis over time to validate the impact dynamics of the truck. As shown in Figure 7, the simulation captured the major events of the crash test, such as the diversion of the tractor away from the barrier, riding of the tires into the barrier, rolling of the trailer towards the barrier, impact of the trailer and rear axle on the barrier, and eventual departure of the vehicle away from the barrier. Figure 8 compares the damage of the barrier in the simulation to the real crash test. The dark shades in the barrier are due to the tires riding on the barrier, which are also the areas where the tractor-trailer exerted maximum load. In addition, the simulation also captured shear cracks and minor concrete spalling damage in the experiment. One of the methods to validate vehicular impact simulations is to monitor the energy balance within simulations. Due to energy conservation, total energy remains constant while kinetic energy is transformed into other forms, such as internal energy, sliding energy, and hourglass energy. Figure 9 illustrates the energy balance in the system in the simulation, where kinetic energy (KE) was converted into internal energy (IE) and hourglass energy (HE). Since the HE was less than 10% of the total energy (i.e., only 5.31%), and the total energy remained constant, it can be concluded that the simulation was reliable from an energy perspective [37,38].

3. Parametric Analysis of Concrete Barrier Under Sequential Impact

A parametric analysis of sequential impact was conducted in two phases to investigate the crashworthiness of the barrier under repeated impact. The models were developed and analyzed in LS-DYNA, incorporating the validated FEM of an 80,000 lb tractor-trailer and the 42 in (1067 mm)-tall vertical-faced reinforced concrete barrier (Section 2.3), modeled with Continuous Surface Cap model material (MAT_159_CSCM) for the concrete and *MAT-24-Linear_Piecewise_Plasticity for the steel reinforcement. To simulate sequential impacts, the *INTERFACE_SPRINGBACK feature in LS-DYNA was employed to export the deformed geometry and internal state variables (such as stress, strain, and damage) from the first impact and reapply them as initial conditions for the second impact. First, the barrier was impacted by the tractor-trailer at 13 different speeds ranging from 30 mph (48 kmph) to 54 mph (87 kmph) with 2 mph (3.2 kmph) increments, at three impact angles of 10°, 15°, and 20° for the first impact. Each test scenario was named as “the impact speed-m-angle-d”. For example, a scenario where the tractor-trailer impacted the barrier at 50 mph (80.5 kmph) and 15° was labeled as “50m15d”. In the second phase, the damaged barrier was subjected to an impact angle and velocity of 52.7 mph (85 kmph) and 15°, respectively, creating a condition equivalent to that in the MASH TL-5 criteria. The barrier subjected to this second impact retained the initial scenario’s designation with an added “seq” to indicate the sequential impact. Thus, the barrier impacted after the initial “50m15d” scenario in the second sequence was labeled as “50m15d-seq.” It should be noted that a sensitivity analysis was performed and determined that impact velocities below 30 mph (48 kmph) caused negligible damage to the barriers. Therefore, a 30 mph (48 kmph) velocity was adopted as the lower threshold for the first impact. Moreover, it was observed that when the tractor-trailer impacted the barrier at an angle of 20° with velocities above 54 mph (87 kmph), the barrier failed to effectively redirect the vehicle. Thus, a velocity of 54 mph (87 kmph) was established as the upper limit.

3.1. Characterization of Impact Phases in Tractor-Trailer Collision Event

As shown by Figure 10, the impact event involving the tractor-trailer could be characterized by the vehicle moving forward and rebounding off the barrier multiple times, resulting in three distinct peaks in the recorded forces due to the deceleration of the vehicle and resistance provided by the barriers as follows:
  • Initial impact and deformation (Phase I): Rapid deceleration occurred when the tractor and the front edge of the trailer first contacted the barrier. Energy absorption occurred through the deformation of the tractor’s front and minor damage to the barrier. This phase spanned from 0.00 s to 0.50 s in the current analysis.
  • Rebound and secondary contact (Phase II): Following the initial contact, the tractor’s rear axle and the front of the trailer struck the barrier, producing a second peak in the force measurement. The combination of vehicle rebound dynamics and the compact axle mass resulted in a sudden, high-magnitude force over a short duration. This phase occurred from 0.60 s to 0.88 s.
  • Final interaction and exit (Phase III): In this stage, the spike in force was caused by the impact and rebound event due to the trailer’s rear axle. The impact due to the trailer’s rear axle occurred around the same region where the first two peaks were observed, indicating a consistent interaction area. This indicated significant energy transfer during the third impact phase, which happened between 0.88 s and 1.20 s in the performed simulations.

3.2. First Impact Sequence of TL-5 Barrier

The analysis of barrier damage for the first sequence of impact across different impact angles and velocities revealed distinct patterns of failure modes. For impacts at 10° with velocities below 50 mph (80.5 kmph), the damage was minimal, typically limited to minor surface abrasions and spalling, as illustrated in Figure 11a. However, at velocities exceeding 50 mph (80.5 kmph), the barrier experienced peak impact forces that surpassed its designed capacity of 941 KN (211 kips), resulting in shear cracks propagating through its cross-section. Similarly, at 15°, velocities below 46 mph (74 kmph) caused only superficial damage to the barrier (Figure 11b). Beyond this threshold, the peak forces exceeded the barrier’s capacity, resulting in shear cracks across its cross-section. This pattern was consistent with the damage observed for 20° impacts (Figure 11c), where velocities under 46 mph (74 kmph) inflicted minimal damage. Shear cracks along the cross-section were observed above 46 mph (74 kph), and the peak impact force at this speed was 4.6% below its designed capacity of 941 KN. In addition, the peak loads for 15° and 20° at 46 mph (74 kmph) were 150% and 112% higher than those at 10° at 46 mph (74 kmph). During the first impact, it was observed that higher impact angles caused shear cracks to develop at lower velocities compared to lower impact angles.
To study the influence of different impact velocities and angles on the peak impact force, multiple regression analysis was performed where the peak impact force was modeled as the linear function of the two independent variables of impact velocity and angle. The peak impact forces corresponding to each of the three distinct collision phases are presented in Figure 12. Overall, higher velocities and greater angles increased the force exerted on the barrier. In addition, the regression analysis for peak forces in each stage and the entire crash event showed R-squared values of 87%, 70%, 79%, and 85%, respectively, indicating that the velocities and angles could explain a large portion of the variability in the peak forces of first impact. The comparison of the R-squared values also suggested that the impact forces of all the phases had a high linear correlation with the velocities and angles. The regression parameters for the impact event during the first impact are presented in Table 1.
Higher impact angles (15° and 20°) caused more severe damage at lower velocities than the 10° angle due to the potentially larger velocity component acting normal to the barrier face, which increased transverse impulse loading over a localized region of the barrier. Additionally, steeper angles shortened the vehicle–barrier contact duration, increasing the impulse intensity, which could exceed the concrete’s tensile and shear capacity before stress redistribution could occur.

3.3. Second Impact Sequence of TL-5 Barrier

Upon the close investigation of the damage patterns in barriers subjected to different velocities and angles during the first impact, it was observed that the barriers were able to successfully redirect vehicles. For barriers that sustained only minor damage from the initial impact, the damage pattern in subsequent impact was similar to typical damage experienced by barriers at the MASH test speed during the first impact. In contrast, barriers that developed shear cracks in the initial impact exhibited significantly higher damage in subsequent impacts (Figure 13a–c), including the failure of the upper protruding part, the exposure of the upper reinforcement, and concrete erosion beyond the clear cover, extending deep into the core confined by the shear reinforcement. Additionally, these damages were more severe for barriers impacted at 15° and 20° with impact velocities above 46 mph (74 kmph) in the first impact, indicating the compounding effect of the impact angle on barrier performance. Figure 13d–f represent the severity of damage in three different barriers, which were impacted with a 52.7 mph (85 kmph) velocity and 10°, 15°, and 20° angles during the first impact and the MASH test speed (52.70 mph (85 kmph), 15°) during the second impact. It can be observed that in the case when the barrier was impacted at 15° and 20°, the damage was more severe with more fragmentation of the concrete and bending and exposure of rebars than in the case with impact at 10°.
Similarly to as described in Section 3.2, multiple linear regression was performed between the peak forces of the second sequence of impacts and the initial impacts’ angles and velocities. As shown in Figure 14, there was no significant correlation between the peak force and impact velocity and angles when considering the entire event or Phase I—which typically represented the collision of the frontal part of the tractor and induced a lower load on the barrier—though a slightly positive trend was observed in Phase I. However, a different trend was observed for the subsequent stages. In Phase II and Phase III, the peak impact force decreased when the first impact occurred at higher velocities and angles, leading to significant damage to the barrier. This reduction indicated that the accumulated damage from earlier high-intensity impacts reduced the barrier’s ability to withstand and transmit greater forces effectively in the later stages of collision. This relationship observed in Phases II and III highlights the critical role of prior damage in influencing barrier performance during subsequent impacts. The regression analysis for peak forces indicated a weak relationship between the first impact’s velocity and angle and the impact force of the entire subsequent crash event (R2 = 7%) and Phase I (R2 = 25%), whereas Phase II and Phase III of the second impact showed a relatively higher correlation, with R-squared values of 26% and 39%, respectively (Table 1).
The reduced peak forces observed during the second impact, particularly in Phases II and III, can be attributed to accumulated damage from the first impact. Phase II typically exhibited the highest force in undamaged barriers due to the concentrated effect of the tractor’s rear axle. However, in damaged barriers, the strength losses were significant in this phase and later stages. Shear cracks, concrete fragmentation, and reinforcement exposure diminished the barriers’ ability to resist and transfer loads, resulting in lower force responses during these critical later phases of the collision.

3.4. Internal Energy (IE)-Based Evaluation of Barrier Damage

Internal energy (IE) represents the total strain energy stored within a system due to deformation under applied forces [39]. The stresses, strains, and damage states produced in the sequential impacts caused the internal energy to be carried over as it was the direct function of the stress, strain, and deformation history of each element. The IE of the barrier’s concrete and reinforcement components was evaluated to investigate their respective roles in energy absorption during sequential impacts. The results revealed distinct behaviors between the concrete and reinforcement across different impact scenarios.

3.4.1. First Impact

During the first impact, the internal energy of the barrier increased consistently across all three angles (10°, 15°, and 20°), as seen in Figure 15a, correlating directly with both the impact speed and angle. This behavior highlighted the dominant role of the concrete in dissipating most of the impact energy due to its ability to undergo significant localized damage and crushing. In contrast, at lower velocities and shallow angles, the stress levels remained within the elastic range for most of the barriers, and the reinforcement remained largely unengaged, resulting in a negligible contribution to the total IE. However, at higher velocities and angles, as the impact severity increased and damage propagated into the concrete, the energy level in the reinforcement became noticeable, although it remained approximately 200 times lower than that in the concrete, as shown in Figure 16a for the impact case 52.7m15d. This minimal contribution was attributed to the reinforcement being fully encased and shielded by the concrete, which absorbed most of the forces under these conditions and did not effectively engage the steel. When the angle and velocity of impact increased, they caused the gradual but delayed development of cracks, and subsequently, the IE of the reinforcement became slightly noticeable (for example, at 85 kmph and 20°; Figure 16b).

3.4.2. Second Impact

The energy absorbed by the barrier in the sequential impacts was determined by subtracting the first impact from the final IE of the barrier after the second impact. In the second impact, the barrier exhibited a varied response depending on the impact angle. As seen in Figure 15b, for 15° and 20°, the IE of the barrier showed a decreasing trend as the impact velocity increased in the first impact, which can be attributed to extensive damage sustained during the initial impact, which reduced the barrier’s ability to absorb additional energy. For 10°, the barrier’s IE remained relatively constant, suggesting that the smaller damage from the first impact allowed it to maintain its energy-absorbing capacity. In addition, the reinforcement played a more significant role during the second impact, particularly at higher angles and speeds. As the concrete eroded and sustained damage, the reinforcement was exposed and directly interacted with the impacting tractor-trailer. This shift resulted in a noticeable increase in the reinforcement’s IE, particularly for a 15° impact angle with impact velocities of 38 mph (61 kmph) and higher and 20° with impact velocities of 36 mph (58 kmph) and higher, which can be seen in Figure 16c. As seen in Figure 16d, when the rebars and stirrups were exposed and came in contact with the tractor-trailer, resulting in bent and exposed reinforcement, the IE increased, enhancing its role in energy absorption. These trends can be explained by the fact that pre-existing damage from the first impact compromised the concrete’s structural integrity, reducing its stiffness, energy absorption capacity, and ability to confine reinforcement. As a result, the degraded concrete absorbed less energy, while the reinforcement, subsequently exposed and unconfined, resisted more of the impact load, thereby increasing its internal energy contribution.

4. Conclusions

This study investigated the impact of low-velocity impacts on a concrete barrier’s resistance against future vehicular impacts. In total, 78 crash simulations were performed, 39 each for the first and sequential impacts, where a TL-5 concrete barrier was subjected to velocities ranging from 30 mph (48 kmph) to 54 mph (87 kmph) with an increment of 2 mph (3.2 kmph) at three different angles of 10°, 15°, and 20° for the first impact and a constant velocity of 52.7 mph (85 kmph) and at an angle of 15° for the second impact, a scenario conforming to representative MASH TL-5 testing conditions. By investigating the peak impact force, the damage patterns, and the internal energy of concrete and rebars in the barrier, this study provides detailed insights into the barrier’s performance under various collision scenarios. The main findings of this study are as follows:
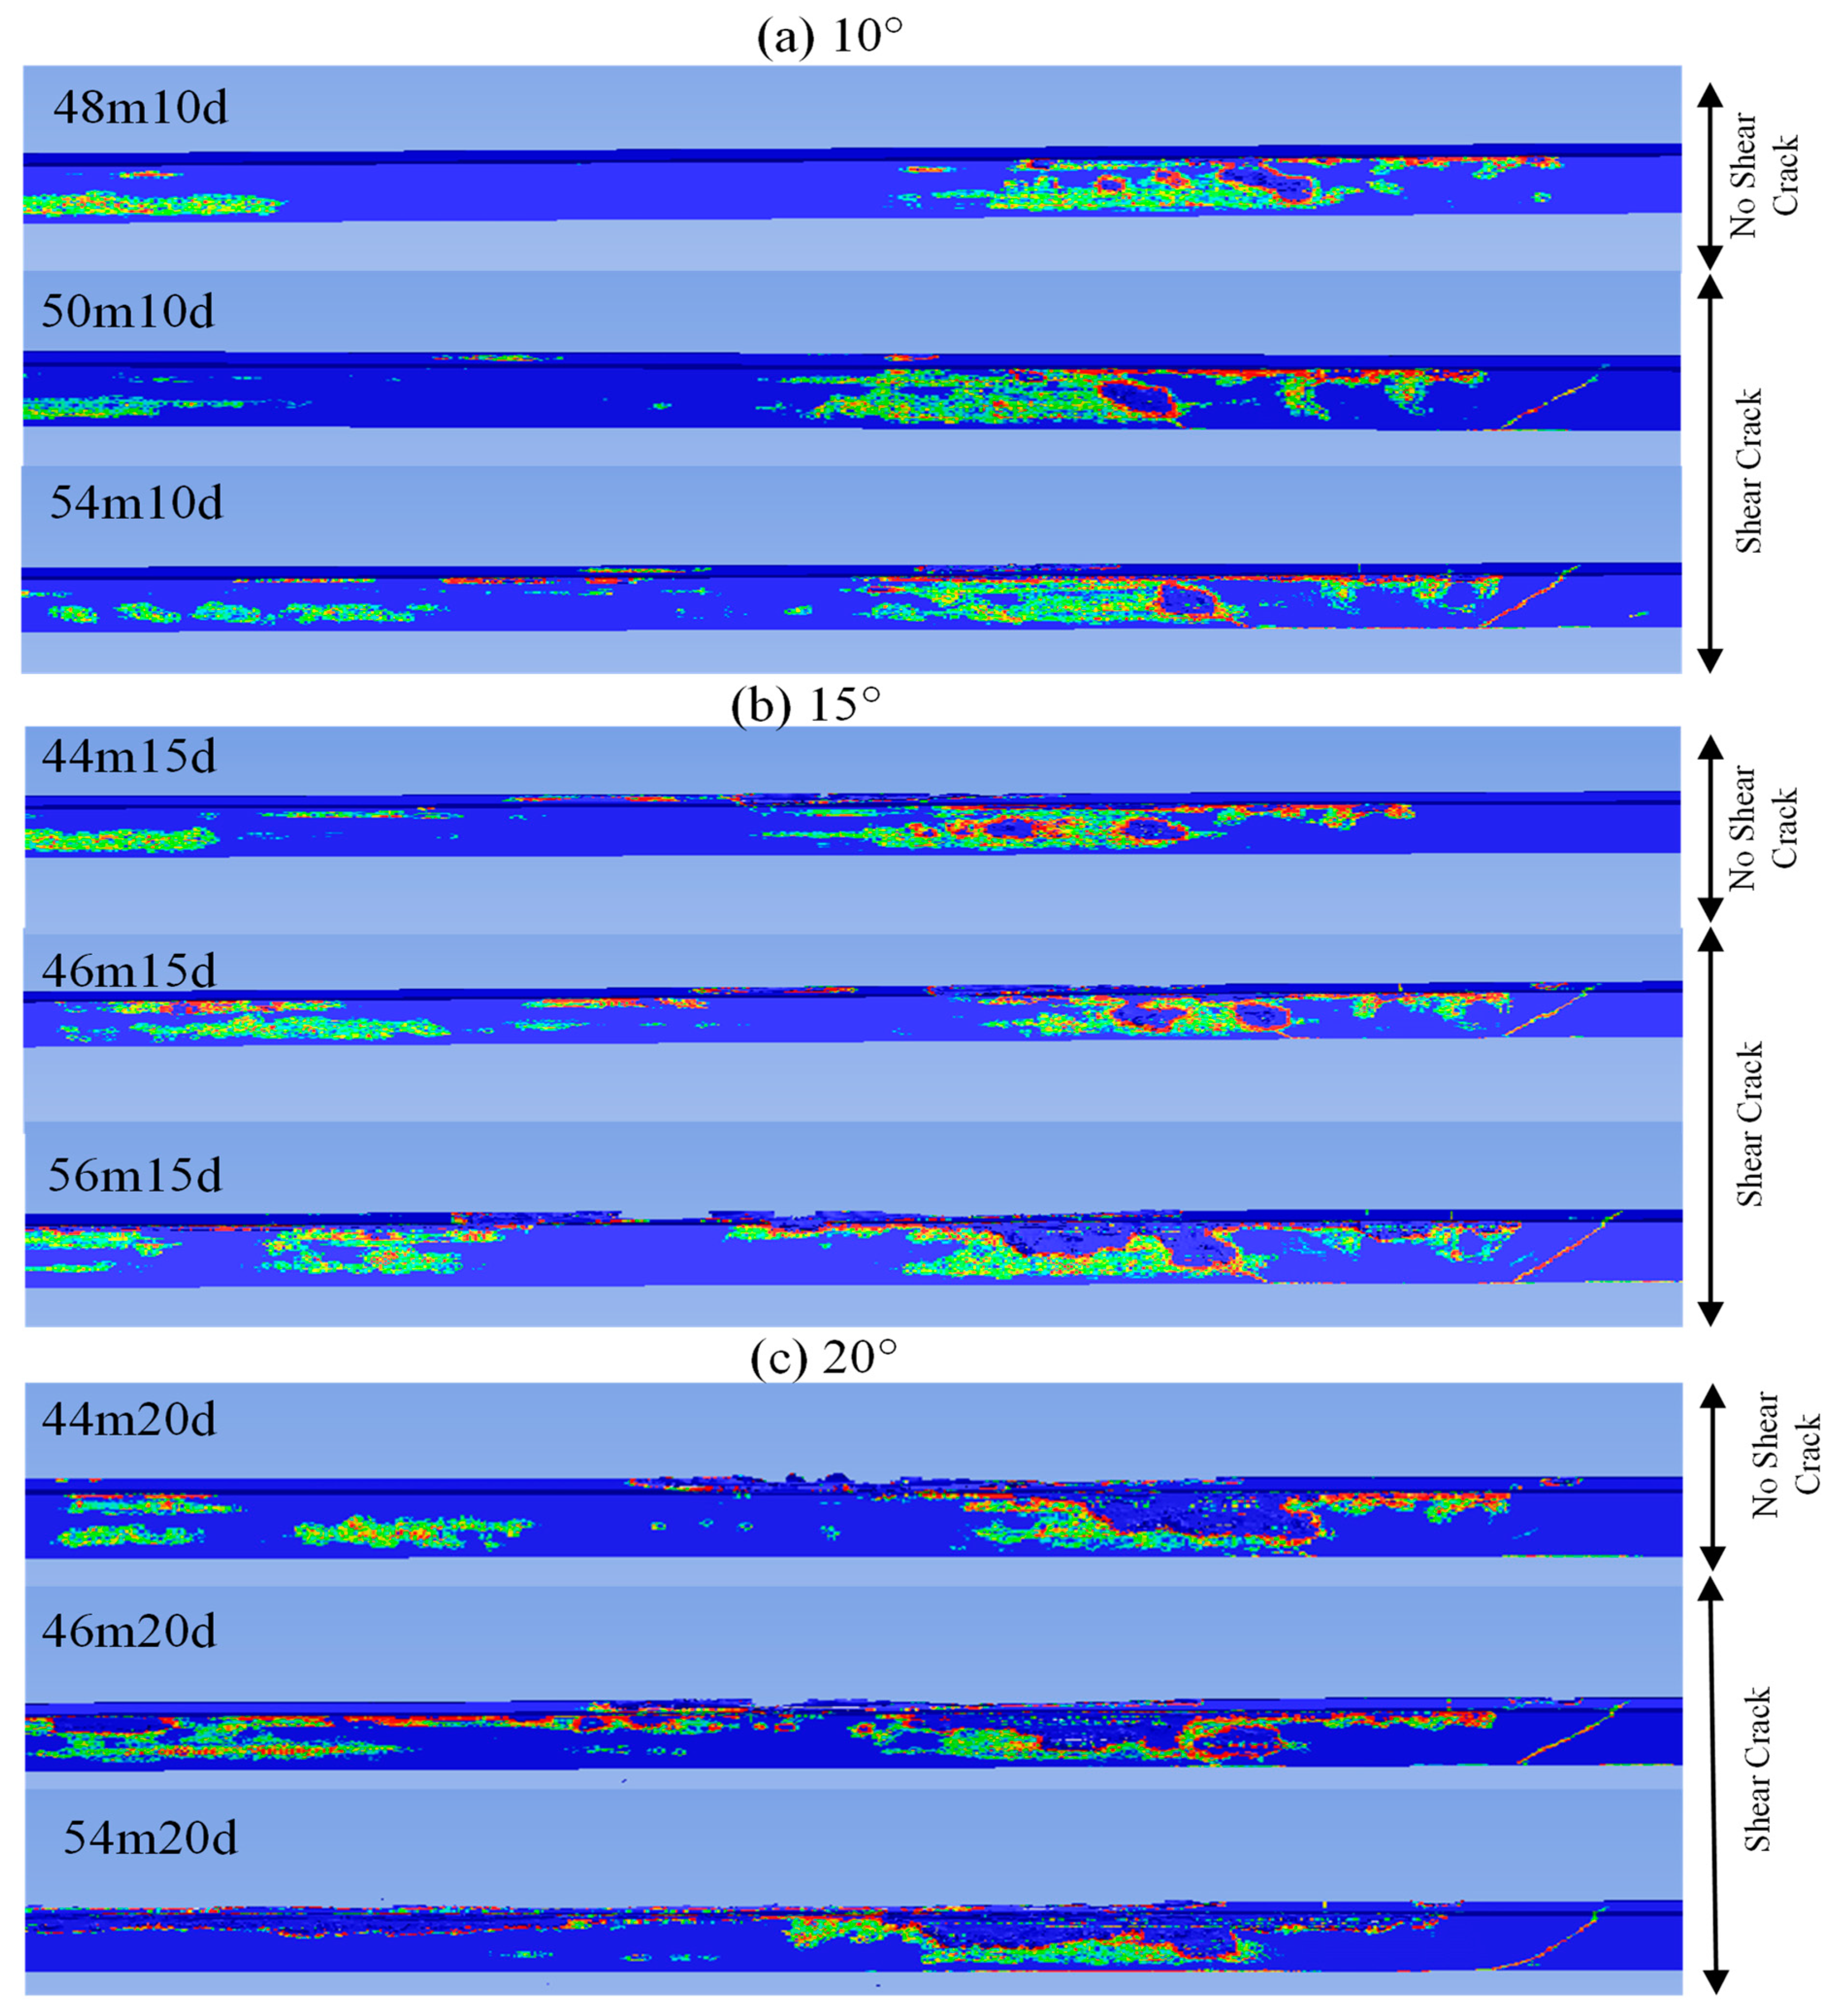
  • The first sequence of impacts showed a clear correlation between the severity of barrier damage and the impact speed and angle. As the impact speed increased, the barrier sustained more significant damage, particularly at oblique angles of 15° and 20°, creating higher-stress concentrations than the lower angle of 10°. For example, the barriers experienced a shear crack at 50 mph (80.5 kmph) for the impact at 10°, whereas the same barrier showed shear crack at 46 mph (74 kmph) for 15° and 20° impact angles.
  • For the second impact sequence, the pre-existing damage from the initial impact significantly affected the barrier’s response, leading to greater structural damage. The barriers that carried over shear cracks and damage, particularly for those impacted at 46 mph (74 kmph) and above for 15° and 20° angles during the first impact, exhibited severe damage such as the excessive fragmentation of concrete, reinforcement exposure, and bending.
  • Barriers that developed shear cracks in the first impact demonstrated reduced peak impact forces in the second impact, particularly in the second and third phases of the crash (i.e., rebound and final interaction phases)
  • Regression analysis showed a strong relationship between the peak impact force and an increasing velocity and angle during the first impact event, as indicated by high R-squared values (>70%), both overall and within each of the three phases.
  • In the second impact, no significant relationship was observed between the first impact’s velocity and angle and the peak forces for the entire crash, as shown by a low R-squared value (i.e., 7%). However, a decreasing trend in the peak impact force was observed in the second (i.e., rebound) and third (i.e., final interaction) phases of the impact, with relatively higher R-squared values (26% and 39%, respectively)
  • This reduction suggested that the barrier may have lost its capacity to satisfy the MASH TL-5 requirements after sustaining initial damage from loads close to the MASH TL-5 specifications, i.e., impacts at 50 mph (80.5 kmph) at 10° and 46 mph (74 kmph) at 15° and 20°.
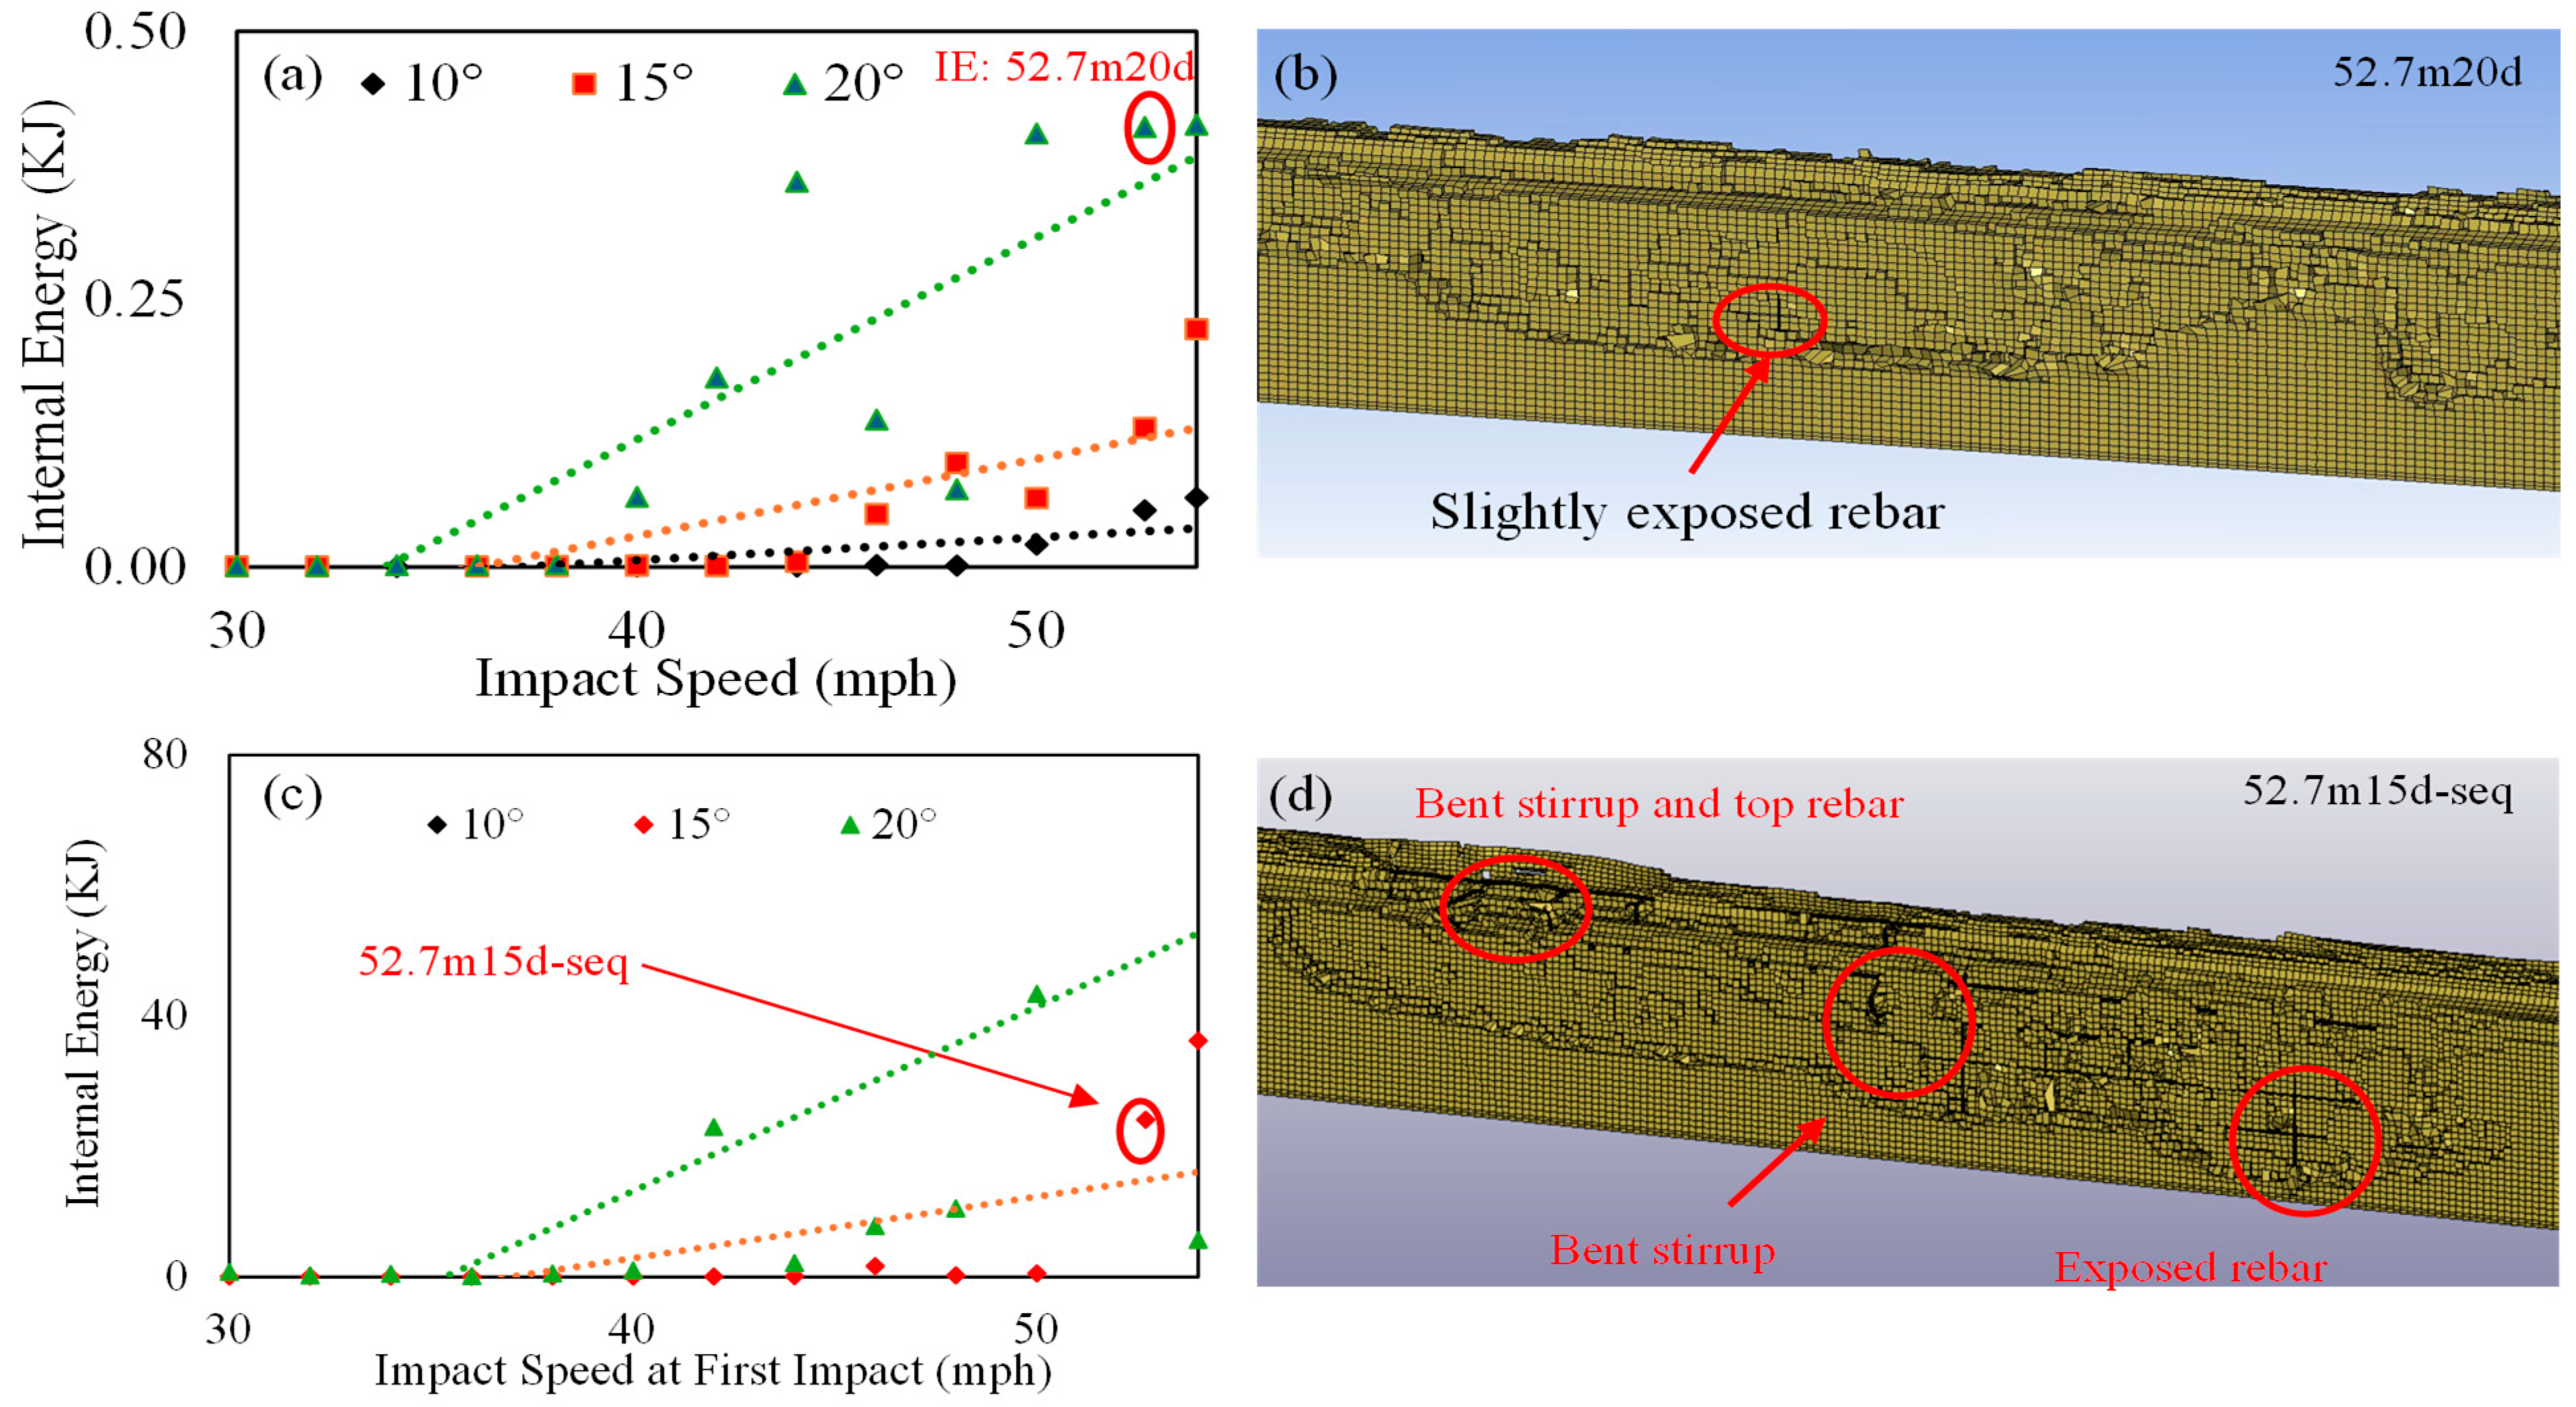
  • The energy-based evaluation of barrier damage concluded that during the first impact, concrete dominated the energy absorption, with its IE approximately 200 times higher than that of the reinforcement for higher-velocity and -impact cases, whereas the contribution from reinforcement for lower-velocity and -impact cases was negligible.
  • In sequential impacts, the concrete’s ability to absorb energy diminished due to sustained damage, as evidenced by a decreasing IE trend at higher impact angles (15° and 20°). The IE of the reinforcement became significant at velocities equal to or higher than 38 mph (61 kmph) at 15° and equal to or higher than 36 mph (58 kmph) at 20°. As the trend shifted towards the reinforcement’s role in energy absorption, the energy absorption by the concrete decreased.
The current MASH guidelines do not provide any recommendations on the continued use of barriers that have been subjected to previous low-velocity impacts. Based on the results presented in this study, such low-velocity impacts can significantly affect barriers’ capacity for future impacts and their structural adequacy based on the MASH criteria. Therefore, the existing MASH guidelines can be updated to include criteria based on the observed damage from the first impact. For example, cast-in-place, fixed barriers that exhibit deep fragmentation below the clear cover or develop shear cracks traversing across the barriers should be investigated further for continued use in terms of crashworthiness.
This study focuses on low-velocity impacts ranging from 30 mph (48 kmph) to 54 mph (87 kmph). However, highway speed limits are often substantially higher than this design threshold, requiring further research on barrier performance under high-velocity conditions. In addition, novel materials, such as barriers constructed with fiber-reinforced concrete, could be studied as some alternative mitigation plans. Such materials may offer enhanced energy absorption and crack resistance, improving durability and performance under sequential loading scenarios. Lastly, variations in barrier shape likely result in different load paths and damage mechanisms, and thus, the findings of this study are specific to the TL-5 configuration

Author Contributions

Conceptualization, M.Z.E. and A.D.S.; methodology, A.P.; software, A.P.; validation, A.P.; formal analysis, A.P.; investigation, A.P.; resources, M.Z.E.; data curation, A.P.; writing—A.P., M.Z.E., and writing—review and editing, M.Z.E. and A.D.S.; visualization, A.P.; supervision, M.Z.E.; project administration, M.Z.E. All authors have read and agreed to the published version of the manuscript.

Funding

This research received no external funding.

Data Availability Statement

The raw data supporting the conclusions of this article will be made available by the authors on request.

Conflicts of Interest

The authors declare no conflicts of interest.

References

  1. NHTSA. FARS Encyclopedia. Available online: https://www-fars.nhtsa.dot.gov/Main/index.aspx (accessed on 15 February 2024).
  2. Manual for Assessing Safety Hardware, 2nd ed.; American Association of State Highway and Transportation Officials: Washington, DC, USA, 2016.
  3. Bielenberg, R.W.; Faller, R.K.; Reid, J.D.; Schmidt, J.D.; Pajouh, M.A.; Emerson, E. Development of retrofit, low-deflection portable concrete barrier system. J. Transp. Saf. Secur. 2019, 11, 333–352. [Google Scholar] [CrossRef]
  4. Williams, W.F.; Sheikh, N.M.; Menges, W.L.; Kuhn, D.L.; Bligh, R.P. Crash Test and Evaluation of Restrained Safety-Shape Concrete Barriers on Concrete Bridge Deck; Texas A&M Transportation Institute: College Station, TX, USA, 2018; Available online: http://tti.tamu.edu/documents/9-1002-15-3.pdf (accessed on 1 December 2024).
  5. Bielenberg, B.W.; Faller, R.K.; Rohde, J.R.; Reid, J.D.; Sicking, D.L.; Holloway, J.H. Development of Tie-Down and Transition Systems for Temporary Concrete Barrier on Asphalt Road; Transportation Research Board: Washington, DC, USA, 2007. [Google Scholar]
  6. Bielenberg, B.W.; Faller, R.K.; Reid, J.D.; Rohde, J.R.; Sicking, D.L. Design and Testing of Tie-down Systems for Temporary Barriers. Transp. Res. Rec. 2003, 1851, 83–94. [Google Scholar] [CrossRef]
  7. Bligh, R.P.; Sheikh, N.M.; Alberson, D.C.; Abu-Odeh, A.Y. Low-deflection portable concrete barrier. Transp. Res. Rec. 2006, 1984, 47–55. [Google Scholar] [CrossRef]
  8. Bielenberg, R.W.M.E.; Asselin, N.M.; Faller, R.K. Mash TL-3 Evaluation of Concrete and Asphalt Tied-Down Anchorage for Portable Concrete Barrier; Midwest Roadside Safety Facility: Lincon, NE, USA, 2019. [Google Scholar]
  9. Sheikh, N.M.; Kovar, J.C.; Cakalli, S.; Menges, W.L.; Schroeder, G.E.; Kuhn, D.L. Analysis of 54-Inch Tall Single-Slope Concrete Barrier on a Structurally Independent Foundation; Texas A&M Transportation Institute: College Station, TX, USA, 2019. [Google Scholar]
  10. AS/NZS 3845.1:2015; Road Safety Barrier Systems. Standards Australia: Sydney, Australia, 2015.
  11. Karim, H.; Moudud, A.; Magnusson, R. Road Barrier Repair Costs and Influencing Factors. J. Transp. Eng. 2011, 137, 349–359. [Google Scholar] [CrossRef]
  12. Sheikh, N.M.; Bligh, R.P.; Menges, W.L. Determination of Minimum Height and Lateral Design Load for Mash Test Level 4 Bridge Rails; Texas A&M Transportation Institute: College Station, TX, USA, 2011. Available online: http://www.ntis.gov (accessed on 1 December 2024).
  13. Mak, K.K.; Campise, W.L. Test and Evaluation of Ontatio ‘Tall Wall’ Barrier with an 80,000-Pound Tractor-Trailer; Texas A&M Transportation Institute: College Station, TX, USA, 1990. [Google Scholar]
  14. Bhutani, S. Development of the Preliminary Guidelines for the Evaluation and Repair of Portable Concrete Barriers. Master’s Thesis, Texas A&M University, College Station, TX, USA, 2021. [Google Scholar]
  15. NYDOT. Temporary Barrier Guidelines. Available online: https://www.dot.ny.gov/divisions/engineering/design/dqab/tcbacceptability (accessed on 12 March 2024).
  16. Silvestri-Dobrovolny, C.; Schroeder, W.J.L.; Kuhn, D.L. Develop Guidelines for Inspection, Repair, and Use of Portable Concrete Barriers—Volume 2: Crash Report; Texas A&M Transportation Institute: College Station, TX, USA, 2022; Available online: https://tti.tamu.edu/documents/0-7059-R1-Vol2.pdf (accessed on 1 December 2024).
  17. Dobrovolny, C.S.; Bhutani, S.; Zalani, A.; Bligh, R.P.; Hurlebaus, S.; Aldahlki, H.; Schroeder, W.; Kuhn, D.L. Development of Guidelines for Inspection, Repair, and Use of Portable Concrete Barriers—Volume 1: Technical Report; Texas A&M Transportation Institute: College Station, TX, USA, 2022. [Google Scholar]
  18. Adhikary, S.D.; Li, B.; Fujikake, K. Low Velocity Impact Response of Reinforced Concrete Beams: Experimental and Numerical Investigation. Int. J. Prot. Struct. 2015, 6, 81–111. [Google Scholar] [CrossRef]
  19. Yu, Y.; Lee, S.; Cho, J.Y. Deflection of reinforced concrete beam under low-velocity impact loads. Int. J. Impact Eng. 2021, 154, 103878. [Google Scholar] [CrossRef]
  20. Lyu, X.; Ran, H.; Elchalakani, M.; Wittek, A.; Hassan, G.M.; Ayough, P.; Pham, T.M. Dynamic responses of rubberised concrete: A study using short-length F-shape barriers subjected to pendulum impact. J. Build. Eng. 2024, 95, 110135. [Google Scholar] [CrossRef]
  21. Sharma, R.; Kasilingam, S. Performance of thin reinforced concrete slabs against low velocity repeated impact load. Eur. J. Environ. Civ. Eng. 2024, 28, 1415–1444. [Google Scholar] [CrossRef]
  22. Othman, H.; Marzouk, H. Finite-Element Analysis of Reinforced Concrete Plates Subjected to Repeated Impact Loads. J. Struct. Eng. 2017, 143, 04017120. [Google Scholar] [CrossRef]
  23. Wei, J.; Li, J.; Liu, Z.; Wu, C.; Liu, J. Behaviour of hybrid polypropylene and steel fibre reinforced ultra-high performance concrete beams against single and repeated impact loading. Structures 2023, 55, 324–337. [Google Scholar] [CrossRef]
  24. Huang, Z.; Zhao, X.; Zhang, W.; Ye, J. Repeated impact performance of stainless steel-lightweight high ductility cement composite beams. Thin-Walled Struct. 2023, 188, 110791. [Google Scholar] [CrossRef]
  25. Jones, N. Pseudo-shakedown phenomenon for the mass impact loading of plating. Int. J. Impact Eng. 2014, 65, 33–39. [Google Scholar] [CrossRef]
  26. Cai, W.; Zhu, L.; Qian, X. Dynamic responses of steel plates under repeated ice impacts. Int. J. Impact Eng. 2022, 162, 104129. [Google Scholar] [CrossRef]
  27. Shi, S.; Lam, N.; Cui, Y.; Lu, G.; Gad, E.; Zhang, L. Life-cycle performance of aluminium cladding panels in resisting hailstorms. Struct. Saf. 2024, 108, 102439. [Google Scholar] [CrossRef]
  28. Fang, C.; Rasmussen, J.D.; Bielenberg, R.W.; Lechtenberg, K.A.; Faller, R.K.; Linzell, D.G. Experimental and numerical investigation on deflection and behavior of portable construction barrier subjected to vehicle impacts. Eng. Struct. 2021, 235, 112071. [Google Scholar] [CrossRef]
  29. Rosenbaugh, S.K.; Sicking, D.L.; Faller, R.K. Development of a TL-5 Vertical Faced Concrete Median Barrier Incorporating Head Ejection Criteria; University of Nebraska: Lincon, NE, USA, 2007. [Google Scholar]
  30. Miele, C.R.; Plaxico, C.; Stephens, D.; Simunovic, S. U26: Enhanced Finite Element Analysis Crash Model of Tractor-Trailers (Phase C); No. Phase C; National Transportation Research Center: Knoxville, TN, USA, 2010; 276p.
  31. Buth, E.; Brackin, M.S.; Williams, W.F.; Fry, G.T. Collision Loads on Bridge Piers: Phase 2. Report of Guidelines for Designing Bridge Piers and Abutments for Vehicle Collisions. 2011. Available online: https://rosap.ntl.bts.gov/view/dot/18684 (accessed on 1 December 2024).
  32. Buth, C.E.; Williams, W.F.; Brackin, M.S.; Lord, D.; Geedipally, S.R.; Abu, A.Y. Analysis of Large Truck Collisions with Bridge Piers: Phase 1. Report of Guidelines for Designing Bridge Piers and Abutments for Vehicle Collisions; Texas A&M Transportation Institute: College Station, TX, USA, 2009. [Google Scholar]
  33. Cao, R.; Agrawal, A.K.; El-Tawil, S.; Xu, X.; Wong, W. Heavy Truck Collision with Bridge Piers: Computational Simulation Study. J. Bridge Eng. 2019, 24, 04019052. [Google Scholar] [CrossRef]
  34. Murray, Y. Users Manual for LS-DYNA Concrete Material Model 159; Federal Highway Administration: Washington, DC, USA, 2007; p. 77.
  35. Jones, C.A. Use of *INTERFACE_SPRINGBACK to Precondition Beams for Impact Analyses; DYANmore GmbH: Stuttgart, Germany, 2012. [Google Scholar]
  36. Schwer, L.E. Modeling Pre and Post Tensioned Concrete. In Proceedings of the 14th International LS-DYNA Conference, Detroit, MI, USA, 12–14 June 2016. [Google Scholar]
  37. Salahat, F.H.; Jones, C.A.; Rasheed, H.A. Assessment of Substandard Concrete Barriers as Protective Structures to Bridge Piers against Vehicular Collision Force. J. Bridge Eng. 2024, 29, 04024043. [Google Scholar] [CrossRef]
  38. Cao, R.; Agrawal, A.K.; El-Tawil, S.; Wong, W. Numerical Studies on Concrete Barriers Subject to MASH Truck Impact. J. Bridge Eng. 2020, 25, 04020035. [Google Scholar] [CrossRef]
  39. LS DYNA Support. Internal Energy—Welcome to the LS-DYNA Support Site. Available online: https://www.dynasupport.com/howtos/general/internal-energy (accessed on 23 November 2024).
Figure 1. Different types of barriers: (a) 813 mm (32 in)-tall, F-shaped, portable concrete barrier [8] and (b) 1372 mm (54 in)-tall, fixed concrete barrier [9].
Buildings 15 01271 g001
Figure 2. Barrier damage evaluation: unacceptable (a,b) and acceptable (c) cases [15].
Buildings 15 01271 g002
Figure 3. Concrete barrier damage modeling: (a) damage in barrier and (b) modeling of barrier by element removal [17].
Buildings 15 01271 g003
Figure 4. Comparison of test setup with FEM: (a) test 429730-2 [31], (b) FEM, (c) comparison of impact force from test and FEM.
Buildings 15 01271 g004
Figure 5. Sequential impact on RC slab: first impact (a,b) and second impact (c,d).
Buildings 15 01271 g005
Figure 6. FE model of fixed vertical-faced barrier and MASH TL-5 test setup.
Buildings 15 01271 g006
Figure 7. Comparison of crash dynamics between real test [29] and simulation performed in this study.
Buildings 15 01271 g007
Figure 8. A comparison of concrete erosion and cracks between the experiment [29] and simulation.
Buildings 15 01271 g008
Figure 9. Energy balance for MASH TL-5 simulation.
Buildings 15 01271 g009
Figure 10. Impact force for 52.7m15d simulation and the corresponding three phases of the crash.
Buildings 15 01271 g010
Figure 11. The damage pattern in the barrier upon the first impact.
Buildings 15 01271 g011
Figure 12. Multiple linear regression of peak forces upon first impact with respect to impact velocity and angle.
Buildings 15 01271 g012
Figure 13. Damage in the barrier upon the second impact.
Buildings 15 01271 g013
Figure 14. Multiple linear regression of peak forces upon second impact with respect to impact velocity and angle.
Buildings 15 01271 g014
Figure 15. The IE of the concrete: (a) the IE of the barrier in the first sequence of impacts, (b) the IE of the barrier during the second impact.
Buildings 15 01271 g015
Figure 16. IE of reinforcement: (a,b) first impact and barrier damage in impact condition 52.7m25d, (c,d) change in IE of reinforcement for second impact and barrier damage in impact scenario 52.7m25d-seq.
Buildings 15 01271 g016
Table 1. Regression parameters for the impact events.
Impact PhaseR-Squared (%)VelocityAngle
Coefficientt-Statp-ValueCoefficientt-Statp-Value
FirstI87.2125,596.5113.281.94 × 10−1529,702.958.326.58 × 10−10
II69.5246,796.318.921.19 × 10−1015,353.891.581.23 × 10−01
III78.3838,036.5410.282.95 × 10−1234,141.154.981.57 × 10−05
Full85.0041,406.1813.766.64 × 10−1621,361.453.834.88 × 10−04
SecondI25.454425.211.985.51 × 10−0211,947.182.896.47 × 10−03
II26.09−7777.22−2.312.69 × 10−02−16,955.17−2.721.01 × 10−02
III38.89−11,651.76−3.619.25 × 10−04−18,780.97−3.143.34 × 10−03
Full7.711400.550.645.24 × 10−01−6491.94−1.611.16 × 10−01
Disclaimer/Publisher’s Note: The statements, opinions and data contained in all publications are solely those of the individual author(s) and contributor(s) and not of MDPI and/or the editor(s). MDPI and/or the editor(s) disclaim responsibility for any injury to people or property resulting from any ideas, methods, instructions or products referred to in the content.

