Article

Study on the Failure Mechanism of Deep Foundation Pit of High-Rise Building: Comprehensive Test and Microstructure Coupling

by
Zhiwu Zhou
1,*,
Lorena Yepes-Bellver
2,
Julián Alcalá
3 and
Víctor Yepes
3
1
Hunan Provincial Key Laboratory of Intelligent Protection and Utilization Technology in Masonry Artifacts, Hunan University of Science and Engineering, Yongzhou 425006, China
2
Mechanics of Continuous Media nd Theory of Structures Department, Universitat Politènica de València, 46022 València, Spain
3
Institute of Concrete Science and Technology (ICITECH), Universitat Politècnica de València, 46022 València, Spain
*
Author to whom correspondence should be addressed.
Buildings 2025, 15(8), 1270; https://doi.org/10.3390/buildings15081270
Submission received: 8 March 2025 / Revised: 7 April 2025 / Accepted: 9 April 2025 / Published: 12 April 2025
(This article belongs to the Section Construction Management, and Computers & Digitization)

Abstract

Under the adverse geological conditions of silty soft soil in coastal, lakeside, and river areas of countries worldwide, safety and quality during deep foundation pit construction are research challenges that researchers must overcome. Through 3D simulation, micro-finite element coupling modeling and construction site monitoring tests, this paper comprehensively analyzes the formation mechanism and causes of deep foundation pit foundation quality defects and diseases under the most unfavorable environment and multi-factor interference and puts forward scientific treatment suggestions. The research process accurately applies multidisciplinary coupling model research such as computer science, instrument science and technology, and material mechanics to solve the impact of multi-factor and uncertain environments on construction. The final research results provide sufficient theoretical and physical cases for improving the safety and stability of deep foundation pits under soft foundation conditions and provide rich practical specifications for the testing, monitoring and construction of similar projects; it provides a strong guarantee for the global deep foundation pit monitoring and early warning system under soft foundation conditions.

1. Introduction

Many deep marine-lacustrine soft, muddy soils are distributed in the coastal mudflat and lake areas around the globe, which have the characteristics of large porosity, small compression modules, low shear strength and low bearing capacity. Due to the poor properties of soft soil engineering, engineering accidents such as foundation pit collapse, pile foundation deviation, fracture, etc., often occur in infrastructure design, construction, and operation [1]. Scholars at home and abroad mainly study the nonlinear pile–soil contact using the trilinear model, hyperbolic model, and bilinear model; and calculate the single pile settlement using the analytical method and simplified recurrence method; calculate the internal force and displacement of the pile body using the finite bar element method, difference method, transfer matrix method, and power series method [2]. Researchers have analyzed the changes in soil behavior caused by void ratio by establishing appropriate soil constitutive models and found that soil deformation is the relative displacement changes between particles caused by particle breakage (or deformation) and sliding or rolling [3].
Structural engineers must address two main issues in foundation design: bearing capacity and uneven settlement (direct, consolidation, and creep) of the foundation. It is necessary to consider the complexity of the failure mechanism of the foundation unit and the failure mechanism of the joint foundation system in the study of complex design [4]. As the soft and flexible homogeneous clay loses constraint on the lateral force construction and asymmetry of stiffness of the structure, it is necessary to consider the non-elastic dynamic effects in the study of nonlinear soil [5]. Paulo Castro et al. [6] established a sand constitutive model considering the soil mechanical material properties in the critical state, aiming to evaluate the possibility of the structure reaching the critical void ratio state during construction. Plaban Deb et al. [7] studied the property changes of two cohesive soil layers. They found that the corresponding models of combined piled raft foundations in cohesive soil with different media are almost identical. Minor disturbances during pile foundations and foundation construction can cause damage or deformation of surrounding pile groups. Cheng Yuan Lin et al. [8] established the finite difference program FLAC3D (fast lagrangian analysis of continua three dimensional) spherical/cylindrical expansion method to analyze multiple corresponding characteristics such as stress and the shielding effect mechanism of construction pile groups, as well as the direct blocking effect of piles and the “soil arch effect” caused by soil between piles.
The slight strain softened soil (HSS) model parameters are completed in the laboratory after soil sample sampling and storage, causing varying degrees of disturbance [9]. In situ test HSS uses some test parameters, such as standard penetration [10], seismic wave flat shovel test and seismic wave hole pressure static cone penetration test [11], which improves data reliability. Some scholars also use static cone tip resistance and soft soil pit bottom reinforcement values as finite element parameters to calculate the deformation of foundation pit excavation [12]. Therefore, numerical analysis and testing can obtain reliable deformation data in the sensitive environment of foundation pit construction, and more comprehensive and systematic research, large-scale field test data comparison and numerical simulation coupling comprehensive research are also needed.
The critical research contents of this paper: (1) How to analyze deep foundation pit problems by combining finite element entity coupling modeling and field experimental monitoring methods through multidisciplinary research; (2) identify soft soil foundations under harsh geological conditions by comparing multiple experimental detection methods, quality defects, formation mechanisms and causes of pile foundation diseases. 3. Through on-site construction excavation, the accuracy and scientific analysis of the theoretical problems and different research methods were verified again.
The innovative aspects of this paper:
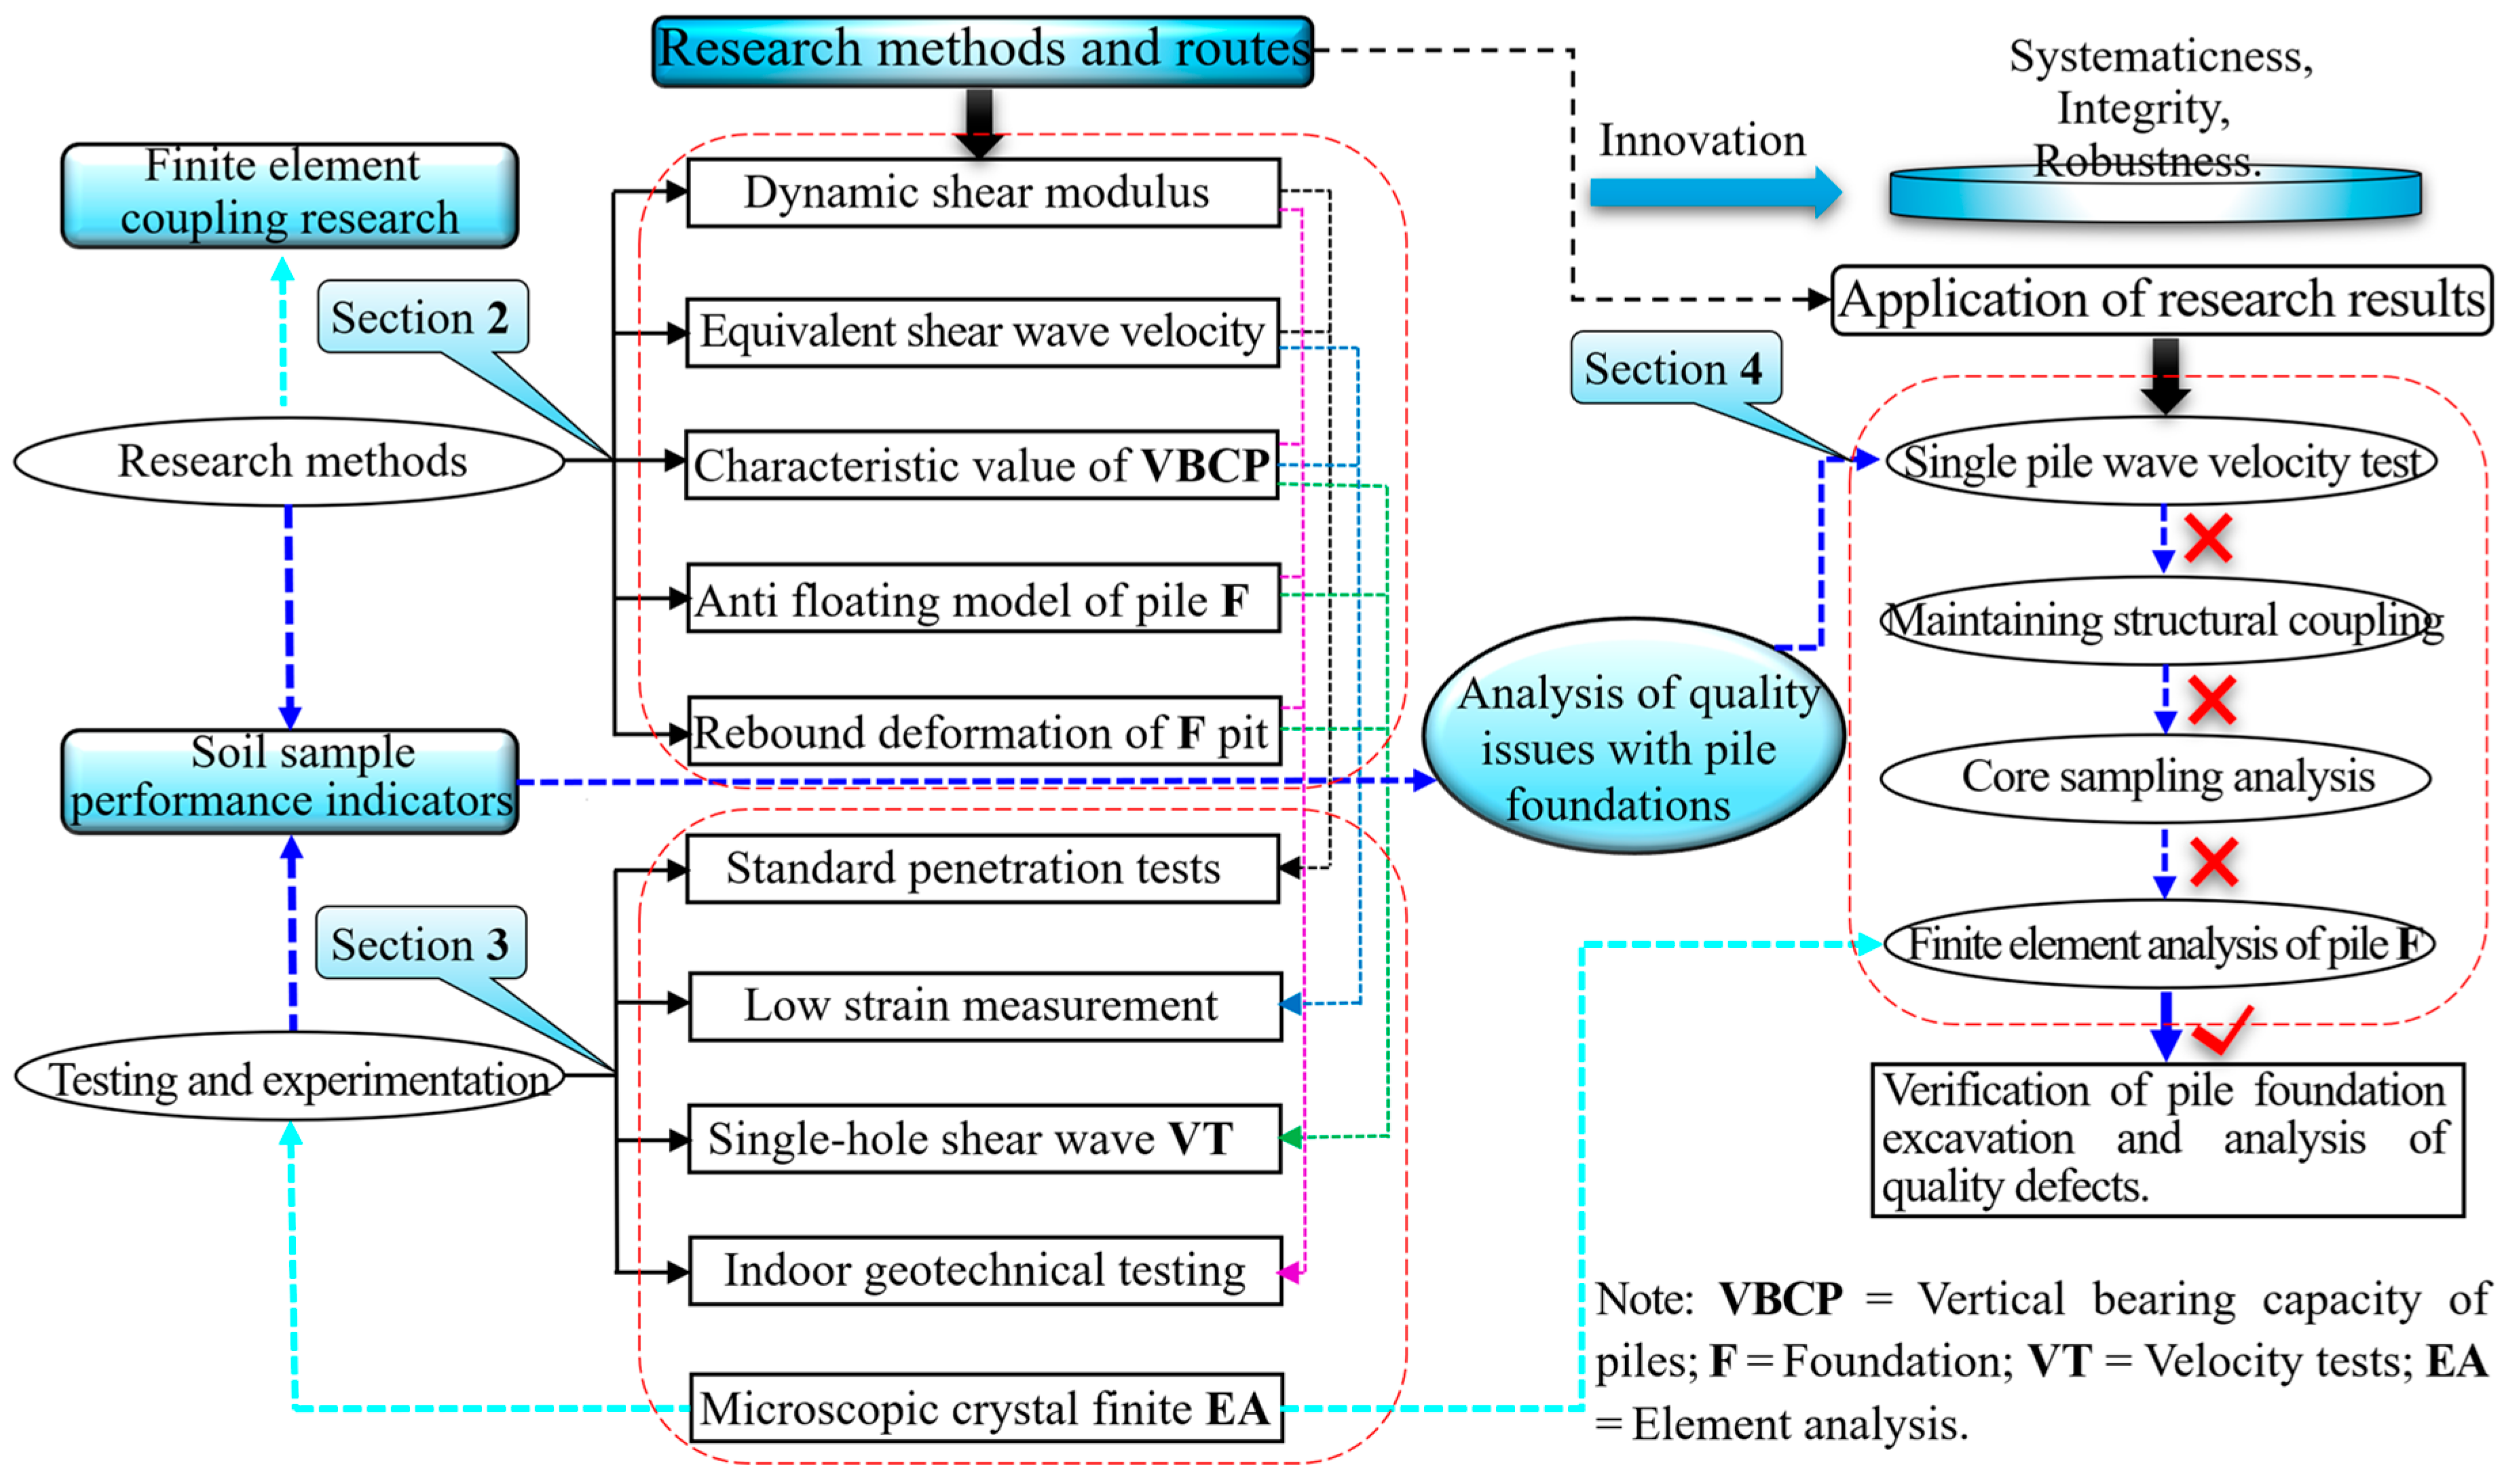
  • Through the multiple coupling of comprehensive testing and finite element models, the problem of quality defects in pile foundations in deep foundation pits in soft soil is solved.
  • Reveals the fully coupled pile foundation defect diagnosis and field test comparative analysis process in soft soil areas.
  • Provides a theoretical research framework and comprehensive analysis method for accurately evaluating and ensuring the construction quality of soft foundation pile foundations.
  • Provides a rich and comprehensive research and analysis process and framework for how to study and analyze similar cases and establishes standards for better judgment of such pile foundation quality accidents.
This paper has five parts: Section 1 describes the research focus and innovation points through the literature review; Section 2 introduces the critical theoretical mathematical models; Section 3 presents the case testing process and the analysis of essential data; Section 4 provides the coupling analysis of quality defects in pile foundations; Section 5 proposes shortcomings and future research prospects in this field.

2. Methods

This work aims to study the stability and failure mechanism of deep foundation pits in silty silt. The research model applies field tests (standard penetration test, dynamic probing, shear wave velocity test, geotechnical test, etc.) and finite element coupling analysis to effectively explain the causes and mechanism factors of pile foundation quality defects.
The research system and innovation of this work can be found in Figure 1. Considering that vertical piles are placed in layered soil layers, and the cap and pile foundation is rigidly connected, an elastic Euler–Bernoulli beam element is used for modeling, which is embedded in a medium composed of independent horizontal viscoelastic infinite layers with different densities of ρ s .

2.1. Main Experimental Testing

There is no gap between the pile foundation and the medium under external forces; the dynamic equilibrium of the system shows a linear distribution, so the model parameters mainly include dynamic shear modulus, triaxial drainage test secant modulus, and shear strain level. The calculation equation of the dynamic shear modulus is [1]:
G 0 = G 0 r e f c cos φ σ 3 sin φ c cos φ + p r e f sin φ m
where c is the cohesive force; φ is the internal friction angle; σ 3 is the effective surrounding rock pressure; m is the relative power exponent of stiffness stress; G 0 r e f is a single sample under reference rock pressure; p r e f = 100   k p a .
Shear wave velocity is one of the most essential parameters in research in engineering seismology, which can effectively predict site effects. According to the Code for Seismic Design of Buildings (GB50011-2016), the calculation equation of equivalent shear wave velocity of the soil layer is [13]:
v s e = d 0 t ,   t = n i = 1 d i v s i
where v s e is the equivalent shear wave velocity (m/s) of the soil layer; d 0 is the calculated depth (m), taking the smaller value of the cover layer thickness and 20 m; t is the propagation time of shear waves from the ground to the calculated reading; d t is the thickness (m) of the i th soil layer within the calculated depth range, where the thickness represented by the i th measuring point is taken; v s i   is the shear wave velocity (m/s) of the i th soil layer within the calculated depth range, where the wave velocity of the i th measuring point is taken.
There are significant differences in the pile foundation load transfer models and end soil failure modes due to different force directions of the pile-soil interaction mechanism in the foundation. According to the regulations, estimating the characteristic value of a single pile’s vertical bearing capacity should meet the Design Parameter Table requirements for Physical and Mechanical Indicators of Foundation Soil and the Code for Design of Building Foundation (DB33/T1136-2017) [14]:
Q u k   = u p q s i a l i + q p a A p
where q p a and q s i a are the characteristic values of pile end resistance and pile side resistance; A p   is the cross-sectional area ( m 2 ) at the bottom of the pile; u p is the length ( m ) around the pile body; l i is the thickness (cm) of the i st soil layer.
After years of research by domestic and foreign scholars, the underground structure will have an anti-floating failure when the upward water buoyancy exceeds the structure’s weight. Under vertical loads, an anti-floating pile can reduce the raft’s average vertical displacement and improve the piles’ bearing efficiency [15]. According to the Technical Standard for Building Engineering against Uplift (JGJ476-2019) [14], as well as the topographic and geomorphologic features of the site, hydrogeological conditions, regional experience, etc., the groundwater anti-floating water level in the basement is determined to be 0.50 m below the outdoor design floor elevation for anti-floating calculation and comprehensive analysis [12].
R a = λ i q s i a u i l i + G p k
where u i is the length (m) around the pile body; λ i is the characteristic value of pile side resistance of the i th soil layer; G p k is the standard value for the self-weight of a single pile, with buoyancy deducted below groundwater.
Due to the reduced vertical stress in the soil caused by the foundation pit excavation, the foundation pit’s foundation soil undergoes rebound deformation. Based on the Code for Design of Building Foundation (GB50011-2011), the rebound amount is calculated according to the following Equation [16]:
S c = ψ c p c Z i a i Z i 1 a i 1 / E c i
where S c is the rebound deformation (cm) of the foundation; p c is the self-weight pressure (kPa) of the soil above the bottom of the foundation pit, with buoyancy deducted below groundwater; ψ c is the empirical coefficient of settlement considering the impact of rebound, with a value of 0.4; z i   and z i 1 are the calculated depth (m) of the foundation pit; a i and a i 1 are the average additional stress coefficient at the center point; E c i is the rebound deformation modulus (kPa) of the foundation soil under the foundation pit.

2.2. Coupling Model for the Spatiotemporal Effects

Deep foundation pits are excavated in layers, and the soil and supports are subjected to computer coupling simulation analysis based on the horizontal stiffness generated by elastic deformation.
U n i j = K i j a = 1 n u a 1 2 K h a K h a 1 T L = X L   Y L   Z L T T U = X U L 0 0 0 Y U L 0 0 0 Z U L
The U 1 value is obtained through the algorithms and programs of the calculation software. Considering the influence of space-time effects on the change of K h , the force corresponding to each interval generated by σ n is calculated in layers and corrected according to the elastic stiffness of different soils under the   i -th working condition.
U n i j is the displacement of the support system at i   depth j under the n th working condition; u a 1 is the deformation increment under working condition a ; K h a is the equivalent horizontal resistance coefficient of working condition a ; K h a 1 is the working condition The equivalent resistance coefficient when a − 1; X L , Y L , Z L is the value of the three-dimensional space element node, and T L is the transformation matrix formed by three parameters; T U is the three-dimensional space effect coupling model; X U L , Y U L , Z U L is the three-dimensional coupling model index parameter [17].

2.3. Stability Evaluation Indicators for Support System

Due to the influence of the foundation pit’s surrounding environment and the soil’s irregular settlement, the support system is deformed. The soil at the bottom of the foundation pit may move vertically upward, and the soil at the bottom will bulge after shear failure, eventually causing the maintenance system to become unstable or collapse. The stability calculation formula of the maintenance system is established based on Prandtl’s ultimate bearing capacity theory [18].
K = r m D tan 2 45 ° + φ 2 e π tan φ + c N q 1 / tan φ / ( Q + G ) / S
where K is the stability coefficient of the support system; γ m is the weighted average weight of the soil above the ground of the support structure in the foundation pit; G is the weight of the support structure itself; D is the embedded depth of the support structure; S is the bottom cross-sectional area of the support structure; c , φ are the cohesion and internal friction angle of the soil below the bottom of the support structure.

3. Results

For the research to ensure the safety and stability of engineering construction, it is necessary to conduct a more comprehensive and in-depth study of the various mechanical behaviors of soft soil foundations from both macro and micro perspectives so that the theory can guide engineering construction more effectively [19].
The total land area of the XSS-10D commercial complex project is about 34,626.00 m 2 , with a total construction area of about 175,950.03 m 2 . The buildings constructed mainly include a 31-story one-office building, a 20-story two-research office building, and auxiliary buildings ranging from 2 to 4 stories.
According to the foundation soil’s physical and mechanical properties and burial characteristics, the foundation soil layer in the site is divided into five engineering geological layers (Figure 2). The stable burial depth of groundwater is 0.40~2.10 m, and the water level elevation is 2.52~4.79 m.
According to the foundation soil’s physical and mechanical properties and burial characteristics, the foundation soil layer in the site is divided into five engineering geological layers (Figure 2). The stable burial depth of groundwater is 0.40~2.10 m, and the water level elevation is 2.52~4.79 m (Table 1).
  • The one # office building is 31 stories high, with a maximum load of 31,000 kN for a single pile. The 3rd layer of medium-weathered tuff is used as the bearing layer of the pile foundation. The pile type is a boring (punched) cast-in-place pile with a diameter of 1000 mm or more, and the design principle is to enter the 10th-3rd layer of medium-weathered tuff for more than 15 m.
  • The two # scientific research office buildings are 20 stories high, with a maximum load of 18,000 kN for a single pile. The 10th-3rd layer of medium-weathered tuff is used as the bearing layer of the pile foundation. The pile type is a bored (punched) cast-in-place pile with a diameter of 800 mm or more, and the design principle is to enter the 10th-3rd layer of medium-weathered tuff for more than 10 m.
  • The maximum load of a single pile for the podium and basement is 4500 kN; the 10-3 layer of medium-weathered tuff is used as the bearing layer of the pile foundation. The pile type is a bored (punched) cast-in-place pile of 600 mm and above. The entire cross-section of the pile end entering the bearing layer is not less than 1 d.

3.1. Load Analysis

In this case, the maximum excavation depth of the bottomless foundation pit is −9.050 m, and there is a “depth effect”. Abaqus/CAE 2021 finite element software was used for analysis, and a three-dimensional numerical model was established. The support system is ∅850 triaxial cement mixing pile water-stop curtain + ∅850 bored pile + ∅850 triaxial cement mixing pile passive zone reinforcement. Since the foundation pit excavation process is a dynamic construction process, the axial force of the reinforced concrete structure support and the passive zone soil pressure are constantly changing throughout the process and are passive forces. Therefore, the elastic support simulation (Figure 3) is used in the plane elastic foundation beam method to realize the analysis of the entire construction process [20].
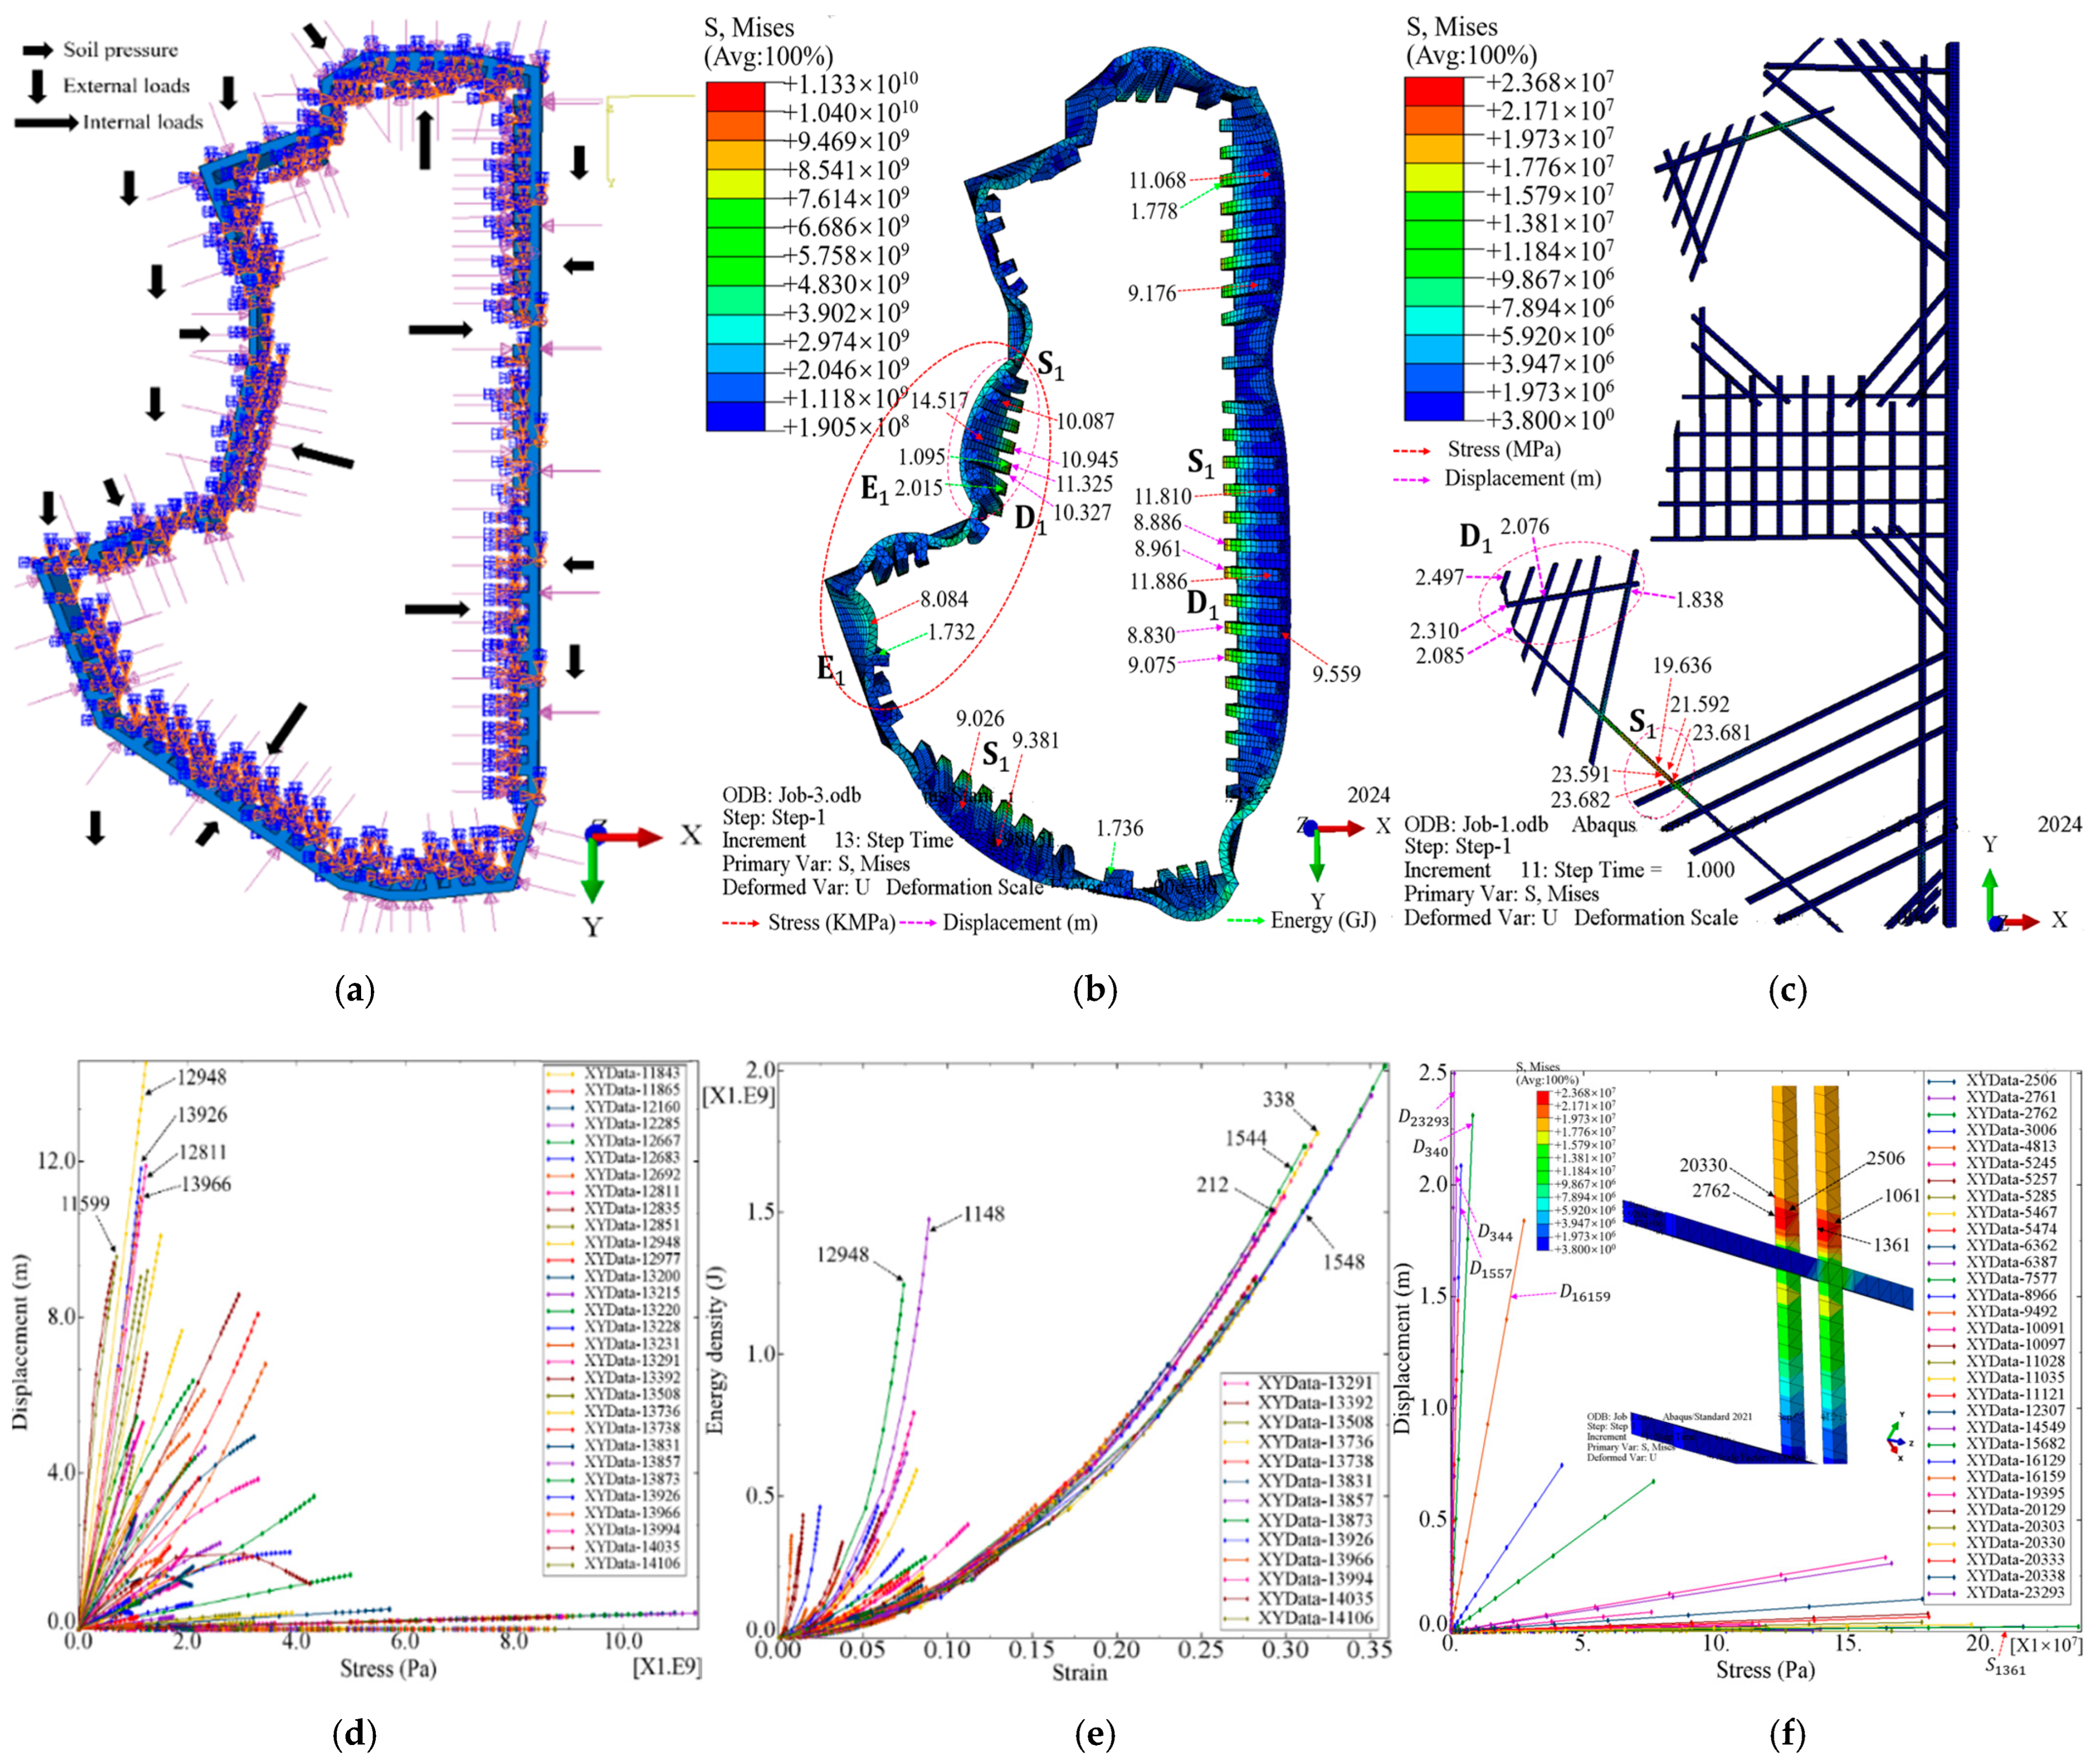
  • The enclosure’s lateral deformation depends on the enclosure’s stiffness, the support spacing, the effective insertion length of the enclosure, the passive soil resistance in the pit, the soil pressure outside the pit, and the axial stiffness of the elastic support.
  • The lateral deformation control caused by soft soil rheology is analyzed using the Kelvin model, which is a mechanical model that represents a viscoelastic material as a spring and a damper in parallel [21].
  • The soil’s dead weight is considered in the load analysis (the width is 25.95 m, and the excavation depths are 5.05 m and 9.05 m, respectively). During construction, the equivalent load is 20.0 kN/ m 2 , which is evenly applied to the road surface around the foundation pit. The soil pressure generated by the deadweight of the soil around the foundation pit is 14,298.28 kN/ m 2 (the total soil pressure Q p is 67.35 × 10 6 kN; see Figure 3 for direction), and the soil pressure X p i inside the foundation pit is 33,182.90 kN/ m 2 (the total soil pressure Q p is 241.80 × 10 6 kN, see Figure 3 for direction). A uniform surface load is applied to the road model near the foundation pit as a vehicle load, and the load value is 28 kN/ m 2 . The concrete support of the retaining structure is designed to be 25.0 kN/ m 3 , and the column piles and retaining piles are 25.0 kN/ m 3 [22].

3.2. Outdoor Testing and Experimentation

Regulations and technical standards were conducted in this experiment, and mechanical drilling was used to collect soil samples for laboratory tests and various in-situ tests such as standard penetration tests, heavy cone dynamic penetration tests, and single-hole wave velocity tests [23,24,25,26,27]. The conclusions drawn from a series of experimental models are clarified by explaining the influence of experimental behavior. Numerical comparison studies between field measurements and numerical model predictions are performed. The obtained results aim to illustrate the robustness of the proposed 3D finite element analysis [28]. Four XY-1 drilling rigs were operated, and 70 exploration holes were completed.

3.2.1. Consolidation Coupling

The consolidation test data show that the data points do not show discrete incremental non-uniform changes. Therefore, a three-dimensional consolidation element and a triaxial element pressure chamber model were established to analyze the stress changes during the loading process. The finite element model is assembled according to the components of the consolidation equipment. The test diameter of the silty clay sample is 60 mm, the thickness is 20 mm, the elastic modulus is 12 MPa, the Poisson’s ratio is 0.32, and the soil sample density is 1896.94 Kg/m3. It is established the number of messes is 74,480 groups, the approximate global size is 0.01, and the maximum deviation factor is 0.0 < h / L < 0.05. The sample model has 880 groups of mess, divided into four types of components loading according to the test pressure: 50 kPa, 100 kPa, 200 kPa, and 400 kPa.
After establishing the finite element model, the test loading sequence was 50 kPa, respectively. The stress of the silty clay sample in the limited space was quickly transferred from the central area to the peripheral position. Under the constraints of the test container, the maximum stress interval was concentrated in the soil sample. Seven nodes (stress = 53,621.195 Pa) are in the surrounding area (Figure 4).
The soil sample’s longitudinal displacement ranged from 0.00000 to 0.00011 m under the transverse restraint of the steel drum. The above data proved the rheological properties of the soil. Under 100 kPa loading, the highest point of internal stress in the soil sample increased to 107,329.398 Pa, and the displacement range was 0.00000~0.000219 m.
The stress diffusion observed through dynamic video was the same, and the red high-stress area gradually increased (Figure 4). Under the 200 kPa loading condition, the soil sample stress reached 214,999.20 Pa (node 7), and 100% of the stress exceeds the 124,869.70 measuring point. The displacement range is 0.00000~0.000438 m. Under continuously increasing load, S ¯ 50 : S ¯ 100 : S ¯ 200 = 42,782.679:86,419.254:165,759.216 = 1:2.01:1.92, D ¯ 50 : D ¯ 100 : D ¯ 200 = 0.0001097:0.0002193:0.0004380 = 1.000:1.999:1.997. The analysis data show that the internal stress change rate of the soil sample is decreasing, and the displacement continues to increase. The ultimate load of the soil sample is 400 kPa, and the maximum stress is 431,296.80 Pa (node 7), S ¯ 200 : S ¯ 400 = 1.00:2.60. Data analysis. During the four loading processes, the increment in the internal stress of the soil sample is decreasing, D ¯ 200 : D ¯ 400 = 1.000:1.993, and the displacement remains unchanged.
Analysis conclusion: Therefore, the finite element analysis of the above four working conditions proves silty clay’s plasticity and highest compression characteristics. At the same time, the study found that the low-strain area in the center of the soil sample was gradually expanding (dark blue area) (Figure 4). It is the core influencing factor causing rapid damage to the foundation pit structure.

3.2.2. Single Hole Wave Velocity Testing

In the standard method of on-site testing, the influence of regional factors causes different uncertainties in the measurement process. Yong Fan [29] established an inherent variable vs. model to analyze the discrete type of random variables and added a normal distribution with mean and standard deviation to further eliminate the differences in research:
ln V S = μ + σ Z V S = 11.711 q c 0.3409
In the Equation, V s is shear wave velocity; μ is normal distribution; σ is standard deviation; q c is tip resistance; Z is a random variable of normal distribution.
The single-hole wave velocity test used the RS-1616 K (P) pile dynamic testing instrument developed and the CDJ-JG38 high-sensitivity in-well three-component detector. The excitation equipment is the vibration origin plate and heavy hammer; the process of obtaining the propagation speed V s of a particular soil layer wave by using the vibration generated by the artificial knocking of a wooden board [30,31,32].
The properties of foundation soil can be determined by shear wave velocity. Four sets of measuring points were selected, namely, Z15, Z24, Z44, and Z52, with testing depths of 20 m (Figure 5). One set of shear wave velocity was collected per meter, and the average wave velocities of different strata were calculated, namely = 127.8, 144.3, 111.8 m/s; A Z 15 = 124.7, 112.6, 132.3 m/s; A Z 24 = 124.8, 112.6, 128.8 m/s; A Z 44 = 124.7, 112.6, 132.3 m/s. The maximum shear wave velocity was 148 m/s, located at a depth of −6 m in Z15. The minimum shear wave velocity of A Z 52 was 105 m/s, located at a depth of −17 m in Z52 (Figure 5a). According to the equivalent shear wave velocity design data, it was found that Z15 = 118.7 m/s; Z24 = 114.6 m/s; Z44 = 121.2 m/s; Z52 = 116.8 m/s. By comparing the average data and conducting the fitted equivalence analysis, it was found that v s ≤ 150 m/s; the construction site is classified as class III; the depth is within the range of 20 m. Based on the established Equation (7) model, the q c value interval after adjustment is analyzed: 640.36 kN < q c Z 15 < 1704.69 kN; 640.36 kN < q c Z 24 < 1165.31 kN; 713.88 kN < q c Z 44 < 1388.42 kN; 713.88 kN < q c Z 52 < 1330.21 kN.
Analysis conclusion: After comparative modeling and analysis, the data improved the smoothness and robustness of q s and V s . After meeting the design interval requirements, the performance of the two parameters was improved ( q c R = 600 mm = 989 kN; q c R = 800 mm = 1759 kN; q c R = 1000 mm = 2749 kN) (Figure 5b). The silty clay particles have large porosity, high compressibility, and poor bearing capacity.

3.3. Indoor Testing and Experimentation

The indoor geotechnical test was carried out strictly per the relevant provisions of the Standard for Soil Test Method (GB/T50123-2019) [30].
  • The conventional physical and mechanical performance tests of undisturbed soil include indicators such as liquid limit, internal friction angle, cohesive force, etc.
  • For the natural (saturated) uniaxial compressive strength test samples of rocks, the development of joints and cracks is uneven. It is necessary to analyze the maximum value, minimum value, average value, statistical sample size, and statistical coefficient of variation [31].
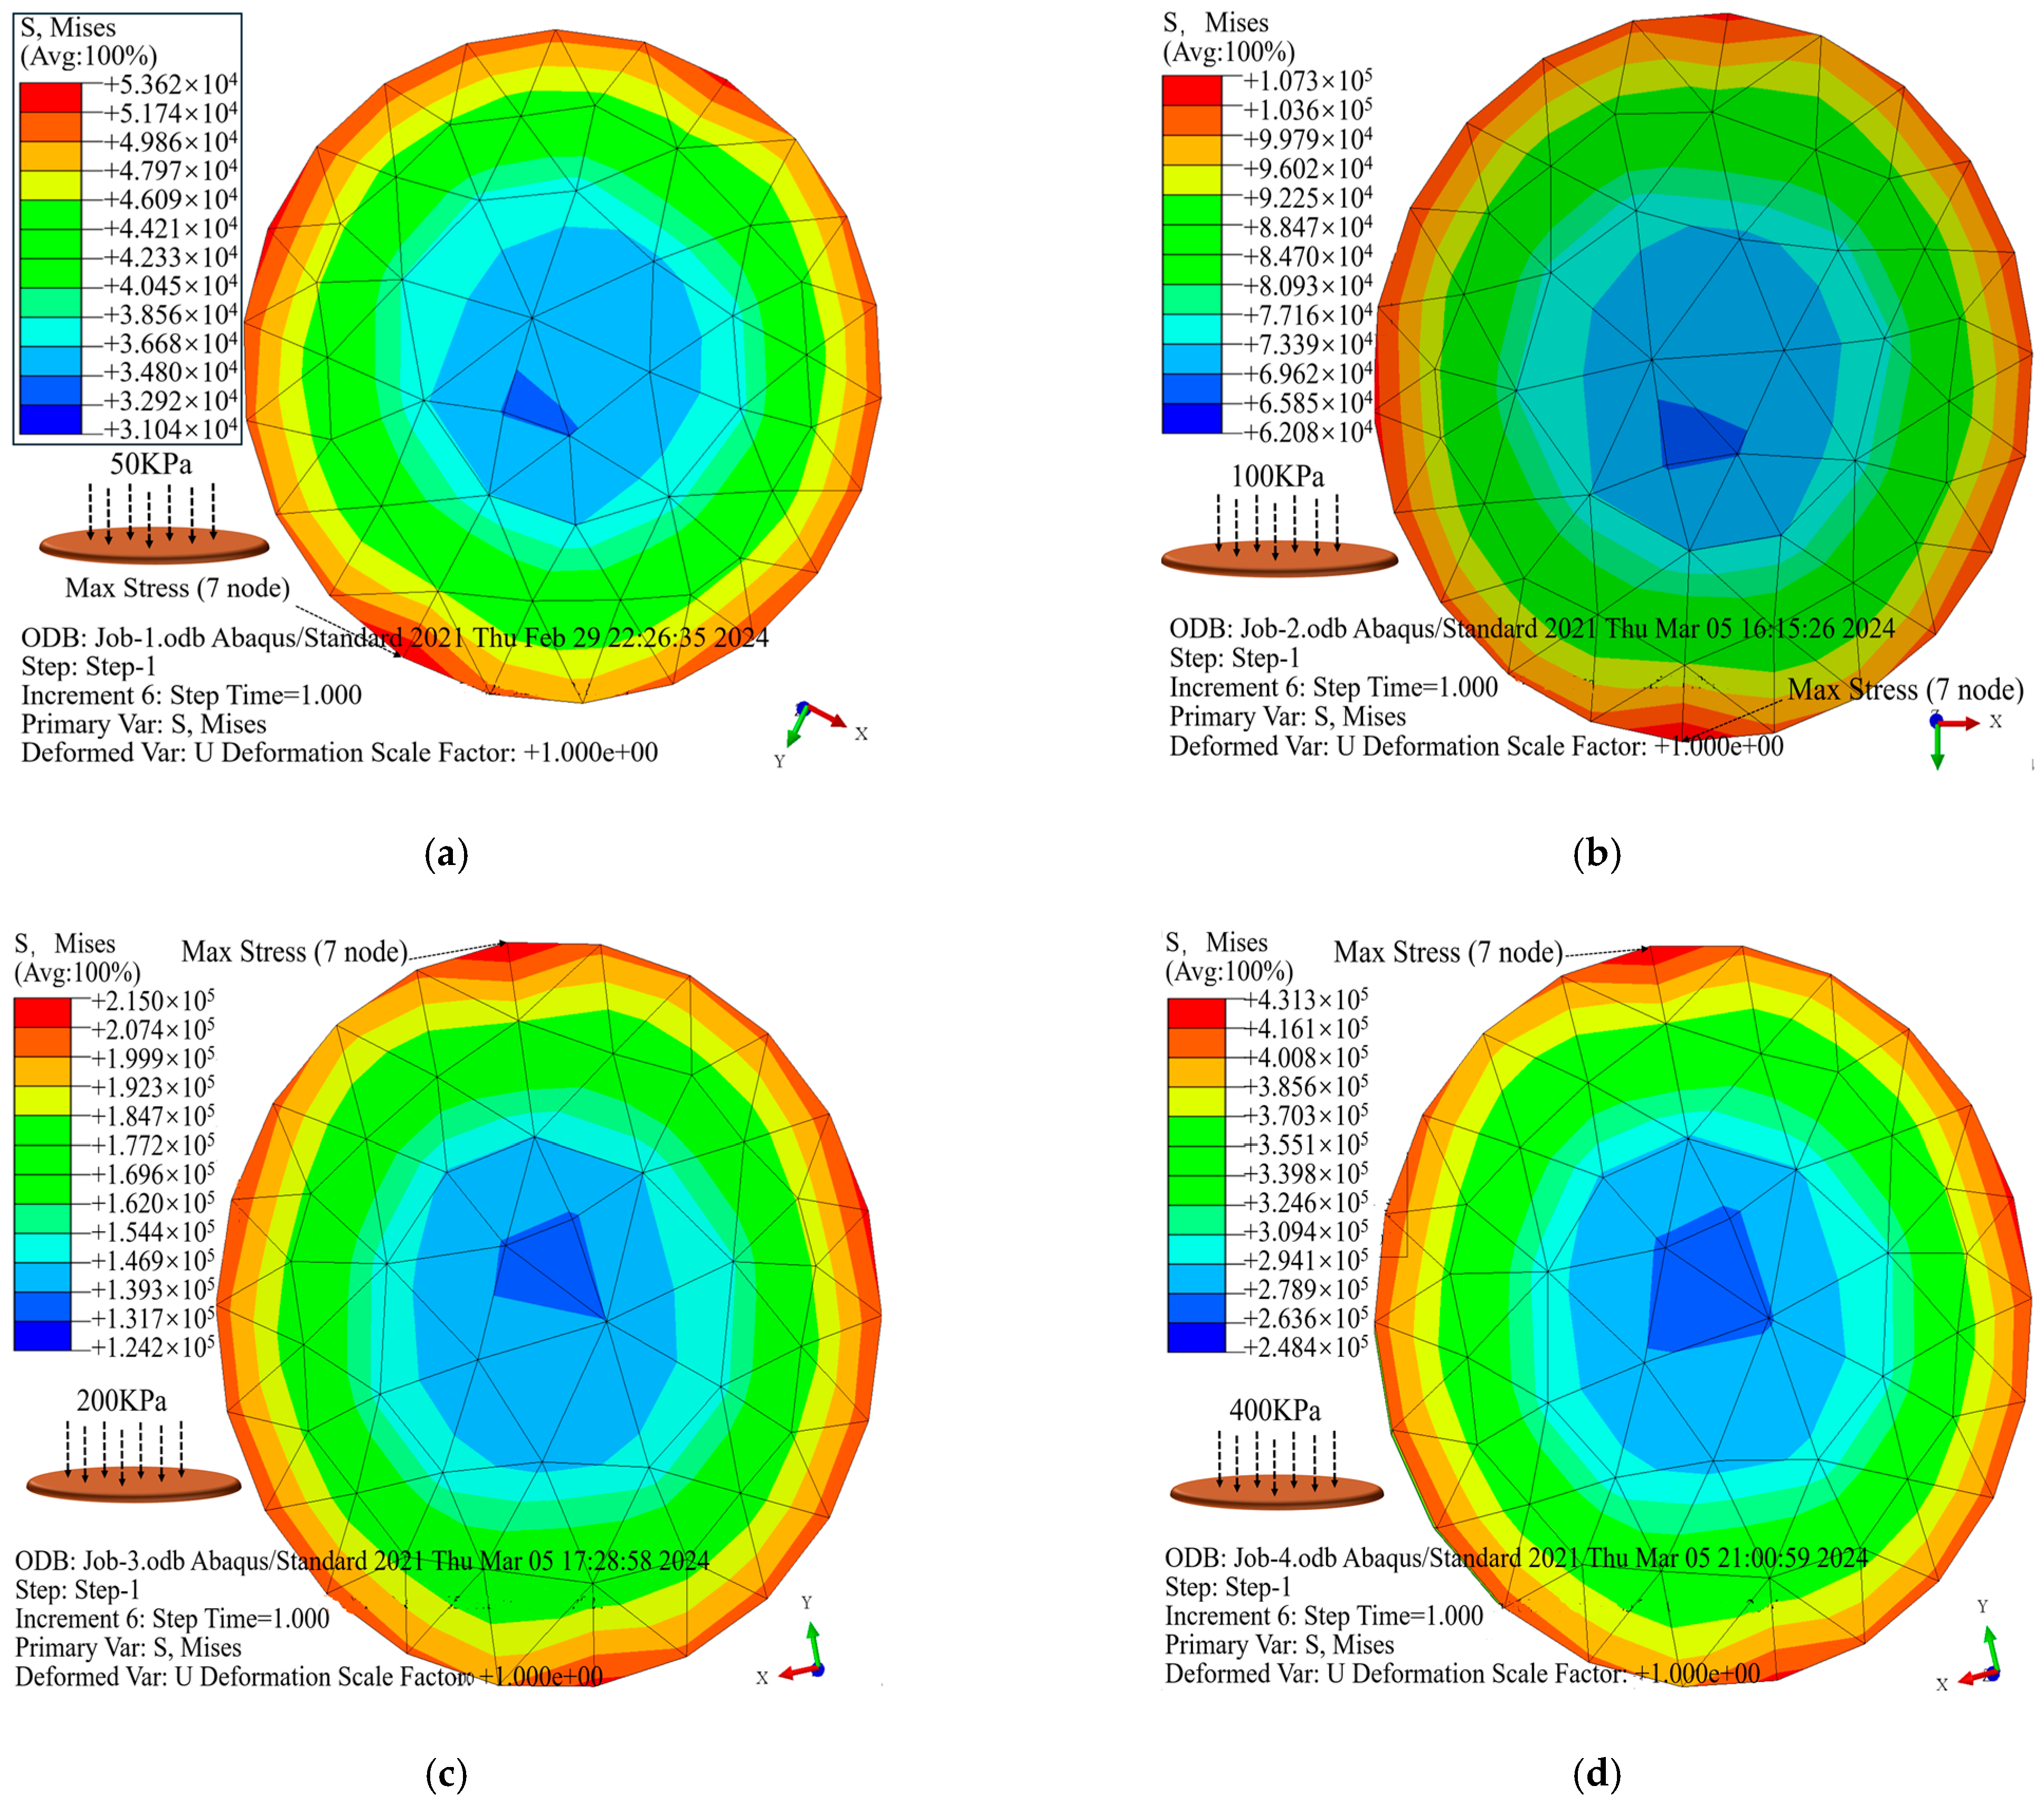
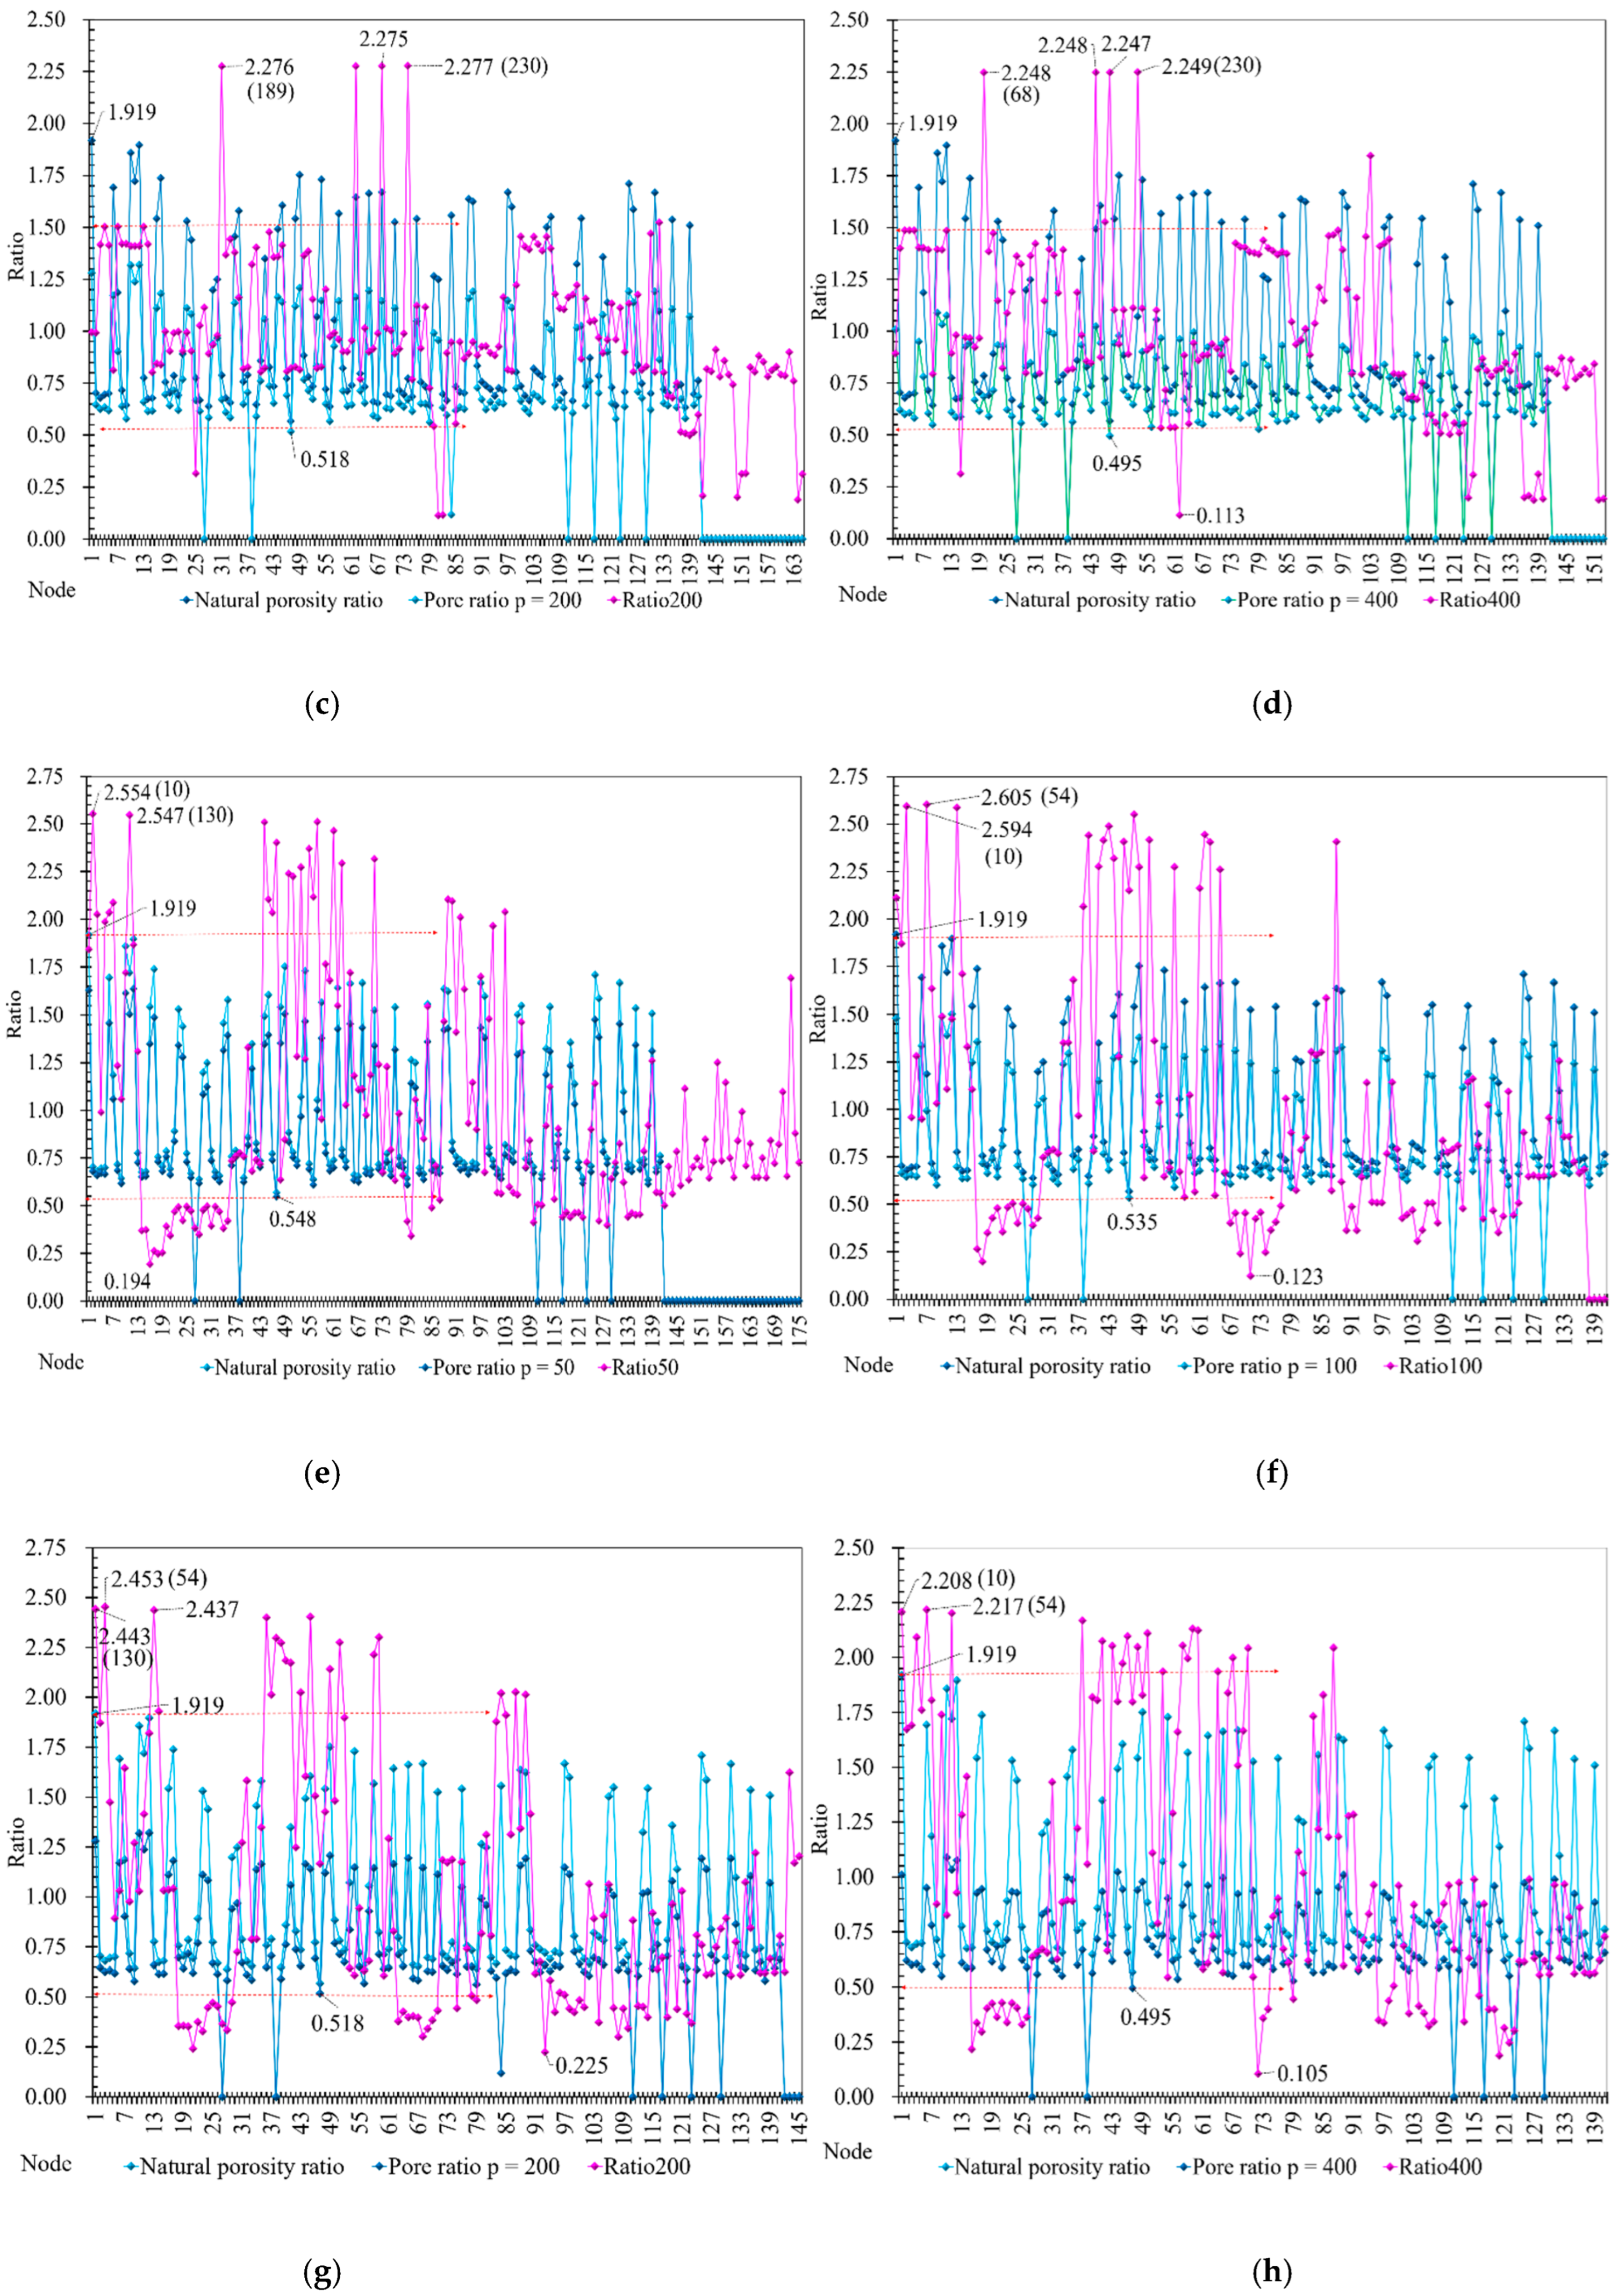
  • One hundred forty-one sets of soil samples and 29 sets of points were collected in the geotechnical test. The average sample bottom depth is 19.89 m, and the moisture content range is 19.90%~68.50%, with an average of w = 34.41%. The highest water content range is concentrated in positions Z52-T3, T1, and Z60-T1, as well as the silt layer’s main distribution areas of the silt layer. The soil sample’s average dry density/average wet density is 0.75, consistent with the moisture content test result. The average value of natural porosity e is 0.96, and the porosity of the foundation soil is relatively large. The average liquid limit index is ω l   = 36.93%, and the plastic limit index is ω p = 21.30%, indicating a plastic state. The soil is relatively soft and has a high natural moisture content. Four pressure conditions were used to test the porosity of the soil layer: p = 50~400 MPa, average porosity e 50 = 0.878, e 100 = 0.832, e 200 = 0.765, e 400 = 0.690 (Figure 6).
Analysis conclusion: After the cohesive force test, the average c value is 25.87 KPa, indicating that it is brittle and prone to erosion and fragmentation; the mutual attraction and adhesion between soil particles are poor, and finite element coupling analysis of microstructure is necessary.

Soil Microstructure Analysis

After linear regression analysis, the rock’s microstructure was given a fractal dimension ratio equation, which improved the optimal fractal model reflecting pore size distribution and pore size distribution [32]:
> r 1 r / r m a x 3 D 1 r / L 3 D r m a x / L 3 D r / L 3 D
In the equation, is the porosity; D is the fractal dimension of the porous medium; r is the pore diameter; r m a x is the maximum pore diameter; L is the measured size of the particles.
Based on the Sierpinski carpet model, a void ratio analysis model is established at p = 50, p = 100, p = 200, and p = 400. To determine the finite element model, the model follows the sampling standards of ring knife R = 61.8 mm, h = 20 mm, S = 30 cm2, V = 60 cm3 size. The bearing layer of the soil sample is in the pebble-sand layer, the elastic modulus is 148 MPa, the density is 1947.96 kg/m3, Poisson’s ratio is 0.245, and the test loads are divided into 50 MPa, 100 MPa, 200 MPa, and 400 MPa (Figure 7a,d).
Based on the Sierpinski carpet model, a void ratio analysis model is established at p = 50, p = 100, p = 200, and p = 400. To determine the finite element model, the model follows the sampling standards of ring knife R = 61.8 mm, h = 20 mm, S = 30 cm2, V = 60 cm3 size.
The bearing layer of the soil sample is in the pebble-sand layer, the elastic modulus is 148 MPa, the density is 1947.96 kg/m3, Poisson’s ratio is 0.245, and the test loads are divided into 50 MPa, 100 MPa, 200 MPa, and 400 MPa (Figure 7a,d).
As shown in Figure 7, under a constant load of 50 KPa, the single body stress is concentrated at the central pore intersection position S 230 = 132,450.97 Pa, and the maximum displacement D 21 = 0.00001482 m. Through the analysis of the change rate of and S , the change interval of / S and the void ratio changes up and down in the same interval, and the limit value accounts for 5.5% of the total value (Figure 7). Under 100 kPa load, the maximum S 230 = 265,131.25 Pa, and the maximum displacement D 140 = 0.00006358 m. The change interval of / S changes up and down in the same interval as the void ratio, and the limit value accounts for 4.1% of the total value (Figure 8).
Analysis conclusion: Based on the analysis of the above data, this study demonstrated that the porosity distribution between the porosity in shrinkage cracks and the microporosity of the clay matrix is caused by the evolution of the “honeycomb” microstructure inside the structure.

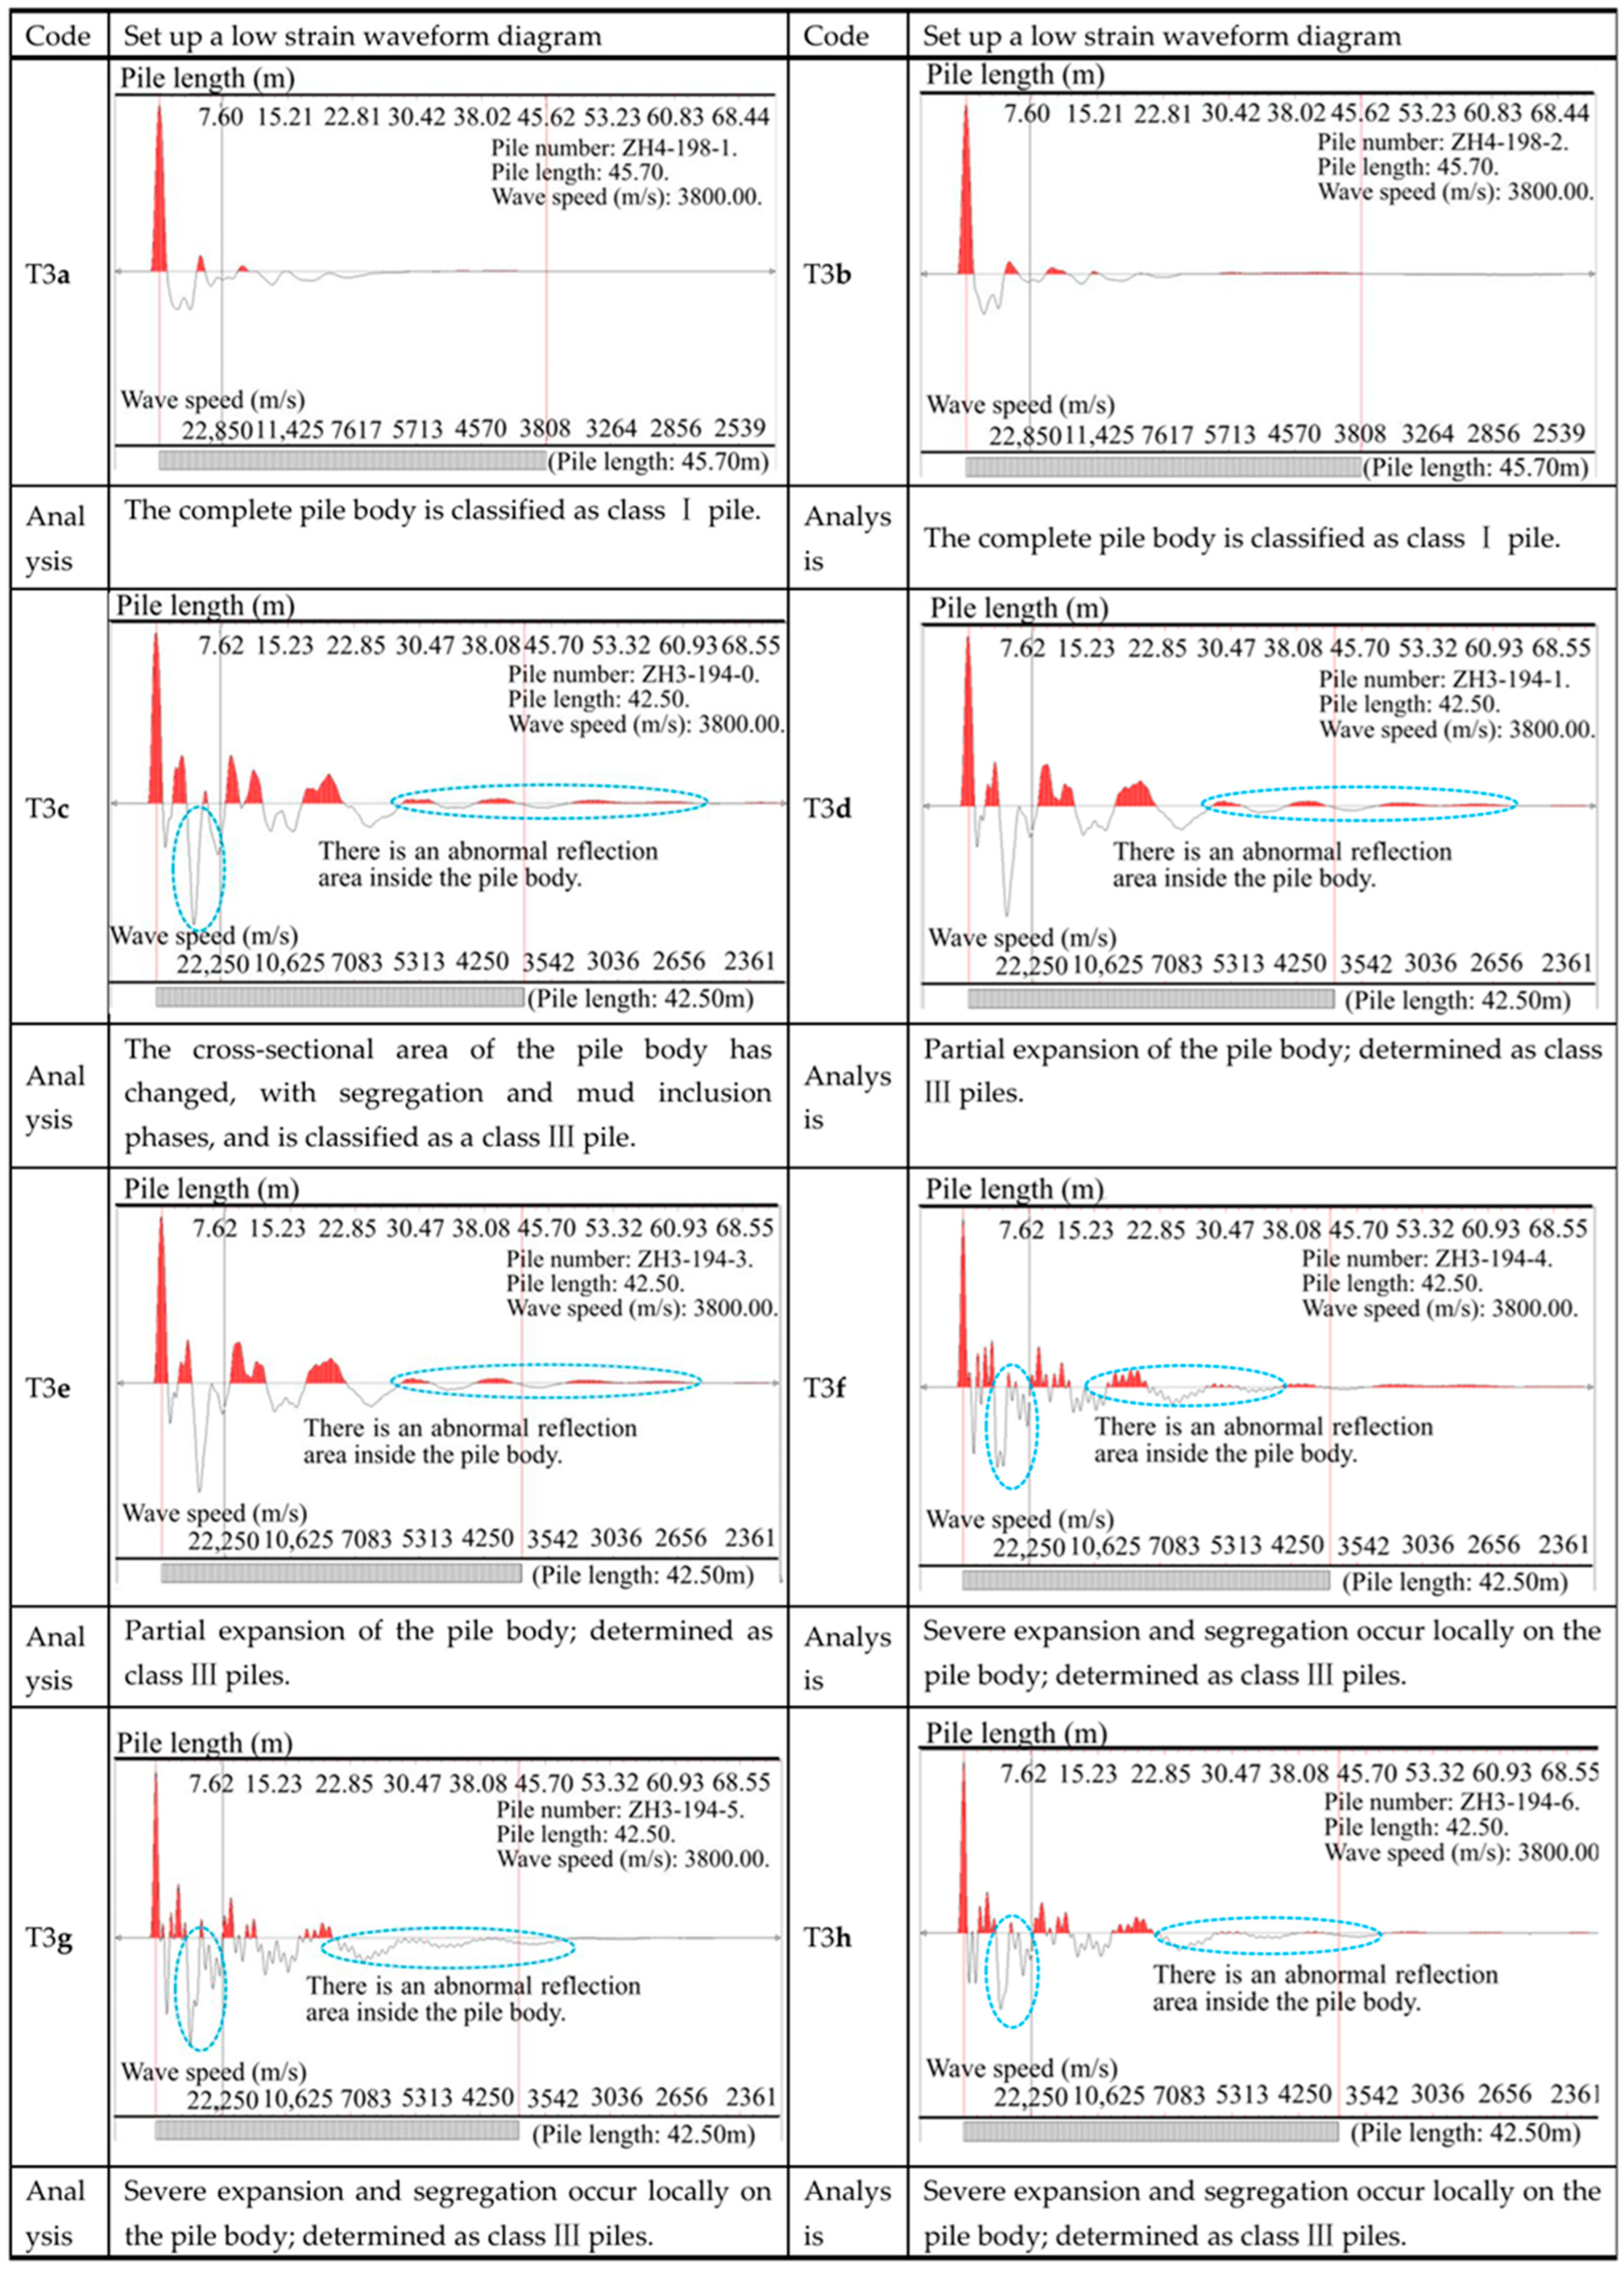
3.4. Low Strain Wave Velocity Testing

After the completion of indoor and outdoor testing and experimentation in Section 3.1, Section 3.2 and Section 3.3, the range of quality defects in the foundation pit can be determined, and the defect interval can be narrowed down through intelligent testing graphics.
The XSS-10D pile foundation uses 346 ZHI compression piles and 767 ZH2, ZH3, and ZH4 compression and uplift piles. After 28 days of pile foundation pouring, the integrity of each pile body is first tested using a single-hole wave velocity, with crosstalk suppression > 80 decibels, amplitude consistency < 1%, phase consistency < 0.5 ms, and a frequency response range of 0.1~4000 Hz. The ultimate value of the R Z H 1 = 900 mm test pile is 13,000 KN, and the ultimate value of the R Z H 2,3 , 4 = 700 mm test pile is 7300 KN.
Each low-strain pile foundation is fully monitored, with four sets of points/single pile, totaling 4452 sets of measuring points numbering ZH1-1~346: ZH2, ZH3, and ZH4-1~767 (Figure 9). The ZH2-194 low-strain waveform diagram was found to be abnormal, and it was preliminarily determined that there were expansion and concrete defects in the pile foundation within the range of 8.74~11.42 m. The project team reviewed the on-site construction records. The project team has decided to use static load testing to monitor the quality of the ZH2-194 pile foundation.

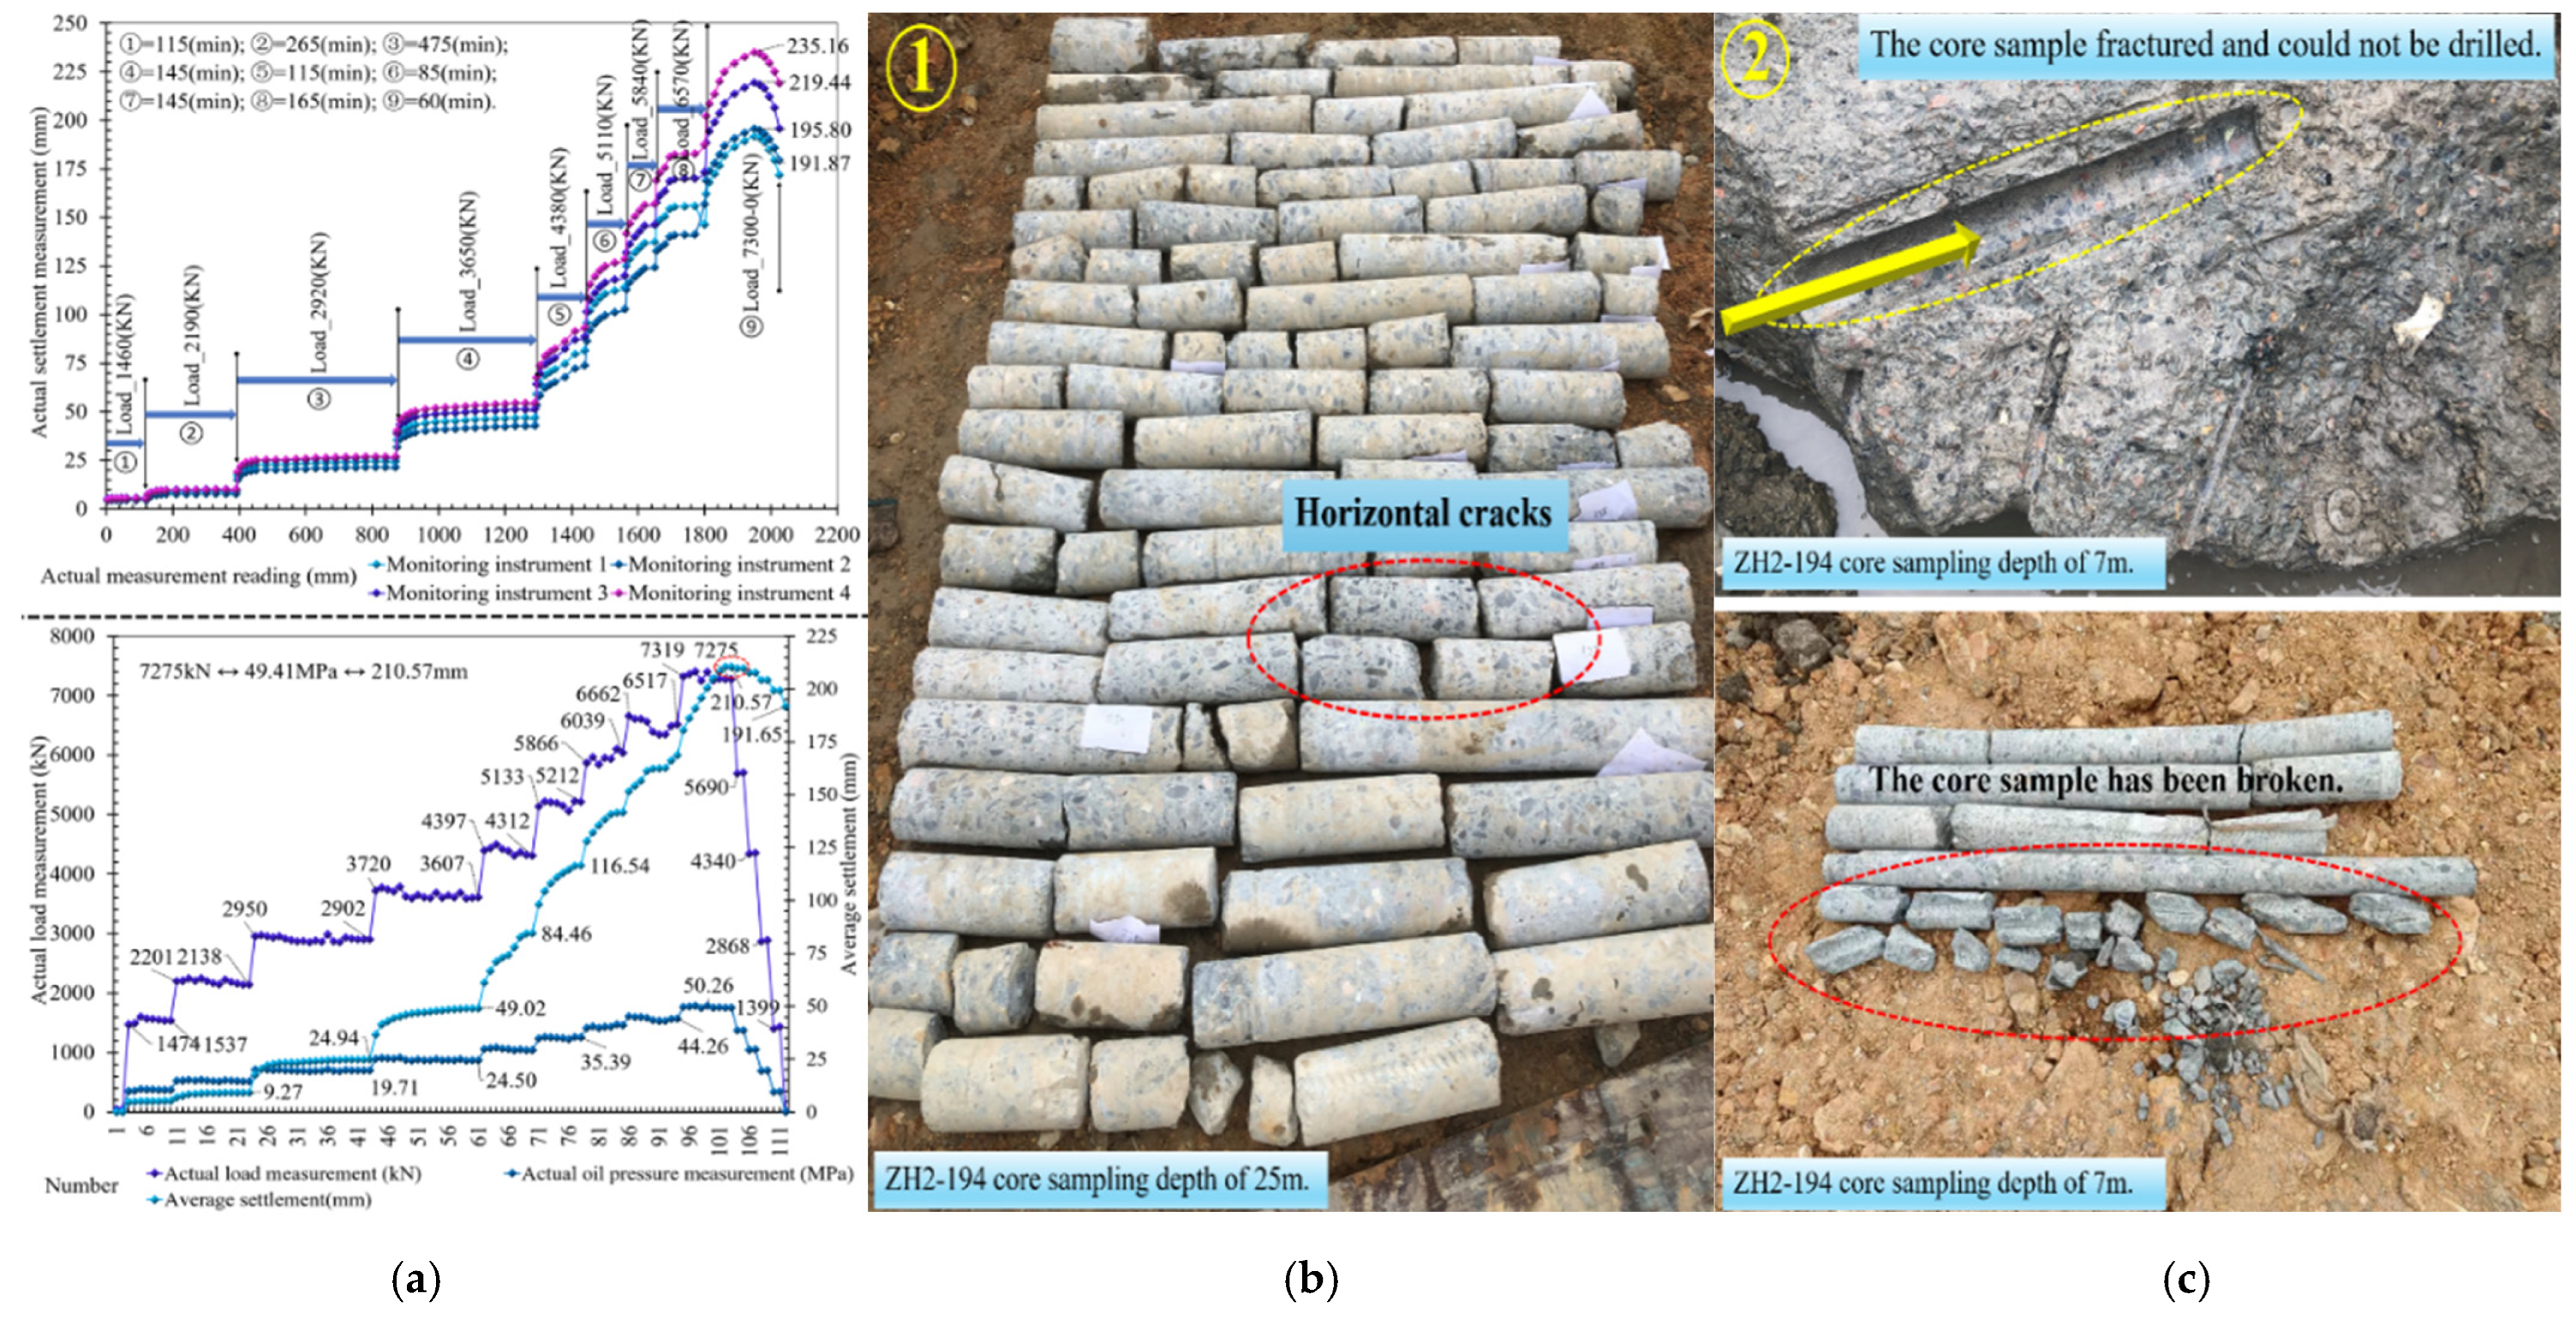
Static Load and Core Sampling

According to the experimental specifications, the proportion of static load tests is 1% of the total number of piles, with 15 ZH2-194 piles added.
The design characteristic value of =700 mm is 3550 KN, and the required ultimate bearing capacity loading value is 7300 KN (Figure 10a); R R a the design characteristic value of R = 900 mm is 5900 KN, and the required ultimate loading value of the bearing capacity is 13,000 KN; using the slow maintenance load method for graded loading, the total settlement R ≤ 800 mm is L = 30~50 mm, and R > 800 mm is L < 0.05 R.
A single pile’s vertical compressive ultimate bearing capacity is loaded using a hydraulic jack, and the counterweight of the reaction device is composed of steel beams and concrete blocks (Figure 10). With a settlement range of 2.87~210.57 mm. According to the research findings, ZH-8, 106, 162, 198, 244; ZH2-123; ZH3-53, 155, 191, 48, 65; and ZH4-172,184 meet the required range, and ZH3-194 exceeds the limit range of 205.57~207.57 mm.
Therefore, the experimental group analyzed the detailed process data of ZH2-194. The load was loaded in fourteen stages, with a total cumulative time of 2025 min, a maximum rebound amount of 18.92 mm, and a rebound rate of 8.99%. The load is loaded in nine stages, with a maximum design load of 7300 kN. The maximum observation time for each stage from loading to the stable stage is 480 min under 2920 kN, and the minimum observation time is 90 min under 5840 kN. The observation time in the stable stage is 150 under 7300 kN, and the pile foundation has reached the maximum average settlement of 210.57 mm. Sufficient data prove that there are quality defects in the ZH2-194 pile foundation (Figure 10a).
ZH2-194 has set up two core sampling holes. The first core sampling hole of the pile body is located at the center of the pile core, and it cannot be drilled when it touches the steel bar at about 25 m. The core sample is complete. Combined with deep hole imaging, transverse cracks are found at 7.2 m (Figure 10). The second core sampling hole on the pile body is located at the edge of the pile (inside the steel cage). It cannot be drilled to a depth of about 3 m as it touches the steel bar. After adjusting the core sampling position, it can be drilled to a depth of about 7 m. There are fragments in the core sample (Figure 10b,c).
Analysis conclusion: The cross-sectional size of the pile body has undergone relative changes at 7 m, and the local concrete of the pile body has been broken, losing the compressive strength of the specimen, once again confirming the conclusions of low-strain and static-load tests.

4. Discussion

Through on-site data testing and laboratory data analysis in Section 3.2 and Section 3.3, it has been confirmed that the researchers have identified the critical areas where the foundation pit structure is about to fail and become unstable during excavation. Therefore, it is clearer that the target is concentrated in zone D 1 , which fully demonstrates the robustness of the modeling analysis in Figure 11.
According to the above experimental research and analysis, the bearing capacity of ZH2-194 cannot meet the design requirements. When the structure exhibits nonlinear behavior characteristics and fractures under ultimate strength, the average displacement and tangential displacement, local pressure, and deformation field of key elements fail, resulting in sheer and tensile failure [33]. Therefore, a finite element coupling model was established with ZH2-194 as the center area to expand the research range for discussion and analysis.

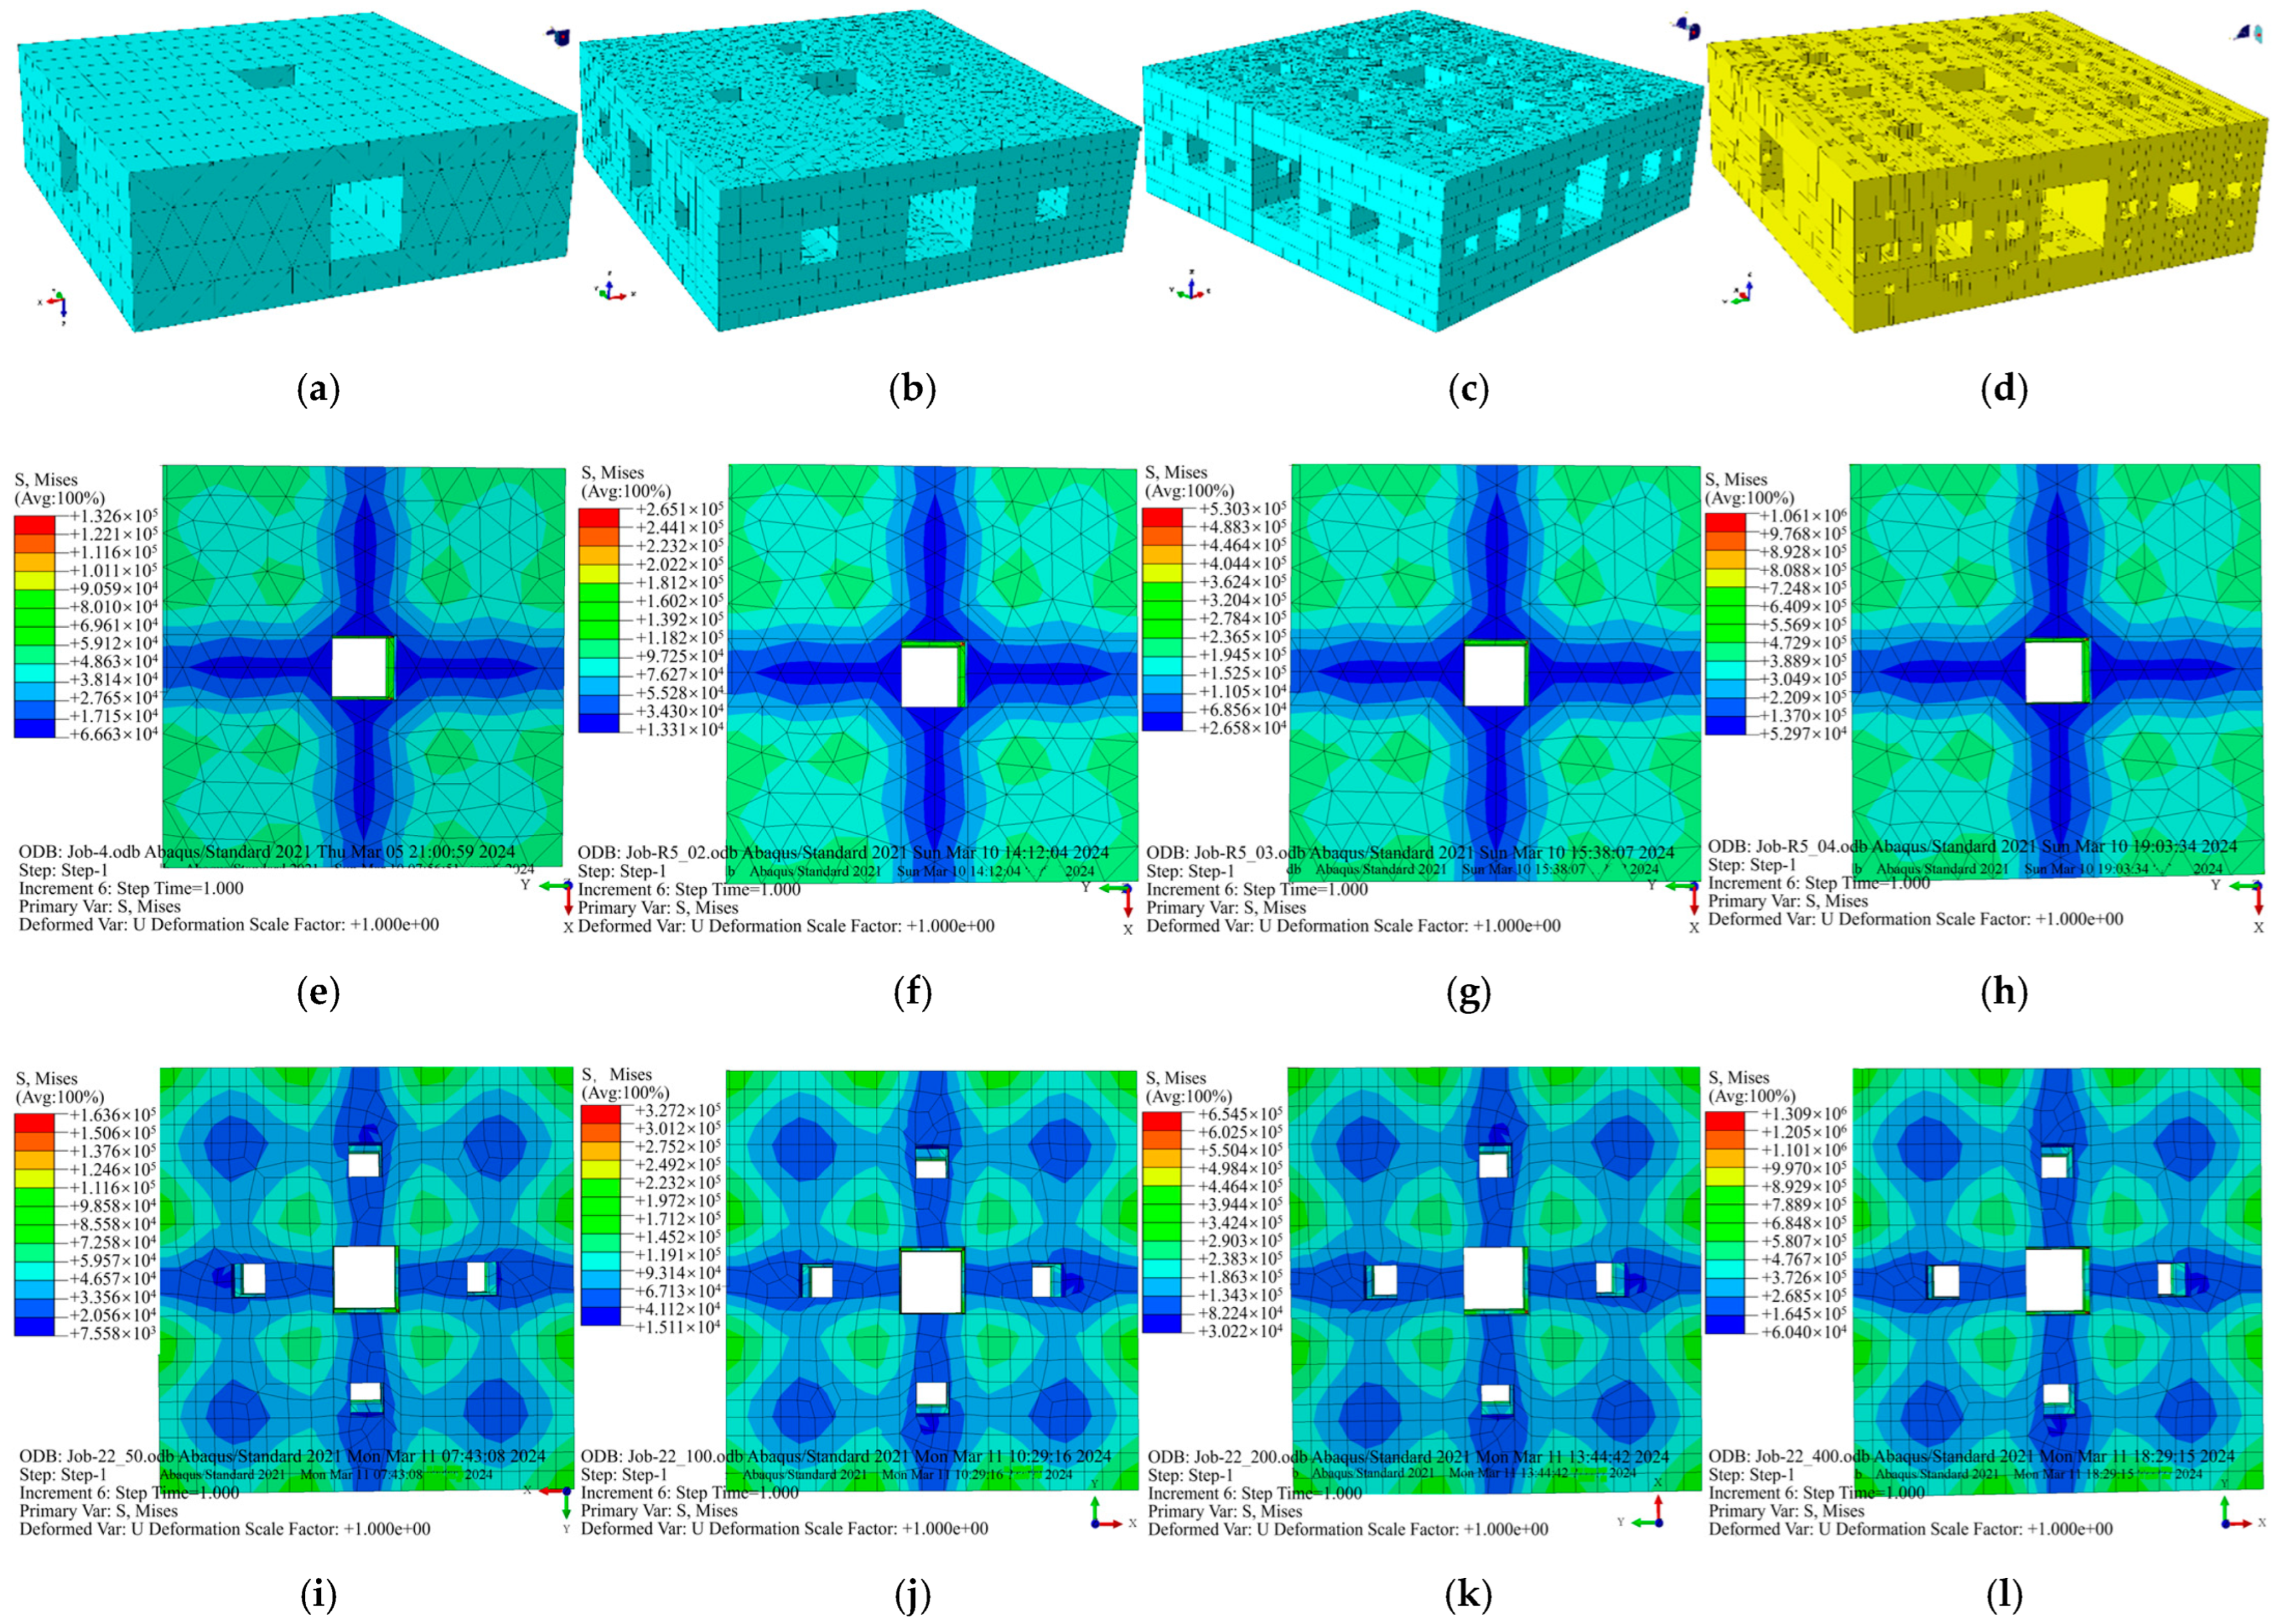
4.1. Numerical Simulation Analysis

A three-dimensional computational model was established to study the usual constraints imposed by the soil around the foundation pit and the support system inside the foundation pit and analyze the deformation and failure characteristics of the foundation pit. Due to the significant changes in the strata, the foundation pit excavation is layered, the soil material obeys the Mohr–Coulomb yield criterion, the support system is constructed using solid elements, and the contact elements obey the Coulomb failure yield criterion and the tensile failure yield criterion (Table 1).

4.1.1. Overall Support System

Seepage damage in rivers is caused by soil erosion and water seepage through walls. Seepage damage is related to insufficient groundwater in the water-rich soil of ordinary aquifers or confined aquifers. The west and north sides of XSS-10D are rivers with perennial water flow. Environmental Implications of Altered River Water Levels The riverbank’s water pressure around the river is replaced by a uniform load without setting up precipitation wells [23]. The highest flood level of the Wujiaba River is 3.76 m, and the relative maximum depth of the riverbed is 4.96 m. The calculated P 167.40 = 26,300.77 kN (the length of the riverbank curve is 167.40 m).
Soft soil has prominent consolidation creep characteristics. Soft soil creep can lead to ground settlement and slope instability. A creep test is necessary to understand soil creep characteristics qualitatively, establish a creep constitutive model, and determine model parameters [34]. The triaxial creep test can be used to study the creep behavior of soft clay under different stresses and strains, establish an elastic-viscoelastic constitutive model (Figure 11), and predict the time of consolidation creep failure [35].
As shown in Figure 11, the foundation pit is divided into 15,588 elements. Under the load of 3.1, the structure has a large deformation and stress concentration. The highest stress range and value shown in Figure 11a,d are S 1544 = 11,325.051 MPa~ S 1540 = 10,944.948 MPa~ S 1548 = 10,327.003 MPa~ S 1379 = 9075.098 MPa~ S 1821 = 8961.389 MPa, and the location is mainly concentrated in the S 1 area of the foundation pit (Figure 11d); the displacement distribution is D 12948 = 14.517 m~ D 12811 = 11.886 m~ D 13926 = 11.810 m~ D 13966 = 11.068 m~ D 11843 = 10.087 m and the positions are distributed in the D 1 area inside the foundation pit (Figure 11e). Energy is the core indicator of the foundation pit showing the internal energy transfer under load, which are E 1548 = 20,149.048 MJ~ E 1544 = 19,117.181 MJ~ E 346 = 17,782.948 MJ~ E 232 = 17,357.143 MJ~ E 486 = 15,075.839 MJ, and the positions are distributed in the E 1 area inside the foundation pit (Figure 11c).
Data analysis conclusion: The above finite element coupling analysis data show that the support system of the foundation pit, under the action of multiple loads, has undergone large deformation and local displacement. The area is mainly concentrated in the red curve indicated in Figure 11b. This area is also critical for monitoring and safety prevention during the foundation pit excavation process.
The support frame is one of the measures to ensure the safety of foundation pit construction. The finite element model analysis is shown in Figure 11c. The stress data are S 1361 = 23,681,564 Pa~ S 2762 = 23,681,592 Pa~ S 1061 = 21,592,308 Pa~ S 2506 = 21,592,346 Pa~ S 20330 = 19,635,828 Pa~ S 20333 = 18,035,016 Pa ~ S 5257 = 17,995,898 Pa~ S 20338 = 17,783,970 Pa~ S 11028 = 17,773,364 Pa~ S 11035 = 17,783,946 Pa. The stress is concentrated at the S 1 position in Figure 11c. Displacement is D 23293 = 2.497 m~ D 340 = 2.310 m~ D 344 = 2.085 m~ D 1557 = 2.076 m~ D 16159 = 1.839 m~ D 11121 = 1.482 m~ D 16129 = 0.744 m~ D 1850 = 0.672 m~ D 576 = 0.373 m~ D 5245 = 0.332 m. The displacement area is concentrated at the D 1 position in Figure 11c. Through the above finite element data analysis, the weakest force link of the support system is focused on the D 1 area, and the analysis results are consistent with Figure 11b.

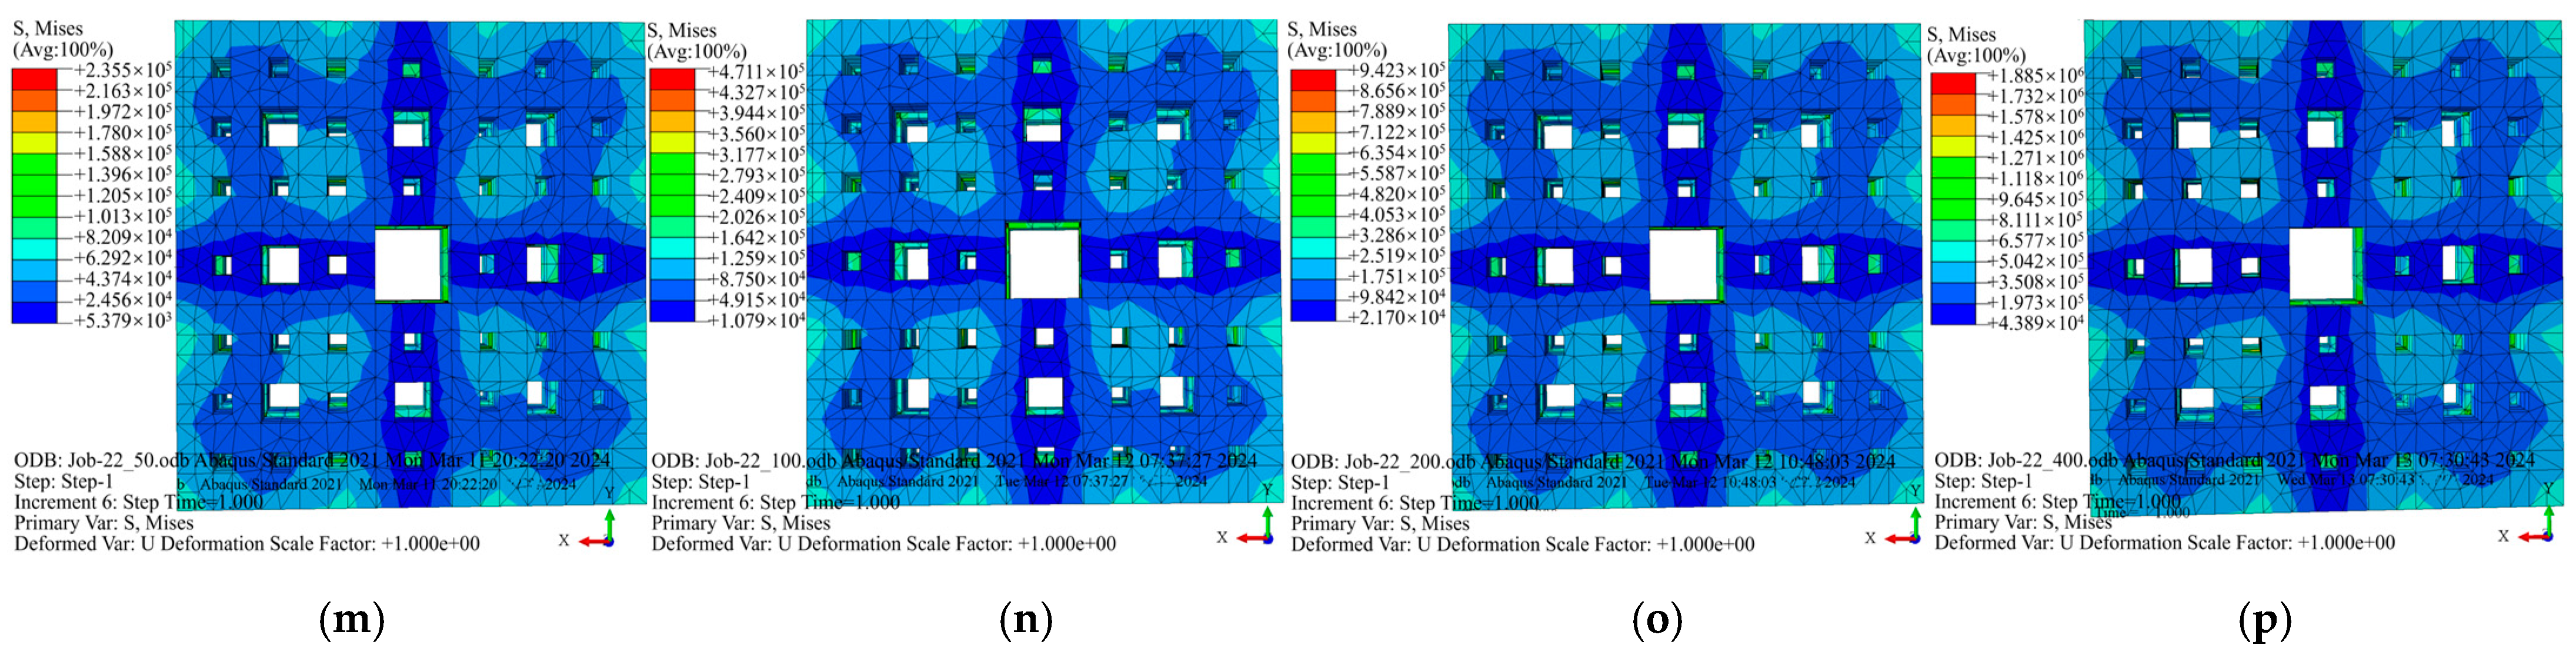
4.1.2. Damaged Component Structures

According to the design drawings, the finite element coupling model is established. The foundation pit support system is divided into four structures (Figure 2 and Figure 3). The cement mixing pile material is E 1 = 938,000 kPa, μ 1 = 0.180, ρ 1   = 2100 kg/ m 3 ; the C30 concrete value is E 2 = 28,850 MPa, μ 2 = 0.233, ρ 2 = 2360 kg/ m 3 ; the C40 concrete value is E 3 = 32,330 MPa, μ 3 = 0.249, ρ 3 = 2440 kg/ m 3 . The established finite element model is divided into 53,323 mess units (approximate global size: 1.2), analysis errors: 0 (0%), and analysis warnings: 0 (0%), showing the robustness of the model. The external load is divided into seven layers according to the classical earth pressure theory to calculate the ultimate earth pressure value (Figure 3):
The additional load outside the foundation pit is calculated according to the equivalent uniformly distributed load, and the value is 1850.15 kN. The finite element analysis takes 0.03 S to complete, divided into 61 increments, and the mutation area is concentrated in the range of 0–10. As shown in Figure 12, the retaining structure has an unstable failure surface, and the cement mixing pile maintenance system has a large displacement and damage.
P a = γ i h i + q K a 2 c K a = P 1 3082.57   kN P 3 1 11681.52   kN P 3 2 2797.02   kN P 4 1 3899.10   kN P 10 1 6556.18   kN P 10 2 5654.43   kN P 10 3 5940.32   kN
Fifty-eight sets of analysis data are selected to obtain the deformation and internal force change rules of the foundation pit. The stress changes in the data are S 695 = 2,218,539,520 Pa > S 4346 = 1,966,420,352 Pa > S 696 = 1,747,337,728 Pa > S 4337 = 1,653,827,328 Pa > S 14680 = 1,577,293,440 Pa. The strongest stress area is concentrated in area B. First, the BC foundation pit retaining structure was damaged and gradually developed to the BA section.
Therefore, the foundation pit soil within the BC range slipped as a whole, the main pile foundation suffered shear failure along the slip surface, and the pile body would be fractured (Figure 12b). The displacement changes of the support system are D 15264 = 49.178 m > D 14647 = 48.793 m > D 15376 = 35.019 m > D 15416 = 31.241 m > D 15489 = 23.295 m. As shown in Figure 12c, the support structure first experienced sliding failure in area C and then quickly expanded from C to B, resulting in large deformation, cracking, and failure in the deep foundation pit.
According to the finite element model analysis, under the ultimate load of 7300 kN, the area with the most significant stress and displacement changes in ZH2-194 is concentrated in the range of 2900 → 3200 cm at the pile bottom, and the values of stress and energy changes are relatively large and concentrated in the range of 0 → 100 cm at the pile top.
Based on the research on testing and modeling in Section 4, it is determined that the quality defects in ZH2-194 are located in 3-1 silt layer area (Figure 13a,c).
Analysis conclusion: The research shows that the failure phenomena of foundation pit support structures mainly include instability of retaining structures, overall sliding of soil, and shear failure of pile foundations. The analysis conclusions in this section are consistent with Section 3.1 and Section 3.2. The research and analysis results indicate that there are also issues with quality control and construction processes during the construction process.

4.2. Component Defect Inspection

According to the construction plan, the zoning and segmented foundation pit excavation method can reduce the foundation pit deformation and uneven stress distribution [36].
Excavation survey results:
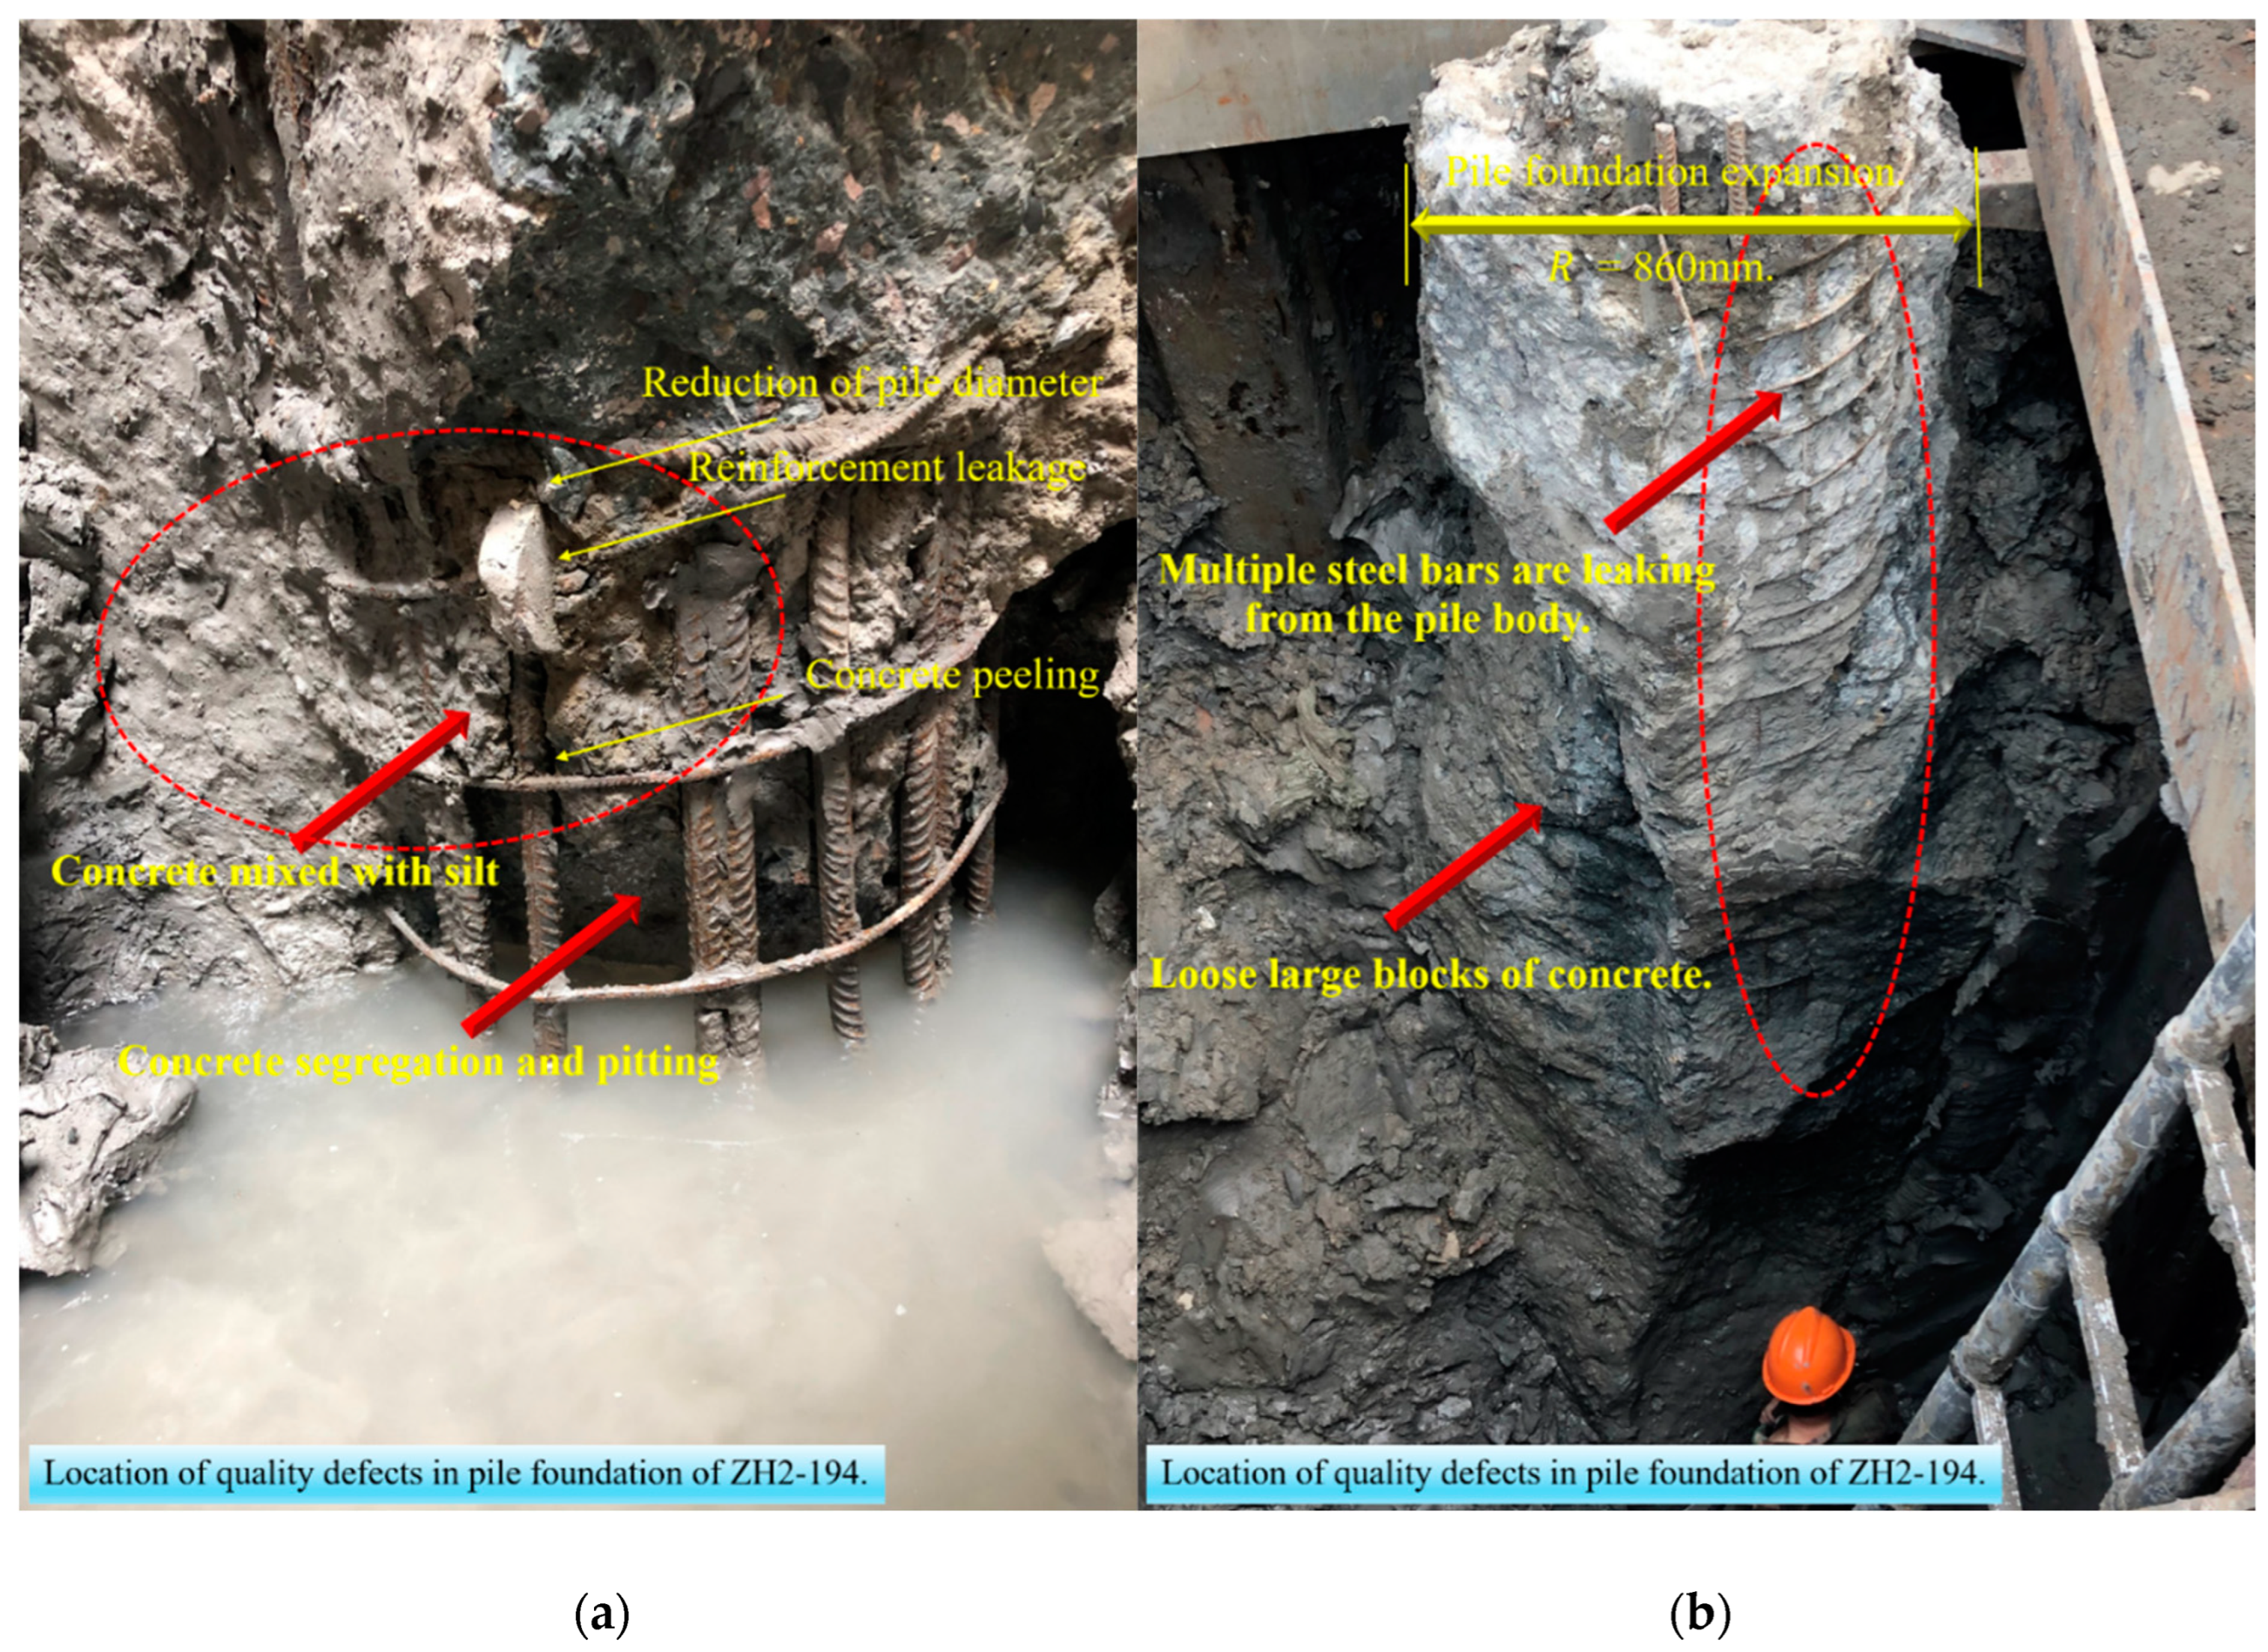
  • Digging down to a depth of −2.7 m (on-site pile top elevation, Figure 14a) to −5.2 m, with a pile foundation diameter R > 700 mm, there was expansion, and the pile foundation expansion range was 760~860 mm. The primary reinforcement of the pile top steel cage was offset by 60~10 mm, and a small amount of hoop reinforcement had leakage (Figure 14a,b).
  • Digging down to a depth of −5.2 m, the steel cage was exposed to one side of the pile foundation, and the primary reinforcement of the steel cage was slightly deformed. There were honeycombs, pitted surfaces, and a small amount of looseness in the concrete (Figure 14a).
  • Digging down to a depth of −10.4 m, the primary reinforcement of the steel cage on the excavation surface was bent and deformed, with an exposed section of 2.4 m. The deformation within a range of about 1.4 m in the upper part was relatively small; in comparison, within a range of 1 m in the lower part, the pile body necking and primary reinforcement deformation were obvious [37]. The range of about 0.25 m extension of the pile body towards the core of the pile was all loose compressed concrete aggregates (Figure 14b).
  • Researchers also inspected the large volume of concrete blocks of the expanded pile body peeled off on-site and found evident traces of drilling at the bottom of the second core sampling hole (Figure 10b). The concrete at the bottom of the core sampling hole was mixed with silt and sand, losing structural strength and damaging bearing capacity and stability (Figure 14b).
  • As the distance of ZH2-194 from the main tower crane pile foundation is only 3.9 m, the outer expansion of the Larssen steel sheet pile support around the pile body is small. The Larssen steel sheet pile is 12 m long, with a support excavation section of 2.8 m × 3.7 m = 10.36 m 2 .
The excavation depth on site has reached 5.2 m, and the silt layer is still nearly 15 m thick in the lower part. During the excavation process, quality defects in the pile foundation were found (Figure 14).

4.3. Entity Structure Verification

After comprehensive analysis by the research group, the main reason for the abnormal detection results of ZH2-194 is the quality defect of the pile body. The following aspects:
  • The test data for the steel cage invade the protective layer by 5 cm. From the perspective of material elasticity and strength theory, the bending and pure torsion of the pile foundation under a stress state have changed, resulting in displacement-deformation deviations (Figure 14b).
  • The circular pie-shaped cushion of the steel cage does not control the protective layer in the deformation caused by the vertical S-shaped deformation of the pile hole or the creep shrinkage of the soft soil in the pile foundation in soft soil geology (Figure 14a).
  • Under the superposition of the additional stress generated by the construction of soft soil and the load generated by the concrete mixer truck during concrete pouring, the soft soil layer undergoes creep deformation within a specific depth range or local and large-scale hole collapse [38,39]. The mud on the hole wall invades the pile foundation, causing quality defects such as voids and honeycomb pits (Figure 14).
  • After the second hole cleaning, the concrete cannot be poured in time. The equilibrium state of the lateral pressure of the slurry inside the hole and the horizontal force of the soft soil outside the hole changes or is damaged for a short time. Plastic deformation occurs in the hole wall range with weak anti-skid (shear) strength of the soil layer, and the soft soil invades the boundary of the pile foundation concrete [40].
  • The concrete used for bored piles is underwater. Due to long-distance transportation and vibration equipment not being used during pouring, the concrete should have lost its good construction workability, water retention, cohesion, and retardancy.
Final processing conclusion: There is pile foundation quality in ZH2-194, and pile replacement measures have been proposed. The original ZH2-194 engineering piles have been scrapped.

5. Conclusions

This paper accurately determined the influencing factors and attenuation mechanisms of different indicators on pile foundation quality by studying indoor tests of engineering cases under silty clay geological conditions (standard penetration test, heavy static penetration test, single-hole shear wave velocity test, and laboratory geotechnical index in-situ test) and three finite element coupling analyses of the same model. The scope, size, and spatial characteristics of pile foundation quality defects were accurately determined through low-strain tests, on-site core sampling, and three-dimensional solid finite element coupling models. Finally, the accuracy and scientific nature of the test and finite element coupling analysis were verified through manual and mechanical excavation.
The study of actual engineering cases verified the robustness of the established model, theoretical method, and measured system in soft soil creep formations. The theoretical model framework and data analysis obtained through this study can be used as a reference to study the failure of other structures in similar soft soil formations. The shortcoming of the study is whether this article applies to the analysis of complex structural defects in other geological conditions, which still needs further research and verification. The research group will continue to carry out research related to the spatiotemporal disturbance and harm of deep soft soil foundations to surrounding maintenance structures during construction and analyze the lateral deformation characteristics of soft soil deep foundation pit support systems under dynamic load disturbances.

Author Contributions

Conceptualization, Z.Z. and J.A.; methodology, Z.Z.; software, Z.Z. and L.Y.-B.; validation, V.Y.; formal analysis, Z.Z., L.Y.-B., J.A. and V.Y.; investigation, Z.Z. and V.Y.; resources, J.A.; data curation, Z.Z. and L.Y.-B.; writing—original draft preparation, Z.Z.; writing—review and editing, Z.Z.; visualization, V.Y.; supervision, J.A. and V.Y.; project administration, J.A.; funding acquisition, Z.Z. and V.Y. All authors have read and agreed to the published version of the manuscript.

Funding

The authors gratefully acknowledge the funding received from the following research projects: Grant PID2023-150003OB-100 funded by MCIN/AEI/10.13039/501100011033 and the European Regional Development Fund (ERDF), a program of the European Union (EU); The newly launched doctoral research project, issued by Xiang Ke University [2023] No. 75; Natural Science Foundation in Hunan Province, Number 2025JJ50288.

Data Availability Statement

All data generated or analyzed during this study are included in this published article.

Conflicts of Interest

The authors declare that they have no known competing financial interests or personal relationships that could have appeared to influence the work reported in this paper.

References

  1. Fu, X.; Li, J.; Liu, J.; Hu, Z.; Tang, C. Influence of Complex Hydraulic Environments on the Mechanical Properties of Pile-Soil Composite Foundation in the Coastal Soft Soil Area of Zhuhai. Buildings 2023, 13, 563. [Google Scholar] [CrossRef]
  2. Chen, Y.; Lv, Y.; Wu, K.; Huang, X. Centrifuge Shaking Table Study on the Hydrodynamic Effects on a Pile Foundation Bridge Pier in Soft Soil under Earthquakes. Mar. Struct. 2022, 85, 103261. [Google Scholar] [CrossRef]
  3. Shamsi, M.; Ghanbari, A. Nonlinear Dynamic Analysis of Qom Monorail Bridge Considering Soil-Pile-Bridge-Train Interaction. Transp. Geotech. 2020, 22, 100309. [Google Scholar] [CrossRef]
  4. Ahmed, D.; Bt Taib, S.N.L.; Ayadat, T.; Hasan, A. Numerical Analysis of the Carrying Capacity of a Piled Raft Foundation in Soft Clayey Soils. Civ. Eng. J. 2022, 8, 622–636. [Google Scholar] [CrossRef]
  5. Bhattacharjee, T.; Chanda, D.; Saha, R. Influence of Soil Flexibility and Plan Asymmetry on Seismic Behaviour of Soil-Piled Raft-Structure System. Structures 2021, 33, 1775–1788. [Google Scholar] [CrossRef]
  6. Castro, P.; Martins, P.; Castro, M.; Amaral, L.; Urashima, B. Use of Geosynthetic in Soft Soil Foundation in Mining Area: A Case Study with Analytical and Numerical Studies. Int. J. Geosynth. Ground Eng. 2023, 9, 12. [Google Scholar] [CrossRef]
  7. Deb, P.; Debnath, B.; Reang, R.B.; Pal, S.K. Structural Analysis of Piled Raft Foundation in Soft Soil: An Experimental Simulation and Parametric Study with Numerical Method. Ocean Eng. 2022, 261, 112139. [Google Scholar] [CrossRef]
  8. Lin, C.; Huang, L.; Chen, S.; Huang, M.; Wang, R.; Tan, Q. Study on Shielding Effect of the Pile Group in a Soft-Soil Foundation. Appl. Sci. 2023, 13, 9478. [Google Scholar] [CrossRef]
  9. Li, C.; Sheng, Y. Large-strain Analysis for Cylindrical Cavity Contraction in Strain-softening Geomaterials. Int. J. Numer. Anal. Methods Geomech. 2022, 46, 3012–3027. [Google Scholar] [CrossRef]
  10. Tan, J.J.; Ramli, H. Effect of standard penetration test corrections on the estimation of undrained shear strength. J. Civ. Eng. Manag. 2023, 29, 501–515. [Google Scholar] [CrossRef]
  11. Yang, J.; Zhao, D.; Fan, T.; Sun, T. Dynamic and Residual Pore Water Pressure Response of Hybrid Foundation System Under Combined Action of Wind, Wave and Seismic Loading. Period. Polytech. Civ. Eng. 2022, 67, 1. [Google Scholar] [CrossRef]
  12. Wang, Y.; Zhang, F. Effects of Pit-Bottom-Soil Reinforcement on the Deformation of Subway Deep Foundation Pits Based on an Improved Model. Adv. Mater. Sci. Eng. 2022, 2022, 2661311. [Google Scholar] [CrossRef]
  13. Farrugia, D.; Galea, P.; D’Amico, S.; Paolucci, E. Sensitivity of Ground Motion Parameters to Local Shear-Wave Velocity Models: The Case of Buried Low-Velocity Layers. Soil Dyn. Earthq. Eng. 2017, 100, 196–205. [Google Scholar] [CrossRef]
  14. Li, X.; Zhang, R.; Yang, Z.; Chen, P.; Ji, F.; Wen, B. Mechanical Behavior Analysis and Bearing Capacity Calculation of CFG Pile Composite Foundation on Coral Sand Site. Front. Earth Sci. 2023, 11, 1204989. [Google Scholar] [CrossRef]
  15. Kong, D.; Guan, Y.; Yuan, H. Study on the Anti-Floating Water Level of the Underground Structure’s Comprehensive Anti-Floating. Structures 2023, 56, 104921. [Google Scholar] [CrossRef]
  16. Zhou, Z.W.; Alcalá, J.; Yepes, V. Research on the Optimized Environment of Large Bridges Based on Multi-Constraint Coupling. Environ. Impact Assess Rev. 2022, 97, 106914. [Google Scholar] [CrossRef]
  17. Zhang, Z.; Li, W.; Ding, Z.; Wu, X. An Approach to the Selection of Target Reliability Index of Cable-Stayed Bridge’s Main Girder Based on Optimal Structural Parameter Ratio from Cost-Benefit Analysis. Structures 2020, 28, 2221–2231. [Google Scholar] [CrossRef]
  18. Du, D.; Liu, Z. Seismic Bearing Capacity of Strip Foundation on Rock Mass Obeying Modified Hoek-Brown Failure Criterion. Buildings 2022, 12, 2083. [Google Scholar] [CrossRef]
  19. Dai, E.; Lv, Z.; Yuan, P.; Liu, G.; Guo, N.; Liu, Z.; Tang, B. Ductile Fracture of Anisotropic QP980 Steel Sheet by Using the Isotropic/Anisotropic Modified Mohr-Coulomb Models. Eng. Fract. Mech. 2023, 290, 109522. [Google Scholar] [CrossRef]
  20. Dai, Z.; Tang, H.; Wu, S.; Habibi, M.; Moradi, Z.; Ali, H.E. Nonlinear Consecutive Dynamic Instabilities of Thermally Shocked Composite Circular Plates on the Softening Elastic Foundation. Thin-Walled Struct. 2023, 186, 110645. [Google Scholar] [CrossRef]
  21. Wang, Y.; Pan, Z.; Zeng, B.; Xu, Q. Cyclic Creep Model of Concrete Based on Kelvin Chain under Fatigue Loads. Constr. Build Mater. 2024, 417, 135255. [Google Scholar] [CrossRef]
  22. Rao, P.; Meng, J.; Cui, J.; Feng, W.; Nimbalkar, S.; Liu, Z. Stability Analysis of Unsaturated Soil Pit Under Vehicle Load. Geotech. Geol. Eng. 2024, 42, 4987–5001. [Google Scholar] [CrossRef]
  23. Wang, Y.; Ouyang, J.; Guo, P.; Liu, Y.; Lin, H.; Li, X.; Gong, X.; Li, J. Performance of Deep Braced Excavation Under Embankment Surcharge Load. Geotech. Geol. Eng. 2023, 41, 3575–3586. [Google Scholar] [CrossRef]
  24. Zhai, S.; Du, G.; He, H. Bayesian Probabilistic Characterization of the Shear-Wave Velocity Combining the Cone Penetration Test and Standard Penetration Test. Stoch. Environ. Res. Risk Assess. 2023, 38, 69–84. [Google Scholar] [CrossRef]
  25. Jebali, H.; Bouassida, M.; frikha, W. Numerical Study of Tunis Soft Soil Improved by Combined Vacuum Consolidation and Geodrains. Innov. Infrastruct. Solut. 2024, 9, 289. [Google Scholar] [CrossRef]
  26. Yuan, J.; Gan, Y.; Chen, J.; Tan, S.; Zhao, J. Experimental Research on Consolidation Creep Characteristics and Microstructure Evolution of Soft Soil. Front. Mater. 2023, 10, 1137324. [Google Scholar] [CrossRef]
  27. Moozhikkal, R.; Sridhar, G.; Robinson, R.G. Constant Rate of Strain Consolidation Test Using Conventional Fixed Ring Consolidation Cell. Indian Geotech. J. 2019, 49, 141–150. [Google Scholar] [CrossRef]
  28. Alam, M.; Chen, J.; Umar, M.; Ullah, F.; Shahkar, M. Predicting Standard Penetration Test N-Value from Cone Penetration Test Data Using Gene Expression Programming. Geotech. Geol. Eng. 2024, 42, 5587–5613. [Google Scholar] [CrossRef]
  29. Fan, Y.; Niu, H.; Yang, G.; Gao, Q.; Wu, J.; Tian, B. Near-Field Vibration Induced by Single-Hole Blasting under Different Initiation Modes. Eur. J. Environ. Civ. Eng. 2023, 28, 753–778. [Google Scholar] [CrossRef]
  30. Guan, Z.; Wang, Y. Assessment of Liquefaction-Induced Differential Ground Settlement and Lateral Displacement Using Standard Penetration Tests with Consideration of Soil Spatial Variability. J. Geotech. Geoenviron. Eng. 2022, 148, 0002775. [Google Scholar] [CrossRef]
  31. Su, Z.; Tan, X.; Chen, W.; Ma, W.; Zhang, C.; Xu, F. A Combined Non-Destructive Prediction Method for Evaluating the Uniaxial Compressive Strength of Rocks Under Freeze–Thaw Cycles. Arab. J. Sci. Eng. 2022, 47, 13365–13379. [Google Scholar] [CrossRef]
  32. Pérez, J.A.; Reyes-Rodríguez, A.M.; Sánchez-González, E.; Ríos, J.D. Experimental and Numerical Flexural–Torsional Performance of Thin-Walled Open-Ended Steel Vertical Pile Foundations Subjected to Lateral Loads. Buildings 2023, 13, 1738. [Google Scholar] [CrossRef]
  33. Amrioui, J.; Le Kouby, A.; Duc, M.; Guedon, J.-S.; Lansac, F. Relationship between Porosity and Water Permeability for Deep Soil Mixing Material. Int. J. Geomech. 2023, 23, 8447. [Google Scholar] [CrossRef]
  34. Cetin, K.O.; Cevik, M.E.; Al-Suhaily, A.; Yunatci, A.A. Probabilistic Assessment of Standard Penetration Test Hammer Energy Efficiency and Rod Length Corrections. J. Geotech. Geoenviron. Eng. 2023, 149, 11136. [Google Scholar] [CrossRef]
  35. Bagińska, I. Comparative Analysis of Cone Resistances in Cone Penetration Test (CPTu) and Dynamic Probe Heavy Test (DPH). Geotech. Geol. Eng. 2020, 38, 5269–5278. [Google Scholar] [CrossRef]
  36. Zhang, G.; Liu, X.; Zheng, F.; Sun, Y.; Liu, G. Geological Disaster Information Sharing Based on Internet of Things Standardization. Environ. Earth Sci. 2024, 83, 148. [Google Scholar] [CrossRef]
  37. Zhou, Z.; Wang, Y.; Alcalá, J.; Yepes, V. Research on Coupling Optimization of Carbon Emissions and Carbon Leakage in International Construction Projects. Sci. Rep. 2024, 14, 10752. [Google Scholar] [CrossRef]
  38. Zhou, Z.W.; Alcalà, J.; Yepes, V. Carbon impact assessment of bridge construction based on resilience theory. J. Civ. Eng. Manag. 2023, 29, 561–576. [Google Scholar] [CrossRef]
  39. Li, J.; Hu, B.; Sheng, J.; Zhang, Z. Failure Mechanism and Treatment of Mine Landslide with Gently-Inclined Weak Interlayer: A Case Study of Laoyingzui Landslide in Emei, Sichuan, China. Geomech. Geophys. Geo-Energy Geo-Resour. 2024, 10, 61. [Google Scholar] [CrossRef]
  40. Wu, C.; Yu, J.; Cao, X.; Shen, W. Study on Design Method of Pile Wall Combination Structure in a Deep Foundation Pit Considering Deformation Induced by Excavation. Front. Earth Sci. 2022, 10, 837950. [Google Scholar] [CrossRef]
Figure 1. The research framework and contribution of this work.
Buildings 15 01270 g001
Figure 2. XSS-10D project floor plan diagram (red dots indicate the location of the pile foundation).
Buildings 15 01270 g002
Figure 3. Schematic diagram of the composition, maintenance system, and mechanical model of the basic rock layer structure.
Buildings 15 01270 g003
Figure 4. Analysis of consolidation coupling model: (a) 50 kPa; (b) 100 kPa; (c) 200 kPa; (d) 400 kPa.
Buildings 15 01270 g004
Figure 5. Various in situ tests: (a) The shear wave velocity test data; (b) data discrete analysis.
Buildings 15 01270 g005
Figure 6. Soil test results data with the sixteen indicators for geotechnical testing.
Buildings 15 01270 g006
Figure 7. Finite element optimization with over eight holes: (a) n = 1; (b) n = 2: (c) n = 3; (d) n = 4; (e) 50 KPa (Two holes (TH)); (f) 100 KPa (TH); (g) 200 KPa (TH); (h)400 KPa (TH); (i) 50 KPa (four holes (FH)); (j) 100 KPa (FH); (k) 200 KPa (FH); (l) 400 KPa (FH); (m) 50 KPa (exceeding eight holes (EEH)); (n) 100 KPa (EEH); (o) 200 KPa (EEH); (p) 400 KPa (EEH).
Buildings 15 01270 g007aBuildings 15 01270 g007b
Figure 8. Comparative analysis of / S data; (a) 50 kPa/TH; (b) 100 kPa/TH; (c) 200 kPa/TH; (d) 400 kPa/TH; (e) 50 kPa/FH; (f) 100 kPa/FH; (g) 200 kPa/FH; (h) 400 kPa/FH.
Buildings 15 01270 g008aBuildings 15 01270 g008b
Figure 9. Statistical analysis of waveform data from small strain experiments.
Buildings 15 01270 g009
Figure 10. Retain sample specimens after drilling core sampling: (a) The maximum settlement data; (b) the sampling at a depth of 25 m; (c) the sampling at a depth of 7 m.
Buildings 15 01270 g010
Figure 11. Finite element coupling analysis of foundation pit: (a) Load modeling; (b) finite element modeling; (c) coupling of supporting system; (d) stress–displacement; (e) strain–energy; (f) stress–displacement of supporting framework.
Buildings 15 01270 g011
Figure 12. Finite element modeling analysis: (a) Stress cloud map when Increment = 3; (b) stress cloud map when increment = 46; (c) average displacement cloud map at increment = 46.
Buildings 15 01270 g012
Figure 13. Finite element modeling analysis: (a) Mises; (b) Tresca; (c) magnitude.
Buildings 15 01270 g013
Figure 14. Excavation and inspection of ZH2-194: (a) Partial detailed drawing; (b) defects in the pile body.
Buildings 15 01270 g014
Table 1. Mechanical parameter indicators of supporting structures.
Material TypeDensity (kg/m3)Poisson’s RatioElastic Modulus (MPa)Position
Cement mixing pile15000.32 31,000Surrounding the foundation pit
Supporting beam C3024620.23 28,850Inside the foundation pit
Slope protection C2023090.22 25,350Slope of foundation pit
Steel support78500.30 200,000Local reinforcement
Disclaimer/Publisher’s Note: The statements, opinions and data contained in all publications are solely those of the individual author(s) and contributor(s) and not of MDPI and/or the editor(s). MDPI and/or the editor(s) disclaim responsibility for any injury to people or property resulting from any ideas, methods, instructions or products referred to in the content.

