Article

Cutting Feature Extraction Method for Ultra-High Molecular Weight Polyethylene Fiber-Reinforced Concrete Based on Feature Classification and Improved Hilbert–Huang Transform

1
School of Mechanical Engineering, Guangxi University, Nanning 530004, China
2
Intelligent Manufacturing College, Nanning University, Nanning 530001, China
*
Authors to whom correspondence should be addressed.
Buildings 2025, 15(8), 1272; https://doi.org/10.3390/buildings15081272
Submission received: 8 March 2025 / Revised: 3 April 2025 / Accepted: 9 April 2025 / Published: 13 April 2025
(This article belongs to the Section Building Structures)

Abstract

Ultra-high molecular weight polyethylene (UHMWPE) fiber-reinforced concrete (UHMWPE-FRC) is a hard–soft multiphase hybrid composite with exceptional toughness and impact resistance compared to conventional concrete. However, its cutting characteristics and processing performance have not been sufficiently investigated, potentially causing accelerated saw blade wear, higher energy consumption, and poor cutting quality, thus increasing project costs and duration. In order to intelligently evaluate the performance of diamond saw blades when cutting UHMWPE-FRC, a feature extraction method, based on feature classification and an improved Hilbert–Huang transform (HHT), is proposed, which consider Improved Complete Ensemble Empirical Mode Decomposition with Adaptive Noise (ICEEMDAN) and wavelet threshold de-noising. By conducting the cutting experiments, the cutting force was analyzed by the improved HHT, in terms of noise reduction and time-frequency. Five types of characteristics were preliminarily screened, including depth of cut (ap), cutting speed (Vc), feed rate (Vf), concrete strength, and the type of concrete. A feature correlation analysis method for UHMWPE-FRC cutting, based on feature classification, is proposed. The five features were classified into continuous variable features and unordered categorical variable features; correlation analyses were carried out by Spearman correlation coefficient testing and Kruskal–Wallis and Dunn’s testing, respectively. It was found that the ap and concrete strength exhibited a strong positive correlation with cutting force, making them the primary influencing factors. Meanwhile, the influence of aggregates on cutting force can be identified in the low-frequency range, while the influence of fibers can be identified in the high-frequency range. The feature classification-based correlation analysis effectively distinguishes the influence of Vc on cutting force.

1. Introduction

Concrete is a widely used material in the construction field but its low tensile strength and its brittleness limit its applications in high-loading, impact-resistant situations, as well as typical working conditions that require durability for extended periods of time [1]. Therefore, to enhance the performance of concrete, natural fibers [2,3], carbon fibers [4,5], glass fibers [6], and steel fibers [7,8] have been incorporated to improve its strength and toughness.
Recent studies have shown that polymer fibers such as polypropylene (PP) fiber [9], polyvinyl alcohol (PVA) fibers [10], and aramid fiber [11], owing to their unique performance advantages, exhibit significant potential in the development of novel fiber-reinforced concrete. Of these, ultra-high molecular weight polyethylene (UHMWPE) fibers are an excellent choice for use in fiber-reinforced concrete. The fibers are made from polyethylene, with a molecular weight exceeding 1.5 million, and exhibit a tensile strength of up to 3000 MPa, an elastic modulus of 100 GPa, and an ultimate elongation rate of up to 5% [12].
Numerous studies have demonstrated that the UHMWPE fibers significantly enhance the compressive strength [13], tensile strength [14], flexural strength [15,16], and impact resistance [17,18] of concrete. Furthermore, UHMWPE fibers can improve the toughness of concrete [19] to meet more scenarios in modern construction. The hybrid use of UHMWPE and steel fibers can synergistically improve the tensile strength and strain of ultra-high-performance concrete (UHPC) [20]. Surface-modified UHMWPE fibers can further increase interfacial bond strength with the cement matrix, and improve the mechanical properties of the concrete [21,22]. In the field of concrete repair, UHMWPE fibers’ excellent strength and energy-absorbing capacity allow them to be a viable substitute for conventional repair materials [23]. Compared to other fiber-reinforced polymer materials, the UHMWPE fibers have significant advantages for situations requiring high energy absorption [23], such as seismic design.
Diamond saw blades play a crucial role in concrete construction, precast slab cutting, and special building demolition, due to their high efficiency. Scholars have conducted extensive research into the cutting mechanisms and tool performance of diamond saw blades for cutting concrete. Wei [24] and Wang [25] investigated the effects of cutting parameters and material types on cutting force. Yuan Hui [26] studied the removal mechanism of concrete and classified the wear patterns of diamond grains on saw blades, finding that the falling off and fracture of diamond grains significantly affect the service life of the saw blades. With the rapid development of intelligent construction, the intelligent evaluation of the cutting performance of diamond saw blades during concrete cutting directly provides data for the intelligent management of the entire lifecycle of engineering projects. Our research group conducted in-depth studies on the identification of dynamic data features and cutting state prediction of diamond saw blades during the cutting of conventional concrete. Yang Zili et al. [27] found that the fluctuation of concrete cutting force in the high-frequency range of the spectrum was closely related to the composition of the concrete and the cutting state. Zheng Dongrui et al. [28] employed wavelet multi-scale analysis to filter out low-frequency noise from concrete cutting force and found that the cutting force exhibited good synchronization with acoustic emissions. Based on wavelet analysis and neural network prediction, Hu et al. [29] were the first to propose a prediction model for cutting force and vibration during the dry cutting of concrete with different aggregates; they adopted the multi-sensor fusion in the prediction model.
Although previous studies have provided valuable insights into the cutting mechanisms and performance evaluation of diamond saw blades, they have not fully addressed the unique challenges posed by UHMWPE-FRC. As a new type of hard–soft multiphase hybrid composite, the mechanical properties of UHMWPE-FRC are significantly different to conventional concrete or traditional fiber-reinforced concrete, e.g., steel fiber-reinforced concrete (see Table 1). The most prominent difference lies in its higher toughness and impact resistance after adding UHMWPE fibers, which would absorb and dissipate energy during cutting, altering the force distribution and reducing peak cutting forces. Therefore, the existing theories on the cutting mechanisms and dynamic characteristics of conventional concrete cannot be fully applied to UHMWPE-FRC. In order to accurately evaluate the cutting performance of a diamond saw blade cutting UHMWPE-FRC, it is essential to first address the feature extraction methods that influence the cutting performance of UHMWPE-FRC in intelligent evaluation models. Current feature extraction methods for material processing mainly include: 1) image-based feature extraction methods for part geometries, such as improved local binary pattern (LBP), grey level co-occurrence matrix (GLCM) [30], and knowledge graph (KG) [31]; 2) data-driven feature extraction methods for machining processes, such as wavelet packets [32] and principal component analysis (PCA) [33]; and 3) feature extraction methods based on intelligent algorithms and machine learning, such as artificial neural network (ANN) machine learning [34] and improved hybrid difference grey wolf algorithms (IHDGWA), for optimizing support vector machines (SVM) [35]. However, the training data for these feature extraction methods were limited to homogeneous materials and none of them addressed the influence of hard–soft multiphase hybrid composites on feature extraction.
In order to extract processing features and intelligently evaluate the performance of diamond saw blades when cutting UHMWPE-FRC, a feature extraction method, based on feature classification and an improved Hilbert–Huang transform (HHT), is proposed, which considers Improved Complete Ensemble Empirical Mode Decomposition with Adaptive Noise (ICEEMDAN) and wavelet threshold de-noising. Unlike the fast Fourier transform (FFT) and wavelet transform (WT), since FFT assumes stationarity of the data and WT heavily relies on the choice of wavelet basis and threshold determination [37], ICEEMDAN adaptively decompose the data into IMFs without requiring prior knowledge of the characteristics of data. As for PCA [38], it can reduce the complexity of data but may not capture the intricate temporal and frequency characteristics of cutting force as effectively. The number of datasets required by ANN-based algorithms increase the length of processing experiments and the difficulty of data processing [39]. The improved HHT considering ICEEMDAN and wavelet threshold de-noising proposed in this paper has better performance in dealing with non-stationary and nonlinear data. It effectively addresses the issue of mode mixing and reduced reconstruction errors and computational demands, which has been successfully applied in various fields such as geodynamics [40], medical data processing [41], and mechanical vibration data processing [42], demonstrating its versatility and effectiveness. In comparison to previous studies on fiber-reinforced concrete cutting force with non-stationary and nonlinear characteristics [27,28,29], the improved HHT provided a more accurate decomposition of the data into its intrinsic mode functions (IMFs), followed by effective de-noising using wavelet thresholding.
The UHMWPE-FRC cutting experiments were conducted to investigate the effects of cutting parameters and material types on the cutting performance of diamond saw blades (cutting UHMWPE-FRC) by taking the cutting force as evaluation indicator. The results of this study should provide a feature extraction method for the evaluation model of intelligent construction engineering systems for high-strength concrete.

2. Experimental Methods

2.1. Concrete Specimen and Diamond Saw Blade

The diamond saw blade used in this study was manufactured by Xiamen Jinzhou Diamond Tools Co., Ltd. Its diameter was 160 mm, the inner hole diameter was 3 mm, the thickness of the segment was 2.6 mm, and the length of the segment was 13 mm. The base material was 65 Mn steel and the diamond grain size was 50/60 mesh.
The compositions of UHMWPE-FRC are shown in Table 2. The UHMWPE-FRC was prepared by Wuhan Kingstone Environmental Protection and Energy-Saving Technology Co., Ltd. The dimensions of the concrete specimen were 30 × 30 × 100 mm. To ensure the flatness of the machined surfaces, the specimens were semi-finished and the flatness accuracy controlled within 0.05 mm.

2.2. Experimental Equipment and Conditions

The experimental cutting platform is shown in Figure 1. The selection of cutting parameters was based on a combination of preliminary experimental results and a comprehensive review of existing literature [24,25,26,27,28,29], and the specific parameter settings are shown in Table 3. The cutting experiment was conducted on a CY-LW865 horizontal machining center (Yunnan CY Group Co. Ltd., Kunming, China). The cutting force measurement system consisted of a 9257B piezoelectric dynamometer (Kistler Co. Ltd., Winterthur, Switzerland), a 5070A charge amplifier (Kistler Co. Ltd., Winterthur, Switzerland), a 1677A5 data cable (Kistler Co. Ltd., Winterthur, Switzerland), a 5679A data acquisition unit (Kistler Co. Ltd., Winterthur, Switzerland), and a computer. The data sampling frequency was 5000 Hz and each experiment was repeated three times.

3. Experimental Results and Discussion

3.1. Mechanical Characteristics of Cutting UHMWPE-FRC

The cutting force of a diamond saw blade cutting concrete is shown in Figure 2. The cutting process was divided into three stages: the cut-in stage, steady cutting stage, and cut-out stage. In the cut-in stage, the diamond saw blade began to contact the concrete and experienced an impact. The cutting force responded synchronously and increased rapidly. In the steady cutting stage, the saw blade made maximum contact with the concrete and the cutting force reached multiple peak values, then returned to zero instantly. In the cut-out stage, the saw blade only partially cut in the concrete and the cutting force gradually decreased and dropped to zero, until the saw blade was completely detached from the specimen. The raw cutting force data showed that the z-axis cutting force was dominant and was selected for further analysis.
The raw cutting force data was the main performance indicator for evaluating the cutting process but it could not directly be used for feature extraction. Firstly, it was affected by background noise and baseline drift, where the drift was caused by environmental factors, such as temperature fluctuations, power supply disturbances, and changes in humidity and air pressure. Furthermore, the different compositions of UHMWPE-FRC and the heterogeneous nature of concrete caused frequent fluctuations and significant variations in the raw data. Additionally, the uneven distribution of hard aggregates, such as stones, introduced a certain degree of randomness into the cutting force. The presence of micro-voids and surface pores within the concrete also contributed to data fluctuations. To improve the accuracy and reliability of the data, it is necessary to reduce noise and remove drift from the data. The specific method for data processing is detailed in Section 3.2.

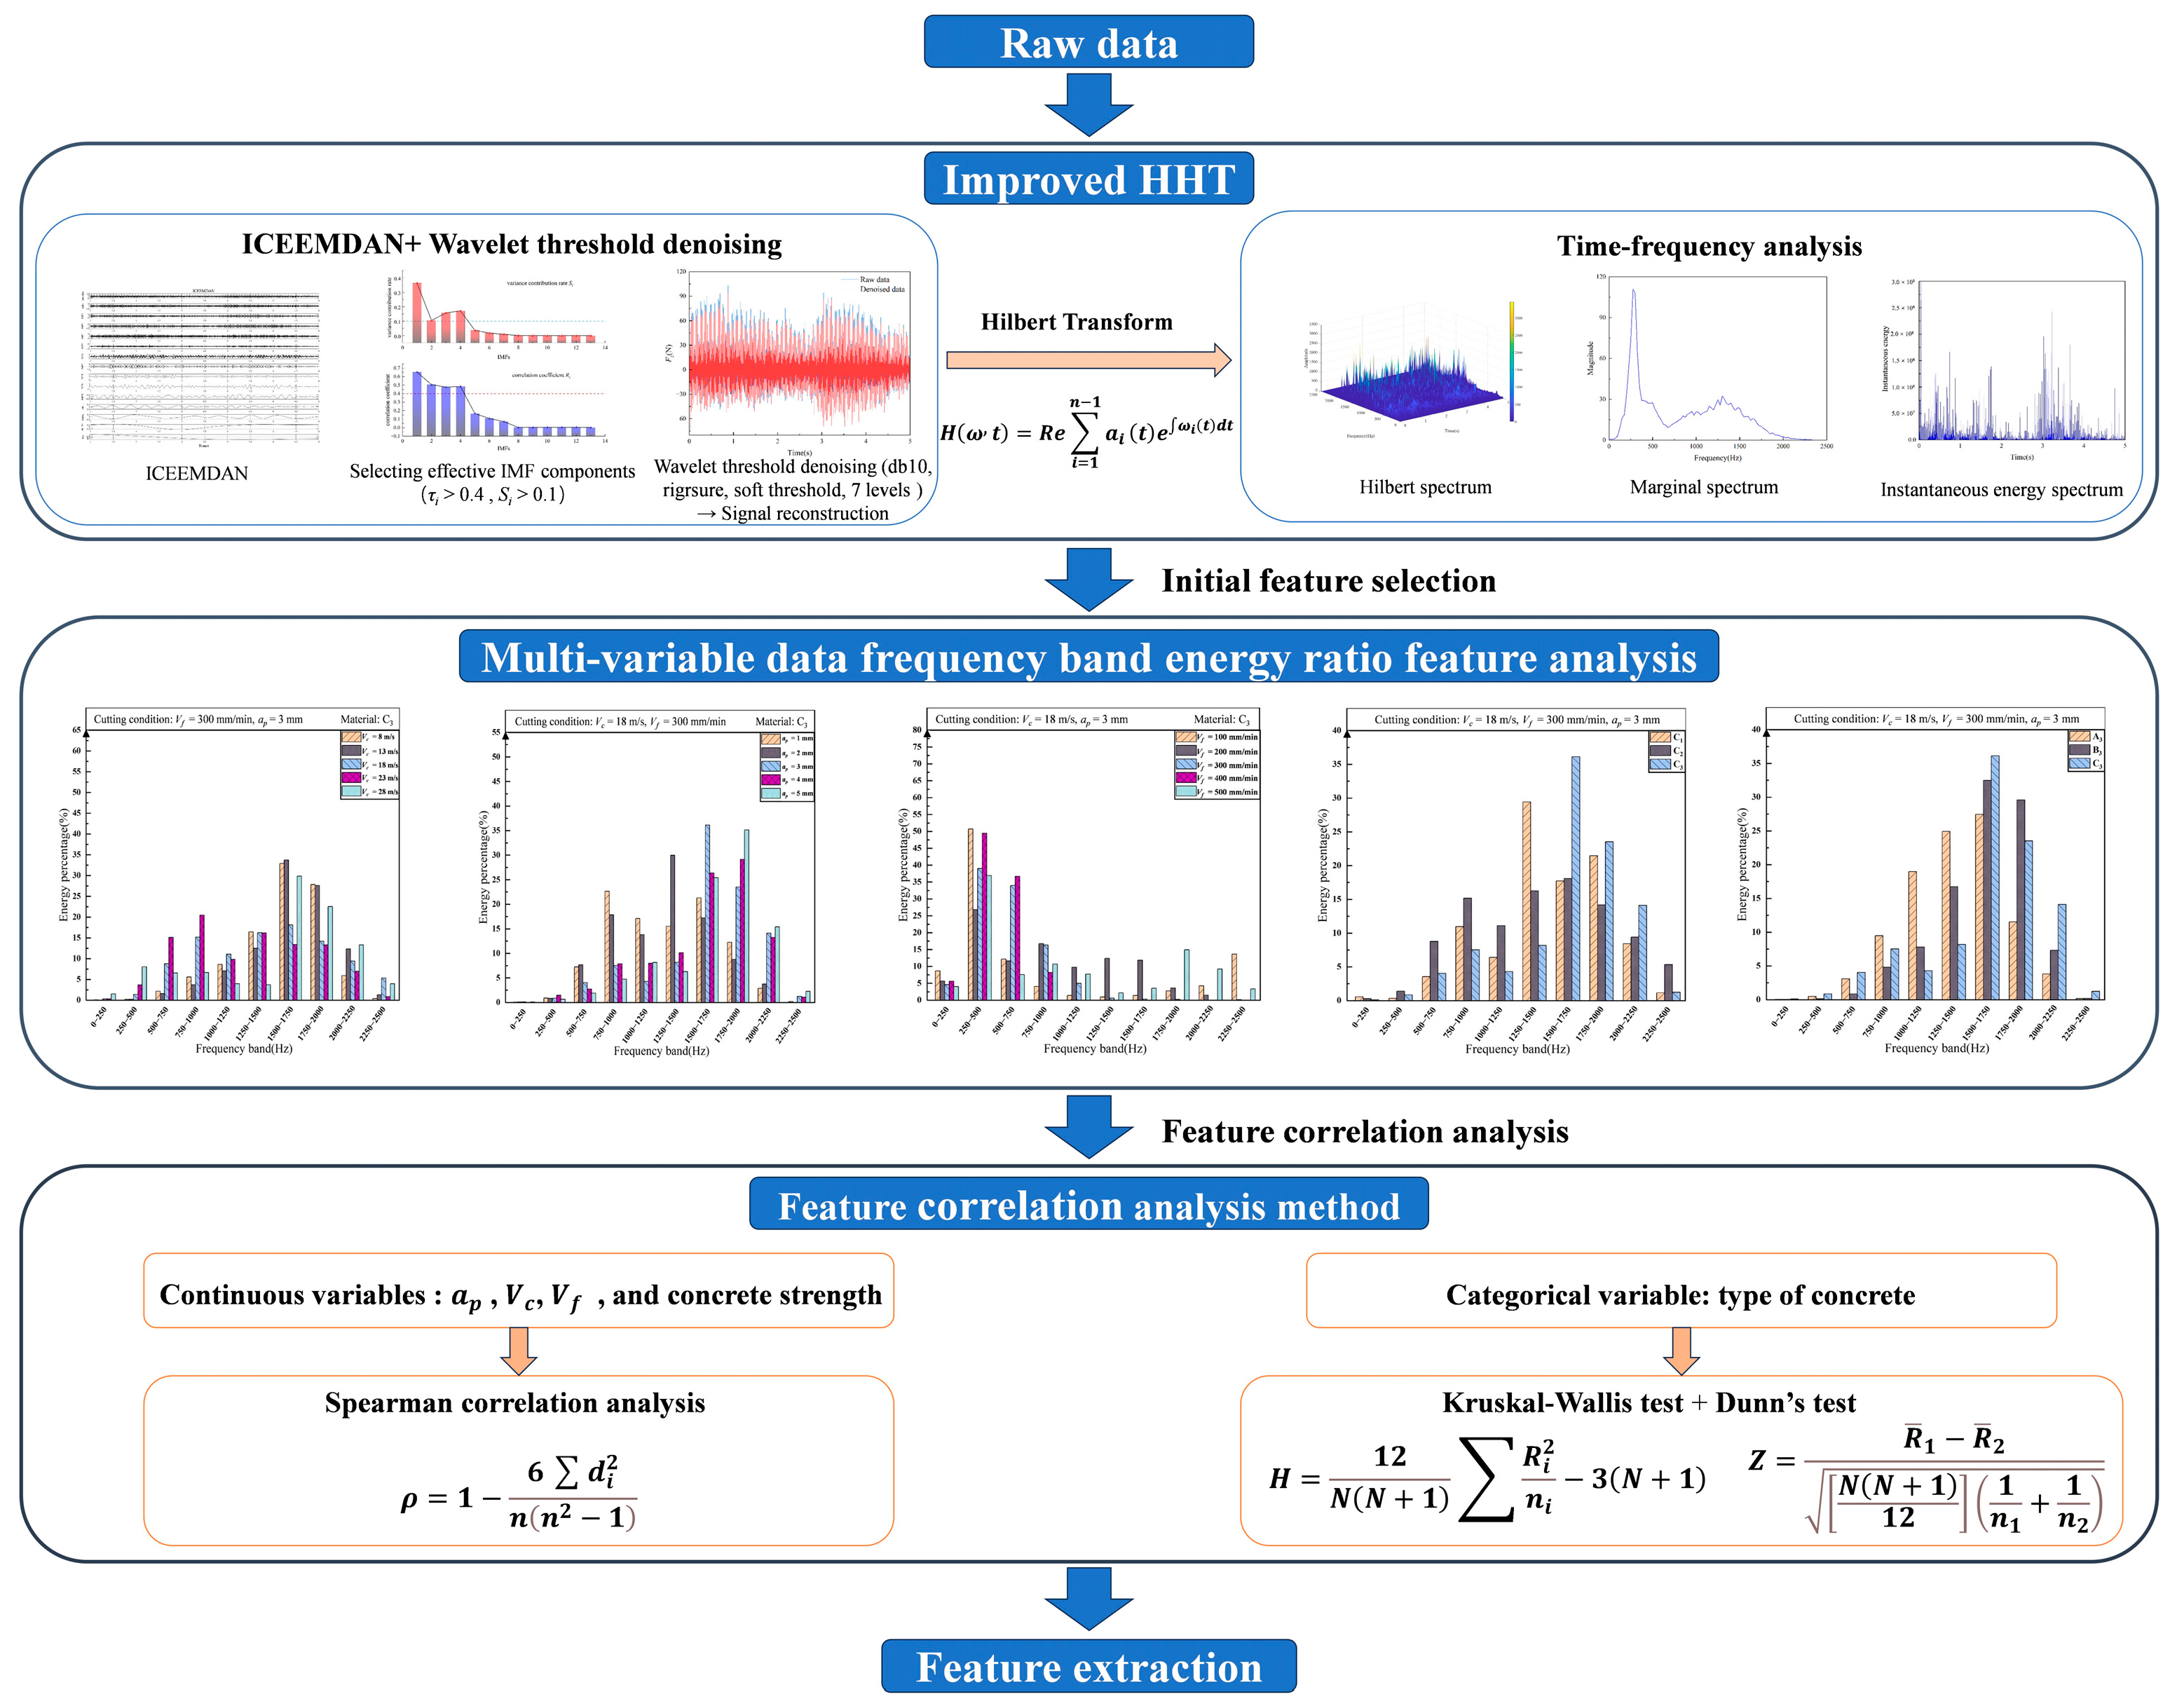
3.2. Cutting Feature Extraction for UHMWPE-FRC Based on Feature Classification and Improved Hilbert–Huang Transform (HHT)

The flowchart of the cutting feature extraction method for UHMWPE-FRC is shown in Figure 3.

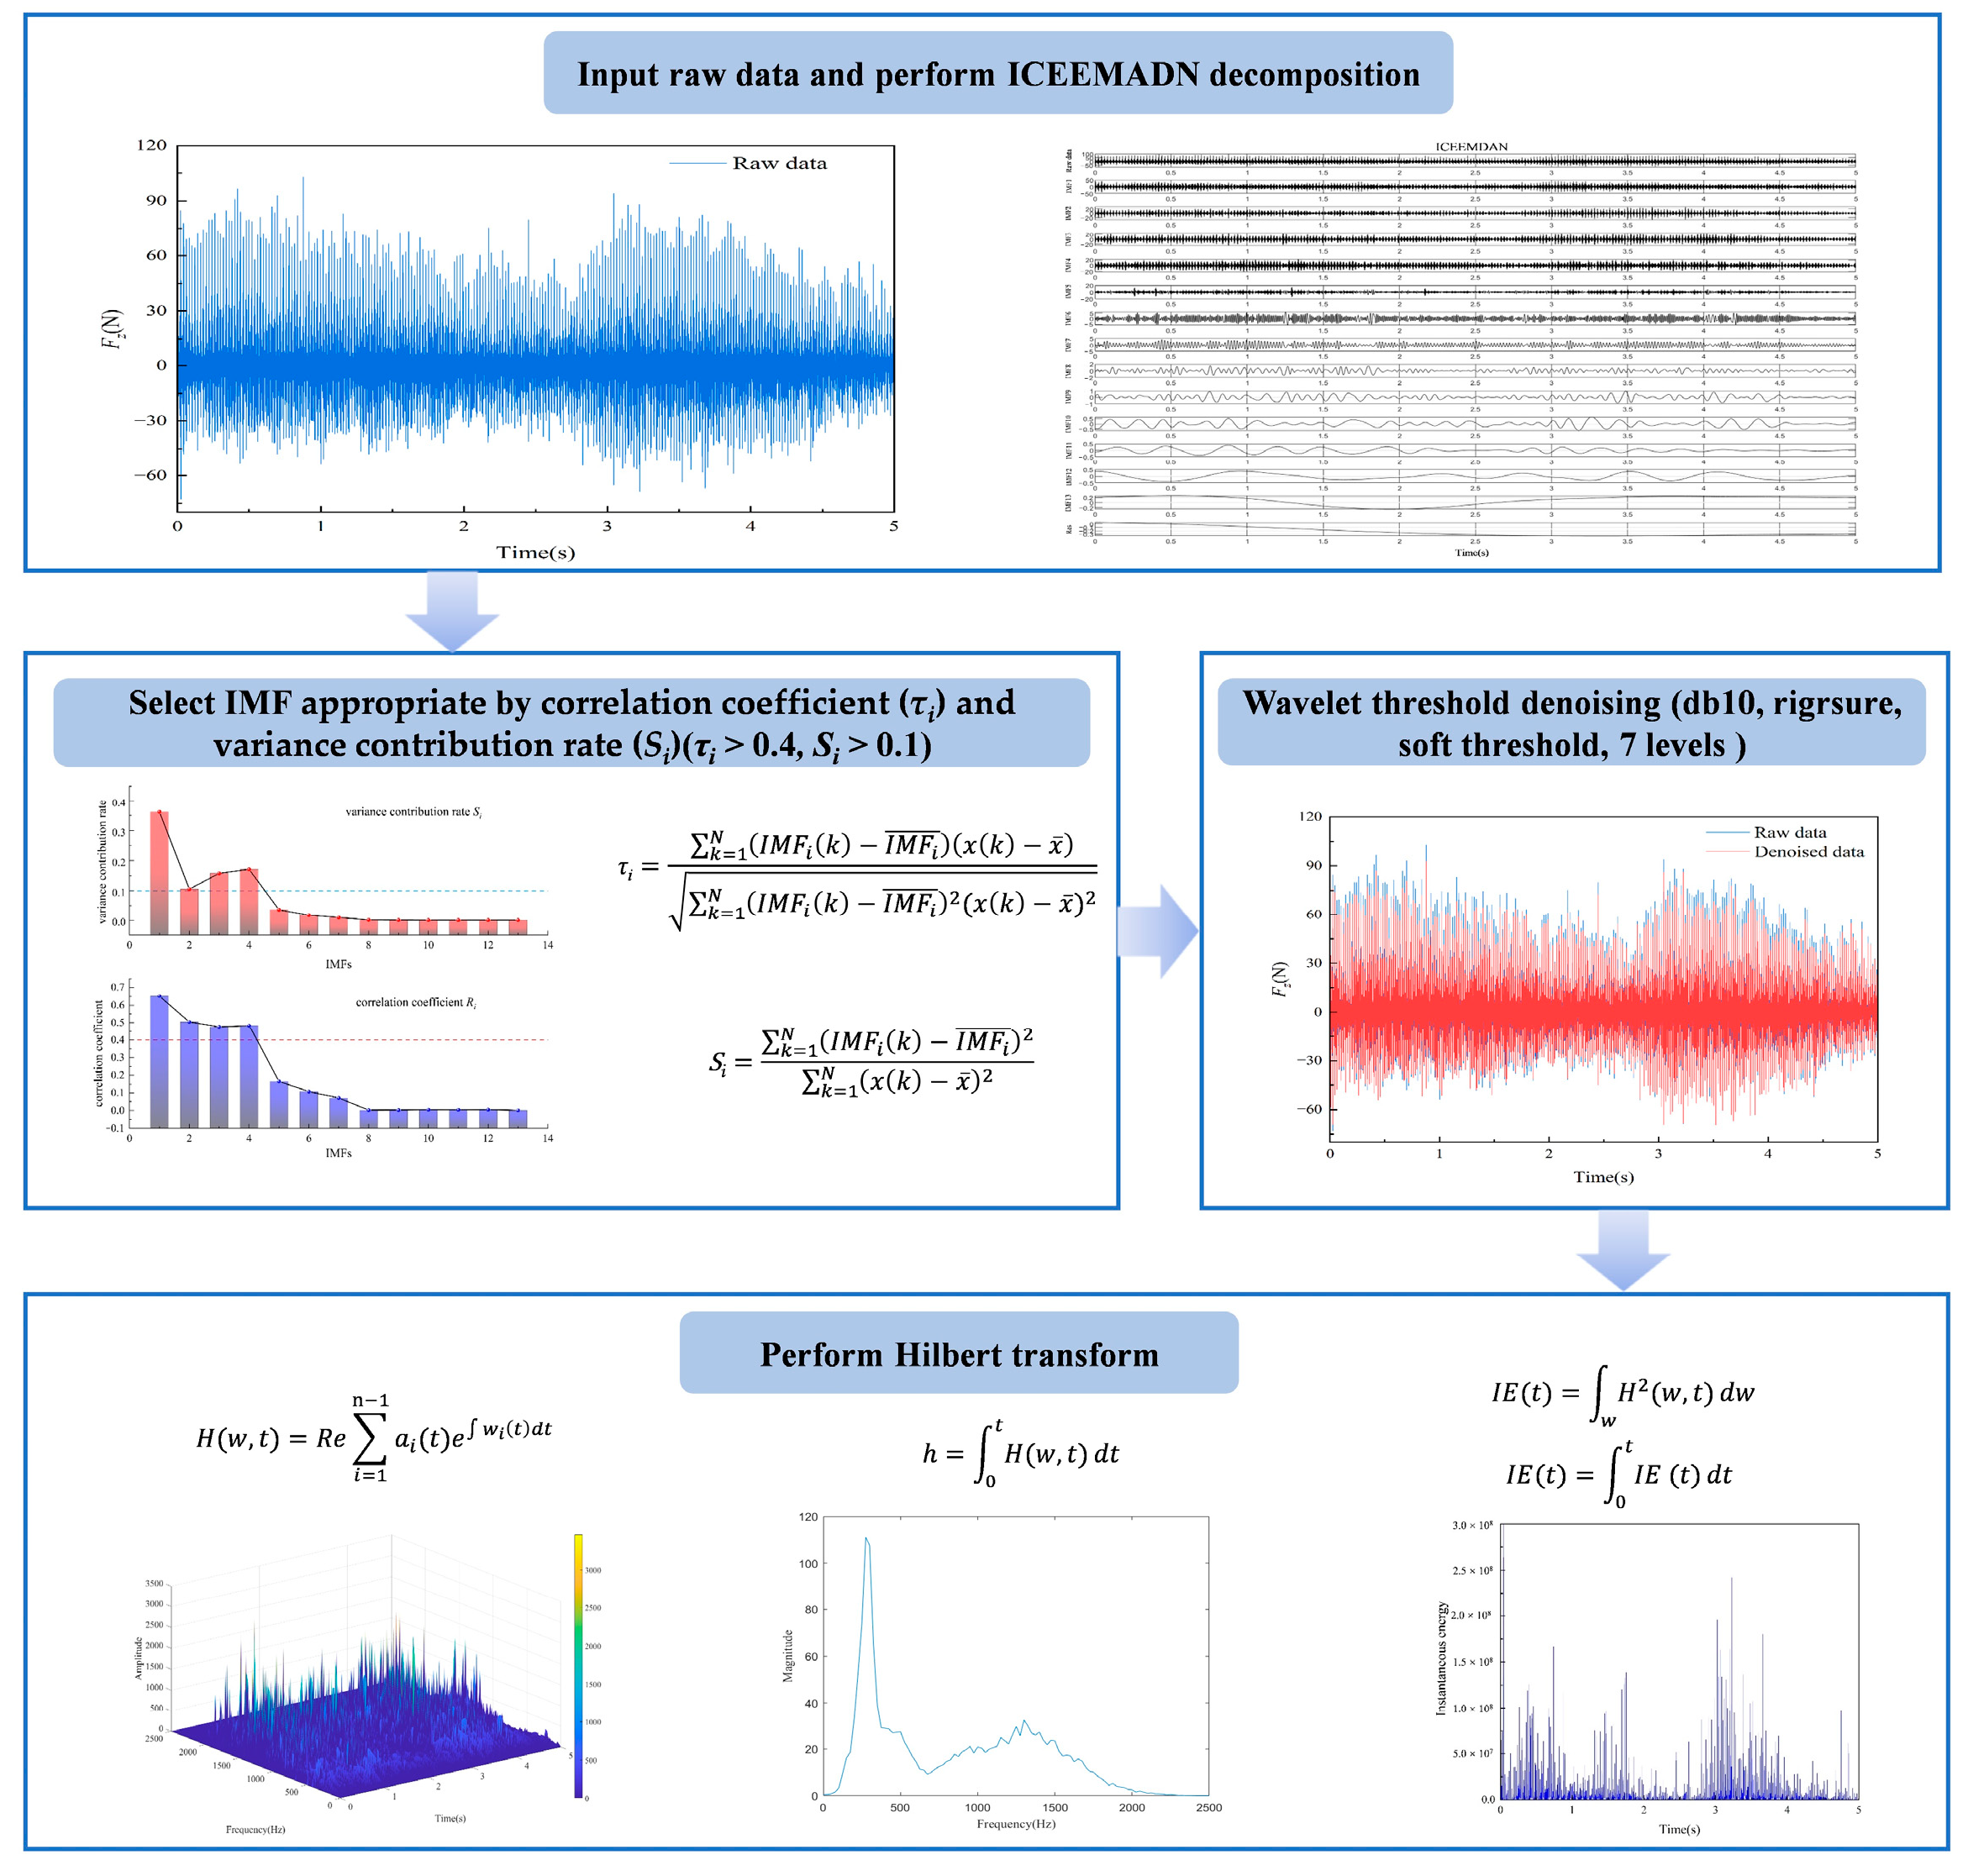
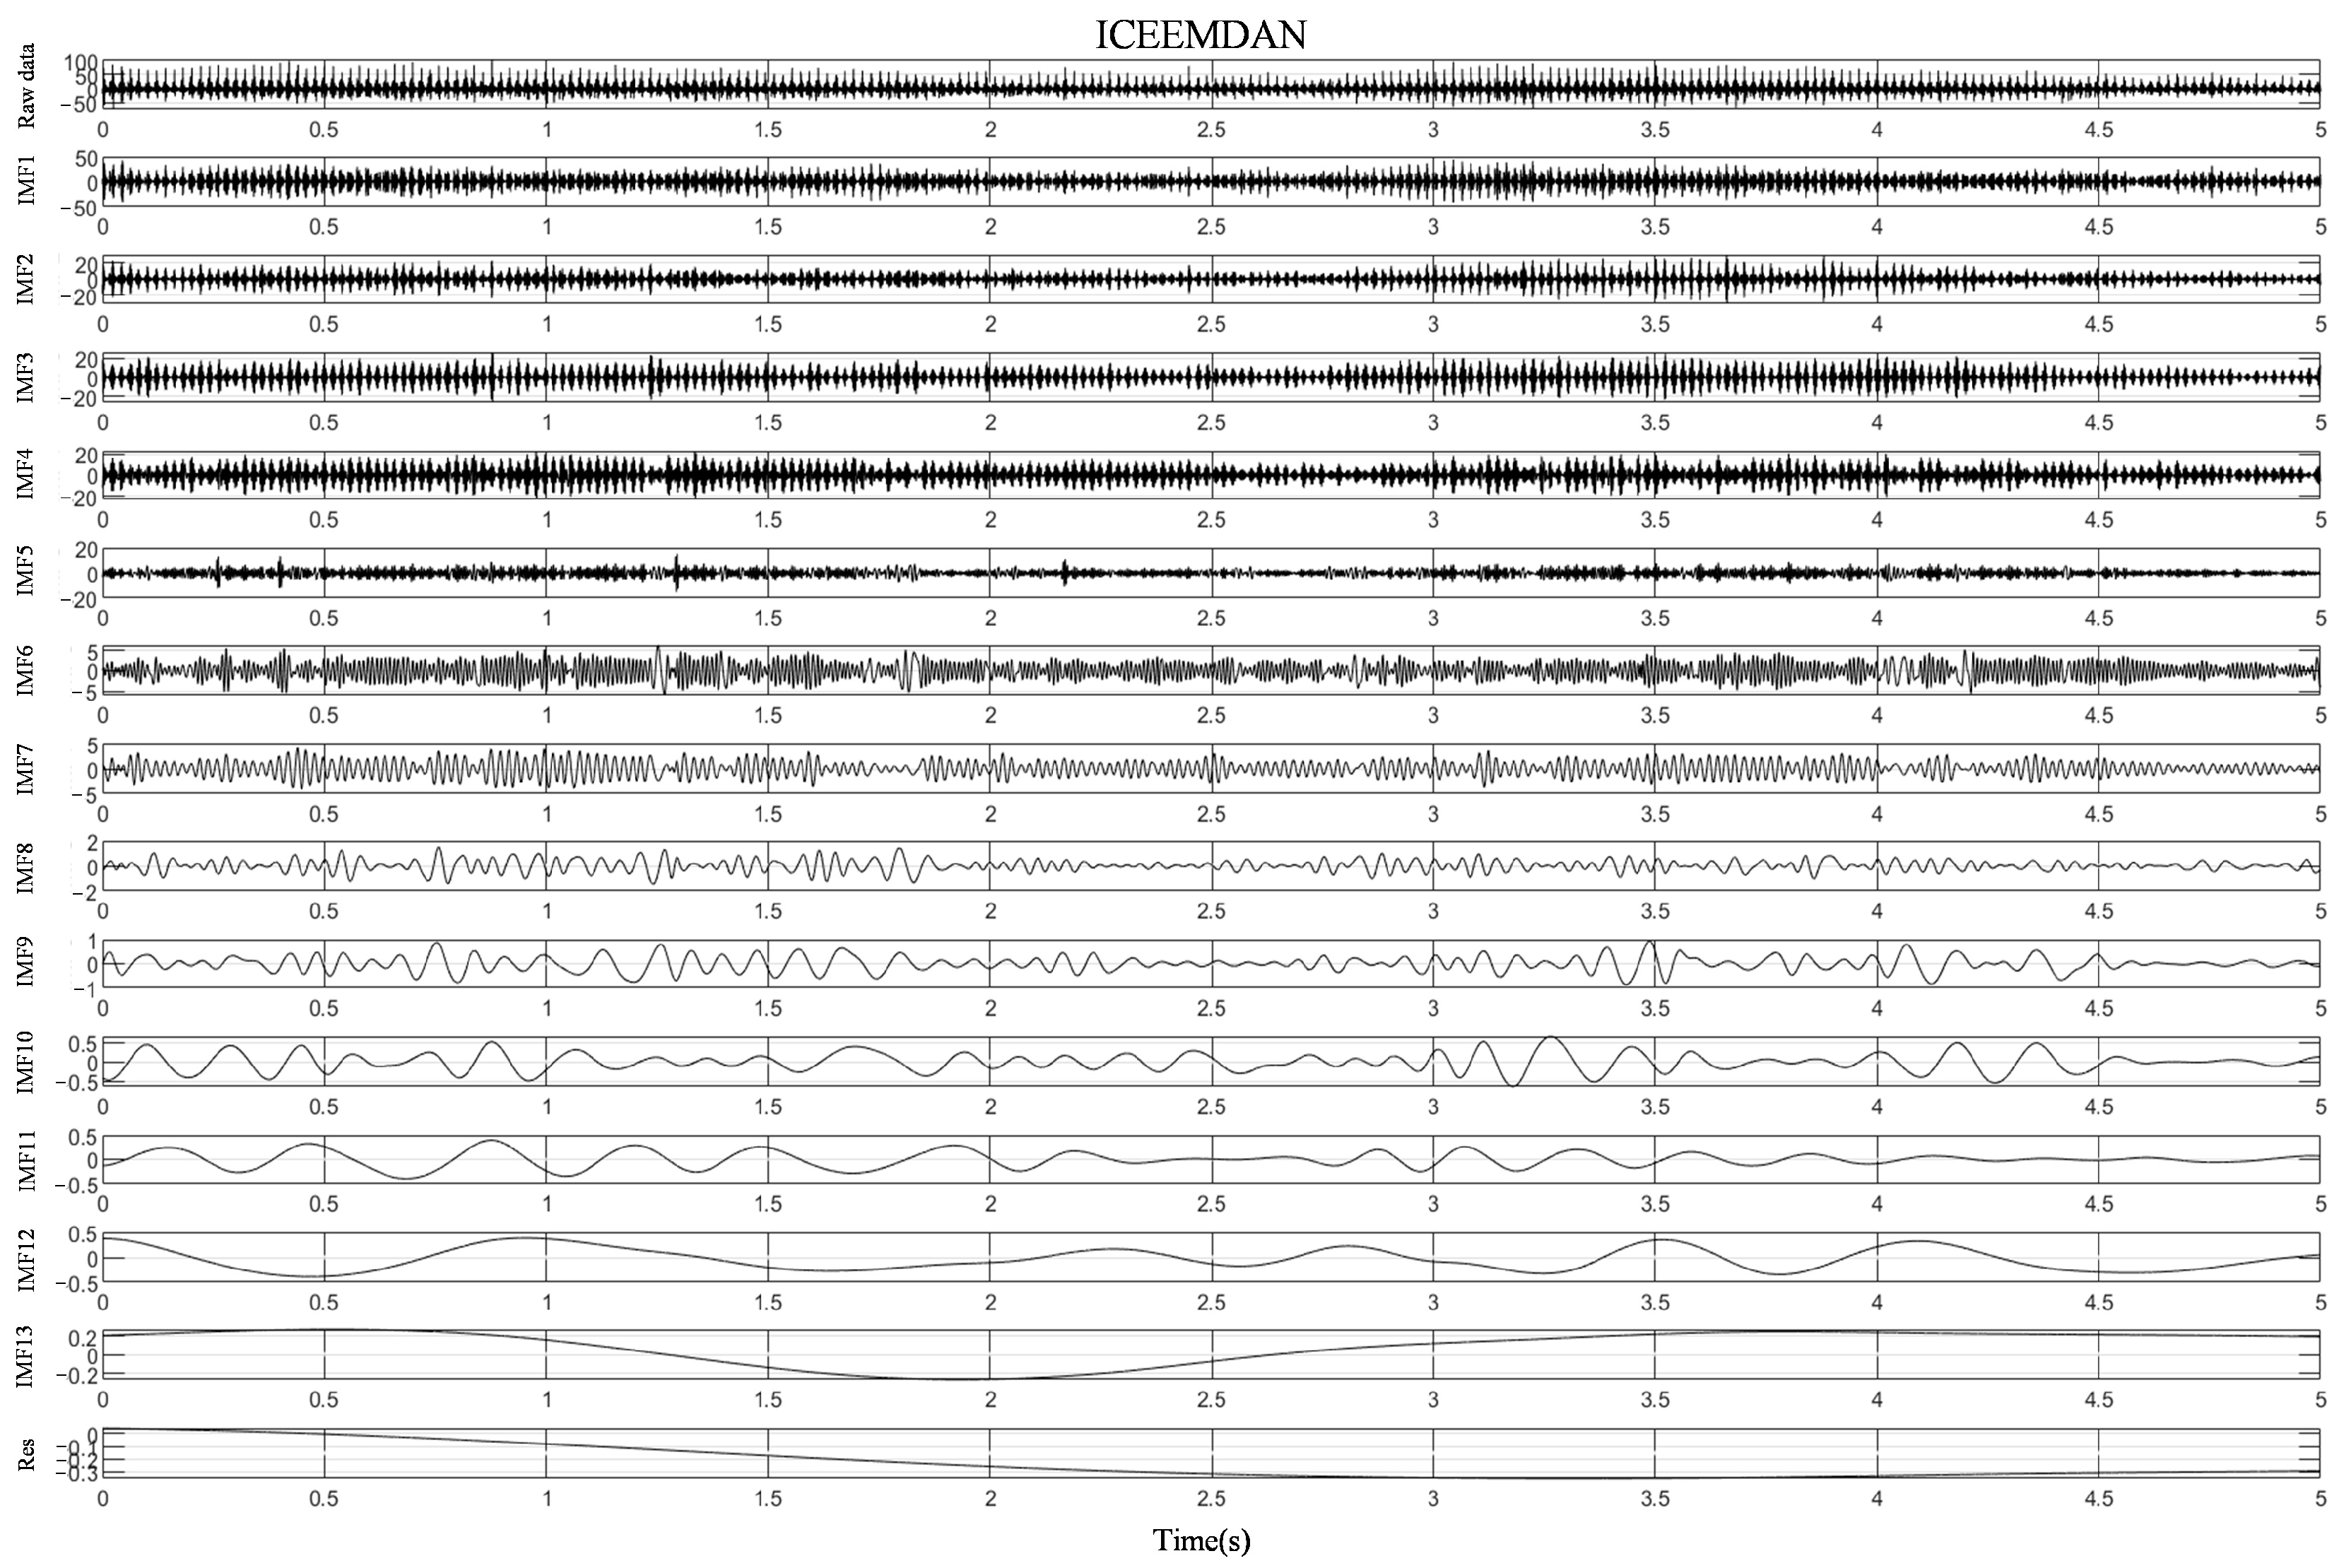
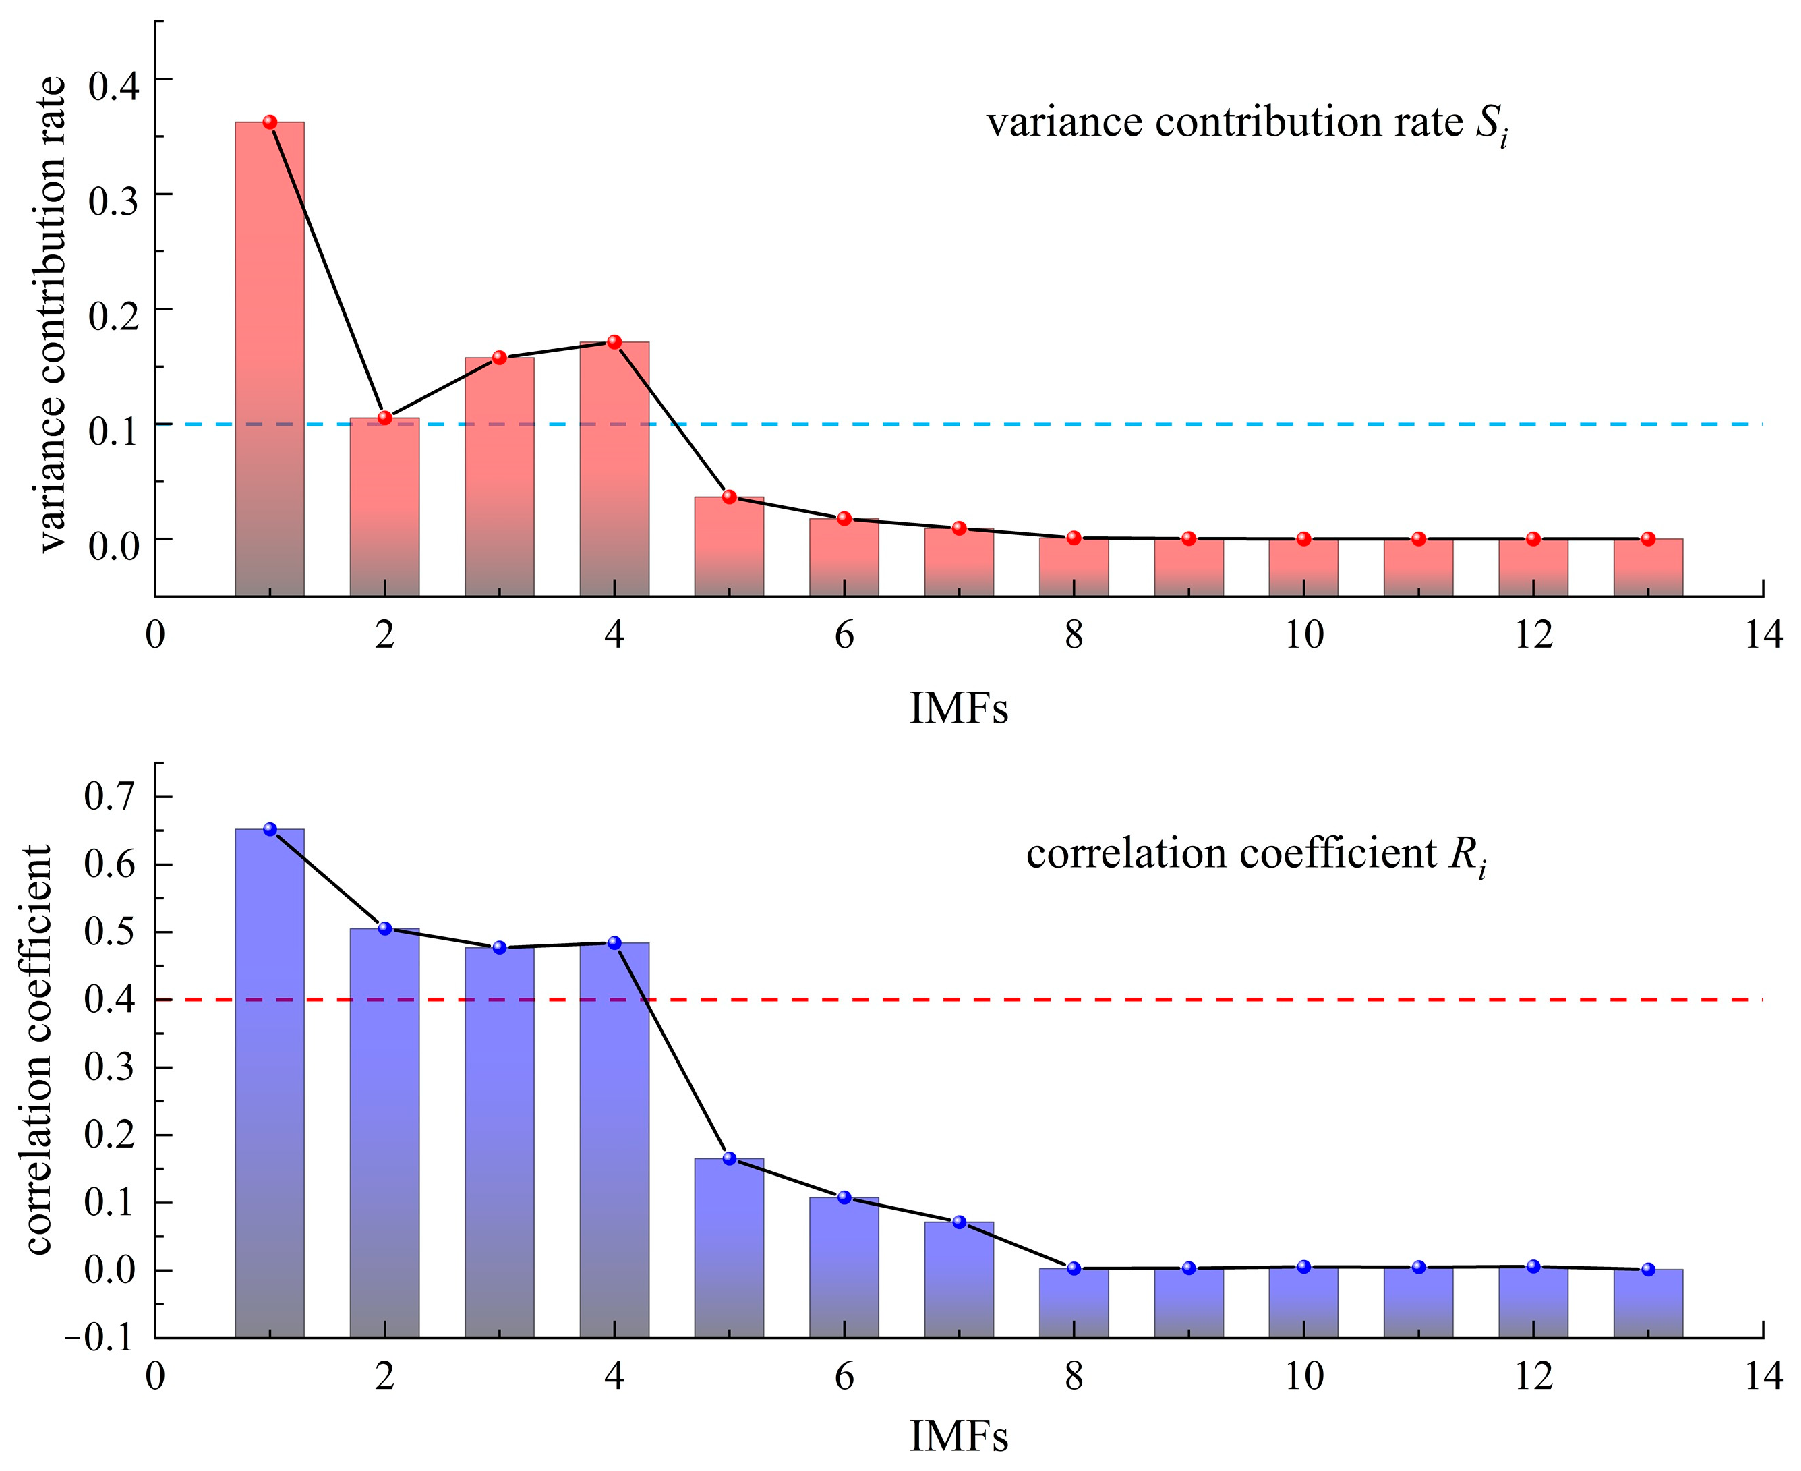
3.2.1. The Cutting Feature Extraction Method for UHMWPE-FRC Based on the Improved HHT

1.
The Improved HHT Considering ICEEMDAN and Wavelet Threshold De-Noising:
HHT was used to analyze and process raw time-domain data in the frequency domain by the procedure which first performs Empirical Mode Decomposition (EMD) on the raw data, to obtain multiple intrinsic mode functions (IMFs). It then applied the Hilbert transform (HT) to each IMF. Although HHT shows strong adaptability in processing unsteady and non-linear signals, it also has certain limitations: (1) EMD always results in the aliasing of mode functions, which affects the accuracy of subsequent analysis; (2) the IMFs with low-frequency contain some functions that are not highly correlated with the raw data, which should be excluded from the analysis; (3) the IMFs often contain a large amount of high-frequency and low-frequency interference information. Therefore, it is essential to reduce noise on the raw data before using HT. To address these issues, this study proposes an improved HHT, considering Improved Complete Ensemble Empirical Mode Decomposition with Adaptive Noise (ICEEMDAN) and wavelet threshold de-noising for reducing the cutting force signal’s noise and conducting time-frequency analysis [43]. The specific flow chart is shown in Figure 4.
The specific steps are as follows:
Step 1: Decompose the raw data by ICEEMDAN to obtain IMFs.
ICEEMDAN is an improved algorithm of EMD, which solves the aliasing of mode functions through adaptive noise injection and ensemble averaging strategies. Its core idea is to gradually extract the IMF by adding adaptive white noise for a few times and then ensemble the residuals. Adaptive noise injection improves the distinguishability and minimizes interference between different mode functions with stable decomposition process and optimized decomposition parameters [41]. The decomposition steps are as follows:
(1) Add adaptive white noise to the raw data x to be decomposed
X 1 n = x + α 1 E ( w n ) ,
where wn is Gaussian white noise; n = 1, 2, …, N; α 1 is the expected signal-to-noise ratio, which was calculated as
α 1 = ε 1 σ ( x ) σ E 1 w s ,
where ε1 is the amplitude; σ(·) is the mathematical expectation formula; and E1(·) is the 1st-order mode function decomposed by EMD.
(2) Calculate the 1st-order IMF1
IMF 1 = x r 1 ,
where r1 is the residual of the first decomposition, and r 1 = m e a n [ X 1 n E 1 ( X 1 n ) ] .
(3) When i ≥ 2,
X i n = r i 1 + α 1 E w n ,
(4) Then, the i-th IMF of the raw data x is
IMF i = r i 1 r i ,
Step 2: The thresholds are set, based on the correlation coefficient (τi) and variance contribution rate (Si), to select appropriate IMF [44].
The τi reflects the degree of similarity between the mode function and the raw data; it can be defined as
τ i = k = 1 N IMF i ( k ) - IMF i ¯ ( x ( k ) x ¯ ) k = 1 N IMF i ( k ) - IMF i ¯ 2 ( x ( k ) x ¯ ) 2 ,
where IMF i ¯ and x ¯ represent the mean values of IMFi and x, respectively.
The variance contribution rate Si of each IMF to the raw data is
S i = k = 1 N IMF i ( k ) - IMF i ¯ 2 k = 1 N x ( k ) x ¯ 2 ,
In this study, IMF with τi > 0.4 and Si > 0.1 were selected for further noise reduction processing.
Step 3: Perform wavelet threshold de-noising on the selected IMF and reconstruct the data [45,46]. The DB10 wavelet function, rigrsure threshold, and soft threshold function were selected, and the decomposition level was set at 7 for wavelet threshold de-noising.
Step 4: Based on the reconstructed data obtained in Step 3, the HT is performed to obtain the Hilbert spectrum, the marginal spectrum, the instantaneous energy spectrum, and the energy ratio of each frequency band. The HT is as follows:
H [ i ( t ) ] = 1 π P V i t t t d t ,
where PV is the Cauchy principal value and the analytical data z(t) is constructed as
z ( t ) = i ( t ) + j H [ i ( t ) ] = a ( t ) e j Φ ( t ) ,
where a(t) is the instantaneous amplitude and Φ(t) is the instantaneous phase:
a ( t ) = i 2 ( t ) + H 2 [ i ( t ) ] ,
Φ ( t ) = tan 1 H [ i ( t ) ] i ( t ) ,
The instantaneous frequency ω ( t ) is obtained by taking the derivative of Φ(t)
ω ( t ) = d Φ ( t ) d t = H i ( t ) i ( t ) H i ( t ) i ( t ) H 2 i ( t ) + i 2 ( t ) ,
Simultaneously, the raw data x(t) is reconstructed as follows
x ( t ) = R e i = 1 n 1 a i ( t ) e j Φ i ( t ) = R e i = 1 n 1 a i ( t ) e ω i ( t ) d t ,
where Re is the real part and the influence of residual terms is ignored in the calculation. Then, the Hilbert spectrum is
H ( ω , t ) = R e i = 1 n 1 a i ( t ) e ω i ( t ) d t ,
The Hilbert marginal spectrum (h(ω)) in Equation (15) is the integration of H(ω, t) with the time domain, which expresses the accumulation degree of data amplitude (energy) in each frequency range.
h ( ω ) = 0 t H ( ω , t ) d t ,
By segmenting the data frequency, the energy ratio of each frequency band is
FBER k = f l o w , k f h i g h , k h ( ω ) d ω 0 h ( ω ) d ω ,
where flow,k and fhigh,k are the low-frequency and high-frequency boundaries of the k-th frequency band.
The Hilbert instantaneous energy spectrum is obtained by integrating the square of H(ω,t) with the frequency, as follows:
I E ( t ) = ω H 2 ( ω , t ) d ω ,
The total energy E is obtained by integrating the instantaneous energy curve in the time domain:
E = 0 t I E ( t ) d t ,
2.
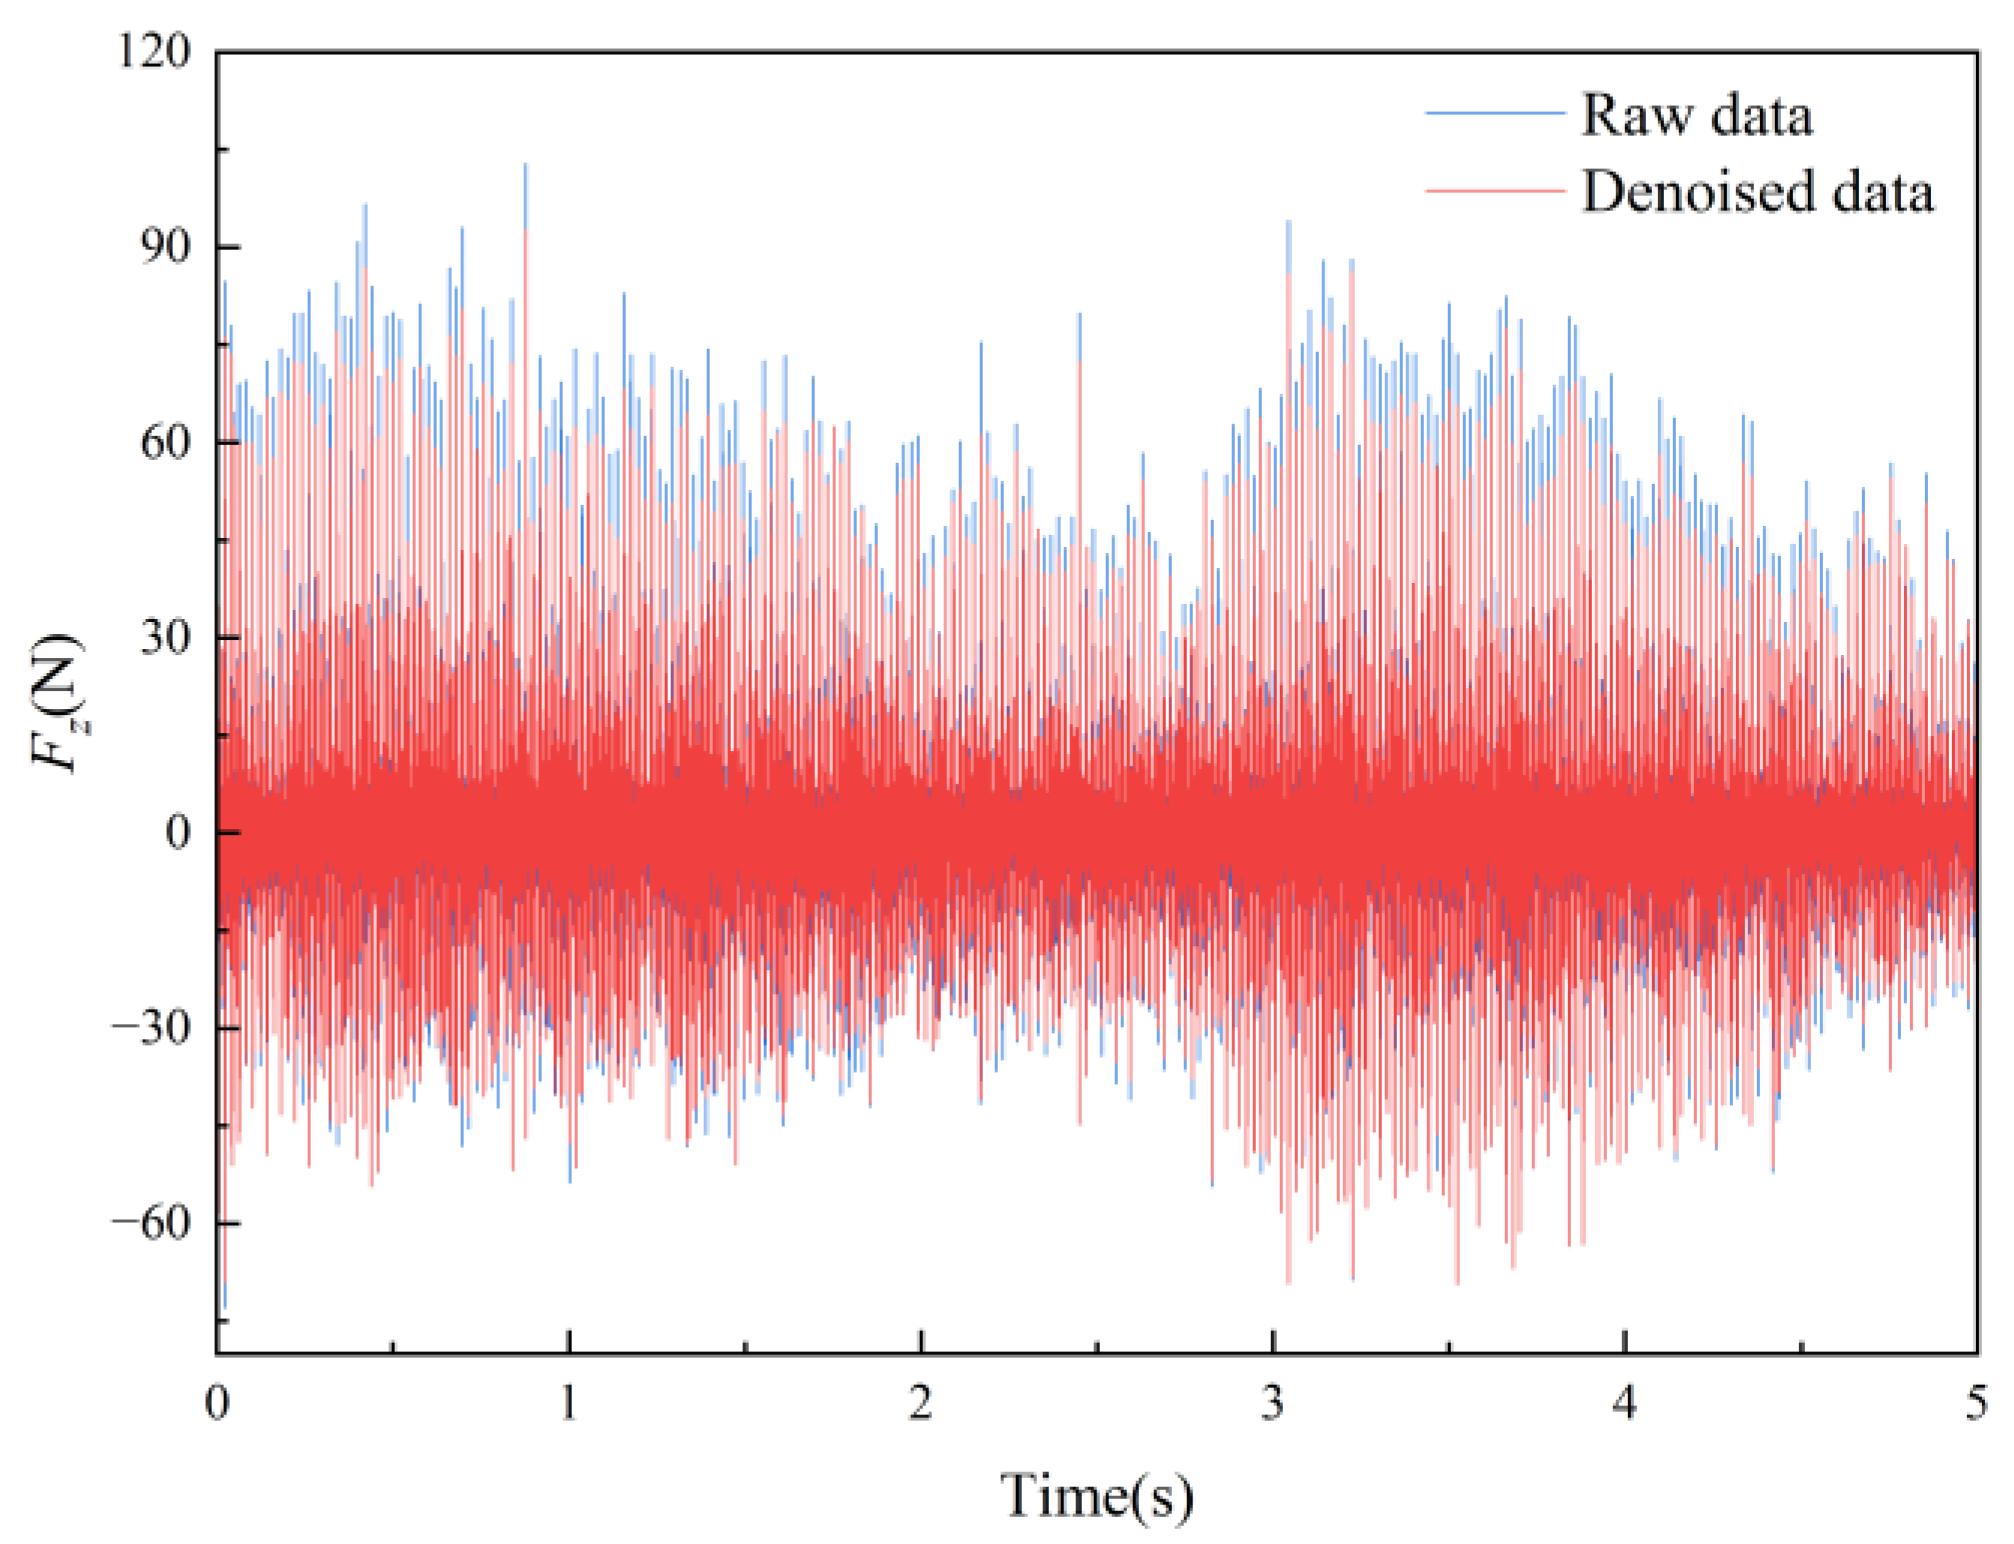
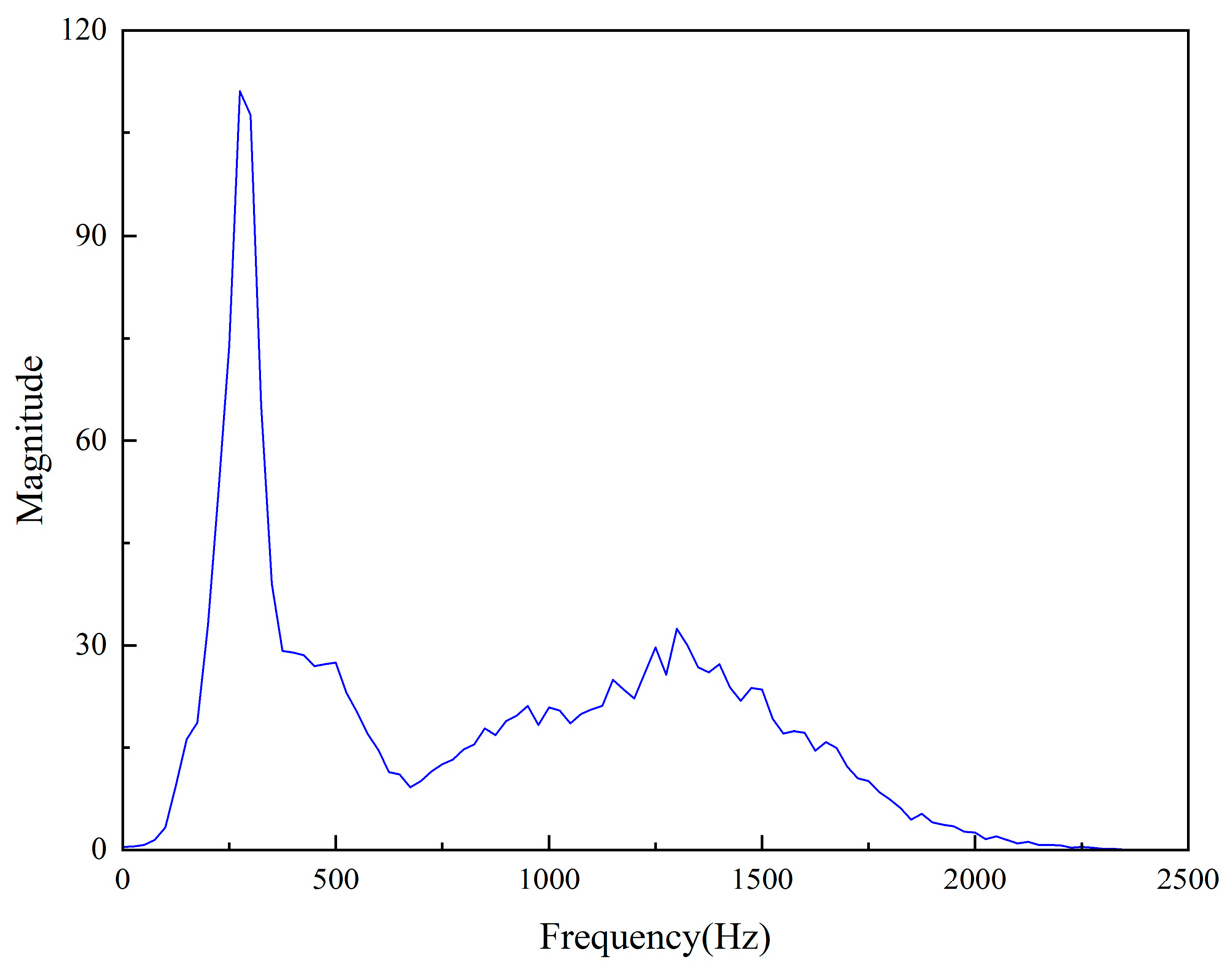
An Example of Cutting Force De-Noising and Time-Frequency Analysis with Improved HHT:
Taking the z-axis cutting force with cutting parameters of Vc = 18 m/s, Vf = 300 mm/min, and aq = 5 mm as an example, the above improved HHT method was applied for noise reduction and time-frequency analysis. The raw cutting force data are shown in Figure 5.
First, ICEEMDAN was used to empirically decompose the raw data of the cutting force. The adaptive Gaussian white noise standard deviation was 0.2, the number of added noise signals was 200, and the maximum allowed number of iterations was 1000. 13 IMF were obtained after decomposition, as shown in Figure 5.
Then, according to Equations (6) and (7), the τi and Si between each IMF and the raw data were obtained, as shown in Figure 6. Based on the method described above, the IMF must meet the requirements of τi > 0.4 and Si > 0.1; therefore, only IMF1~IMF4 were retained in this scenario. Wavelet threshold de-noising, with a decomposition level of 7, was applied to the IMF1~IMF4 by the DB10 wavelet basis function, rigrsure threshold, and soft threshold function. The de-noised IMF1~IMF4 were reconstructed to obtain cutting force, as shown in Figure 7. The processed data basically retained the characteristic information of the raw data after eliminating the influence of external noise.
The reconstructed and de-noised data performed HT based on Equations (8)–(18). Figure 8, Figure 9 and Figure 10 show the Hilbert time spectrum, marginal spectrum, and instantaneous energy spectrum, respectively.
From Figure 8 and Figure 9, the energy of the cutting force was mainly concentrated in the low and medium–frequency bands, which exhibited a multi-band distribution. The cutting force energy in primary frequency band of 250–350 Hz was the most concentrated, and the 1000–1500 Hz band also showed a relatively high energy distribution. The cutting force energy decreased after 1700 Hz and was nearly zero and negligible after exceeding 2000 Hz.
The cutting force energy distribution in Figure 8 and Figure 10 exhibited frequent fluctuations throughout the entire cutting process, which was consistent with the fluctuation in the raw cutting force data.

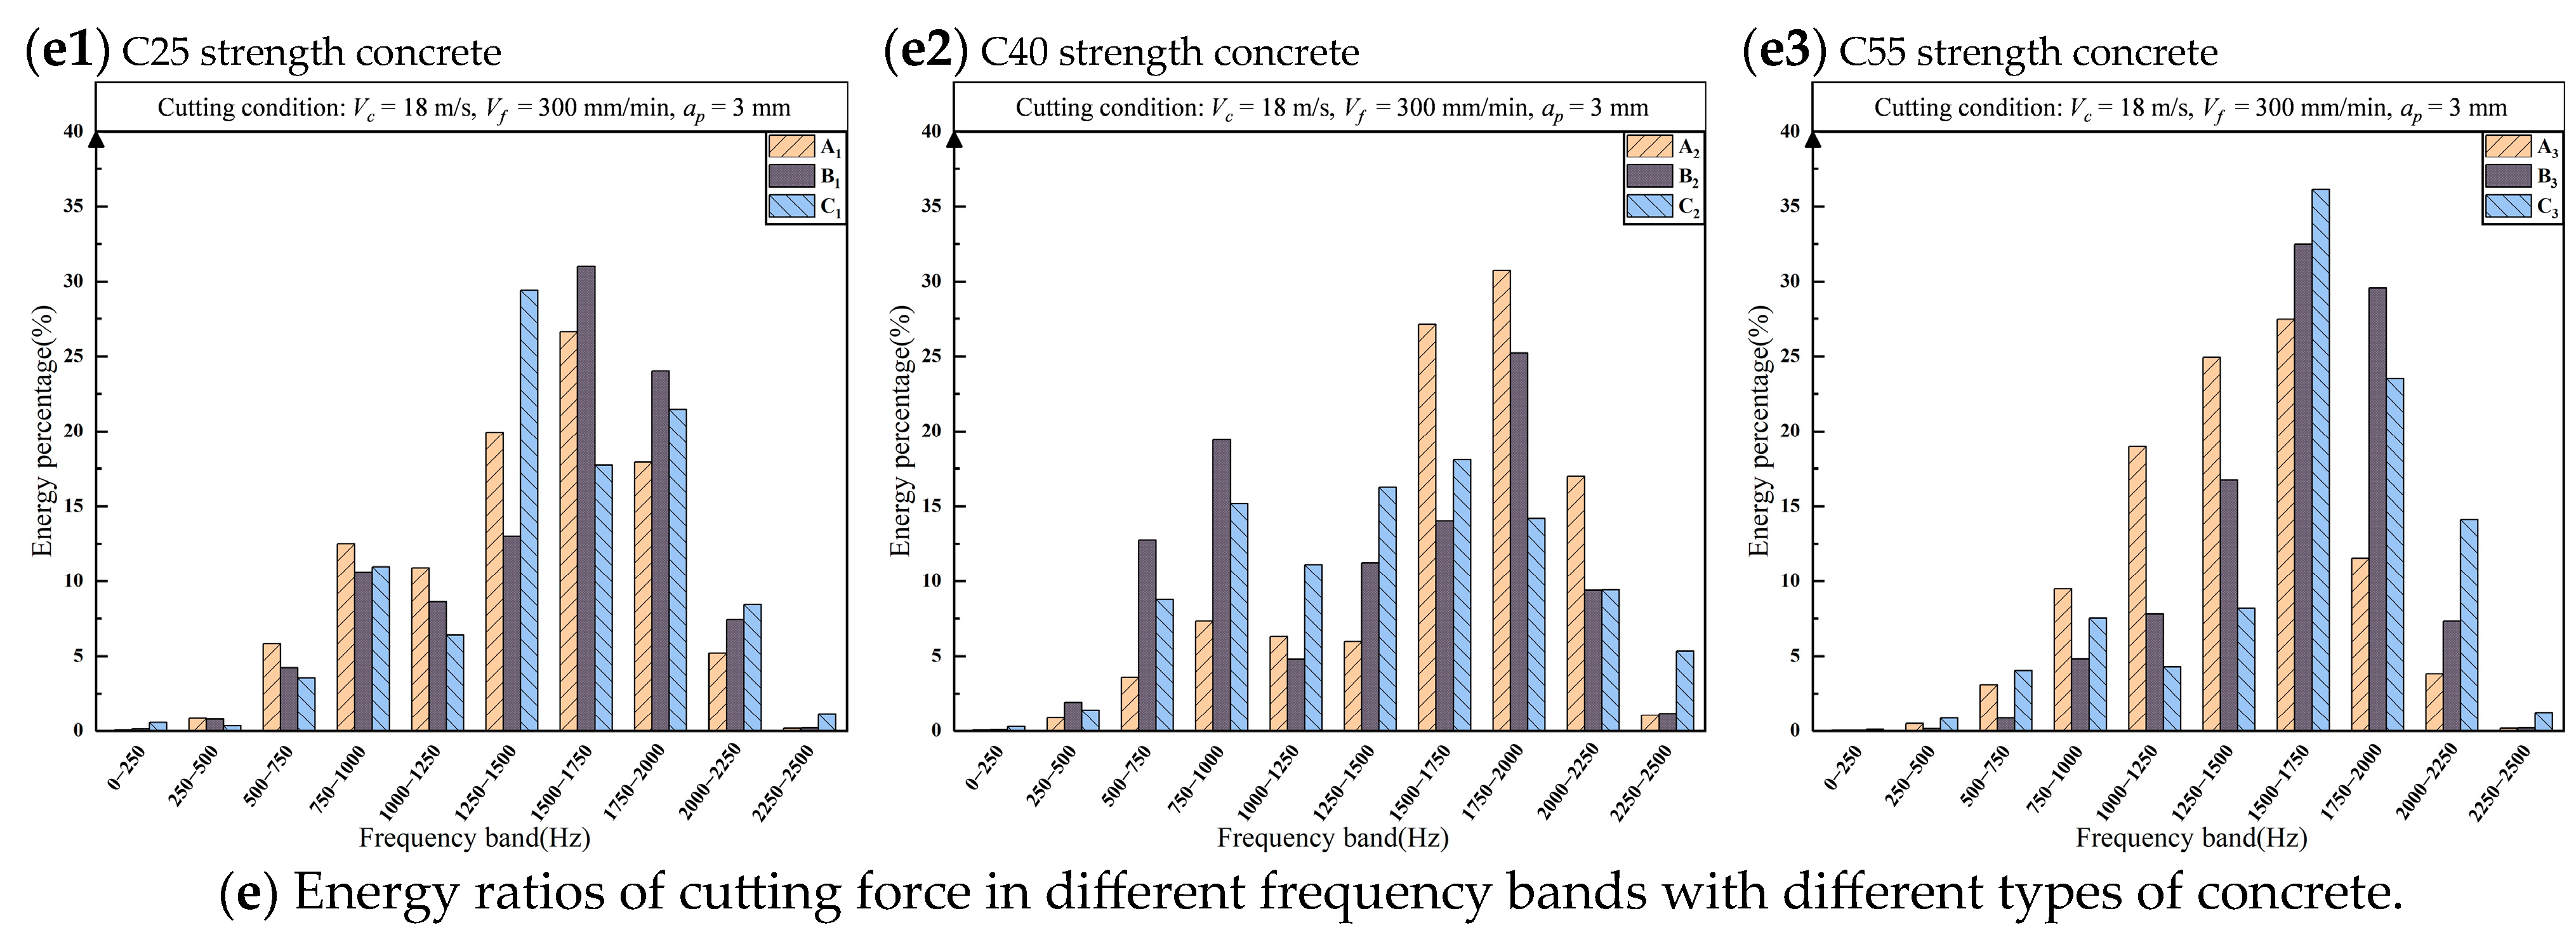
3.2.2. Feature Analysis and Preliminary Screening Based on Energy Ratios of Different Frequency Bands

The five types of parameters (depth of cup (ap), cutting speed (Vc), feed speed (Vf), concrete type, and concrete strength) were regarded as features which affected the cutting force of UHMWPE-FRC. Then, the energy ratio of cutting force in different frequency bands can be used to preliminarily determine whether these features significantly affect the cutting force.
The energy ratios of the cutting force of a diamond saw blade cutting UHMWPE-FRC, under multi-parameters, are shown in Figure 10. In Figure 11a, as ap increased, the frequency bands with higher energy ratios gradually shifted towards higher frequency bands. The increasing ap intensified the fiber fracture/pull-out and matrix fragmentation and triggered more frequent and higher-amplitude stress waves within the material, and generated higher-frequency components of the cutting force. Simultaneously, the increased contact area between saw blade and specimen induced more intense frictional micro-impacts and vibrations, which synergistically shifted the force signal energy toward higher frequency bands.
In Figure 11b, the frequency bands with higher energy ratios mainly stayed within 1500~2000 Hz under different Vc, with fewer low-frequency components and insignificant fluctuations. In Figure 11c, regardless of the change of Vf, the primary energy ratios of the cutting force were consistently located within the 250~1000 Hz range, with fewer high-frequency components. In Figure 11d, as the concrete strength increased, the frequency bands with the highest energy ratios gradually shifted towards a higher frequency range. The higher strength concrete exhibited enhanced brittleness, and its broken mode transited from plastic deformation to brittle fracture during cutting, characterized by rapid crack initiation and propagation, which resulted in an increase in the high frequency component of the cutting force. Also, when the concrete contained hard aggregates, the frequency bands with higher energy ratios also shifted towards a higher frequency range.
From the above analysis, it was preliminarily found that the ap, concrete strength, and the types of concrete were likely to be significant features for the cutting force. To further validate these findings, a correlation analysis between these five parameters/features and the cutting force, processed by the improved HHT, will be carried out next.

3.2.3. Correlation Analysis for Feature Extraction of UHMWPE-FRC Based on Feature Classification

From Section 3.2.2, the changes of energy ratios were closely related to the features themselves. Therefore, a unified approach could not analyze the correlation between all features and the energy ratios of cutting force. It was necessary to define and categorize the features based on their inherent properties. In this study, based on the characteristics of the cutting process, the cutting parameters (ap, Vc, Vf) and the concrete strength were considered freely selectable with continuous value ranges, thus classified as continuous variable features. On the other hand, the type of concrete was regarded as being a typically unordered variable feature.
1.
Correlation Analysis Methods for Continuous Variable Features:
The cutting parameters (ap, Vc, and Vf) and concrete strength were considered as continuous variable features. Experiments found that their relationship with the energy ratios of the cutting force, after improved HHT, was non-linear/non-normal. Therefore, the Spearman’s Rank correlation was appropriate for analyzing whether the continuous variable features had a significant influence on the cutting force. The equation for the Spearman’s Rank correlation coefficient (ρ) is as follows:
ρ = 1 6 d i 2 n n 2 1 ,
where di is the difference between the ranks of corresponding variables and n is the number of samples.
The Spearman’s Rank correlation is primarily used to analyze the correlation between two variables. One of the variables in this example was the continuous variable features classified above, where the rank value represented the ordered sequence, from smallest to largest. The other variable was the distribution of the cutting force energy ratios after improved HHT across different frequency ranges. Since the energy ratios in different frequency band ranges have different influences on cutting force, the ranking value is defined as the sum of the products of the top three maximum energy ratios and the median values of their corresponding frequency bands.
2.
Correlation Analysis Methods for Unordered Category of Variable Features:
Under the specific experimental conditions of this study, the type of concrete was considered to be the unordered categorical variable feature, in that it did not exhibit a significant normal distribution. The Kruskal–Wallis test was suitable for analyzing its correlation with the energy ratios of cutting force across different frequency band ranges after improved HHT. The basic idea of the Kruskal–Wallis test is to replace the original observations with their ranks and then perform a one-way analysis of variance (ANOVA) on these ranks. The H statistic for the Kruskal–Wallis test is:
H = 12 N ( N + 1 ) R i 2 n i 3 ( N + 1 ) ,
where ni is the number of samples in the i-th group, Ri is the sum of ranks for the i-th group, and N is the total number of samples. H approximately follows a chi-square distribution (χ2) with k−1 degrees of freedom, where k is the number of groups. The p-value can be obtained by checking the chi-squared distribution table, to determine the significance of the test.
The null hypothesis (H0) stated that the distributions of the samples were identical. The findings in this paper imply that there were no significant differences in the energy ratios across the frequency bands among the three types of concrete. The alternative hypothesis (H1) stated that the distributions of the samples were not identical (at least not entirely identical), implying that at least one pair of concrete types exhibited a significant difference in the energy ratios across the frequency bands. By fully considering the complex data for composite materials with mixed soft and hard aggregates, the significance level (α) was set at α = 0.1.
In order to investigate whether there were differences between groups (i.e., different types of concrete), post hoc comparisons were conducted after the Kruskal–Wallis test. A commonly used method is Dunn’s test, and the Z statistic is calculated as follows:
Z = R ¯ 1 R ¯ 2 N ( N + 1 ) 12 1 n 1 + 1 n 2 ,
where R 1 ¯ is the mean of R1 (the first group in the pairwise comparison), R 2 ¯ is the mean of R2 (the second group in the pairwise comparison), n1 is the sample size of the first group in the pairwise comparisons, and n2 is the sample size of the second group in the pairwise comparisons. The Z statistic follows a standard normal distribution with a mean of 0 and a standard deviation of 1. The corresponding p-value is obtained from checking the standard normal distribution table. To reduce the inflation of Type I errors resulting from multiple pairwise comparisons, the Bonferroni [47] correction was employed in this study.

3.2.4. Correlation Analysis Results and Feature Extraction

1.
Correlation Analysis Results for Continuous Variable Features:
The results of the Spearman correlation coefficients for the continuous variable features are shown in Table 4. Since a larger |ρ| indicated a stronger correlation, the ap and concrete strength exhibited a strong positive correlation with cutting force, while the Vc showed a negative correlation. In contrast, Vf demonstrated little correlation. However, it must be noted that the above results were obtained under specific experimental conditions and the results may vary if the conditions are changed. Therefore, ap, concrete strength, and Vc can be extracted as the significant features affecting cutting. This observation illustrates the fact that feature extraction for multi-component composite materials is highly dependent on the specific implementation conditions.
In a physical sense, there are significant relationships between the cutting parameters, concrete properties, and the cutting force frequency band energy ratios. The ap and concrete strength exhibited a strong positive correlation with cutting force, as greater depths and stronger materials naturally required more force, leading to higher energy ratios in specific frequency bands. In contrast, the Vc showed a negative correlation with cutting force. This phenomenon was attributed to reduced contact time between the diamond saw blades and the concrete material, leading to less resistance and less energy concentrated in specific frequency bands. This correlation analysis method quantified the features of complicated data mixed with multi-components and provided an effective idea for feature extraction.
2.
Correlation Analysis Results for Unordered Categorical Variable Features:
The results of the Kruskal–Wallis and Dunn’s tests for the unordered categorical variable features are shown in Table 5. At low frequency ranges, it was relatively easy to distinguish between aggregate-free UHMWPE-FRC and aggregate-containing UHMWPE-FRC, indicating that the influence of aggregates on the cutting force could be identified within this frequency range. Conversely, at high frequency ranges, it was relatively easy to differentiate between non-aggregate and non-fiber concrete and aggregate-containing UHMWPE-FRC, indicating that the influence of fibers on the cutting force could be detected within this frequency range.
The conclusions in this section are largely consistent with the preliminary screening results in Section 3.2.2. However, the correlation between Vc and cutting force is better-distinguished in this section, which proves that correlation analysis based on feature classification could effectively improve the accuracy of the experimental results obtained after de-noising and time-frequency analysis by the improved HHT.
This method can be extended to hard–soft hybrid systems such as carbon fiber-reinforced ceramics and basalt fiber concrete, enabling the exploration of a universal frequency-domain feature extraction framework for multiphase composite materials. This advancement allows for more precise and intelligent evaluation of tool performance and material states, thereby extending the tool life of diamond saw blades and lowering construction costs.

4. Conclusions

In this study, the effects of five variable features (ap, Vc, Vf, concrete strength, and the type of concrete) on the cutting force of a diamond saw blade cutting UHMWPE-FRC were analyzed, with cutting force being the evaluation index. A feature extraction method for UHMWPE-FRC, based on feature classification, and an improved HHT was proposed for the properties of hard–soft multiphase hybrid composites. The main conclusions are as follows:
1. To address the randomness of cutting force data, an improved HHT, considering ICEEMDAN and wavelet threshold de-noising, was used to de-noise and analyze the time-frequency of the cutting force to make the data features visible.
2. The preliminary screening of features, based on the energy ratios of frequency bands in the cutting force of UHMWPE-FRC, found that the frequency bands with higher energy ratios gradually shifted towards a higher frequency range, with the increase of ap and concrete strength. With the changes in the Vc and Vf, the frequency bands with higher energy ratios remained concentrated within a specific frequency range and exhibited insignificant fluctuations. Additionally, when the concrete contained hard aggregates, the frequency bands with higher energy ratios also shifted towards a higher frequency range.
3. A correlation analysis method was proposed to extract the features of cutting UHMWPE-FRC based on feature classification. The five variable features were categorized into continuous variable features and unordered categorical variable features, and correlation analyses were then carried out using the Spearman correlation coefficient test and Kruskal–Wallis and Dunn’s test, respectively. The results indicate that the ap and concrete strength exhibit a strong positive correlation with cutting force, while the Vc showed a negative correlation and the Vf demonstrated little to no correlation. By employing the Kruskal–Wallis and Dunn’s test, it was found that the influence of aggregates on the cutting force could be identified in the low-frequency range; whereas, the influence of fibers could be identified in the high-frequency range. The feature classification-based correlation analysis method was largely consistent with the preliminary screening results of the energy ratios in the frequency bands, but it provided a more refined distinction of the correlation between Vc and cutting force, demonstrating its effectiveness in improving the accuracy of the experimental results.
4. This feature extraction method can be extended to hard–soft hybrid materials such as carbon fiber-reinforced ceramics and basalt fiber concrete, enabling the exploration of a universal frequency-domain feature extraction framework for multiphase composite materials.

Author Contributions

Conceptualization, writing—original draft, S.H.; data analysis, methodology, J.F.; experiment, data collection, H.L.; formal analysis, investigation G.T.; resources, G.Z.; experimental design and guidance, F.X.; methodology, writing—review and editing, S.Z. and Y.H. All authors have read and agreed to the published version of the manuscript.

Funding

This work was supported by the National Natural Science Foundation of China (Grant No. 52465051 and No. 51965004) and the Natural Science Foundation of Guangxi Zhuang Autonomous Region, China (Grant 2025GXNSFAA069889).

Data Availability Statement

The original contributions presented in the study are included in the article, further inquiries can be directed to the corresponding authors.

Conflicts of Interest

The authors declare no conflict of interest.

References

  1. Li, J.; Wu, C.; Liu, Z.-X. Comparative Evaluation of Steel Wire Mesh, Steel Fibre and High Performance Polyethylene Fibre Reinforced Concrete Slabs in Blast Tests. Thin Walled Struct. 2018, 126, 117–126. [Google Scholar] [CrossRef]
  2. Chen, L.; Chen, Z.; Xie, Z.; Wei, L.; Hua, J.; Huang, L.; Yap, P.S. Recent developments on natural fiber concrete: A review of properties, sustainability, applications, barriers, and opportunities. Dev. Built Environ. 2023, 16, 100255. [Google Scholar] [CrossRef]
  3. García, G.; Cabrera, R.; Rolón, J.; Pichardo, R.; Thomas, C. Natural Fibers as Reinforcement of Mortar and Concrete: A Systematic Review from Central and South American Regions. J. Build. Eng. 2024, 98, 111267. [Google Scholar] [CrossRef]
  4. Guo, Z.; Zhuang, C.; Li, Z.; Chen, Y. Mechanical Properties of Carbon Fiber Reinforced Concrete (CFRC) after Exposure to High Temperatures. Compos. Struct. 2021, 256, 113072. [Google Scholar] [CrossRef]
  5. Ivorra, S.; Garcés, P.; Catalá, G.; Andión, L.G.; Zornoza, E. Effect of Silica Fume Particle Size on Mechanical Properties of Short Carbon Fiber Reinforced Concrete. Mater. Des. 2010, 31, 1553–1558. [Google Scholar] [CrossRef]
  6. Spagnuolo, S.; Meda, A.; Rinaldi, Z.; Nanni, A. Precast Concrete Tunnel Segments with GFRP Reinforcement. J. Compos. Constr. 2017, 21, 04017020. [Google Scholar] [CrossRef]
  7. Song, P.S.; Hwang, S. Mechanical Properties of High-Strength Steel Fiber-Reinforced Concrete. Constr. Build. Mater. 2004, 18, 669–673. [Google Scholar] [CrossRef]
  8. Iqbal Khan, M.; Abbas, Y.M. Significance of Fiber Characteristics on the Mechanical Properties of Steel Fiber-Reinforced High-Strength Concrete at Different Water-Cement Ratios. Constr. Build. Mater. 2023, 408, 133742. [Google Scholar] [CrossRef]
  9. Yao, X.; Han, Y.; Shen, L.; Zhu, D. Experimental study on the effect of polypropylene fiber on compressive strength and fracture properties of high-strength concrete after elevated temperatures. J. Build. Eng. 2024, 86, 108860. [Google Scholar] [CrossRef]
  10. Yang, Y.B.; Chen, B.X.; Chen, Y.; Liu, F.C.; Xie, X.M.; Guo, W.Y.; Wang, H.C. Effect of admixtures and PVA fiber on the mechanical properties of high strength cementitious grout. Case Stud. Constr. Materials 2023, 18, e01884. [Google Scholar] [CrossRef]
  11. Zhen, G. Study on the failure effect of aramid reinforced concrete slab under localized blast loading. Structures 2024, 63, 106292. [Google Scholar] [CrossRef]
  12. Staniszewski, J.M.; Bogetti, T.A.; Wu, V.; Moy, P. Interfibrillar behavior in ultra-high molecular weight polyethylene (UHMWPE) single fibers subjected to tension. Int. J. Solids Struct. 2020, 206, 354–369. [Google Scholar] [CrossRef]
  13. Li, Y.-F.; Hsu, C.-F.; Syu, J.-Y.; Chen, F.-W.; Wu, J.-H. Experimental Investigation on the Mechanical Characteristics of Ultra-High-Molecular-Weight Polyethylene (UHMWPE) Based Fiber-Reinforced Concrete. Case Stud. Constr. Mater. 2024, 21, e03762. [Google Scholar] [CrossRef]
  14. Chen, Z.; Yu, L.; Jin, W.; Jiang, L.; Guo, M. Effect of ultra-high molecular weight polyethylene fiber on the early mechanical strength and shrinkage crack resistance of concrete. Struct. Concr. 2022, 23, 412–422. [Google Scholar] [CrossRef]
  15. Ji, Y.; Pei, Z. Investigation of Mechanical Properties of Ultra-High-Performance Polyethylene-Fiber-Reinforced Recycled-Brick-Aggregate Concrete. Polymers 2023, 15, 4573. [Google Scholar] [CrossRef]
  16. Yan, L.H.; Zhang, Y.W.; Zhu, L. Basic mechanical properties of ultra high molecular weight polyethylene fiber concrete. J. Natl. Univ. Def. Technol. 2014, 36, 43–47. [Google Scholar]
  17. Chu, S. Strain-hardening ultra-high performance concrete (UHPC) with hybrid steel and ultra-high molecular weight polyethylene fibers. Constr. Build. Mater. 2024, 438, 136716. [Google Scholar] [CrossRef]
  18. Wu, J.Q.; Wang, Y.; Sun, P.; Sun, Z.S.; Shen, J.S. The complete chloroplast genome of Prunus phaeosticta(Hance) Maxim. (Rosaceae) and its phylogenetic implications. Mitochondrial DNA Part B 2023, 8, 136–140. [Google Scholar] [CrossRef]
  19. Wu, Y.; Chen, M.; Chen, D.; Zhou, X.; He, J. Modification of ultra-high molecular weight polyethylene fiber to improve mechanical properties of foamed concrete. Constr. Build. Mater. 2024, 450, 138681. [Google Scholar] [CrossRef]
  20. Chun, B.; Lee, S.W.; Piao, R.; Kim, S.; Yoo, D.-Y. Enhanced Impact Resistance of RC Beams Using Various Types of High-Performance Fiber-Reinforced Cementitious Composites. Eng. Struct. 2024, 319, 118790. [Google Scholar] [CrossRef]
  21. Hajiesmaeili, A.; Denarié, E. Next Generation UHPFRC for Sustainable Structural Applications. In DSCS 2018: 2nd International Workshop on Durability and Sustainability of Concrete Structures; American Concrete Institute: Farmington Hills, MI, USA, 2018. [Google Scholar]
  22. Osman, B.H.; Sun, X.; Tian, Z.; Lu, H.; Jiang, G. Dynamic Compressive and Tensile Characteristics of a New Type of Ultra-High-Molecular Weight Polyethylene (UHMWPE) and Polyvinyl Alcohol (PVA) Fibers Reinforced Concrete. Shock. Vib. 2019, 2019, 6382934. [Google Scholar] [CrossRef]
  23. Pan, Z.; Tuladhar, R.; Yin, S.; Shi, F.; Dang, F. Feasibility of Repairing Concrete with Ultra-High Molecular Weight Polyethylene Fiber Cloth: A Comprehensive Literature Review. Buildings 2024, 14, 1631. [Google Scholar] [CrossRef]
  24. Wei, X.; Du, H.W.; Wang, C.Y.; Fang, Y.L. Investigation of Cutting Forces in Concrete Sawing Process. Key Eng. Mater. 2003, 250, 181–186. [Google Scholar] [CrossRef]
  25. Wang, C.Y.; Hu, Y.N.; Ding, H.N. Cutting Forces in Sawing Process of Reinforced Concrete. Mater. Sci. Forum 2004, 471–472, 292–297. [Google Scholar] [CrossRef]
  26. Yuan, H.; Wang, C.Y.; Hu, S.S.; Hu, Y.N.; Wang, Z.W.; Ding, H.N. Characteristics of Concrete Sawing Process with Diamond Tools. Chin. J. Mech. Eng. 2007, 18, 1604–1609. [Google Scholar]
  27. Yang, Z.L.; Hu, S.S.; Wang, Y.; Wang, C.Y.; Chen, B. Machining State and Surface Quality Analysis of Diamond Saw Blade Sawing Concrete Based on Wavelet Analysis. Tool Eng. 2018, 52, 45–51. [Google Scholar]
  28. Zheng, D.R.; Hu, S.S.; Wang, C.Y.; Hu, Y.N.; Chen, B.D.; Qin, C.H. Multi-scale analysis on dynamic characteristics of dry cutting plain concrete with diamond saw blades. Diam. Abras. Eng. 2015, 35, 40–45+51. [Google Scholar]
  29. Hu, S.S.; Yang, F.; Yang, Z.L.; Xiong, F.X.; Shi, W.W.; Tang, H.Q. Sawing Status Prediction of Diamond Sawblade Sawing Concrete Based on the Characteristics of Material Composition. In Proceedings of the ASME 2018 International Mechanical Engineering Congress and Exposition. Volume 13: Design, Reliability, Safety, and Risk, Pittsburgh, PA, USA, 9–15 November 2018; p. V013T05A069. [Google Scholar] [CrossRef]
  30. Li, M.Y.; Liu, S.; Tian, S.; Xiao, G.F. Image feature extraction and recognition of milling chatter of thin walled parts. J. Jilin Univ. (Eng. Technol. Ed.) 2022, 52, 425–432. [Google Scholar]
  31. Guo, L.; Yan, F.; Li, T.; Yang, T.; Lu, Y. An Automatic Method for Constructing Machining Process Knowledge Base from Knowledge Graph. Robot. Comput. Integr. Manuf. 2022, 73, 102222. [Google Scholar] [CrossRef]
  32. Wu, Y.; Du, R. Feature extraction and assessment using wavelet packets for monitoring of machining processes. Mech. Syst. Signal Process. 1996, 10, 29–53. [Google Scholar] [CrossRef]
  33. Segreto, T.; Simeone, A.; Teti, R. Principal Component Analysis for Feature Extraction and NN Pattern Recognition in Sensor Monitoring of Chip Form during Turning. CIRP J. Manuf. Sci. Technol. 2014, 7, 202–209. [Google Scholar] [CrossRef]
  34. Caggiano, A.; Angelone, R.; Napolitano, F.; Nele, L.; Teti, R. Dimensionality Reduction of Sensorial Features by Principal Component Analysis for ANN Machine Learning in Tool Condition Monitoring of CFRP Drilling. Procedia CIRP 2018, 78, 307–312. [Google Scholar] [CrossRef]
  35. Liang, Y.; Hu, S.; Guo, W.; Tang, H. Abrasive Tool Wear Prediction Based on an Improved Hybrid Difference Grey Wolf Algorithm for Optimizing SVM. Measurement 2022, 187, 110247. [Google Scholar] [CrossRef]
  36. Wang, G.; Zhuang, Y.; Song, L.; He, Z.; Zhang, J.; Zhou, H. Mechanical Properties and Failure Mechanism of Fiber-Reinforced Concrete Materials: Effects of Fiber Type and Content. Constr. Build. Mater. 2025, 465, 140190. [Google Scholar] [CrossRef]
  37. Fadli, M.; Alhamli, B.; Aldosari, A.; Alajmi, N.; Alkhayat, Z.; Potams, A.; Salman, M. Q-State Versus FFT and WT for Stress Detection. In Recent Trends and Advances in Artificial Intelligence; Garcia, F.P., Jamil, A., Hameed, A.A., Ortis, A., Ramirez, I.S., Eds.; ICAETA: Catania, Italy; Springer: Cham, Switzerland, 2024; Volume 1138. [Google Scholar] [CrossRef]
  38. Lever, J.; Krzywinski, M.; Altman, N. Principal component analysis. Nat. Methods 2017, 14, 641–642. [Google Scholar] [CrossRef]
  39. Kariri, E.; Louati, H.; Louati, A.; Masmoudi, F. Exploring the Advancements and Future Research Directions of Artificial Neural Networks: A Text Mining Approach. Appl. Sci. 2023, 13, 3186. [Google Scholar] [CrossRef]
  40. Xu, J.; Du, J.; Yuan, C. An alternative 2D ICEEMDAN-based denoising method and its application in processing magnetic anomaly data. Geod. Geodyn. 2024, 15, 465–476. [Google Scholar] [CrossRef]
  41. Colominas, M.A.; Schlotthauer, G.; Torres, M.E. Improved complete ensemble EMD: A suitable tool for biomedical signal processing. Biomed. Signal Process. Control. 2014, 14, 19–29. [Google Scholar] [CrossRef]
  42. Bai, Z.; Wei, J.; Chen, K.; Wang, K. ICEEMDAN and improved wavelet threshold for vibration signal joint denoising in OPAX. J. Mech. Sci. Technol. 2024, 38, 5841–5851. [Google Scholar] [CrossRef]
  43. Zhao, Y.; Shan, R.L.; Wang, H.L. Research on Vibration Effect of Tunnel Blasting Based on an Improved Hilbert–Huang Transform. Environ. Earth Sci. 2021, 80, 206. [Google Scholar] [CrossRef]
  44. Yang, C.; Wang, A.L.; Wang, J.H.; Cai, J. Hilbert-Huang Transfer Time-frequency Energy Analysis on Ultrasonic Signal of Detecting Lotus Root Based on ICEEMDAN. Chin. J. Mech. Eng. 2021, 10, 52–54+59. [Google Scholar]
  45. Cai, G.P.; Zhao, X.T.; Hu, X.N.; Huang, X.H.; Chen, H.M. Denoising Method of Vibration Signal of Ball Mill based on CEEMDAN-wavelet Threshold Combination. Mech. Sci. Technol. Aerosp. Eng. 2020, 39, 1077–1085. [Google Scholar]
  46. Zhang, J.; Li, S.; Liu, X.; Chen, H.; Zhou, Q. A WOA-ICEEMDAN joint wavelet threshold function based denoising method for ultrasound signals. Nondestruct. Test. Eval. 2025, 1–36. [Google Scholar] [CrossRef]
  47. Keppel, G.; Wickens, T.D. Design and Analysis: A Researcher’s Handbook. In Upper Saddle River, 4th ed.; Pearson: New York, NY, USA, 2004. [Google Scholar]
Figure 1. Experimental cutting platform.
Buildings 15 01272 g001
Figure 2. Cutting process of UHMWPE-FRC and raw cutting force data.
Buildings 15 01272 g002
Figure 3. Feature extraction method for UHMWPE-FRC cutting process based on feature classification and improved HHT.
Buildings 15 01272 g003
Figure 4. Improved HHT considering ICEEMDAN and wavelet threshold de-noising.
Buildings 15 01272 g004
Figure 5. Raw cutting force data and IMF components (Vc = 18 m/s, Vf = 300 mm/min, aq = 5 mm).
Buildings 15 01272 g005
Figure 6. τi and Si of each IMF component relative to raw data.
Buildings 15 01272 g006
Figure 7. Cutting force after ICEEMDAN combined with wavelet threshold de-noising.
Buildings 15 01272 g007
Figure 8. Hilbert spectrum of the cutting force after improved HHT.
Buildings 15 01272 g008
Figure 9. Marginal spectrum of the cutting force after improved HHT.
Buildings 15 01272 g009
Figure 10. Instantaneous energy spectrum of the cutting force after improved HHT.
Buildings 15 01272 g010
Figure 11. Energy ratios of cutting force in different frequency bands under multi-variables.
Buildings 15 01272 g011aBuildings 15 01272 g011b
Table 1. Mechanical properties of different types of concrete.
Concrete TypesCompressive
/MPa
Tensile
/MPa
Flexural
/MPa
Elastic Modulus
/GPa
Impact Number of Times
Plain concrete (U-CTRL) ① [13]85.54.115.47//
Steel fiber-reinforced concrete (U-F2-1.5) ① [13]93.05.3213.33//
Steel fiber-reinforced concrete (U-F1-1.5) ① [13]92.75.3312.27//
Plain concrete ② [36]31.92//3.71/
Basalt fiber concrete ② [36]34.44//4.47/
Carbon fiber concrete ② [36]46.86//4.56/
Steel fiber concrete(0.2) ② [36]89.40//7.61/
Plain concrete ③ [15]22.093.01 (split tensile)5.04/15.7
UHMWPE fiber concrete (C-T15-L12) ③ [15]33.555.43 (split tensile)5.82/866.0
① Note: F1 and F2 are different steel fiber types with different lengths and diameters, volume ratio of steel fiber dosage was 1.5, and water–cement ratios were all 0.25; ② Note: Water–cement ratio was 0.18 and volume ratio of steel fiber dosage was 2%; ③ Note: Water–cement ratio was 0.60, length of UHMWPE fiber was 12 mm, weight ratio of UHMWPE fiber dosage was 1.5%, and impact energy was 50 J.
Table 2. Composition of UHMWPE-FRC.
ConcreteNo.Concrete StrengthW/C RatioPortland Cement (P42.5)River Sand
(0.25 mm)
Fine Aggregate
(≤10 mm)
Fiber Volume Fraction
Non-aggregate and non-fiber concrete (A)A1C2525%25%50%00
A2C4022%
A3C5520%
Aggregate-free UHMWPE-FRC (B)B1C2525%50%50%01%
B2C4022%
B3C5520%
Aggregate-Containing UHMWPE-FRC (C)C1C2525%25%25%501%
C2C4022%
C3C5520%
Table 3. Experimental conditions for cutting UHMWPE-FRC.
CategoryConditions
ConcreteA1, A2, A3, B1, B2, B3, C1, C2, C3
Saw blade diameter (mm)∅160
Cutting speed Vc (m/s)8, 13, 18, 23, 28
Feed speed Vf (mm/min)100, 200, 300, 400, 500
Depth of cut ap (mm)1, 2, 3, 4, 5
Cutting methodDown cutting
Cooling methodDry cut
Table 4. Spearman correlation test for continuous variable features (ap, Vc, and Vf, and concrete strength).
Continuous Variable Featuresndi2ρ
ap520.9
Vc534−0.7
Vf5140.3
Concrete strength301.0
Table 5. Results of Kruskal–Wallis and Dunn’s test for unordered categorical variable feature across all frequency bands.
Kruskal–Wallis TestPost Hoc Dunn’s Test
Frequency BandHPSignificance (α = 0.1)Pairwise ComparisonZPAdjusted PSignificance (α = 0.1)
0–250 Hz5.1150.077SignificantA vs. B 0.981 0.327 0.980
A vs. C−1.275 0.202 0.607
B vs. C −2.255 0.024 0.072 Significant
250–500 Hz2.1920.334Not significant(The result of the Kruskal–Wallis test was not significant, therefore a post hoc Dunn’s test was not required)
500–750 Hz1.0770.584Not significant(The result of the Kruskal–Wallis test was not significant, therefore a post hoc Dunn’s test was not required)
750–1000 Hz7.7310.021SignificantA vs. B −2.059 0.039 0.118
A vs. C0.588 0.556 1.000
B vs. C 2.648 0.008 0.024 Significant
1000–1250 Hz4.8850.087SignificantA vs. B −1.961 0.050 0.150
A vs. C−0.098 0.922 1.000
B vs. C 1.863 0.062 0.187
1250–1500 Hz6.0000.050SignificantA vs. B 1.765 0.078 0.233
A vs. C−0.588 0.556 1.000
B vs. C −2.353 0.019 0.056 Significant
1500–1750 Hz7.6540.022SignificantA vs. B 2.746 0.006 0.018 Significant
A vs. C1.079 0.281 0.842
B vs. C −1.667 0.096 0.287
1750–2000 Hz8.7690.012SignificantA vs. B 2.942 0.003 0.010 Significant
A vs. C1.765 0.078 0.233
B vs. C −1.177 0.239 0.718
2000–2250 Hz8.3460.015SignificantA vs. B 2.844 0.004 0.013 Significant
A vs. C1.863 0.062 0.187
B vs. C −0.981 0.327 0.980
2250–2500 Hz4.8030.091SignificantA vs. B 2.165 0.030 0.091 Significant
A vs. C0.787 0.431 1.000
B vs. C −1.378 0.168 0.505
Disclaimer/Publisher’s Note: The statements, opinions and data contained in all publications are solely those of the individual author(s) and contributor(s) and not of MDPI and/or the editor(s). MDPI and/or the editor(s) disclaim responsibility for any injury to people or property resulting from any ideas, methods, instructions or products referred to in the content.

