Article

Multi-Scale Crack Detection and Quantification of Concrete Bridges Based on Aerial Photography and Improved Object Detection Network

1
School of Safety Engineering and Emergency Management, Shijiazhuang Tiedao University, Shijiazhuang 050043, China
2
Key Laboratory of Large Structural Health Monitoring and Control, Shijiazhuang Tiedao University, Shijiazhuang 050043, China
3
School of Transportation and Civil Engineering, Nantong University, Nantong 226019, China
4
Yanzhao Modern Transportation Laboratory, Shijiazhuang 050043, China
5
School of Civil Engineering, Shijiazhuang Tiedao University, Shijiazhuang 050043, China
6
Heibei Transportation Investment Group Company Limited, Shijiazhuang 050000, China
7
China Railway Design Group Co., Ltd., Tianjin 300308, China
8
College of Architecture Science and Engineering, Yangzhou University, Yangzhou 225127, China
*
Author to whom correspondence should be addressed.
Buildings 2025, 15(7), 1117; https://doi.org/10.3390/buildings15071117
Submission received: 4 March 2025 / Revised: 24 March 2025 / Accepted: 27 March 2025 / Published: 29 March 2025

Abstract

Regular crack detection is essential for extending the service life of bridges. However, the image data collected during bridge crack inspections are complex to convert into physical information and construct intuitive and comprehensive Three-Dimensional (3D) models incorporating crack information. An intelligent crack detection method for bridge surface damage based on Unmanned Aerial Vehicles (UAVs) is proposed for these challenges, incorporating a three-stage detection, quantification, and visualization process. This method enables automatic crack detection, quantification, and localization in a 3D model, generating a bridge model that includes crack details and distribution. The key contributions of this method are as follows: (1) The DCN-BiFPN-EMA-YOLO (DBE-YOLO) crack detection network is introduced, which improves the model’s ability to extract crack features from complex backgrounds and enhances its multi-scale detection capability for accurate detection; (2) a more comprehensive crack quantification method is proposed, integrating the crack automation detection system for accurate crack quantification and efficient processing; (3) crack information is mapped onto the 3D model by computing the camera pose for each image in the 3D model for intuitive crack visualization. Experimental results from tests on a concrete beam and an urban bridge demonstrate that the proposed method accurately identifies and quantifies crack images captured by UAVs. The DBE-YOLO network achieves an accuracy of 96.79% and an F1 score of 88.51%, improving accuracy by 3.19% and the F1 score by 3.8% compared to the original model. The quantification accuracy is within 10% of the error margin of traditional manual inspection. A 3D bridge model was also constructed and integrated with crack information.

1. Introduction

Bridge structures are vital components of transportation infrastructure. However, over time, their performance deteriorates due to the combined effects of traffic loads and environmental erosion, posing significant risks to structural safety [1,2,3,4]. As a result, there is an increasing demand for enhanced bridge inspection methods worldwide. Cracks are key indicators of structural deterioration, leading to water infiltration, spalling, and corrosion [5]. Regular crack detection is essential for extending the service life of bridges and maintaining their structural health. However, traditional manual inspections are subjective and inefficient, lack sufficient digitization and integration, and provide results that are not intuitive [6]. These limitations underscore the need for advanced and efficient automated inspection technologies [7].
With the advancement of computer vision, image-based crack detection methods have become widely adopted due to their efficiency and high accuracy [8,9,10]. These methods focus on object detection algorithms based on convolutional neural networks (CNNs) and deep learning, which provide fast computation and the ability to extract crack features for detection and segmentation [11]. Two-stage algorithms, such as Faster Region-based Convolutional Neural Network (R-CNN) and Mask R-CNN [12,13], rely on generating bounding boxes that may contain objects, followed by feature extraction and classification via CNNs. In contrast, one-stage algorithms like You Only Look Once (YOLO) simultaneously perform object classification and localization through a single forward pass of the CNN [14]. While two-stage methods generally offer higher accuracy, one-stage algorithms are more efficient and better suited for real-time detection due to a streamlined, end-to-end design. In recent years, YOLO-based algorithms have been widely applied to crack detection. Zhang et al. proposed an improved CR-YOLO algorithm for crack detection and localization from multi-object images and conducted crack detection tests on bridges [15]. Qiu et al. applied YOLO for real-time crack detection on tiled pedestrian roads, enabling timely road repairs [16]. Li et al. developed an intelligent pavement distress detection system based on an enhanced YOLO and Omni-Scale Network (OSNet), integrating it into a pavement inspection vehicle to improve road maintenance efficiency [17]. Although these algorithms can detect pixel-level cracks, the complex and diverse crack patterns and backgrounds on urban bridges present substantial challenges [18]. Existing crack detection algorithms may not be well-suited for extracting the blurred cracks typically found on urban bridges because (1) cracks and their backgrounds exhibit spatial and semantic imbalances, limiting the efficiency of multi-scale feature fusion and reducing the model’s ability to detect small targets and impairing overall detection accuracy [19]; (2) small or nascent cracks are sparse and often share colors similar to the background, complicating convolution operations with fixed receptive fields, thereby increasing the likelihood of both missed and false detections [20].
In recent years, UAVs have become key tools for improving the automation of bridge damage detection due to their high maneuverability, low cost, and efficient image acquisition capabilities [21,22]. Researchers have explored the integration of UAVs with Digital Image Processing (DIP) algorithms for crack detection and quantification. Jiang et al. proposed an automated crack measurement system using a wall-climbing UAV, which calculates the actual crack width by determining the distance between a fixed camera and the object’s surface [23]. Lei et al. developed a low-cost UAV-based crack detection method and tested concrete structures, demonstrating its potential applications in engineering inspections [24]. John O. Salaan et al. developed a UAV with a passive rotating spherical shell, validating its crack detection performance through simulations and bridge inspections [25]. Ding et al. enhanced the detection accuracy in engineering applications by establishing a full-field scale using DIP and moving least squares for UAV cameras [26]. Although these methods have significantly progressed in precise crack quantification and operational convenience, the scale information obtained is typically limited to a small Field of View (FOV) range. Additionally, most algorithms are semi-automated, and the integration of fragmented information lacks systematization, resulting in a heavy workload for internal operations. Furthermore, visualization solutions that integrate damage and structural information have not been widely adopted [27,28].
To overcome the limitations of FOV, researchers have developed full-field 3D models of the structures under inspection, providing an intuitive and comprehensive representation of structural information. Additionally, structural damage can be mapped onto 3D models, facilitating bridge inspection and establishing a digital archive for the entire structure lifecycle [29]. Compared to the high costs and large data sizes associated with laser scanning 3D point cloud modeling, the image-based Structure from Motion (SfM) 3D modeling technique is favored for its cost-effectiveness and smaller data size [30,31]. By combining multi-view images and estimating depth through stereo vision, SfM generates 3D textures that enable effective damage detection [32,33]. For instance, Saleem et al. integrated CNN with a geotagging system to conduct 3D labeling of structural damage based on camera pose and image data, thereby generating a global damage map of the bridge [34]. Lin et al. proposed an automated robotic bridge inspection system that integrates functions such as automatic damage detection and 3D reconstruction, thus broadening the scope of applications for automated inspections [35]. To ensure Two-Dimensional (2D) image mapping onto the 3D model, Liu et al. proposed a crack width calculation method based on distortion correction, projecting the cracks onto a pier model [36]. Zhou et al. integrated a depth camera measurement system with UAVs to establish coordinate transformation relationships, generating a 3D model incorporating crack information [37]. In UAV-based SfM photogrammetry, positioning typically relies on onboard Real-Time Kinematic (RTK) and IMU systems. While this approach meets accuracy requirements in certain scenarios, positioning data can be easily interfered with in complex urban bridge environments, potentially resulting in a lack of a fixed solution. This leads to the accumulation of model accuracy errors and hinders the rapid establishment of global coordinate transformation relationships over large-scale areas [38,39]. Furthermore, research directly combining automatic quantification methods with detection models is limited, and there is a lack of a comprehensive, fast, and accurate solution for crack detection, quantification, and visualization [40].
In this paper, an improved YOLO-based crack detection network is proposed as part of an integrated solution for bridge crack detection, quantification, and visualization using UAVs and deep learning to achieve efficient bridge inspection and maintenance. By incorporating Deformable Convolutional Networks (DCN), Bidirectional Feature Pyramid Networks (BiFPN), and Efficient Multi-Scale Attention (EMA) modules, the DBE-YOLO network is developed to enhance multi-scale detection capabilities [41,42,43]. Furthermore, SfM is effectively integrated with Ground Control Points (GCPs), improving modeling efficiency and generating intuitive, verifiable, and omnidirectional 3D models. An improved crack quantification method is also proposed and integrated into the system. Crack information is mapped onto the bridge’s 3D model by combining camera pose with coordinate transformation, enabling a comprehensive perception of structural damage. The method was applied and tested for effectiveness on a concrete beam and an urban bridge.
The rest of this paper is organized as follows: Section 2 outlines the framework of the integrated intelligent system for crack detection, quantification, and visualization in bridge structures. Section 3 describes the methodology and processes. Section 4 evaluates the performance of DBE-YOLO, demonstrating the effectiveness and accuracy of the proposed method through testing on a concrete beam. Section 5 presents the application of the proposed method to a bridge, demonstrating its effectiveness in bridge inspection. Finally, conclusions and future work are provided in Section 6.

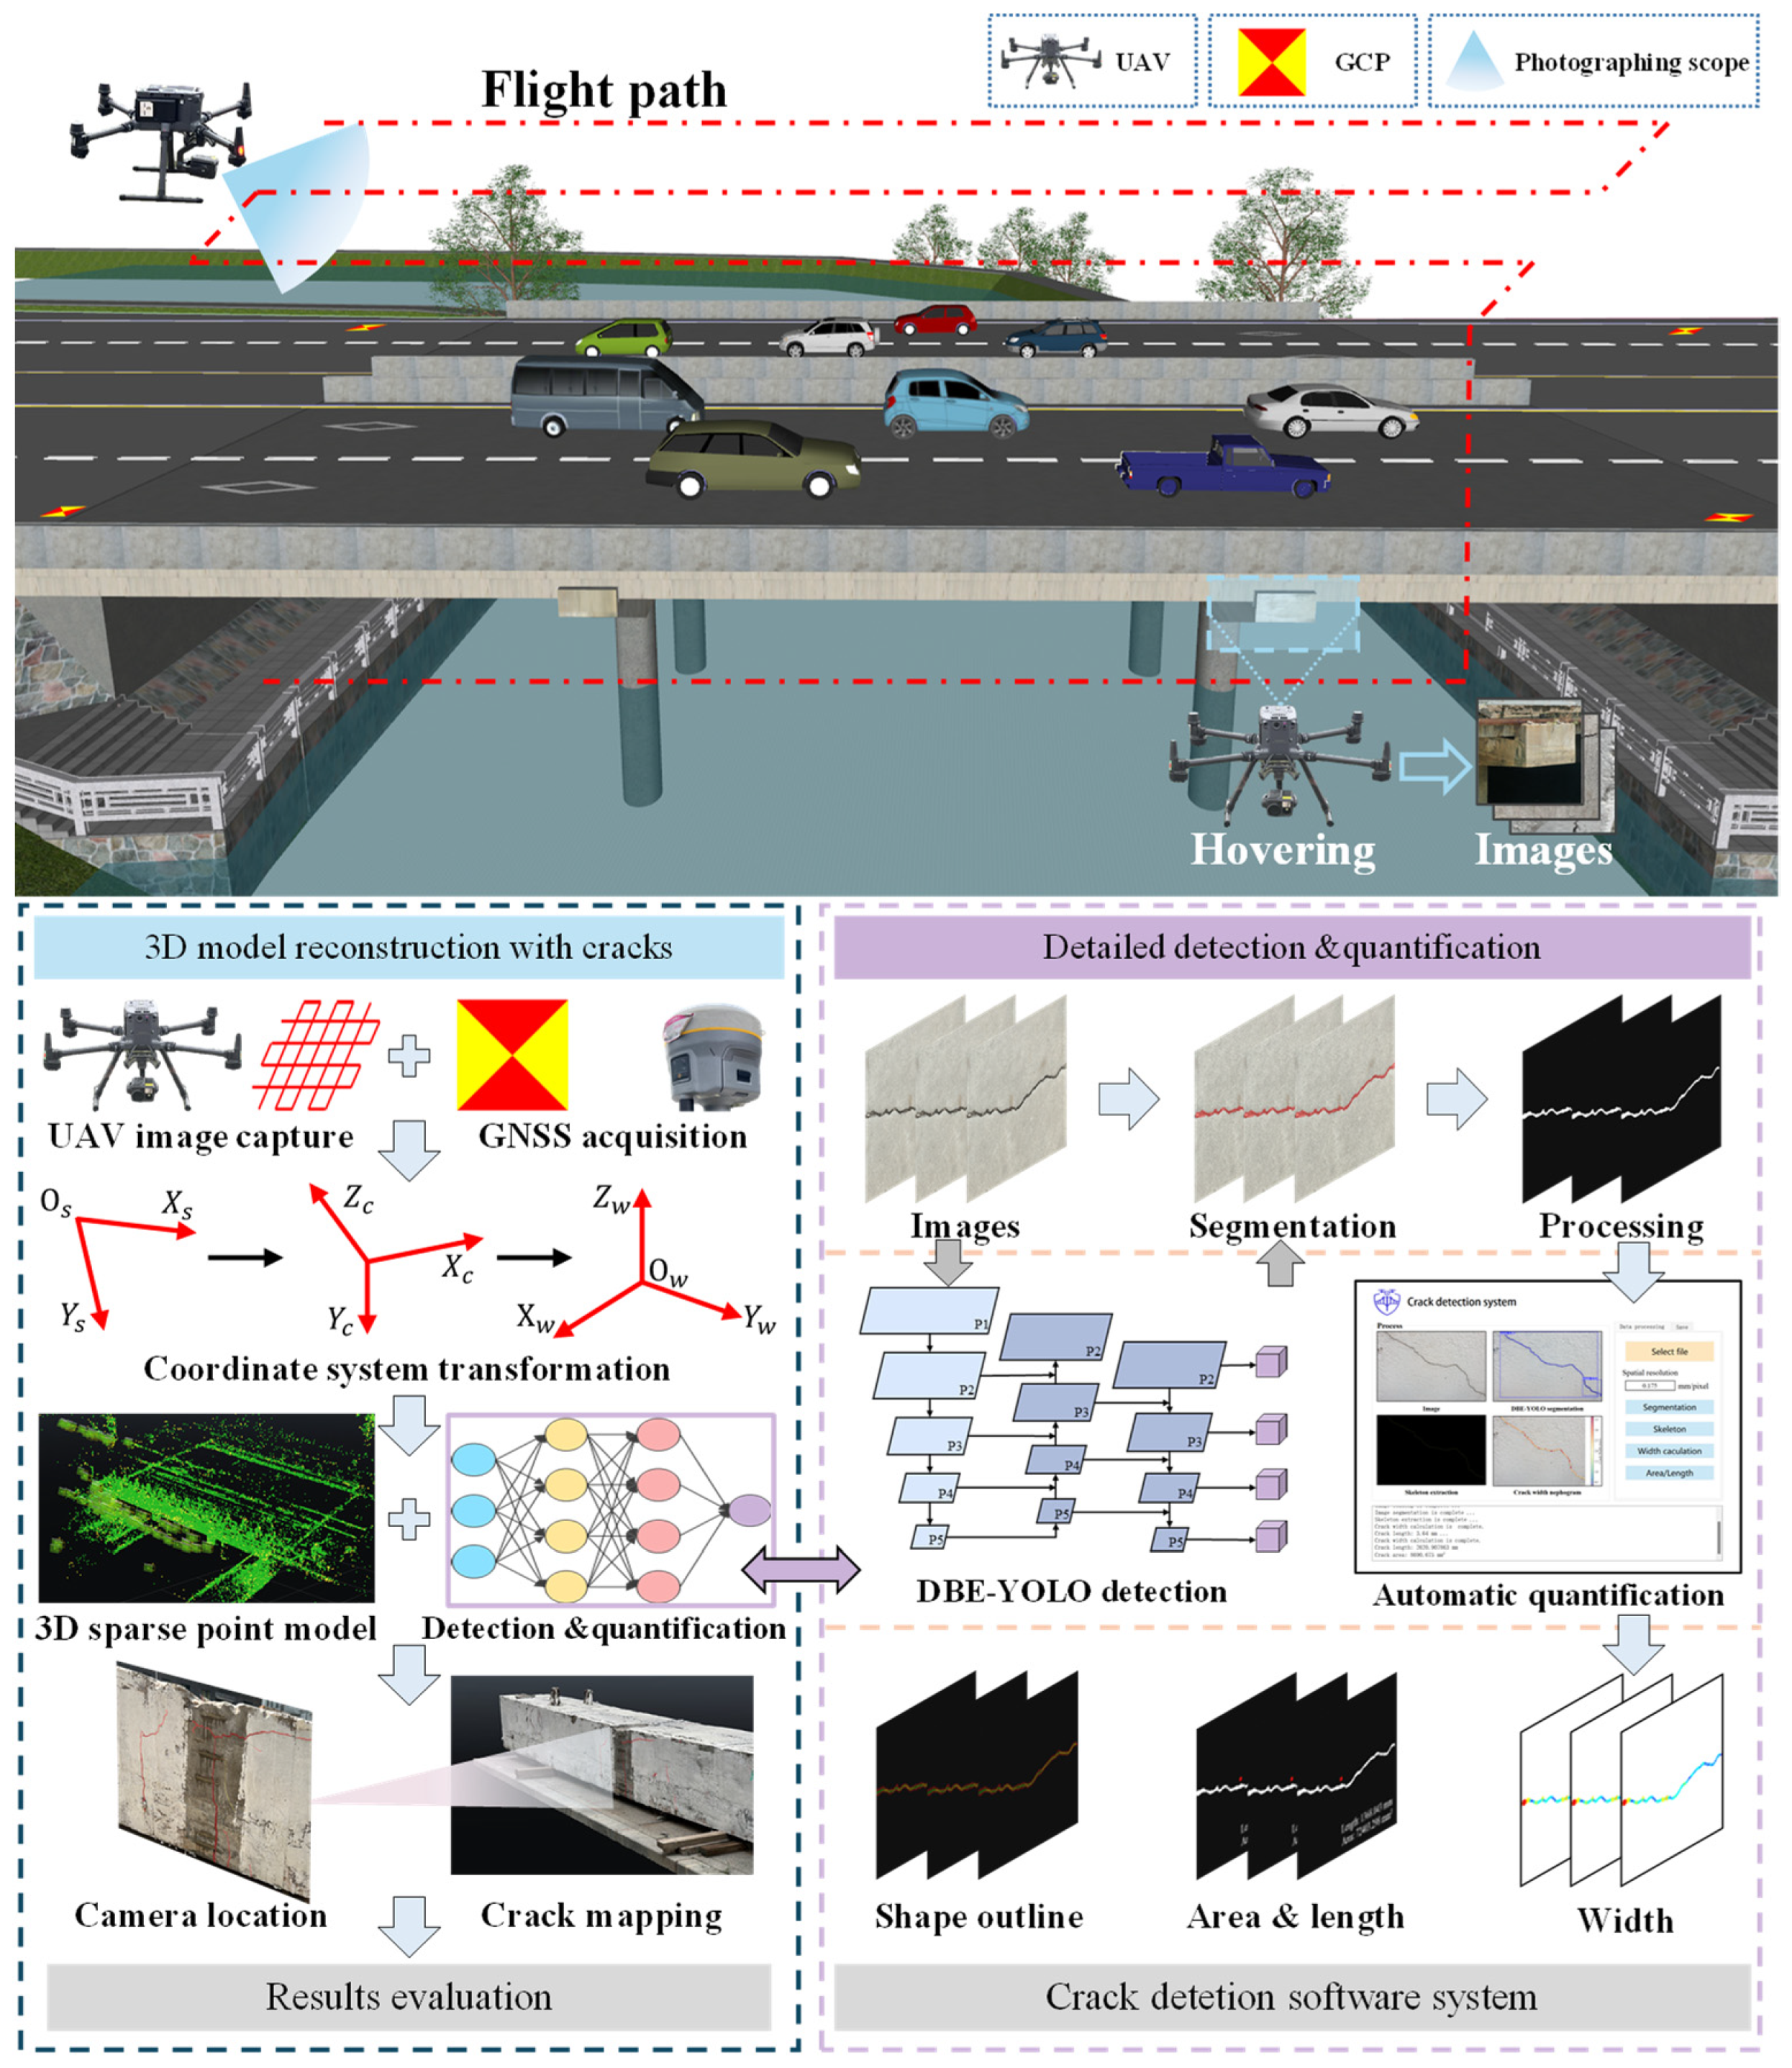
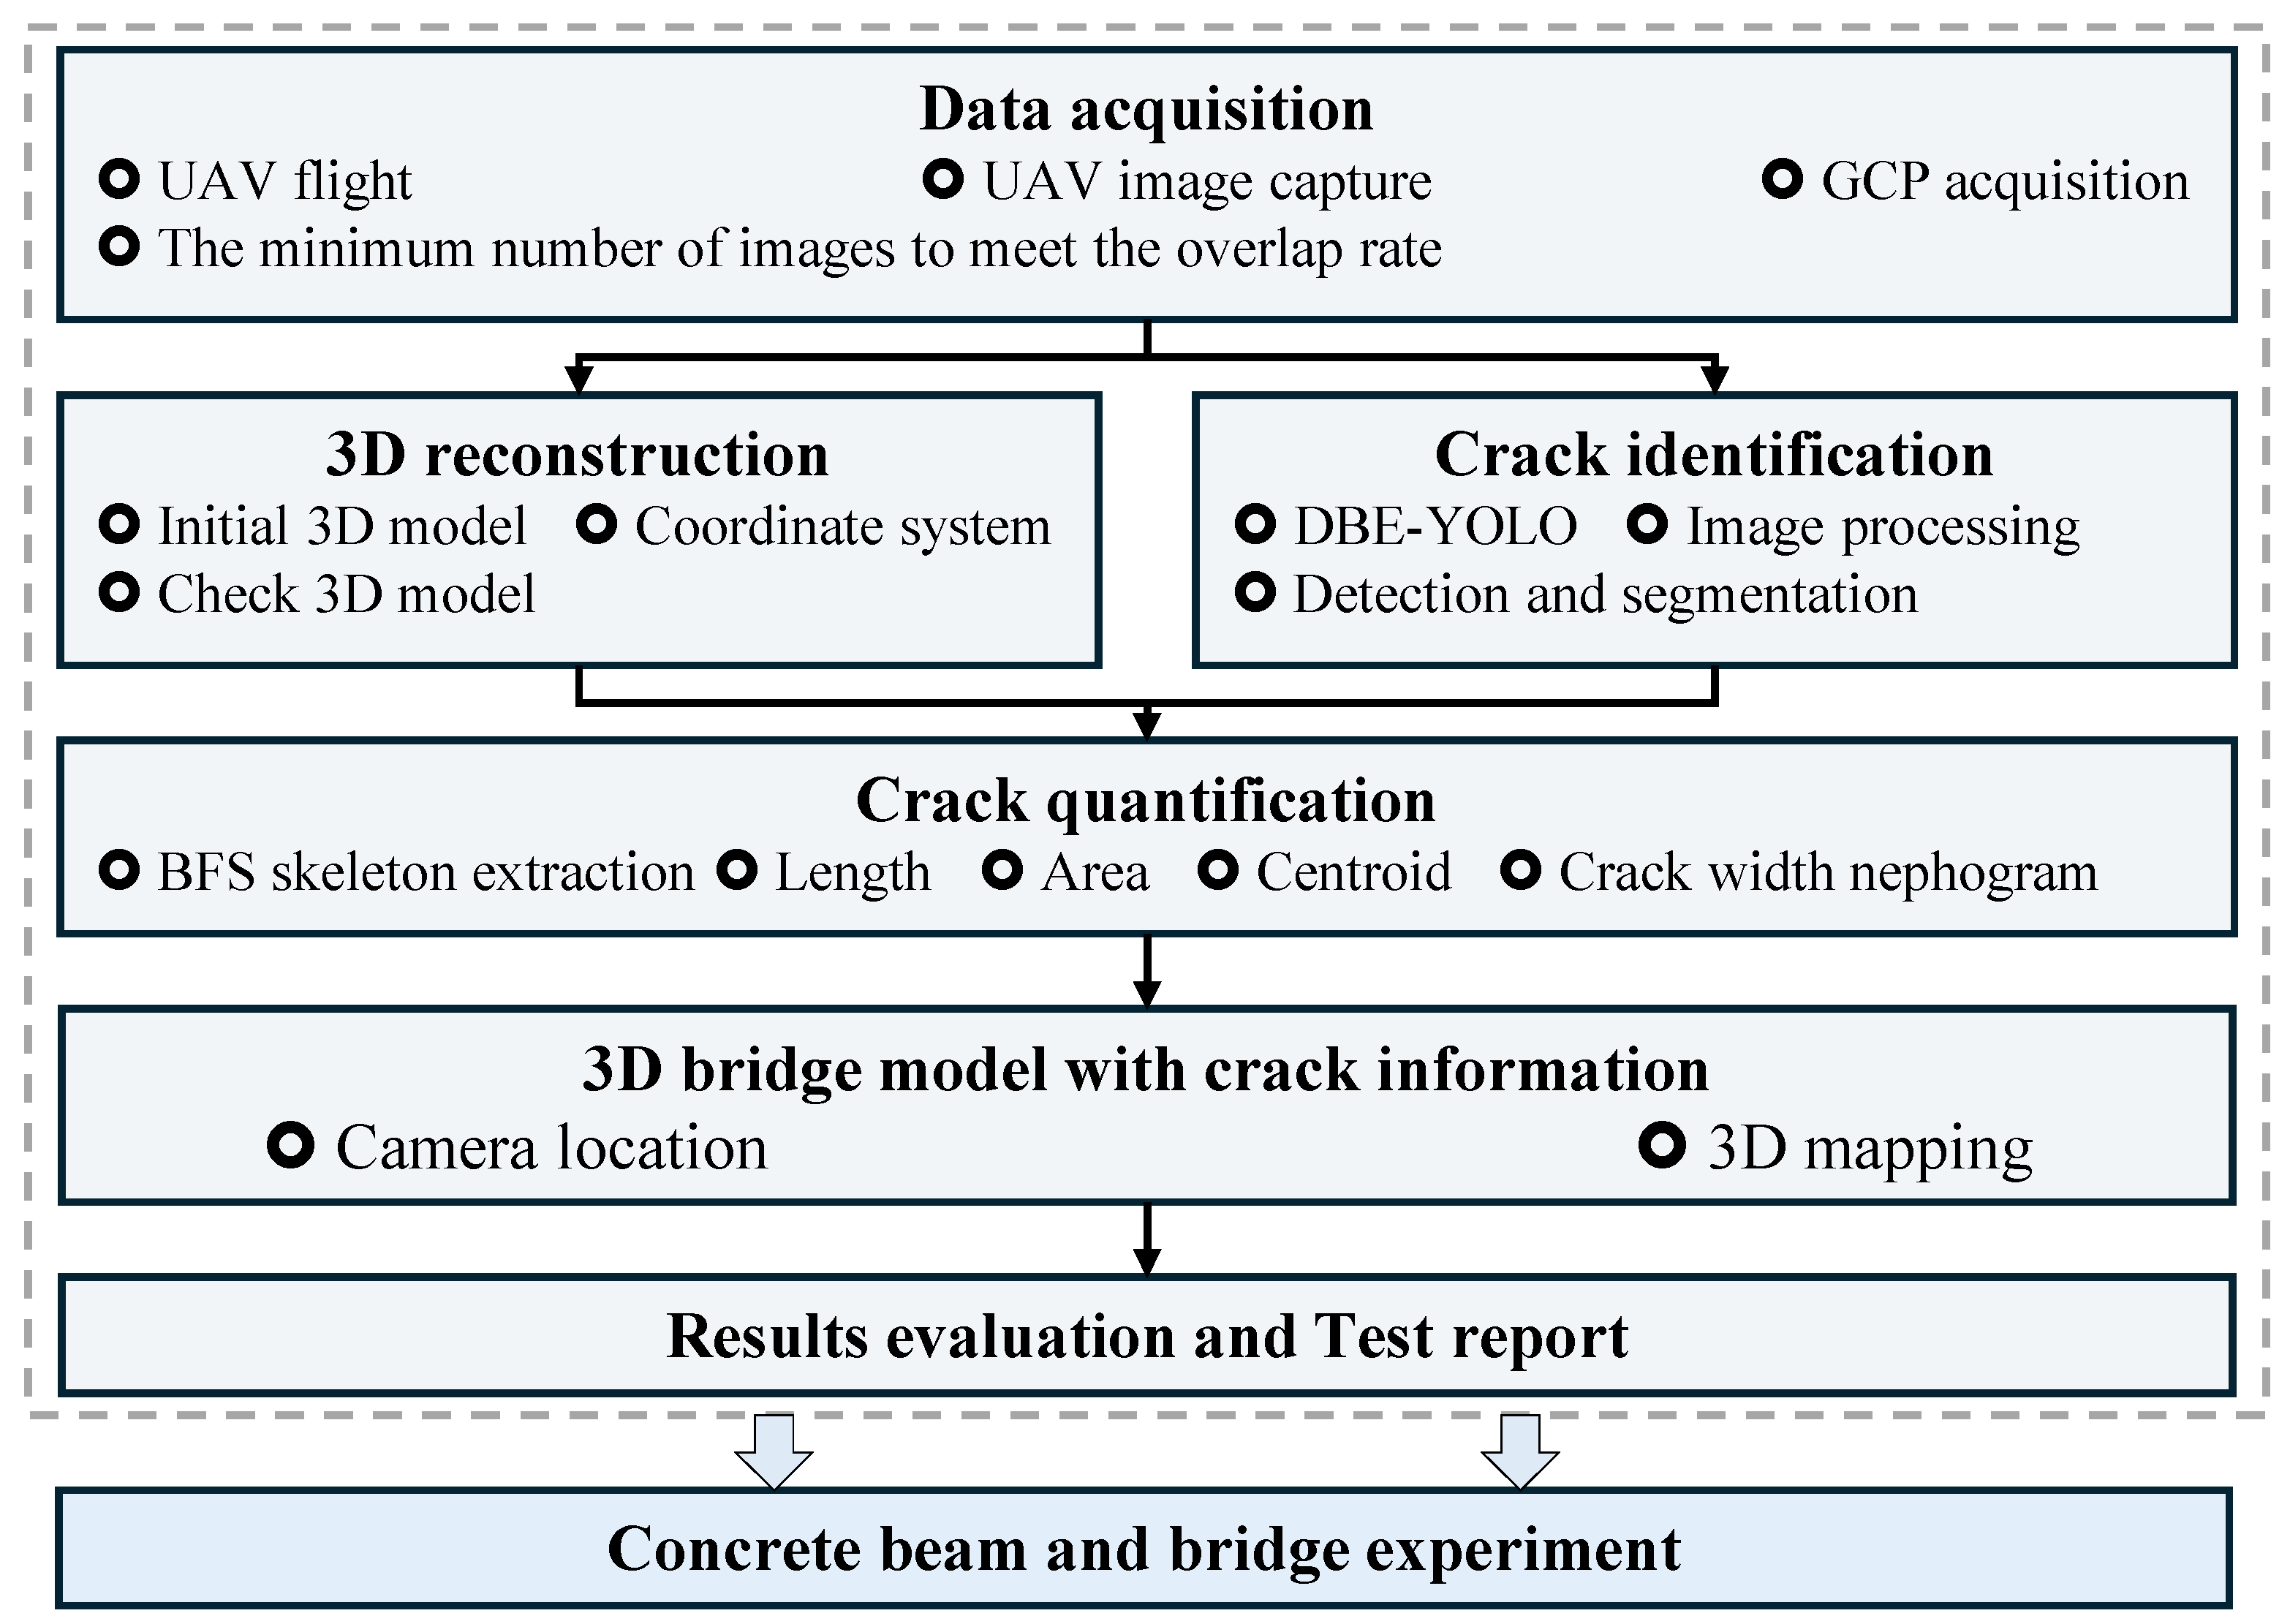
2. Framework of the Proposed Method

Figure 1 illustrates the proposed integrated UAV-based bridge crack detection, quantification, and visualization method. An effective detection system is designed, consisting of the following key steps: (1) developing a plan based on local flight regulations, site conditions, and bridge type, which includes UAV flight path planning and the arrangement of GCPs; (2) conducting on-site data acquisition and utilizing precise coordinate information from RTK and GCPs to recover the camera’s pose, thereby constructing an initial 3D sparse point cloud, along with global scale and coordinate transformation relationships; (3) employing an automatic crack detection system based on the DBE-YOLO network for detection, segmentation, and quantification, along with the extraction of key crack parameters; and (4) mapping the quantified crack parameters onto the 3D model to generate a visual representation of the bridge cracks, viewable from multiple angles, and evaluating the results according to relevant standards.

3. Methodology

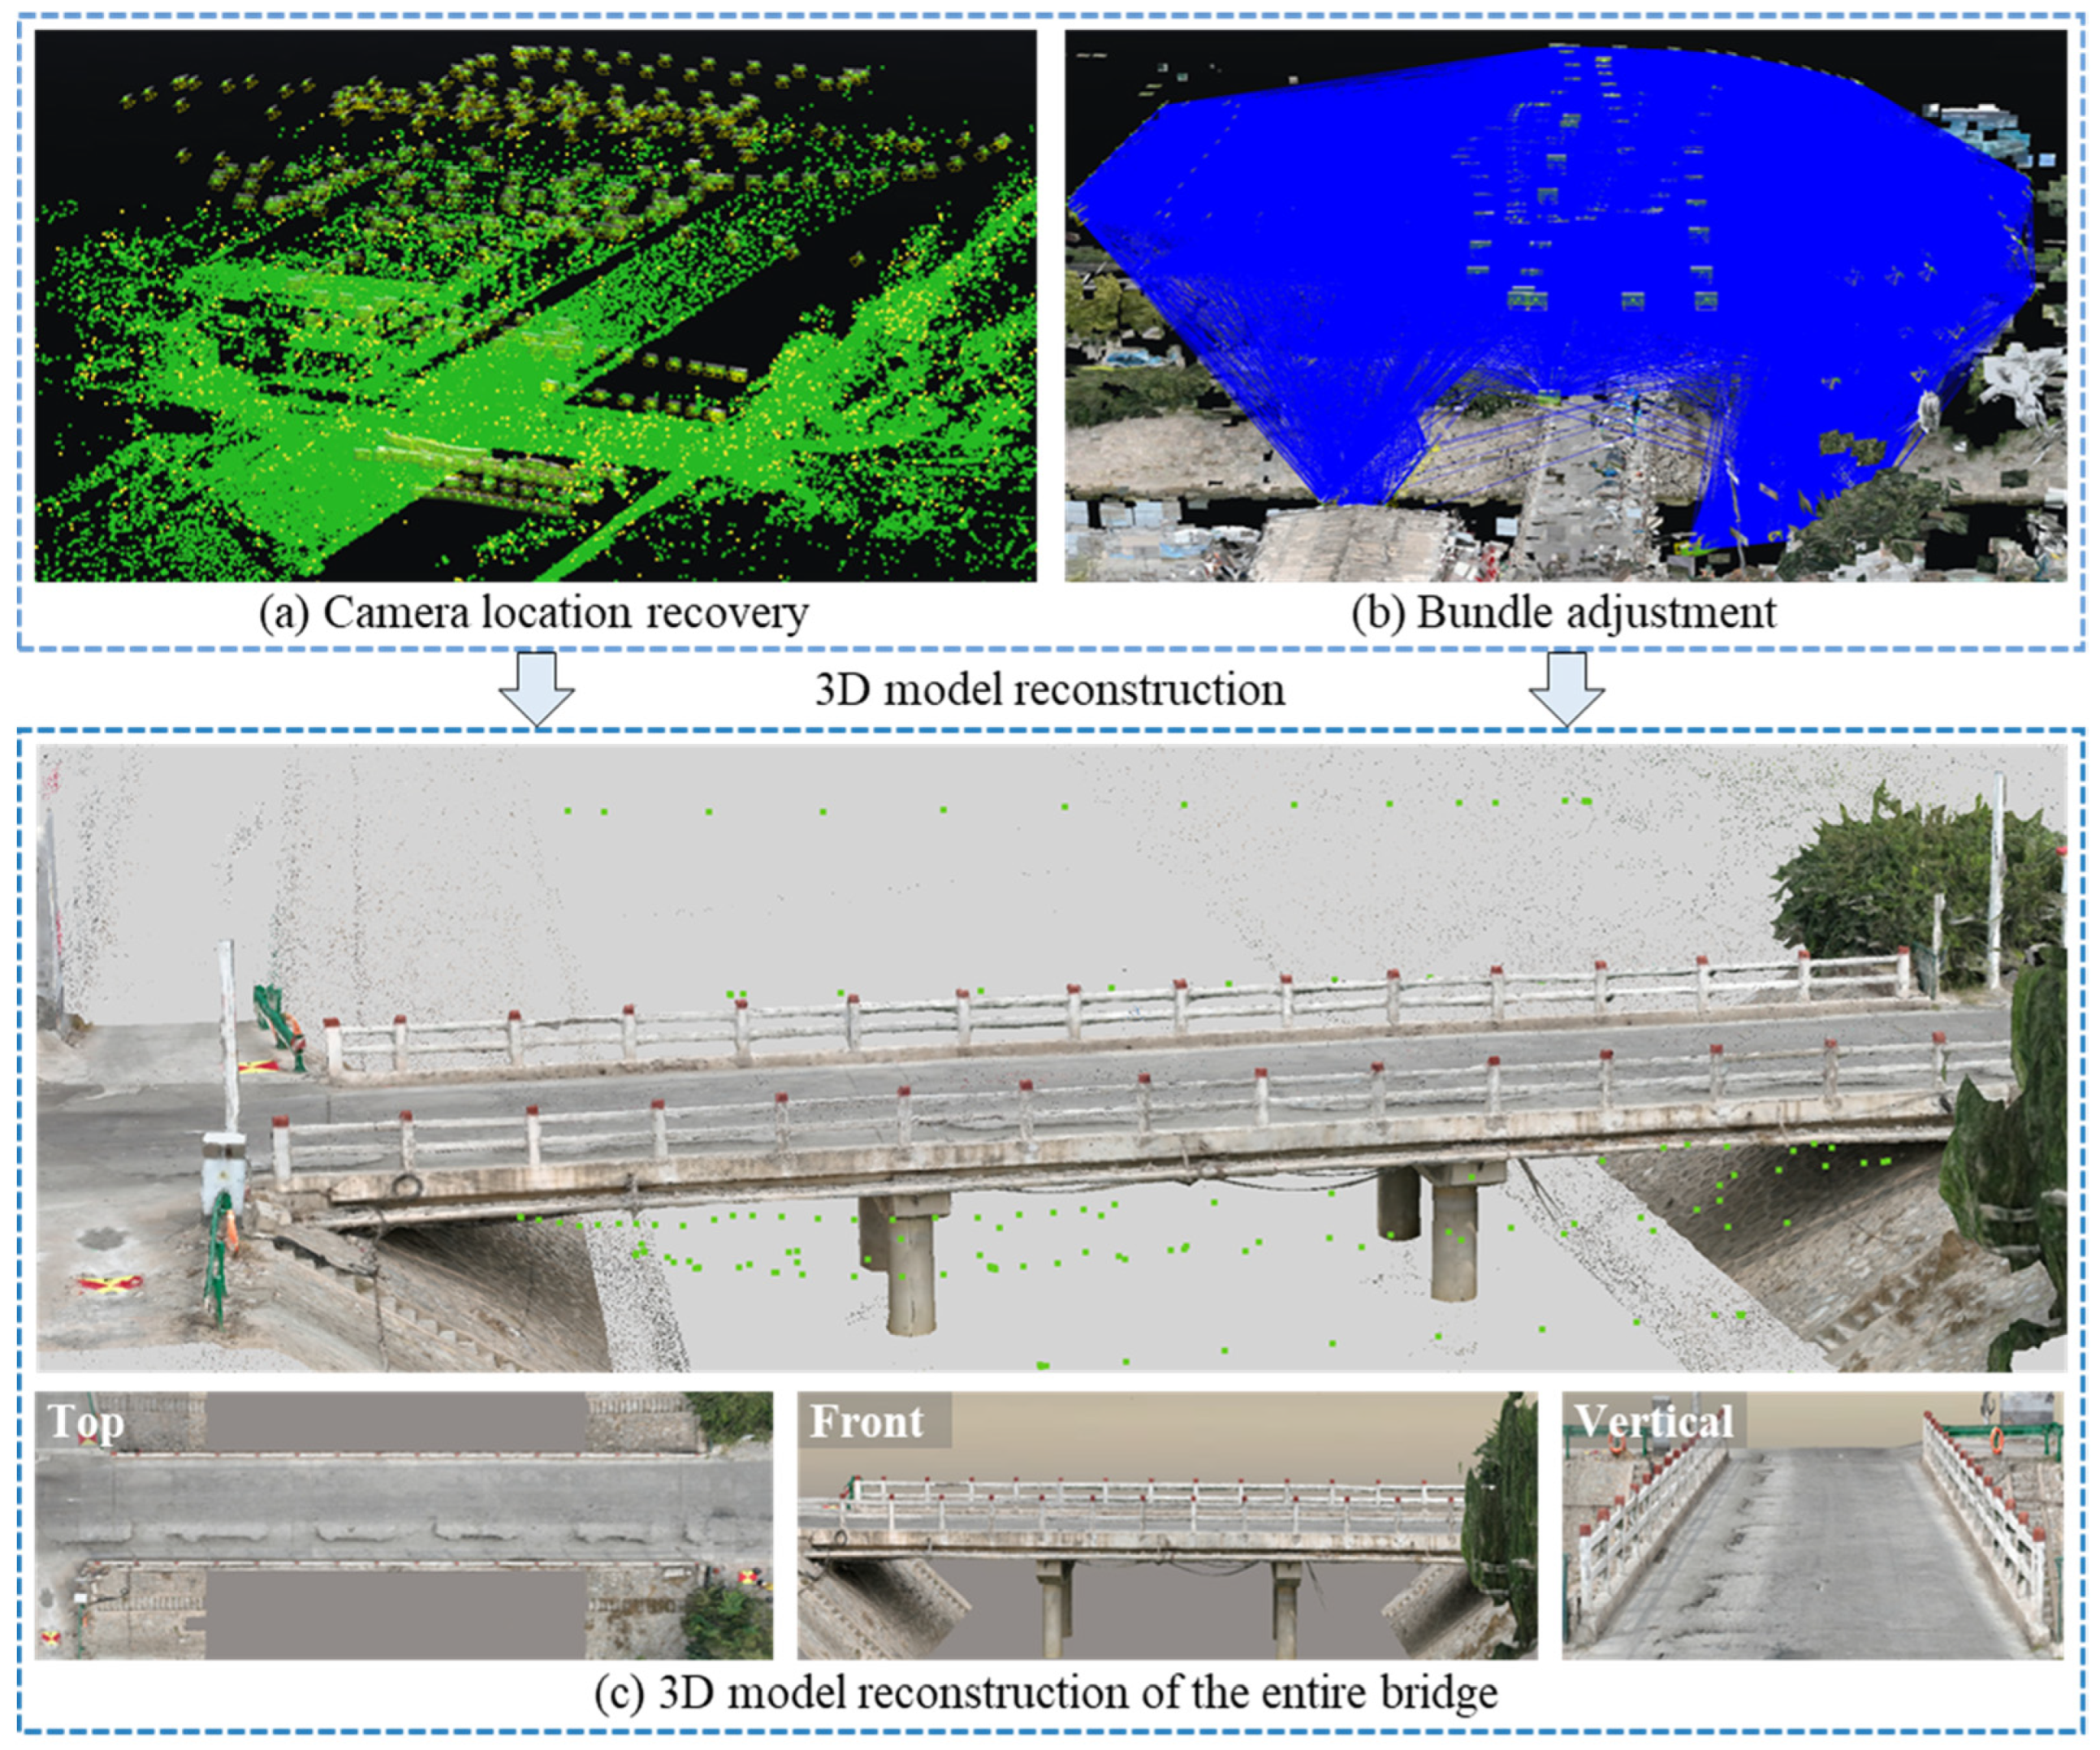
3.1. Three-Dimensional Model Based on SfM

3.1.1. Image Data Acquisition Using UAVs

With low cost and rapid deployment capabilities, UAVs are well-suited for the fast inspection of bridges. In UAV-based SfM modeling, image quality is a critical factor influencing the method’s effectiveness. Therefore, it is essential to conduct necessary functional checks on the UAV according to the specific inspection scenario to ensure it meets the constraints of the field environment.
A two-phase approach is applied to enhance the quality of the 3D model, beginning with capturing the overall scene and then focusing on detailed modeling. In the first phase, the UAV utilizes a five-view oblique photography method, ensuring an image overlap of at least 75%. A circular flight approach is employed for more complex structures to ensure complete coverage, with adjacent images having more than 80% overlap to avoid missing data and minimize significant parallax errors. Subsequently, camera poses are adjusted using feature point matching and photogrammetric triangulation techniques by combining the image Exchangeable Image File Format (Exif) data with IMU data. This process efficiently generates a sparse point cloud of the 3D scene, which supports the detailed modeling phase.
Due to insufficient image overlap and poor image quality, gaps or holes may occur in the initial model. To ensure the creation of a detailed and accurate 3D model, a refined flight path is planned to re-capture data in areas with defects. During this process, image quality is optimized by minimizing motion blur, with a shooting distance maintained at approximately 1–3 m from the target surface. Furthermore, adjacent images should have an overlap of over 80%.
It is important to note that lighting variations and noise interference can affect the modeling quality. Therefore, images need to undergo denoising and histogram equalization (Equations (1) and (2)) to effectively reduce the impact of these disturbances.
S k = j = 0 k P r ( r j ) = j = 0 k n j n
F ( g ) F ( g ) = min k F ( g ) F ( k )
where S k represents the cumulative distribution of image brightness, P r ( r j ) represents the probability associated with the event r j , n j is the number of pixels with brightness value r j , n is the total number of pixels, and F ( g ) and F ( g ) represent the original and processed lighting intensity distributions, respectively.

3.1.2. Image-Based 3D Reconstruction

SfM-based 3D reconstruction of bridges involves several key processes, including image alignment, camera parameter estimation, pose determination, dense point cloud generation, and texture mapping. As shown in Figure 2, the process begins with feature extraction and matching using the Scale Invariant Feature Transform (SIFT) algorithm, which establishes the geometric relationships between corresponding points across multiple images. Next, the camera pose is estimated by applying epipolar constraint theory to the matched feature points. Based on triangulation principles, any matched point a ( u s , v s ) in the pixel coordinate system is employed to calculate its corresponding point A ( x w , y w , z w ) in the 3D model, constructing a sparse point cloud. Finally, the dense reconstruction is carried out to generate a more refined 3D point cloud and triangular mesh model, which are subsequently textured to produce a highly realistic 3D representation. The theoretical details are as follows:
From the pixel coordinate o s u s v s to the image coordinate o i x i y i ,
α u s v s 1 = f x f s c x 0 f y c y 0 0 1 x i y i 1 = K x i y i 1
to the camera coordinates o c x c y c z c ,
α x i y i 1 = f 0 0 0 f 0 0 0 1 0 0 0 x c y c z c 1
and to the world coordinates o w x w y w z w ,
x c y c z c 1 = r 11 r 21 r 31 0 r 12 r 22 r 32 0 r 13 r 23 r 33 0 t x t y t z 1 x w y w z w 1 = R T 0 1 x w y w z w 1
where K is the camera intrinsic matrix, R is called the rotation matrix, T is the translation matrix, ( c x , c y ) denotes the image center, f is the camera focal length with f x and f y representing the ratios of the horizontal and vertical focal lengths to the unit pixel size, respectively, and α is the scaling factor.
Therefore, the point a ( u s , v s ) in the image can be mapped to the corresponding point A ( x w , y w , z w ) in the 3D model using the following equation:
α u s v s 1 = K R T 0 1 x w y w z w 1
Based on the epipolar constraint theory, the homogeneous coordinates X = ( x w , y w , z w , 1 ) T in the 3D model have projections x 1 and x 2 from two viewpoints, which satisfy the following equation:
x 2 T F x 1 = 0
where x represents the coordinates of X in the image, and F is the fundamental matrix, which can be derived from the essential matrix as F = K T E K 1 , with E = t × R .
To simplify the matching process, the epipolar line equation is calculated, and the fundamental matrix is estimated using the eight-point algorithm, which satisfies x 2 i F x 1 i = 0 , i = 1 , 2 , , 8 .
l 2 = F x 1 l 1 = F T x 2
Feature mismatches are common during the matching process due to the images’ unordered nature and numerous repetitive elements in the bridge. To address this, Bundle Adjustment (BA), combined with the Exif data, performs aerial triangulation and optimizes camera parameters and 3D point cloud positions by minimizing the reprojection error, thereby significantly reducing issues such as drift and incompleteness in the 3D reconstruction.
g ( X , R , T ) = i = 1 m j = 1 n ω i j p ( x i , R j , t j ) x i j 2
where ω i j represents the weight coefficient, p ( x i , R j , t j ) is the projection function, and x i j denotes the pixel of point j in image i .
However, the bridge’s 3D model has hierarchical features, which are often difficult to represent accurately using only Exif data. To address this issue, integrating GCPs into SfM significantly improves the accuracy and efficiency of 3D modeling. By placing GCPs at the edges of the structure under investigation, accurate coordinate transformation relationships can be established, optimizing the camera’s internal and external parameters and recovering high-precision camera poses, thereby supporting the mapping of crack information. Additionally, this method helps to avoid the repetitive re-modeling process typical of traditional approaches, thus improving the efficiency of internal operations. For example, Zhao et al. used UAV images and GCPs to establish a 3D model of a dam and analyzed the impact of GCPs on model accuracy [44,45]. The results showed that GCPs significantly improved both modeling efficiency and accuracy. Therefore, in this study, GCPs are strategically placed in the bridge deck area during the modeling process, with their world coordinates measured using high-precision instruments. By matching the world coordinates of these GCPs with their corresponding pixel coordinates in the images, more accurate camera parameter calibration and coordinate system transformation can be achieved.

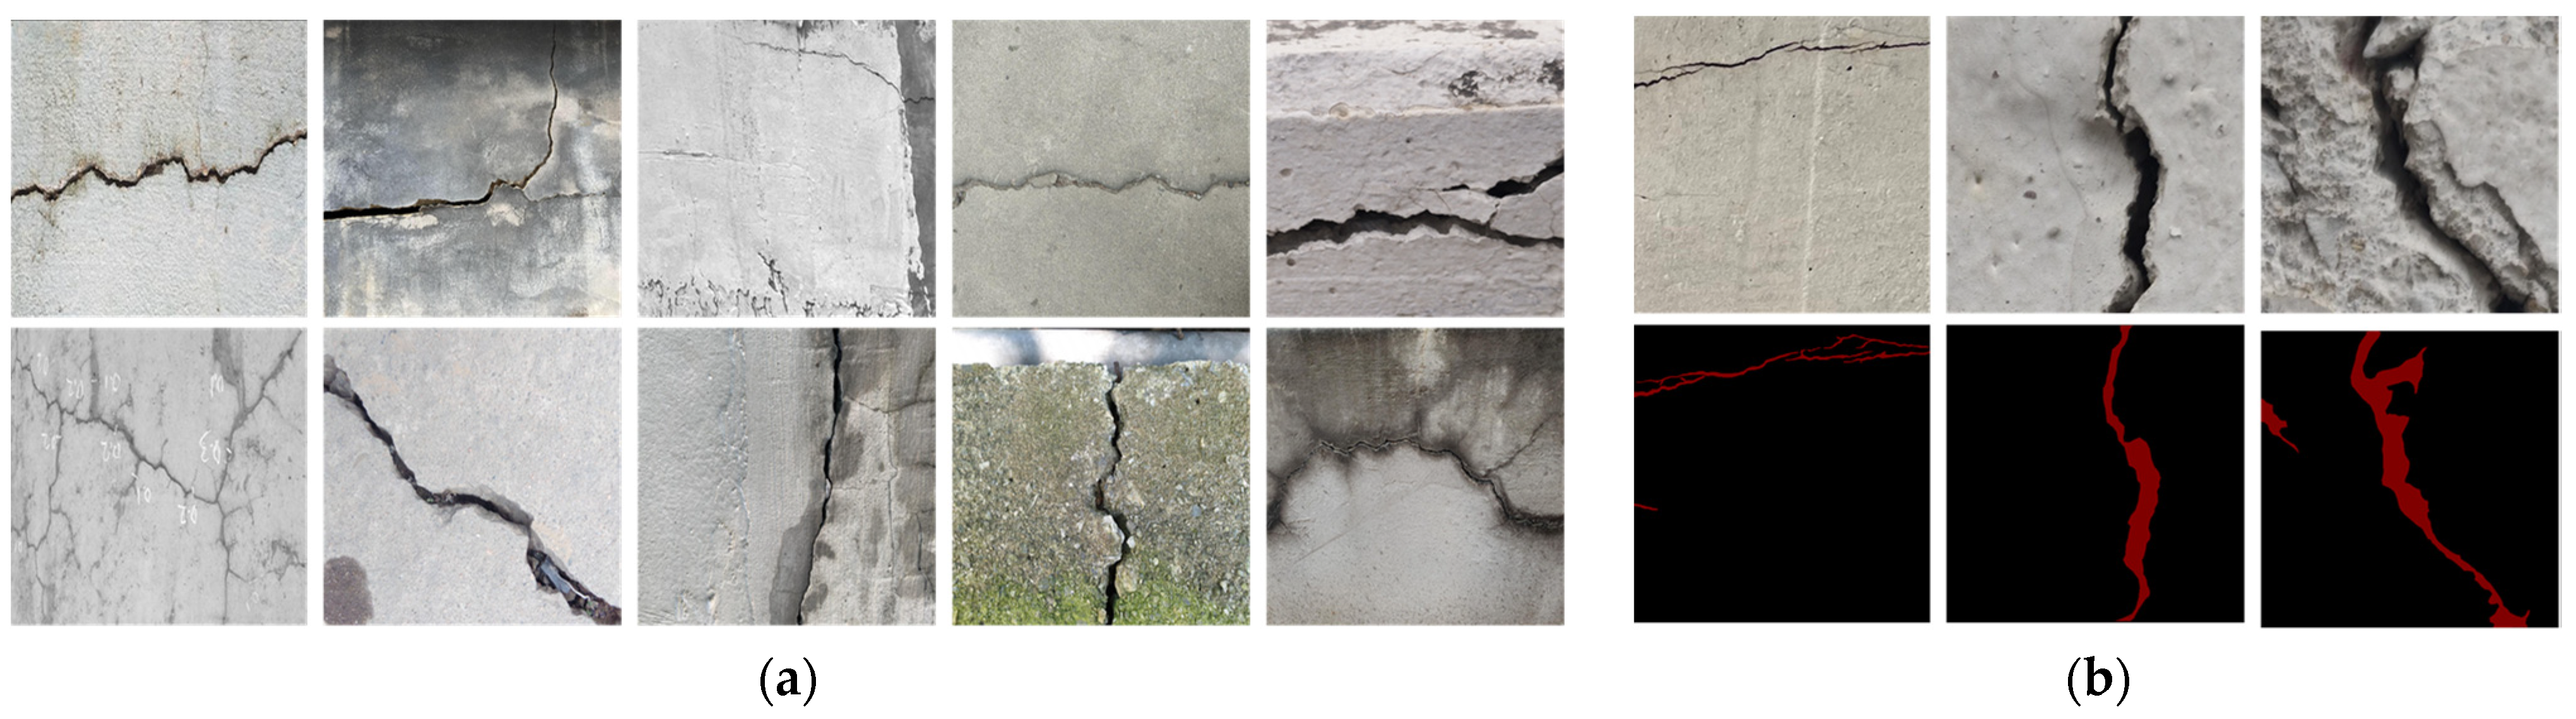
3.2. Improvement of Crack Detection and Segmentation Network

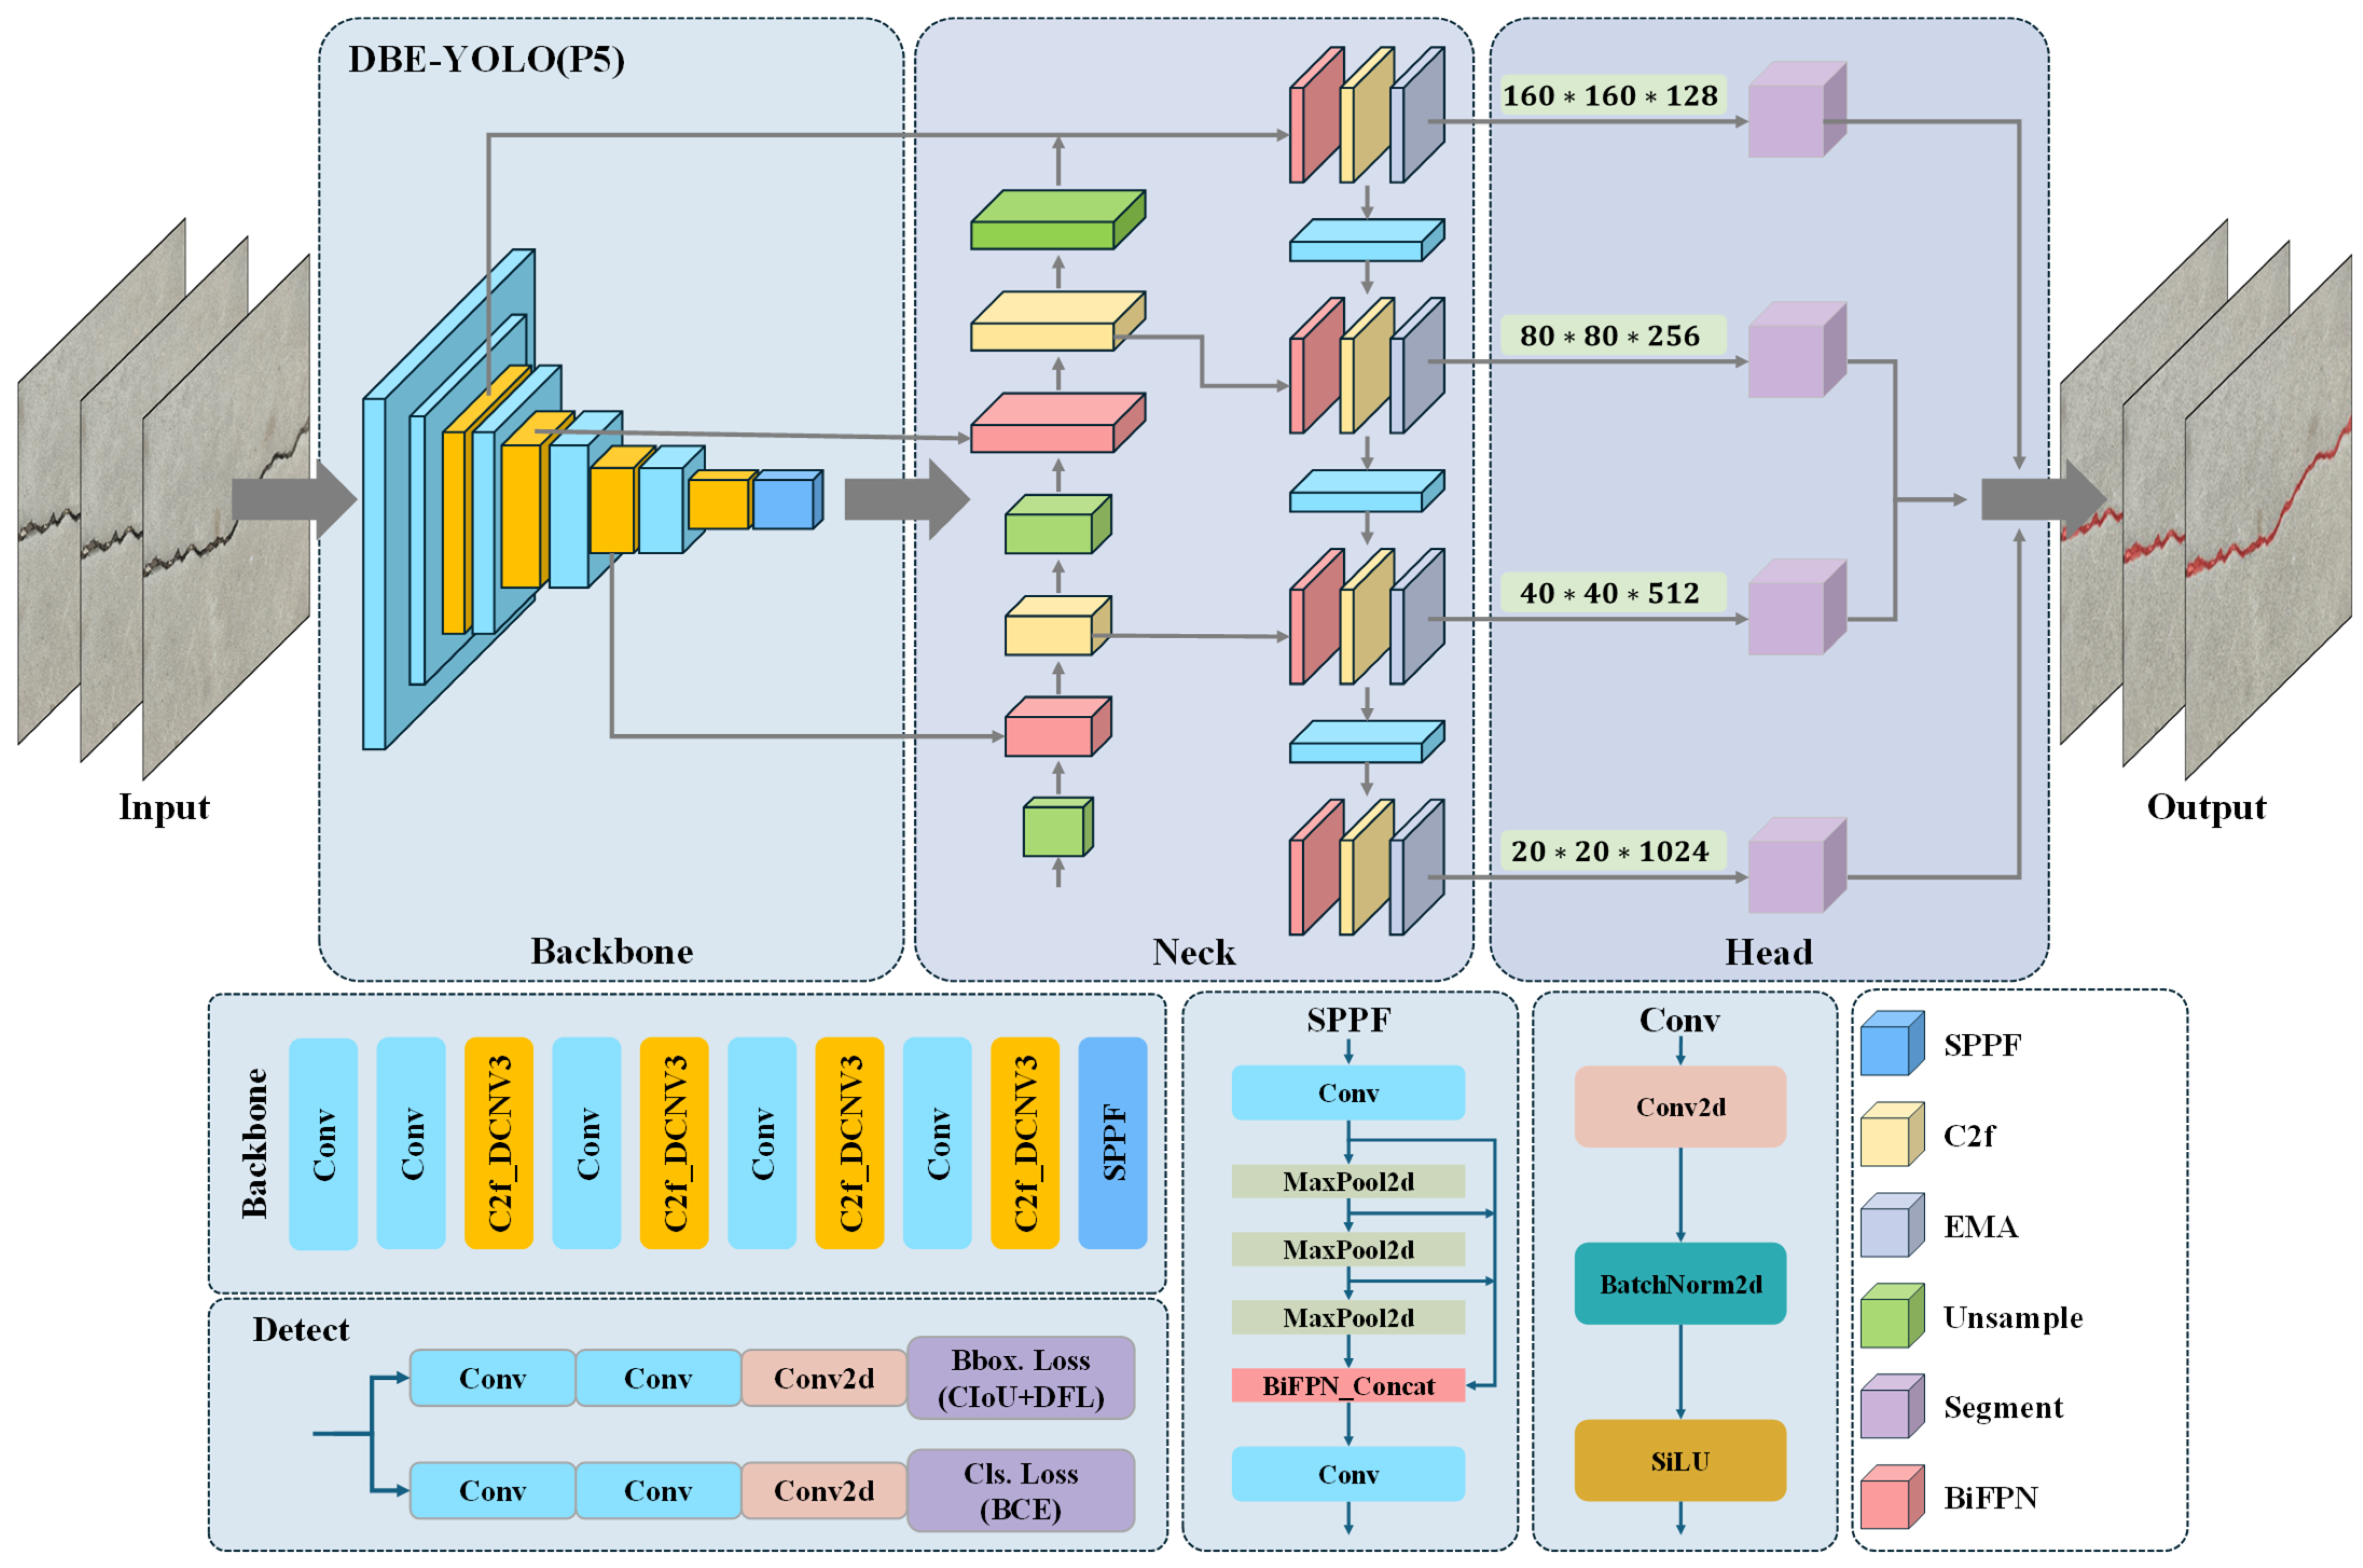
3.2.1. YOLOv8-Based Network

The YOLO series networks excel in object detection and segmentation tasks, offering advantages such as fast detection speed and high accuracy, which are crucial for engineering applications. YOLOv8 maintains detection efficiency and accuracy, making deployment on mobile platforms more convenient.
The crack detection network based on YOLOv8 consists of three main components: the backbone, neck, and head. The backbone, which is built on CSPDarknet53 as its core architecture and includes modules such as Convolution-BatchNorm-SiLU (CBS), CSP Bottleneck with 2 convolutions (C2f), and Spatial Pyramid Pooling Fast (SPPF), is responsible for feature extraction by aggregating different types of image information. Ultimately, the backbone outputs a feature map containing information about object locations, categories, and other relevant details.
Feature Pyramid Network (FPN) and Path Aggregation Network (PAN) are employed in the neck to enhance feature fusion across different scales. FPN conveys semantic information through a top–down pathway, while PAN transmits location information via a bottom–up pathway. The network effectively achieves multi-scale feature fusion through this combination, further enriching the feature information across various scales.
The head is responsible for predicting the output. It generates multi-scale feature maps that predict object categories and bounding boxes, which are filtered using Non-Maximum Suppression (NMS). The network is based on the improved You Only Look at CoefficienTs (YOLACT), which generates a linear combination of prototype masks and mask coefficients for segmentation. This approach is faster and more accurate, further enhancing the overall performance.
However, in bridge surface images captured by UAVs, cracks typically vary in scale and are set against complex backgrounds. As a result, the traditional YOLOv8 network may struggle to maintain high detection accuracy in high-resolution, large-scale scenes, leading to missed detections and false positives. Therefore, improving the original network to enhance segmentation accuracy is crucial for achieving effective UAV-based bridge crack detection.

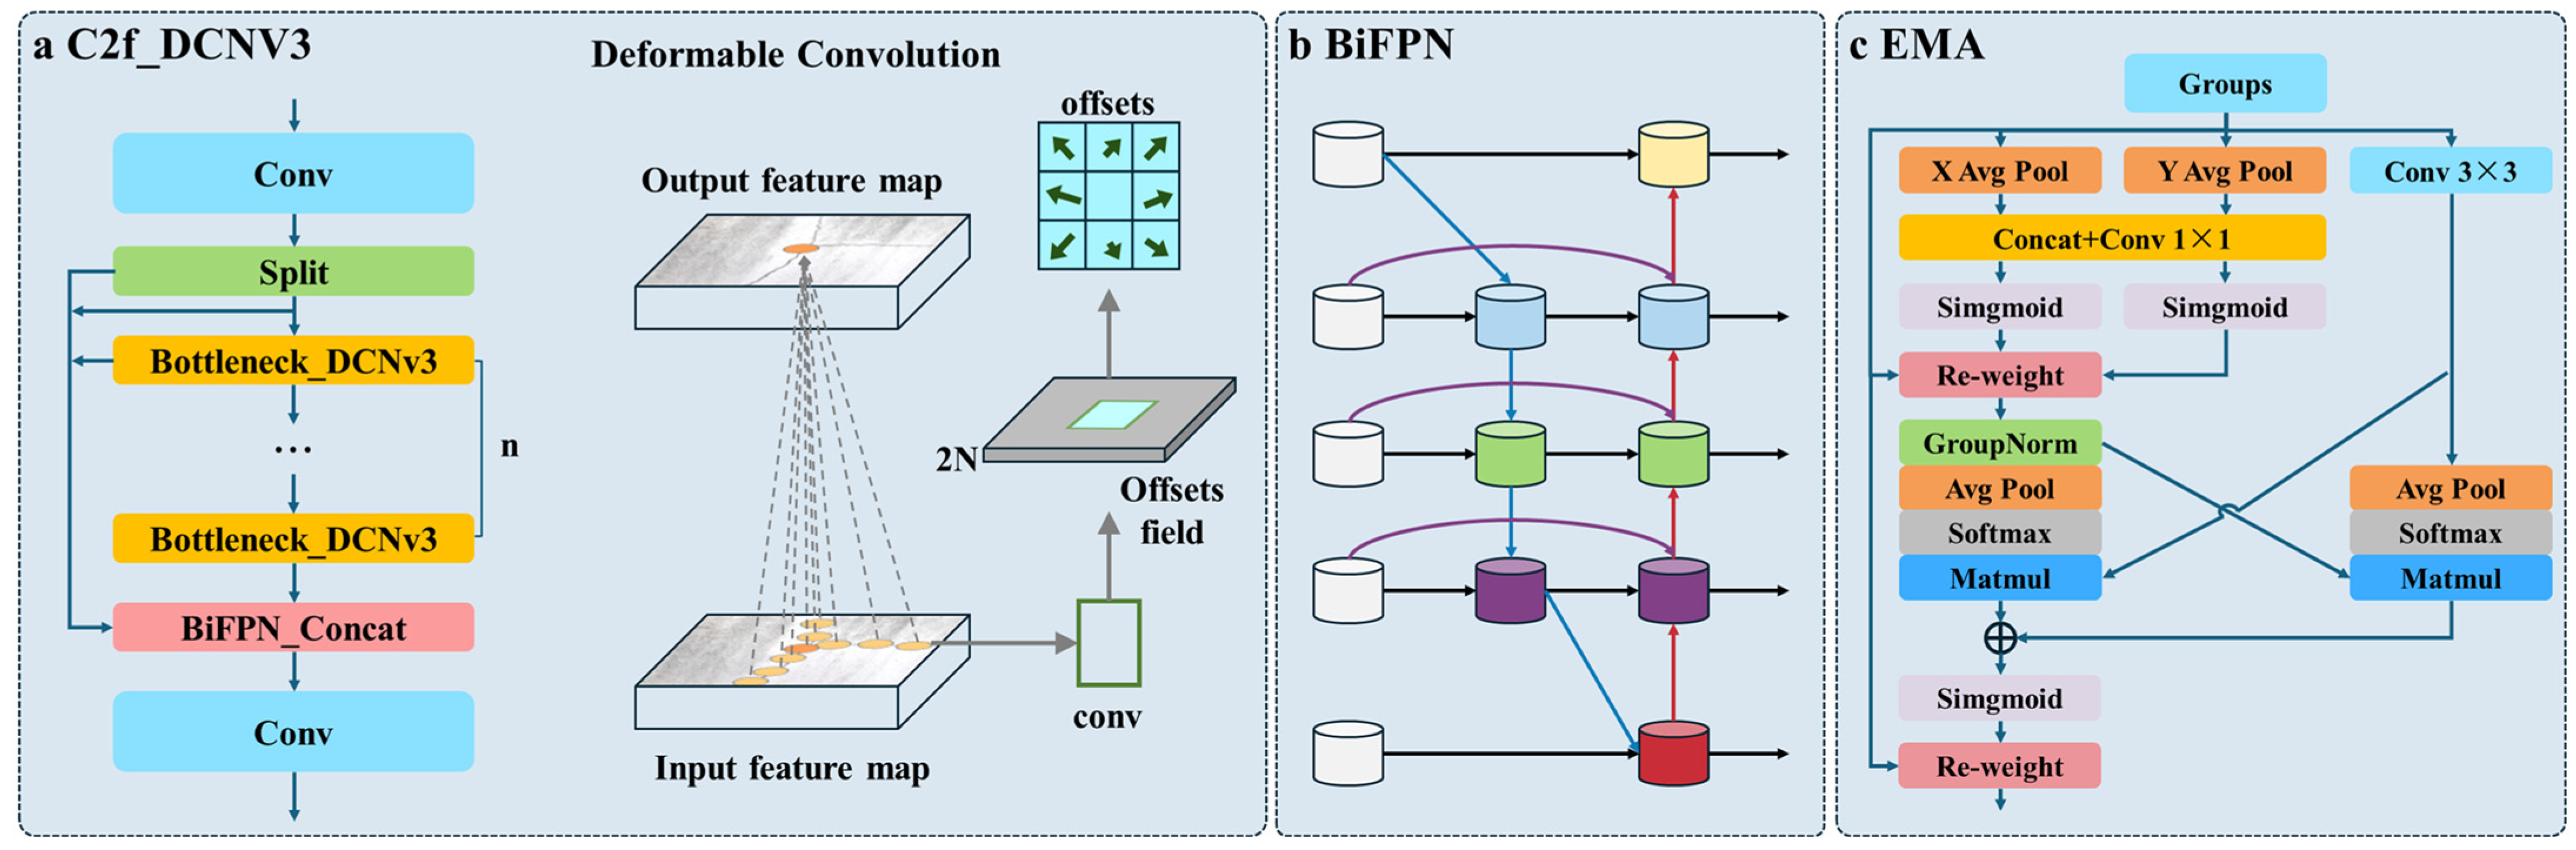
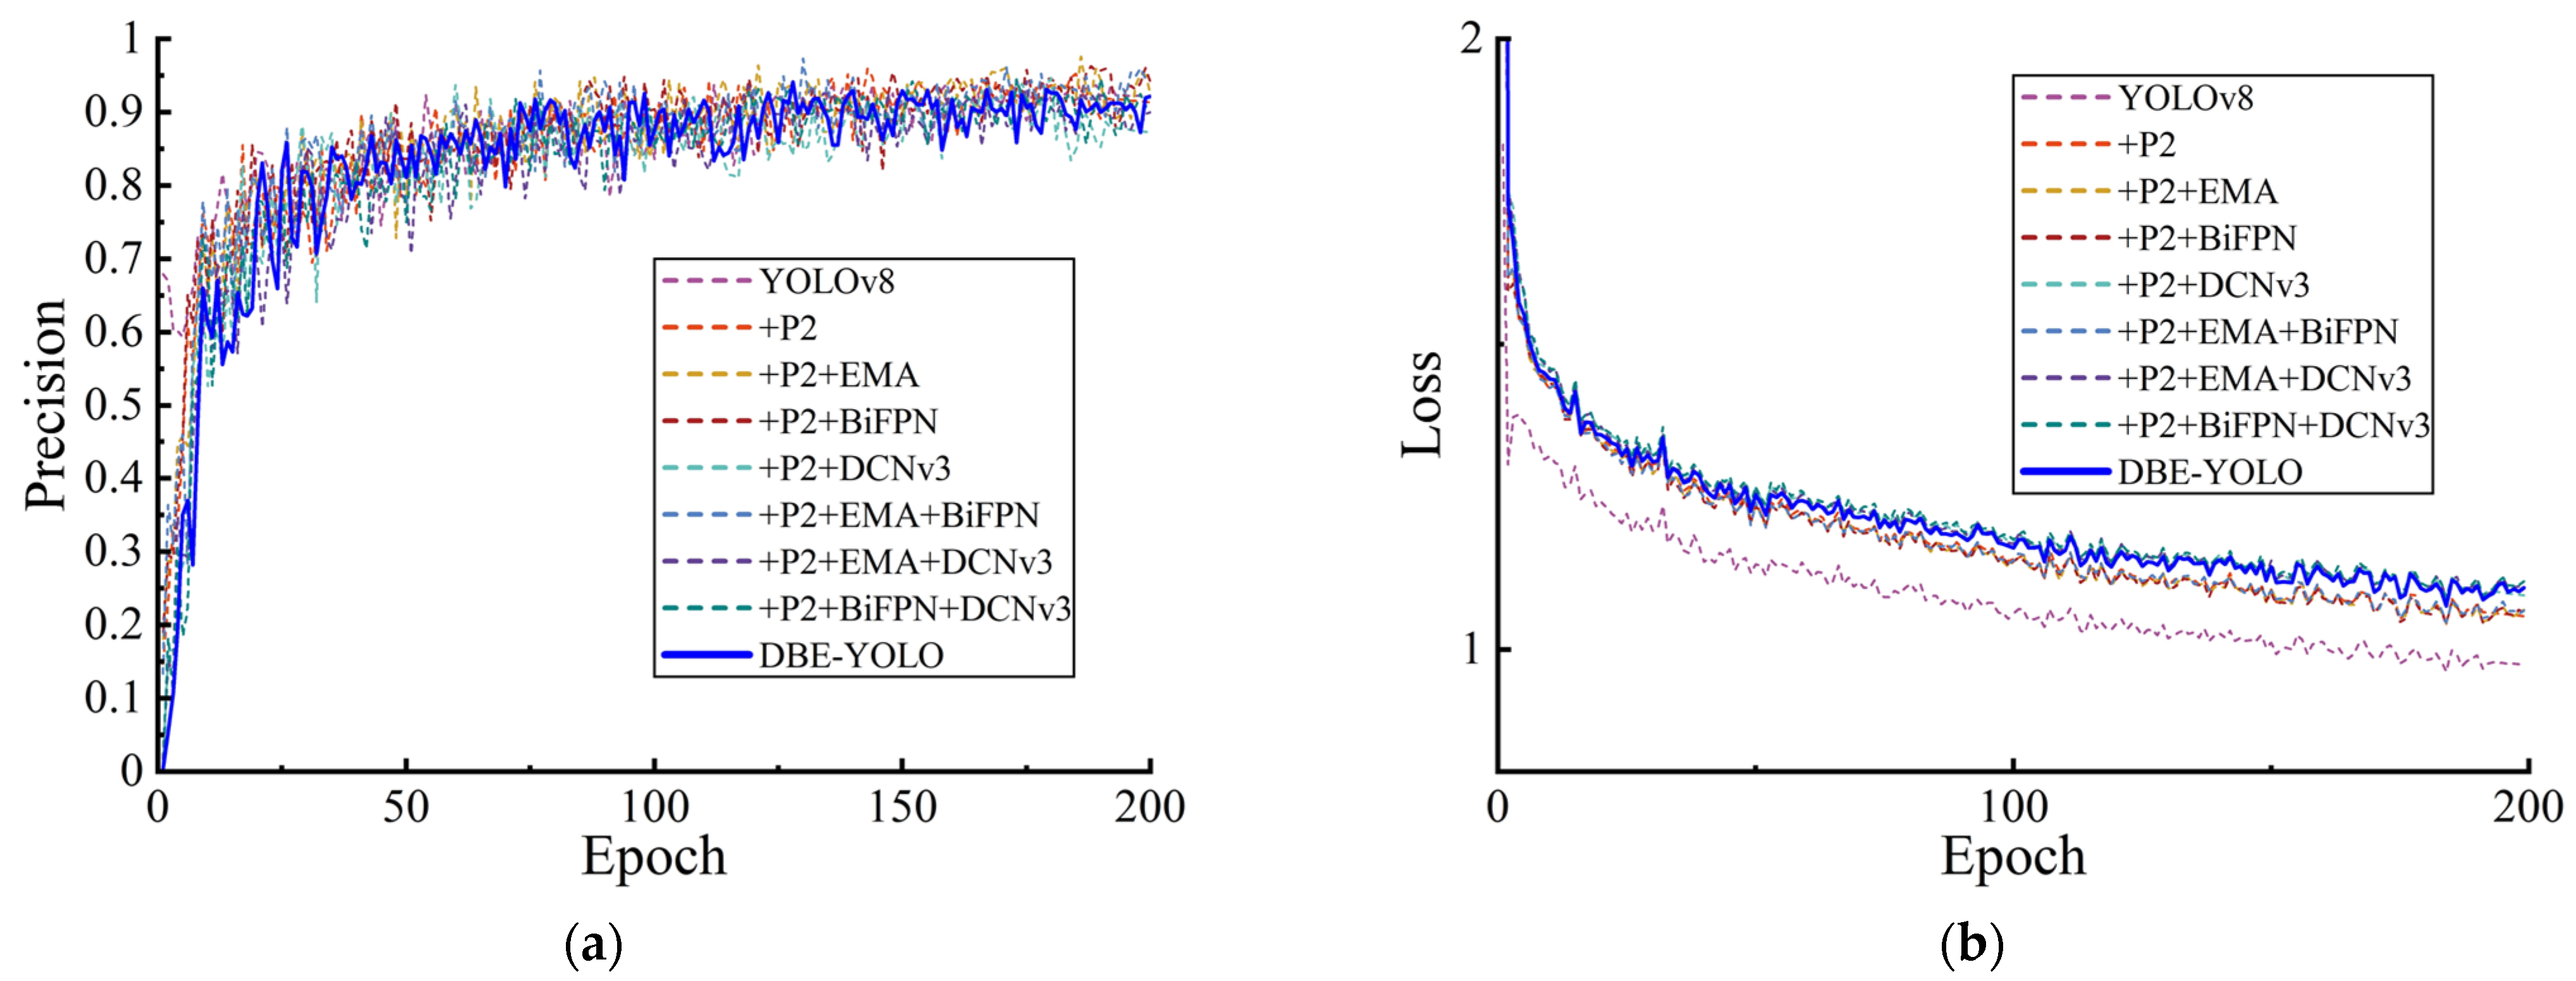
3.2.2. Improvements in DBE-YOLO

An enhanced crack detection network, DBE-YOLO, is proposed to address the aforementioned issues based on YOLOv8. The overall architecture is shown in Figure 3, with the key improvements outlined as follows:
(1) C2f_DCNv3 in the backbone, replacing fixed convolutions with deformable convolutions, allows the receptive field and kernel to better align with crack shapes, significantly improving feature extraction. (2) BiFPN in the neck, utilizing bidirectional connections and cross-layer feature aggregation, reduces information loss during unidirectional flow, thereby enhancing detection performance. (3) EMA in the neck divides the channel dimension into sub-feature groups, ensuring an even distribution of spatial semantic features, reducing computational overhead, and minimizing background noise interference. (4) The addition of smaller-scale detection heads enhances the multi-scale detection capability, allowing it to capture both macro and micro details of cracks more effectively.
1.
C2f_DCNv3 into the backbone
Traditional convolution operations struggle to capture cracks with significant scale variations and irregular deformations due to the limitations of fixed receptive fields and weight distributions. To more accurately capture crack information, DCNv3 is introduced to dynamically adjust the receptive field, allowing it to focus on cracks of varying directions and sizes (Figure 4a) while minimizing interference from complex backgrounds. The feature matrix of the standard convolution is given by Equation (10).
y ( p 0 ) = k = 1 K w k x ( p 0 + p k )
where K is the total number of sampling points, k represents the position of the convolutional kernel, w k denotes its weight, and x ( p 0 + p k ) is the pixel value at the corresponding position in the input feature map.
To improve the convolutional kernel, offset and adjustment terms are introduced as follows:
y ( p 0 ) = g = 1 G k = 1 K w g m g k x g ( p 0 + p k + Δ p g k )
where m g k is the normalization term used to adjust the features at different positions, G is the total number of feature groups, and g represents each group, and Δ p g k is the offset term for the g -th group.
C2f_DCNv3, with its larger receptive field and ability to dynamically adjust sampling offsets, effectively overcomes the limitations of traditional convolutions in handling long-range dependencies and adaptive spatial aggregation. Additionally, the 1 × 1 convolutional kernel is used to reduce the dimensionality of the input features, reducing computational parameters and enhancing training efficiency.
2.
BiFPN into the neck
To address the information neglect or loss caused by unidirectional information flow in traditional FPN networks, DBE-YOLO introduces BiFPN to optimize multi-scale feature aggregation (Figure 4b). BiFPN constructs a bidirectional information flow feature pyramid with top-down and bottom-up connections, enabling efficient fusion of features across different scales. Additionally, it employs an adaptive feature fusion weighting mechanism, allowing the model to learn the importance of input features and assign higher weights to features with more information.
O = i ω i ε + i ω j I i
P 6 t d = C o n v ω 1 P 6 i n + ω 2 R s P 7 i n ω 1 + ω 2 + ε
P 6 o u t = C o n v ω 1 P 6 i n + ω 2 P 6 t d + ω 2 R s P 5 o u t ω 1 + ω 2 + ω 3 + ε
where R s is used for resolution matching, P is the feature information, t d denotes top–down, o u t denotes bottom–up, and ω i represents the learning weights.
BiFPN enhances the efficiency and compactness of the feature pyramid, strengthening the ability to extract crack features at multi-scales in complex backgrounds, thus enabling faster crack detection.
3.
EMA into the neck.
Images captured by UAVs often have complex background information, and feature fusion may be affected by uneven feature distribution, impacting detection accuracy. To address this, DBE-YOLO introduces the EMA module (Figure 4c) to preserve the information in each channel and evenly distribute spatial semantic features across the feature groups, reducing information loss during the channel dimensionality reduction process. Additionally, the EMA module calibrates the weights of each parallel branch during global information encoding and merges the output features of the two branches through cross-dimensional connection techniques.
Furthermore, the EMA module uses the 1 × 1 convolution shared components from the CA module, extracting attention weight descriptors of grouped feature maps through three parallel paths. Two paths in the 1 × 1 branch perform channel encoding and average pooling, followed by Sigmoid to fit the 2D distribution of the linear convolution. The third path uses a 3 × 3 kernel to extract multi-scale features across channels. The outputs are then processed through 2D global average pooling (Equation (15)) and Softmax for linear transformation, converting them into the corresponding dimensions R 1 1 × C / / G × R 3 C / / G × H W . Finally, the output feature map is computed as the sum of the two generated spatial attention weights, with Sigmoid applied to establish pixel-level pairwise relationships.
z c = 1 H × W j H i W x c ( i , j )
where x c is the input feature of the c -th channel.
The EMA module is incorporated into the layers before the head to reduce information loss during the feature fusion process, enhancing feature extraction capabilities.

3.2.3. Evaluation Indicators

The evaluation metrics of the model include Precision, Recall, F 1 score, A P , and A P 0.5 , which are used to assess the recognition performance in engineering applications of the model (Equations (16)–(19)).
P = T P T P + F P
R = T P T P + F N
F 1 = 2 P × R P + R
A P = 0 1 P ( r ) d r
where T P represents true positives, F P is false positives, P refers to Precision, R refers to Recall, and A P 0.5 is the A P at an intersection over union (IoU) threshold of 0.50.

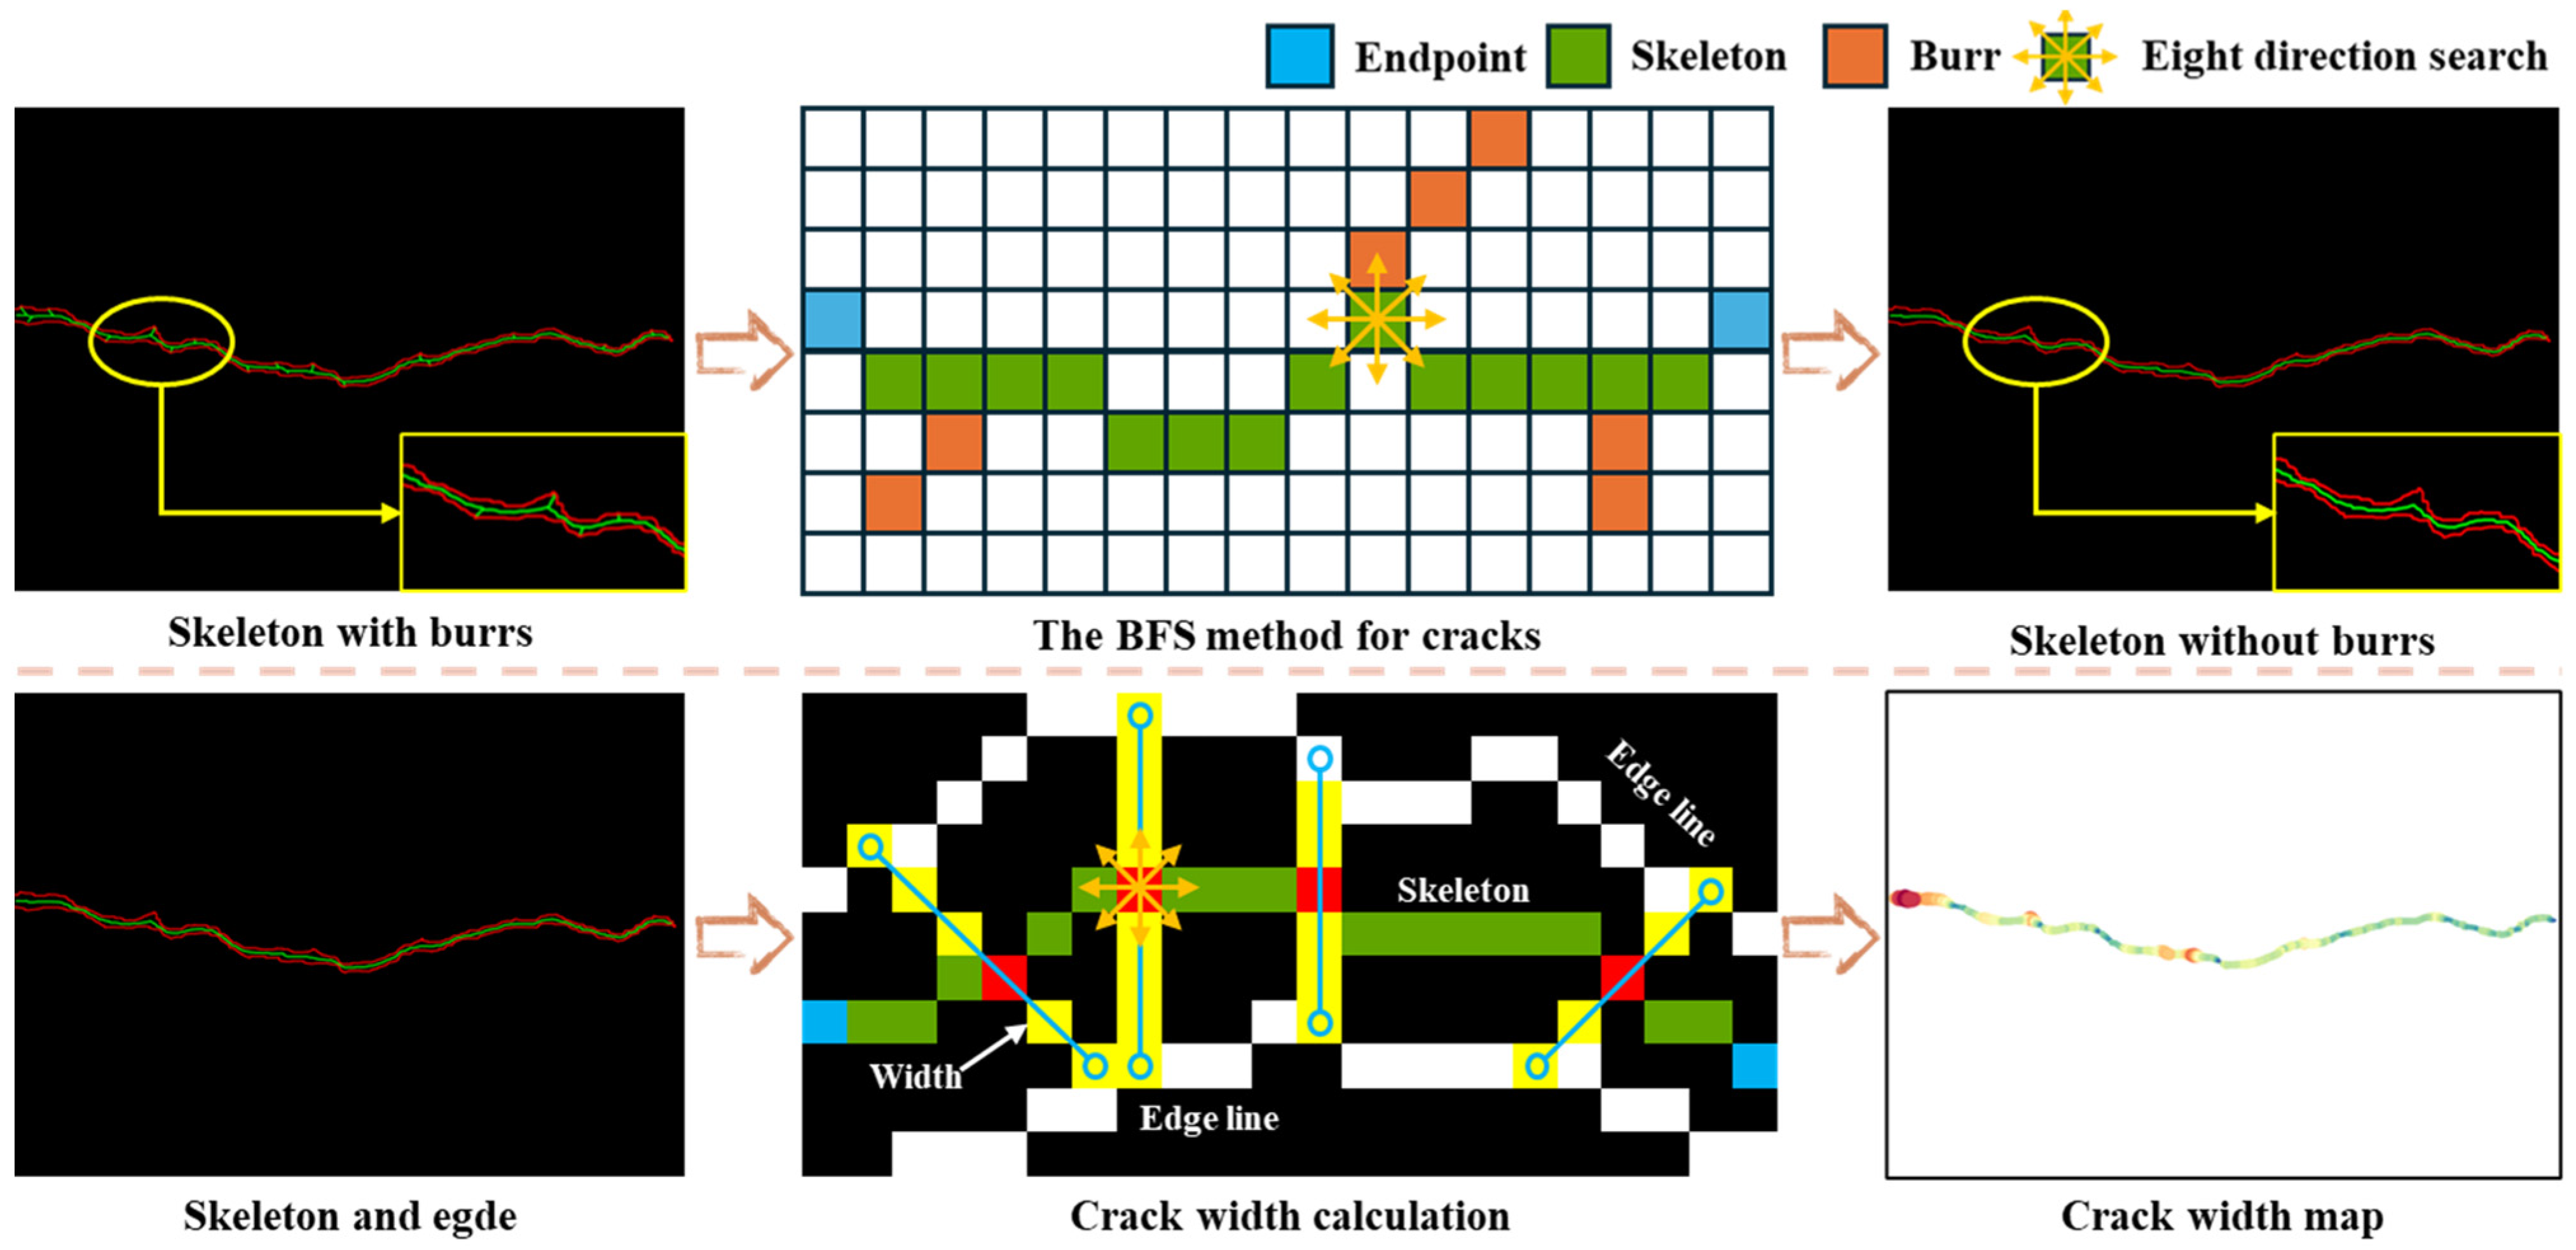
3.3. Quantification Methods for Crack Parameters

The crack pixel information extracted by DBE-YOLO undergoes image denoising and morphological operations to generate an image suitable for quantitative analysis, followed by quantification methods. The computed pixel-level crack parameters are converted into actual physical parameters through coordinate system transformation. Based on the above, this section presents the quantification methods for key crack parameters, such as width, length, and area. These methods are integrated into an automated crack detection system to improve efficiency.

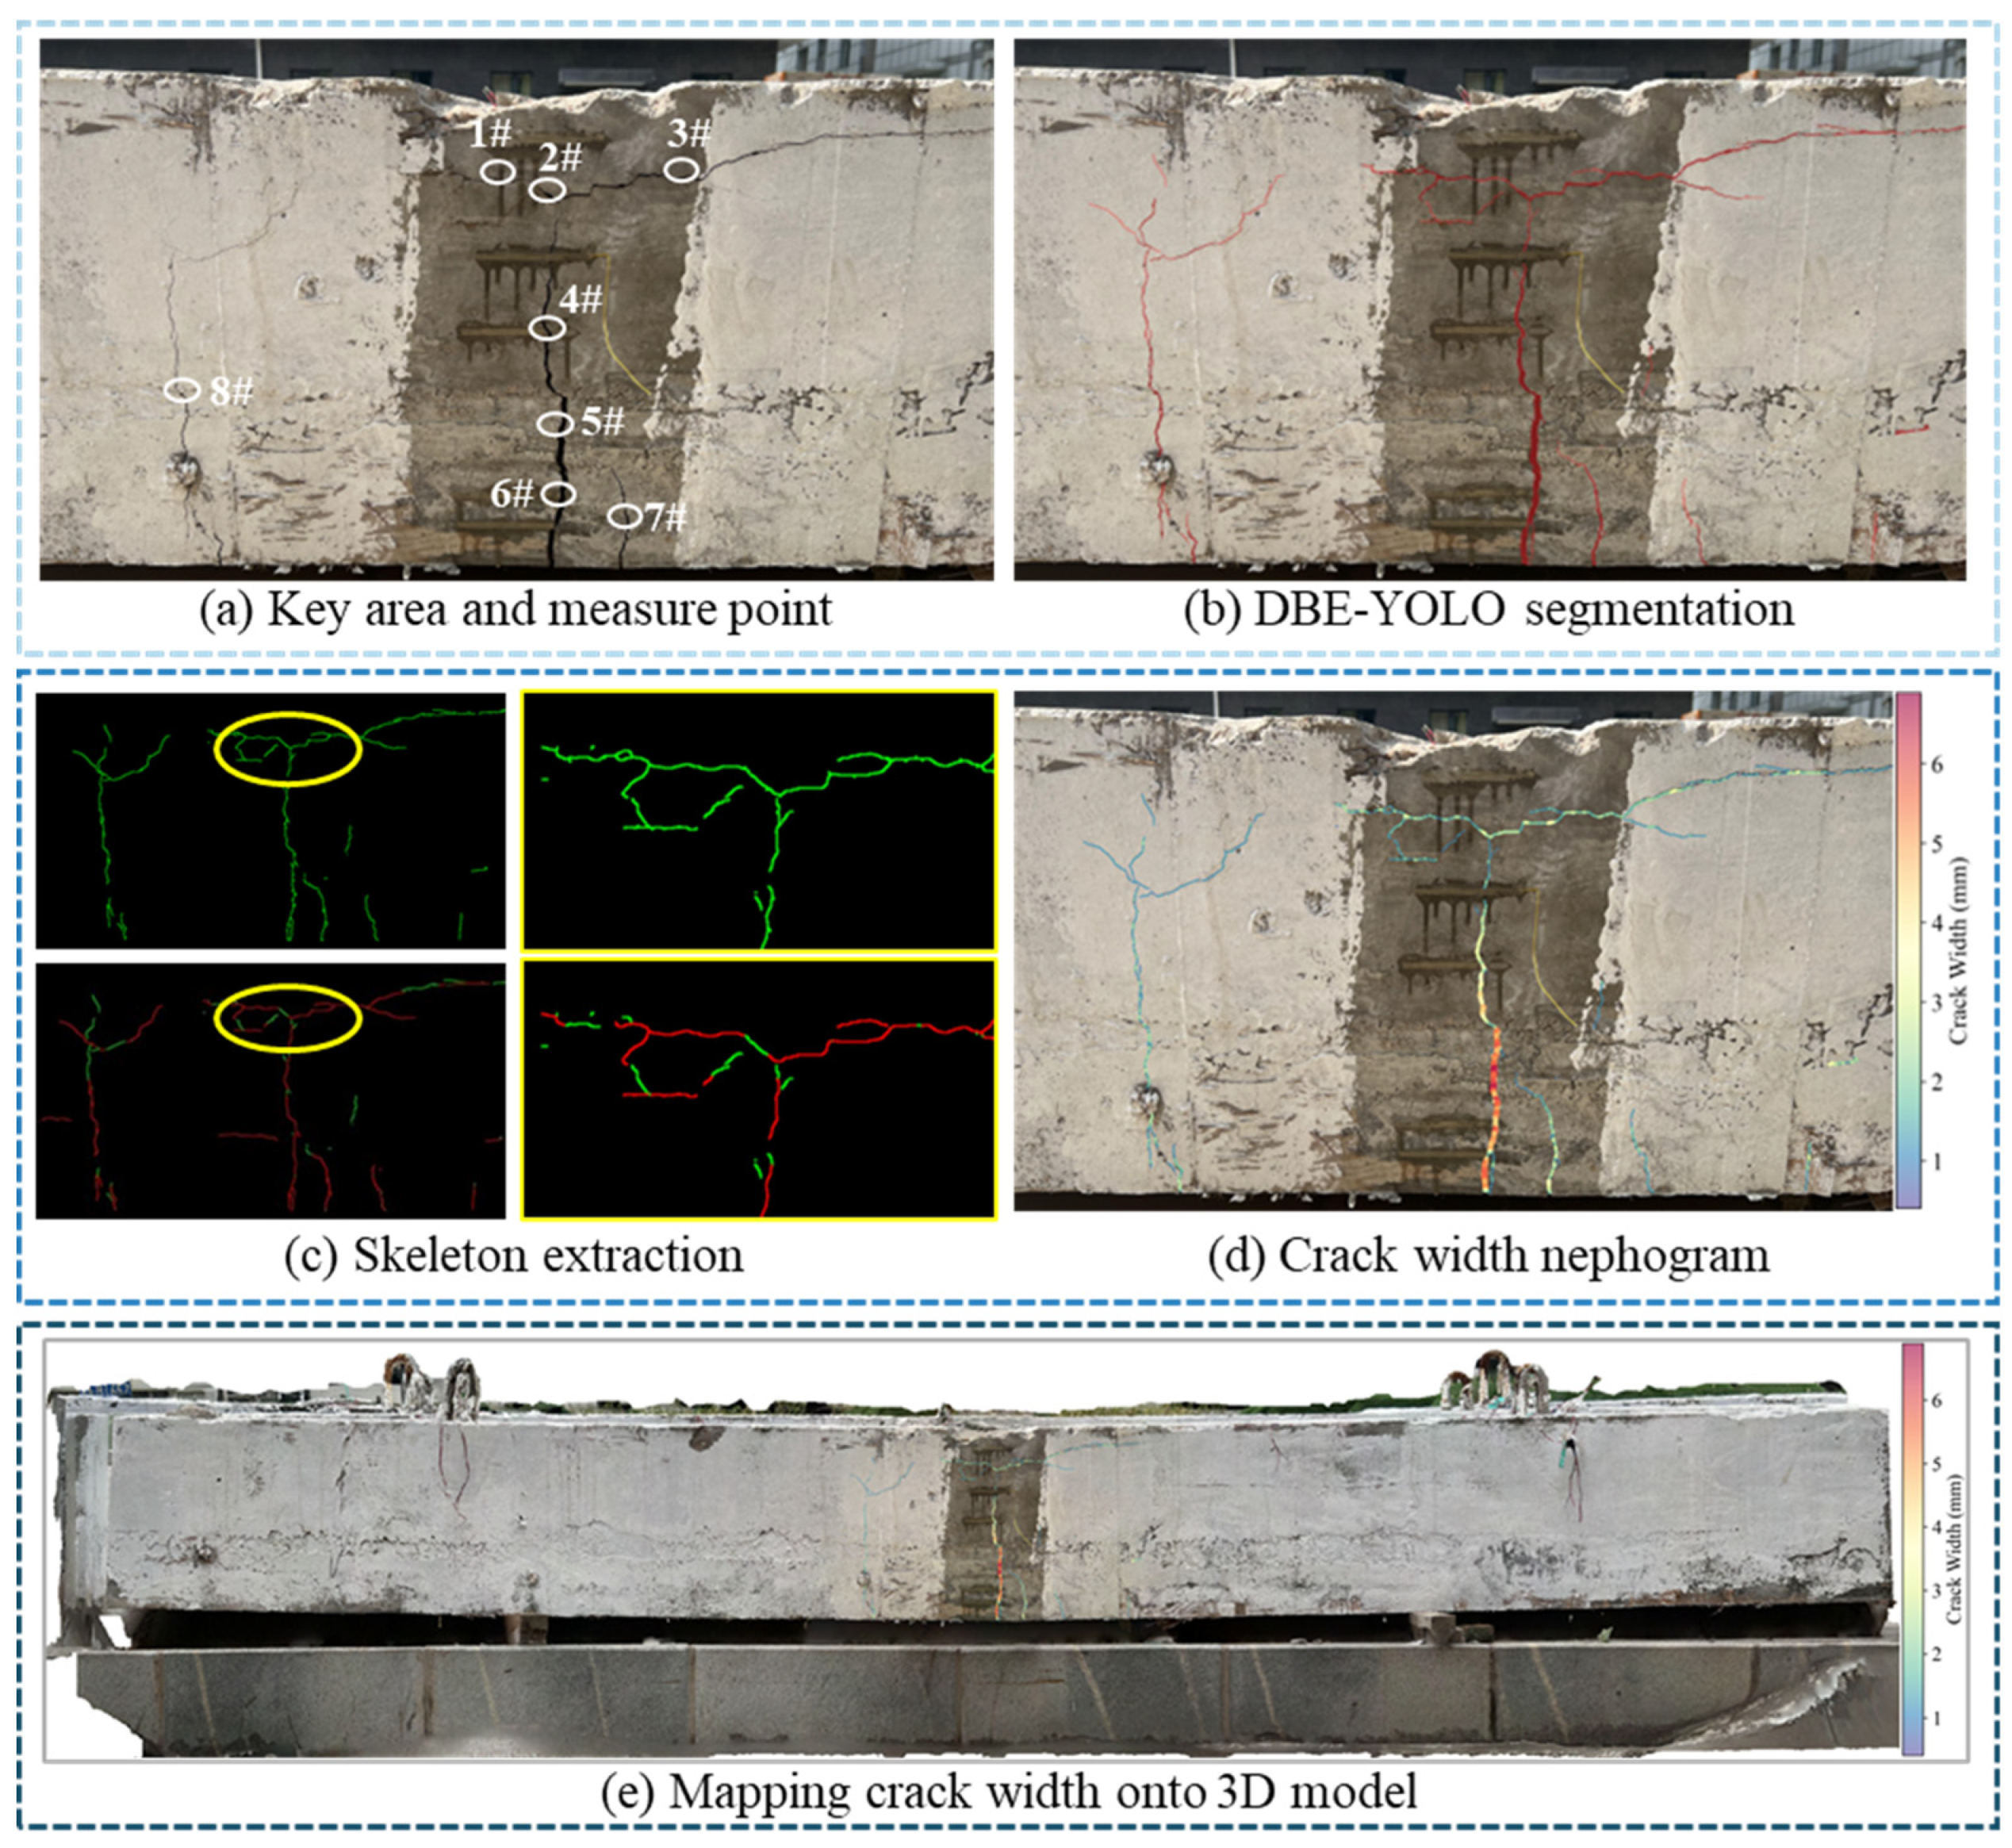
3.3.1. Crack Width Calculation Method

1.
Crack skeleton extraction
In calculating width and length, the segmented crack can be refined to extract the skeleton and edge contours with a width of 1 pixel, facilitating subsequent quantitative analysis. However, as shown in Figure 5, actual bridge cracks are often irregular, and burrs on the skeleton can lead to inaccurate quantification results. To address this issue, a Breadth-First Search (BFS)-based method is applied to remove burrs by identifying the longest path in the skeleton image. Specifically, a 3 × 3 neighborhood around all skeleton points in the image is examined for longer cracks, and skeleton points with two connections are recognized as endpoints. The longest path in the skeleton is then computed to obtain the burr-free crack skeleton image. For branching cracks, the BFS method sets a minimum branch length and a primary skeleton length to capture more detailed skeleton features, as outlined in Section 4.2.
2.
Crack skeleton extraction
After the crack skeleton and contours are determined, the crack width at any point, including the maximum width, average width, and so on, can be calculated. As shown in Figure 5, by traversing from the starting point to the endpoint along the crack skeleton, eight search lines j i ( i = 1 , 2 , , 8 ) are generated in horizontal ( 0 , 180 ) , vertical ( 90 , 270 ) , and diagonal ( 45 , 225 ; 135 , 315 ) directions, extending to the edge contours. Subsequently, the lengths of the search lines in eight directions, j i ( i = 1 , 2 , , 8 ) , are calculated, and the pixel width at the skeleton point is given by D i = min ( d 1 , d 2 , d 3 , d 4 ) , where d 1 = j 1 + j 5 + 1 , d 2 = 2 ( j 1 + j 5 + 1 ) , d 3 = j 3 + j 7 + 1 , and d 4 = 2 ( j 4 + j 8 + 1 ) .
After obtaining the pixel width, the actual width W i and maximum width W i max are determined using the transformation relationship. The average width W A V G is then calculated from the length L and area A using Equation (20). The crack width distribution is visualized through a crack width cloud map.
W A V G = A / L

3.3.2. Crack Length, Area, and Centroid Method

The crack pixel length is obtained by counting the number of skeleton pixels. In the binary image, where the background has a pixel value of 0 (black) and the crack has a value of 255 (white), the crack pixel area is determined by counting the pixels with a value of 255. The actual length L and area A can be computed using the transformation relationship.
The centroid is crucial for describing crack morphology and predicting its future development. The change in the centroid over time helps determine the development direction, with the centroid ( c x , c y ) calculated as follows:
c x = M 10 / M 00 c y = M 01 / M 00
where M 00 = x y I ( x , y ) , M 10 = x y x I ( x , y ) , and M 01 = x y y I ( x , y ) .

3.3.3. Crack Detection System

For detection efficiency, the above methods are integrated into the automated crack detection system (Figure 6). Images captured by UAV are automatically transmitted to the system, automatically performing detection, segmentation, and pixel quantification of the cracks. The system generates actual physical information and produces detection data and width cloud maps using the transformation relationships, significantly improving detection efficiency.

3.4. Procedure of the Proposed Method

Finally, the key technical aspects of the bridge crack identification, quantification, and visualization method based on UAV vision include an improved crack detection network with an automated quantification system, 3D reconstruction of the bridge, and crack information mapping (Figure 7). Detailed descriptions of each step are provided below.
  • Step 1: Data acquisition: Based on the bridge type and inspection task requirements, GCPs, overlap rates, and flight paths are determined. The UAV captures images, while the GNSS receiver collects GCP information.
  • Step 2: 3D reconstruction: The collected data are used for 3D reconstruction, ensuring complete area coverage.
  • Step 3: Crack detection, segmentation, and quantification: The images are processed by an automatic system, which enables the cracks to be identified, segmented, and quantified, providing accurate physical information and width maps of the cracks.
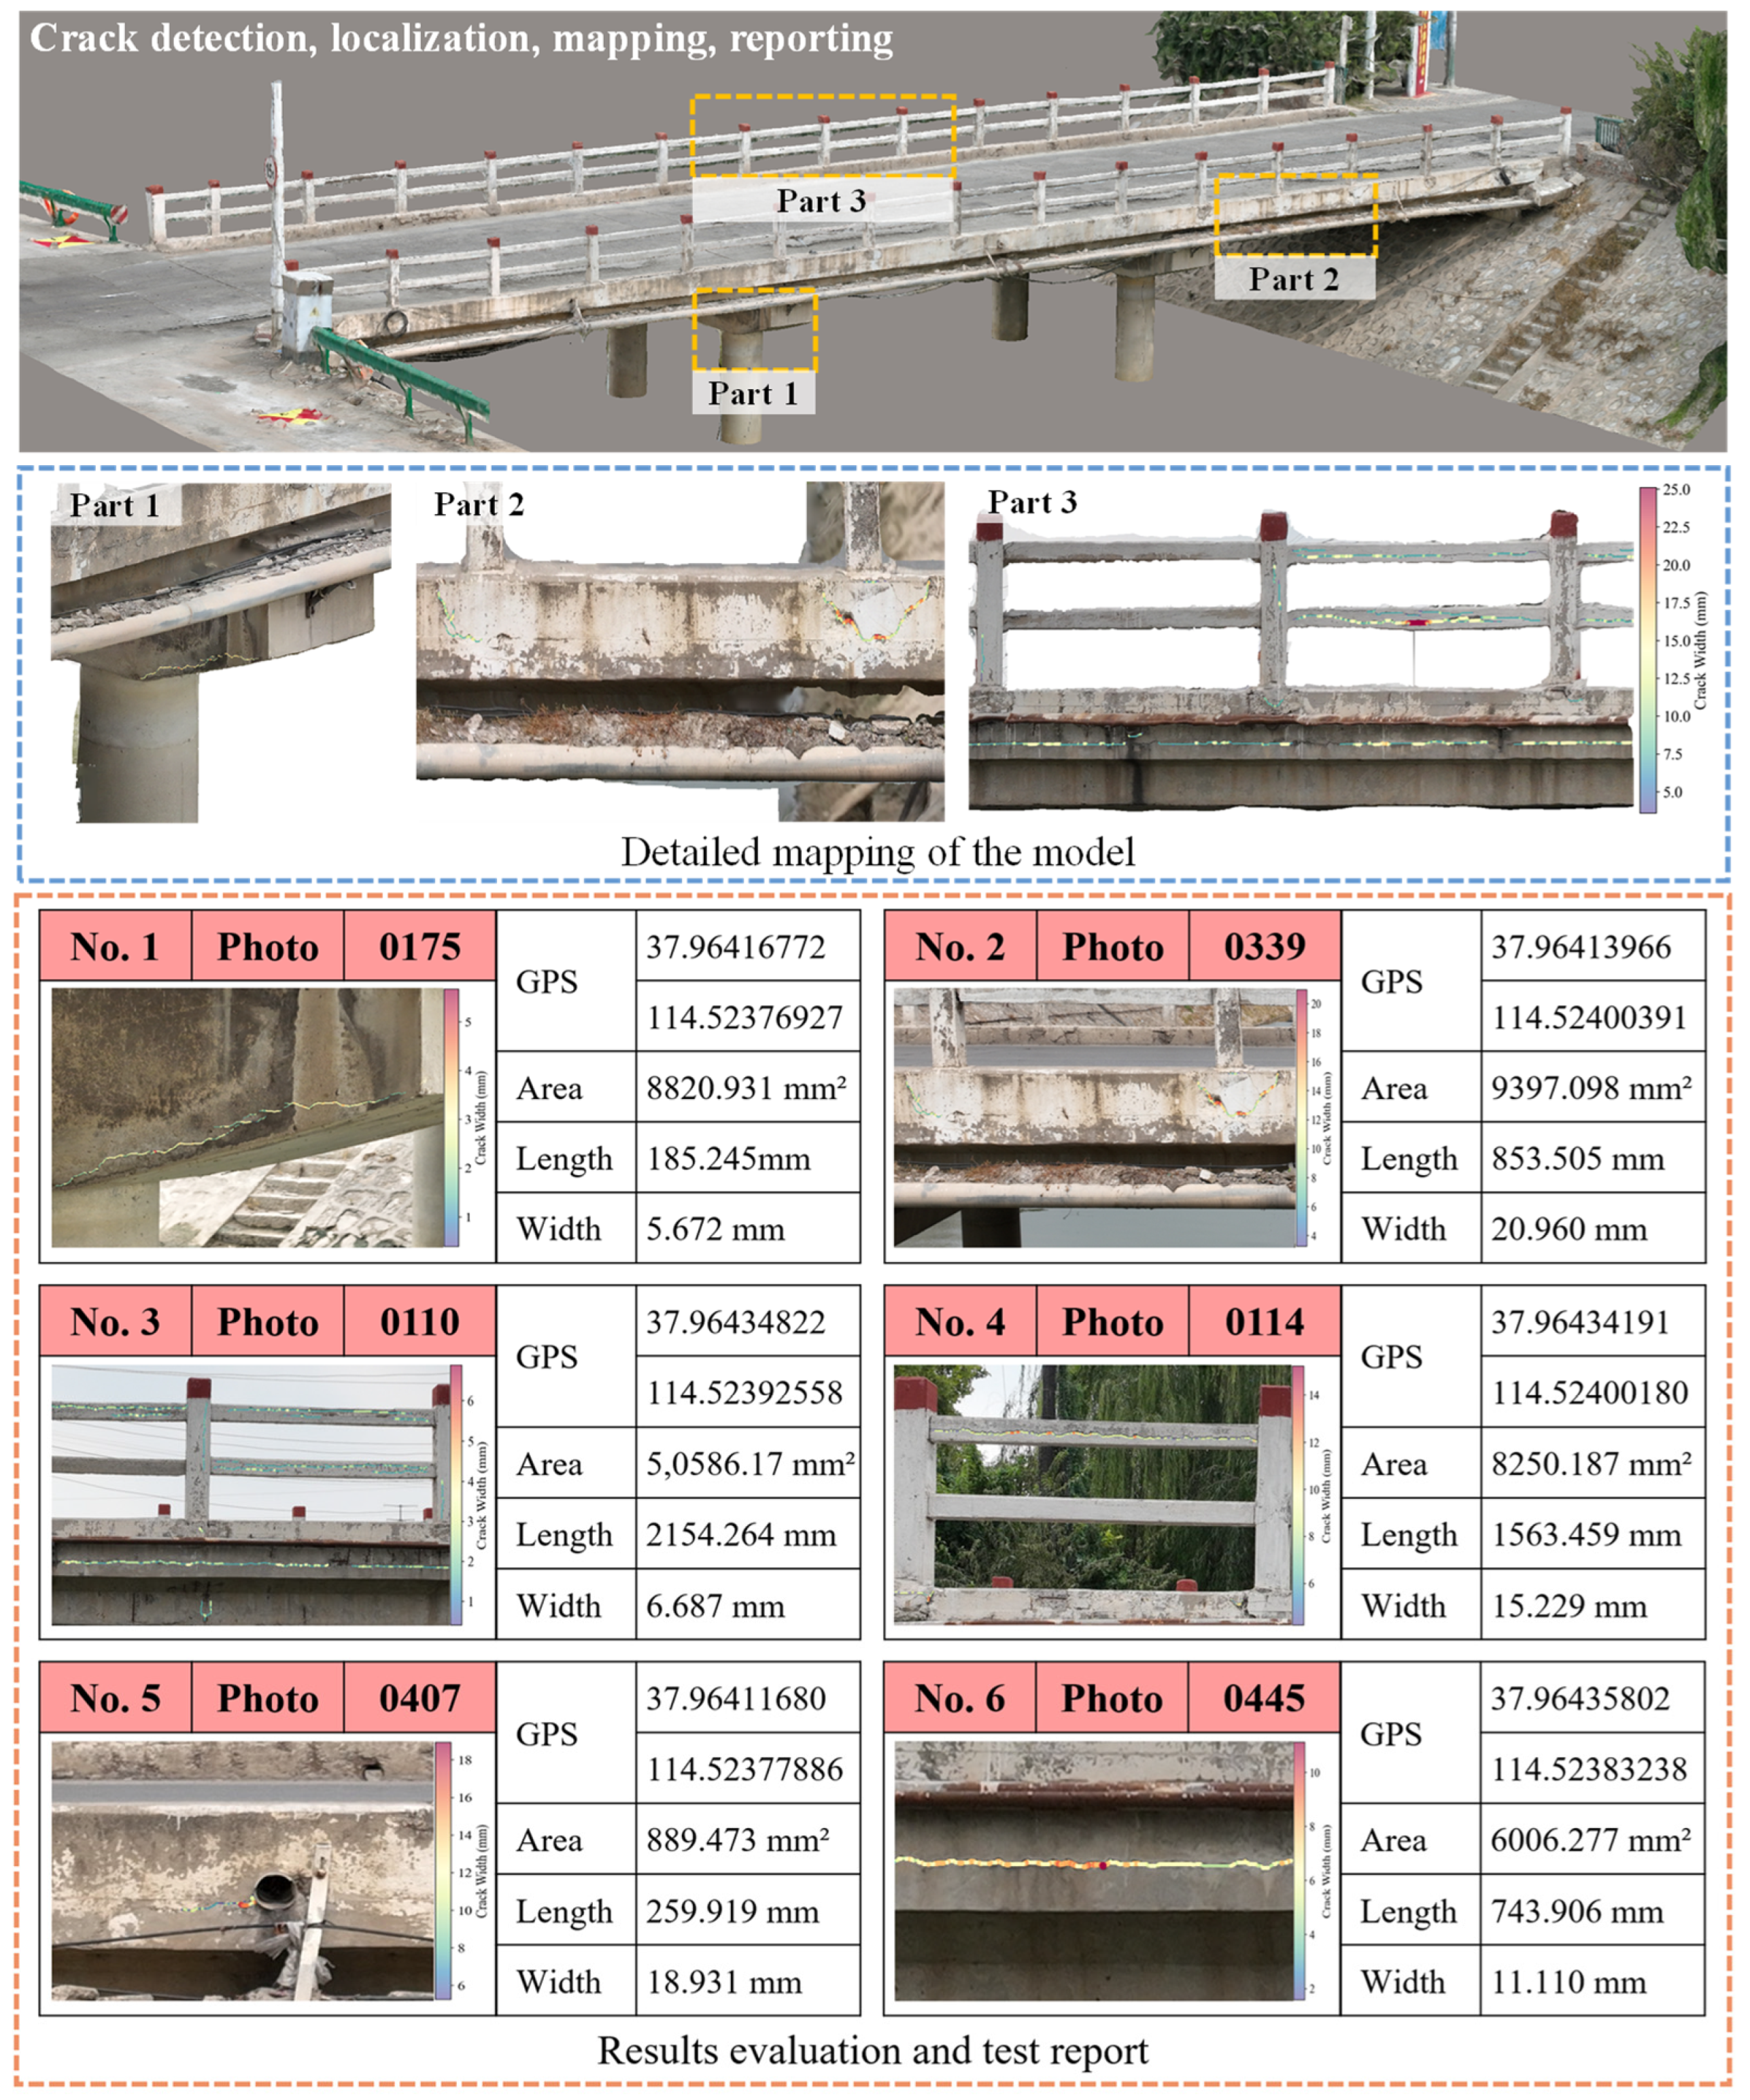
  • Step 4: Crack mapping: By integrating the recovered camera poses, the crack quantification data are mapped onto the 3D model, enabling the 3D visualization of the cracks.
  • Step 5: Bridge inspection report: Inspection results are generated by current standards. Based on crack distribution, areas of concern are highlighted to support the assessment of bridge structural safety.
The following sections demonstrate the effectiveness and accuracy of the proposed method through experiments on a concrete beam and bridge.

4. Experimental Test

4.1. Crack Detection Results Based on DBE-YOLO

The dataset used for training comprises publicly available open-source datasets and crack images collected by the authors (Figure 8). The dataset includes images of bridge cracks, including micro-cracks, severe cracks, and cracks captured from multiple angles and distances in complex backgrounds. Additionally, it has been expanded and augmented through methods such as image flipping, brightness adjustment, and the addition of blur noise. The dataset contains 3386 crack images, each with a resolution of 640 × 640 pixels. Finally, the dataset was manually annotated using Labelme and divided into training, validation, and testing sets in an 8:1:1 ratio.
The pre-trained weights for DBE-YOLO are based on YOLOv8m-seg, and the total training time was 16 h. Several classical segmentation models were trained on the same dataset to evaluate the performance of DBE-YOLO. The configuration parameters for the comparison and ablation experiments are listed in Table 1, and all other parameters are set to default values.
The model comparison experiments used classical segmentation models such as the U-shaped network (U-Net), Fully Convolutional Network (FCN), DeepLabv3+, and YOLOv5 [46,47,48,49]. Table 2 presents the training results for the different networks. DBE-YOLO demonstrates superior segmentation performance on datasets with multi-scale features and complex backgrounds.
To further assess the contribution of each module, an ablation study was conducted, gradually introducing each module. The total duration of the ablation experiment was approximately 120 h. The training results for different modules are shown in Table 3 and Figure 9. The results demonstrate that, compared to the original model, DBE-YOLO improved accuracy by 3.19% and the F 1 score by 3.8%, thereby confirming the effectiveness of the improvements.

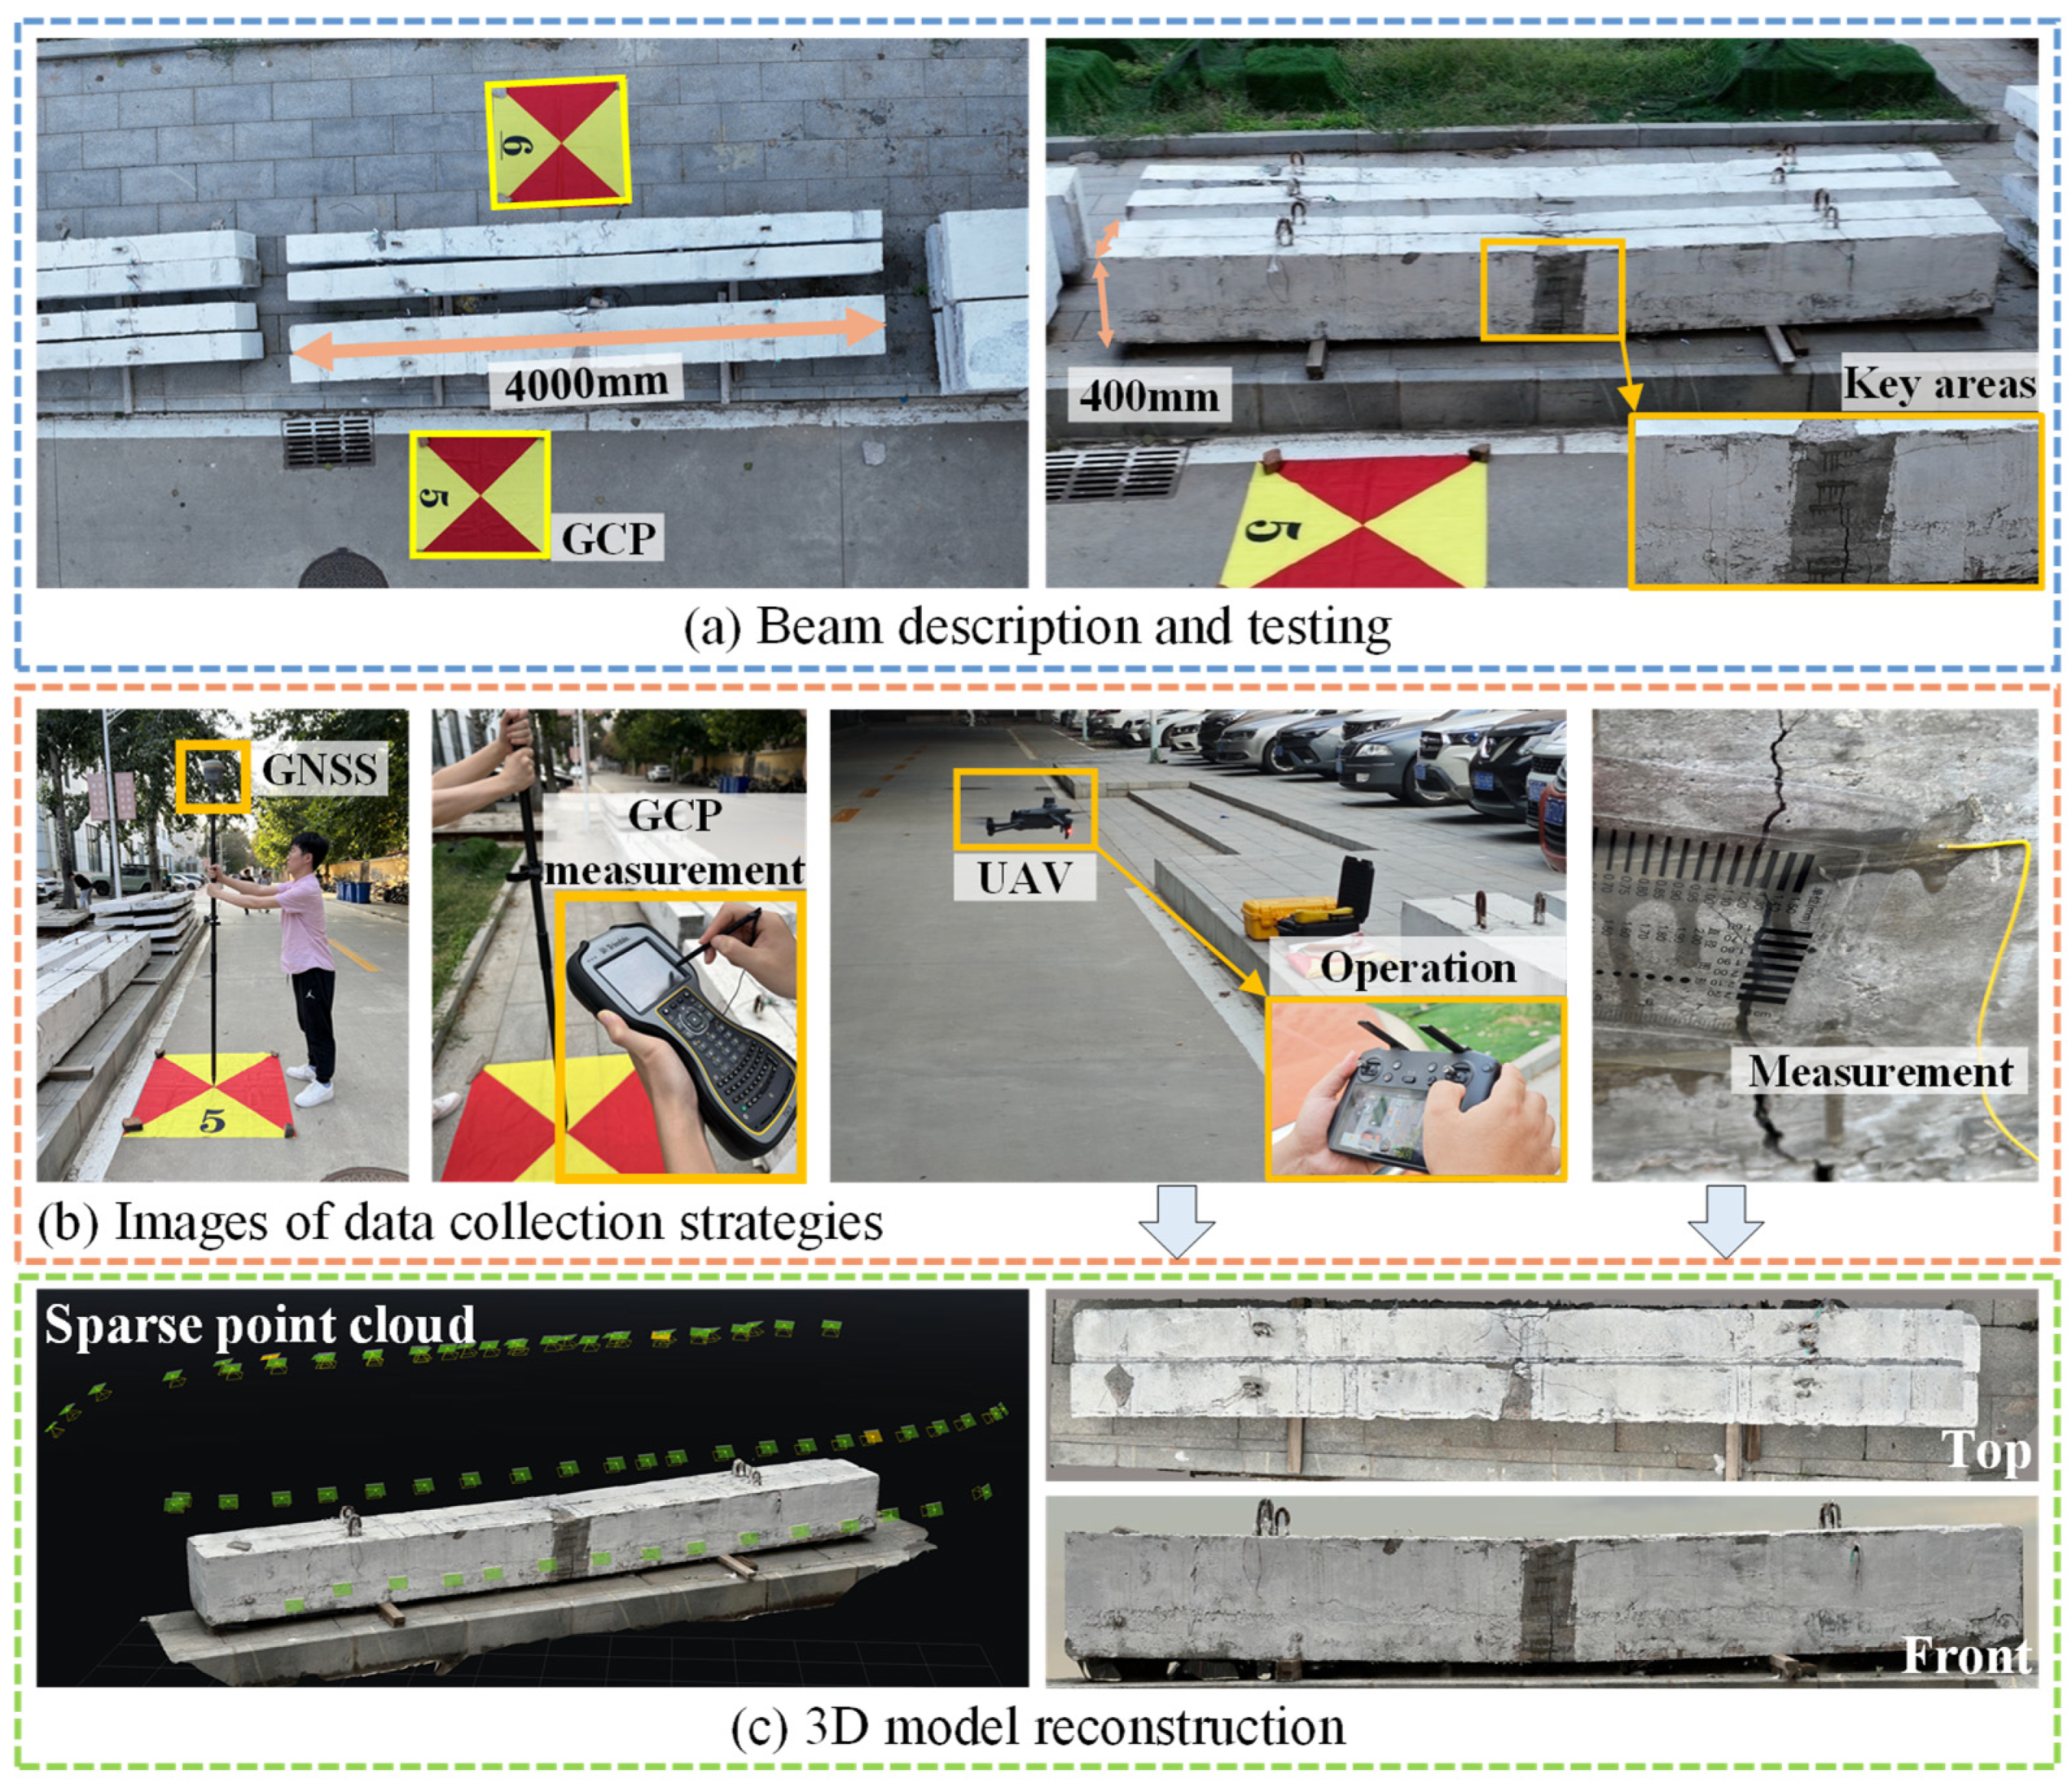
4.2. Verification on an Experimental Beam

A concrete beam crack detection experiment was designed to verify the effectiveness and accuracy of the proposed method. As shown in Figure 10a, the concrete beam has dimensions of 4 m × 0.4 m × 0.4 m, with local cracking. According to the procedure, two 1 m × 1 m red-and-yellow GCPs were placed around the beam, and the experiment was conducted under clear weather, with sufficient sunlight and wind speeds ranging from 0 to 1.0 m/s.
Firstly, based on the surrounding environmental conditions of the specimen, relevant flight path parameters were set while ensuring safety. The UAV (DJI Mavic 3E RTK, 5280 × 3956 pixels) was flown at an altitude of 1–5 m, with an oblique shooting distance of 1–3 m and a horizontal flight speed of 0.5 m/s to 0.8 m/s. The image overlap rate was 80%, with the shooting angle deviation below 30°. The UAV captured multi-images of the concrete beam and the surrounding GCPs, and the coordinates of GCPs were obtained using a Trimble R10 GNSS receiver, with all coordinates referenced to the WGS84 coordinate system. A total of 134 images were captured during the experiment, which were wirelessly transmitted to the ground station. The vernier caliper was used to measure the crack width and length, as shown in Figure 10b.
Next, the 3D model of the beam was constructed using SfM and GCP data, checking for blind spots and gaps caused by insufficient image overlap and recapturing if necessary. The 3D model reconstruction was performed under the conditions listed in Table 1, using Agisoft Metashape 2.0.0 software. The generated 3D model and the recovered camera positions shown in Figure 10c provide realistic textures and a global scale, serving as a critical basis for crack quantification.
With the images imported into the crack detection system, cracks were rapidly detected, Exif data were extracted, and the images were numbered accordingly, enabling preliminary localization and segmentation preparation. The numbered images were then input into the segmentation model to extract pixel-level crack information. In this section, the crack core regions in the mid-span area (Figure 11a) will be discussed in detail for verification.
The crack quantification methods from Section 3.3 were applied to segment the processed image in Figure 11b, extracting the crack skeleton and edge contours (Figure 11c) to calculate parameters such as length, area, and width. By applying the coordinate transformation, the actual crack parameters were obtained. The quantified width map in Figure 11d displays crack width using different colors, clearly visualizing the width distribution. Finally, the crack width map was mapped onto the 3D model (Figure 11e), providing an intuitive and comprehensive display of crack information. The results demonstrate that the proposed method effectively detects and visualizes structural cracks, with information presented intuitively in the 3D model.
To further validate the accuracy of the proposed method, measurements of typical locations on the specimen were conducted using both the proposed method and manual measurement. The manual measurement method involved using a vernier caliper to measure typical locations, with the results averaged from multiple measurements. The measurement results, compared to the actual values, are shown in Table 4. Additionally, the Mean Error (ME), Relative Error (RE), and Standard Deviation (SD) of the collected results were calculated to assess the stability of the method under different conditions. The results demonstrate that the proposed method is in high agreement with the measured results, with the ME of 4.51% and the SD of 3.35%. Furthermore, the constructed 3D model accurately reflects the crack information, meeting the requirements for rapid assessment.

5. Field Test and Implementation

5.1. Field Design and Testing Strategy

The proposed method was applied to a concrete bridge in an urban area, with the bridge structure shown in Figure 12a. The bridge has a total length of 30 m and a width of 7 m. After long-term service, multiple cracks have appeared on the surface of the bridge deck and beams, with a widespread distribution, posing significant safety risks to the bridge structure. Given the high traffic volume and narrow width of the bridge, the method proposed in this study effectively replaces traditional bridge inspection vehicles for inspection.
After the initial survey of the bridge, three GCPs were set up on both sides to establish a high-precision 3D model (Figure 12b). The flight path at the UAV control station was planned with a flight altitude of 3–15 m, a lateral distance from the bridge surface ranging from 0.8 to 3 m, and a horizontal flight speed of 0.5 m/s to 1.0 m/s. The image overlap rate was 80%, with the shooting angle deviation below 30°. It is worth noting that the experiment was conducted under clear weather conditions, high visibility, and wind speeds ranging from 0 to 0.3 m/s.
Images were captured by a DJI M350 RTK UAV equipped with an H20T camera with a 4056 × 3040 pixel resolution. The coordinates of the GCPs were collected using a Trimble R10 GNSS receiver with the WGS84 coordinate reference system. The data collection process is shown in Figure 12c, during which 616 images were captured and wirelessly transmitted to the ground station. The collected data were used for crack detection and 3D reconstruction of the entire bridge structure. It should be noted that no traffic restrictions were imposed on the bridge during the experiment, and it continued to operate normally.

5.2. Three-Dimensional Visualization and Mapping of Cracks in the Bridge

Figure 13a,b show the recovered camera poses and bundle adjustment results. The 3D model of the bridge with realistic texture features capable of visually displaying structural information was then generated (Figure 13c). The collected images were input into an automatic crack detection system, resulting in 203 images containing cracks, from which pixel information was extracted and quantified.
After crack detection, quantification, and 3D model generation, the measurement results were mapped onto the 3D model. Based on the Technical Specifications for Bridge Inspection and Assessment in Urban Areas, the bridge was divided into three main crack zones [50]. These crack zones’ distribution and texture details are shown in Figure 14, with varying crack widths color-mapped onto the 3D model.
The results indicate that the structural cracks in Parts 1–3 significantly exceed the threshold values (width > 5 mm or length > 20 mm), classifying them as dangerous and posing significant safety risks to the bridge structure, requiring immediate maintenance. Other areas exhibited minor, small cracks (in secondary components), which were categorized as slight and recommended for monitoring over time. The bridge inspection report marked all dangerous cracks in red, with detailed information provided, including the associated images, locations, areas, lengths, and maximum widths. The report is clear, comprehensive, and highly visual, facilitating informed bridge maintenance decisions.
To further validate the accuracy of the proposed method, we performed manual measurements on the high-risk cracks shown in Figure 14, following the procedure outlined in Section 4.2. The results of these measurements were compared with those obtained using the proposed method, as shown in Table 5. The ME, RE, and SD were also calculated for the comparison. The results indicate that the RE is less than 10%, demonstrating the method’s good stability in bridge inspection. Furthermore, manual measurements require at least three operators and the assistance of construction vehicles, with a total time expenditure of over 9 h. In contrast, the proposed method can complete the measurement of crack widths across the entire bridge in only 3 h, generating a 3D model with crack information and an intuitive inspection report.

6. Conclusions

This paper primarily investigates an intelligent method for the detection, quantification, and visualization of bridge cracks using UAVs, aiming to enhance detection efficiency and generate intuitive, comprehensive 3D models with crack information. The contributions of this work are as follows:
  • An improved DBE-YOLO crack detection network is proposed. To address the challenges posed by complex backgrounds in UAV-captured images and limitations in multi-scale crack detection, the proposed DBE-YOLO integrates DCNv3, BiFPN, EMA, and multi-scale detection heads. This approach reduces information loss during transmission and enhances both crack feature extraction and detection capabilities at macro- and micro-scales. Experimental results show that DBE-YOLO improves segmentation accuracy by 3.19% and F1 score by 3.8% compared to the original model.
  • An automated crack detection system has been developed. The DBE-YOLO model and the proposed crack quantification methods are integrated into the system to improve detection efficiency and enable rapid crack quantification. This system automatically generates detection data and crack width maps. Experimental results demonstrate that this method can automatically and rapidly process large volumes of crack images and compute crack parameters, effectively overcoming the issue of information loss caused by fragmented processes in traditional methods while also alleviating the workload associated with large-scale image processing.
  • High-precision 3D modeling and crack visualization can be achieved. The 3D model of the bridge is constructed using RTK and GCP data. Crack information is then mapped onto the 3D model based on the recovered camera poses, generating a 3D visualization of the cracks. Experimental results show that the generated 3D bridge model with cracks provides a comprehensive spatial distribution of the cracks and produces an intuitive, verifiable inspection report, providing a novel approach for rapid bridge crack inspection.
The proposed method is more suitable for crack detection in concrete bridges than traditional methods. The measurement results’ RE is less than 10%, and the required testing cost and time are significantly reduced. This method is not limited by traffic flow, allowing accurate identification, quantification, and visualization of cracks in complex backgrounds and generating a 3D bridge damage model with crack information.
However, the proposed method still has certain limitations. Firstly, full automation has not yet been achieved, as some processes still require manual intervention, such as UAV flight path setup, and autonomous navigation is not yet feasible. Additionally, the processing speed of the automated crack detection system does not yet meet real-time requirements, and lightweight edge computing remains a significant challenge. Lastly, the method is currently limited to crack detection, with insufficient capabilities for identifying other types of structural damage, and cannot yet support comprehensive bridge inspection.
Future research will identify additional bridge damage types, such as corrosion, exposed reinforcement, and fractures, to enhance the method’s broad applicability. At the same time, techniques such as super-resolution reconstruction, panoramic stitching, and more comprehensive crack detection networks will be integrated to address the trade-off between large FOV and high precision in bridge inspection. Finally, the method will be optimized for lightweight performance, enabling fully automated, edge-computing-based rapid damage detection, quantification, and visualization.

Author Contributions

Conceptualization, L.Z. and H.J.; methodology, H.J.; software, H.J. and H.T.; validation, S.J., C.X., and F.X.; data curation, H.J.; writing—original draft preparation, H.J.; writing—review and editing, L.Z.; supervision, F.X., G.W., H.Z., and L.C.; funding acquisition, F.X., G.W., and H.Z. All authors have read and agreed to the published version of the manuscript.

Funding

This research was supported by the Science and Technology Project of Hebei Education Department (Grant Number: ZD2022073), the Post-graduate’s Innovation Fund Project of Hebei Province (Grant Number: CXZZSS2024066), the National Natural Science Foundation of China (No. 52478407, No. 52427813), the Natural Science Foundation of Hebei Province (No. E2023210113), and the Class A Key project of China Railway Design Group (No. 2023A0103601).

Data Availability Statement

The data presented in this study are available upon request from the corresponding author.

Conflicts of Interest

Author Guoqing Wang was employed by the Heibei Transportation Investment Group Company Limited, Author Hemin Zheng was employed by the China Railway Design Group Co., Ltd. The remaining authors declare that the research was conducted in the absence of any commercial or financial relationships that could be construed as a potential conflict of interest.

References

  1. Matos, J.C.; Nicoletti, V.; Kralovanec, J.; Sousa, H.S.; Gara, F.; Moravcik, M.; Morais, M.J. Comparison of Condition Rating Systems for Bridges in Three European Countries. Appl. Sci. 2023, 13, 12343. [Google Scholar] [CrossRef]
  2. Aljagoub, D.; Na, R.; Cheng, C. Toward Practical Guidelines for Infrared Thermography of Concrete Bridge Decks: A Preliminary Investigation across U.S. Climate Zones. Case Stud. Constr. Mater. 2025, 22, e04502. [Google Scholar]
  3. Teng, S.; Liu, Z.; Li, X. Improved YOLOv3-Based Bridge Surface Defect Detection by Combining High- and Low-Resolution Feature Images. Buildings 2022, 12, 1225. [Google Scholar] [CrossRef]
  4. Sohaib, M.; Arif, M.; Kim, J.-M. Evaluating YOLO Models for Efficient Crack Detection in Concrete Structures Using Transfer Learning. Buildings 2024, 14, 3928. [Google Scholar] [CrossRef]
  5. Faris, N.; Zayed, T.; Fares, A. Review of Condition Rating and Deterioration Modeling Approaches for Concrete Bridges. Buildings 2025, 15, 219. [Google Scholar] [CrossRef]
  6. Shahin, M.; Chen, F.F.; Maghanaki, M.; Hosseinzadeh, A.; Zand, N.; Khodadadi Koodiani, H. Improving the Concrete Crack Detection Process via a Hybrid Visual Transformer Algorithm. Sensors 2024, 24, 3247. [Google Scholar] [CrossRef]
  7. Chen, W.; He, Z.; Zhang, J. Online Monitoring of Crack Dynamic Development Using Attention-Based Deep Networks. Autom. Constr. 2023, 154, 105022. [Google Scholar]
  8. Jiang, S.; Zhang, J.; Wang, W.; Wang, Y. Automatic Inspection of Bridge Bolts Using Unmanned Aerial Vision and Adaptive Scale Unification-Based Deep Learning. Remote Sens. 2023, 15, 328. [Google Scholar] [CrossRef]
  9. Mirzazade, A.; Popescu, C.; Blanksvärd, T.; Täljsten, B. Workflow for Off-Site Bridge Inspection Using Automatic Damage Detection-Case Study of the Pahtajokk Bridge. Remote Sens. 2021, 13, 2665. [Google Scholar] [CrossRef]
  10. Abdel-Qader, I.; Abudayyeh, O.; Kelly, M.E. Analysis of Edge-Detection Techniques for Crack Identification in Bridges. J. Comput. Civ. Eng. 2003, 17, 255–263. [Google Scholar]
  11. Zhang, A.; Wang, K.C.P.; Fei, Y.; Liu, Y.; Chen, C.; Yang, G.; Li, J.Q.; Yang, E.; Qiu, S. Automated Pixel-Level Pavement Crack Detection on 3D Asphalt Surfaces with a Recurrent Neural Network. Comput.-Aided Civ. Infrastruct. Eng. 2019, 34, 213–229. [Google Scholar] [CrossRef]
  12. Ren, S.; He, K.; Girshick, R.; Sun, J. Faster R-CNN: Towards Real-Time Object Detection with Region Proposal Networks. IEEE Trans. Pattern Anal. Mach. Intell. 2017, 39, 1137–1149. [Google Scholar]
  13. Liu, Z.; Yeoh, J.K.W.; Gu, X.; Dong, Q.; Chen, Y.; Wu, W.; Wang, L.; Wang, D. Automatic Pixel-Level Detection of Vertical Cracks in Asphalt Pavement Based on GPR Investigation and Improved Mask R-CNN. Autom. Constr. 2023, 146, 104689. [Google Scholar]
  14. Tran, T.S.; Nguyen, S.D.; Lee, H.J.; Tran, V.P. Advanced Crack Detection and Segmentation on Bridge Decks Using Deep Learning. Constr. Build. Mater. 2023, 400, 132839. [Google Scholar] [CrossRef]
  15. Zhang, J.; Qian, S.; Tan, C. Automated Bridge Surface Crack Detection and Segmentation Using Computer Vision-Based Deep Learning Model. Eng. Appl. Artif. Intell. 2022, 115, 105225. [Google Scholar]
  16. Qiu, Q.; Lau, D. Real-Time Detection of Cracks in Tiled Sidewalks Using YOLO-Based Method Applied to Unmanned Aerial Vehicle (UAV) Images. Autom. Constr. 2023, 147, 104745. [Google Scholar]
  17. Li, J.; Yuan, C.; Wang, X. Real-Time Instance-Level Detection of Asphalt Pavement Distress Combining Space-to-Depth (SPD) YOLO and Omni-Scale Network (OSNet). Autom. Constr. 2023, 155, 105062. [Google Scholar]
  18. Meng, S.; Gao, Z.; Zhou, Y.; He, B.; Djerrad, A. Real-time Automatic Crack Detection Method Based on Drone. Comput.-Aided Civ. Infrastruct. Eng. 2023, 38, 849–872. [Google Scholar]
  19. Jiang, S.; Zhang, Y.; Wang, F.; Xu, Y. Three-Dimensional Reconstruction and Damage Localization of Bridge Undersides Based on Close-Range Photography Using UAV. Meas. Sci. Technol. 2025, 36, 015423. [Google Scholar] [CrossRef]
  20. Chen, J.; Lu, W.; Lou, J. Automatic Concrete Defect Detection and Reconstruction by Aligning Aerial Images onto Semantic-rich Building Information Model. Comput.-Aided Civ. Infrastruct. Eng. 2023, 38, 1079–1098. [Google Scholar]
  21. Perry, B.J.; Guo, Y.; Atadero, R.; Van De Lindt, J.W. Streamlined Bridge Inspection System Utilizing Unmanned Aerial Vehicles (UAVs) and Machine Learning. Measurement 2020, 164, 108048. [Google Scholar] [CrossRef]
  22. Han, Q.; Liu, X.; Xu, J. Detection and Location of Steel Structure Surface Cracks Based on Unmanned Aerial Vehicle Images. J. Build. Eng. 2022, 50, 104098. [Google Scholar]
  23. Jiang, S.; Zhang, J. Real-time Crack Assessment Using Deep Neural Networks with Wall-climbing Unmanned Aerial System. Comput.-Aided Civ. Infrastruct. Eng. 2020, 35, 549–564. [Google Scholar]
  24. Lei, B.; Ren, Y.; Wang, N.; Huo, L.; Song, G. Design of a New Low-Cost Unmanned Aerial Vehicle and Vision-Based Concrete Crack Inspection Method. Struct. Health Monit. 2020, 19, 1871–1883. [Google Scholar]
  25. Salaan, C.J.O.; Okada, Y.; Mizutani, S.; Ishii, T.; Koura, K.; Ohno, K.; Tadokoro, S. Close Visual Bridge Inspection Using a UAV with a Passive Rotating Spherical Shell. J. Field Robot. 2018, 35, 850–867. [Google Scholar] [CrossRef]
  26. Ding, W.; Yang, H.; Yu, K.; Shu, J. Crack Detection and Quantification for Concrete Structures Using UAV and Transformer. Autom. Constr. 2023, 152, 104929. [Google Scholar] [CrossRef]
  27. Ong, J.C.H.; Ismadi, M.-Z.P.; Wang, X. A Hybrid Method for Pavement Crack Width Measurement. Measurement 2022, 197, 111260. [Google Scholar] [CrossRef]
  28. He, X.; Tang, Z.; Deng, Y.; Zhou, G.; Wang, Y.; Li, L. UAV-Based Road Crack Object-Detection Algorithm. Autom. Constr. 2023, 154, 105014. [Google Scholar] [CrossRef]
  29. Chaiyasarn, K.; Buatik, A.; Mohamad, H.; Zhou, M.; Kongsilp, S.; Poovarodom, N. Integrated Pixel-Level CNN-FCN Crack Detection via Photogrammetric 3D Texture Mapping of Concrete Structures. Autom. Constr. 2022, 140, 104388. [Google Scholar] [CrossRef]
  30. Kalfarisi, R.; Wu, Z.Y.; Soh, K. Crack Detection and Segmentation Using Deep Learning with 3D Reality Mesh Model for Quantitative Assessment and Integrated Visualization. J. Comput. Civ. Eng. 2020, 34, 04020010. [Google Scholar] [CrossRef]
  31. Wang, F.; Zou, Y.; Del Rey Castillo, E.; Lim, J.B.P. Optimal UAV Image Overlap for Photogrammetric 3D Reconstruction of Bridges. IOP Conf. Ser. Earth Environ. Sci. 2022, 1101, 022052. [Google Scholar]
  32. Feng, C.-Q.; Li, B.-L.; Liu, Y.-F.; Zhang, F.; Yue, Y.; Fan, J.-S. Crack Assessment Using Multi-Sensor Fusion Simultaneous Localization and Mapping (SLAM) and Image Super-Resolution for Bridge Inspection. Autom. Constr. 2023, 155, 105047. [Google Scholar]
  33. Martínez-Espejo Zaragoza, I.; Caroti, G.; Piemonte, A.; Riedel, B.; Tengen, D.; Niemeier, W. Structure from Motion (SfM) Processing of UAV Images and Combination with Terrestrial Laser Scanning, Applied for a 3D-Documentation in a Hazardous Situation. Geomat. Nat. Hazards Risk 2017, 8, 1492–1504. [Google Scholar]
  34. Saleem, M.R.; Park, J.-W.; Lee, J.-H.; Jung, H.-J.; Sarwar, M.Z. Instant Bridge Visual Inspection Using an Unmanned Aerial Vehicle by Image Capturing and Geo-Tagging System and Deep Convolutional Neural Network. Struct. Health Monit. 2021, 20, 1760–1777. [Google Scholar] [CrossRef]
  35. Lin, J.J.; Ibrahim, A.; Sarwade, S.; Golparvar-Fard, M. Bridge Inspection with Aerial Robots: Automating the Entire Pipeline of Visual Data Capture, 3D Mapping, Defect Detection, Analysis, and Reporting. J. Comput. Civ. Eng. 2021, 35, 04020064. [Google Scholar]
  36. Liu, Y.; Nie, X.; Fan, J.; Liu, X. Image-based Crack Assessment of Bridge Piers Using Unmanned Aerial Vehicles and Three-dimensional Scene Reconstruction. Comput.-Aided Civ. Infrastruct. Eng. 2020, 35, 511–529. [Google Scholar]
  37. Zhou, L.; Jiang, Y.; Jia, H.; Zhang, L.; Xu, F.; Tian, Y.; Ma, Z.; Liu, X.; Guo, S.; Wu, Y.; et al. UAV Vision-Based Crack Quantification and Visualization of Bridges: System Design and Engineering Application. Struct. Health Monit. 2024, 24, 1083–1100. [Google Scholar] [CrossRef]
  38. Tavasci, L.; Nex, F.; Gandolfi, S. Reliability of Real-Time Kinematic (RTK) Positioning for Low-Cost Drones’ Navigation across Global Navigation Satellite System (GNSS) Critical Environments. Sensors 2024, 24, 6096. [Google Scholar] [CrossRef]
  39. Cheng, Z.; Gong, W.; Tang, H.; Juang, C.H.; Deng, Q.; Chen, J.; Ye, X. UAV Photogrammetry-Based Remote Sensing and Preliminary Assessment of the Behavior of a Landslide in Guizhou, China. Eng. Geol. 2021, 289, 106172. [Google Scholar]
  40. Tan, Y.; Li, G.; Cai, R.; Ma, J.; Wang, M. Mapping and Modelling Defect Data from UAV Captured Images to BIM for Building External Wall Inspection. Autom. Constr. 2022, 139, 104284. [Google Scholar]
  41. Wang, W.; Dai, J.; Chen, Z.; Huang, Z.; Li, Z.; Zhu, X.; Hu, X.; Lu, T.; Lu, L.; Li, H.; et al. InternImage: Exploring Large-Scale Vision Foundation Models with Deformable Convolutions. In Proceedings of the 2023 IEEE/CVF Conference on Computer Vision and Pattern Recognition (CVPR), Vancouver, BC, Canada, 17–24 June 2023; IEEE: New York, NY, USA, 2023; pp. 14408–14419. [Google Scholar]
  42. Wang, S.; Dong, Q.; Chen, X.; Chu, Z.; Li, R.; Hu, J.; Gu, X. Measurement of Asphalt Pavement Crack Length Using YOLO V5-BiFPN. J. Infrastruct. Syst. 2024, 30, 04024005. [Google Scholar] [CrossRef]
  43. Ouyang, D.; He, S.; Zhang, G.; Luo, M.; Guo, H.; Zhan, J.; Huang, Z. Efficient Multi-Scale Attention Module with Cross-Spatial Learning. In Proceedings of the ICASSP 2023–2023 IEEE International Conference on Acoustics, Speech and Signal Processing (ICASSP), Rhodes Island, Greece, 4–10 June 2023; IEEE: New York, NY, USA, 2023; pp. 1–5. [Google Scholar]
  44. Zhao, S.; Kang, F.; Li, J.; Ma, C. Structural Health Monitoring and Inspection of Dams Based on UAV Photogrammetry with Image 3D Reconstruction. Autom. Constr. 2021, 130, 103832. [Google Scholar] [CrossRef]
  45. Zhao, S.; Kang, F.; Li, J. Intelligent Segmentation Method for Blurred Cracks and 3D Mapping of Width Nephograms in Concrete Dams Using UAV Photogrammetry. Autom. Constr. 2024, 157, 105145. [Google Scholar] [CrossRef]
  46. Ronneberger, O.; Fischer, P.; Brox, T. U-Net: Convolutional Networks for Biomedical Image Segmentation. In Proceedings of the Medical Image Computing and Computer-Assisted Intervention—MICCAI 2015, Munich, Germany, 5–9 October 2025. [Google Scholar]
  47. Long, J.; Shelhamer, E.; Darrell, T. Fully Convolutional Networks for Semantic Segmentation. In Proceedings of the 2015 IEEE Conference on Computer Vision and Pattern Recognition (CVPR), Boston, MA, USA, 7–12 June 2015; pp. 3431–3440. [Google Scholar]
  48. Yurtkulu, S.C.; Şahin, Y.H.; Unal, G. Semantic Segmentation with Extended DeepLabv3 Architecture. In Proceedings of the 2019 27th Signal Processing and Communications Applications Conference (SIU), Sivas, Turkey, 24–26 April 2019; IEEE: New York, NY, USA; pp. 1–4. [Google Scholar]
  49. Hussain, M. YOLOv1 to v8: Unveiling Each Variant–A Comprehensive Review of YOLO. IEEE Access 2024, 12, 42816–42833. [Google Scholar] [CrossRef]
  50. CJJT233-2015; Technical Code for Test and Evaluation of City Bridges. Ministry of Housing and Urban-Rural Development of the People’s Republic of China: Beijing, China, 2015.
Figure 1. Framework of the proposed method.
Buildings 15 01117 g001
Figure 2. The transformation of the pixel coordinate system to the world coordinate system.
Buildings 15 01117 g002
Figure 3. Architecture of the DBE-YOLO.
Buildings 15 01117 g003
Figure 4. Structure diagram of DBE-YOLO and modules. (a) C2f_DCNv3; (b) BiFPN; and (c) EMA.
Buildings 15 01117 g004
Figure 5. Crack width calculation for skeletons without burrs.
Buildings 15 01117 g005
Figure 6. Crack detection system.
Buildings 15 01117 g006
Figure 7. Detailed procedure of the proposed method.
Buildings 15 01117 g007
Figure 8. Examples of datasets: (a) training data and (b) validation data with ground truth.
Buildings 15 01117 g008
Figure 9. Precision and Loss over epochs. (a) Precision and (b) Loss.
Buildings 15 01117 g009
Figure 10. Overview of concrete beam testing.
Buildings 15 01117 g010
Figure 11. Verification of crack width measurements.
Buildings 15 01117 g011
Figure 12. Bridge description and testing.
Buildings 15 01117 g012
Figure 13. A 3D model of the test bridge.
Buildings 15 01117 g013
Figure 14. A 3D model and crack evaluation of the test bridge.
Buildings 15 01117 g014
Table 1. Experimental environments and training parameters.
Environmental ItemVersionParameterValue
OSWindows 11Input shape640 × 640
Python3.8Epoch200
PyTorch1.12.0Batch Size16
CUDA12.2OptimizerAdam
CPUIntel i9-13900 KFMomentum0.9
RAM96 GBLearning rate0.0001
GPURTX 3090(24 GB)Patience30
Table 2. Comparison with other standard networks (%).
Network Structure P R F 1
U-Net92.7382.7787.46
FCN90.1381.7085.70
DeepLabv3+90.8985.7488.23
YOLOv581.4969.2574.87
YOLOv893.6077.3584.71
DBE-YOLO96.7981.5488.51
Table 3. Ablation experiment results of DBE-YOLO (%).
GroupMethod P R A P 0.5 A P 0.5 : 0.95 F 1
1YOLOv8m-seg93.6077.3581.6369.3684.71
2+ P289.1477.4681.5270.5282.89
3+ P2 + EMA95.3076.6683.7874.4284.97
4+ P2 + BiFPN94.4474.8782.6672.2583.53
5+ P2 + DCNv388.7375.4780.6670.7581.56
6+ P2 + EMA + BiFPN95.5977.2784.8576.4685.46
7+ P2 + EMA + DCNv391.6482.4685.3576.1086.81
8+ P2 + BiFPN + DCNv395.9176.2184.4173.9384.93
9DBE-YOLO96.7981.5487.7478.5688.51
Table 4. Comparison results of crack widths.
NumberProposed Method (mm)Width (mm)AE (mm)RE (%)
11.0621.020.0424.11
22.4842.54−0.0562.21
31.0270.930.09710.43
42.9322.860.0722.51
54.7014.76−0.0591.23
65.5205.280.244.55
71.6861.550.1368.77
82.5252.470.0552.23
ME///4.51
SD///3.35
Table 5. Comparison of crack width measurements on the bridge.
NumberProposed Method (mm)Width (mm)AE (mm)RE (%)
15.6725.83−0.1582.71
220.96022.32−1.3606.09
36.6877.53−0.84311.20
415.22914.570.6594.52
518.93120.34−1.4096.93
611.11010.460.6506.21
ME///6.28
SD///2.85
Disclaimer/Publisher’s Note: The statements, opinions and data contained in all publications are solely those of the individual author(s) and contributor(s) and not of MDPI and/or the editor(s). MDPI and/or the editor(s) disclaim responsibility for any injury to people or property resulting from any ideas, methods, instructions or products referred to in the content.

