Article

Critical Region Identification of Cable-Stayed Bridges Based on Eigensensitivity

School of Civil Engineering and Architecture, Wuhan Institute of Technology, Hubei Provincial Engineering Research Center for Green Civil Engineering Materials and Structures, Wuhan 430074, China
*
Author to whom correspondence should be addressed.
Buildings 2025, 15(7), 1038; https://doi.org/10.3390/buildings15071038
Submission received: 19 February 2025 / Revised: 17 March 2025 / Accepted: 19 March 2025 / Published: 24 March 2025

Abstract

Conducting health monitoring on entire large-scale structures is challenging. Compared to non-critical regions, local damage in critical regions significantly impacts the overall structural performance, with even minor damage posing a threat to structural safety. Therefore, identifying the critical regions of a structure is essential to enable prioritized and focused monitoring, evaluation, and management. This paper proposes a method for identifying critical regions in cable-stayed bridges based on dynamic eigensensitivity analysis. The method integrates the sensitivity of multi-order eigenvalues and eigenvectors with respect to elemental stiffness parameters, designating regions with high sensitivity values as critical. The results demonstrate that the midspan region of the main girder, the longest stay cable, and the junctions between the upper, middle, and lower bridge towers and the foundation are identified as critical regions in a cable-stayed bridge. These findings are consistent with established engineering experience. The proposed critical region identification method holds significant potential for improving the efficiency of health monitoring and assessment, as well as optimizing the allocation of manpower and material resources.

1. Introduction

Currently, civil engineers design structural components based on their ultimate bearing capacity or normal use state. However, this design approach fails to account for the varying impacts of different components on overall structural performance. The failure of certain critical components can lead to the collapse of the entire structure, making the determination of component importance a fundamental aspect of addressing such issues [1,2]. Component importance refers to the influence of individual components on the performance of the overall structural system, encompassing multiple factors such as bearing capacity, reliability, stiffness, deformation, and stability [3]. The critical region is defined as the area where these important components are concentrated. Analogous to human health check-ups, which focus on critical organs such as the brain, heart, and liver, the assessment of structural health should prioritize critical regions. Following the collapses of notable bridges, including the Quebec Bridge, Tacoma Narrows Bridge, and I-35W Bridge, etc., the health monitoring of critical bridges has garnered increasing attention [4,5,6]. Advanced health monitoring technologies, such as machine learning algorithms and synthetic aperture radar interferometry, have been developed and integrated with various sensors to enhance monitoring capabilities [5,6,7]. Given the complexity of modern large-scale bridges, which feature numerous degrees of freedom, nodes, and elements, focusing health monitoring and damage identification efforts on critical regions rather than the entire structure can significantly reduce manpower and material costs [8,9,10]. Traditionally, the importance of components in structural systems has been assessed based on the principles of structural force transmission and long-term engineering experience. For instance, columns are deemed more critical than beams under traditional identification methods, leading to the seismic design principle of “strong columns and weak beams”. Similarly, in frame shear wall structures, shear walls are considered the primary lateral force-resisting components and are thus assigned greater importance than frames. However, these judgments heavily rely on the expertise and experience of engineering professionals.
To further quantify the evaluation of component importance, Abiona and Head [11] employed a random forest algorithm comprising multiple decision trees to assess the importance of bridge elements to the overall bridge condition. Their findings revealed that deck and rail elements are the most critical components across all bridge design types. Inkoom and Sobanjo [12] calculated the importance weights of bridge elements using an availability metric based on element failure time distribution parameters and repair rates. To account for structural plasticity and stiffness degradation, Lin et al. [13] measured the importance of structural elements by their impact on the elastic–plastic strain energy of the structure. Recognizing that the singularity of the global stiffness matrix reflects the structural safety status, Feng et al. [14] derived an element importance index based on the difference between the determinants of the tangent stiffness matrix before and after damage to the ith element. This method was applied to analyze critical elements in three types of truss structures. Building on the consensus that elements transferring higher loads within the load path are generally more critical, Cai et al. [15] evaluated the importance of truss system elements using eigenvalues of the stiffness matrix. Ma et al. [16] proposed a quantitative evaluation method for assessing the structural safety status of traditional courtyard-style timber buildings using an improved analytic hierarchy process. In this method, the component importance index is defined as the rate of change in structural strain energy caused by component alterations. Inkoom and Sobanjo [17] introduced a reliability importance index to measure the importance of bridge components. Liu et al. [18] developed a multi-indicator approach based on the slope degradation coefficient of incremental dynamic analysis curves, load capacity degradation coefficients, nested load capacity degradation coefficients, sensitivity coefficients, and fragility coefficients to evaluate the importance of components in truss string structures. To identify components that contribute most significantly to resisting external loads or stabilizing structural mechanisms, Xia and Wu [19] evaluated component importance based on the contribution of elemental stiffness to the subspaces of zero elastic stiffness and demand stiffness. Yuan et al. [20] predicted the importance of components in cable network antennas based on the sensitivity of mode displacements to the elastic modulus of the components.
Sensitivity analysis is a quantitative method for evaluating the impact of changes in individual elemental parameters on the overall performance of a structure. Eigensensitivity refers to the first-order partial derivative of the eigenvalues and eigenvectors of a structure with respect to its elemental stiffness parameters, reflecting the degree to which changes in elemental stiffness influence the overall dynamic properties (e.g., frequency and mode shape) [21]. Eigensensitivity has been widely applied in various fields, including damage identification [22,23,24,25], model-updating parameter selection [26,27], and optimal sensor placement [28,29]. Yin et al. [23] proposed an improved sensitivity-based model-updating and damage detection method, in which the sensitivity function is established by incorporating changes in mode shapes and eigenvalues, enabling more accurate identification of localized damage. Jiang et al. [26] introduced a novel multistage model-updating approach based on the sensitivity ranking of selected updating parameters, where parameters with similar sensitivity levels are updated simultaneously at the same stage. Chai et al. [28] investigated optimal sensor placement for bridge structures using an eigensensitivity-effective independence method. Additionally, eigensensitivity can serve as a basis for determining critical regions, as this index identifies which elemental parameter variations have the greatest impact on the dynamic properties of the structure.
Any structure can be regarded as a dynamic system characterized by structural parameters such as stiffness, mass, and damping. When damage or other abnormalities occur in the structure, its dynamic characteristics (e.g., mode shapes, frequencies, and damping) will also change. For instance, a reduction in structural stiffness typically results in a decrease in the natural frequency of the bridge and alterations in its mode shapes. Eigensolution sensitivity analysis involves calculating the first-order partial derivatives of the eigenvalues and eigenvectors (natural frequencies and mode shapes) of the structure with respect to its elemental stiffness parameters. This reflects the degree to which changes in elemental stiffness influence the overall dynamic characteristics (e.g., frequencies and mode shapes) of the structure. Therefore, by dynamically calculating the sensitivity coefficients of the elemental stiffness parameters in real time, critical regions for structural inspection and maintenance can be identified.
This paper proposes a critical region identification method for cable-stayed bridges based on dynamic eigensensitivity analysis, which integrates the sensitivity of multi-order eigenvalues and eigenvectors with respect to the elemental stiffness parameters, identifying regions with high sensitivity values as critical regions. Compared with the traditional experience-based identification method, the proposed method determines the critical regions based on structural dynamic properties and is both quantitative and objective.

2. Eigensensitivity-Based Critical Region Identification

Damage to some elements significantly influences the dynamic response of the entire structure. These elements are referred to as critical elements, and the area where they are located is called the critical region. Conversely, damage to other elements does not significantly alter the dynamic response of the structure, indicating that these elements are not critical from the perspective of vibration-based health monitoring. Eigensensitivity to elemental stiffness parameters reflects the sensitivity of the structure’s eigensolution (eigenvalues and eigenvectors) to element damage. Elements with higher eigensensitivity have a greater influence on the structure. It should be noted that eigensensitivity to prestressing force is not suitable for identifying critical regions, as a reduction in prestressing force does not affect the eigenvector [30]. In this section, a critical region identification method based on dynamic eigensensitivity is proposed.

2.1. Eigenvalue Sensitivity

The stiffness matrix of a structure is assembled by that of each element as
K = j = 1 L r j K j e
in which r j and K j e stand for the stiffness parameter and stiffness matrix of jth element, respectively. L stands for the number of elements of the structure.
The eigenequation of the structure has the form of
( K λ i M ) ϕ i = 0
in which M represents the structural mass matrix. λ i and ϕ i represent the ith order eigenvalue and eigenvector, respectively.
Differentiating the eigenequation (Equation (2)) with respect to the elemental stiffness parameter r j equates to
K r j λ i r j M ϕ i + K λ i M ϕ i r j = 0
Pre-multiply Equation (3) with ϕ i T and
ϕ i T K r j λ i r j M ϕ i + ϕ i T K λ i M ϕ i r j = 0
Substituting the relationship of ϕ i T M ϕ i = 0 and ϕ i T ( K λ i M ) = 0 into Equation (4) and re-arranging Equation (4) obtains
λ i r j = ϕ i T K j e ϕ i
λ i r j stands for the ith eigenvalue sensitivity with respect to the elemental stiffness parameter of the jth element.

2.2. Eigenvector Sensitivity

Re-arranging Equation (3) gives the form
K λ i M ϕ i r j = Y i r
Y i r = λ i r j M ϕ i K r j ϕ i
In Equation (6), ϕ i r j stands for the ith eigenvector sensitivity with respect to the elemental stiffness parameter of the jth element, which can be solved by using the Nelson method [31]. The steps of the Nelson method are as follows.
ϕ i r j is expressed as the sum of a homogeneous vector and a specific vector, as follows:
ϕ i r j = v i + c i ϕ i
in which c i stands for the coefficient of the ith eigenvector. Substituting Equation (7) into Equation (6) gives
K λ i M v i = Y i
Assume Equation (2) does not have a repeated solution, and the size of Equation (2) is equal to N × N. The rank of Equation (2) is equal to N − 1. To solve v i , the kth column and rank of K λ i M and the kth item of Y i r are set to zero, and the full rank equation of Equation (8) is obtained as
K λ i M 11 0 K λ i M 13 0 1 0 K λ i M 31 0 K λ i M 33 v i 1 v i k v i 3 = Y i 1 0 Y i 3
in which k is the row number of the matrix element in ϕ i . The v i is solved from Equation (10).
Differentiating the orthogonal relationship of ϕ i T M ϕ i = 0 with respect to the elemental stiffness parameter r j gives
2 ϕ i T M ϕ i r j = 0
Substituting Equation (8) into Equation (11) leads to
2 ϕ i T M v i + c i ϕ i = 0
The coefficient c i is solved from Equation (12) as
c i = ϕ i T M v i
Thus, the ith eigenvector sensitivity ϕ i r j is obtained according to Equations (10) and (13).

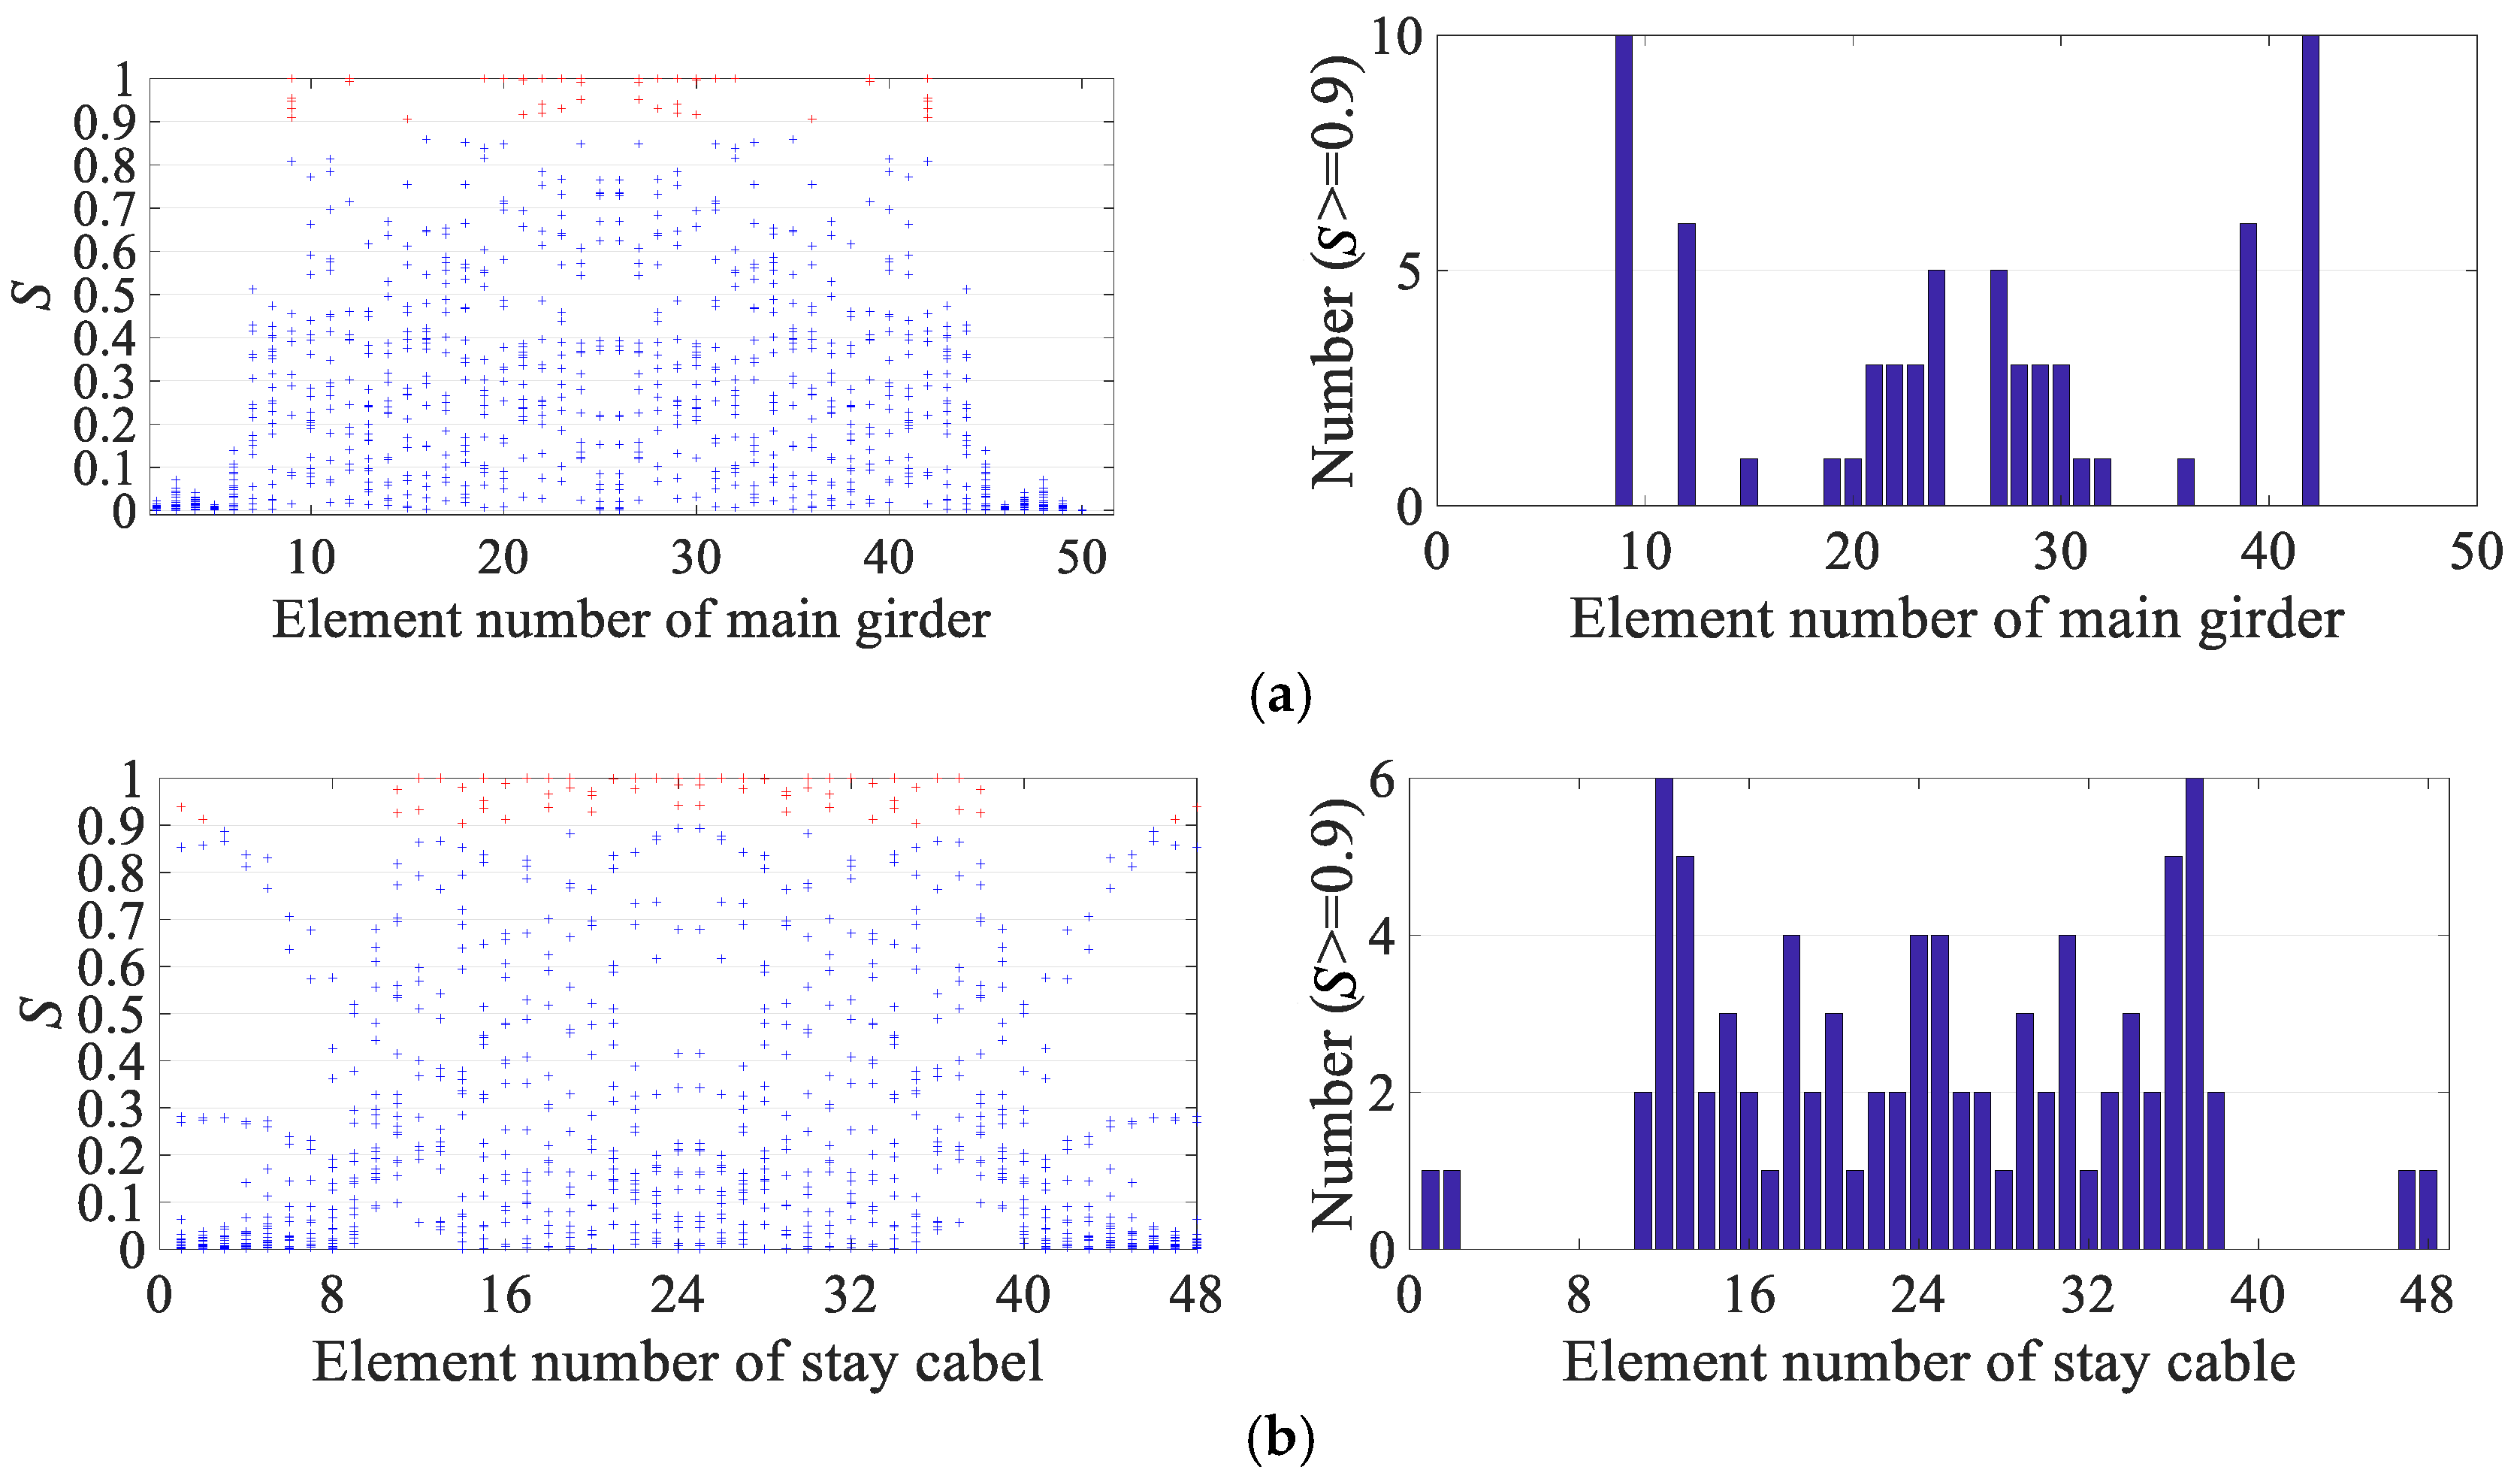
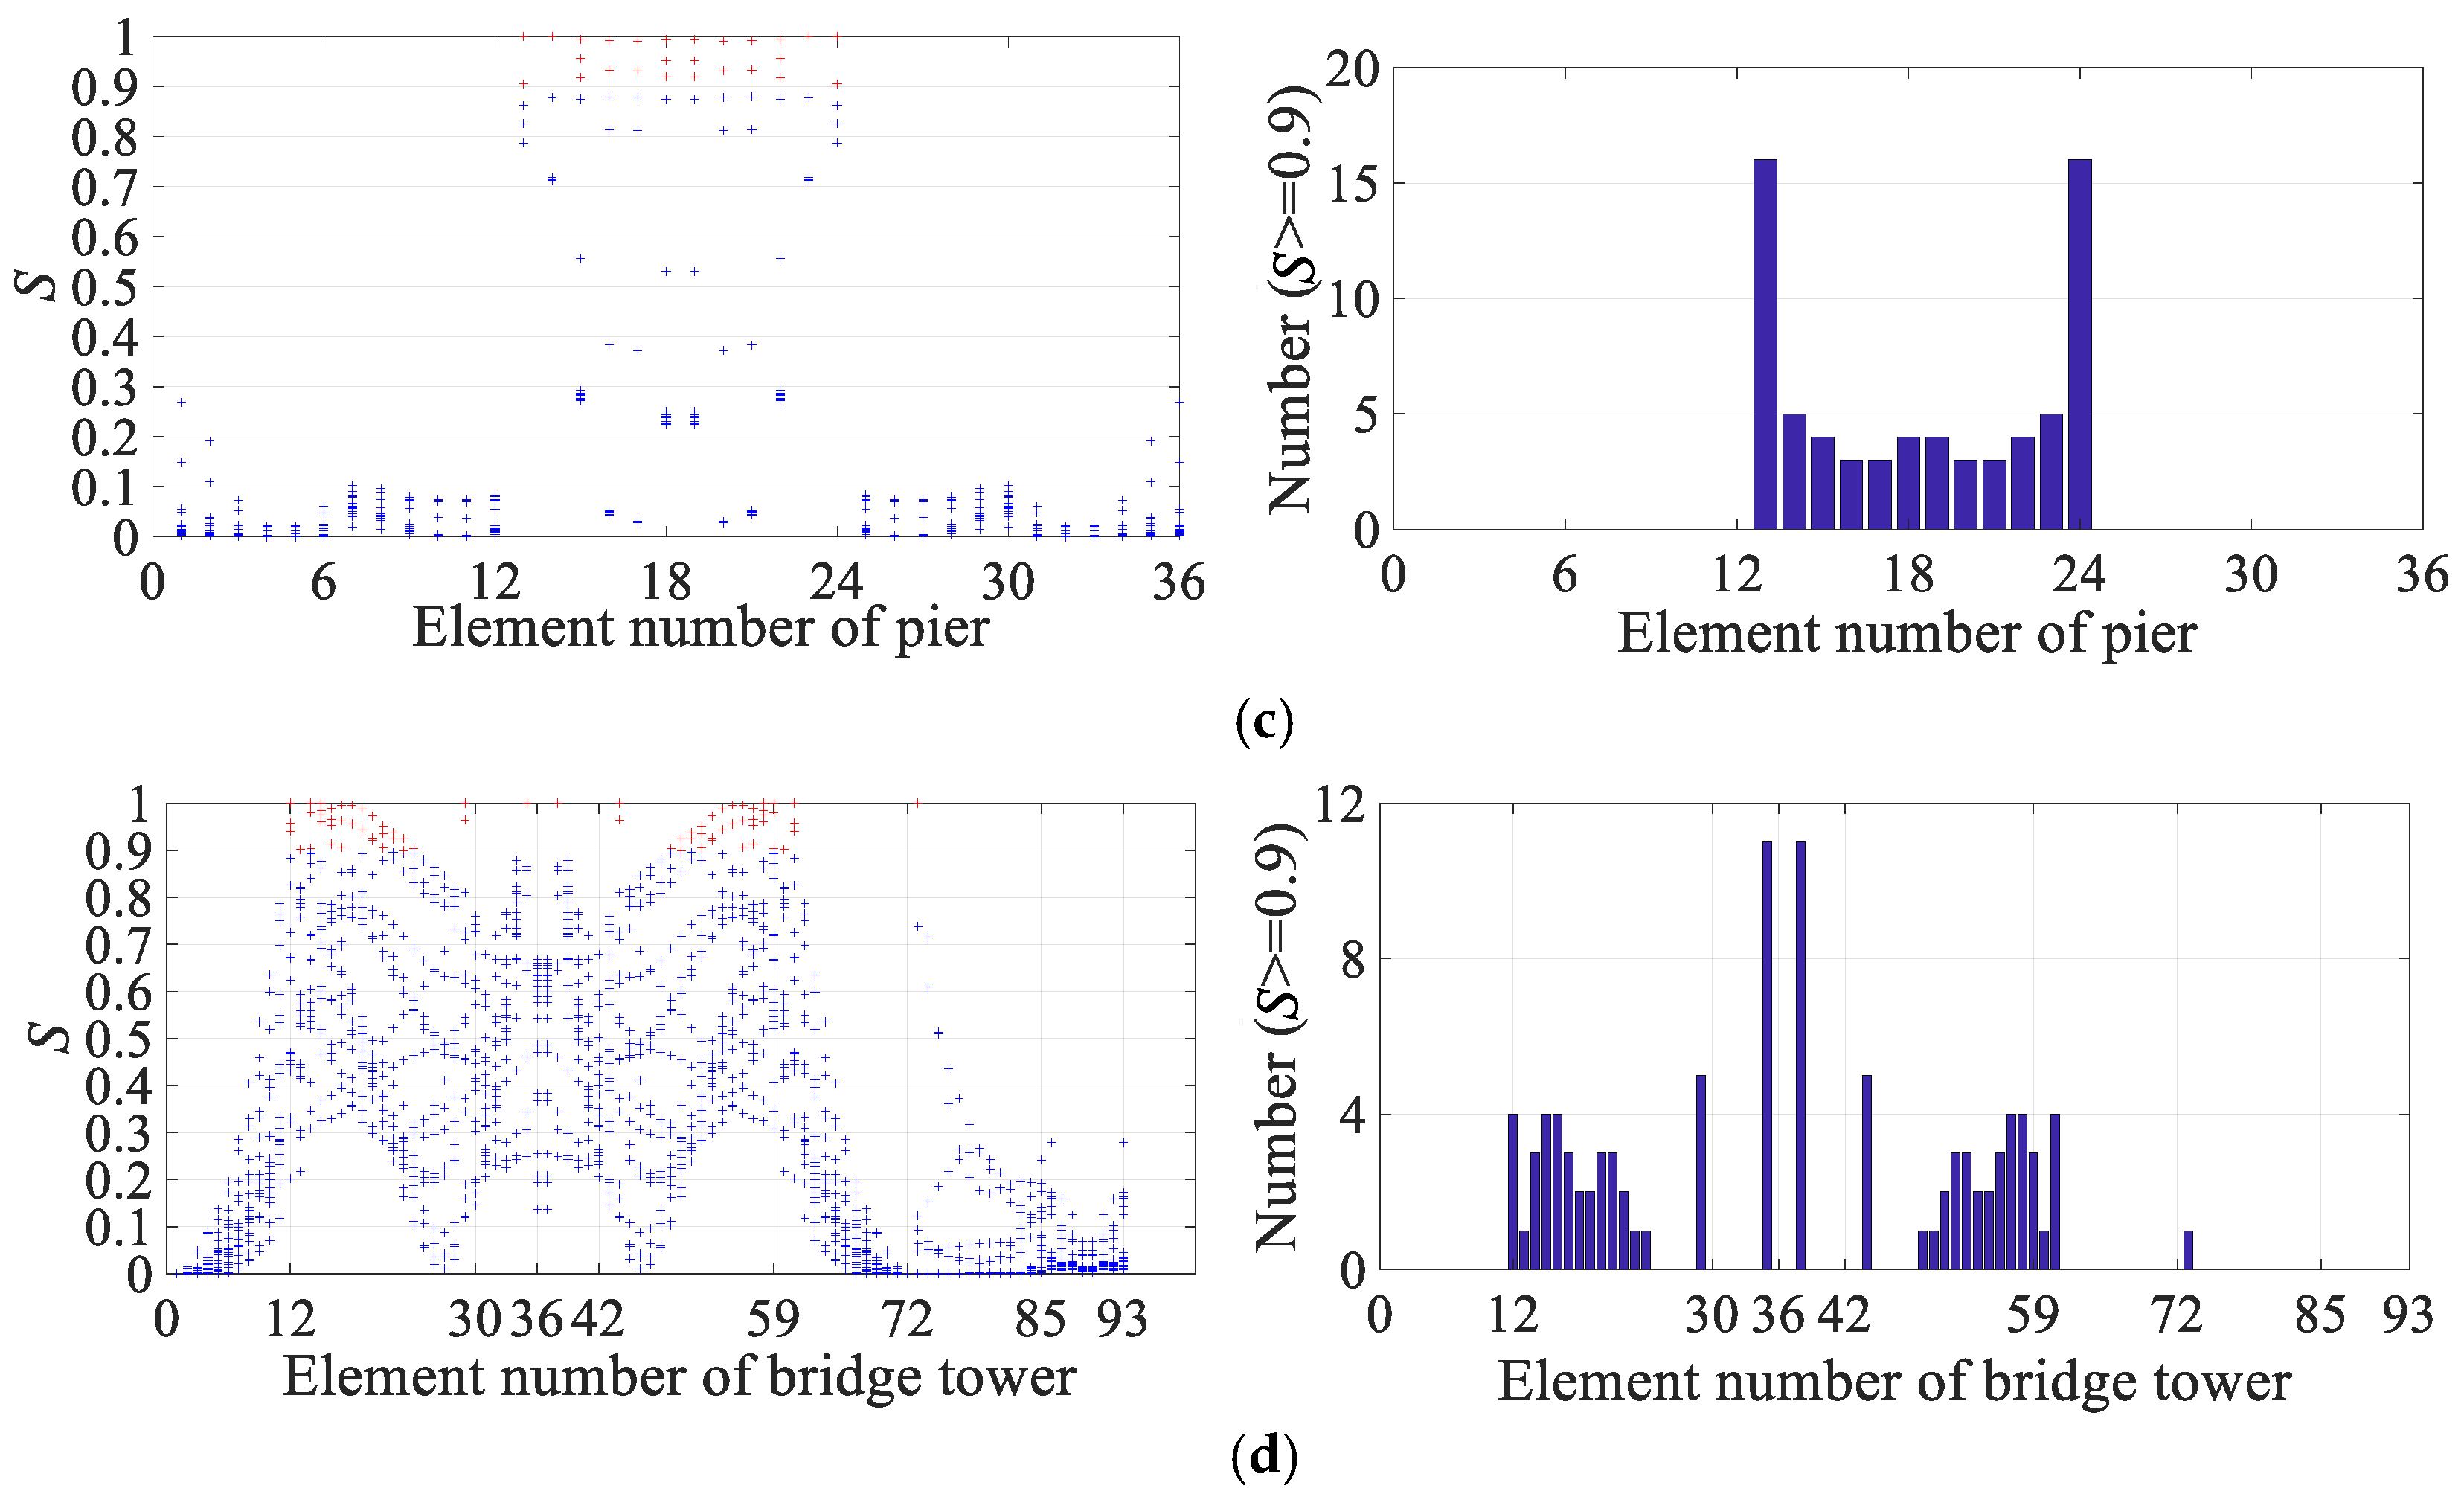
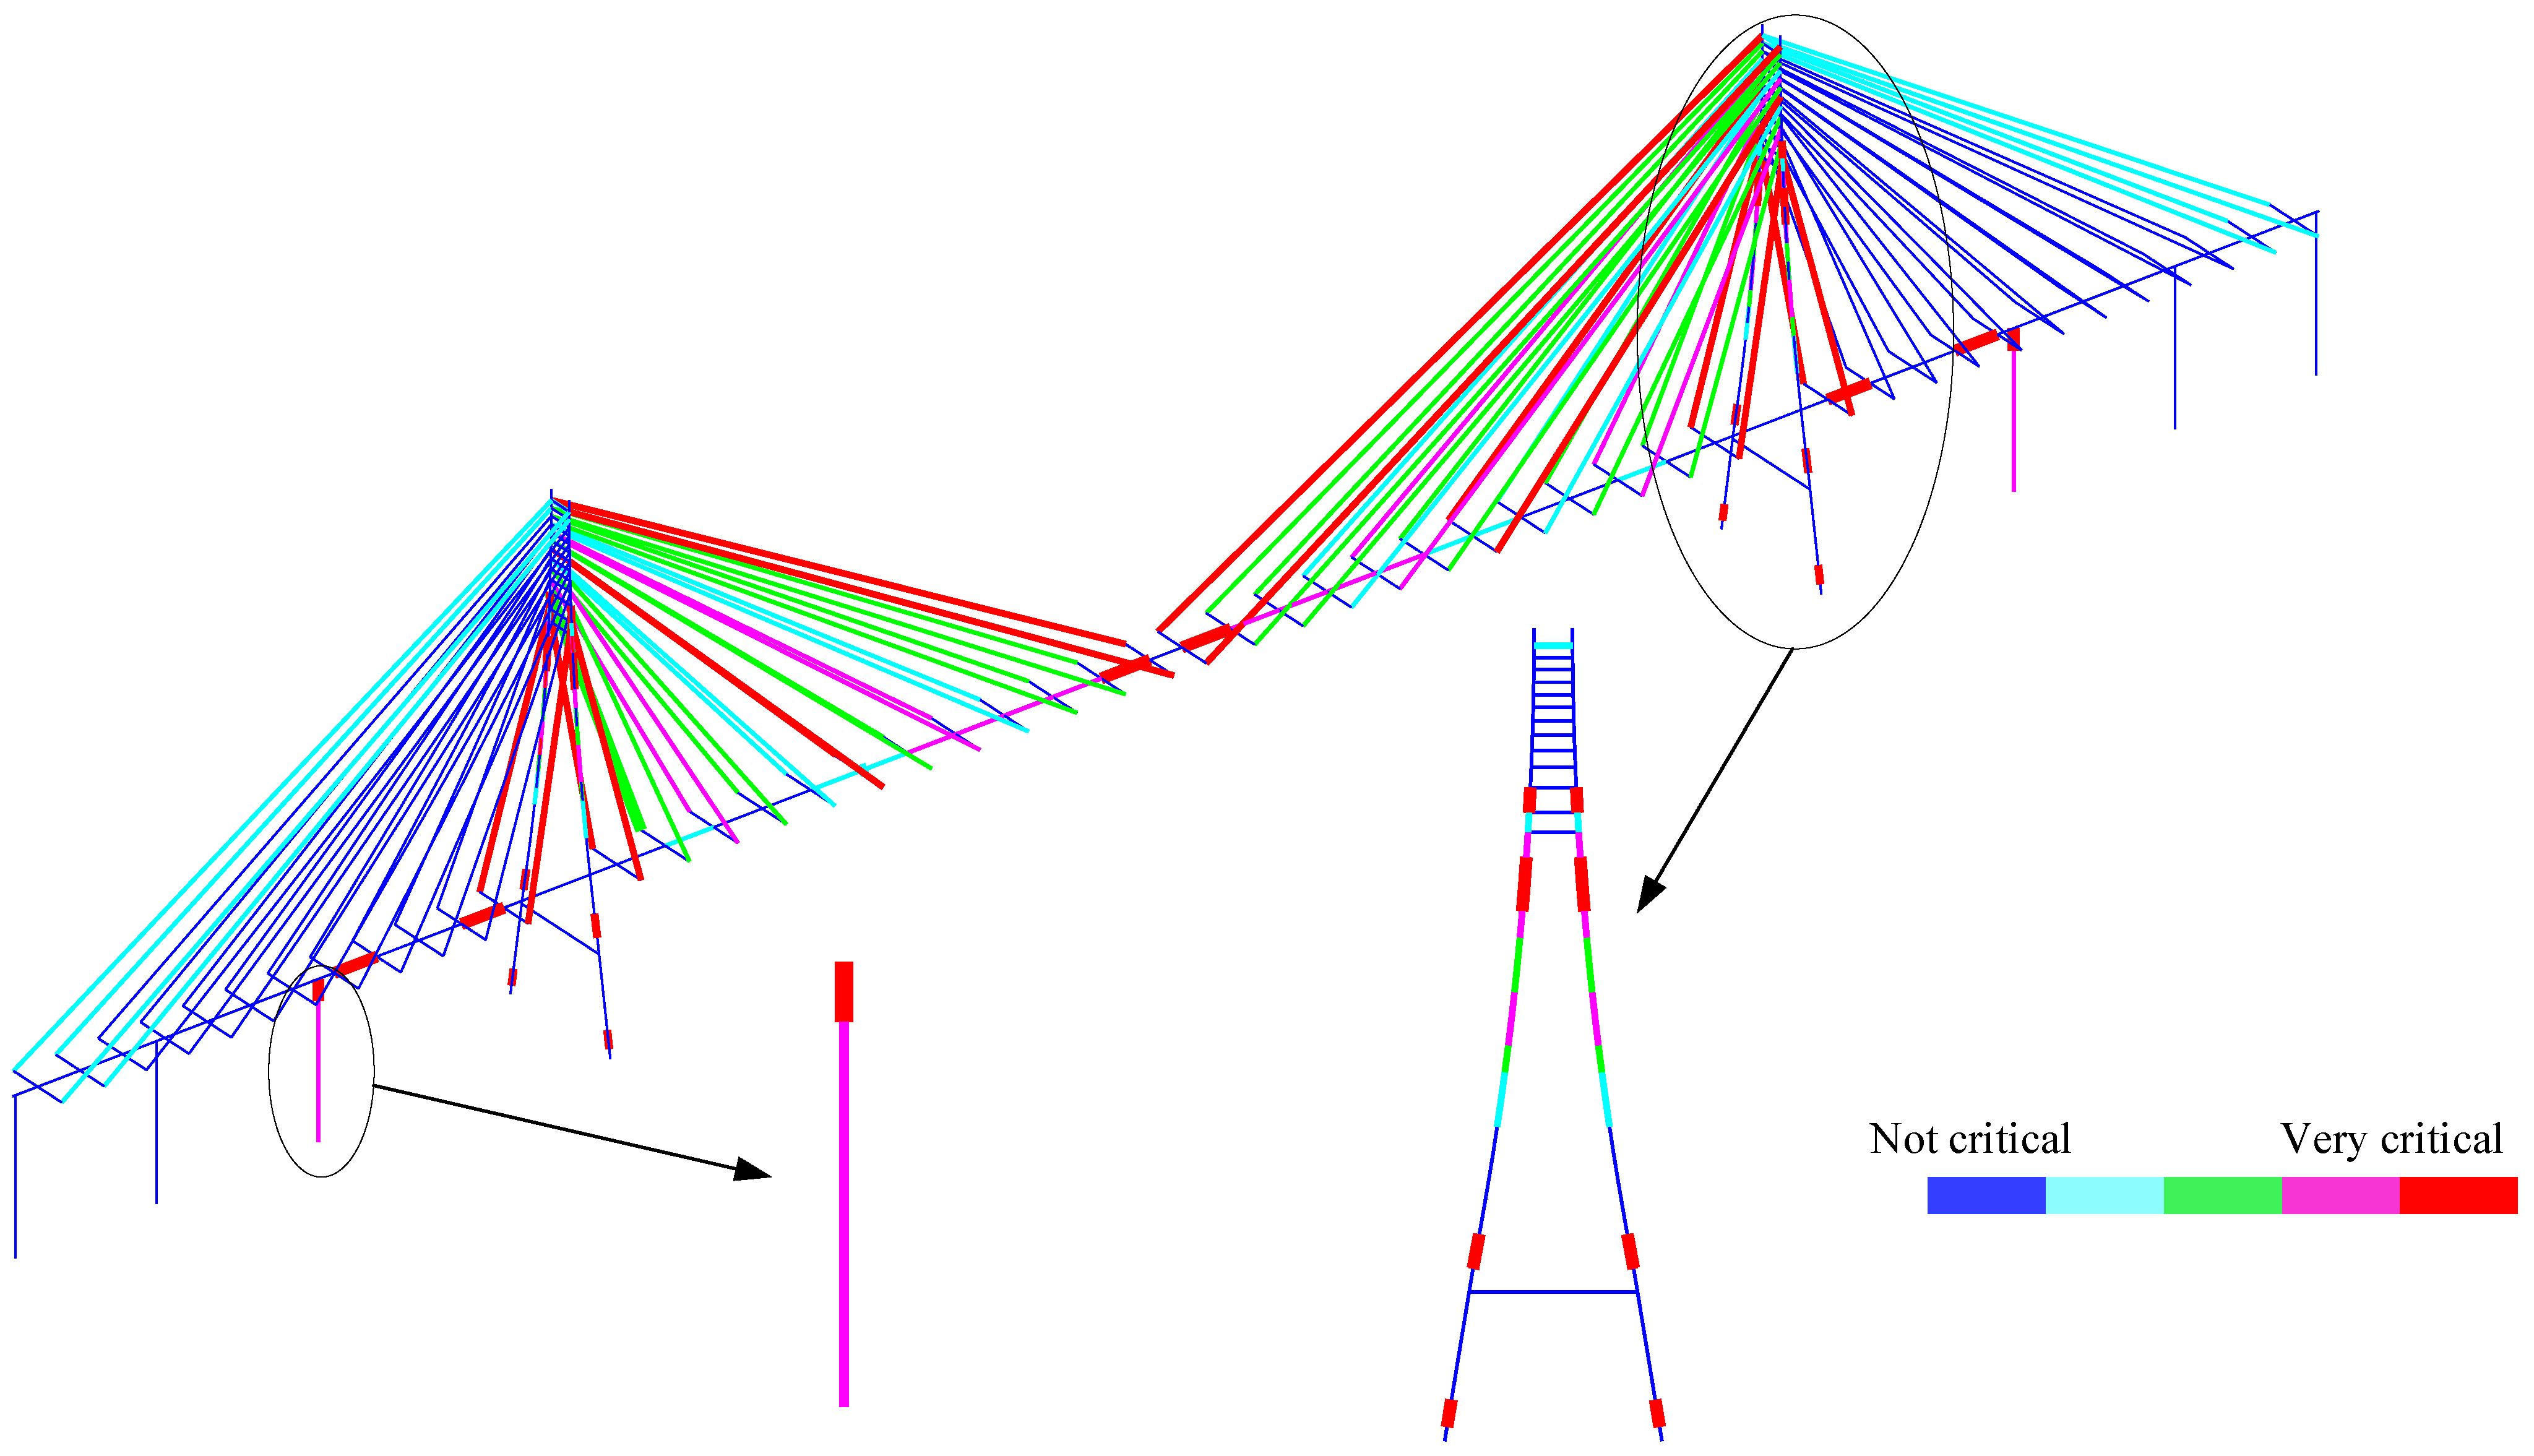
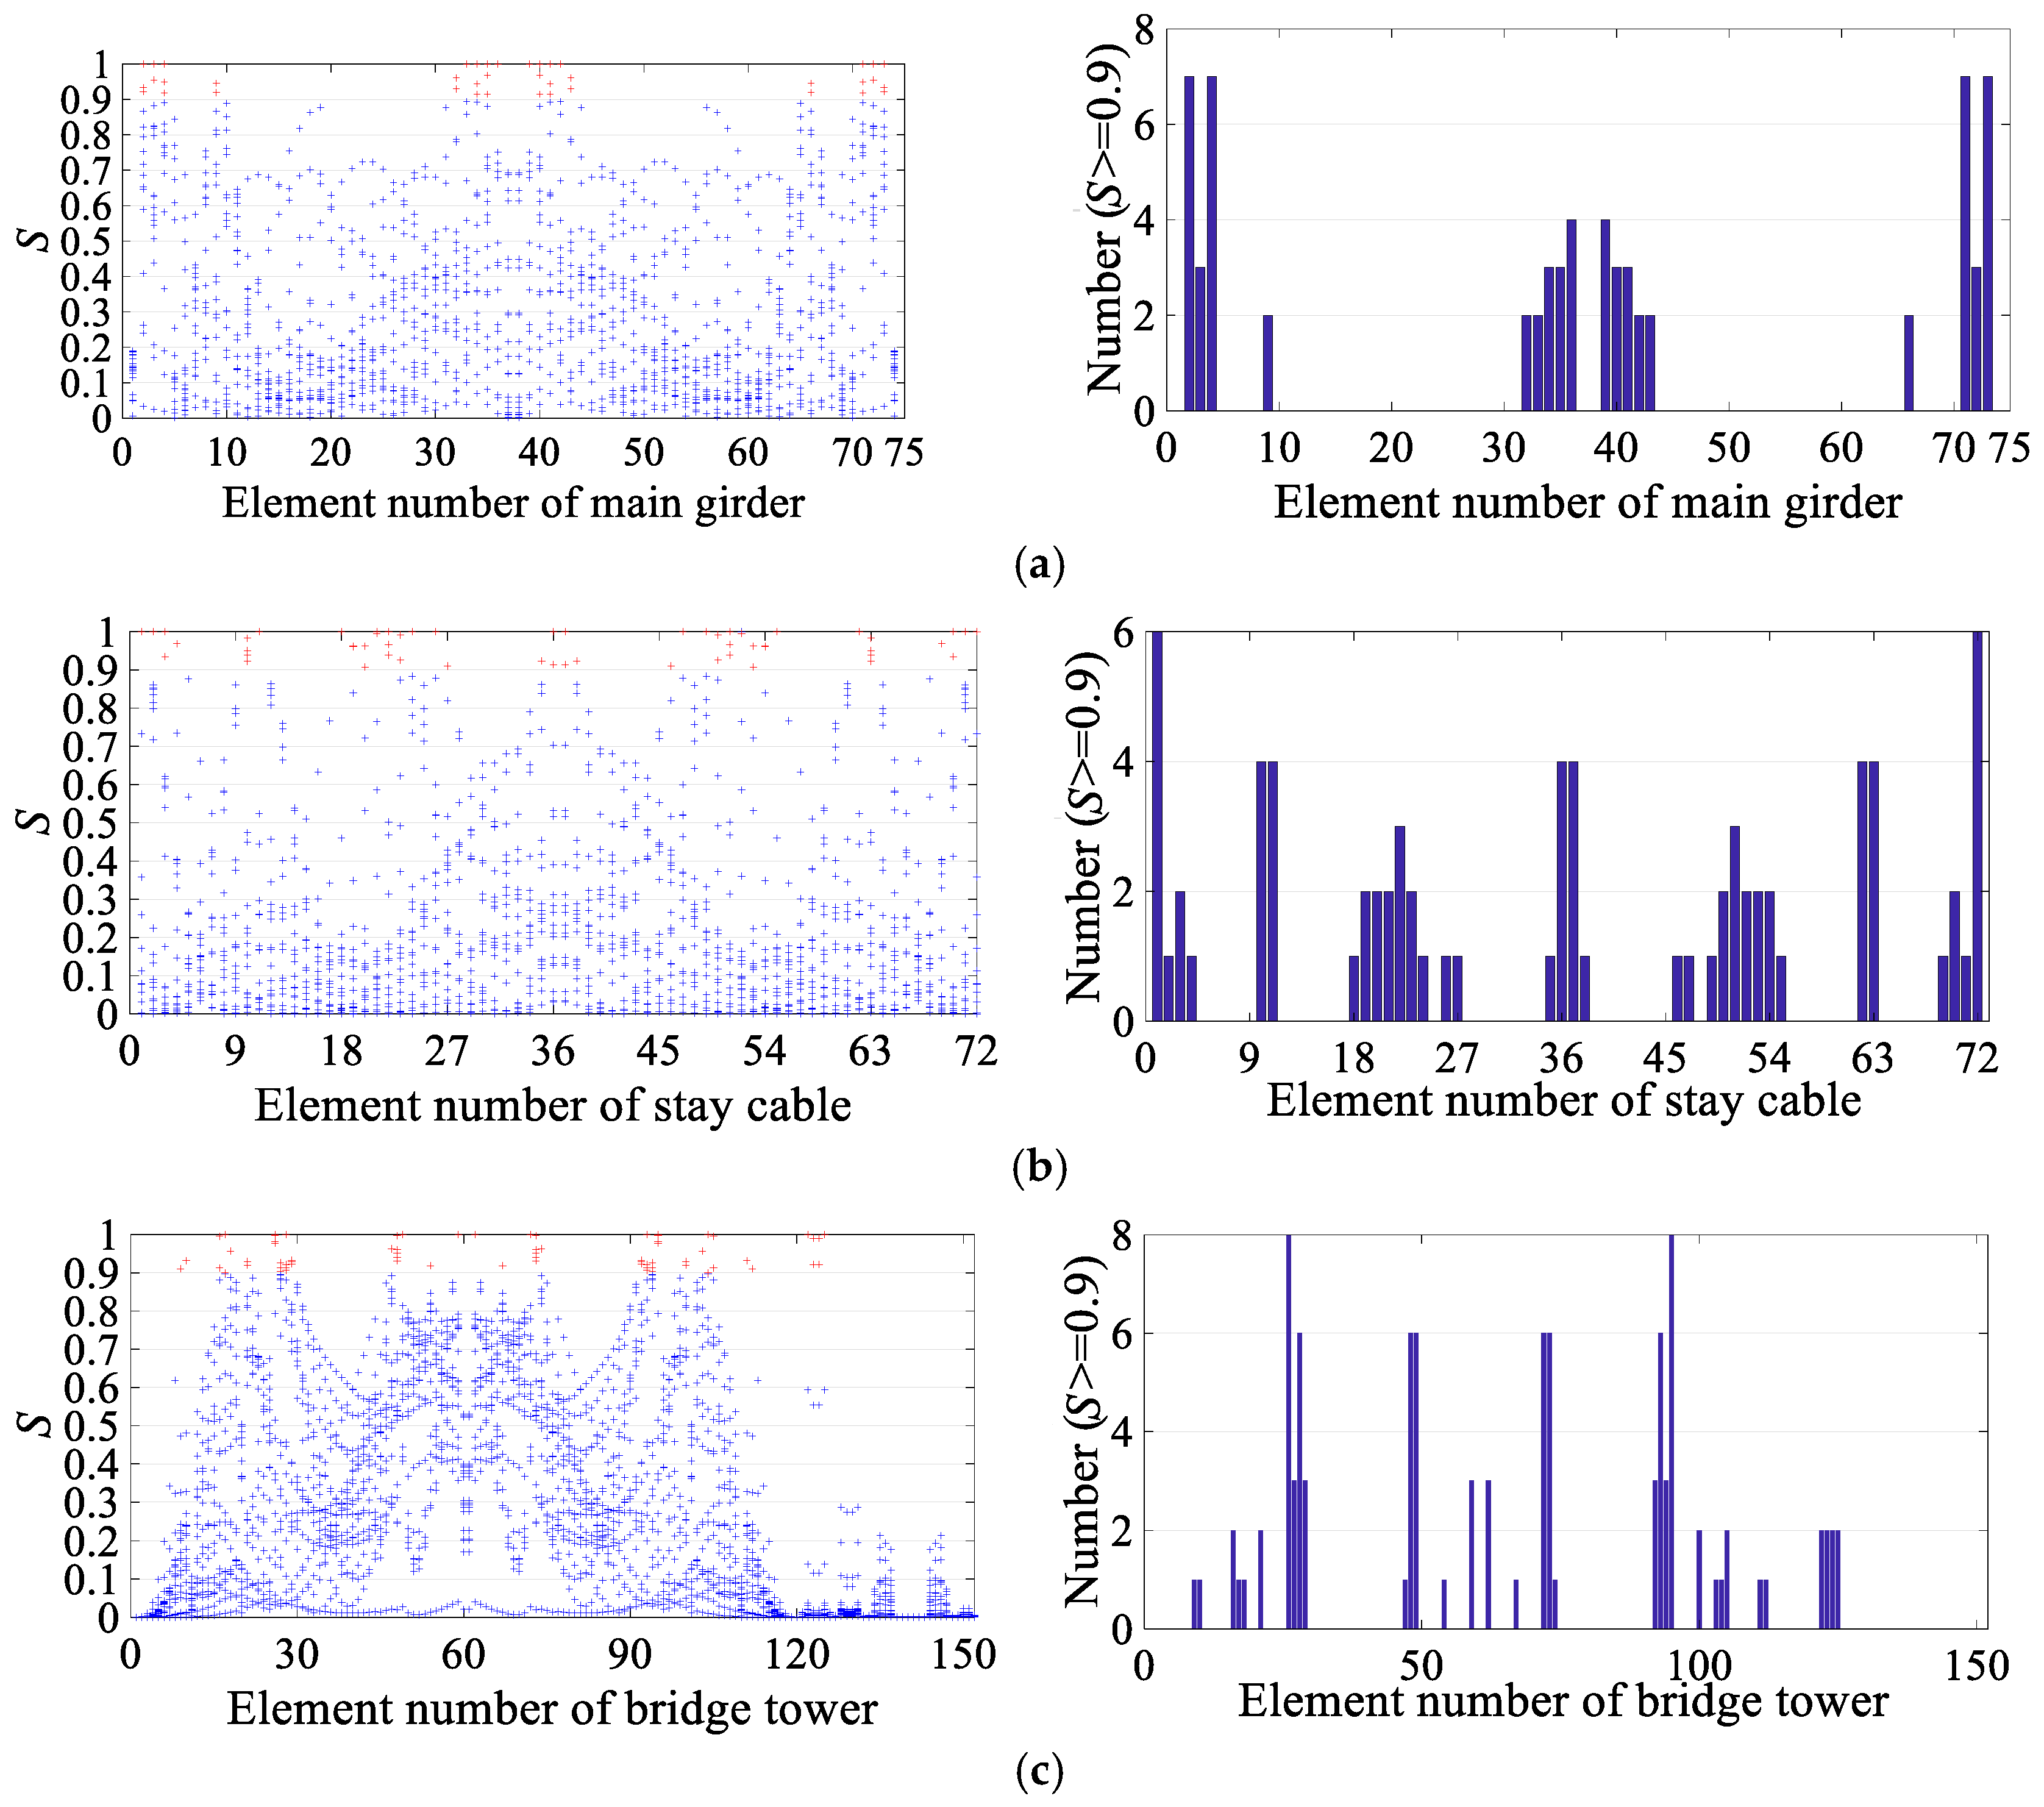
2.3. Criterion of Critical Region Determination

Assume that the structure has N degrees of freedom (DOFs) and L elements. The first M orders of eigenvalue sensitivity and eigenvector sensitivity are used to identify the critical region. The eigenvalues increase with the order. To ensure that the sensitivity of each eigenvalue order is independent of its magnitude, for the jth element, the critical region index based on eigenvalue sensitivity is defined as the relative eigenvalue sensitivity:
S λ j = 1 λ 1 λ 1 r j     1 λ M λ M r j   j = 1 , 2 , , L
The size of each order of eigenvector sensitivity is equal to 1 × N, and eigenvector sensitivity includes both positive and negative elements. To account for these elements in each order of eigenvector sensitivity, for the jth element, the critical region index based on eigenvector sensitivity is defined as the sum of the absolute values of each order of eigenvector sensitivity:
S ϕ j = q = 1 N ϕ 1 q r j     q = 1 N ϕ M q r j   j = 1 , 2 , , L
For the jth element, the index of the critical region based on both the eigenvalue sensitivity and eigenvector is defined as
S j = S λ j max ( S λ j ) S ϕ j max ( S ϕ j )   j = 1 , 2 , , L
in which max ( S λ j ) and max ( S ϕ j ) stand for the maximum element of S λ j and S ϕ j , respectively. The number of elements in S j greater than 0.9 determines the importance of the element in the proposed critical region identification method. The threshold value is primarily determined by the number of sensors. When an adequate number of sensors are used for structural health monitoring, a lower threshold value can be used, and vice versa. The proposed critical region identification method, which incorporates various orders of eigenvalues and eigenvector sensitivity, selects elements with high eigensensitivity as the critical region.

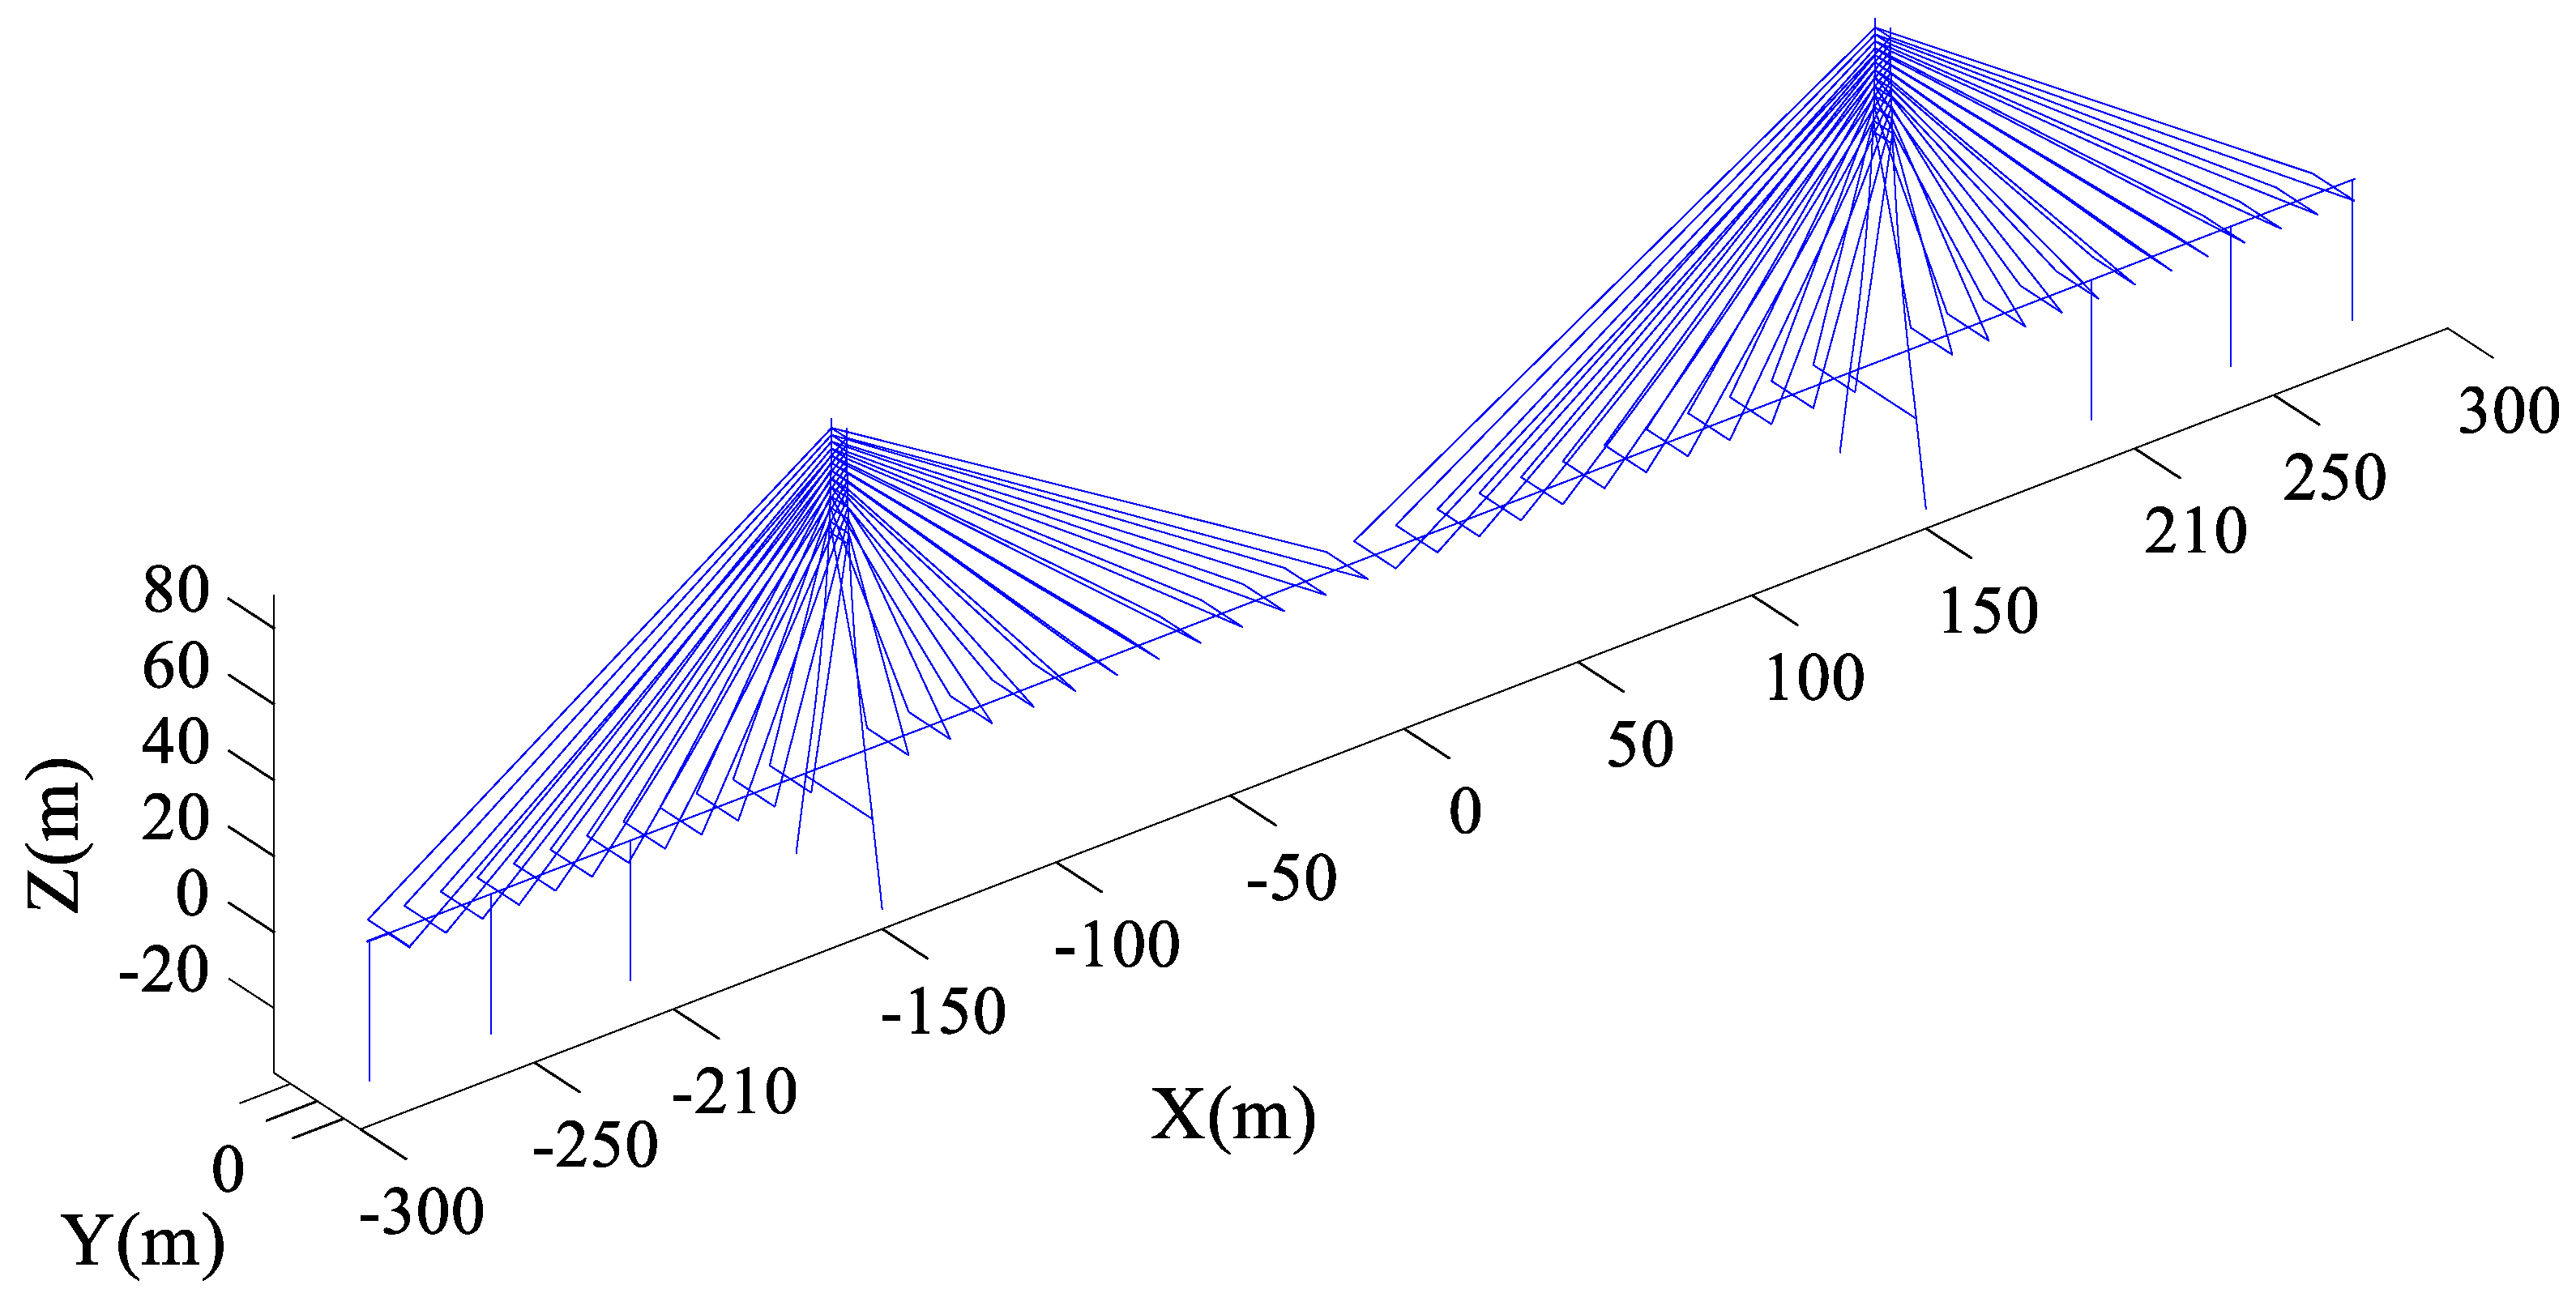
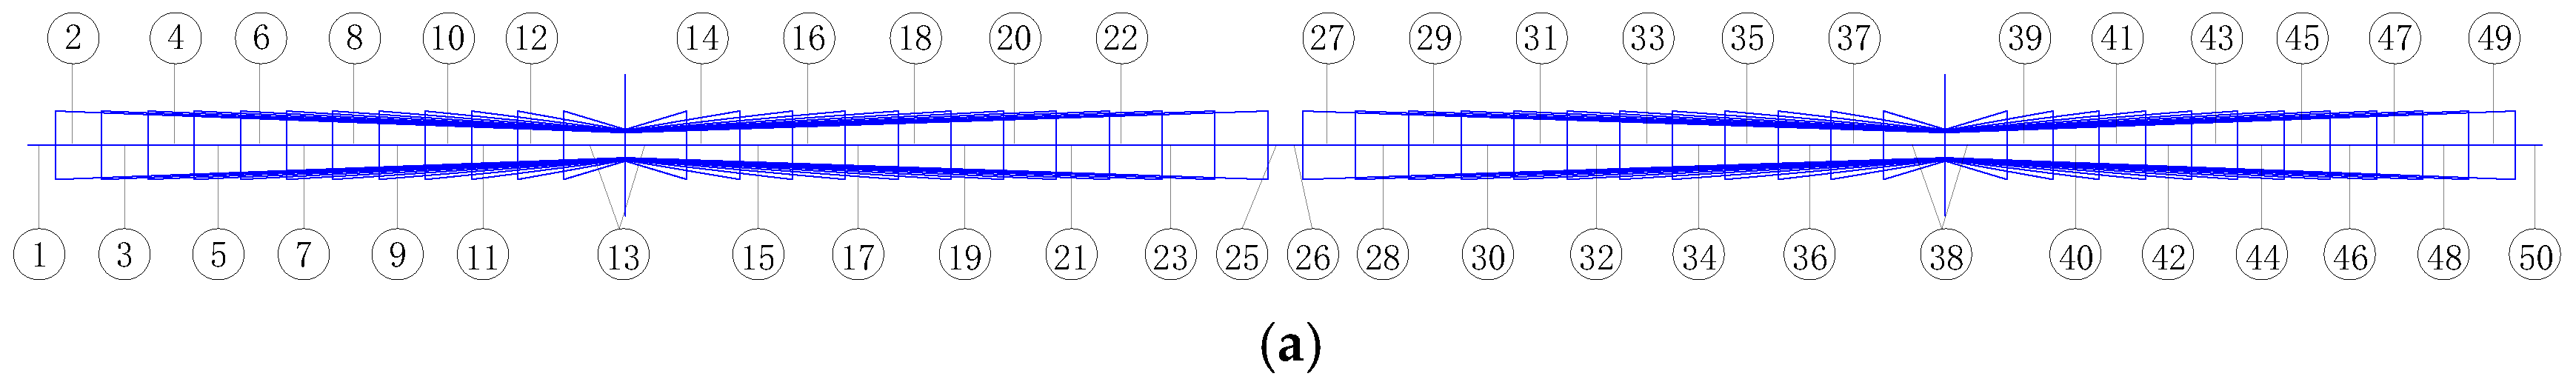
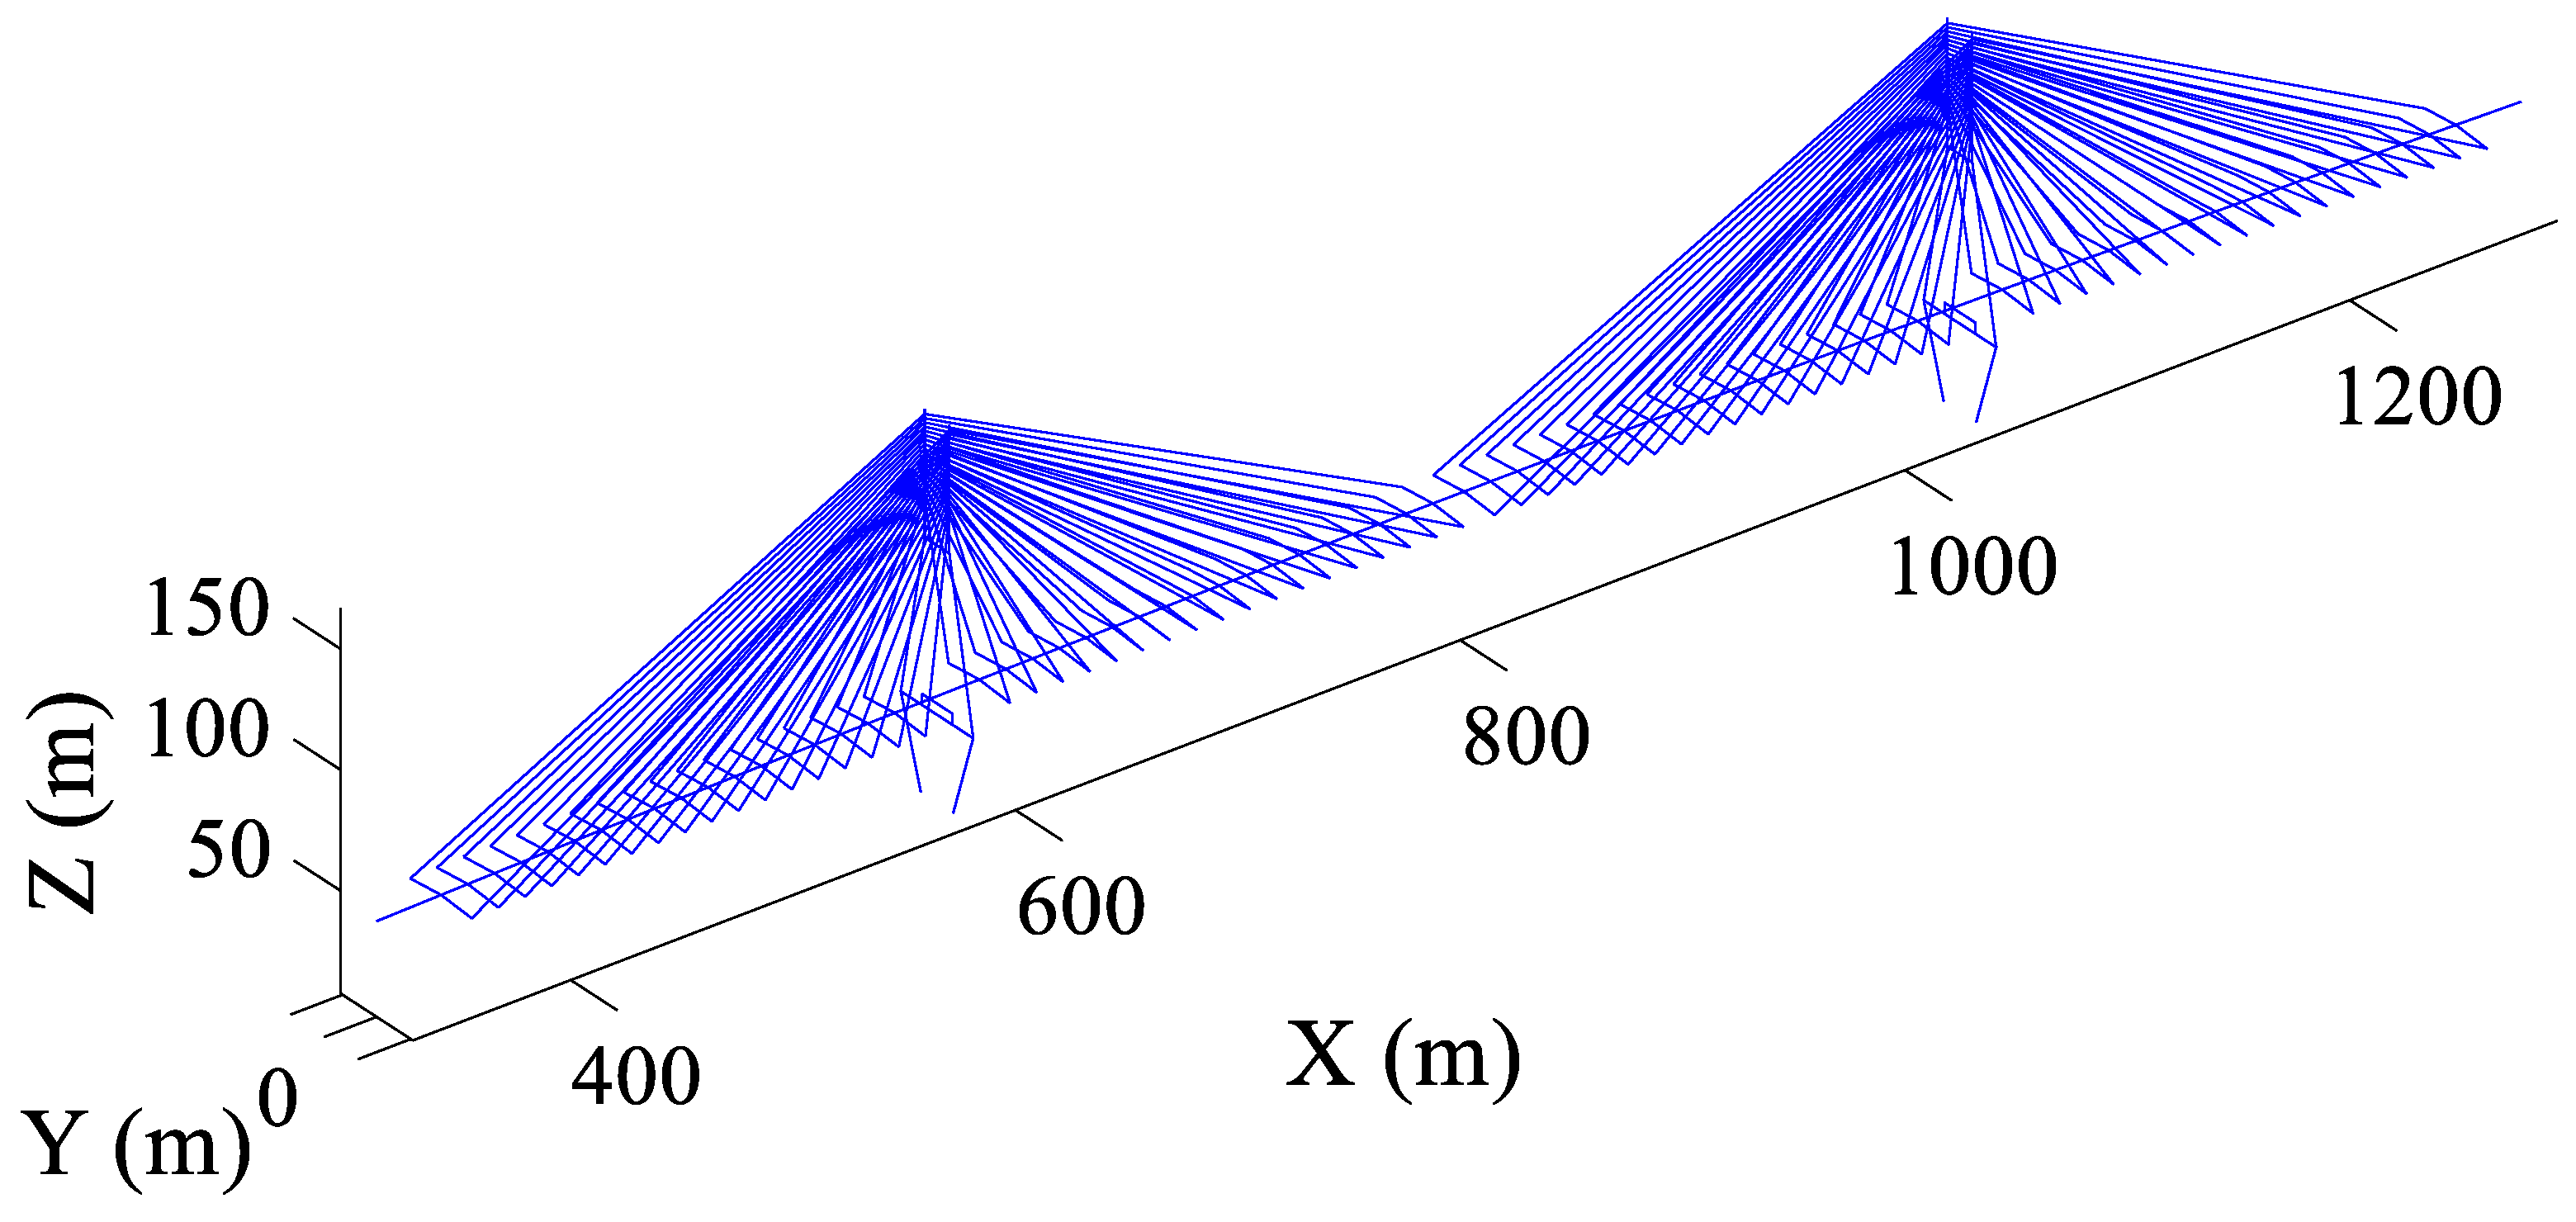
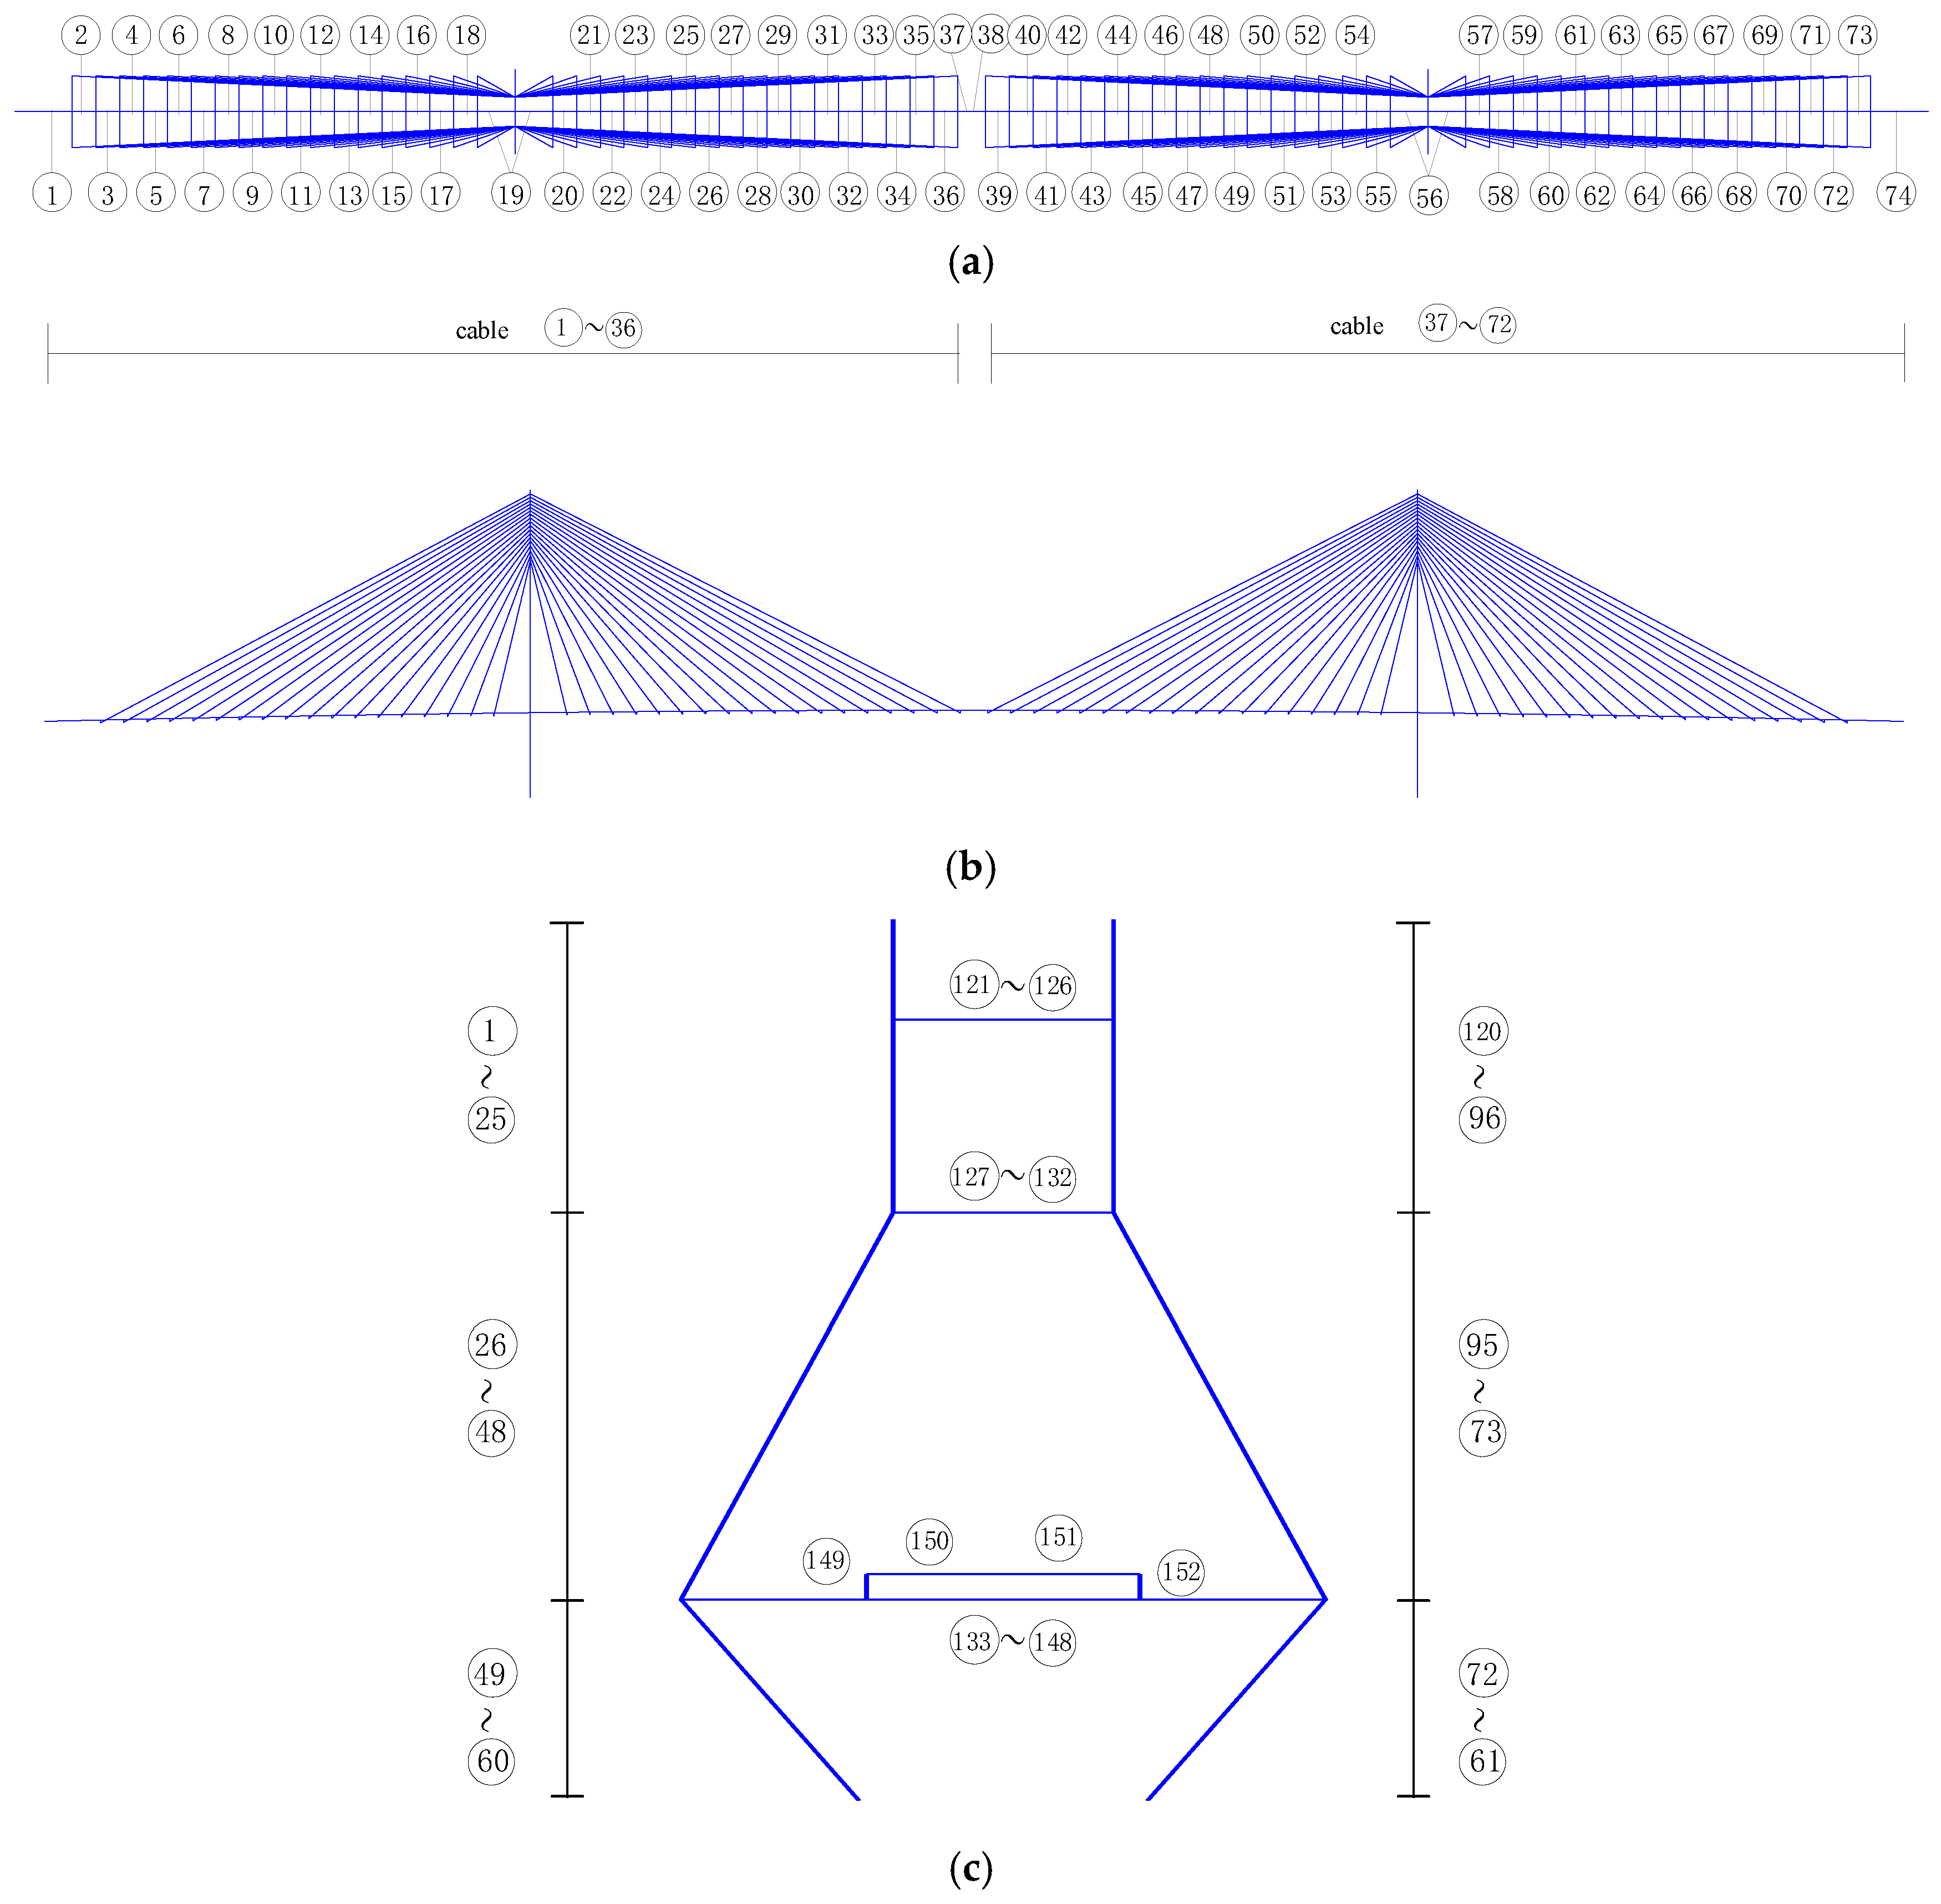
3. Numerical Simulation: Two Cable-Stayed Bridges

3.1. Ganjiang Bridge

The Ganjiang Bridge is the largest bridge along the entire span of the Changgan Passenger Dedicated Line. The main bridge structure is a (35 + 40 + 60 + 300 + 60 + 40 + 35) m cable-stayed bridge, with a total length of 572.1 m. The side spans and some midspan main beams are prestressed concrete box beams, while the remaining midspan main beams are steel–concrete composite box beams. The bridge tower features a herringbone-shaped concrete design, and the edge piers and auxiliary piers are constructed with circular end solid bodies. As shown in Figure 1, the finite element model of the Ganjiang Bridge consists of 604 elements, 485 nodes, and 2832 DOFs. The model has undergone updating in previous work to ensure its accuracy [32]. The Ganjiang Bridge comprises four types of components, including the main girder, stay cables, piers, and bridge towers. The first ten orders of eigenvalue sensitivity and eigenvector sensitivity are used for critical region identification. Figure 2 illustrates the element numbers of the main girder, stay cables, piers, and bridge towers, respectively. Figure 3 shows the critical region index (S) based on both eigenvalue sensitivity and eigenvector sensitivity for each element of the four component types, along with the number of S values greater than or equal to 0.9. Figure 4 presents the color map of the critical regions of the Ganjiang Bridge. In Figure 4, elements with four or more S values greater than or equal to 0.9 are colored red, while those with three, two, one, or zero S values meeting this criterion are colored pink, green, cyan, and blue, respectively.
For the main girder, elements located near the midspan of the bridge, such as Element 24, are colored red. In contrast, Elements 25 and 26, located directly at the midspan, are colored blue. Elements 21, 22, and 23, located to the left of Element 24, are colored pink. Elements 9 and 12, which are near the third pier and the bridge tower, respectively, are colored red. Most elements colored blue are located on the left side of the first bridge tower and the right side of the second bridge tower. It can be concluded that the critical region of the main girder is located near the midspan of the bridge, the bridge towers, and the piers closest to the bridge towers.
As for the stay cables, the elements colored red, pink, green, and cyan are primarily located between or near the two bridge towers. Element 24, the longest cable between the two bridge towers, is marked red. Elements 12, 13, and 18—located near the bridge tower and at the 1/4 span between the two towers—are also colored red. Elements 1 and 2, positioned at the left end of the bridge, are painted cyan, while Elements 3–11, on the left side of the first bridge tower, are marked blue. Clearly, the critical regions of the stay cables are near the bridge tower and at the 1/4, 1/2, and 3/4 spans between the two towers. In contrast, the cables between the piers and the bridge tower are of lower priority compared to those between the two bridge towers.
As for the piers, the first and second piers are colored blue, while the third pier, located near the bridge tower, is marked red and pink. The element at the top of the third pier is also colored red. Evidently, the critical region of the pier is located near the junction of the main girder and the pier, with the most critical pier being the one closest to the bridge tower. As for the bridge tower, elements colored red are positioned near the junctions of the upper, middle, and lower parts, as well as the restrained end of the bridge tower, which constitute its critical regions.

3.2. Junshan Bridge

The Junshan Bridge, the fourth Yangtze River Bridge built in Wuhan, is currently the widest highway bridge on the Yangtze River. It features a five-span continuous semi-floating system, with fully welded streamlined flat steel box girders and a separated inverted “Y-shaped” bridge tower. The main bridge spans 964 m (48 + 204 + 460 + 204 + 48) with a width of 38.8 m. As shown in Figure 5, the finite element model of the Junshan Bridge comprises 758 elements, 611 nodes, and 3634 degrees of freedom (DOFs). Model updating has been conducted in previous work to ensure the accuracy of the finite element model [33]. The main bridge consists of three types of components: the main girder, stay cables, and bridge towers. The pier, which supports the main bridge at the end of the main girder, is not included in the finite element model. The first ten orders of eigenvalue and eigenvector sensitivity are used for critical region identification. Figure 6 shows the element numbers of the main girder, stay cables, and bridge towers, respectively. Figure 7 illustrates the critical region index (S) based on eigenvalue and eigenvector sensitivity for each element of the three component types. The number of elements with S ≥ 0.9 is also shown in Figure 7. Figure 8 displays the color map of the critical regions of the Junshan Bridge. In Figure 8, elements with (S ≥ 0.9) occurring four or more times are colored red, while those with (S ≥ 0.9) occurring 3, 2, 1, or 0 times are colored pink, green, cyan, and blue, respectively.
As for the main girder, elements near the midspan of the bridge, such as Elements 34, 35, and 36, are colored red or pink. Elements 2, 3, 4, 71, 72, and 73, located near the longest cables at the end of the bridge, are also colored red or pink. Notably, elements located exactly at the midspan of the bridge, such as Elements 37 and 38, are colored blue. Evidently, the critical regions of the main girder are located near the midspan of the bridge and near the longest cables at the end of the bridge. As for the stay cables, the longest cables located at the end and midspan of the bridge are colored red. Additionally, cables located at the midspan between the end of the bridge and the bridge tower are also colored red. Cable elements colored pink, green, or cyan are distributed near the bridge tower or the longest cables. The most critical regions of the stay cables are the longest cables and those located at the midspan between the end of the bridge and the bridge tower. The second most critical regions are near the longest cables and the bridge tower. As for the bridge tower, similar to the Ganjiang Bridge, elements colored red are located near the junctions of the upper, middle, and lower parts, as well as the restrained end of the bridge tower, which constitute the critical regions of the bridge tower.
From the above two numerical examples, the identified critical regions of the cable-stayed bridge are located in the midspan of the main girder, the longest stay cables, and the junctions between the upper, middle, and lower parts of the bridge tower and its foundation. These critical regions are also considered important based on engineering experience [34]. Unlike engineering experience, the proposed method is quantitative and objective, making it easier to integrate into health monitoring systems. In the literature, other quantitative methods for critical region identification exist, such as those based on element failure time, elastic—plastic strain energy, singularity of the global stiffness matrix, and the determinant of the tangent stiffness. Traditional methods identify critical elements based on their influence on the static properties of the global structure. In contrast, the proposed method identifies critical elements based on their influence on the dynamic properties of the global structure, as reflected by natural frequencies and mode shapes. The proposed method offers a novel approach for identifying critical regions. Additionally, the method can be extended to identify critical regions in other types of bridges. The accuracy of the proposed method depends heavily on the finite element model. Testing data are required to update the initial model for improved accuracy.

4. Conclusions

This paper proposes an eigensensitivity-based critical region identification method, in which multiple orders of eigenvalue sensitivity and eigenvector sensitivity to the elemental stiffness parameter are incorporated to derive the index of the critical region. Regions with a large eigensensitivity value are identified as critical regions. The proposed method is applied to two cable-stayed bridges. The results indicate that the longest cables and those near the bridge tower are the most critical among all cables. The elements of the main girder near the midspan of the bridge, the pier, and the bridge tower are also identified as the most critical. The critical regions of the bridge tower are located near the junctions of the upper, middle, and lower parts of the tower, as well as the restrained end of the bridge tower. The proposed method is a scientific and quantitative approach. It clarifies the priorities and focuses of structural monitoring, evaluation, and maintenance, thereby saving manpower and material resources.

Author Contributions

Conceptualization, J.L. and Q.W.; methodology, J.L.; software, M.M.; validation, J.L., M.M., and Q.W.; formal analysis, J.L.; investigation, M.M.; resources, Q.W.; data curation, J.L.; writing—original draft preparation, J.L.; writing—review and editing, Q.W.; visualization, M.M.; supervision, Q.W.; project administration, Q.W.; funding acquisition, J.L. and Q.W. All authors have read and agreed to the published version of the manuscript.

Funding

The research is supported by the National Natural Science Foundation of China (NSFC, contract number: 52408346, 52478319), Wuhan Institute of Technology Research Start-Up Fund (23QD73), Natural Science Foundation of Hubei province for Distinguished Young Scholars (2023AFA103), Young Topnotch Talent Cultivation Program of Hubei Province, and Hubei Provincial Engineering Research Centre for Green Civil Engineering Materials and Structures.

Data Availability Statement

The data presented in this study are available on request from the corresponding author. The data are not publicly available due to privacy.

Conflicts of Interest

The authors declare that they have no conflicts of interest.

Abbreviations

The following abbreviation are used in this manuscript:
DOFsDegrees of freedom

References

  1. Qin, J.G.; Zhang, W.W.; Huang, T.; Qian, K.; Deng, X.F. Effect of steel reinforcement corrosion on progressive collapse resistant of beam-slab structure with interior column failure. Eng. Struct. 2024, 312, 118257. [Google Scholar] [CrossRef]
  2. Zhao, X.Z.; Yan, S.; Chen, Y.Y.; Xu, Z.Y.; Lu, Y. Experimental study on progressive collapse-resistant behavior of planar trusses. Eng. Struct. 2017, 135, 104–116. [Google Scholar] [CrossRef]
  3. Zhang, Z.J.; Chen, G.; Cai, Q.; Feng, R.Q. Robustness study of fabricated single-layer grid shell structures based on component sensitivity and vulnerability. Thin-Walled Struct. 2022, 180, 109753. [Google Scholar] [CrossRef]
  4. Calvi, G.M.; Moratti, M.; O’Reilly, G.J.; Scattarreggia, N.; Monteiro, R.; Malomo, D.; Calvi, P.M.; Pinho, R. Once upon a time in Italy: The tale of the Morandi Bridge. Struct. Eng. Int. 2019, 29, 198–217. [Google Scholar] [CrossRef]
  5. Farneti, E.; Cavalagli, N.; Costantini, M.; Trillo, F.; Minati, F.; Venanzi, I.; Ubertini, F. A method for structural monitoring of multispan bridges using satellite InSAR data with uncertainty quantiffcation and its pre-collapse application to the Albiano-Magra Bridge in Italy. Struct. Health Monit. 2022, 22, 353–371. [Google Scholar] [CrossRef]
  6. Calό, M.; Ruggieri, S.; Buitrago, M.; Nettis, A.; Adam, J.M.; Uva, G. An ML-based framework for predicting prestressing force reduction in reinforced concrete box-girder bridges with unbonded tendons. Eng. Struct. 2025, 325, 119400. [Google Scholar] [CrossRef]
  7. Gao, K.; Weng, S.; Zhu, H.P.; Chen, C.J. Recovery of missing strain data under multiple time-varying effects using IMM Kalman filtering. Eng. Struct. 2025, 329, 119830. [Google Scholar] [CrossRef]
  8. Weng, S.; Xia, Y.; Xu, Y.L.; Zhu, H.P. Substructure based approach to finite element model updating. Comput. Struct. 2011, 89, 772–782. [Google Scholar] [CrossRef]
  9. Sun, L.M.; Shang, Z.Q.; Xia, Y.; Bhowmick, S.; Nagarajaiah, S. Review of bridge structural health monitoring aided by big data and artificial intelligence: From condition assessment to damage detection. J. Struct. Eng. 2020, 146, 04020073. [Google Scholar] [CrossRef]
  10. He, Z.G.; Li, W.T.; Salehi, H.D.; Zhang, H.; Zhou, H.Y.; Jiao, P.C. Integrated structural health monitoring in bridge engineering. Autom. Constr. 2022, 136, 104168. [Google Scholar] [CrossRef]
  11. Abiona, Q.O.; Head, H.M. Determination of bridge elements’ weights using the random forest algorithm. J. Perform. Constr. Facil. 2025, 39, 04024056. [Google Scholar] [CrossRef]
  12. Inkoom, S.; Sobanjo, J. Availability function as bridge element’s importance weight in computing overall bridge health index. Struct. Infrastruct. Eng. 2018, 14, 1598–1610. [Google Scholar] [CrossRef]
  13. Lin, Y.J.; Zhang, X.Z.; Xu, W.Q.; Zhou, M. Importance assessment of structural members based on elastic-plastic strain energy. Adv. Mater. Sci. Eng. 2019, 2019, 8019675. [Google Scholar] [CrossRef]
  14. Feng, J.; Li, C.T.; Xu, Y.X.; Zhang, Q.; Wang, F.; Cai, J.G. Analysis of key elements of truss structures based on the tangent stiffness method. Symmetry 2020, 12, 1008. [Google Scholar] [CrossRef]
  15. Cai, J.G.; Jia, W.W.; Feng, J.; Wang, F.; Xu, Y.X. Applications of stiffness-based evaluation method to element importance of truss systems. J. Civ. Eng. Manag. 2017, 23, 562–572. [Google Scholar] [CrossRef]
  16. Ma, S.Y.; Chun, Q.; Zhang, C.W.; Yang, L.; Qian, Y.C.; Cao, G.; Dong, Q.C. Quantitative evaluation method for the structural safety status of traditional courtyard-style timber buildings. Int. J. Archit. Herit. 2024, 18, 1323–1345. [Google Scholar] [CrossRef]
  17. Inkoom, S.; Sobanjo, J.O. Reliability importance as a measure of bridge element condition index for deteriorating bridges. Transp. Res. Rec. 2019, 2673, 327–338. [Google Scholar] [CrossRef]
  18. Liu, W.H.; Zeng, B.; Zhou, Z.; Zheng, Y.F. Multi-indicator evaluation method of important members of truss string structure. Struct. Des. Tall Spec. Build. 2024, 33, e2085. [Google Scholar] [CrossRef]
  19. Xia, J.W.; Wu, X.S. Evaluating the stiffness of cable-bar tensile structures based on subspaces of zero elastic stiffness and demand stiffness. Eng. Struct. 2020, 206, 110167. [Google Scholar] [CrossRef]
  20. Yuan, P.F.; He, B.Y.; Nie, R.; Zhang, L.H.; Yu, H.B.; Wang, G.B.; Ma, X.F. Member importance prediction and failure response analysis for cable network antennas. Eng. Struct. 2022, 266, 114642. [Google Scholar] [CrossRef]
  21. Lin, R.M.; Mottershead, J.E.; Ng, T.Y. A state-of-the-art review on theory and engineering applications of eigenvalue and eigenvector derivatives. Mech. Syst. Signal Process. 2020, 138, 106536. [Google Scholar] [CrossRef]
  22. Zhu, H.P.; Zhang, Y.; Weng, S. Damage identification of mono-coupled periodic structures based on driving-point anti-resonance frequency and sensitivity analysis. J. Sound Vib. 2025, 597 Pt B, 118819. [Google Scholar] [CrossRef]
  23. Yin, X.F.; Yan, W.L.; Liu, Y.; Zhou, Y.; Li, L.Y. Structural damage detection based on improved sensitivity function of modal flexibility and iterative reweighted lp regularization. Int. J. Struct. Stab. Dyn. 2024, 24, 2450111. [Google Scholar] [CrossRef]
  24. Weng, S.; Zhu, H.P.; Xia, Y.; Li, J.J.; Tian, W. A review on dynamic substructuring methods for model updating and damage detection of large-scale structures. Adv. Struct. Eng. 2020, 23, 584–600. [Google Scholar] [CrossRef]
  25. Weng, S.; Tian, W.; Zhu, H.P.; Xia, Y.; Gao, F.; Zhang, Y.T.; Li, J.J. Dynamic condensation approach to calculation of structural responses and response sensitivities. Mech. Syst. Signal Process. 2017, 88, 302–317. [Google Scholar] [CrossRef]
  26. Jiang, Y.F.; Li, Y.C.; Wang, S.Q.; Xu, M.Q. A novel multistage approach for structural model updating based on sensitivity ranking. Smart Struct. Syst. 2020, 25, 657–668. [Google Scholar] [CrossRef]
  27. Cong, S.; Hu, S.L.J.; Li, H.J. Model updating methods using complex eigenvalues: Sensitivity-based versus cross-model cross-mode. J. Eng. Mech. ASCE 2021, 147, 04021013. [Google Scholar] [CrossRef]
  28. Chai, W.H.; Yang, Y.X.; Yu, H.B.; Yang, F.L.; Yang, Z.K. Optimal sensor placement of bridge structure based on sensitivity-effective independence method. IET Circ. Devices Syst. 2022, 16, 125–135. [Google Scholar] [CrossRef]
  29. Gonen, S.; Demirlioglu, K.; Erduran, E. Optimal sensor placement for structural parameter identification of bridges with modeling uncertainties. Eng. Struct. 2023, 292, 116561. [Google Scholar] [CrossRef]
  30. Kodur, V.K.R. Strategies for improving the performance of high-strength concrete columns under fire hazard. Struct. Control Health Monit. 2008, 15, 921–938. [Google Scholar] [CrossRef]
  31. Nelson, R.B. Simplified calculation of eigenvector derivatives. AIAA J. 1976, 14, 1201–1205. [Google Scholar] [CrossRef]
  32. Chen, Q.X. Model Updating and Elaborate Simulation of Multi-Type Bridges. Master’s Thesis, Huazhong University of Science and Technology, Wuhan, China, 2021. [Google Scholar] [CrossRef]
  33. Zhu, T.Y.; Tian, W.; Weng, S.; Ge, H.B.; Xia, Y.; Wang, C. Sensitivity-based finite element model updating using dynamic condensation approach. Int. J. Struct. Stab. Dyn. 2017, 45, 1840004. [Google Scholar] [CrossRef]
  34. JT/T 1037-2022; Technical Specifications for Structural Monitoring of Highway Bridges. China Communications Press: Beijing, China, 2022.
Figure 1. The finite element model of Ganjiang Bridge.
Buildings 15 01038 g001
Figure 2. The element numbers of the Ganjiang Bridge: (a) main girder; (b) stay cable and pier; (c) bridge tower.
Buildings 15 01038 g002aBuildings 15 01038 g002b
Figure 3. The elemental eigensensitivity of the Ganjiang Bridge: (a) main girder; (b) stay cable; (c) pier; (d) bridge tower. Note: The points with red color in the scatter diagrams indicate S ≥ 0.9, and the points with blue color indicate S < 0.9.
Buildings 15 01038 g003aBuildings 15 01038 g003b
Figure 4. The critical region of the Ganjiang Bridge.
Buildings 15 01038 g004
Figure 5. The finite element model of Junshan Bridge.
Buildings 15 01038 g005
Figure 6. The element number of the Junshan Bridge: (a) main girder; (b) stay cable and pier; (c) bridge tower.
Buildings 15 01038 g006
Figure 7. The elemental eigensensitivity of the Junshan Bridge: (a) main girder; (b) stay cable; (c) bridge tower. Note: The points with red color in the scatter diagrams indicate S ≥ 0.9, and the points with blue color indicate S < 0.9.
Buildings 15 01038 g007
Figure 8. The critical region of the Junshan Bridge.
Buildings 15 01038 g008
Disclaimer/Publisher’s Note: The statements, opinions and data contained in all publications are solely those of the individual author(s) and contributor(s) and not of MDPI and/or the editor(s). MDPI and/or the editor(s) disclaim responsibility for any injury to people or property resulting from any ideas, methods, instructions or products referred to in the content.

