Article

Study on the Lateral Performance of Large-Scale Steel Casing-Reinforced Concrete Pile Composite Members

1
Key Laboratory of Hydraulic and Waterway Engineering of the Ministry of Education, Chongqing Jiaotong University, Chongqing 400074, China
2
College of River and Ocean Engineering, Chongqing Jiaotong University, Chongqing 400074, China
*
Author to whom correspondence should be addressed.
Buildings 2025, 15(7), 1039; https://doi.org/10.3390/buildings15071039
Submission received: 19 February 2025 / Revised: 18 March 2025 / Accepted: 20 March 2025 / Published: 24 March 2025
(This article belongs to the Section Building Structures)

Abstract

In order to investigate the lateral working performance of large-scale steel casing-reinforced concrete pile composite members, this paper sets up large-scale steel casing-reinforced concrete pile composite members with different slenderness ratios λ, compressive axial force ratios N, and foundation strengths. It conducts quasi-static loading tests to investigate the effects of these factors on the hysteretic performance, bearing capacity, ductile performance, strength degradation, and stiffness degradation of the members. The results show that the hysteresis curves of the members all have a typical inverse S-shape, which is affected by slip and has a poor degree of fullness. The members with larger slenderness ratios exhibit better ductility performance, deformation performance, and energy dissipation performance, but their poorer bearing capacity and effect on stiffness degradation are limited. While members with smaller slenderness ratios exhibit better bearing capacity, their ductile performance is poor. As the compressive axial force ratio increases, the lateral bearing capacity and ductility of the members slightly improve. However, the bearing capacity rapidly decreases when the compressive axial force ratio reaches a critical value. As the strength of the foundation increased, the lateral bearing capacity of the structures continued to improve, but its improvement effect began to decay after reaching a certain value. This paper investigates the lateral working properties of large-scale steel casing-reinforced concrete pile composite members designed for overhead vertical wharves that are subjected to significant water level differences in inland rivers, aiming to provide a reference for their application in practical engineering.

1. Introduction

With the completion of the Three Gorges Reservoir and its subsequent water storage, the water level in the reservoir area exhibits prolonged periods of high water levels and brief intervals of low water levels. This phenomenon results in the overhead vertical wharf experiencing more complex and variable water pressure during operation. Additionally, the shore geological conditions and complex topography of the Three Gorges Reservoir area make the traditional overhead vertical wharf go through a lot of changes in construction, use, and hydrological conditions, making it difficult to meet the construction and development needs. The large-scale steel cashing-reinforced concrete pile composite member can significantly accelerate the construction speed during the dry water period, and it is not affected by the changes in water level rise and fall in the reservoir area. Thus, it prolongs the overall construction time and makes it widely applicable in overhead vertical wharfs designed for significant water level differences [1,2]. In addition to being used in overhead vertical wharfs with significant water level differences, steel casing is widely used in highland canyon reservoir bridges, karst areas, offshore wind power piles, and so on due to their advantages of anti-sliding stability, foundation reinforcement, and construction convenience. There is a significant difference in the lateral working performance of large-scale steel casing-reinforced concrete pile composite members under complex hydrological conditions compared to traditional reinforced concrete column (concrete-filled steel tube) composite structures. In the context of ship–wave–current–structure interactions, this combined structure is subjected to low-frequency ship impacts, resulting in ship crashes that damage piers from time to time, which have serious impacts on the structure’s strength, stiffness, deformation, and energy consumption. Therefore, studying the interfacial force transfer, damage mechanisms, and energy dissipation modes [3,4] of the wharf-combined structure under low-frequency lateral loading [5,6,7] is of great theoretical and practical significance.
Steel casings are often required to be embedded to a certain depth within the rock strata as part of the construction of rock-socketed piles over water. Due to the difficulty of removing the steel casing after construction, it is typically not considered a stressed member. However, a steel casing exhibits significant flexural stiffness, which inevitably results in load-bearing under horizontal loading conditions [8]. As research on composite piles has deepened, scholars both domestically and internationally have increasingly focused on the influence of steel casings on the overall performance of the structure. The AASHTO LRFD Bridge Design Specifications [9] indicate that the steel casing can be regarded as participating in the load-bearing capacity when the wall thickness of the steel casing exceeds 3 mm. Mu et al. [10] investigated the displacement and internal force distribution of foundation piles under cast-in-place conditions, considering and ignoring the effects of the steel casing. The study found that the pile top displacement can be reduced by half when accounting for the effect of the steel casing. Zhu et al. [11,12,13] investigated the lateral bearing behavior of steel-socketed piles. They found that the steel casing significantly improved the bearing capacity of rock-socketed piles and facilitated the local backfill of steel tube pile computational technology. Zhou et al. [14] investigated the impact behavior of steel casing composite piles by performing pendulum impact tests on specimens and found that the damage of short steel casing piles transferred from bending to bending-shear as the impact velocity increased. Wang et al. [15] investigated the displacement depth and buckling characteristics of super-large-diameter steel casings under axial impact loads, etc. The results showed that for thin walls, the resulting axial stresses are high, and buckling deformation is likely to occur, making it difficult to drive the SLDSC to the design depth. Chen et al. [16] carried out vertical bearing tests and horizontal bearing tests on common precast piles and steel casing precast piles, respectively, to compare and analyze the effects of the depth of rock embedded in the pile body on the bearing performance of the pile foundation under the conditions of with and without steel casings. Xiong et al. [17] analyzed the relationship between the circumferential strain and displacement of thin-walled steel casings under axial loads by constructing the equilibrium differential equations, geometric equations, and the intrinsic equations of the micrometric body.
From the above literature, it can be seen that existing studies mainly focus on the structural bearing capacity under vertical as well as horizontal loading of steel casing members; however, large-scale steel casing-reinforced concrete pile composite members are often subjected to more complex loads, such as low circumferential cyclic loads. The current studies on large-scale steel-reinforced concrete columns and steel link-braced composite structures are still limited [18], and most of the studies focus on the lateral load-bearing characteristics and hysteresis performance of concrete-filled steel tubes. For instance, Bradford et al. [19,20,21,22,23] investigated rectangular concrete-filled steel tubular columns, revealing their cross-section strain and stress patterns under vertical loading and exploring the applicable conditions for these columns. Huang et al. [24,25,26,27,28,29,30,31] found that the thickness and strength of steel tubes significantly influence the concrete bearing capacity by studying the compression performance of square concrete-filled steel tubes (CFSTs), rectangular reinforced concrete-filled steel tubes (RACFSTs), and slender columns. Hajjar et al. [32,33,34,35,36,37] developed a theoretical model for the hysteretic performance of square concrete-filled steel tubes by investigating the constitutive relationship of concrete-filled steel tubes and proposed a corresponding theoretical framework for axial compression members made of average-strength and high-strength concrete-filled steel tubes. Additionally, a study by Dong [38] showed that concrete-filled steel tubes with internal structures have fuller hysteresis return curves, a higher load-bearing capacity, better energy dissipation capacity and ductility, and better seismic performance. Zhang Y et al. [39] explored the effect of axial load levels on the hysteretic performance of concrete-filled steel tubes through experimental tests. Alva et al. [40,41] found that both the structural design and the magnitude of the axial load significantly influence the energy dissipation capacity of concrete-filled steel tubes in their study. Given that large-scale steel and reinforced concrete composite members share similarities with concrete-filled steel tubes, this paper aims to further investigate the mechanical properties and working mechanisms of steel casing-reinforced concrete pile composite members, leveraging the existing research findings on concrete-filled steel tubes.
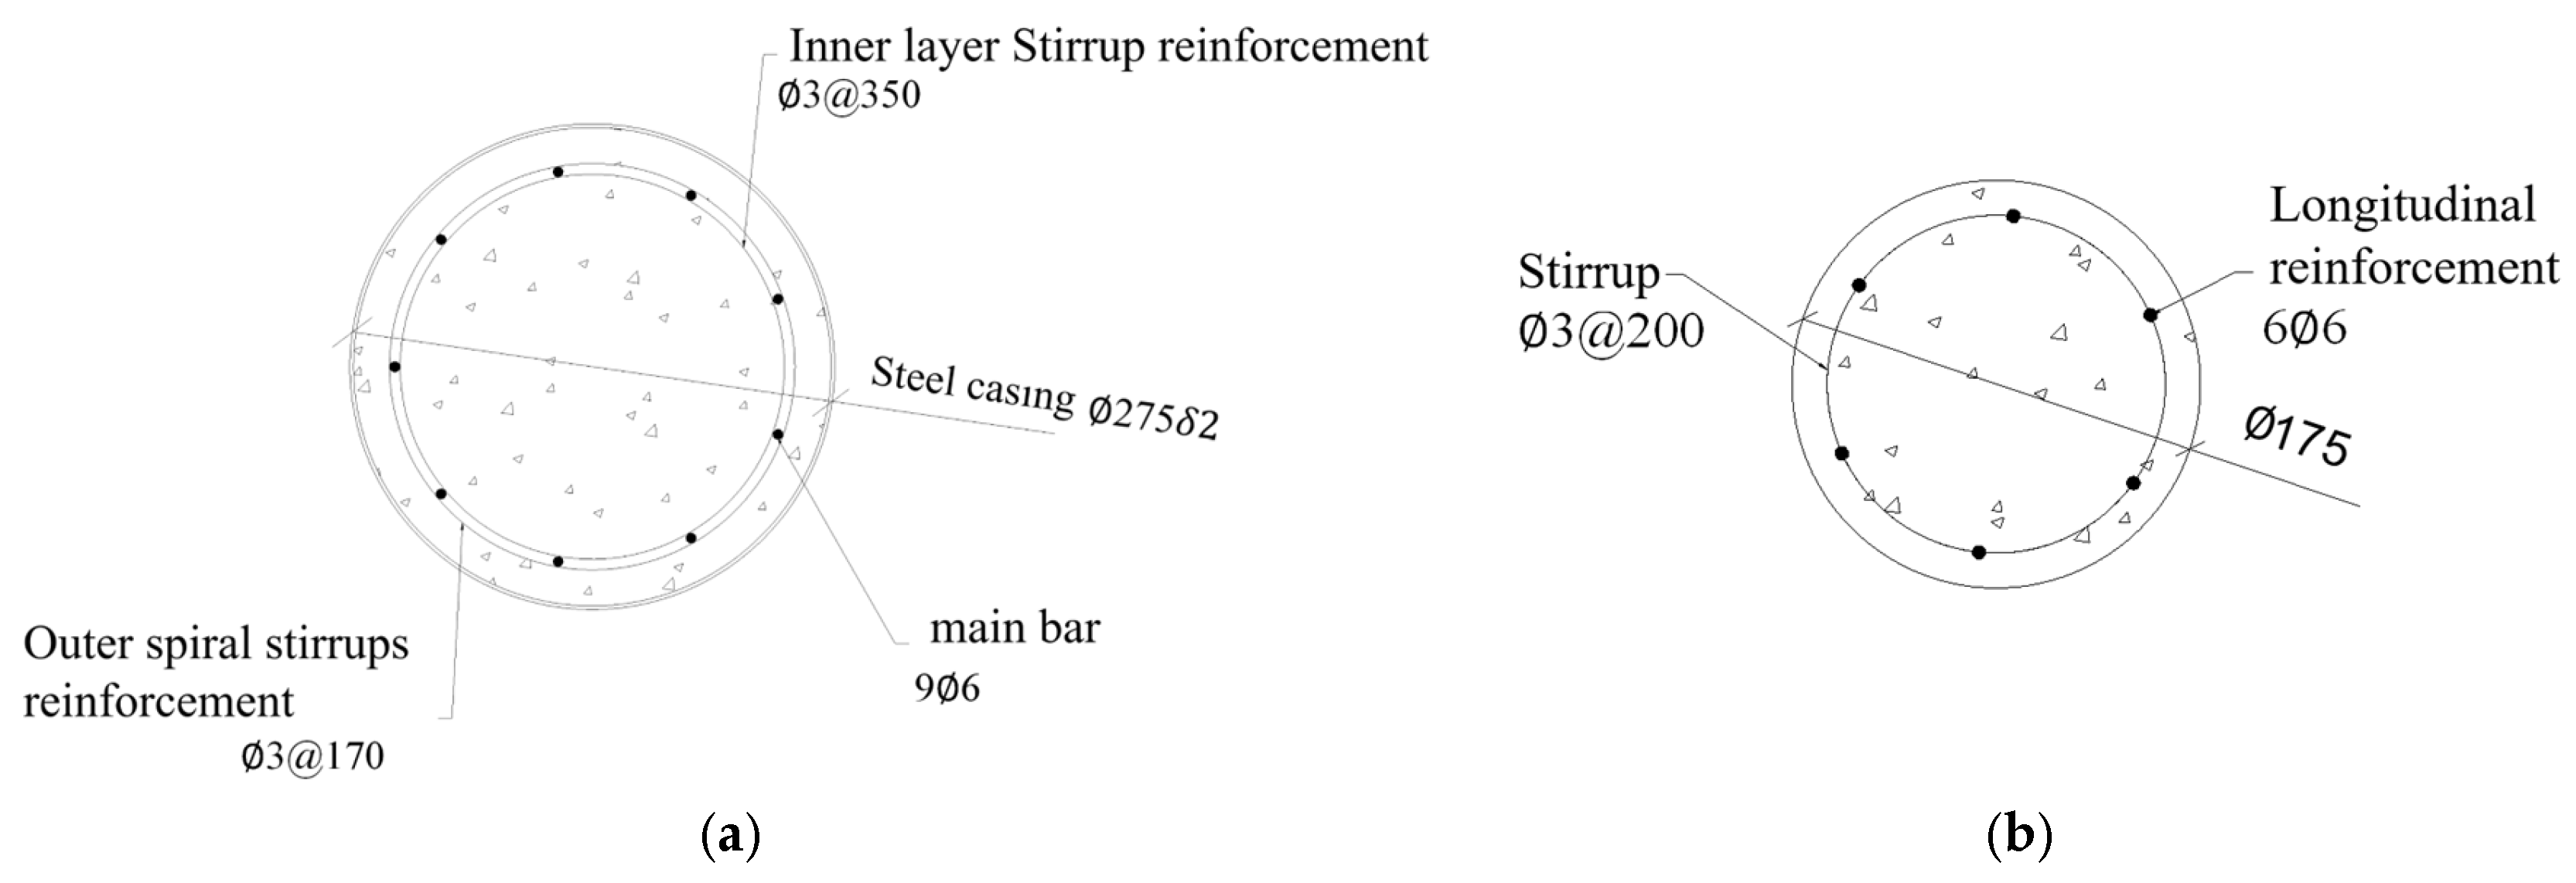
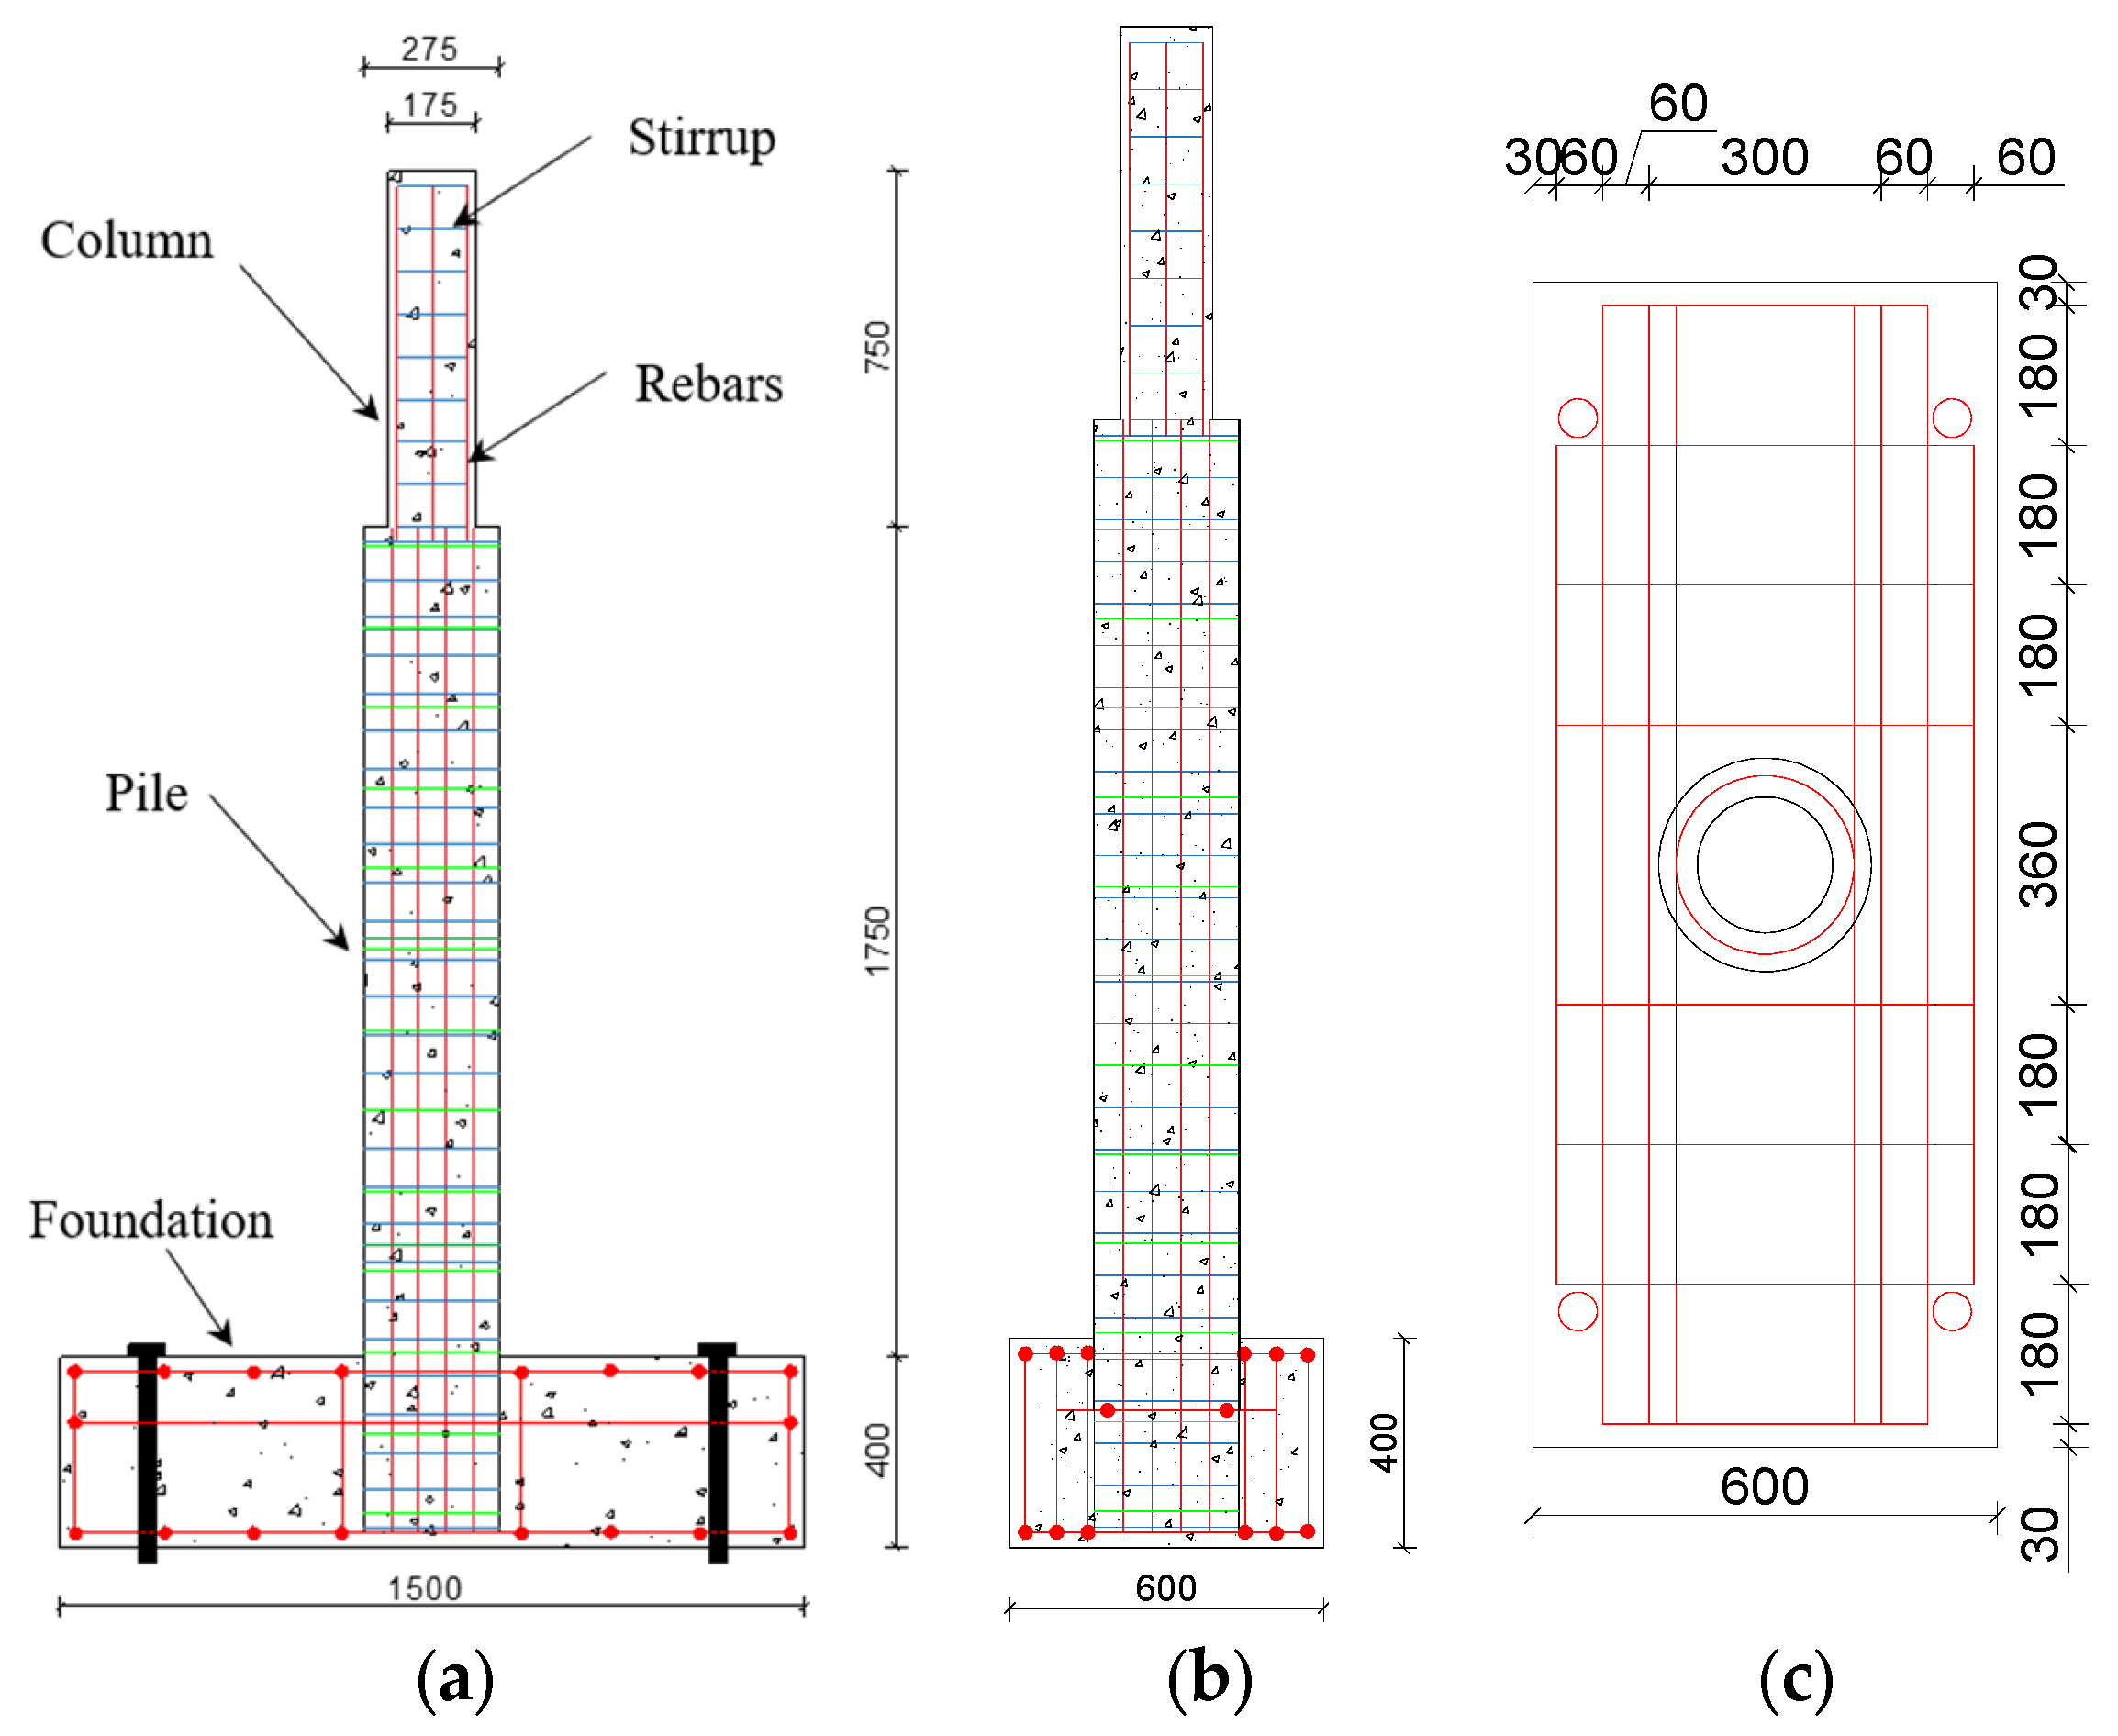
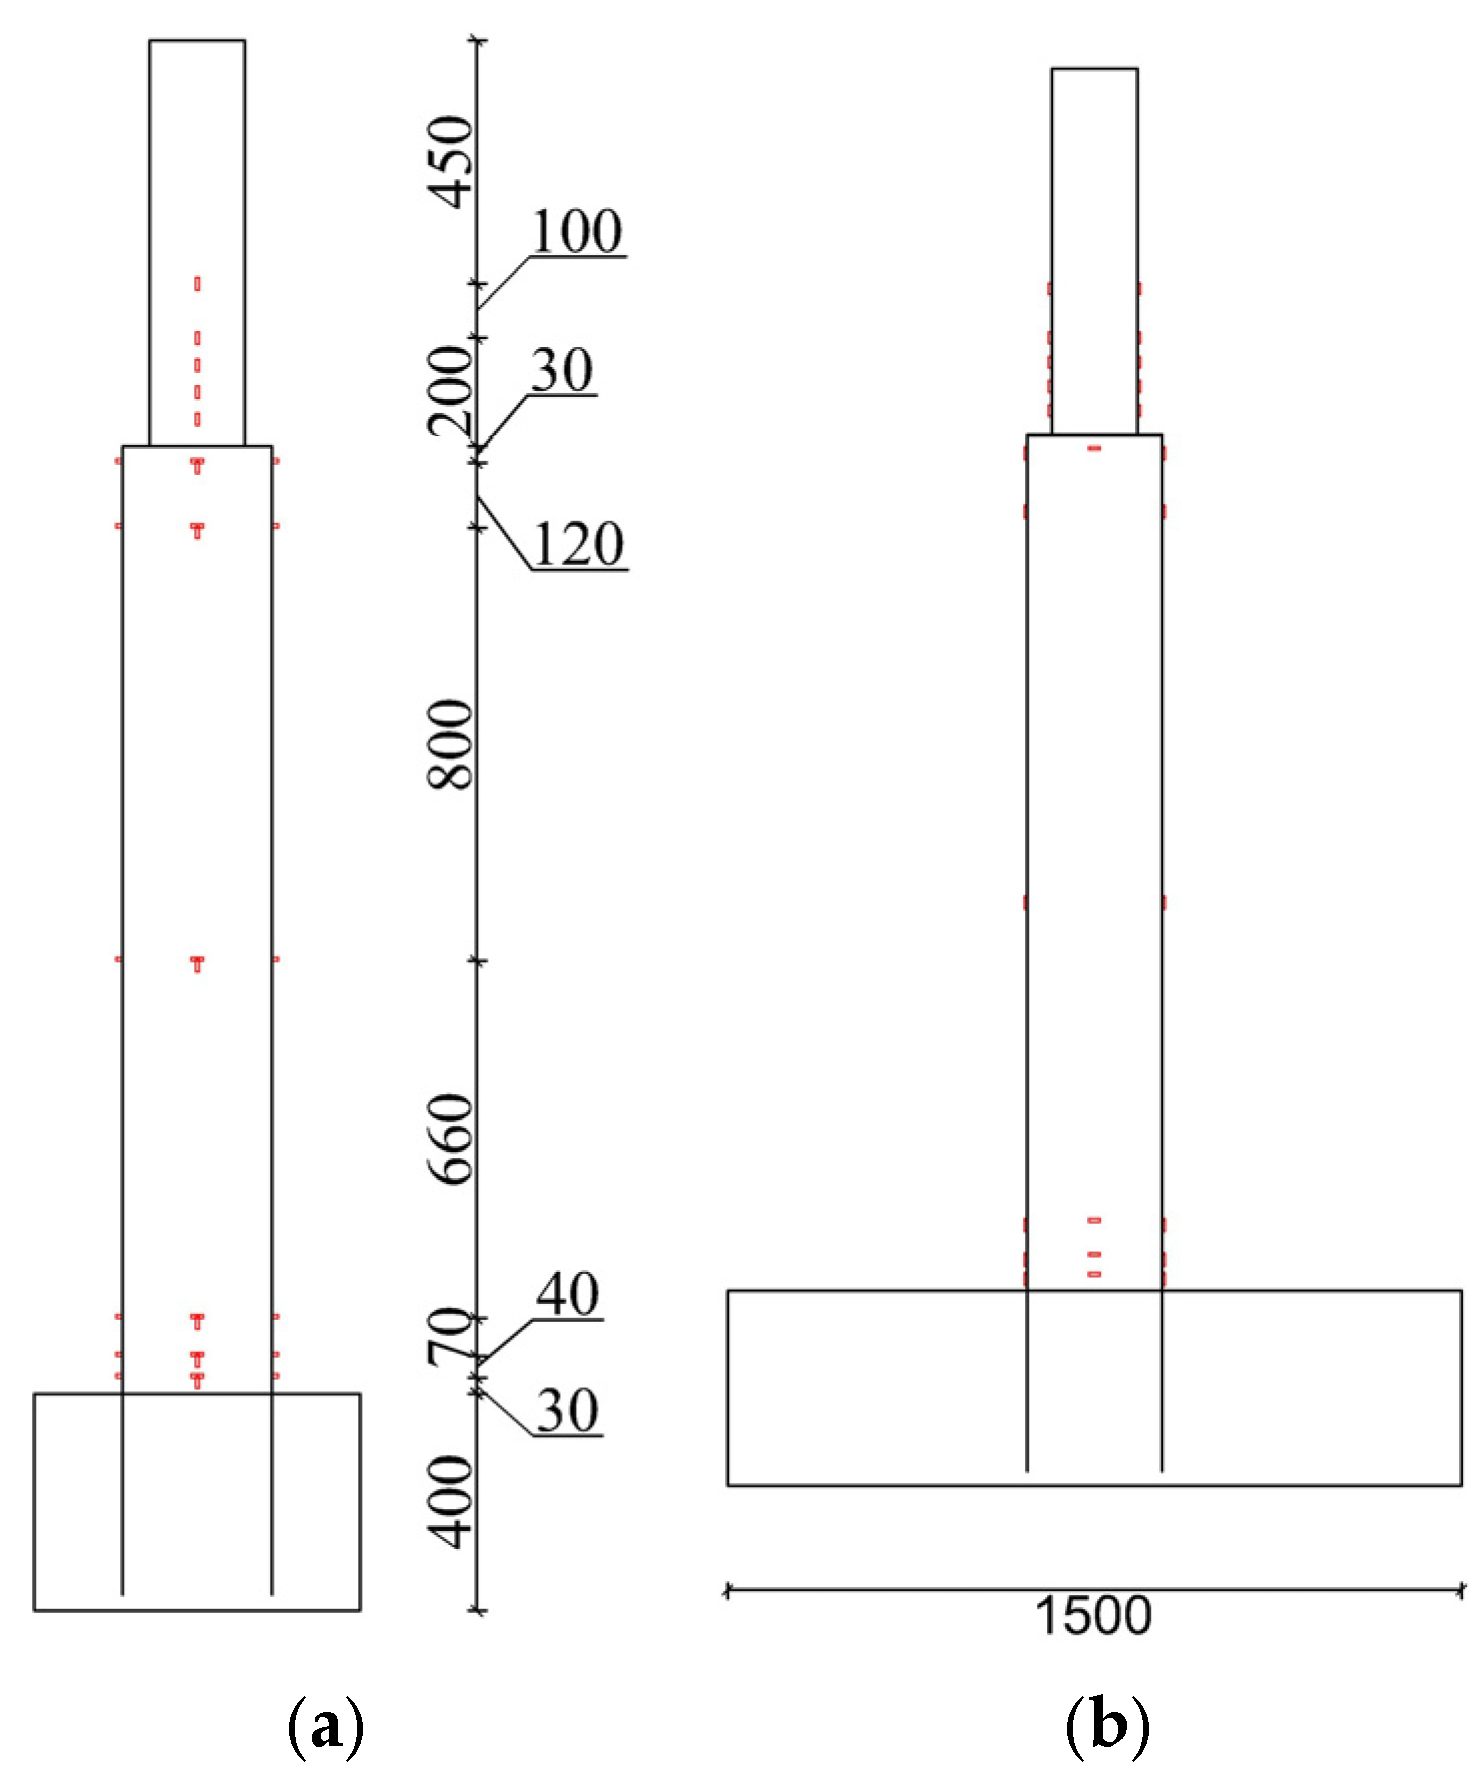
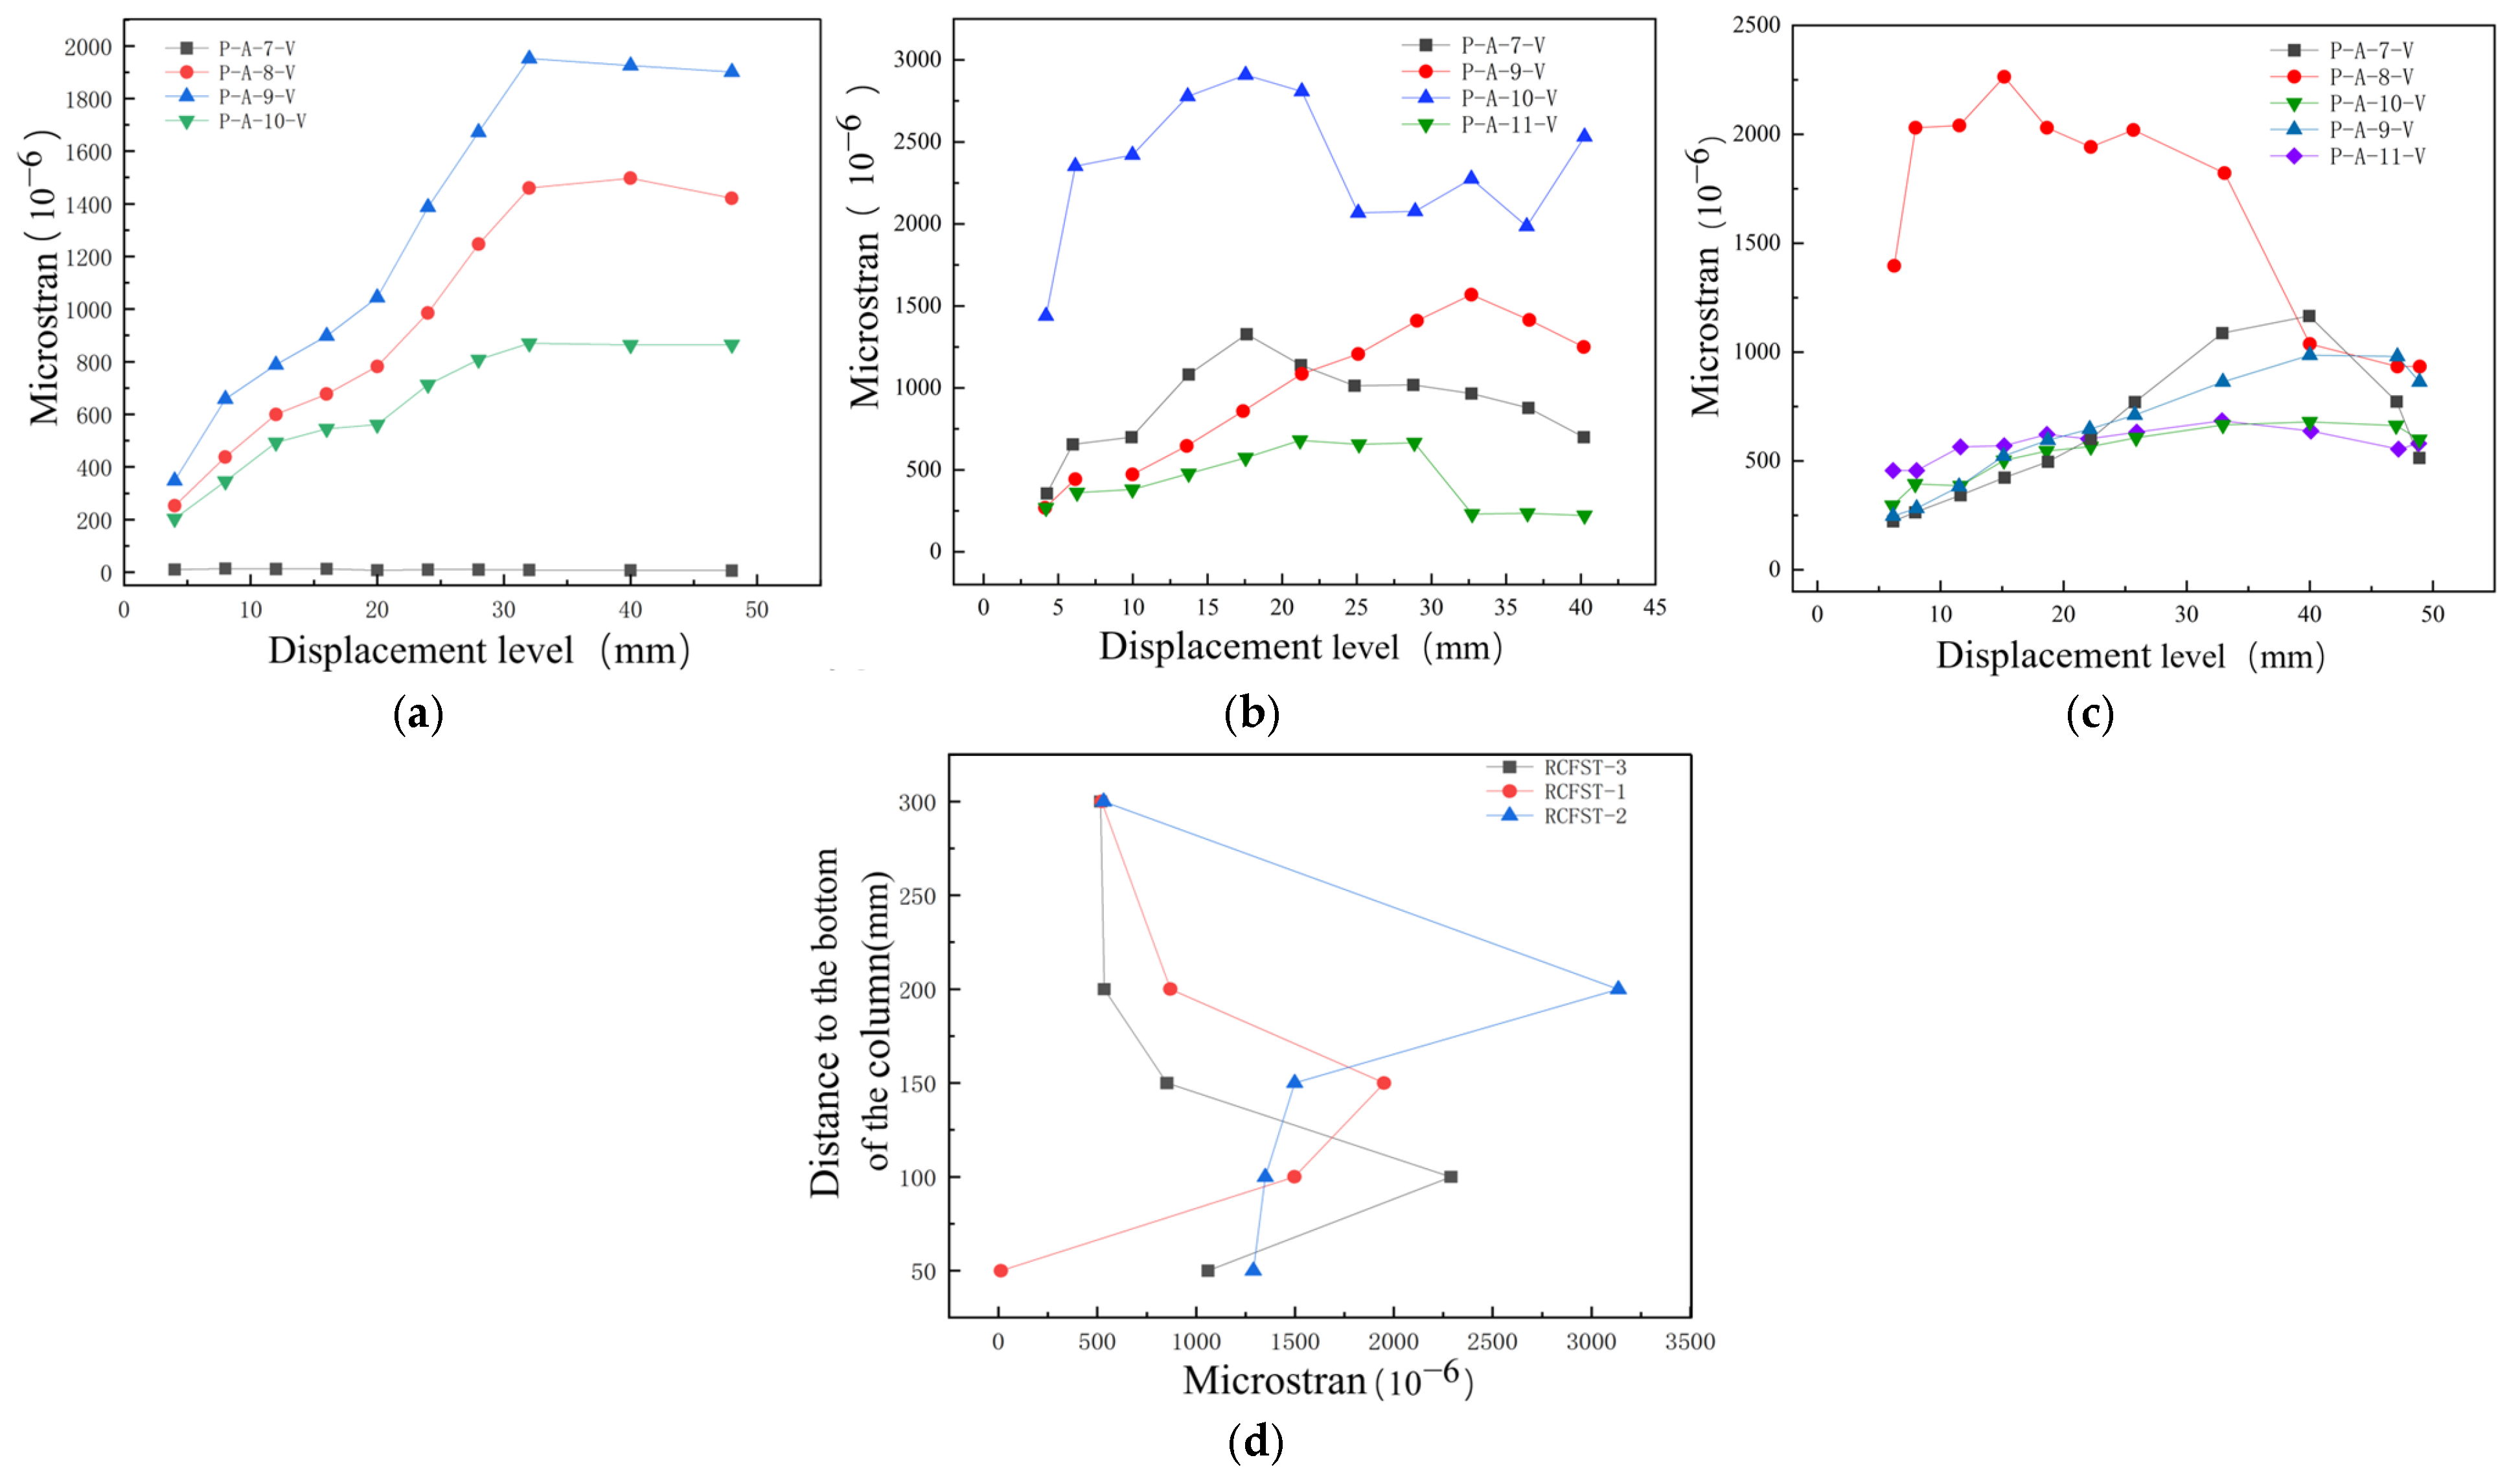
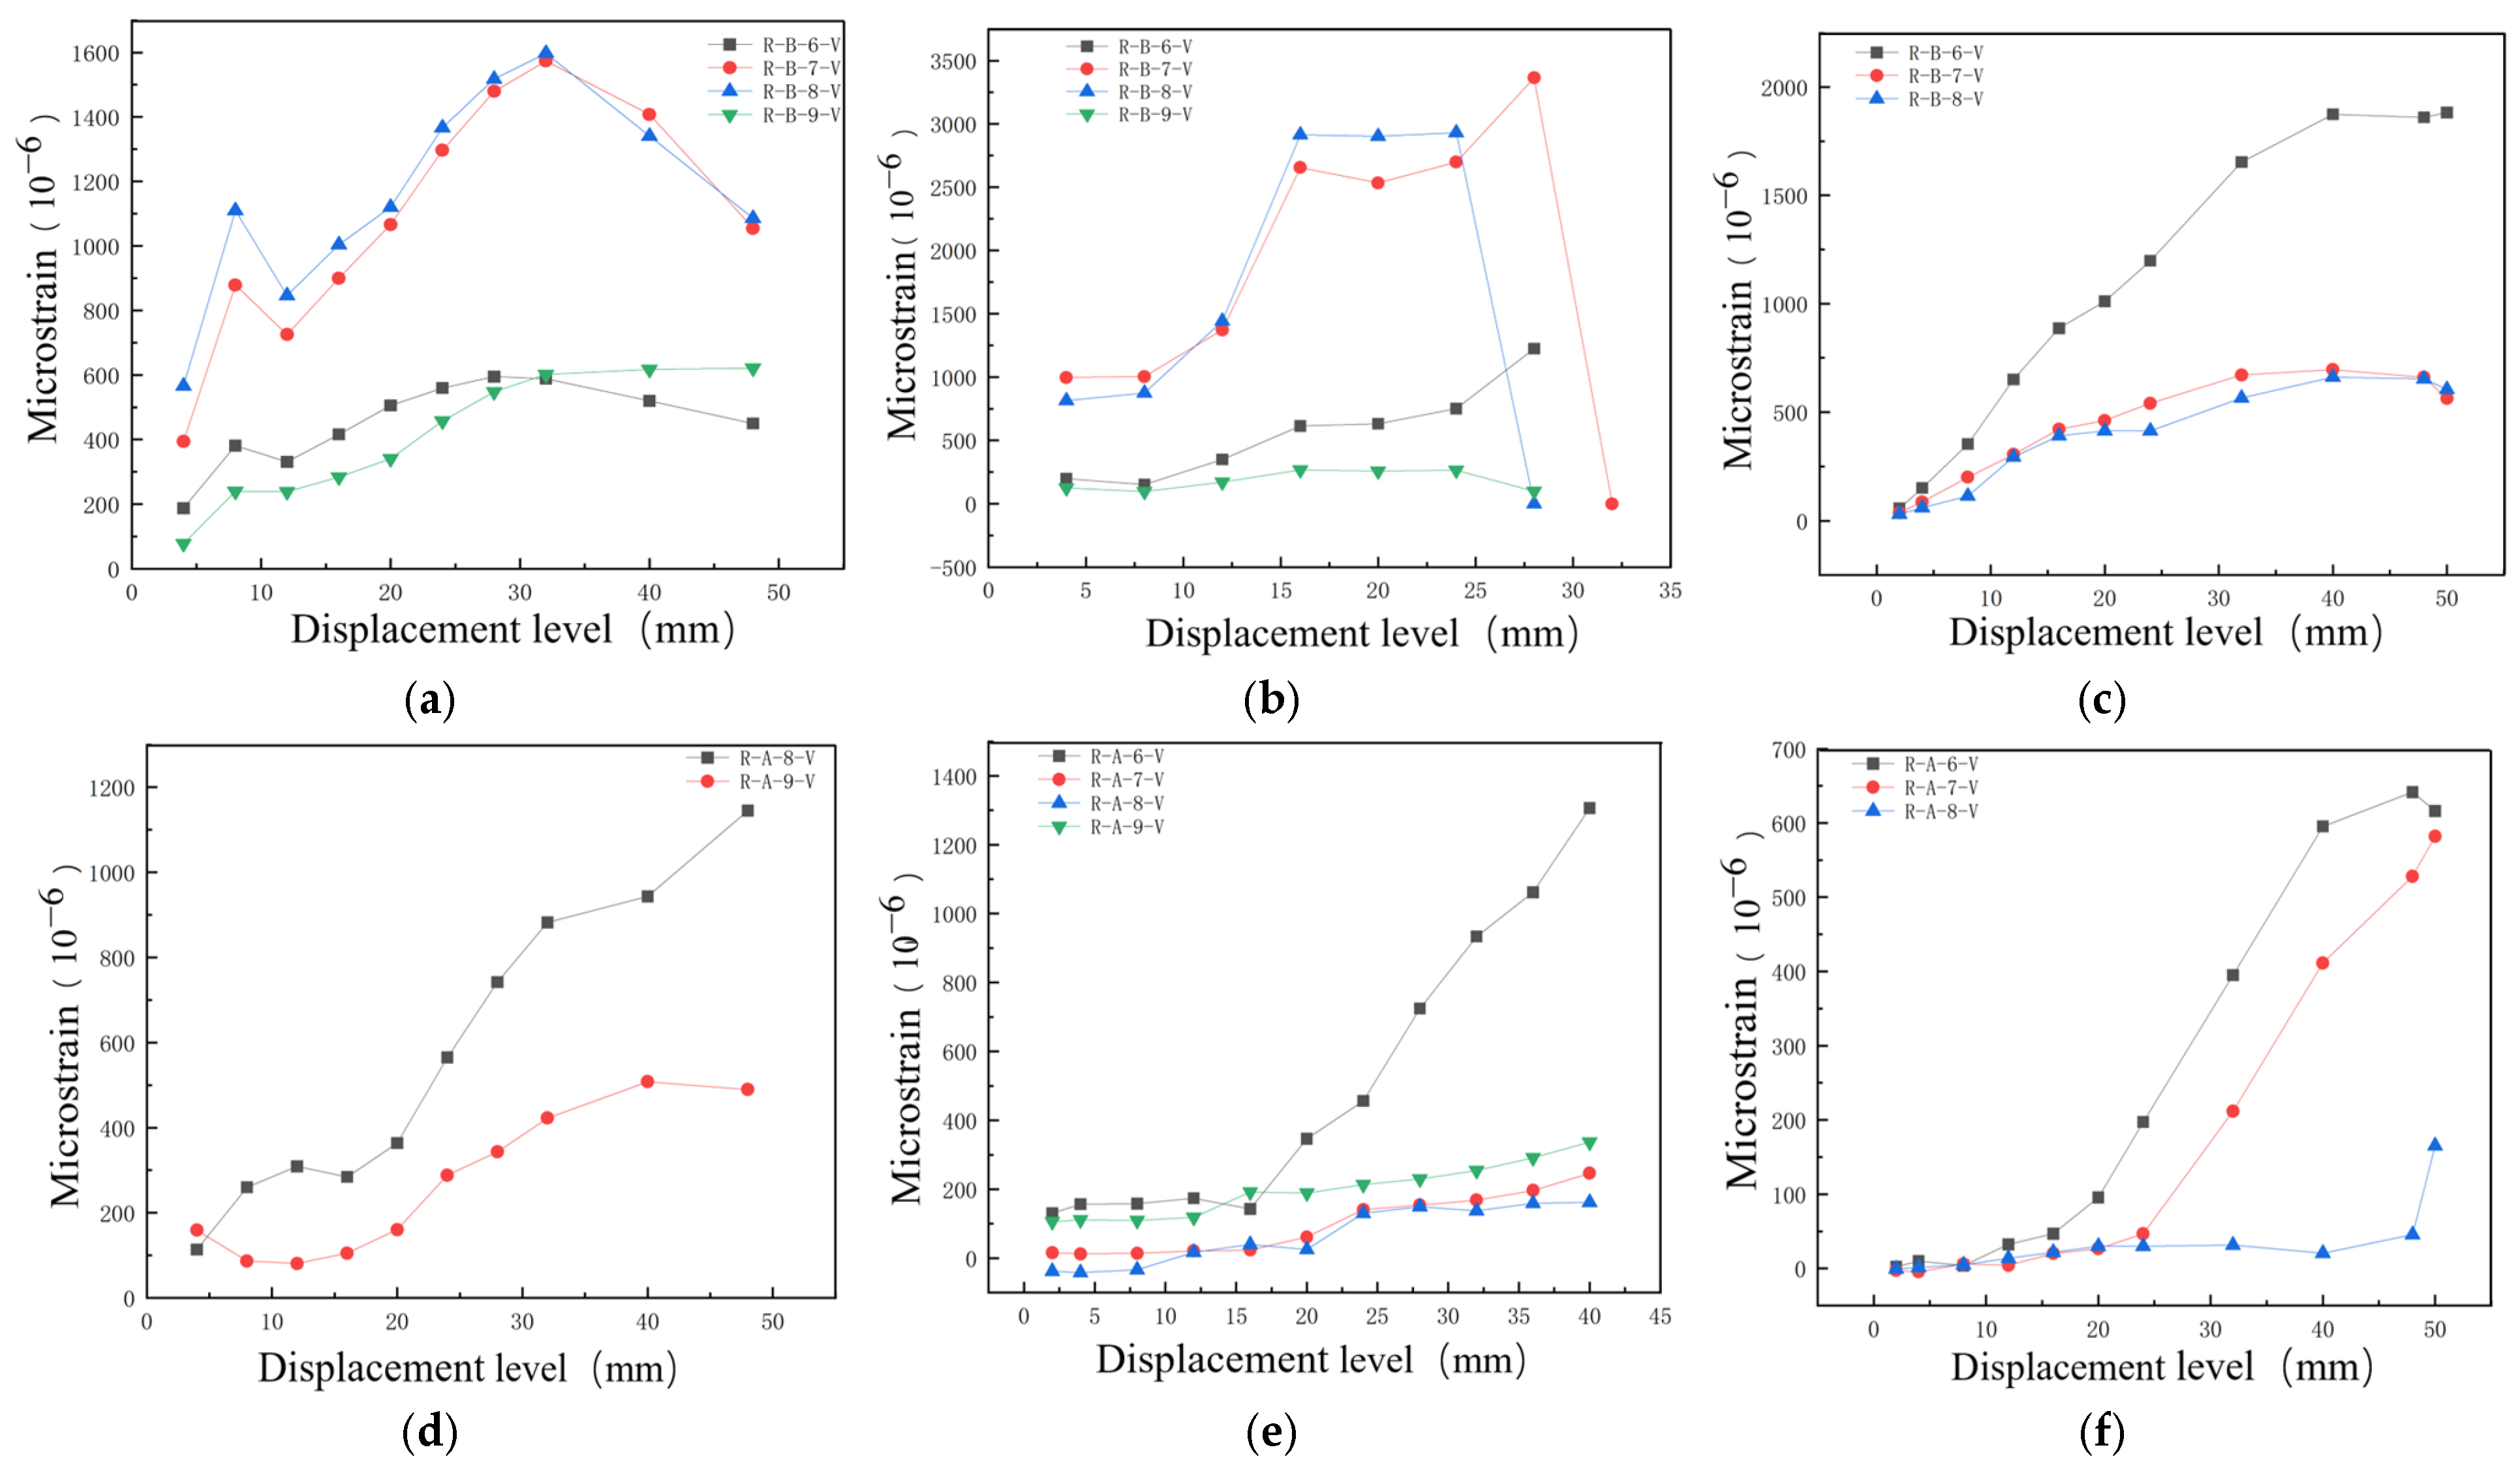
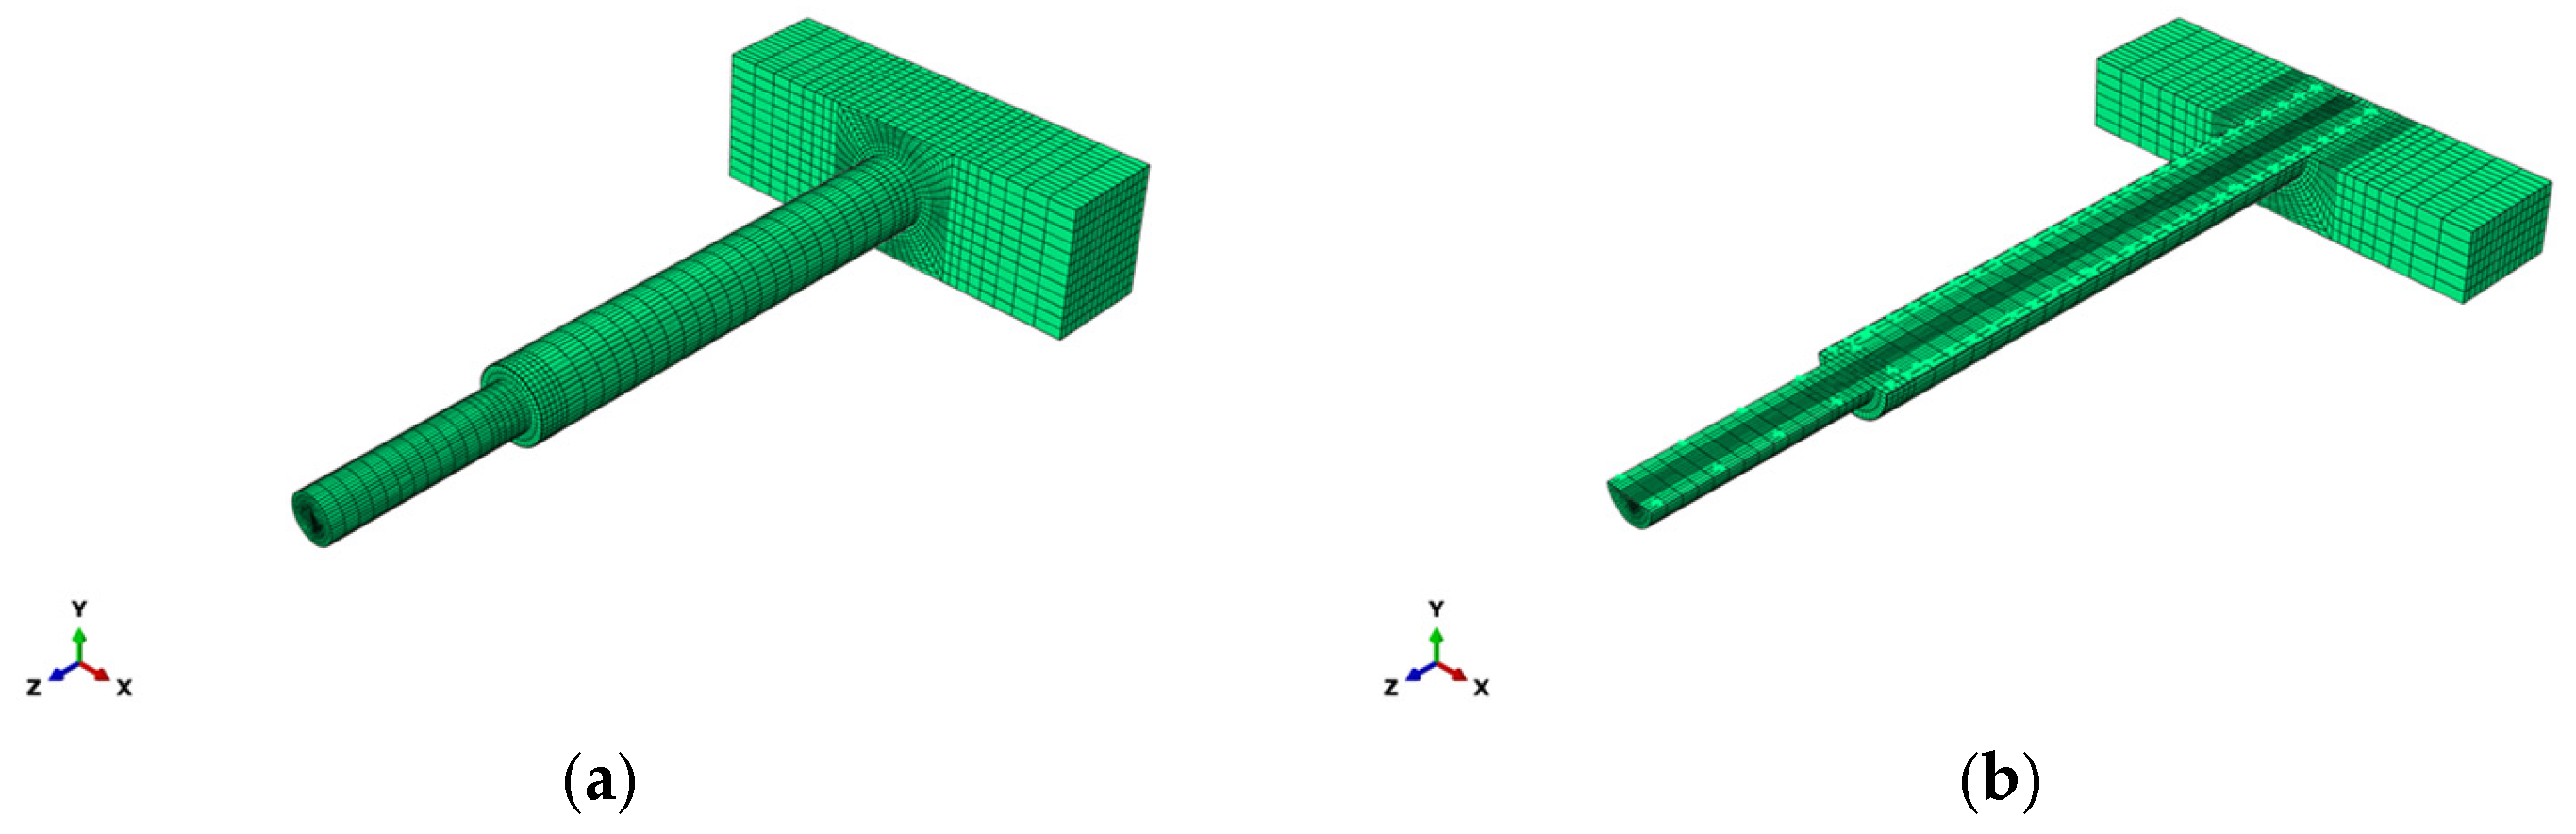
In this paper, three indoor physical model components, RCFST-1, RCFST-2, and RCFST-3, are designed according to similarity criteria based on the prototype structure of the Chongqing Orchard Port Project. And in the sample preparation process, this paper considers the impact of the reliability of physical modeling of sample preparation from the sub [
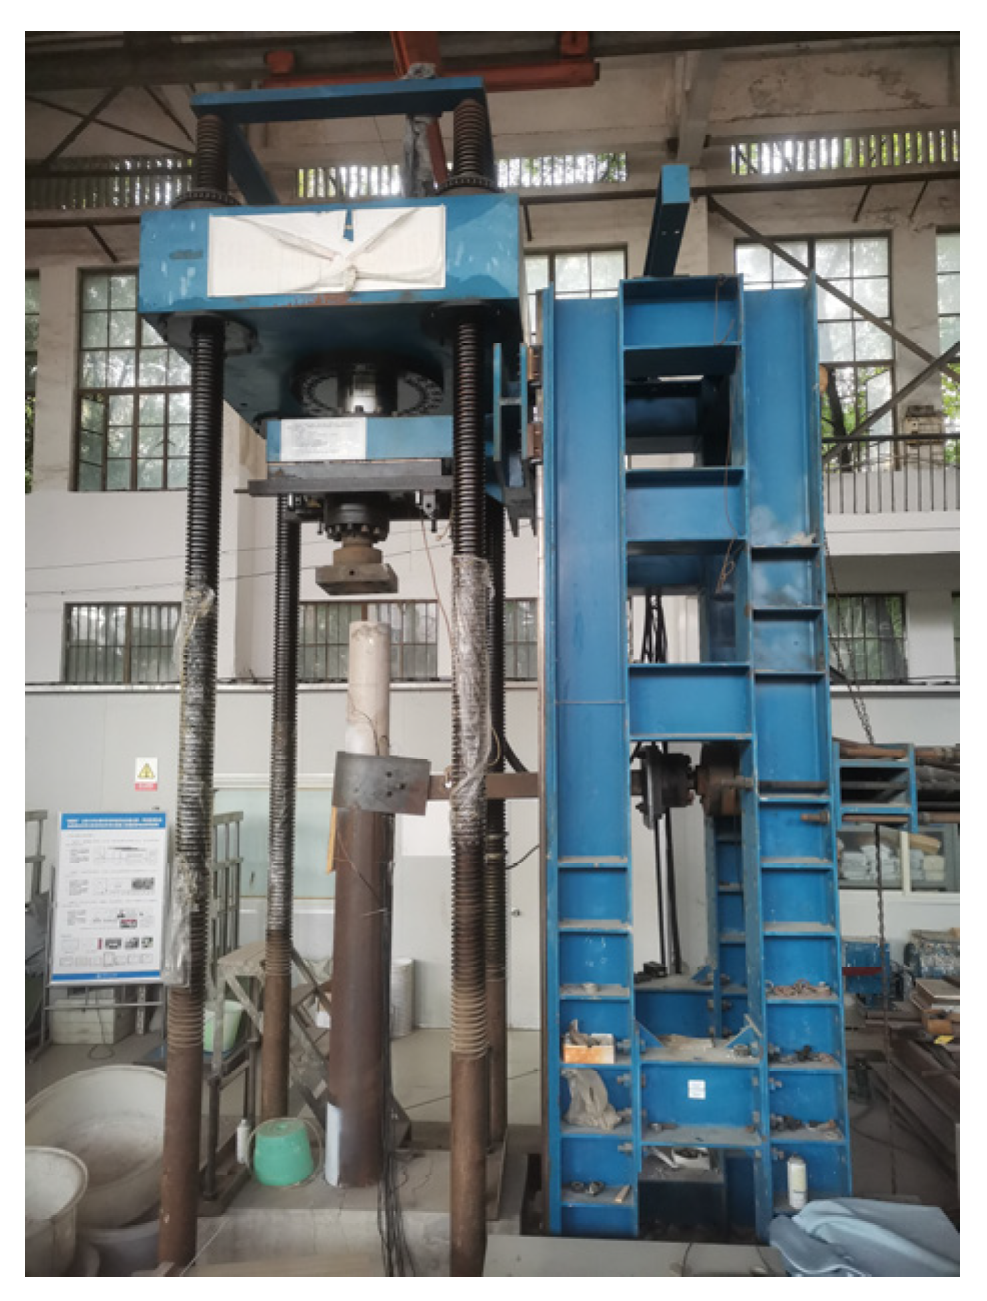
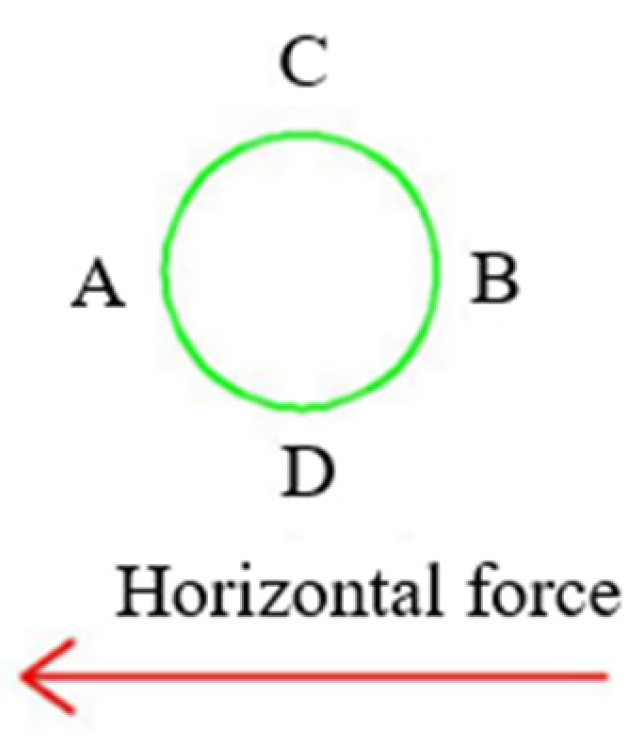
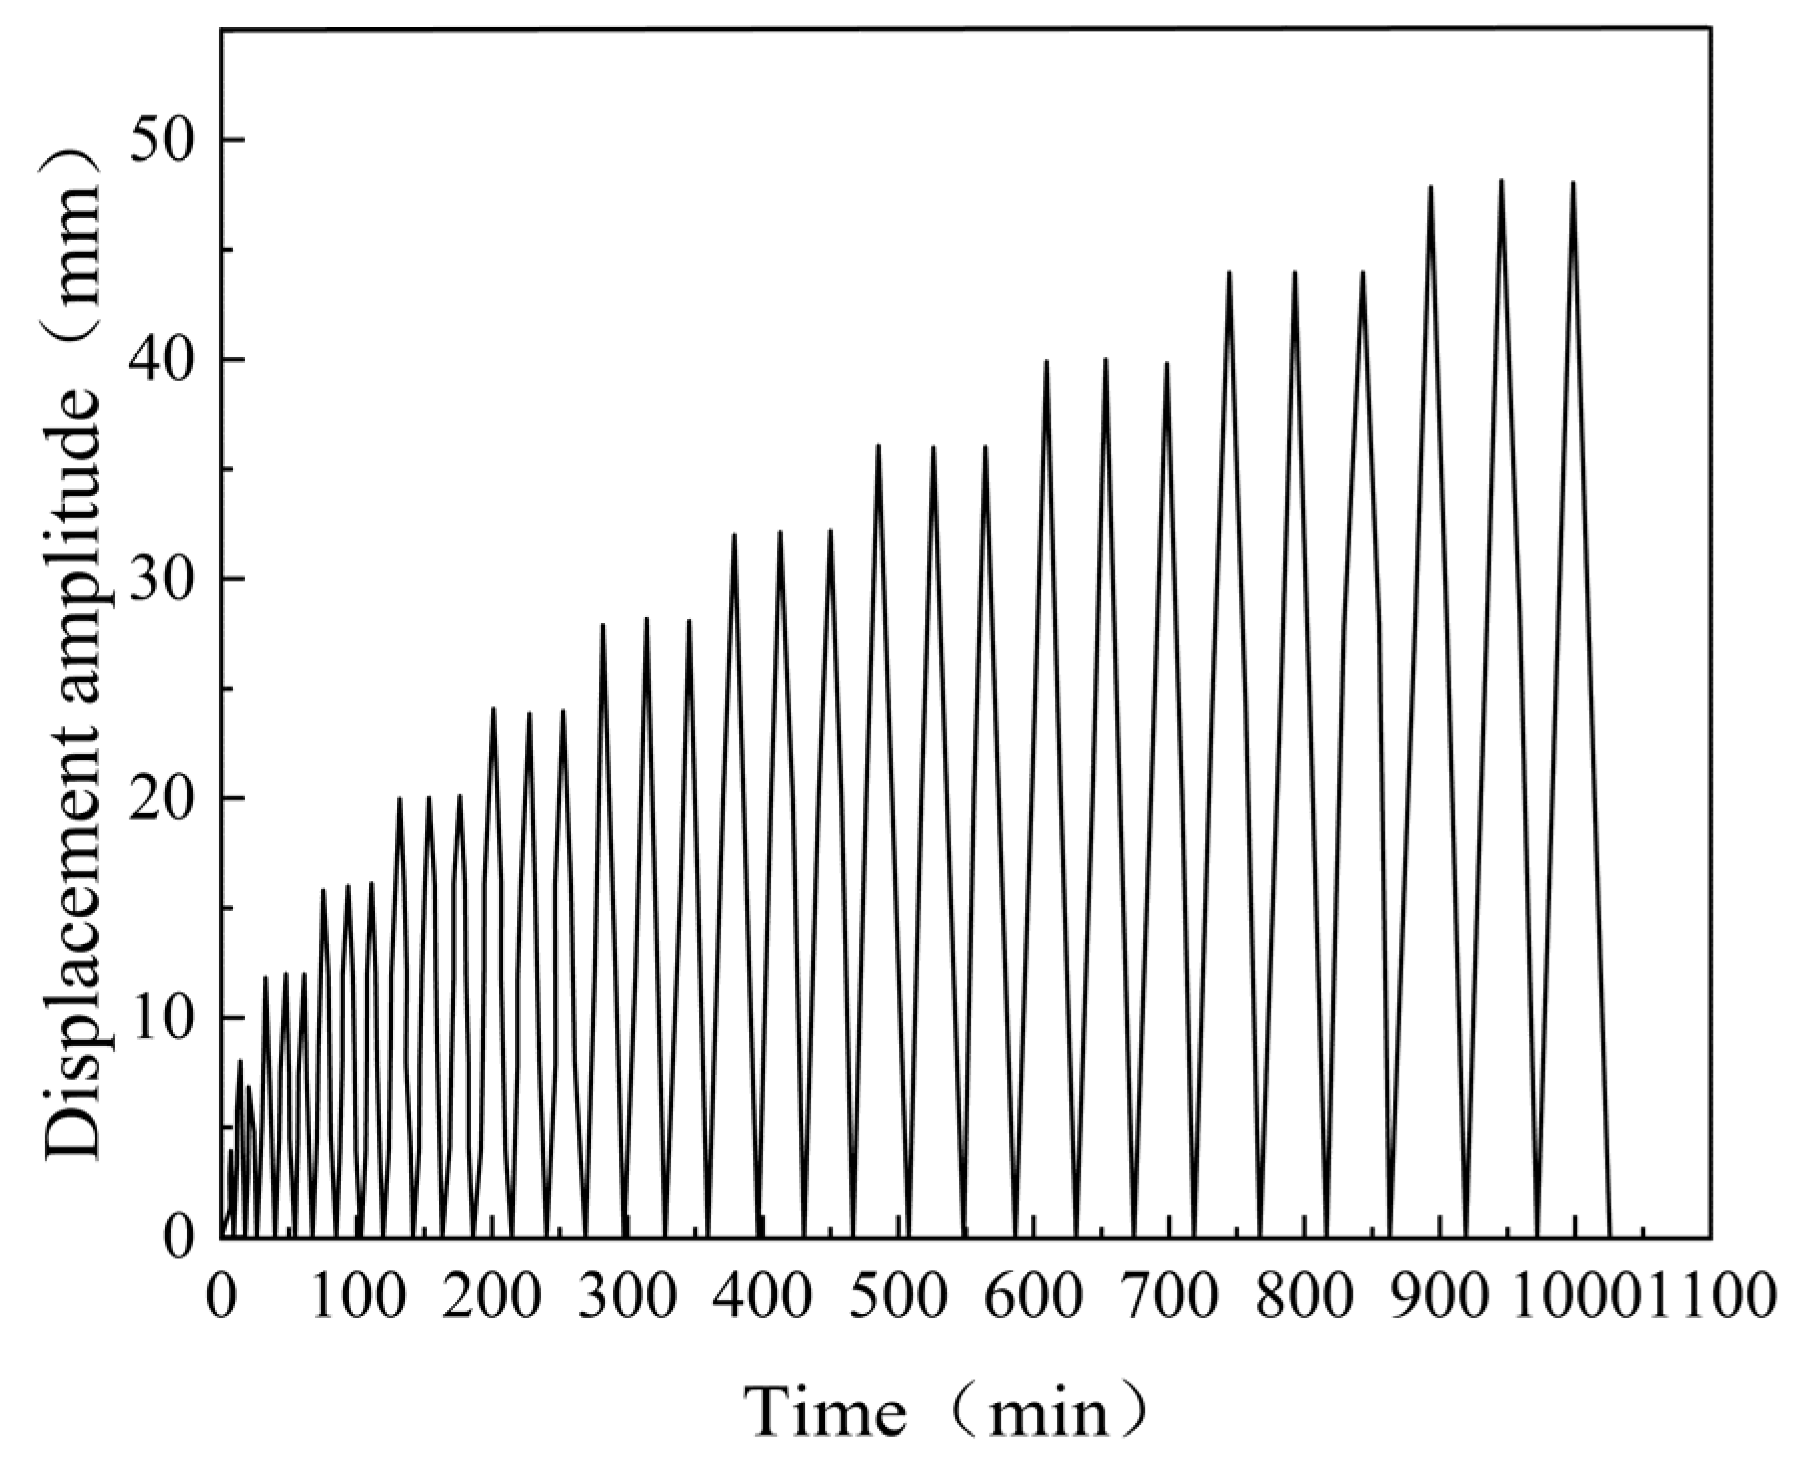
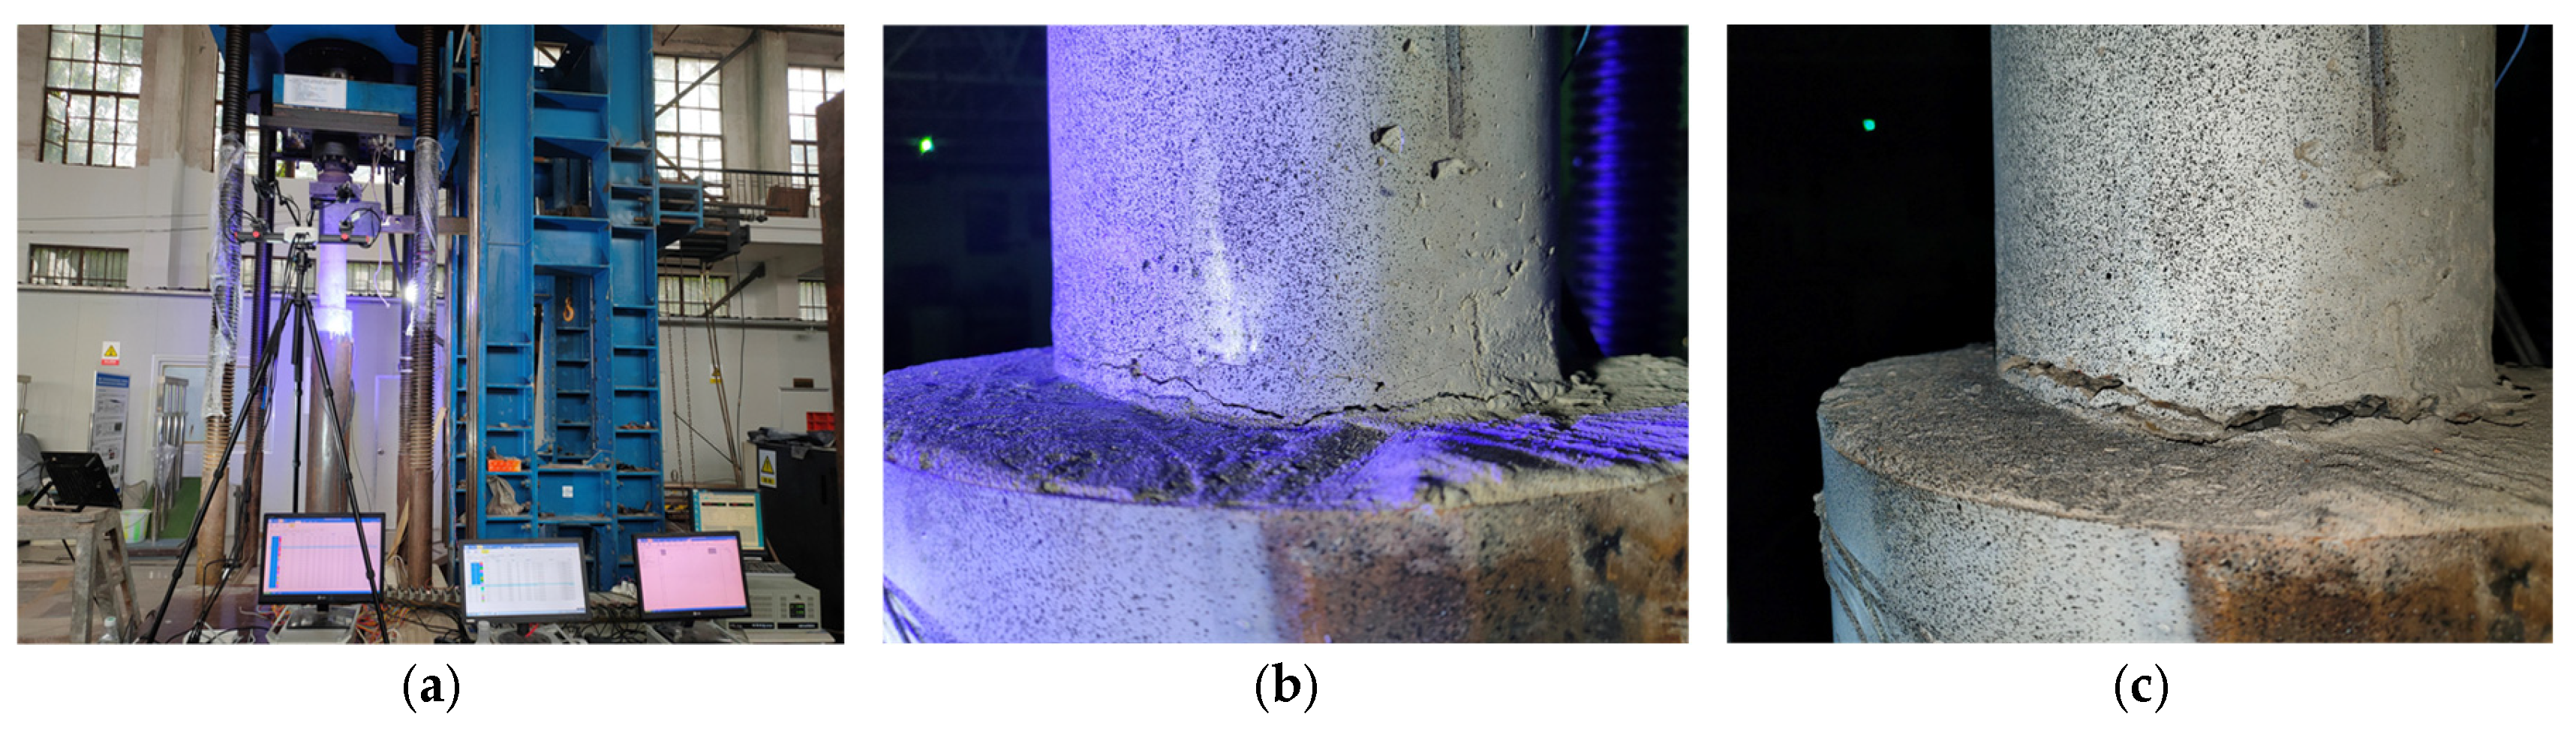
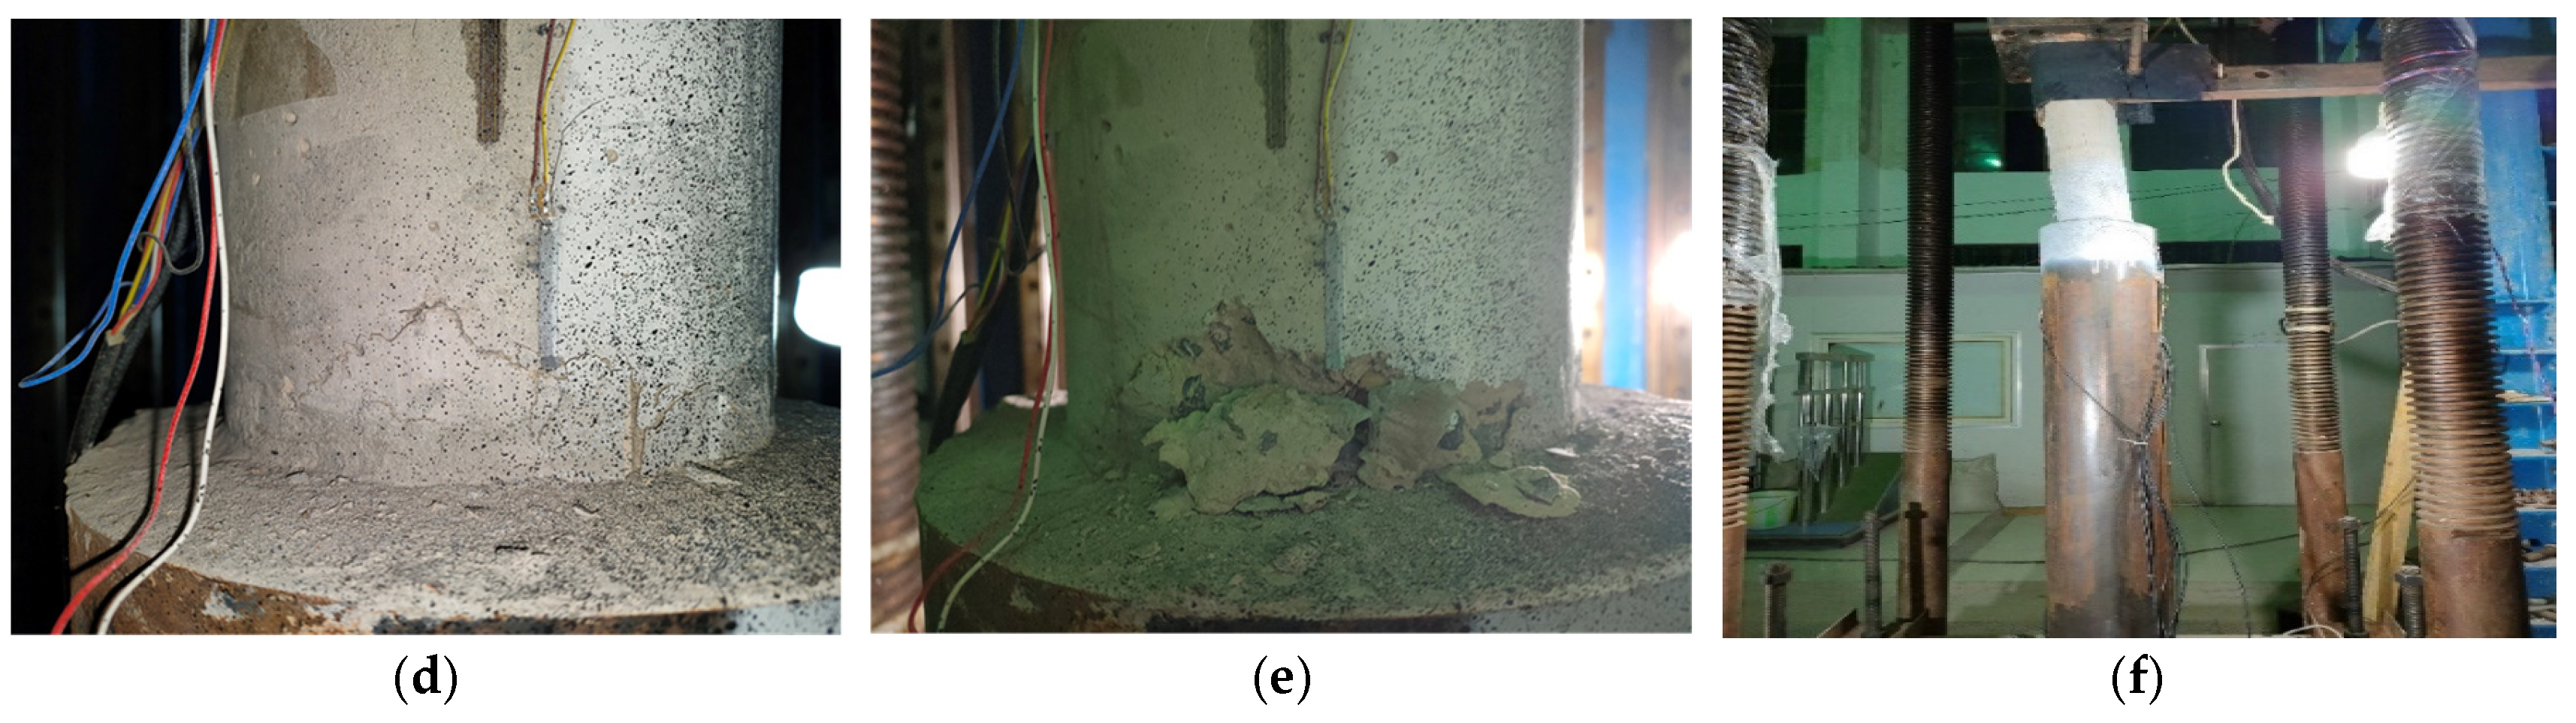
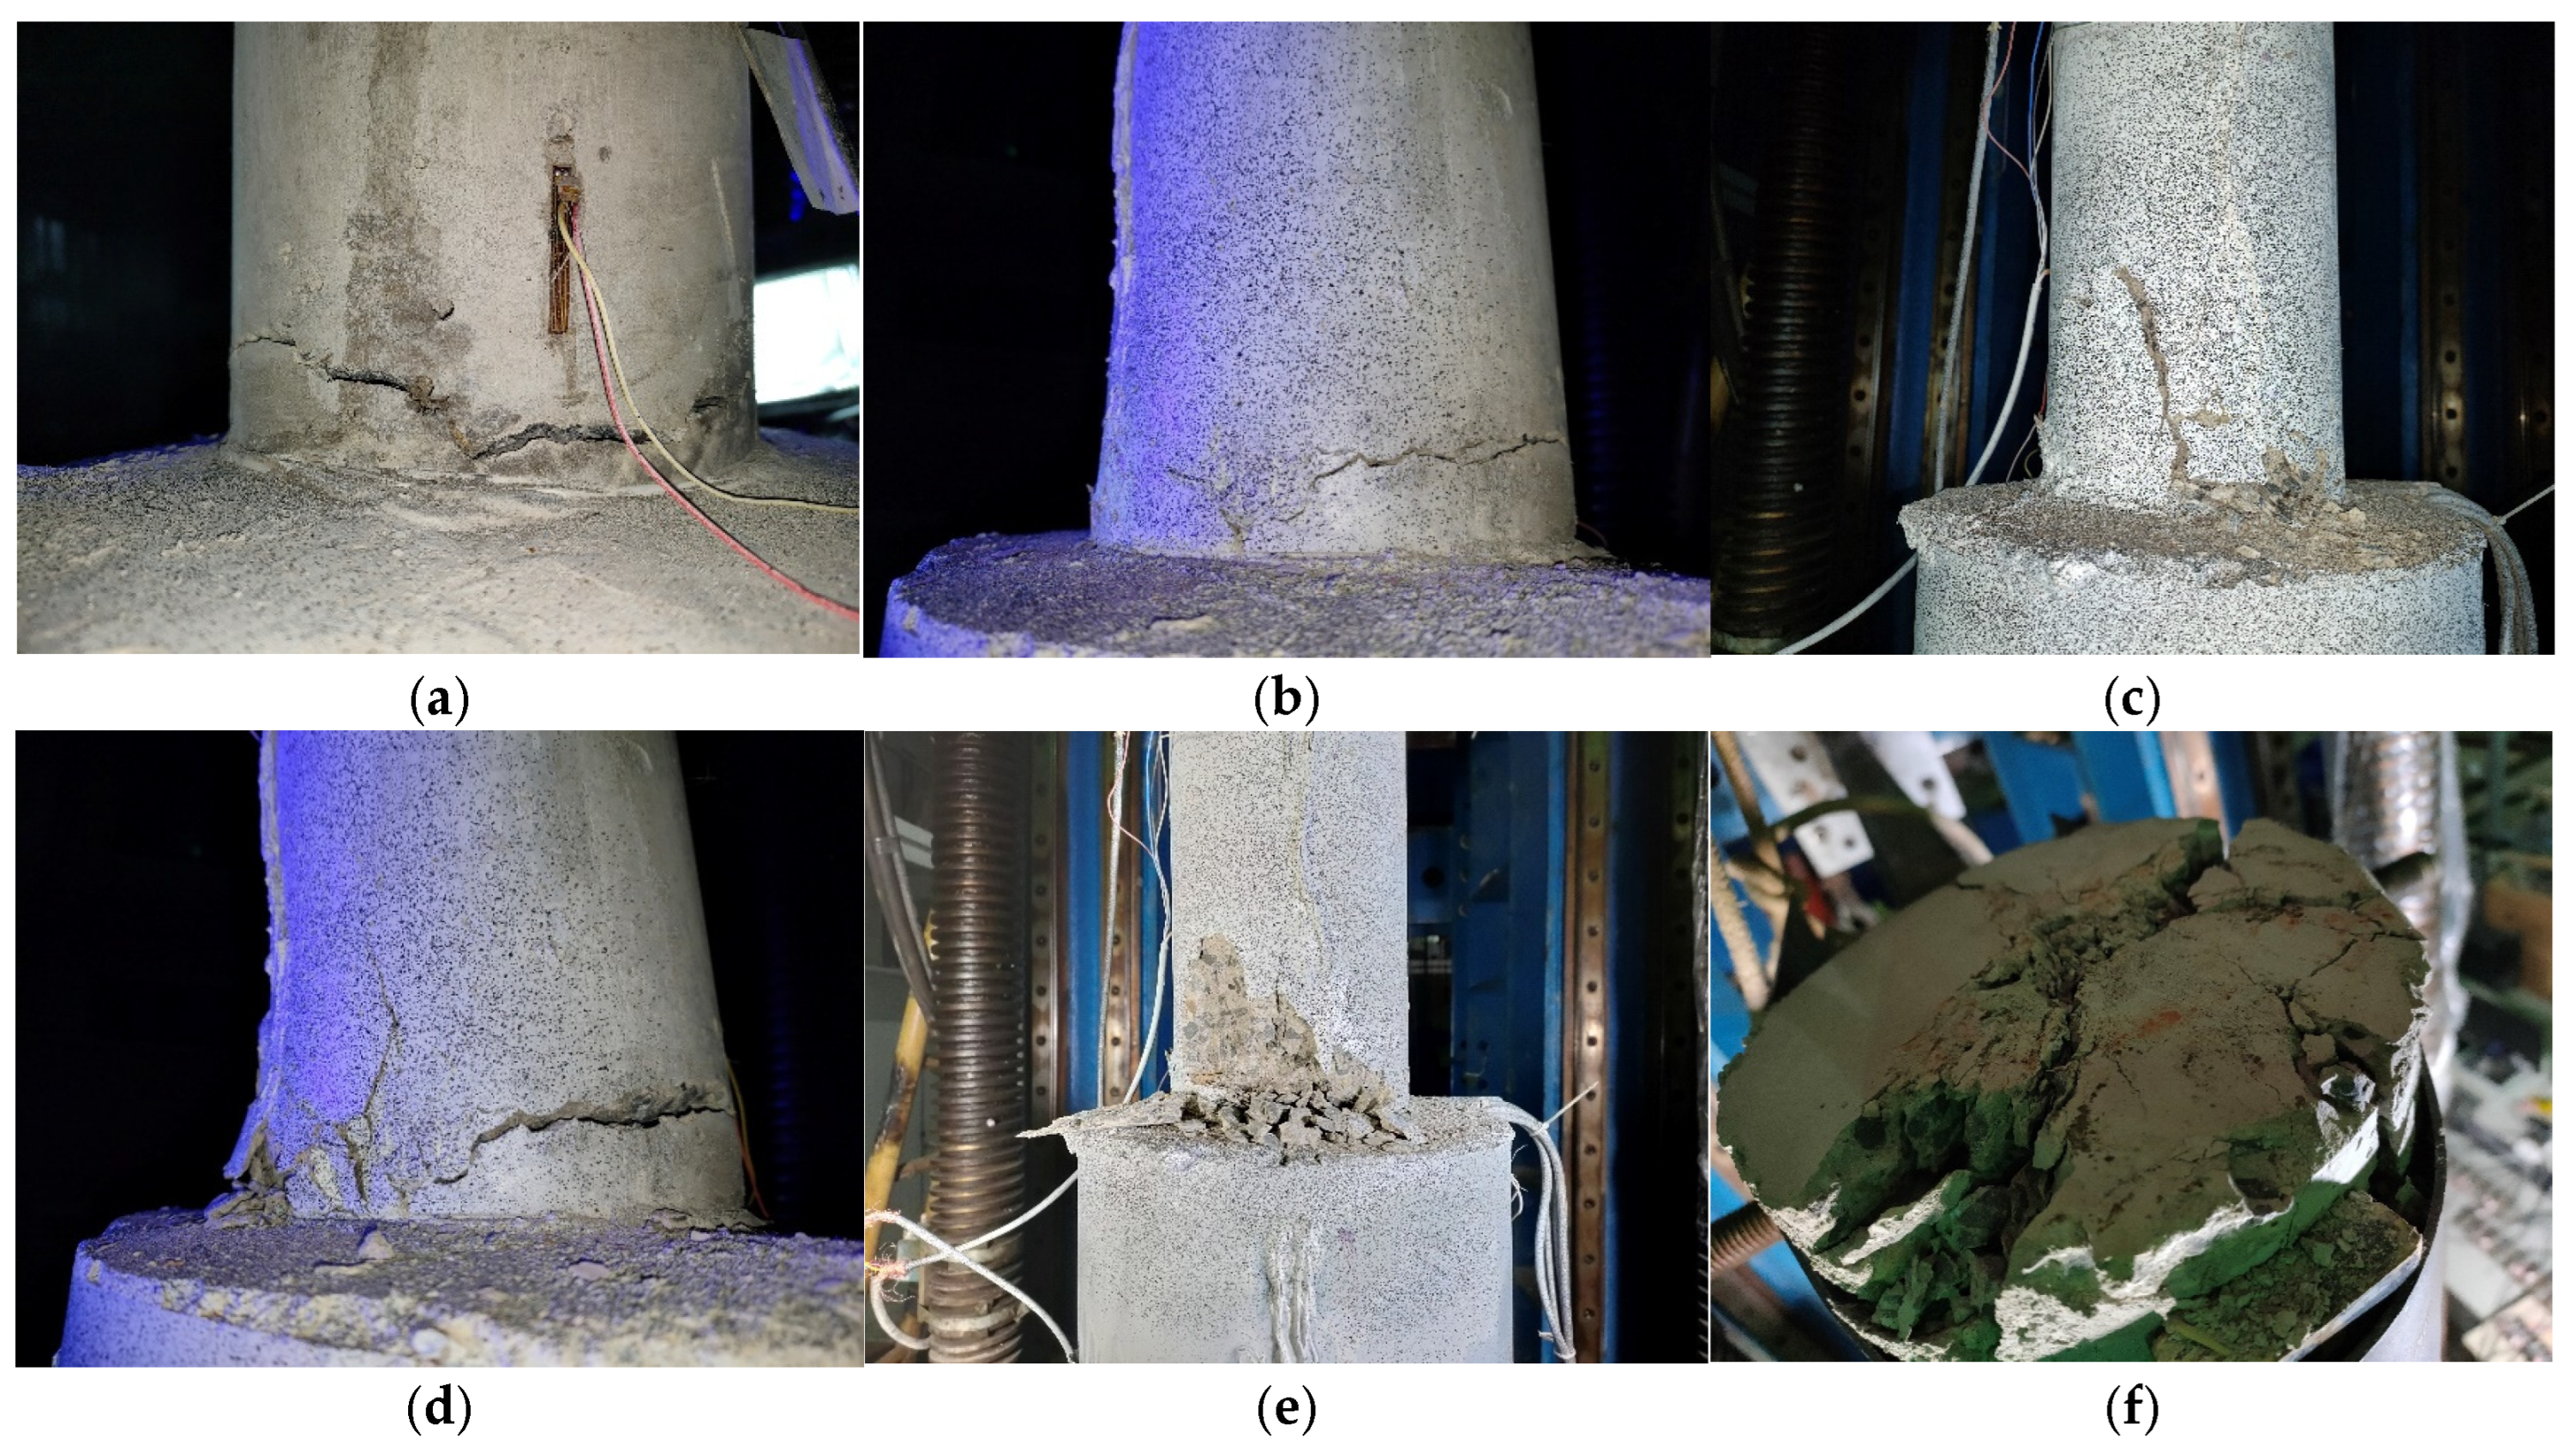
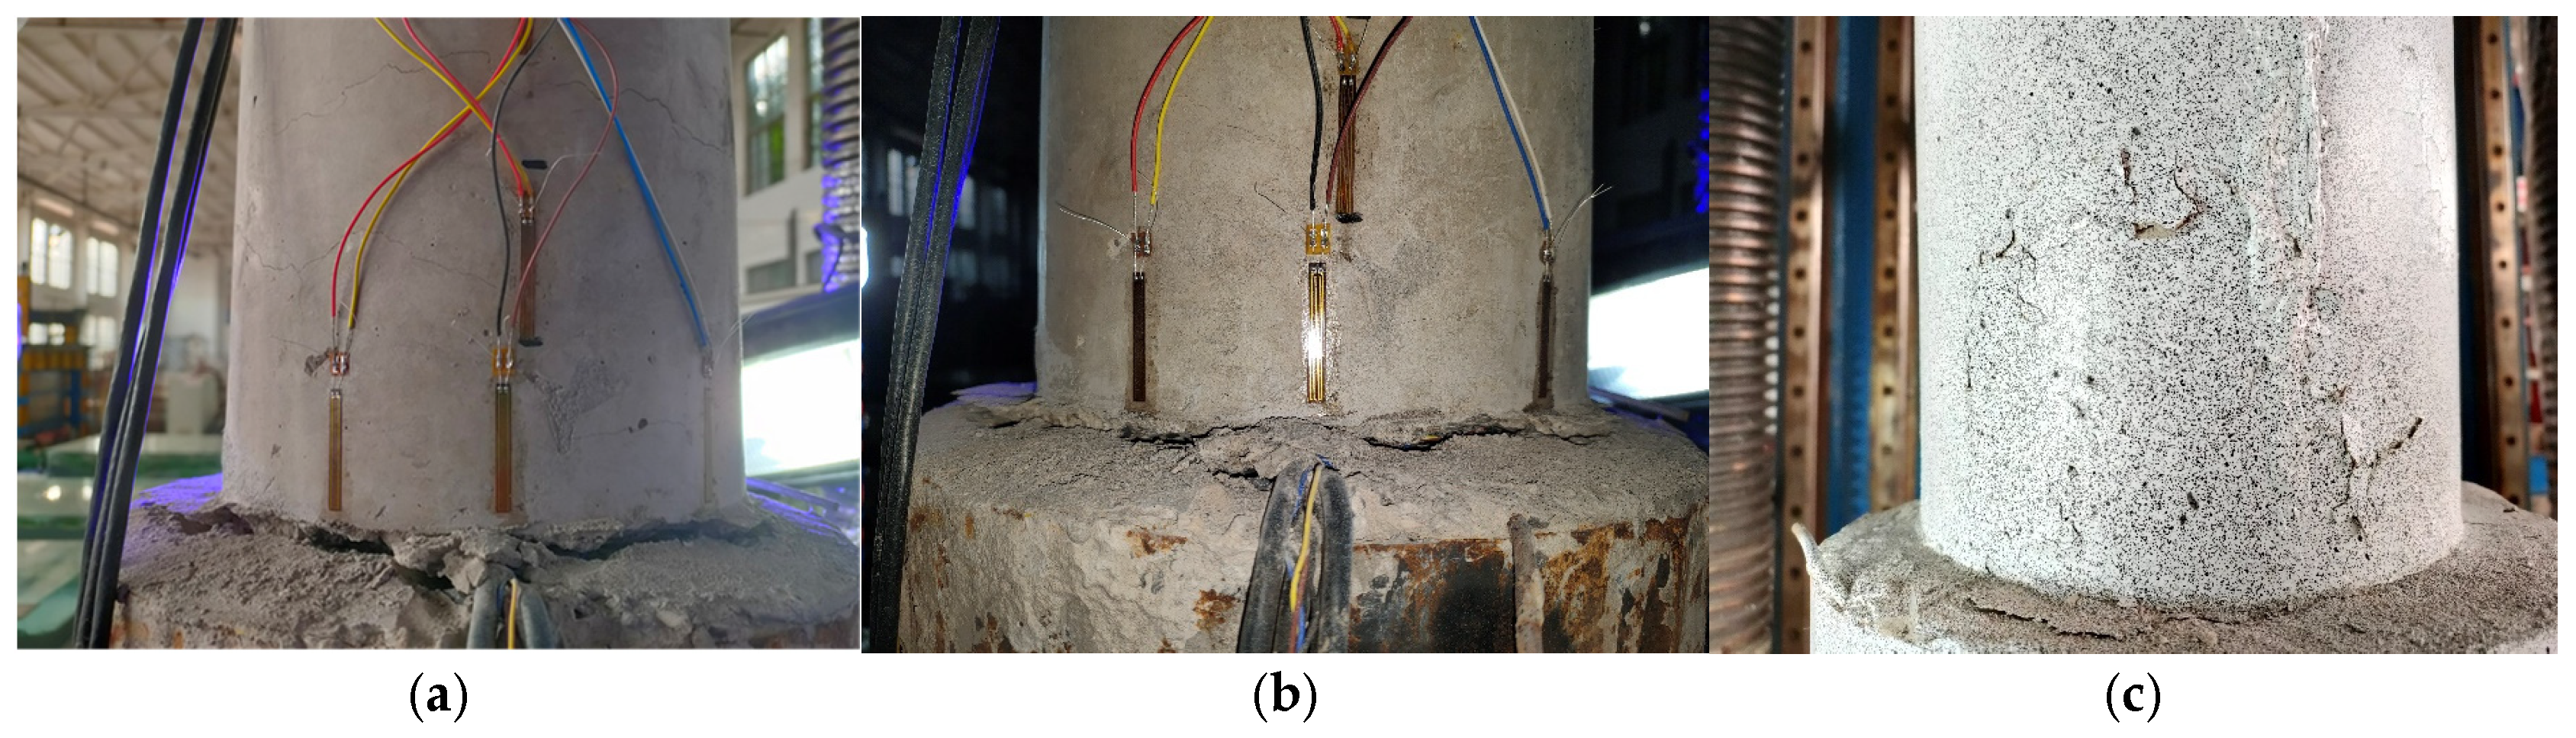
42]. The force development process and the final damage patterns of the combined structure, which is subjected to horizontal low cyclic loading, are influenced by varying the column diameters of the upper column members of the steel casing-reinforced concrete pile composite members. The differences in damage patterns under various variables and the damage patterns of this member are summarized. To investigate the lateral performance of the members under varying parameters, five groups of numerical models were established, each with different compressive axial force ratios, along with three groups representing different foundation strengths. This setup allows for an examination of the effects of each factor on the bearing capacity, ductility, and energy dissipation performance of the members. This paper further enriches the design theory and composite material theory of overhead vertical wharfs in inland rivers with large water level differences through the quasi-static loading test to study the lateral working properties of large-scale steel casing-reinforced concrete pile composite members, which is an important supplement to the research on large-scale steel casing-reinforced concrete pile composite members, with a view of providing a reference for the design of large-scale steel–concrete structures. Meanwhile, this study is of great significance for promoting the theoretical research on offshore hydraulic buildings and the structural design of harbor wharves in terms of both theoretical and practical applications.

2. Experimental Program

2.1. Material Properties

In order to ensure that the designed indoor model is scientific and reasonable, this model will use the method of magnitude analysis to determine the similarity constant between the model and the prototype. The similarity constant of the practical model is based on the general model to control the elastic modulus of the model material to be consistent with the prototype; so, in order to control the similarity constant of the elastic modulus, this test chooses to use the same material as the prototype.
The test steel pipe is rolled from Q235 steel plates (Shandong Hangda Traffic Facilities Co., Shandong, China), conforming to the Chinese specification (GB/T700-2006) [43]. In addition, groove butt welds are used to ensure the weld quality of the steel pipe and reduce the residual deformation of the steel during the welding process. In order to obtain the steel properties, standardized steel plate specimens were cut on the prototype Q235 steel plates according to the Chinese specification (GB/T228.1-2021) [44] for the steel pipe material property test. The test results of density ρ , elasticity modulus E , Poisson’s ratio υ , and yield strength f y were determined as follow: 7850 kg/m3, 206,000 MPa, 0.3, and 235 MPa, respectively. All specimens were constructed using C30 concrete with a strength grade of 38.2 MPa, and the ratio properties of the cement (strength class 42.5) (Zhengzhou Zhongtai Cement Co., Zhengzhou, China), fine aggregate (medium sand), coarse aggregate (0–10 mm stone), and water were 325 kg/m3, 752 kg/m3, 1128 kg/m3, and 195 kg/m3, respectively. The water–cement ratio was taken as 0.60. To obtain the compressive strength of the component model, three non-standard specimens (100 mm × 100 mm × 100 mm) for the cubic compressive test were made in each batch and cured for a period of 28 days. The compressive strength of the concrete cube specimen was measured to be 26.1 Mpa, and the axial compressive strength of the concrete was calculated to be 17.46 MPa using the empirical formula. The elasticity modulus was calculated as 25,185 MPa using the formulae in the specification CEB-FIP (2020) [45], and Poisson’s ratio of the concrete was taken as 0.2 according to the Chinese specification (GB50010-2010) [46].

2.2. Sample Design and Preparation

A total of three RCFST members were designed for this test, with the test parameters being the column diameters of the upper column members of the steel casing-reinforced concrete pile composite members. The length of the cantilever section of the designed member is 2500 mm, and the reinforcement is configured as nine longitudinal reinforcements with a diameter of 6 mm. The inner and outer layers are equipped with 3 mm diameter galvanized iron wire as the inner and outer stirrups, with a spacing of 350 mm and 170 mm, respectively. The specific dimensional parameters of the three components are shown in Table 1. The cross-section of the steel casing-reinforced concrete pile and reinforced concrete column is shown in Figure 1. During the experiment, in order to keep the concrete-filled steel tube without displacement, deflection, and damage to the foundation, the reinforced concrete base was taken to be 400 mm × 1500 mm × 600 mm in height × length × width. In the direction of force in the column, the foundation is arranged with six main bars of Grade III rebar of HRB335, with a diameter of 8 mm and distribution bars at intervals of 18 cm. The front and side profile reinforcement diagrams of the RCFST-1 model and the top view of the foundation reinforcement are shown in Figure 2. Pile and column reinforcement cages were fabricated by means of round gauges; iron nails in thick wooden boards were used to make circular areas with diameters of 250 mm, 228 mm, and 145 mm, respectively. The galvanized iron wire is hooped around the nails to form the reinforcement cage hoop for the piles and columns, where the interface is connected through spot welding. The hoop bars of the advance hoop circle are evenly segmented according to the number of longitudinal bars, and one longitudinal bar is tied at each node. The inner and outer hoops should be arranged at equal spacing along the direction of longitudinal bars, thereby completing the steel cage system. Foundation cages are made by welding the purchased processed L-shaped bars into rectangular frames for subsequent cage lapping. The formwork for the pile section was used directly as a pouring template by using the outer steel cashing, and the column section was purchased with two sizes of PVC pipe and a custom wooden mold with dimensions of 180 mm × 3 mm, 160 mm × 4 mm, and 275 mm × 18 mm, respectively, where PVC pipe is used to pour the concrete.

2.3. Testing Instruments

The experimental loading device was an MTS loading system(Hangzhou Bangwei Company, Hangzhou, China), as shown in Figure 3. The vertical actuator is a fixed tonnage of 500 t, and its end position is fixed on the steel bearing platform, which can be adjusted according to the actual needs of its up and down along the slide. The sliding horizontal actuator is of 100 t tonnage according to the actual load value, which can be used to achieve the loading at different heights with the reserved holes of the counterweight frame. The displacement meter adopts the Donghua self-resetting linear displacement sensor with a range of 0–20 mm, a minimum resolution of 0.01 mm, and a sensitivity of 1. Strain gauges are mainly applied to the 6 mm threaded longitudinal reinforcement, 3 mm galvanized iron wire of the cage, 275 mm diameter steel sheaths made of Q235, and the surface of the reinforced concrete column. The four faces of the specimen are shown in Figure 4. The specific arrangement positions of various types of strain gauges before strain are shown in Table 2 and Table 3, and the detailed arrangement diagram of strain gauges is shown in Figure 5. (The first letters, P, C, and R, in the measurement point number indicate pile, column, and steel reinforcement, respectively. The second letters, A, B, C, and D, stand for the prescribed directions. The third digit stands for the order from the bottom up. The fourth letters, H and V, stand for horizontal and vertical, respectively.) The acquisition system (Tianjin Lexun Co., Tianjin, China) uses five 16-channel DH5922 and DH5923 dynamic signal test and analysis systems, with supporting software to monitor and store the strain gauge data during the test. The system is accompanied by adapters DH3810N and DH3810 for strain gauge measurement and 1395 connecting cables.

2.4. Test Procedure and Loading Sequence

To simulate the low circumferential repeated loads on the wharf under the scenarios of ship berthing and wave reciprocation, this test is conducted to investigate the damage pattern and cumulative energy dissipation of the assembled pile-column members under low circumferential repeated loads by performing the proposed static test. The displacement-controlled loading method was employed throughout the test, with the loading position at the top of the column and with a loading rate of 0.03 mm/s. Combining the code as well as the experience of the thesis, it was learned that the axial pressure was first applied at the top of the column before the experiment was carried out. While applying, 50% of the axial pressure value was taken for preloading and then unloaded. Then, the sample was loaded to the required value and applied to the horizontal repeated load once. The main purpose of this method is to eliminate the internal defects of the steel casing-reinforced concrete specimen and at the same time to check whether the working performance of each test equipment and measuring instrument is intact. Initially, the load level difference is 2 mm, increasing from 0 mm to 4 mm, with each load level cycling once. Subsequently, the displacement level difference was increased to 4 mm, with loading cycles of 2–3 times per level; the displacement loading curve is shown in Figure 6. During the course of the test, it is necessary to combine the changes in the strain gauge values of the steel casing and the longitudinal reinforcement during the test with the real-time drawing of load–displacement curves using the proposed static test program. In order to monitor the test process and determine the yield load and displacement of the specimen, we verify the estimated values and make timely adjustments. In this test, the outer envelope of the hysteresis curve (skeleton curve) is used as the yield point, as there is a significant stiffness degradation. The peak load point corresponding to the hysteresis loop at 10% strength degradation at the same displacement amplitude or the starting point of the section where the bearing capacity decreases significantly during cyclic loading to the next displacement amplitude is taken as the final point of failure, and the load is applied until the bearing capacity decreases to 85% of the ultimate load.

3. Experimental Results and Discussion

3.1. Test Observation

By observing the damage process of the members, it was found that the test phenomena of the three specimens with different slenderness ratios were similar during the loading process. Figure 7 shows a diagram of the RCFST-1 test. For specimen RCFST-1, two small transverse cracks appeared at the bottom 2 cm of the B-side of the column under tension and spread to the C-side at the completion of the first 8 mm grade load. With the increase in the grade load, the crack width increases and spreads to side D. Throughout the completion of the first 28 mm grade loading, the cracks at the roots of the three faces were completely connected, forming a through crack. At the completion of the first 40 mm grade loading, the hysteresis curve’s skeleton curve of the member shows a descending segment, indicating that the ultimate load had been reached. After the 40 mm displacement grade loading was completed, the root cracks in the tensioned B-surface increased significantly. The internal coarse aggregate is clearly visible, and the core region of the reinforcement cage is exposed. In addition, the crack edge of the concrete at the bottom of the column was crushed and dislodged as the pressure increased on the compressed A-side, and a clear crack direction appeared. At the completion of the final 48 mm grade load loading and unloading, the concrete on the A-side of the pressurized area was dislodged along the cracks in one piece, and the dislodged area was within 50 mm.
Figure 8 shows a diagram of the RCFST-2 test. In the case of specimen RCFST-2, a correction error was made during installation, resulting in a small crack on the tensile side of the column portion of the member. Combined with the development of the damage pattern of the previous specimen, the tensile side of the column cracked under a very small displacement load, which had little effect on the purpose of this experiment (development of the damage pattern of the member), and the reciprocal loading and unloading tests could be continued. When the load level reaches 12 mm, the initial crack grows significantly and spreads to both sides. When the load level reaches 24 mm, the crack connects the B-, C- and D-sides. When the load rating reaches 36 mm, the crack width of the tensioned C-side rapidly expands and spreads to the bottom root of the column. The cracks on the B-, C- and D-sides are connected to form a penetration crack, and the internal coarse aggregate on the tensioned B-side can be clearly discerned. When the loading was continued to 40 mm, block cracks appeared at the compression surface, and the compression vertical cracks were increasing, while the load bearing performance of the member was decreasing. In order to understand the final damage morphology of the member, the slow push-to-test experiment was carried out on the member. Until the displacement load reached 68 mm, the member was completely damaged, with severe cracking on the tensile side, and extrusion vertical cracks and compression diagonal cracks appeared on both sides. The concrete was crushed and spalled at the block cracking on the compression A-side. The coarse aggregate in the protective layer was exposed through compression scattering, and its shedding was within 150 mm of the bottom of the column. At the same time, under the combined action of the confining pressure of the hold hoop and the load at the top of the column, the pile top collapses.
Specimen RCFST-3 has a certain difference in the bearing capacity and damage form from the previous two specimens due to its small slenderness ratio. Figure 9 shows a diagram of the RCFST-3 test. When the load was loaded to 20 mm, four small cracks appeared on the tensile side of the column. Three of the cracks were 30 mm, 70 mm, and 130 mm away from the bottom of the column, and one crack was 70 mm away from the bottom of the column and spread to the C-side. This is different from the crack distribution in the previous members. When the load rating reached 24 mm, in addition to crack growth, small cracks were found between the top steel casing and the internal reinforced concrete of the steel casing-reinforced concrete portion of the member. This means that the bond state between the steel casing and reinforced concrete was damaged during the continuous loading and unloading process, and minor bond slippage occurred. When the load was loaded up to 32 mm, the cracks on the upper part of the column developed slowly. The crack at the root junction developed rapidly and spread to both sides of C and D, constituting a penetration crack. When the load was loaded to 48 mm, the member reached the ultimate bearing capacity, and the cracks on the tensile B-side intensified. The concrete surface of the compressed A-side was covered with vertical compression cracks, and the concrete began to fall off in pieces. After unloading was completed, transverse cracks appeared at the root junction of the compressed A-side. When continuing loading up to 50 mm, the bearing capacity of the member was reduced, and the tensile and compressive sides were severely damaged. The concrete crushing in the compression zone of the member was shallow, and there was no dislodgement of concrete coarse aggregates. However, horizontal cracks were observed at the bases of the columns on both sides A and B, and the bearing capacity decreased more rapidly after reaching the ultimate load, indicating brittle failure.
In general, members with different slenderness ratios showed similar damage development. Horizontal cracks on the tensile side of each member developed and spread to form penetration cracks, promoting the emergence of extrusion cracks and vertical diagonal cracks on the compression side. In the final damage, the horizontal cracks on the tension side were wide and penetrated deep into the inner core concrete, with the aggregate clearly visible. The surface of the protective layer concrete on the compressed side is cracked and broken off. However, there are some differences in the spreading trend of the crack and the final damage pattern.

3.2. Strain Analysis

From Figure 10a–c, it can be seen that the maximum values of column concrete surface strains for specimens RCFST-3, RCFST-2, and RCFST-1 are approximately 100 mm, 100 mm–150 mm, and 150 mm. This is somewhat different from the area of concrete dislodgment because the concrete dislodgment is not purely due to compressive damage. As shown in Figure 10d, the compressive strain is much smaller than the theoretical ultimate compressive strain. And the main reason for concrete shedding in the compression area is because the compression side of the column was subjected to the combined effect of reverse tension and crack penetration on the tensile side during the loading and unloading process of the column, resulting in a reduction in the compressive strength of the compression side. Eventually, the concrete on the compression side collapses and falls off, leading to a decrease in the force area, which exacerbates the reduction in the bearing capacity of the member. Figure 10d shows the distribution of the maximum compressive strain at each point along the column, and it can be seen that the maximum strain is concentrated in the distance of 100 mm–200 mm from the bottom of the column, which roughly corresponds to the location of the cracking cracks in the first block of the concrete. From the above, it can be concluded that the distribution of different specimens of the compression zone, namely the strain at 100 mm, 150 mm, and 200 mm from the bottom of the central, is greater than that at 50 mm and 300 mm from the bottom of the two ends. This is related to the large plastic deformation of the column, which produces a plastic hinge in the compression zone.
From Figure 11, it can be seen that the main stress area of the reinforcement cage is within 150 mm, and the overall performance of the concentrated compressive deformation zone is lower than the concentrated tensile deformation zone. This is because there is a certain difference in the location of the maximum value due to the individual differences in the specimens. The vertical strain in the reinforcement on the tension side is greater than the vertical strain in the longitudinal reinforcement on the compression side, and the vertical strains in tension and compression occur alternately. In addition, the first strain gauge R-B-6-V of specimens RCFST-1 and RCFST-2 was significantly much smaller than the strains at the upward bias position, which was different for specimen RCFST-3. The possible reason for this is that specimens RCFST-1 and RCFST-2 have smaller column diameters and less flexural stiffness in the column section, resulting in a relatively upwardly biased stress region. Specimen RCFST-3 has a larger column diameter and a smaller slenderness ratio, which is more inclined to the force characteristics of short columns. And the column part of the section bending stiffness is larger, so the force position of the reinforcement cage is lower.
From Figure 12 and Figure 13, it can be found that compared with RCFST-1 and RCFST-2, the steel casing and the reinforcement cage at the bottom of the pile of component RCFST-3 are most obviously stressed, and the plastic hinge region is initially formed at the bottom of the pile. The forces in the steel tubular piles of component RCFST-1 are slightly greater than those in the RCFST-2 steel tubular piles, but they are in the elastic phase of operation, which is a poor utilization of the material properties of the overall component.

3.3. Hysteresis Curves

From Figure 14, it can be seen that the shape of this hysteresis curve is a typical inverse S-shape, which is affected by slip and has a poor degree of fullness. And the ductility performance and energy dissipation performance are not like the hysteresis curve of pike and bow. It shows that this structure has poor ability to absorb energy when subjected to dynamic loads (earthquake and explosion), limited plastic deformation capacity, and poor seismic performance. Among them, specimen RCFST-3 is the driest, implying poor energy dissipation performance and deformation performance, which is consistent with the nodal damage pattern of reinforced concrete column structures. In addition, the members had very small residual displacements and large initial stiffness within 2 mm displacement. As the load continues to increase, the column cracks. At this time, the force transmitted to the steel tubular pile was weakened, and the integrity of the member was weakened. The upper and lower parts of the column could not coordinate the deformation, in which the deformation of the upper part of the column was larger than the deformation of the steel tubular column part. This indicates that the stiffness of the member decreases, and some plastic deformation occurs. The loading stress path basically coincides with the stress path of the previous loading level, indicating that no obvious strength degradation has occurred yet. Unloading is carried out with initial modulus then slowly with plastic deformation unloading, and even a certain amount of residual strain occurs, making the member tensile in the reverse direction. The complete closure of the formed concrete surface cracks, but at this stage, the reinforcement cage has not yielded and is still in the elastic phase. When the three members were loaded to 20 mm, 20 mm, and 32 mm load levels, respectively, the members showed obvious strength degradation, while the loading of the members caused further stiffness degradation. After unloading, there was no growth in the elastic unloading stage, but growth occurred in the plastic unloading section. Overall yielding of the member occurs at this stage, mainly due to the yielding of the stressed longitudinal reinforcement, which produces a plastic hinge at the bottom end of the column. By continuing loading, the shear crack at the bottom of the column increased until a penetration crack was formed, and the internal longitudinal reinforcement slipped along with the protective layer concrete and core concrete. This indicates that the overall bearing capacity of the members reached its limit and decreased rapidly. The ultimate loads of the three members were 18.62 kN, 13.09 kN, and 22.35 kN, respectively, and the corresponding displacements were 36.86 mm, 36 mm, and 48 mm. At this time, the residual displacements increased substantially, which was related to the crack penetration and misalignment of the internal aggregate fragments. Overall, along with the loading and unloading of the members, the stiffness and strength degradation of the members, the accumulation of plastic deformation, the decrease in energy dissipation capacity, and the significant increase in residual displacement seriously weakened the structural seismic toughness and post-earthquake recoverability.

3.4. Skeleton Curves

To obtain the yield load and yield displacement, this paper uses the energy equivalence method to identify the yield point of the member based on the principle of Figure 15. The principle uses the folded line OYN instead of the original P- skeleton curve, so the area enclosed under the folded line OYN is equal to the area enclosed by the original skeleton curve, as shown in Equation (1)
S OABNM = S OBYNM = Δ max + Δ max Δ y P max 2
where Δ y is the yield displacement of the specimen, P max is the maximum load, and Δ max is the displacement corresponding to the maximum load. The yield displacement Δ y can be solved according to the formula to obtain the corresponding yield load P y .
The calculation results are shown in Table 4. The ductility coefficient refers to the maximum deformation of the structure under a certain bearing capacity and the ratio of its elastic limit deformation, which is a concentrated expression of the size of the plastic deformation capacity of the structure or component. μ is expressed in Equation (2).
μ = Δ u Δ y
where μ is the ductility coefficient of the structure or member, Δ u is the displacement of the structure or member at damage, and Δ y is the displacement of the structure or member at yield.
According to Figure 16, it can be learnt that the stresses of specimens RCFST-1 and RCFST-3 in the preliminary stage are close to each other but different from RCFST-2. The possible reason is that specimen RCFST-2 has an initial crack during the installation process, which leads to the poor integrity of the upper and lower parts of this specimen. At the same time, the initial stiffness of RCFST-2 is reduced, which directly affects the bearing capacity increase in the second stage. However, it can be seen that when the axial pressure is certain, the component with a larger slenderness ratio has a smoother ascending and descending section of the skeleton curve, and the bearing capacity is smaller. After exceeding the peak load, with the continuous increase in displacement, the bearing capacity of the specimen slowly decreases but has good ductility performance. The final damage pattern of the specimen results in typical bending damage. Components with smaller slenderness ratios have better bearing capacity, but their ductility performance is poor. After reaching the ultimate bearing capacity, the bearing capacity decreases rapidly and eventually shows more serious brittle bending shear damage. In addition, it can be seen from Table 4 that the ductility coefficient increases and then decreases with the increase in the length-to-slenderness ratio of the members, which is the same as the previous study [47]. Among them, the highest ductility coefficient of the members was found at a 34.3 length-to-slenderness ratio. Due to the limited control group in this test, the ductility performance of specimen RCFST-2 was affected by the initial state. The correlation between ductility performance and slenderness ratios cannot be accurately derived, and more research is needed to determine the relationship between the slenderness ratio and ductility performance.

3.5. Strength Degradation

The phenomenon of the horizontal force load decaying at the same displacement load level during repeated loading and unloading of the specimen is known as strength degradation. Strength degradation is expressed in Equation (3). And the smaller the degradation coefficient, the more obvious the strength degradation.
λ j i = P j i P j 1 P j 1
where λ j i is the strength degradation factor for the ith loading of the jth displacement level, P j 1 is the value of the horizontal load corresponding to the first loading of the jth displacement level, and P j i is the value of the horizontal load corresponding to the ith loading of the jth displacement level.
From Figure 17, it can be seen that with the increasing number of cycles of loading and unloading, the degradation coefficient of each specimen decreases, and the strength degradation becomes more and more obvious. Even the value of force load corresponding to the same displacement class keeps decreasing and reversing, converting from thrust to tension. The minimum degradation coefficient reaches −1.24. By comparing the strength degradation between different displacement levels, it was found that the strength degradation of specimens damaged at smaller displacement levels was more obvious. However, the degree of strength degradation fluctuated more in the first two development stages, and there was a transient case of strength enhancement, which may be related to the gradual involvement of the longitudinal reinforcement of the cage in the forces. The strength degradation of the larger displacement grades occurs in the second and third stages, where all longitudinal reinforcement is fully involved in the stress and yields sequentially. And as the number of cycles continues to increase, irreversible damage occurs and accumulates throughout the member, and the strength continues to decay steadily. Serious slips occurred between the stressed steel reinforcement and the core concrete, the bearing capacity decreased abruptly, and the strength degradation of the specimen intensified. And the overall direction of the folding lines of Figure 17g,h is extended to the lower right, indicating that the strength degradation corresponding to the larger displacement load class of each member is more obvious under the same number of cycles. This is directly related to the degree of specimen development and material stiffness degradation. And the strength degradation of RCFST-3 is smoother in the continuous loading and unloading cycles, which indicates that it has a better bearing capacity before reaching the ultimate load.

3.6. Stiffness Degradation

The equivalent stiffness describes the stiffness degradation of the entire member during cyclic loading and unloading. Equivalent stiffness is expressed in Equation (4):
K s j = P j i / Δ j i
where K s j is the equivalent stiffness corresponding to the jth displacement level, P j i is the load value corresponding to the ith loading of the jth displacement level, and Δ j i is the displacement value of the jth displacement level.
As shown in Figure 18, the equivalent stiffness decreases with the increasing number of loading and unloading cycles. The figure shows that the change patterns of RCFST-1 and RCFST-3 differ from that of RCFST-2, and the equivalent stiffness of the former two is significantly higher than that of the latter. This may be related to the initial cracks present in member RCFST-2, leading to a significant decrease in the initial stiffness. Compared to the other specimens, its initial stiffness is approximately 35.7% lower and affects the whole stiffness degradation process. The stiffness degradation of RCFST-1 and RCFST-2 is quite similar and goes in the same direction overall. The reason is that although there are differences in the dimensions of the two members, the material and structure are the same. In addition, the percentage of the concrete protection layer and core concrete are the same, which makes the overall structural performance of the two specimens close to each other. It is also illustrated that the magnitude of the slenderness ratio is less associated with stiffness degradation when the similarity ratios are kept consistent. The whole degradation process consists of three main stages, of which the stiffness degradation stage in the final stage is the most obvious. It is related to the severe shear cracks at the bottom of the columns, the significant slip phenomenon of the reinforcement with the concrete, and the interface slip between the steel casing of the lower steel tubular column and the concrete surface at a later stage.

3.7. Energy Dissipation

The energy dissipation performance is a major factor in measuring the horizontal bearing capacity of a member. In this paper, since the initial stiffness of the specimen cannot be accurately derived, only the plastic deformation energy is used to reflect the energy dissipation performance of the members during the loading and unloading process. In addition, the index cumulative hysteretic energy dissipation E is introduced to reflect the cumulative energy dissipation performance of the member in the cyclic process so as to reflect the damage deterioration characteristics of the structure to some extent and to expose the damage deterioration development process. From Figure 19, it can be observed that as the load level increases, more energy is dissipated per cycle, and the increase in energy consumption is increasingly large. When the load level is the same, the energy dissipation of different cycles decreases successively. The first cycle has the highest energy dissipation, while the energy dissipation of the second and third cycles is close to each other, but the third cycle still experiences a slight decrease.
In order to quantitatively express the difference in energy consumption of different specimens, the power ratio index is introduced, which is expressed by Equation (5). Table 5 shows the power ratio index for the three specimens.
I w = i = 1 n P i Δ i P y Δ y
where n is the number of cycles, i is the cyclic order, P i is the load values of the ith cycle, and Δ i is the displacement values of the ith cycle.
From Table 5, it can be seen that the larger the slenderness ratio of the specimen column, the larger the work ratio coefficient. It indicates that the specimen absorbed more energy at the same level before its destruction, and the energy dissipation performance is better. Among them, the power ratio index of specimen RCFST-2 is the largest, which indicates that specimen RCFST-2 absorbed more energy and the cumulative damage is more serious. However, RCFST-3 has the smallest work ratio coefficient and consumes the most energy overall. This is mainly due to the fact that its slenderness ratio is smaller and its structural properties are closer to those of a short column. This causes the structure to not fully utilize the energy dissipation properties of the material during damage and exhibit brittle damage.

4. Finite Element Analysis

4.1. Modeling

In order to study the hysteresis performance and bearing properties of steel casing-reinforced concrete pile composite members under the joint action of the horizontal low cyclic loading and constant vertical load, this numerical simulation will use finite element software ABAQUS (2018) to simulate the study. The solid unit adopts unit C3D8R; the steel casing adopts unit S4R, and the steel reinforcement adopts truss unit T3D2. Surface-to-surface contact is used for the interaction behavior between concrete and foundation, concrete and steel casing, and foundation and steel casing. The tangential behavior is based on the Cullen friction model. The friction coefficients between concrete and steel casing, foundation and steel casing, and steel casing and foundation are 0.5, 0.4, and 0.35, respectively. Hard contact is used for normal behavior. In static analysis, in addition to setting load boundary conditions at the loading end and adding displacement constraint boundary conditions to the foundation, it is also necessary to add necessary constraint boundary conditions between the components when necessary. This is to ensure that they are free from indeterminate rigid body displacements in all translational and rotational degrees of freedom. The grid division is shown in Figure 20.

4.2. Constitutive Relations of Materials

The finite element model in this paper assumes that the stress–strain relationship of steel casing obeys the typical isotropic elastic-plastic model, and the strength criterion obeys the classical Von Mises yield criterion. The model adopts the elastic-strengthening model. In other words, the slope of the stress–strain curve represents the elasticity modulus of the steel before it reaches the yield stress f y , and it is simplified to a straight line with a slope of 0.01 E s after yielding, as shown in Equation (6).
σ = f y E y E E < E y f y + E E y 0.01 E E y E E u
where E y and f y are the yield strain and yield strength of the steel, respectively; E u is the ultimate strain of the steel; and E s and E s are the initial elasticity modulus and the second elasticity modulus of the steel, respectively. The values of density ρ , elasticity modulus E s , Poisson’s ratio υ , and yield strength f c were 7850 kg/m3, 206,000 MPa, 0.3, and 235 MPa, respectively.
Concrete is modeled by plastic damage CDP, and its stress–strain relationship is fitted by combining the results of hysteretic properties of physical model tests and using the stress–strain relationship proposed by concrete specification GB50010-2010 [46], and the damage factor strain relationship is solved using a graphical method [48]. C30 concrete modified the tensile and compressive stress–strain curves; the compressive stress–inelastic strain curve and tensile stress–cracking strain curve are shown in Figure 21. Combined with the previous research and continuous attempts to try each parameter to fit this model, the values of yield surface parameters for the CDP model are given in Table 6. The expansion angle ψ and the viscosity parameters ν are calculated based on the results of the physical modeling tests, and the parameters are debugged several times. The plasticity parameters e , f b 0 / f c 0 , and K are chosen as the default values.
The steel reinforcement constitutive model is adopted as the cyclic hysteresis constitutive model of steel reinforcement proposed by Fang et al. [49], as shown in Figure 22. In this paper, the Coulomb friction model is used to simulate the slip phenomenon between the concrete and steel casing, while the UMAT subroutine is used to indirectly simulate the bond–slip behavior of the concrete and the steel reinforcement. The elasticity modulus E s , yield strength f c , and hardened stiffness coefficient γ of the longitudinal reinforcement are 206,000 MPa, 400 MPa, and 0.01, respectively. The elasticity modulus E s , yield strength f c , and hardened stiffness coefficient γ of the stirrups are 206,000 MPa, 235 MPa, and 0.01, respectively. The foundation adopts the reinforced foundation model based on the equivalent modulus approach of the finite mechanics [50], and the orthotropic anisotropy parameters are shown in Table 7.

4.3. Initial Defect Simulation

Combined with a large number of existing studies, it has been found that initial defects in reinforced concrete and steel pipe concrete composite structures have become an important factor affecting the safety, serviceability, and durability of the structures. The literature [51] combines existing research on reinforced concrete with three working conditions and several control groups to study and draw meaningful conclusions; it showed that initial defects have an impact on the load-bearing capacity of reinforced concrete, especially for reinforced concrete structures with large aspect ratios. This test will cause unavoidable damage to the integrity of the model when making and maintaining the model, so the ideal perfect model cannot be obtained. In the process of numerical simulation, in order to better restore the physical model and obtain more realistic results, the initial condition function (“initial conditions”) of ABAQUS (2018) software is used to realize the numerical simulation of initial defects. The displacement of the eigenmode of the buckling analysis of the model’s pile–column composite member is used as the setting value of the initial defects, in which the amplification factor is 1/1000 of the model size, and the data output of the buckling analysis results and the setting of the initial defects are realized by adding the model keywords (*keywords). Figure 23 shows the first-order modal deformation obtained by performing the buckling analysis.

4.4. Model Verification

From Figure 24, it can be seen that the skeleton curve of the finite element hysteresis curve and the monotonic loading results of the previous period are in general agreement, but the initial stiffness is slightly lower than that of the physical experiment results. Monotonic loading has the highest ultimate load and better ductility performance, with a 4.98% higher ultimate load and an 8.69% higher ductility coefficient than the finite element low cyclic loading and unloading model. This is in agreement with previous physical test results [52] which show that specimens subjected to cyclic tests have more pronounced degradation relative to monotonic specimens, which may be due to the Bauschinger effect in steel and the development of opening and closing of cracks and plastic deformation in concrete. From Figure 25, it can be seen that the shape of the hysteresis loops roughly matches, but the peak load from the finite element results is slightly larger than that of the test results. Additionally, the inverse load of the finite element results is large, which may be due to the damage of the physical model in different parts of the model fabrication, model maintenance, and installation process. The initial defects of the model and the homogeneity of the concrete material cannot be simulated by the finite element. Therefore, the finite element model is more idealized compared to the physical model, but the overall simulation results are better, and the model can be used for subsequent studies.

5. Analysis of Results

5.1. Analysis of the Effect of the Compressive Axial Force Ratio on the Lateral Working Properties of Members

In previous studies on concrete-filled steel tube and reinforced concrete column structures, it was found that the compressive axial force ratio has a large influence on the ductile performance of the structure or member [53,54] In this paper, a finite element model is developed based on physical model tests to further investigate the lateral working performance of large-scale steel casing-reinforced concrete pile composite members. In this test, the finite element results are used as a reference to set the compressive axial force ratio, and two control groups are added. Finally, this paper sets up six control group working conditions, and Table 8 shows the calculation results of the lateral working performance of each control group.
Combined with Table 8 and Figure 26, it can be observed that the changes in ultimate load for each control specimen relative to specimen RCFST-1 are within 5%, indicating a minimal influence of the compressive axial force ratio on bearing capacity. The magnitude of the effect of compressive axial force ratio on the ductility coefficient is within 7%, and the ductility coefficients of all specimens are lower than the typical values of displacement ductility coefficients of reinforced concrete column specimens, which ranged from 3 to 5 [55]. This indicates that the members exhibit very poor ductility performance, plastic deformation capacity, and energy dissipation performance. A comprehensive analysis suggests that the bearing capacity and ductility performance of the steel casing-reinforced concrete pile composite members are small, resulting in a limited influence of the compressive axial force ratio on the lateral working performance of the members. However, the following pattern can be drawn: with the increase in the compressive axial force ratio, the yield displacement of the member decreases, while the yield load changes irregularly, and the magnitude is small. The ultimate loads and ductility coefficients of the members show a consistent pattern. At lower compressive axial force ratios (below 0.3), the lateral bearing capacity of the members increases slowly with increasing compressive axial force ratios, and the peak displacement corresponding to the ultimate bearing capacity also increases slightly. This means that at lower compressive axial force ratios, there is a small increase in displacement ductility with increasing compressive axial force ratios. When the compressive axial force ratio reaches 0.376, the ultimate load and displacement ductility coefficients of the members reach their maximum values. When the compressive axial force ratio is greater than 0.376, the ultimate load and the ductility coefficient of the member decrease rapidly with the increase in the compressive axial force ratio, and the magnitude of the descending section of the skeleton curve of the hysteresis curve increases. A poor plastic deformation capacity is shown, which corresponds to sudden brittle damage of the member.

5.2. Analysis of the Effect of Different Foundation Strengths on the Working Properties of the Members

In order to accurately study the effects of different foundation strengths on the bearing capacity and damage morphology of the members when the load position is at the top of the steel casing, the three-dimensional finite element model of large-scale steel casing-reinforced concrete pile composite members with foundation concrete grades of C30, C40, and C50 is established using the finite element numerical simulation method, respectively. From Figure 27, it can be observed that when the load is applied at the top of the pile, the maximum force at the bottom of the pile foundation is concentrated approximately 140 mm from the top surface of the foundation. From Figure 28, it can be seen that when the foundation strength is C30, C40, and C50, the ultimate horizontal bearing capacity of the member is 39.7 kN, 77.9 kN, and 82.6 kN, respectively. The member ultimate bearing capacity of C40 foundations increased by 96.2% compared to C30 foundations, and the member ultimate bearing capacity of C50 foundations increased by 108.1% compared to C30 foundations. However, the ultimate load capacity of the members increased by only 6% with C50 foundations compared to C40 foundations. It can be seen that the lateral bearing capacity of the large-scale steel casing-reinforced concrete pile composite members increased with the increase in foundation strength, but after a certain value of foundation strength was reached, the enhancement effect of foundation strength on the bearing capacity of the members was attenuated. This may be related to the relative ratios of the foundation flexural stiffness and the sectional flexural stiffness of the steel tubular columns; in other words, different relative stiffness ratios ultimately present different patterns of pile damage.

6. Conclusions

In this paper, the lateral working performance of steel casing-reinforced concrete pile composite members is investigated, but due to the limitation of test conditions and other reasons, this paper only summarizes the damage pattern of steel casing-reinforced concrete pile composite members and does not put forward a specific theoretical calculation model, which can be added to the control group test to derive the formulae in the subsequent research. Overall, the research content of this paper is an important supplement to the study of large-scale steel casing-reinforced concrete pile composite members, with a view to provide a reference for the design of large-scale steel–concrete structures, Meanwhile, the research content is also needed to improve and enrich the design theory of overhead upright wharfs with large water level differences and the theory of composite materials in inland rivers and to provide a basis for the design of inland river-related wharves and offshore buildings. The following conclusions are obtained:
  • The steel casing-reinforced concrete pile composite members with different slenderness ratios exhibit a similar damage development process under the quasi-static loading test, and the damage area is concentrated in the upper column part. The member RCFST-2 formed an obvious plastic hinge within 200 mm from the bottom of the column, while the rest of the members did not produce obvious plastic regions in the compression zone. The hysteresis curves of the members were all in the shape of a typical inverse S-shape, with a poor degree of fullness. Among them, the specimen RCFST-3 is the driest, which implies poor energy dissipation and deformation performance;
  • By increasing the number of loading and unloading cycles of the combined members, the degradation coefficient of the specimens decreases, and the strength degradation becomes more obvious. At the same time the equivalent stiffness of the specimen keeps decreasing. The strength degradation of RCFST-3 is smoother in the continuous loading and unloading cycles, which reflects its better bearing capacity before reaching the ultimate load. The larger the slenderness ratio of the members, the larger the work ratio coefficient. It indicates that the specimen absorbs more energy before damage and has better energy dissipation performance;
  • A finite element model was established to analyze the working behavior of steel casing-reinforced concrete pile composite members at different compressive axial force ratios and foundation strengths. The results show that as the compressive axial force ratio increases, the yield displacement of the member decreases, while the yield load changes irregularly and with a small magnitude. For the ultimate load and ductility coefficient of the members, the compressive axial force ratio reaches 0.376 with a critical point phenomenon. With the increase in foundation strength, the lateral bearing capacity of the members is increasing. However, after the foundation strength reaches a certain value, the enhancement effect of foundation strength on the bearing capacity of members decays.

Author Contributions

Conceptualization: D.W.; resources: D.W.; writing—original draft: W.L.; supervision: C.Q.; writing—review & editing: C.Q.; data curation: M.J.; formal analysis: M.J.; visualization: B.G. All authors have read and agreed to the published version of the manuscript.

Funding

The authors are grateful for the financial support from National Natural Science Foundation of China (Grant No. 51979017), and Graduate Education Innovative Found Program of Chongqing Jiaotong University (CYB23252).

Data Availability Statement

The original contributions presented in the study are included in the article, further inquiries can be directed to the corresponding author.

Conflicts of Interest

The authors declare no conflict of interest.

References

  1. Zhang, X.L.; Xing, L.; Wang, L.; Wang, D.Y. A Review of Studies on Mechanical Properties of Concrete Filled Steel Tubular Rock-socketed Piles. Sci. Technol. Eng. 2020, 20, 7982–7990. [Google Scholar]
  2. Wang, D.Y.; Lan, C.; He, G.C.; Wang, C.Z. Researches on lateral support behavior of large diameter rock-socketed cast-in-place piles at river port by laboratory model test. Yantu Gongcheng Xuebao 2007, 29, 1307–1313. [Google Scholar]
  3. Liu, Q.; Guo, Z.; Wu, X. Energy Dissipation Enhanced by Multiple Hinges in Bridge Piers with CFST Y-Shaped Fuses. Symmetry 2002, 14, 2371. [Google Scholar] [CrossRef]
  4. Wang, C.; Qu, Z.; Shen, Y. Numerical investigation of the performance of segmental CFST piers with external energy dissipators under lateral cyclic loadings. Materials 2002, 15, 6993. [Google Scholar]
  5. Dong, X.; Wang, L.; Xu, Z.; Liu, L.S.; Guan, S.; Chen, H. Cyclic performance of T-Shaped CFST column to steel beam joint with vertical stiffener. Structures 2023, 55, 1659–1674. [Google Scholar] [CrossRef]
  6. Wang, L.; Cui, W.; Liu, S. The analysis on the seismic behavior of L-shaped prefabricated special-shaped CFST with rectangular multi-cell columns. Adv. Struct. Eng. 2022, 25, 1673–1686. [Google Scholar] [CrossRef]
  7. Cui, W.; Wang, L.; Chen, H. The analysis on the seismic behavior of T-shaped prefabricated special-shaped CFST with rectangular multi-cell columns. Structures 2002, 28, 803–815. [Google Scholar] [CrossRef]
  8. We, H.F. Finite element analysis on horizontal bearing capacity of larger-diameter steel casing rock-socketed pile. Shanxi Archit. 2015, 41, 50–52. [Google Scholar]
  9. GB/T 7714-2015; AASHTO LRFD Bridge Design Specifications. China Communications Press: Beijing, China, 1998; p. 685. (In Chinese)
  10. Mu, B.G.; Ban, X.; Gong, W.M. Lateral Load Capacity Analysis of Variable Section Hybrid Piles with Wteel Casing. J. Civ. Environ. Eng. 2011, 6, 3–8. [Google Scholar]
  11. Zhu, P.B. Study on Lateral Bearing Behavior of Steelsocketed Piles Under Complex Geological conditions. Master’s Thesis, Chongqing Jiaotong University, Chongqing, China, 2016. [Google Scholar]
  12. Yan, L. Large Diameter Steel Liners Rock-Socketed Pile Mechanical Behavior Analysis and the Engineering Application Research. Master’s Thesis, Chongqing Jiaotong University, Chongqing, China, 2015. [Google Scholar]
  13. Li, P.F. Study on Bearing Capacity of Rock-Socketed Pile with Steel Casing Based on Large Scale Model Test. Master’s Thesis, Chongqing Jiaotong University, Chongqing, China, 2015. [Google Scholar]
  14. Zhou, W.W.; Gao, R.; Chen, E.; Liang, L. Responses of steel casing composite piles of bridges under impact loads. Struct. Infrastruct. Eng. 2024, 20, 36–55. [Google Scholar] [CrossRef]
  15. Wang, F.; Wang, P.F.; Lyu, Z.D.; Zhao, Z.M.B. Dynamic response of super-large-diameter steel casing under axial impact load. Ocean Eng. 2022, 244, 110249. [Google Scholar] [CrossRef]
  16. Chen, G.F.; Zhu, F. Experimental study on stress response characteristics of rock embedded pile foundation with steel casing. Hebei J. Ind. Sci. Technol. 2021, 38, 251–256. [Google Scholar]
  17. Xiong, J. Research on Stress-strain Analysis and Thickness Design Method of Steel Casing for Cofferdam Bottom Sealing Concrete. Eng. Technol. Res. 2024, 9, 180–182. [Google Scholar]
  18. Wang, D.Y.; Wang, C.Z. Study on Damage Style of Over-erection Wharfe in Inland River. In Geotechnical Engineering for Disaster Mitigation and Rehabilitation; Springer: Berlin/Heidelberg, Germany, 2008; pp. 913–919. [Google Scholar]
  19. Bradford, M.A. Design strength of slender concrete filled rectangular steel tubes. ACI Struct. J. 1996, 93, 229–235. [Google Scholar]
  20. Cederwall, K.; Engstrom, B.; Grauers, M. High-strength concrete used in composite columns. High Strength Concr. 1996, 121, 195–210. [Google Scholar]
  21. Aval, S.; Saadeghvaziri, M.; Golafshani, A. Comprehensive composite inelastic fiber element for cyclic analysis of concrete-filled steel tube columns. J. Eng. Mech. 2011, 128, 428–437. [Google Scholar] [CrossRef]
  22. Braford, M.A.; Loh, H.Y.; Loh, B. Slenderness limits for filled circular steel stubs. J. Constr. Steel Res. 2022, 58, 243–252. [Google Scholar] [CrossRef]
  23. Frangin, E.; Marin, P.; Daudeville, L. On the use of combined finite/discrete element method For impacted concrete structures. J. Phys. IV 2006, 134, 461–466. [Google Scholar] [CrossRef]
  24. Huang, Y.; Li, W.; Lu, Y.; Liang, H.; Yan, Y. Behaviour of CFST slender columns strengthened with steel tube and sandwiched concrete jackets under axial loading. J. Build. Eng. 2022, 45, 103613. [Google Scholar] [CrossRef]
  25. Li, P.; Jiang, J.; Li, Q.; Ren, Z. Axial compression performance and optimum design of round-cornered square CFST with high-strength materials. J. Build. Eng. 2023, 68, 106145. [Google Scholar] [CrossRef]
  26. Yang, Y.F.; Fu, F.; Bie, X.M. Behaviour of rectangular RACFST slender columns under eccentric compression. J. Build. Eng. 2021, 38, 102236. [Google Scholar]
  27. Xu, L.; Pan, J.; Yang, X. Mechanical performance of self-stressing CFST columns under uniaxial compression. J. Build. Eng. 2021, 44, 103366. [Google Scholar]
  28. Tong, J.Z.; Zhang, J.B.; Tong, G.S.; Chen, M.; Zhang, L.; Yu, C.Q.; Zhou, S.M. Flexural tests and behavior of multi-celled corrugated-plate CFST members. J. Build. Eng. 2022, 49, 104051. [Google Scholar]
  29. Wang, J.T.; Wu, X.H.; Yang, B.; Sun, Q. Bearing capacity and damage behavior of hcftst columns under cyclic loading. Structures 2021, 32, 1492–1506. [Google Scholar]
  30. Wang, W.D.; Xian, W.; Hou, C.; Shi, Y.L. Experimental investigation and FE modelling of the flexural performance of square and rectangular SRCFST members. Structures 2022, 27, 2411–2425. [Google Scholar] [CrossRef]
  31. Hasan, M.M.; Tao, Z.; Ghafar, W.A.; Huangfu, S.E.; Zhang, Z.Q. Investigating the axial compressive behavior of cruciform CFST columns: An experimental study. Structures 2024, 69, 107538. [Google Scholar]
  32. Hajjar, J.F.; Gourley, B.C. Representation of concrete-filled steel tube cross-section strength. J. Struct. Eng. 1996, 122, 1327–1336. [Google Scholar]
  33. Lakshmi, B.; Shanmugam, N.E. Nonlinear analysis of concrete-filled steel composite columns. J. Struct. Eng. 2022, 287, 922–933. [Google Scholar]
  34. Han, L.H.; Feng, J.B. Constitutive Relarions of Concrete and Its Applications in theIntegral Analysis of Concrete Filled Steel Tube. Harbin Inst. Archit. Eng. 1995, 28, 26–32. [Google Scholar]
  35. Han, L.H.; Tao, Z.; Yan, W.B. Research on moment-curvature hysteretic behaviors of concrete filled circular steel tubes. Earthq. Eng. Eng. Vib. 2000, 3, 50–59. [Google Scholar]
  36. Zhang, W.; Mao, Y.; Xing, Z.Q.; Xu, Y.Y.; Chen, Y.; Chen, W.; Jiang, X.F. Axial compression behavior of square CFST short column with triangular-corner gap. J. Build. Eng. 2003, 80, 108046. [Google Scholar] [CrossRef]
  37. Qiao, Q.; Li, J.; Yang, Z.; Cao, W.L.; Yang, J.; Zhang, W.W. Axial compressive behavior of concrete filled stainless-carbon steel tube columns: Experimental investigation. J. Build. Eng. 2021, 42, 102460. [Google Scholar] [CrossRef]
  38. Dong, H.; Liang, X.; Cao, W.; Zhao, L.D.; Zhang, J.W. Cyclic behavior of circular CFST stub columns with different inner constructions. J. Build. Eng. 2022, 53, 104549. [Google Scholar] [CrossRef]
  39. Zhang, Y.; Xu, C.; Lu, X. Experimental study of hysteretic behaviour for concrete-filled square thin-walled steel tubular columns. J. Constr. Steel Res. 2007, 63, 317–325. [Google Scholar] [CrossRef]
  40. Alva, G.M.S. Application of lumped dissipation model in nonlinear analysis of reinforced concrete structures. Eng. Struct. 2010, 32, 974–981. [Google Scholar] [CrossRef]
  41. Eom, T.; Park, H. Evaluation of energy dissipation of slender reinforced concrete members and its applications. Eng. Struct. 2010, 32, 2884–2893. [Google Scholar] [CrossRef]
  42. Mortazavi, B.H.; Mostafaei, H.; Shahbodagh, B.; Vahab, B.; Hashemolhosseini, H. Effect of Sample Preparation on the Reliability of Large-Scale Physical Modeling in Geotechnical Systems: A Case Study. Geotech. Geol. Eng. 2024, 42, 2693–2707. [Google Scholar] [CrossRef]
  43. GB/T 700-2006; Carbon Structural Steels. China Standard Press: Beijing, China, 2006; pp. 2–4. (In Chinese)
  44. GB/T 228-2021; Metallic Materials-Tensile Testing-Part 1: Method of Test at Room Temperature. China Standard Press: Beijing, China, 2021; pp. 12–15. (In Chinese)
  45. FIB—Federation Internationale du Beton. Fib Model Code for Concrete Structures 2010; John Wiley & Sons: Berlin, Germany, 2013. [Google Scholar]
  46. GB/T 50010-2010; Code for Design of Concrete Structures. Architecture & Building Press: Beijing, China, 2010; p. 20. (In Chinese)
  47. Wang, F.; Chen, S.L.; Y, M.H. Research on hysteretic behavior of prefabricated special truss moment frame fabricated with high-strength steel. J. Archit. Civ. Eng. 2024, 41, 23–32. [Google Scholar]
  48. Liu, W.; Xu, M.; Chen, Z.F. Parameters Calibration and verification of Concrete Damage Plasticity Model of Abaqus. Ind. Constr. 2014, 44, 167–171, 213. [Google Scholar]
  49. Fang, Z.H.; Zhen, Y.; Li, X.P. Steel hysteretic model of reinforced concrete structures. Eng. J. Wuhan Univ. 2018, 51, 613–619. [Google Scholar]
  50. GB/T 7714-2015; Mechanics of Composite. Tsinghua University Press: Beijing, China, 2013; pp. 209–212. (In Chinese)
  51. Wang, W.H.; Hou, W. Effect of initial imperfection on the bearing capacity of RC columns. J. Lanzhou Univ. Technol. 2013, 39, 129–132. [Google Scholar]
  52. Matsui, C.; Tsuda, K.; Yamaji, Y.; Fuji, T. Structural performance and axial load limits of concrete-filled rectangular steel tube columns. Proc. Tecton. Dep. Archit. Inst. Jpn. 1998, 504. (In Japanese) [Google Scholar]
  53. Xu, Y.H. Analysis of Hysteretic Capability of Concrete Filled Steel Tube Compression-bending Members. Master’s Thesis, Dalian Jiaotong University, Dalian, China, 2005. [Google Scholar]
  54. Diao, B.; Li, S.C.; Ye, Y.H. Analysis and experiment of cumulated damage of RC structures with special columns under cyclic loading. J. Build. Struct. 2008, 1, 57–63. [Google Scholar]
  55. Li, Y.X. Energy Dissipation Mechanism and Ductility Design of Reinforced Concrete Frams Structure. Master’s Thesis, Hefei Polytechnic University, Hefei, China, 2006. [Google Scholar]
Figure 1. Column cross-section: (a) steel casing-reinforced concrete pile; (b) reinforced concrete column.
Buildings 15 01039 g001
Figure 2. Reinforcement diagram for RCFST-1(unit: mm): (a) elevation; (b) side view; (c) top view.
Buildings 15 01039 g002
Figure 3. Large harbor piling test system.
Buildings 15 01039 g003
Figure 4. Lateral section of the member.
Buildings 15 01039 g004
Figure 5. Strain gauge arrangement (unit: mm): (a) side A; (b) side C.
Buildings 15 01039 g005
Figure 6. Displacement loading diagram.
Buildings 15 01039 g006
Figure 7. RCFST-1 test diagrams: (a) instrument laying; (b) side B is connected to the crack on side C; (c) cracks on side B; (d) extrusion cracks on side A; (e) the pressurized A-side shedding area; (f) overall deformation of the specimen.
Buildings 15 01039 g007aBuildings 15 01039 g007b
Figure 8. RCFST-2 test diagrams: (a) Spreading of cracks on side B; (b) spreading of cracks on side C; (c) A-side concrete crushing and stripping; (d) concrete crushing for diagonal cracks on surface C; (e) the A-side shedding area; (f) concrete crush at the top loading end of the column.
Buildings 15 01039 g008
Figure 9. RCFST-3 test diagrams: (a) B-side cracks open under tension; (b) Stopped development of small cracks in the upper part; (c) Expansion of diagonal cracks on the A-side.
Buildings 15 01039 g009
Figure 10. Plot of the peak compressive strain and the maximum compressive strain value of concrete: (a) the RCFST-1 peak concrete compressive strain map; (b) the RCFST-2 peak concrete compressive strain map; (c) the RCFST-3 peak concrete compressive strain map; (d) the maximum compressive strain at each point along the column for different specimens.
Buildings 15 01039 g010
Figure 11. Peak strain at each point on the column longitudinal reinforcement: (a) RCFST-1 tensile strain on the tension side; (b) RCFST-2 tensile strain on the tension side; (c) RCFST-3 tensile strain on the tension side; (d) RCFST-1 compressive strain on the compression side; (e) RCFST-2 compressive strain on the compression side; (f) RCFST-3 compressive strain on the compression side.
Buildings 15 01039 g011
Figure 12. Vertical and circumferential strain diagrams for the steel casing: (a) RCFST-1 vertical strain; (b) RCFST-2 vertical strain; (c) RCFST-3 vertical strain; (d) RCFST-1 circumferential strain; (e) RCFST-2 circumferential strain; (f) RCFST-3 circumferential strain.
Buildings 15 01039 g012aBuildings 15 01039 g012b
Figure 13. Vertical strain diagram of the reinforcement cage for steel tubular columns: (a) RCFST-1; (b) RCFST-2; (c) RCFST-3.
Buildings 15 01039 g013
Figure 14. Hysteresis curve: (a) RCFST-1; (b) RCFST-2; (c) RCFST-3.
Buildings 15 01039 g014
Figure 15. Load displacement curve.
Buildings 15 01039 g015
Figure 16. Skeleton curve diagram.
Buildings 15 01039 g016
Figure 17. Line graph of strength degradation points: (a) displacement class 4 mm; (b) displacement class 8 mm; (c) displacement class 12 mm; (d) displacement class 16 mm; (e) displacement class 20 mm; (f) displacement class 24 mm; (g) second loading with different displacement levels; (h) third loading with different displacement levels.
Buildings 15 01039 g017
Figure 18. Equivalent stiffness variation curve.
Buildings 15 01039 g018
Figure 19. Plastic energy dissipation diagram: (a) RCFST-1; (b) RCFST-2; (c) RCFST-3.
Buildings 15 01039 g019
Figure 20. Numerical simulation model: (a) full view; (b) section view.
Buildings 15 01039 g020
Figure 21. Strain relationship curve: (a) modified compressive stress–strain curve for C30 concrete; (b) modified tensile stress–strain curve for C30 concrete; (c) damage factor–inelastic strain relationship curve; (d) damage factor–cracking strain relationship curve.
Buildings 15 01039 g021
Figure 22. Cyclic hysteresis model for reinforcing steel.
Buildings 15 01039 g022
Figure 23. First-order modal deformation diagram.
Buildings 15 01039 g023
Figure 24. Comparison of skeleton curves.
Buildings 15 01039 g024
Figure 25. Comparison of experimental hysteresis curves and numerical simulation hysteresis curves.
Buildings 15 01039 g025
Figure 26. Skeleton curves of members at different compressive axial force ratios for RCFST-1.
Buildings 15 01039 g026
Figure 27. Damage profiles of members with different foundation strengths.
Buildings 15 01039 g027
Figure 28. Load–displacement curves of members with different foundation strengths.
Buildings 15 01039 g028
Table 1. Component-specific parameters for the three materials (unit: mm).
Specimen NumberRCFST-1RCFST-2RCFST-3
ColumnDimensions175 × 750150 × 750200 × 750
slenderness ratio34.294030
Longitudinal reinforcement specificationHRB400-6Φ6HRB400-4Φ6HRB400-8Φ6
Specification of stirrupsHPB235-Φ3@200HPB235-Φ3@220HPB235-Φ3@160
PileDimensions275 × 1750275 × 1750275 × 1750
Thickness of steel casing222
Depth of embedment of steel casing137.5137.5137.5
depth of embedded rock370370370
Longitudinal reinforcement specificationHRB400-9Φ6HRB400-9Φ6HRB400-9Φ6
Inner layer Stirrup reinforcementHPB235-Φ3@350HPB235-Φ3@350HPB235-Φ3@350
Outer spiral stirrups reinforcementHPB235-Φ3@170HPB235-Φ3@170HPB235-Φ3@170
Table 2. Location of measurement points on the outer surface of the pile structure (unit: mm).
Serial Number123456
Position from top of foundation307014080016001720
Measurement point number (pile)P-A/B-1-H/VP-A/B-2-H/VP-A/B-3-H/VP-A/B-4-H/VP-A/B-5-H/VP-A/B-6-H/V
P-C/D-1-VP-C/D-2-VP-C/D-3-VP-C/D-4-VP-C/D-5-VP-C/D-6-V
Serial number789101112
Position from top of foundation5010015020030080
Measurement point number (column)C-A-7-VC-A-8-VC-A-9-VC-A-10-VC-A-11-VC-B-12-V
Table 3. Distribution of strain measurement points of reinforcing steel (unit: mm).
Serial Number12345
Position from top of foundation−130501503001650
Measurement point number (pile)R-A/B-1-VR-A/B-2-VR-A/B-3-VR-A/B-4-VR-A/B-6-V
R-C/D-1-HR-C/D-2-HR-C/D-3-HR-C/D-4-HR-C/D-6-H
Serial number6789
Measurement point number (column)50100150300
Measurement point number (column)R-A/B-7-VR-A/B-8-VR-A/B-9-VR-A/B-10-V
R-C/D-7-HR-C/D-8-HR-C/D-9-HR-C/D-10-H
Table 4. Test results.
Specimen NumberD (mm) λ P max (kN) Δ max (mm) P y (kN) Δ y (mm) μ
RCFST-117.534.318.6236.8616.0222.482.14
RCFST-215.04013.0936.0011.5325.901.54
RCFST-320.03022.3548.0019.4232.101.56
Table 5. Power ratio coefficients for each component.
Specimen Number λ P y (kN) Δ y (mm)E (kN·mm) I w
RCFST-134.2916.0222.48853.1992.369
RCFST-24011.5325.90733.0272.455
RCFST-33019.4232.10948.1381.521
Table 6. CDP parameters.
ρ (kg/m3) E s (MPa) υ f c p (MPa) ψ / e f b 0 / f c 0 K
250025,1850.217.46380.11.160.6667
Table 7. Foundation orthotropic anisotropy parameters.
ρ (kg/m3) E s (MPa) υ
2430112233112233
26,189.6125,221.2925,221.290.19300.19300.2012
Table 8. Lateral working performance of members with different compressive axial force ratios.
Specimen NumberP (kN) λ P y (kN) Δ y (mm) P max (kN) Δ max (mm) μ
RCFST-122,0000.04718.0729.4220.6539.601.512
RCFST-466,0000.14018.4129.5521.1840.371.589
RCFST-5110,0000.23318.8828.1521.3940.511.662
RCFST-6176,0000.37318.8326.7321.5838.601.708
RCFST-7300,0000.63519.2225.1821.3433.941.643
RCFST-8376,0000.79618.9224.3220.4730.841.532
Disclaimer/Publisher’s Note: The statements, opinions and data contained in all publications are solely those of the individual author(s) and contributor(s) and not of MDPI and/or the editor(s). MDPI and/or the editor(s) disclaim responsibility for any injury to people or property resulting from any ideas, methods, instructions or products referred to in the content.

