
Effect of Soil–Structure Interaction on the Damage Probability of Multistory RC Frame Buildings with Shallow Foundations


Abstract
1. Introduction
2. Materials and Methods
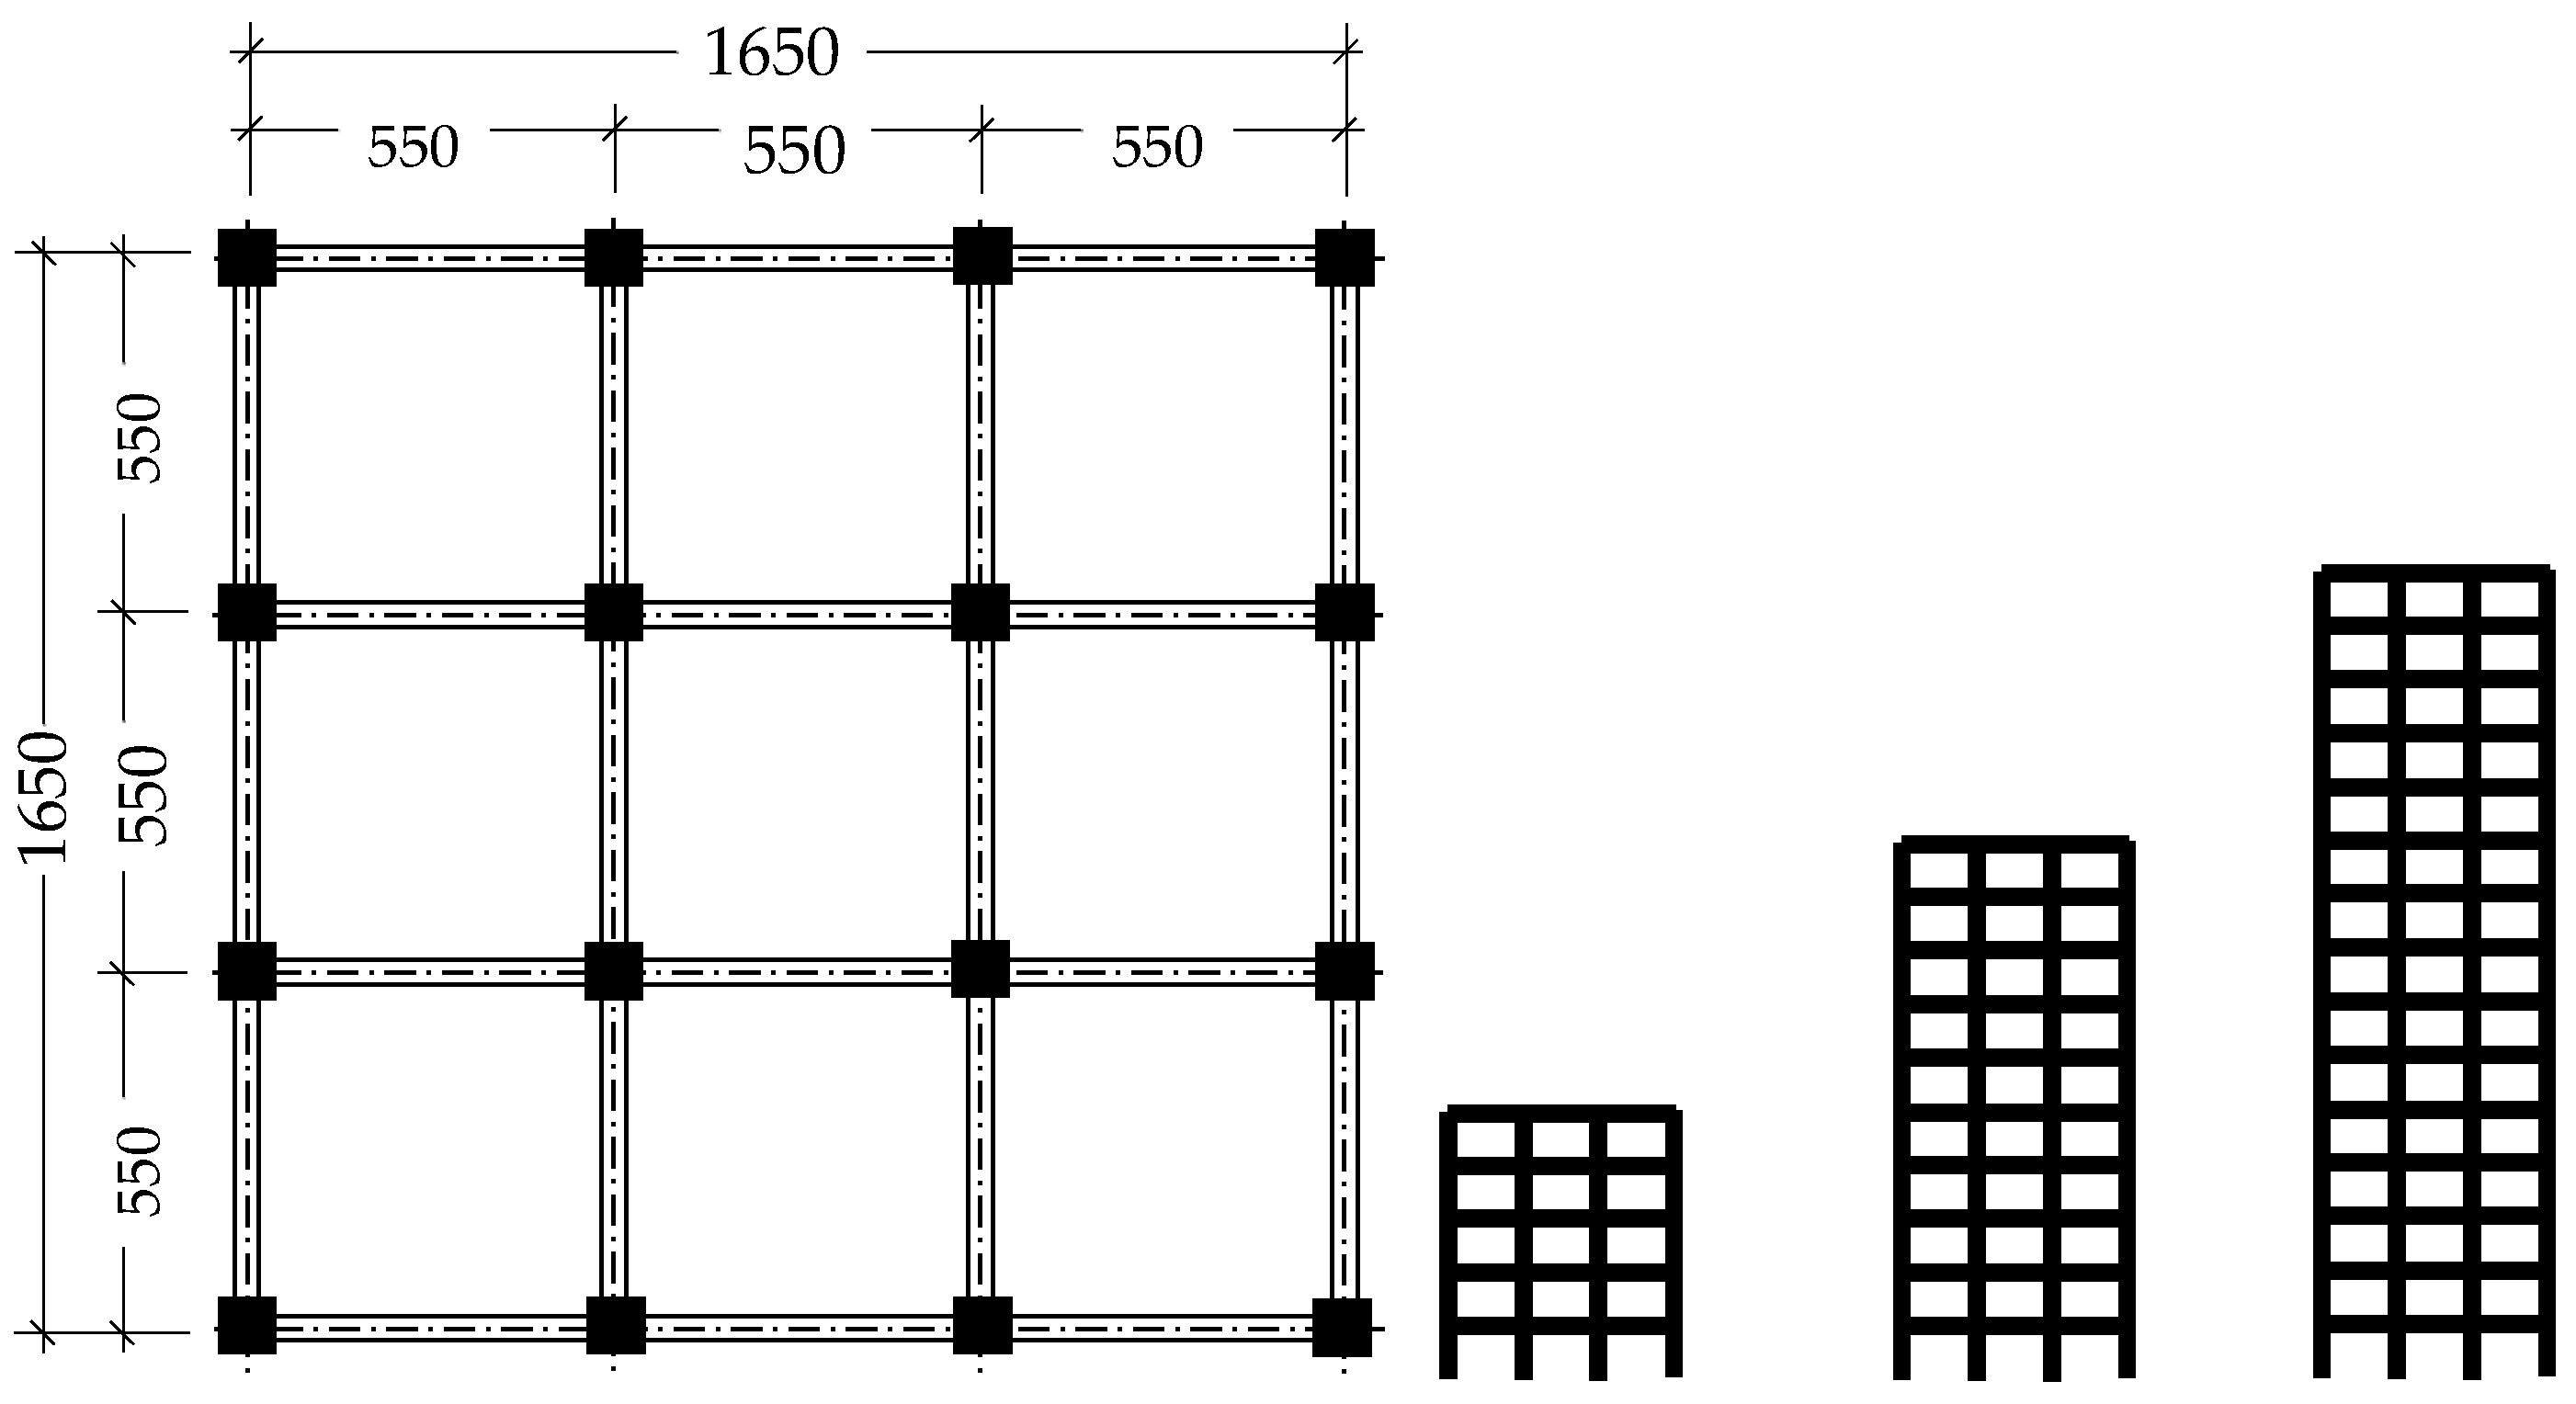
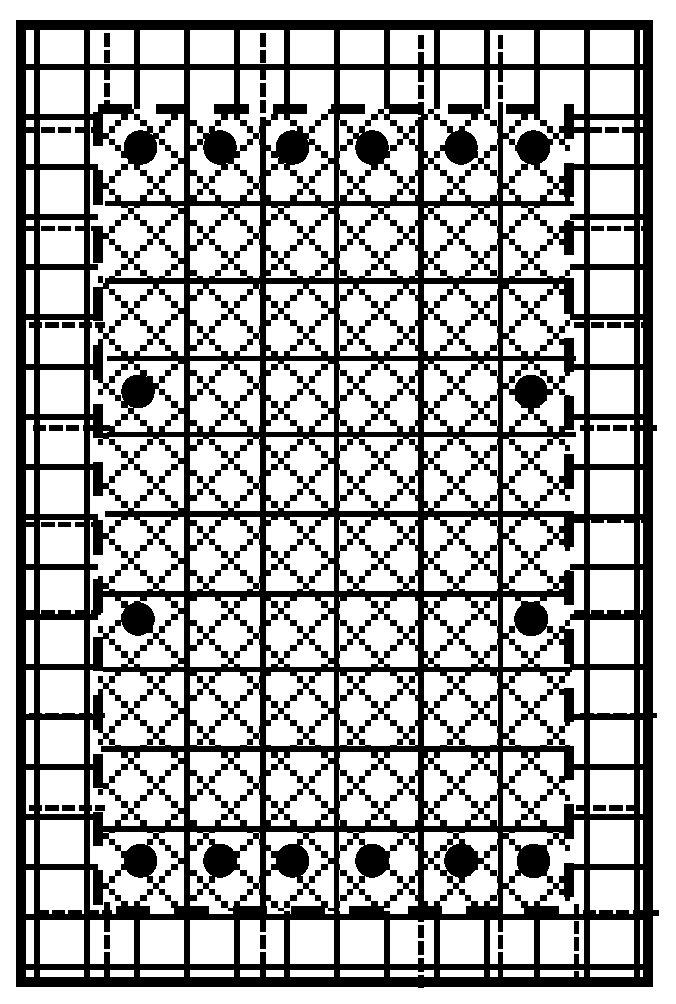
2.1. Sample Buildings
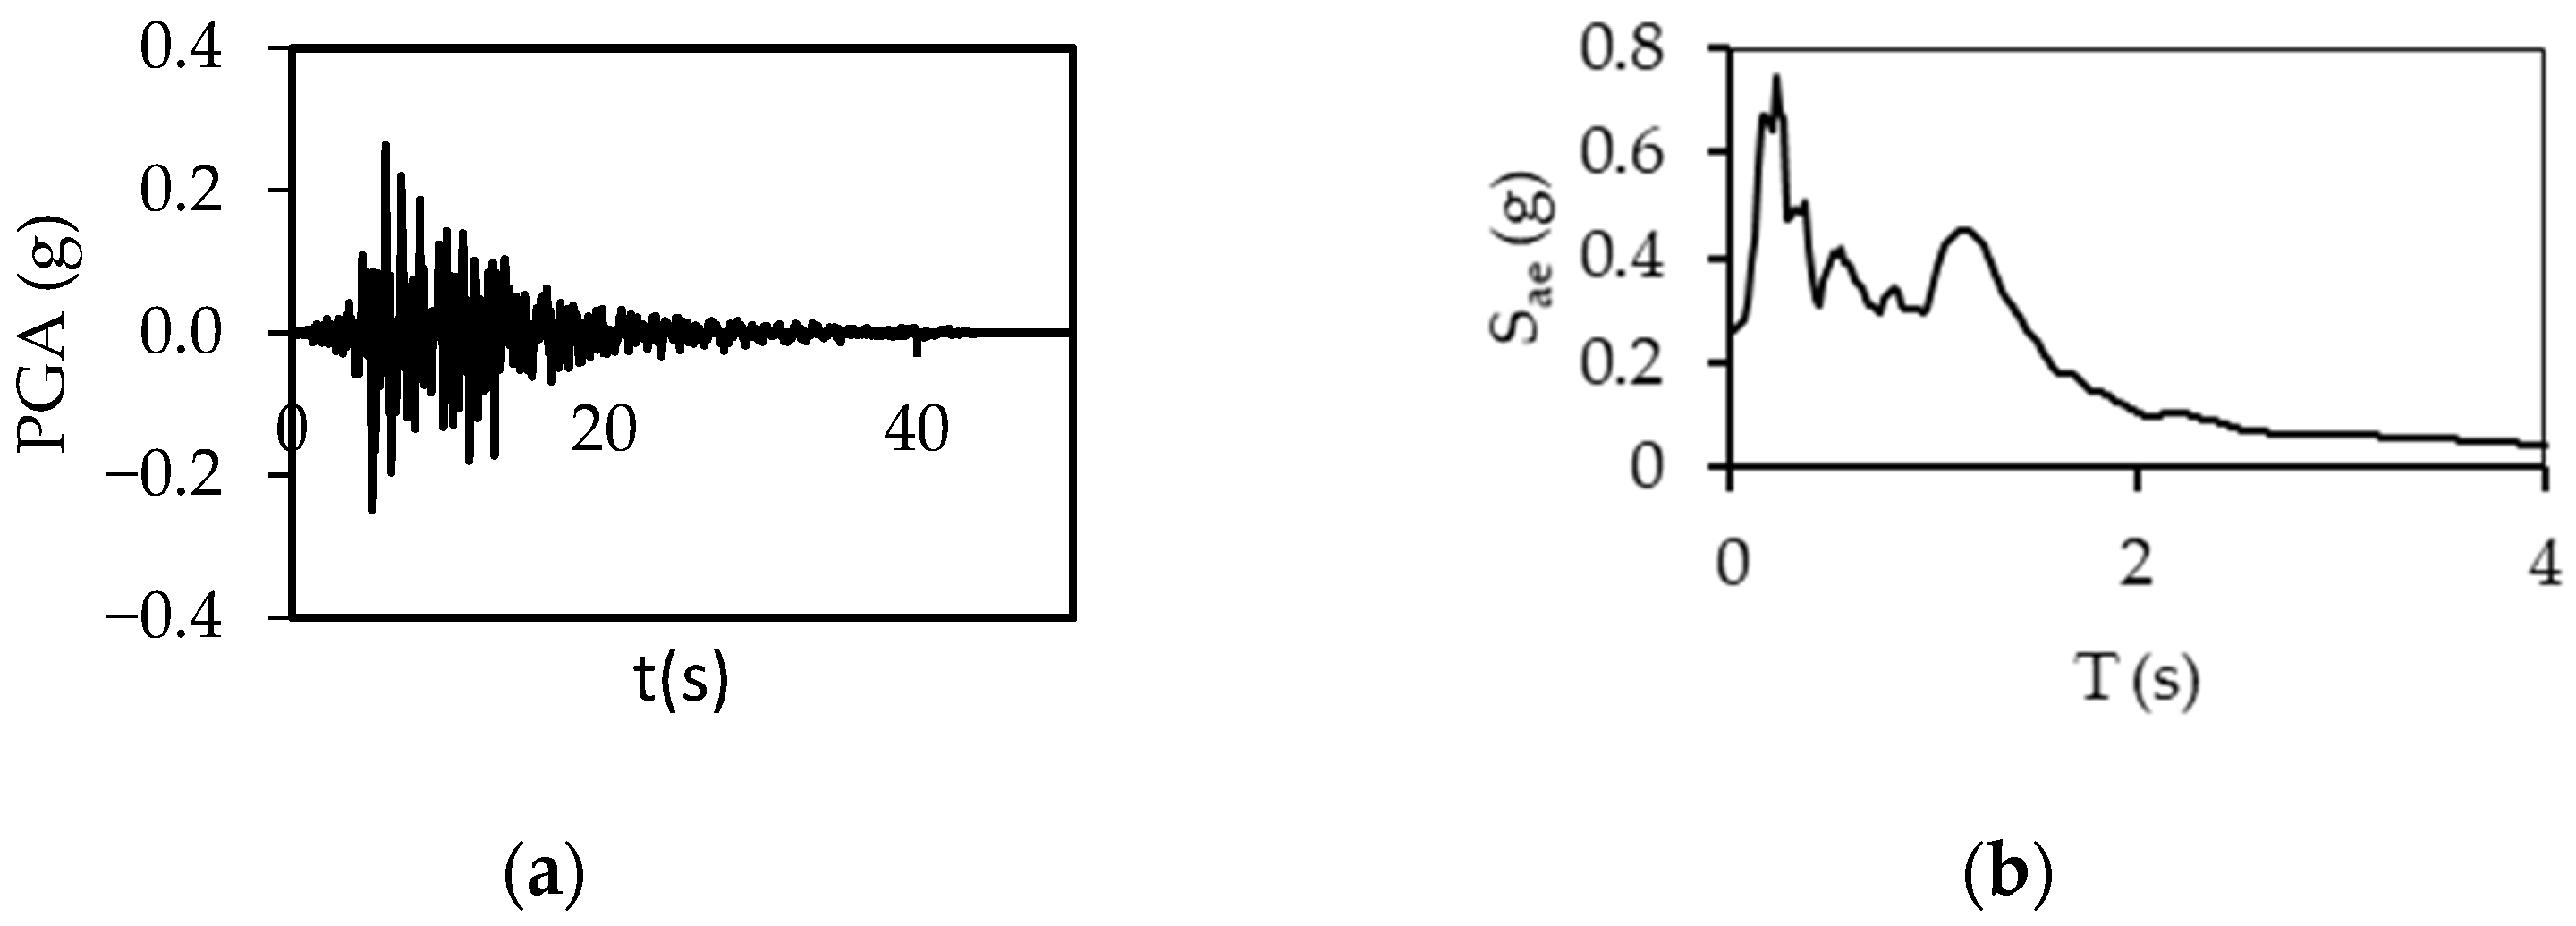
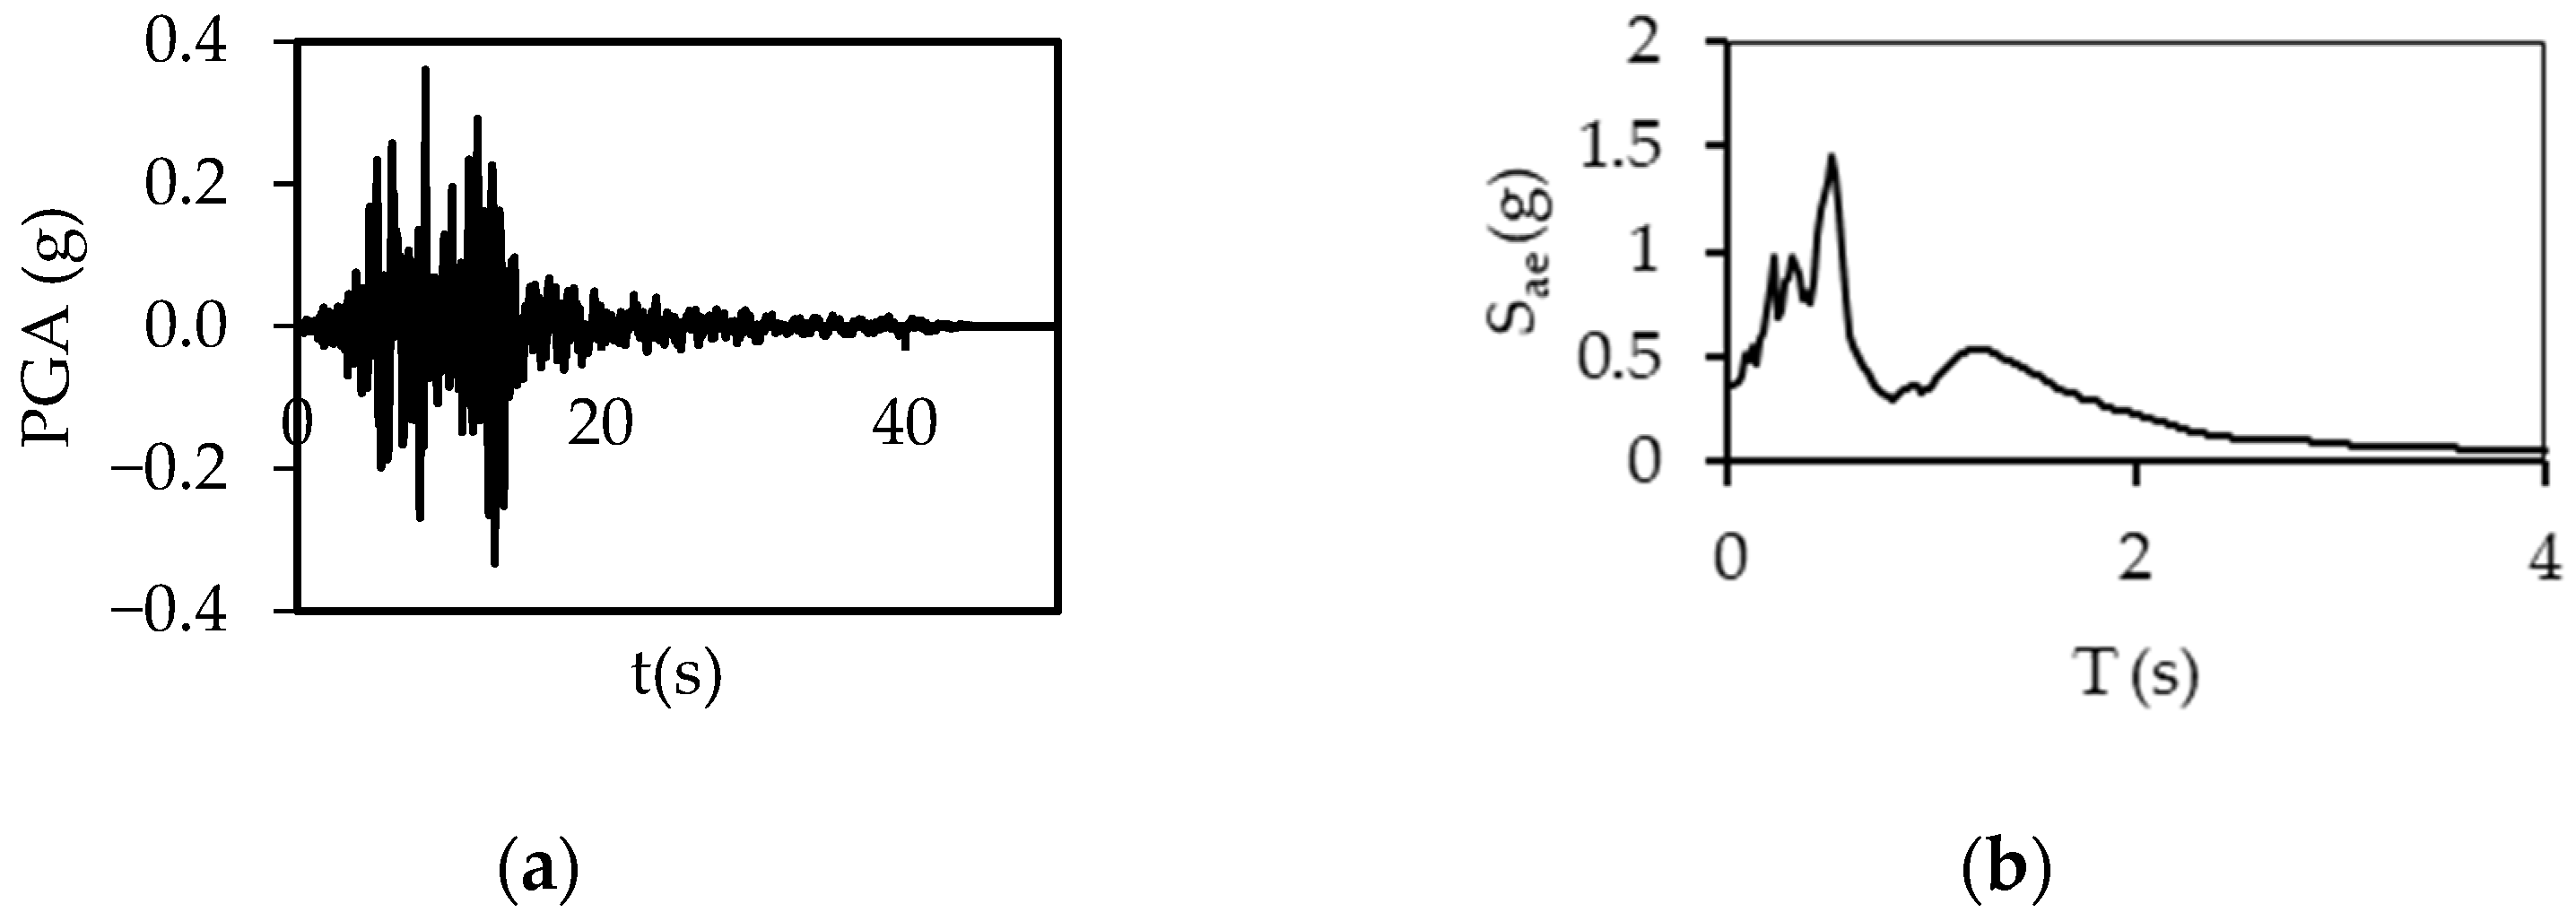
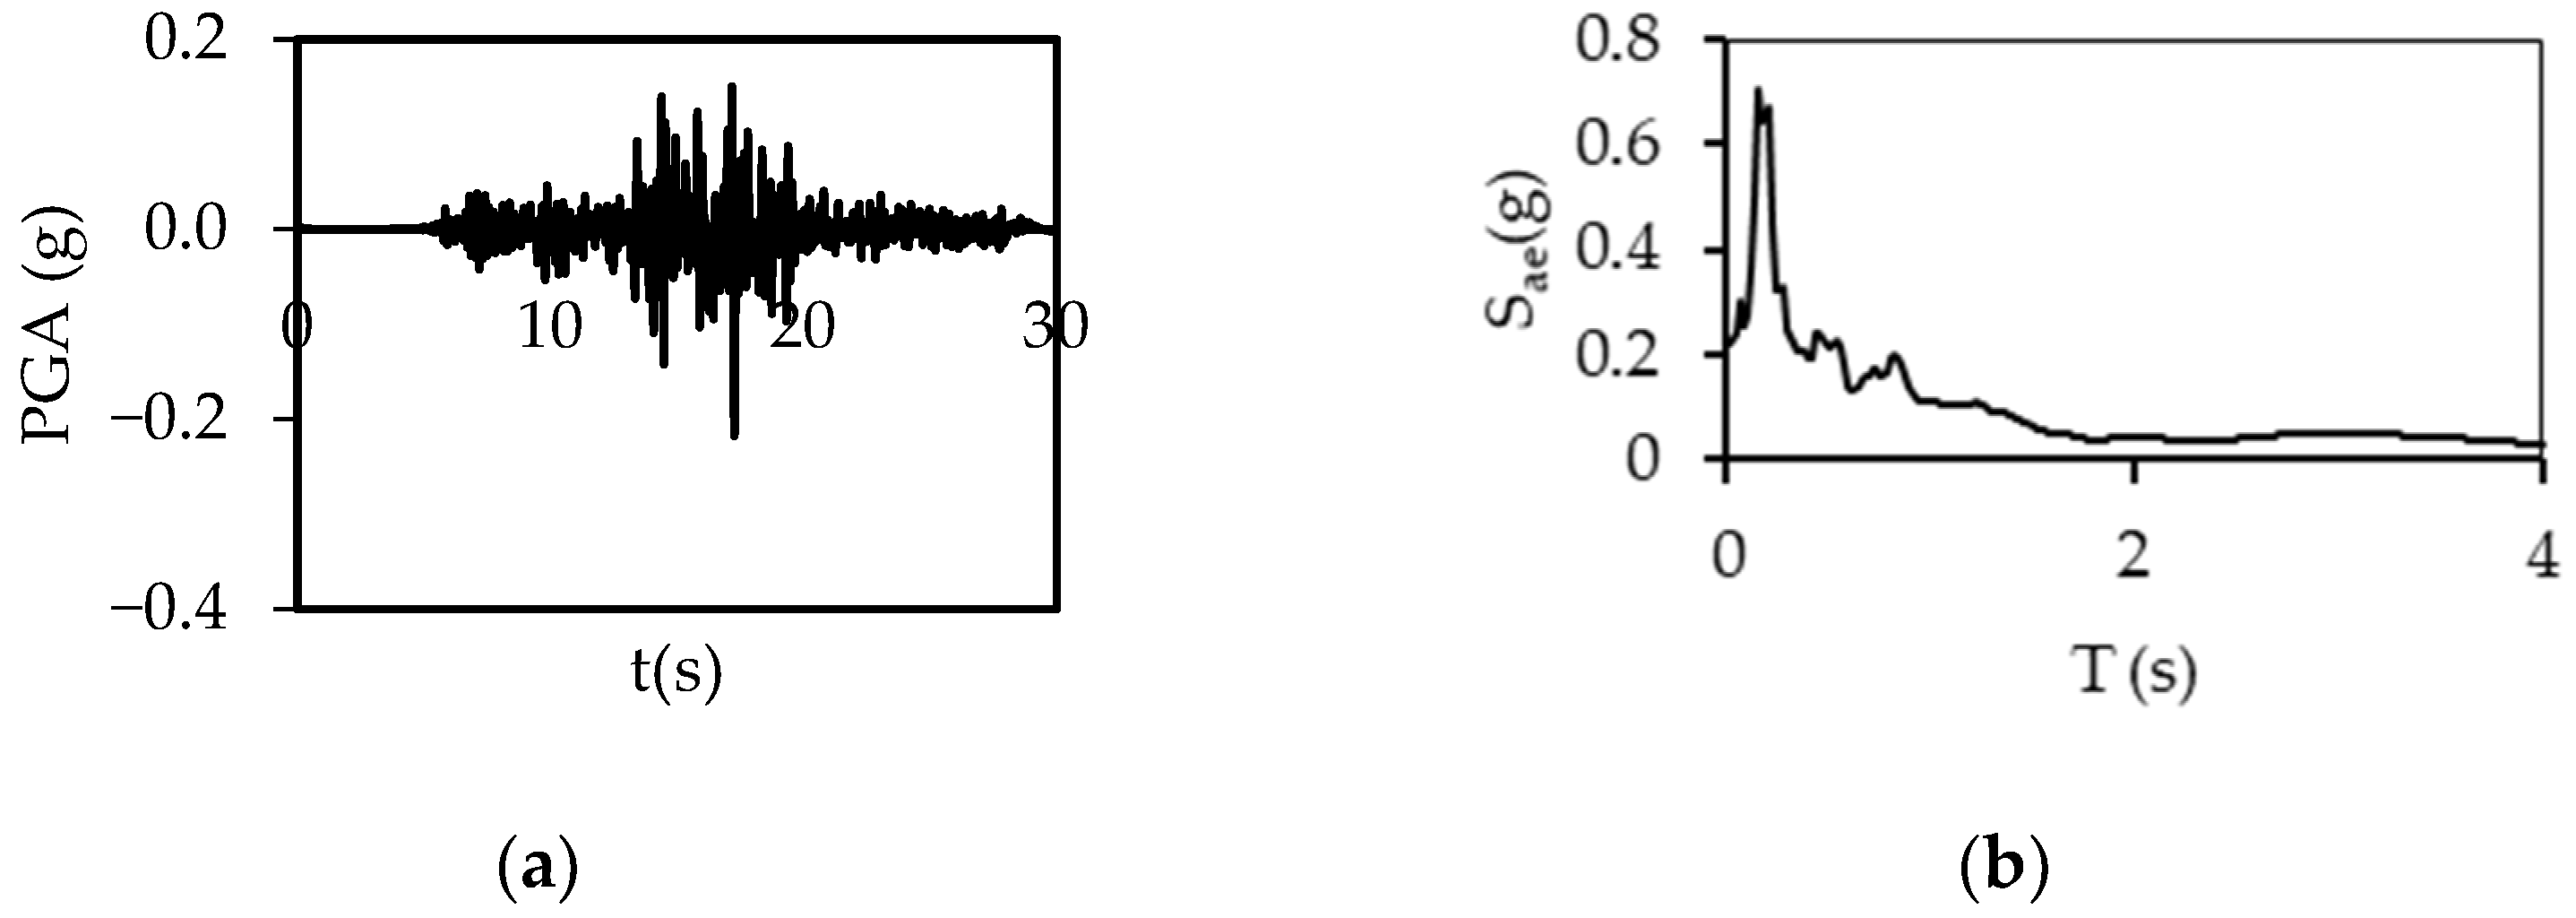
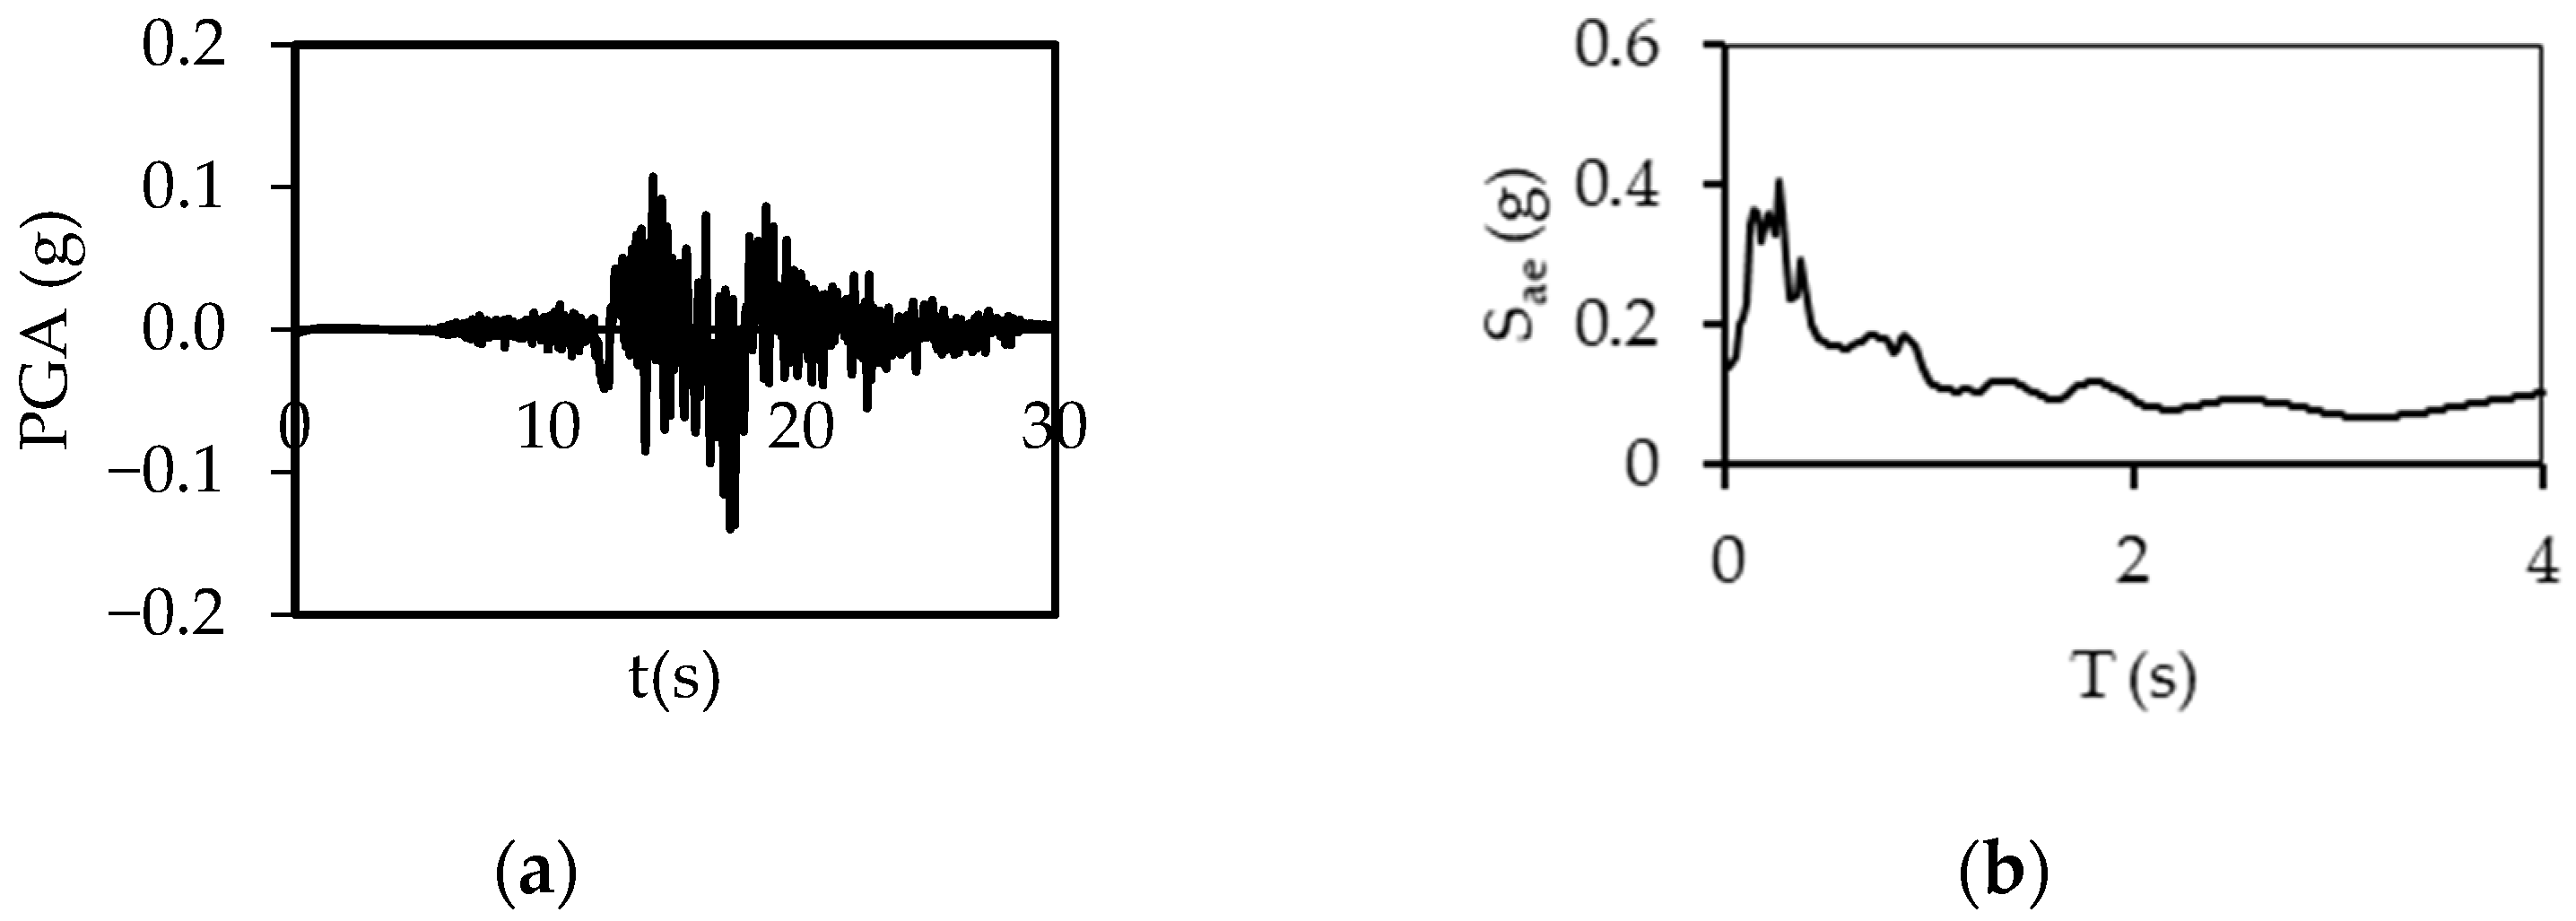
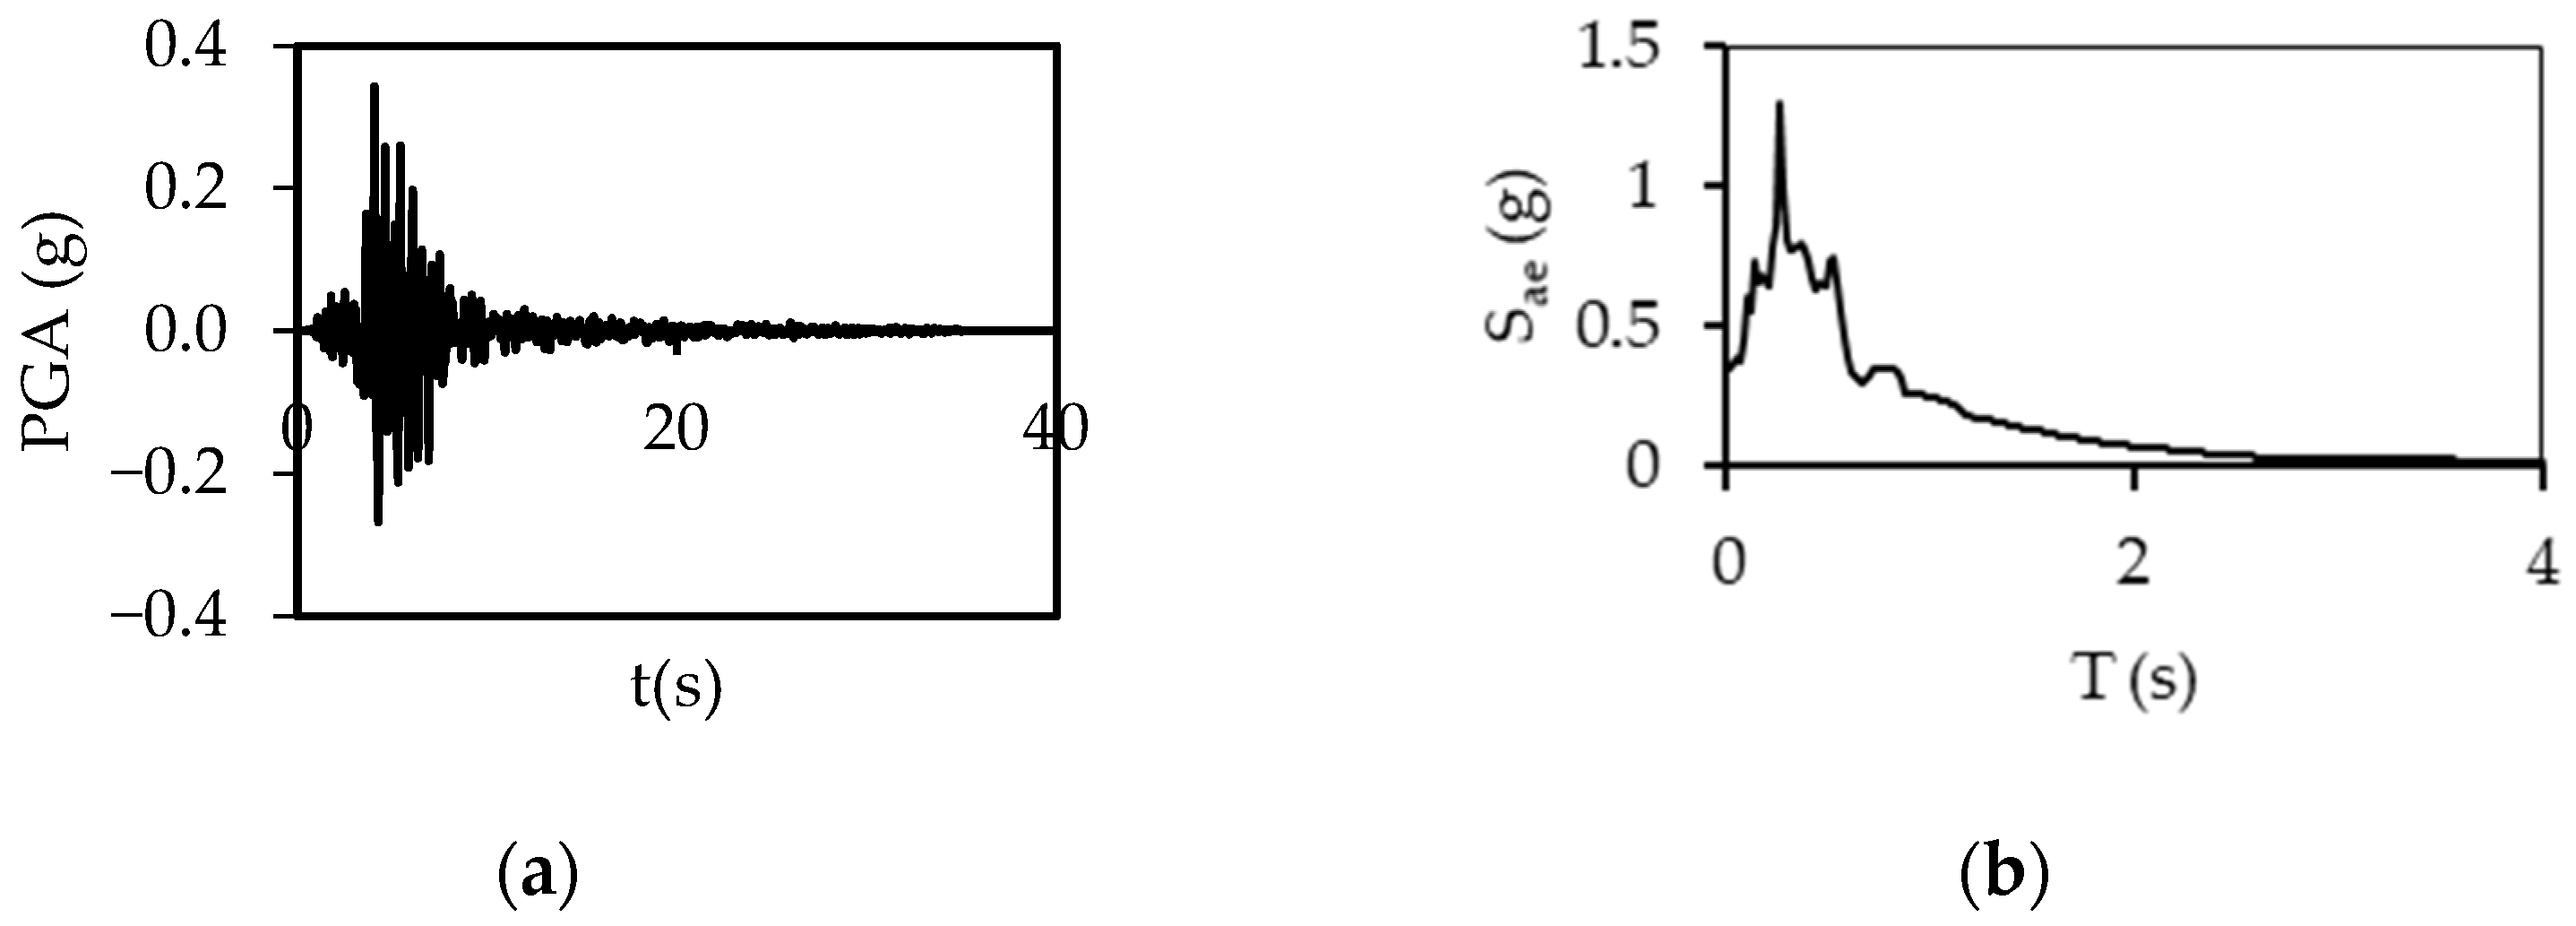
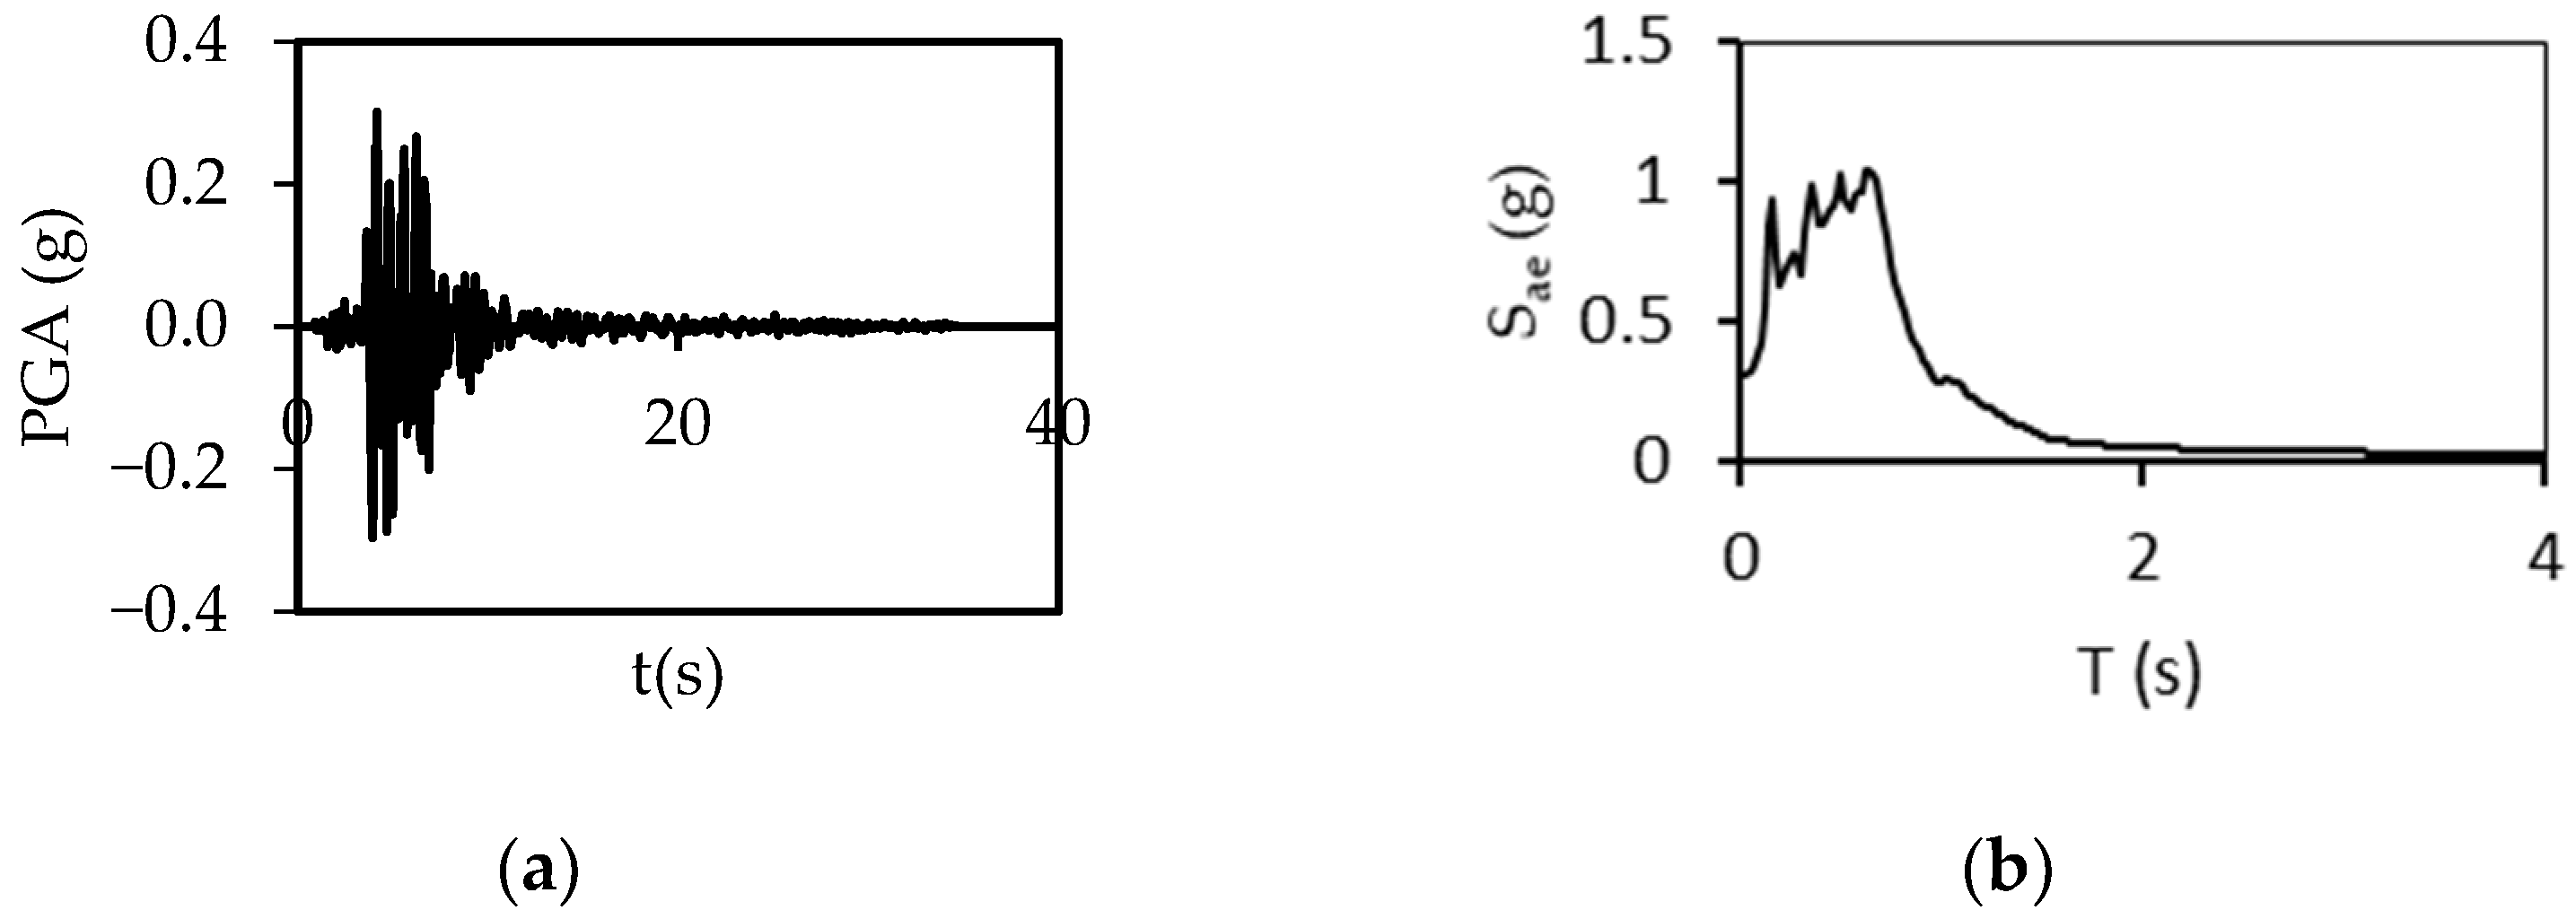
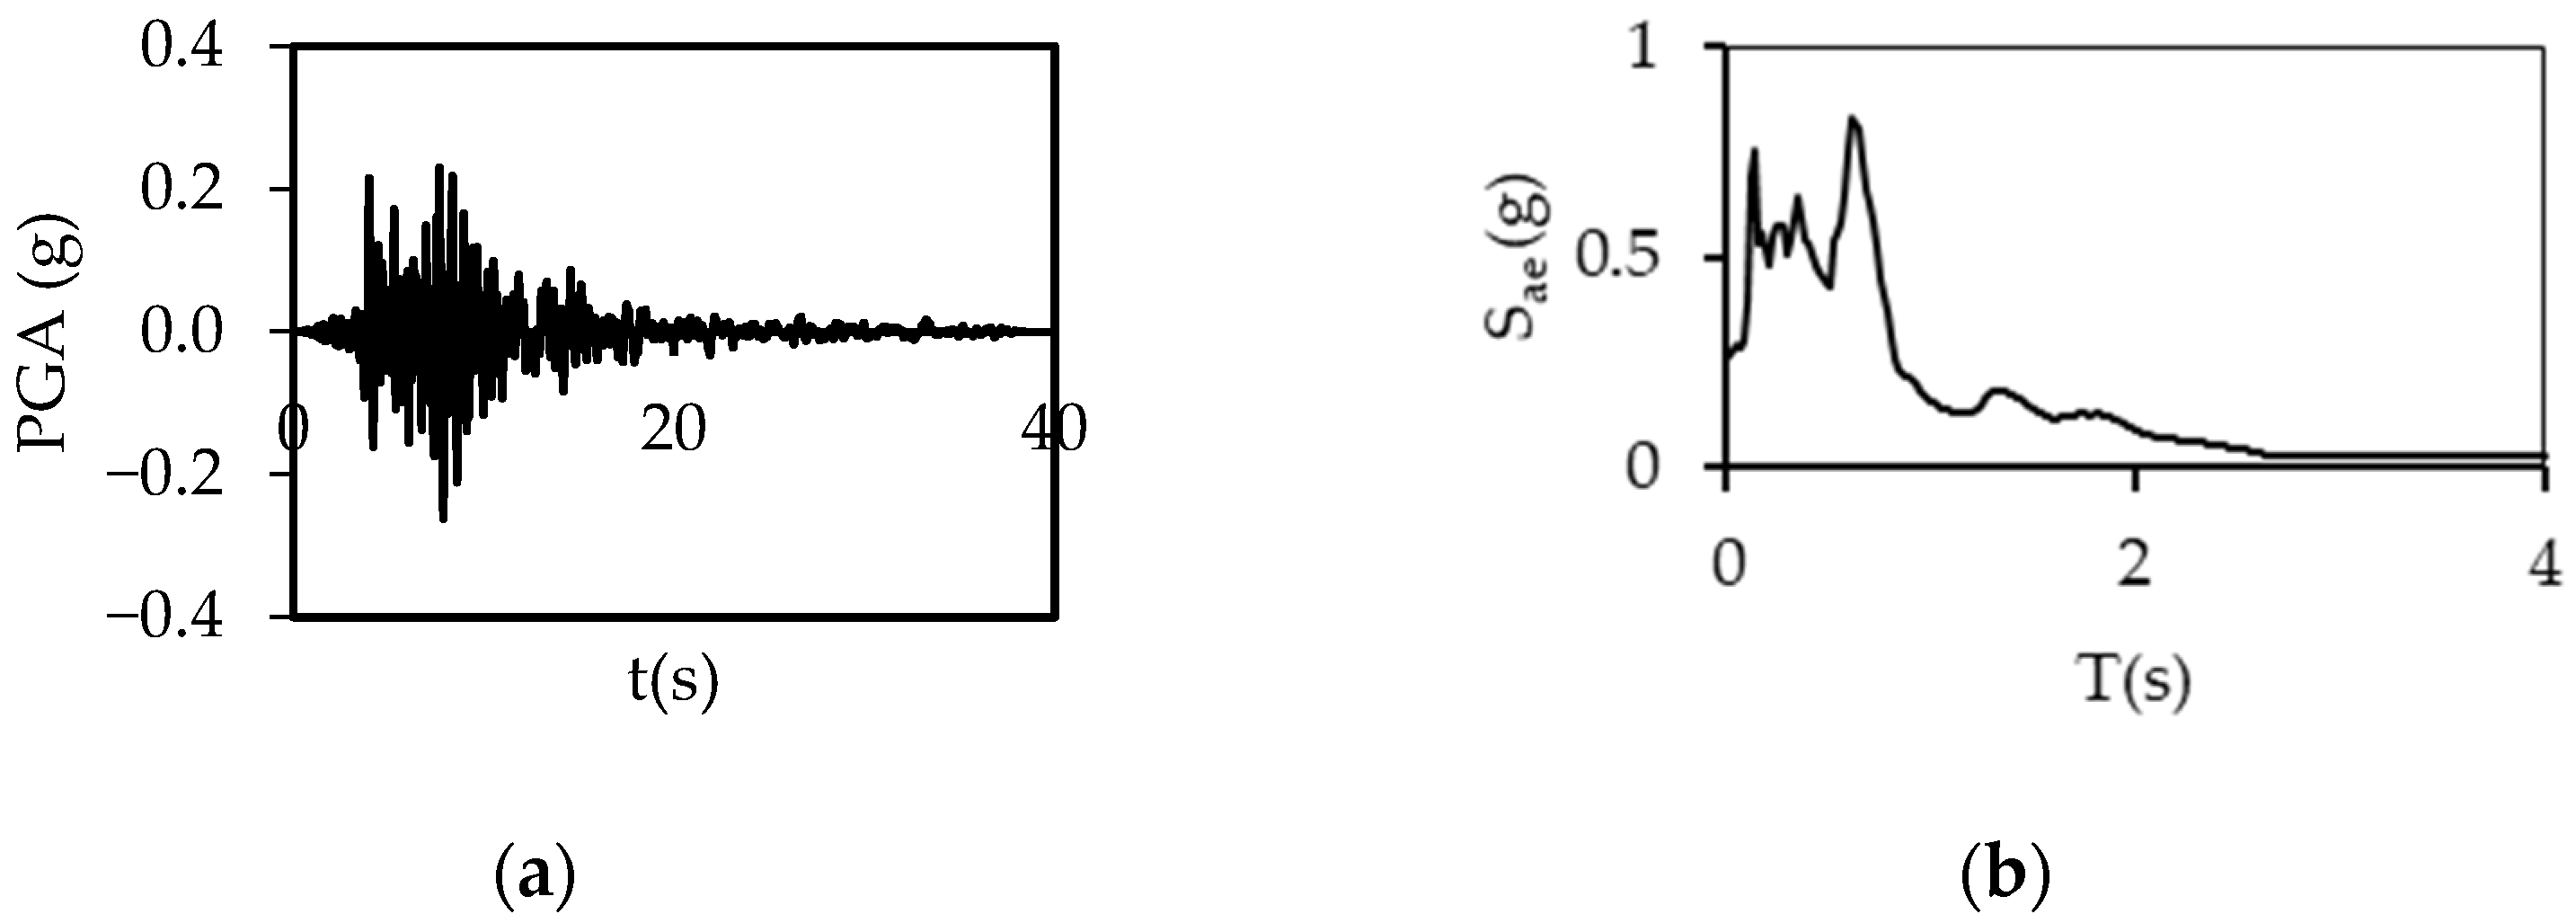
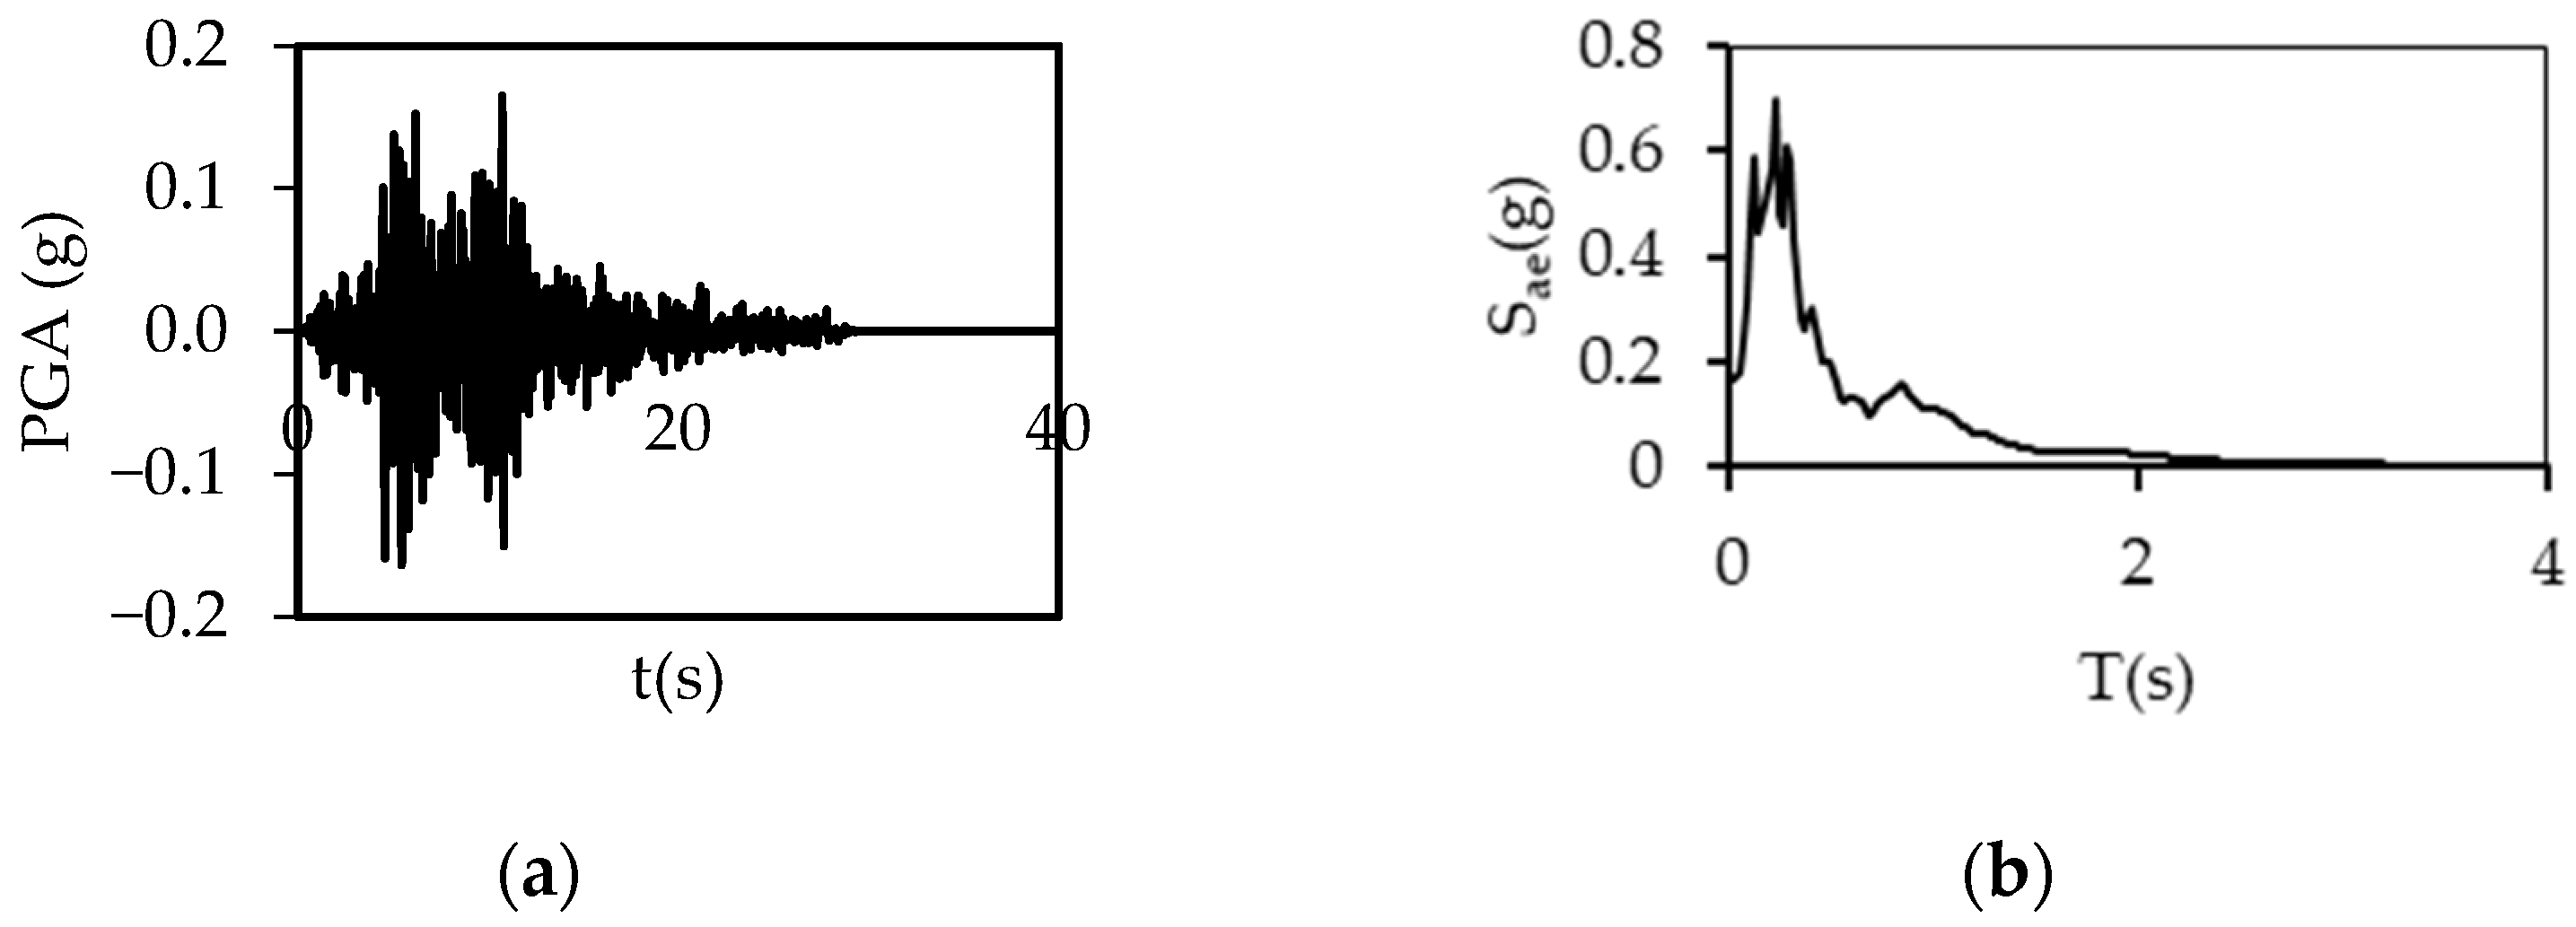
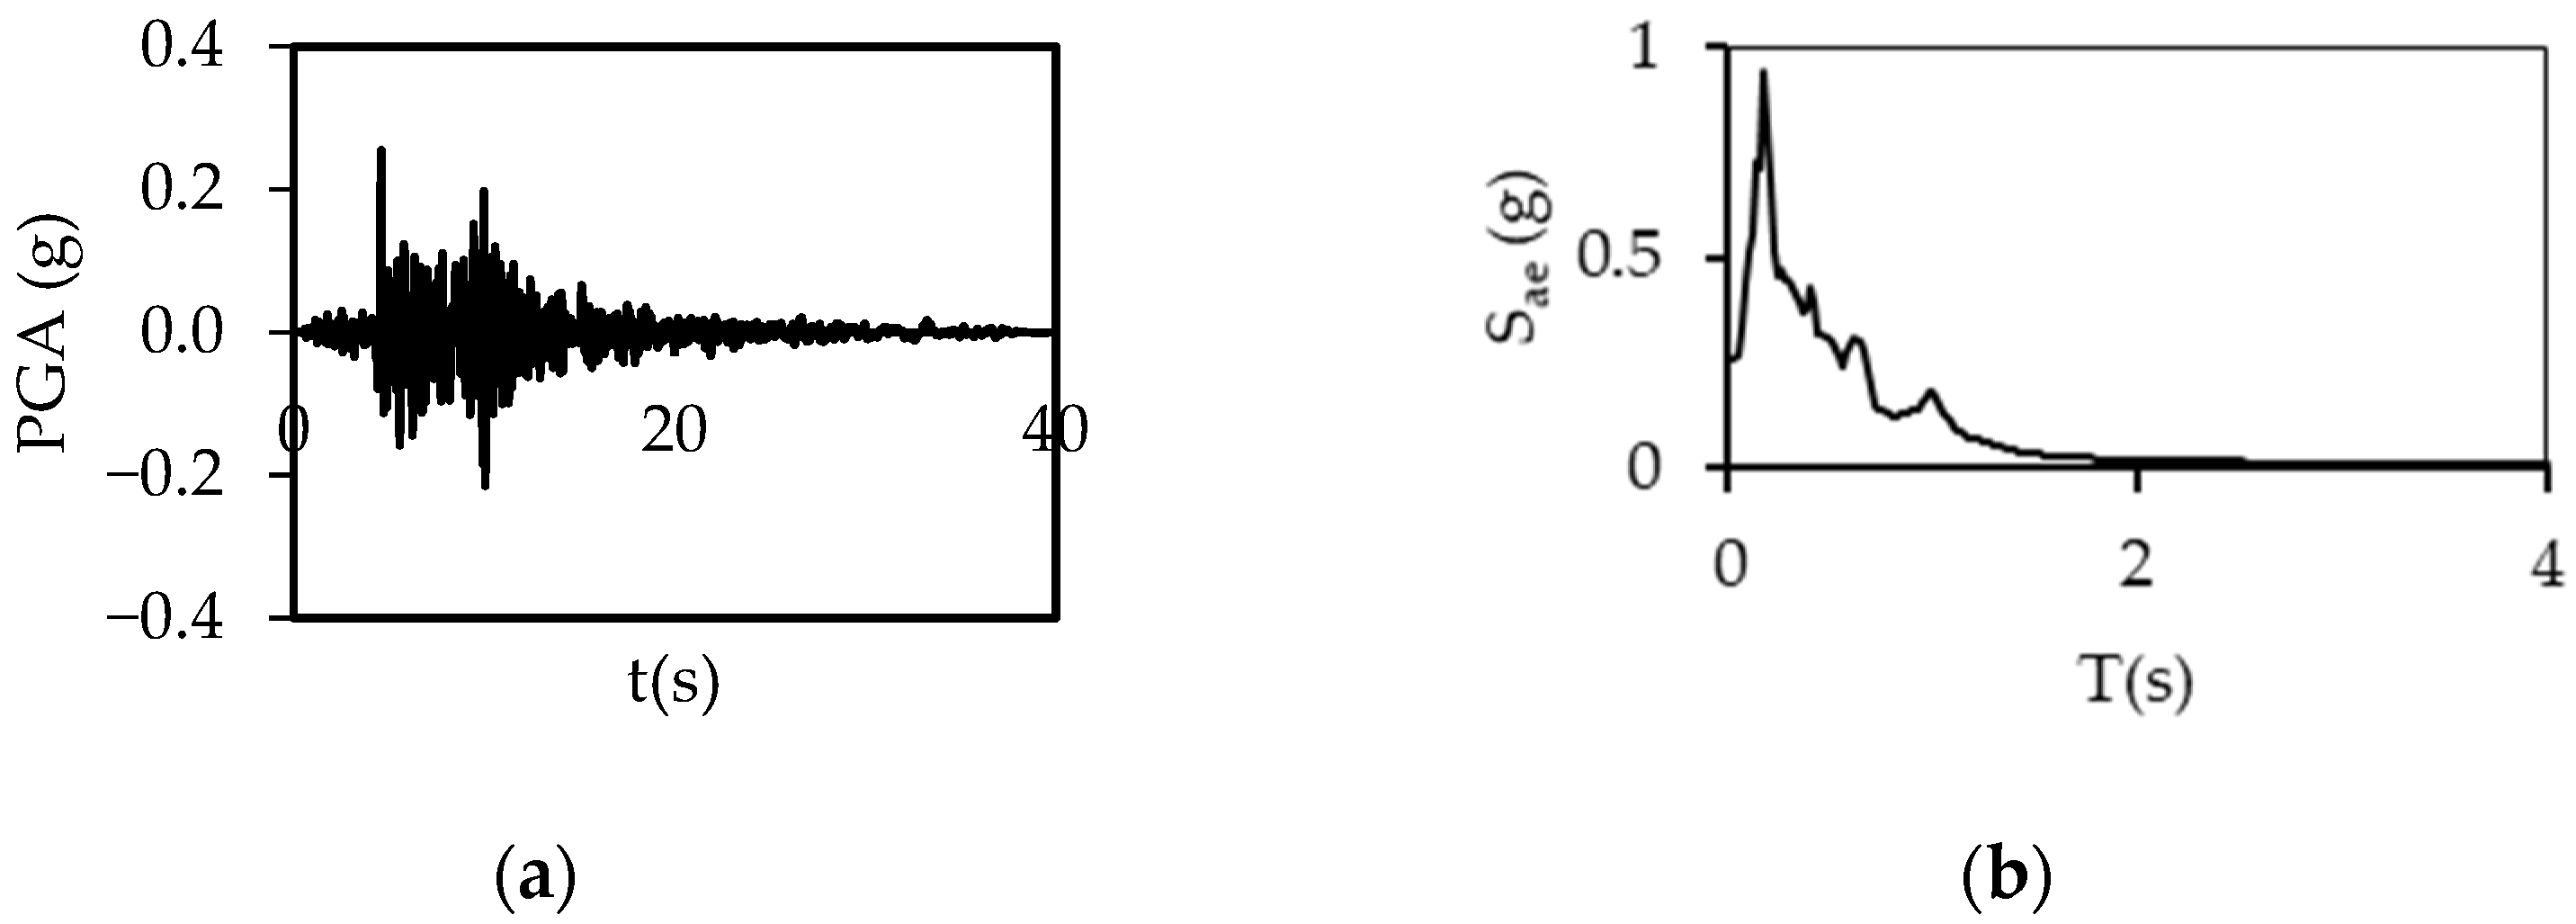
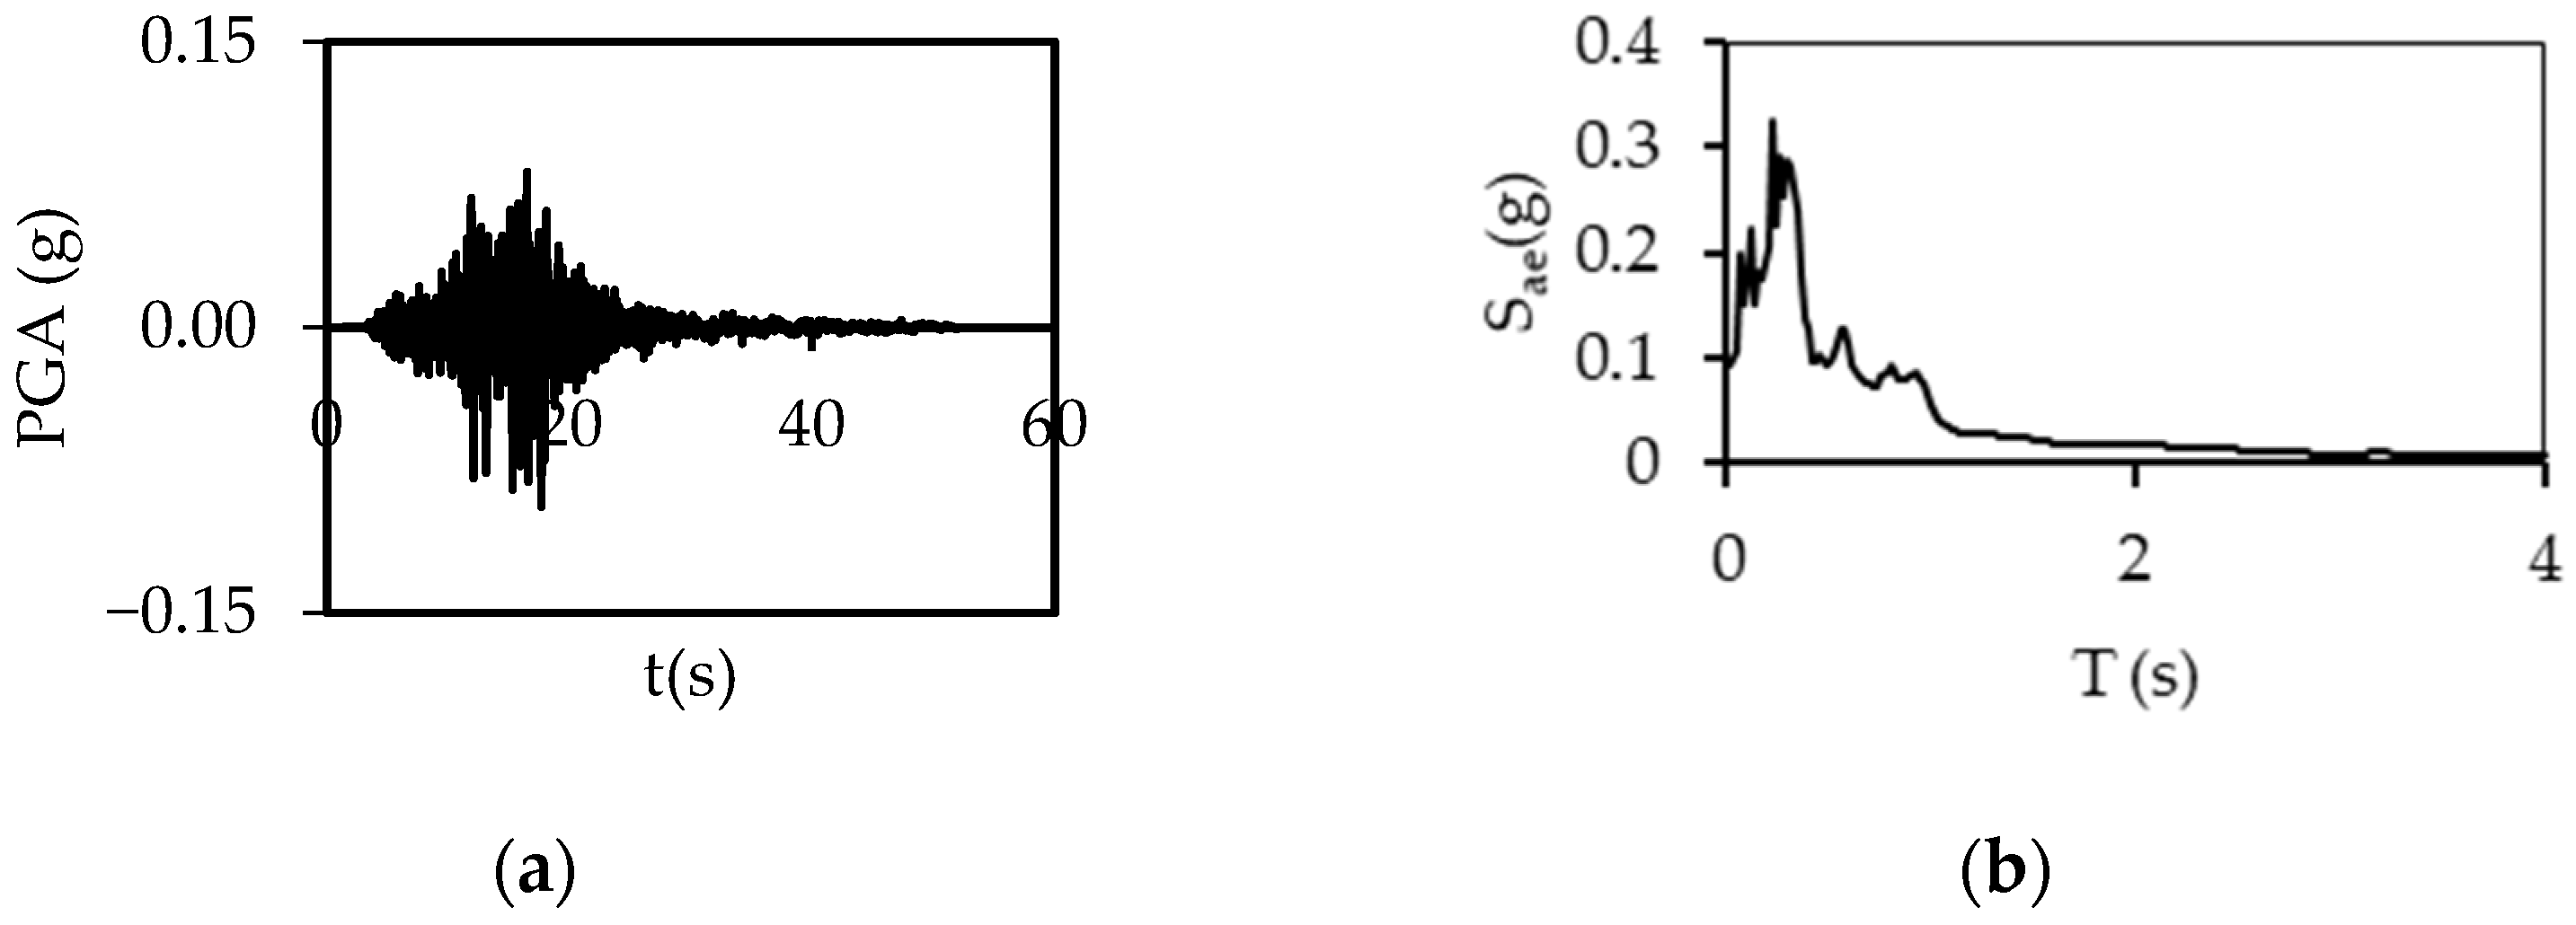
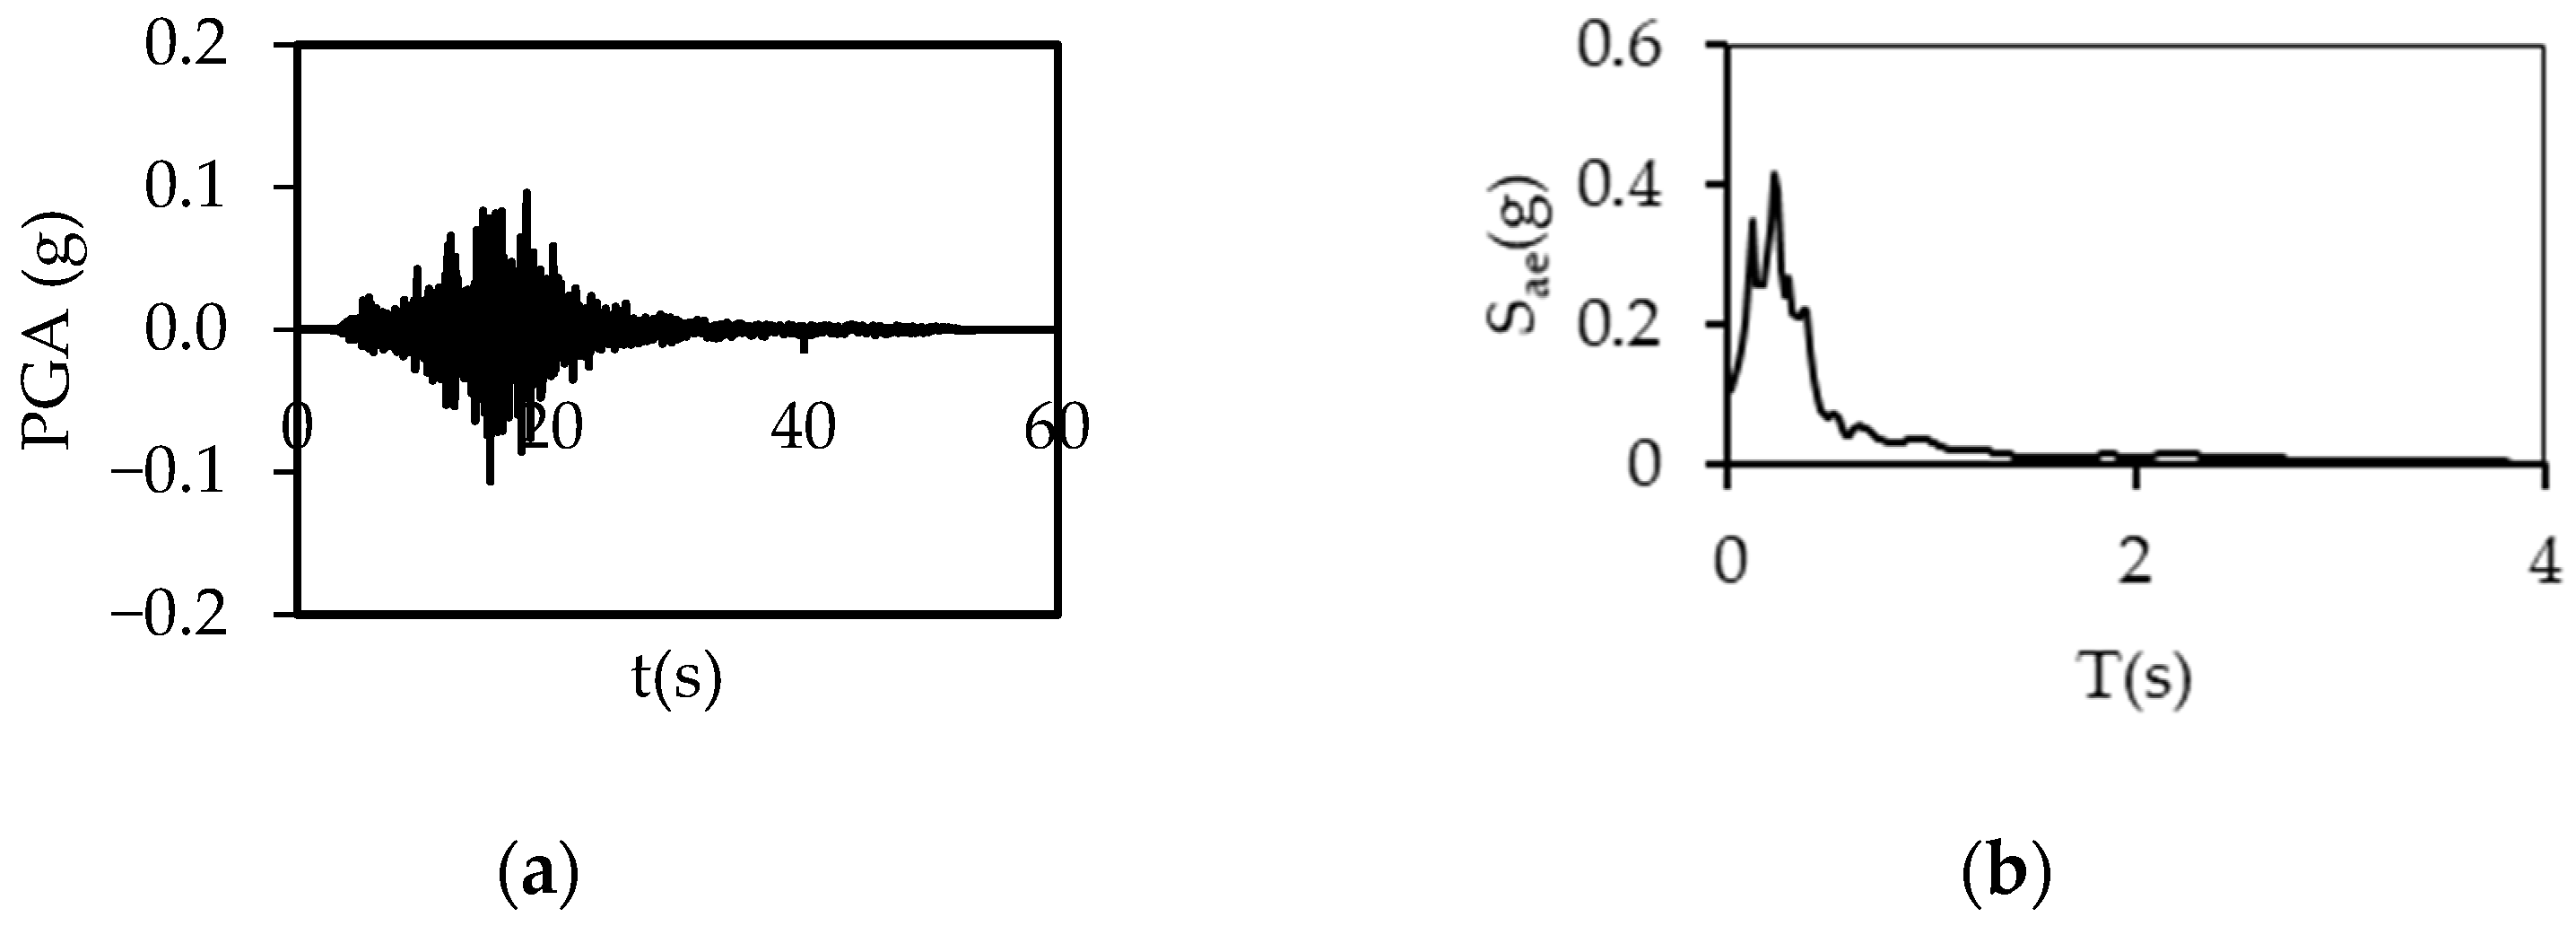
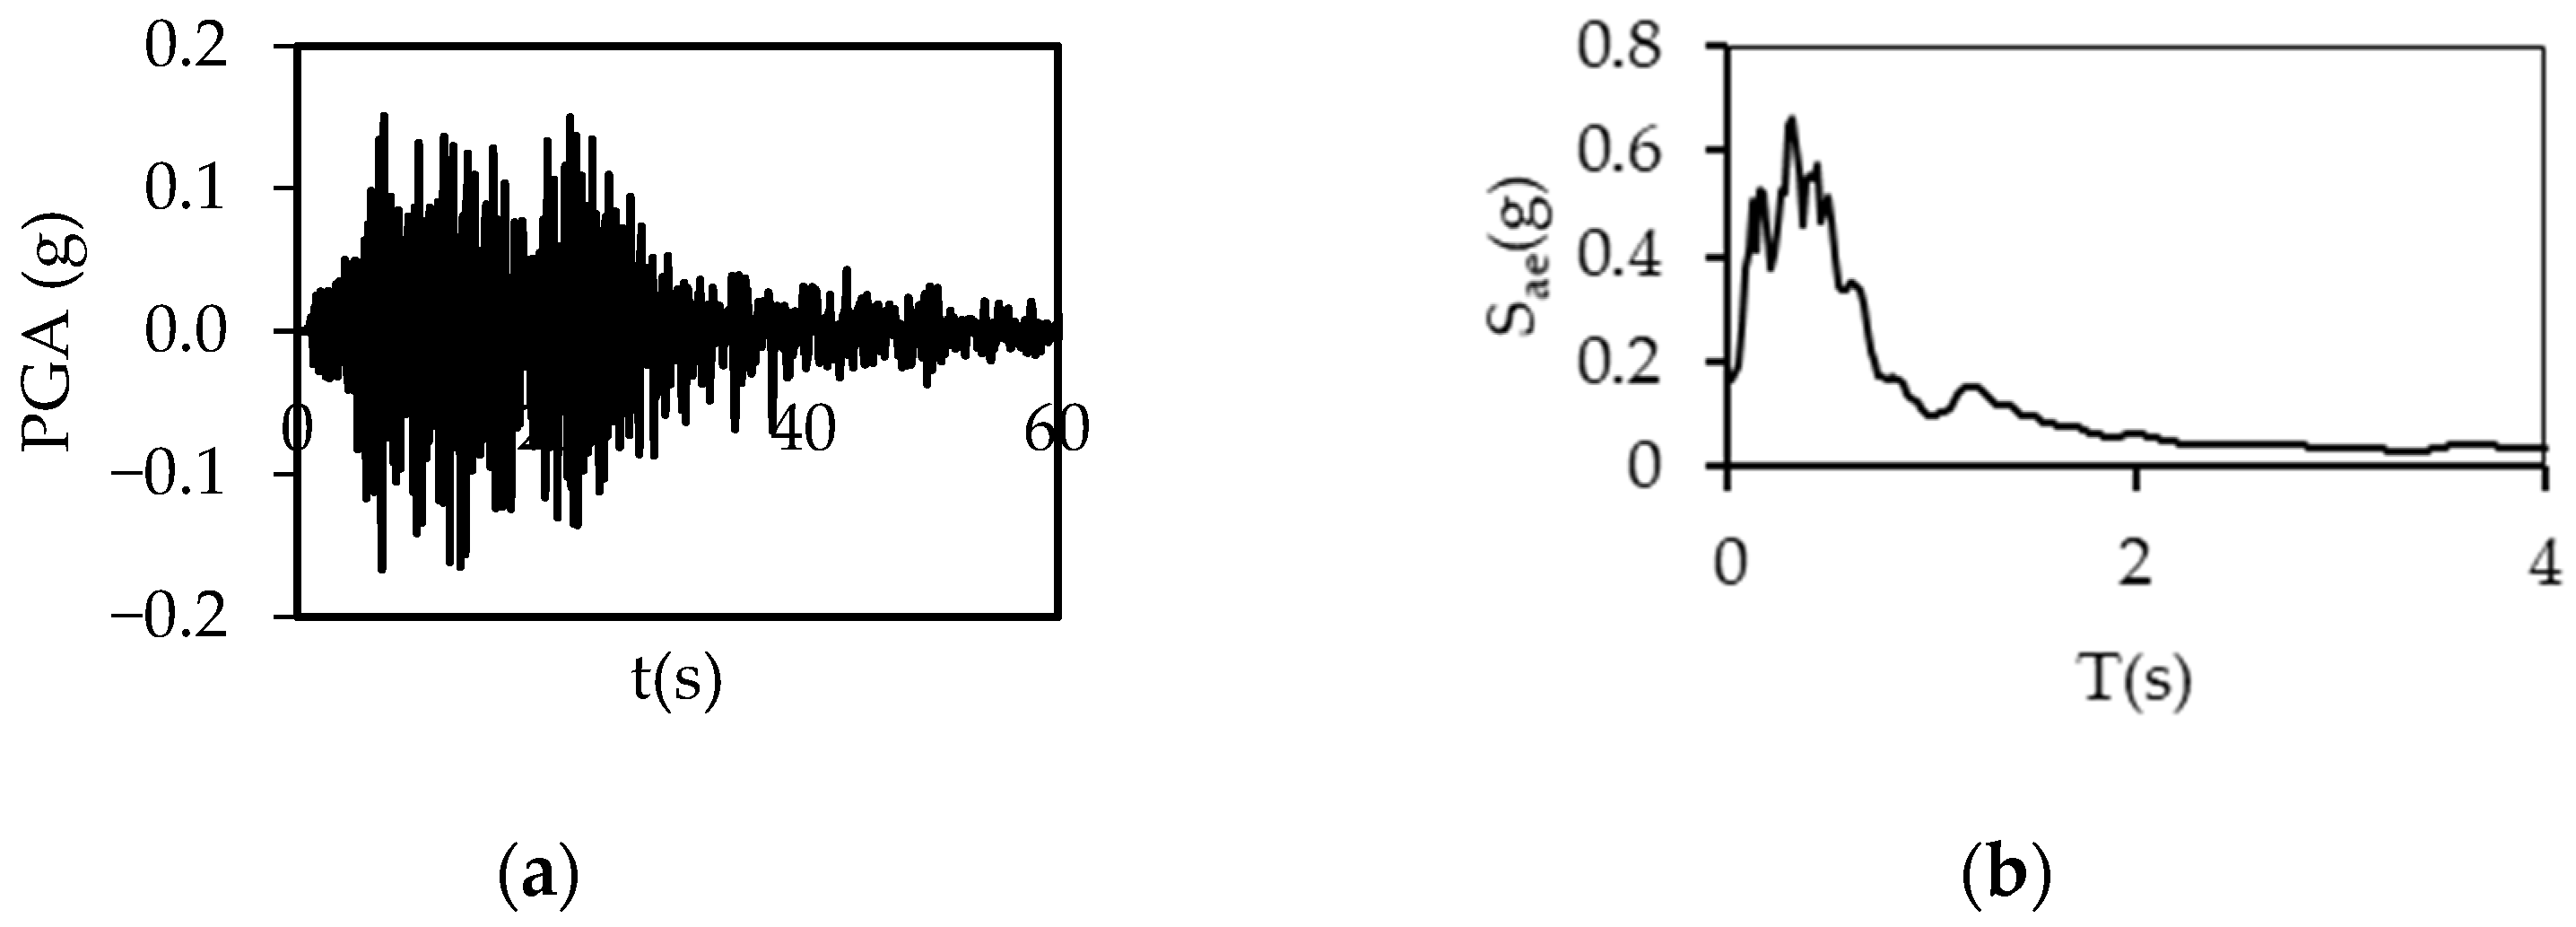
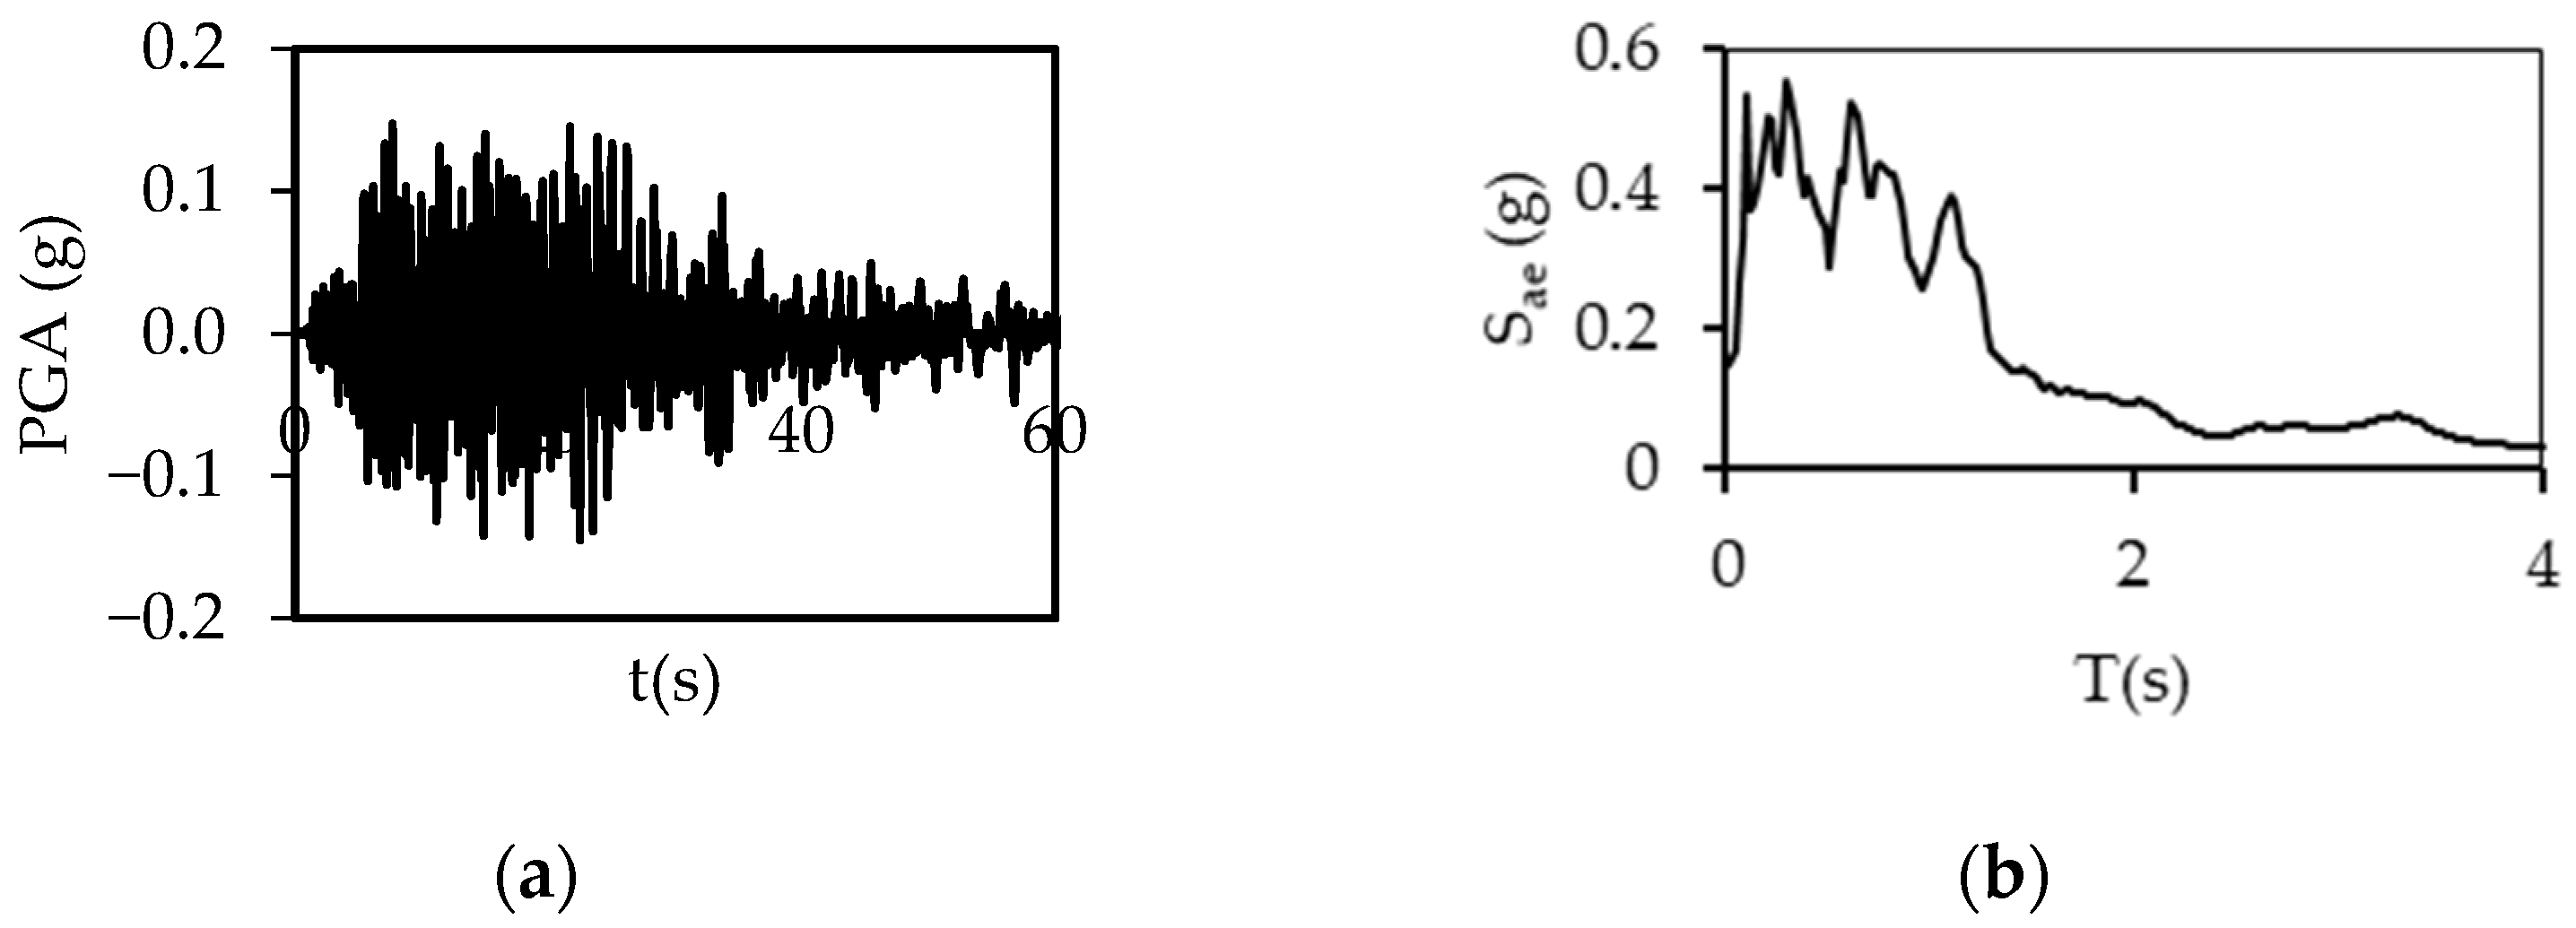
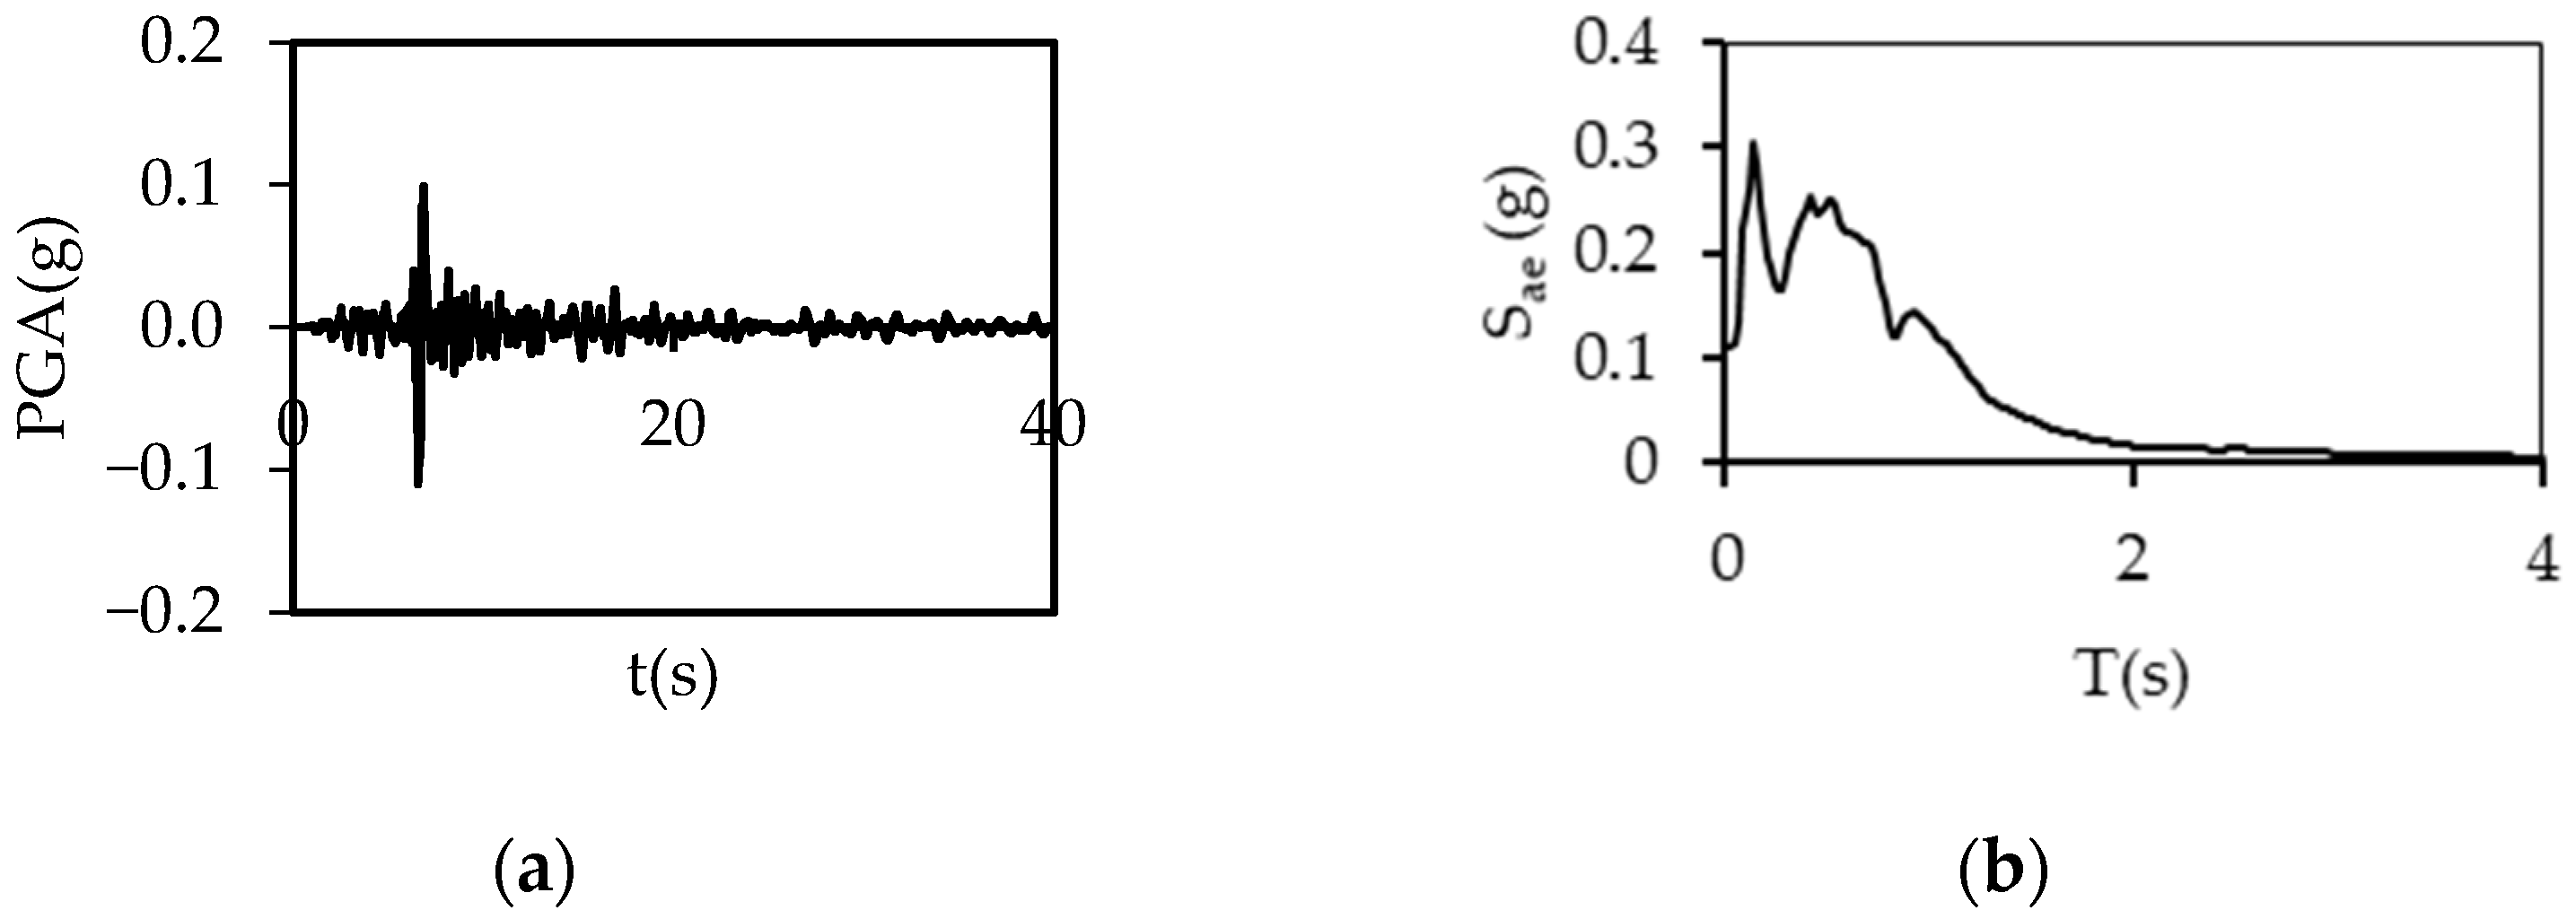
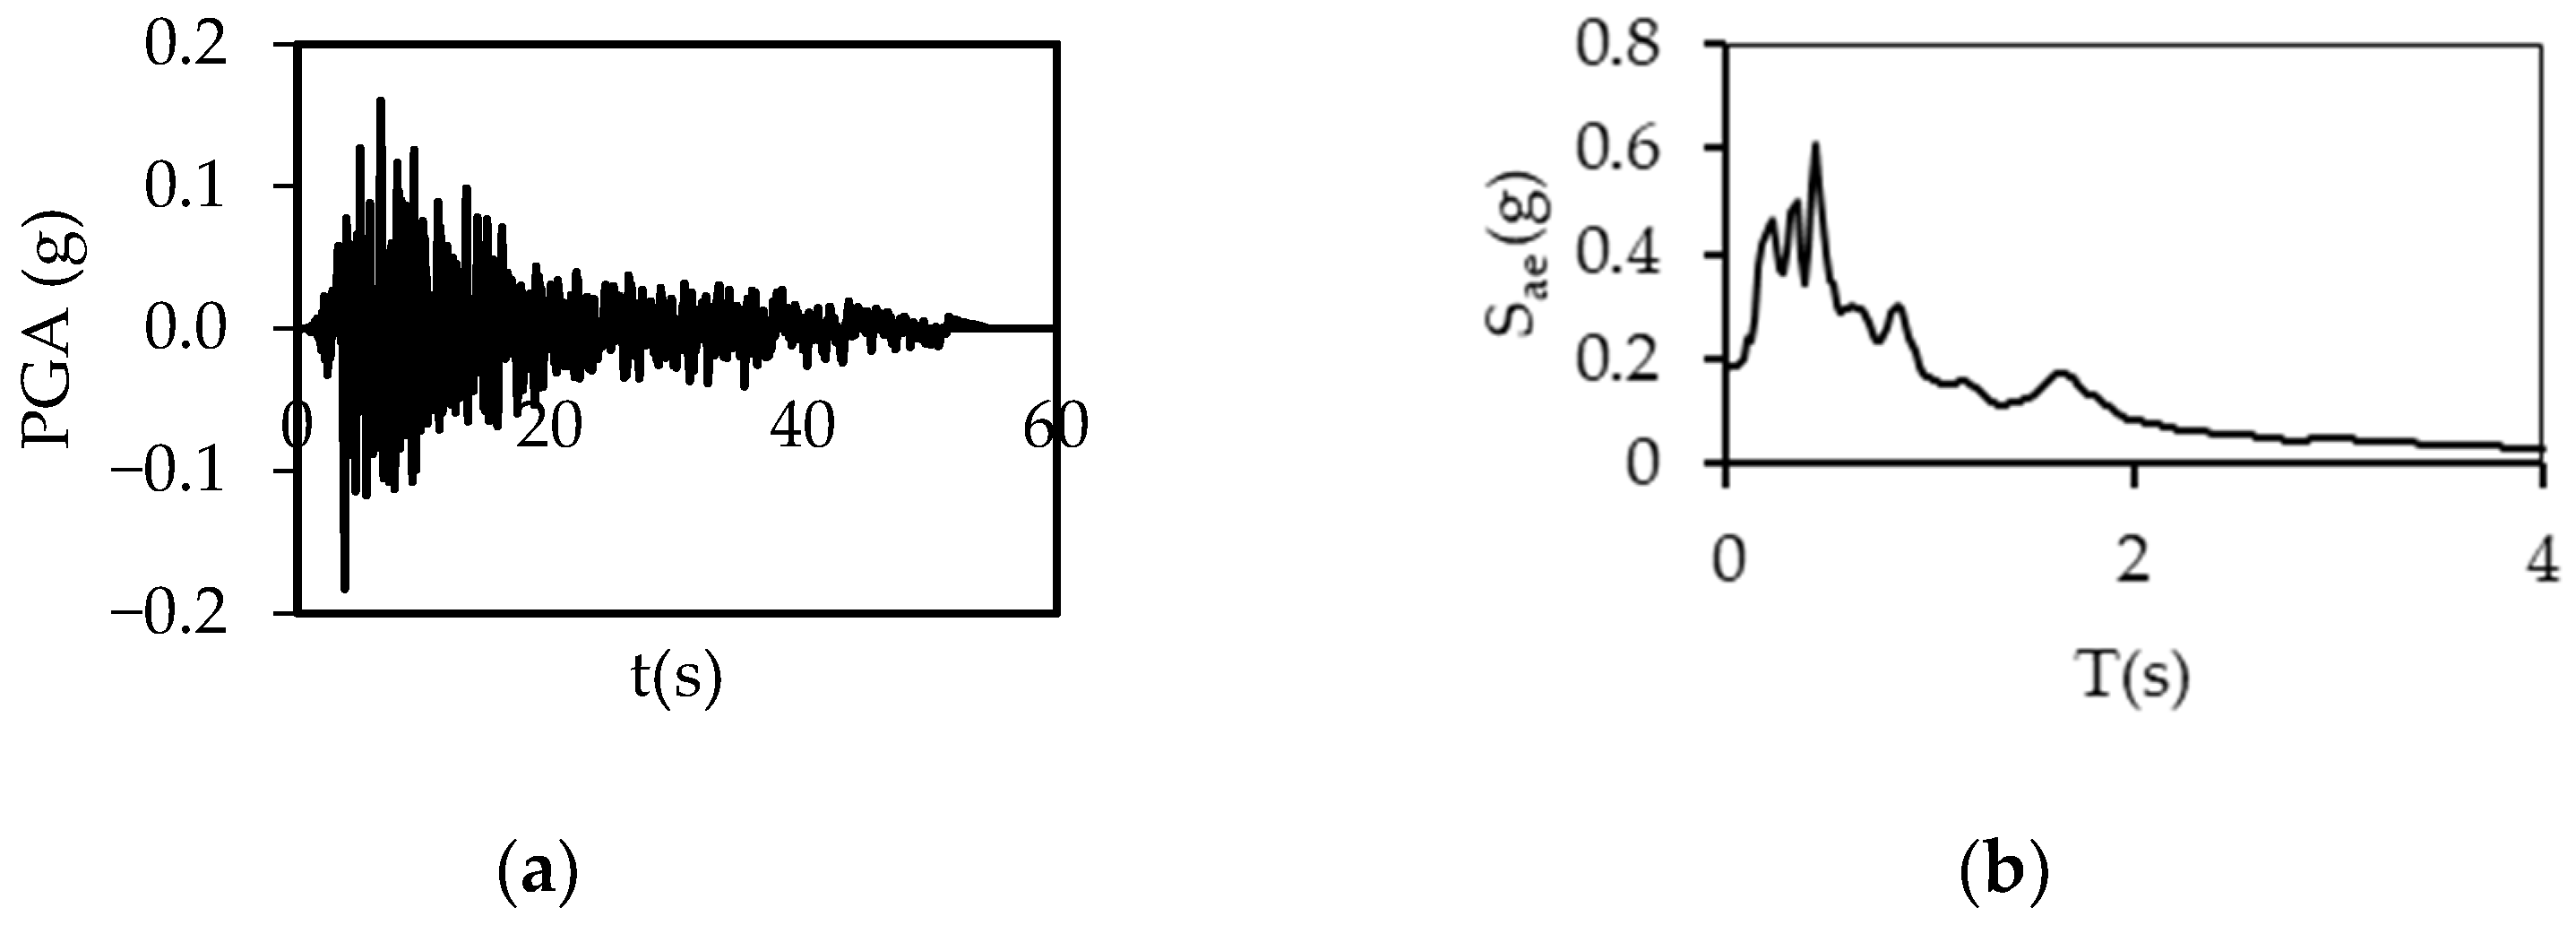
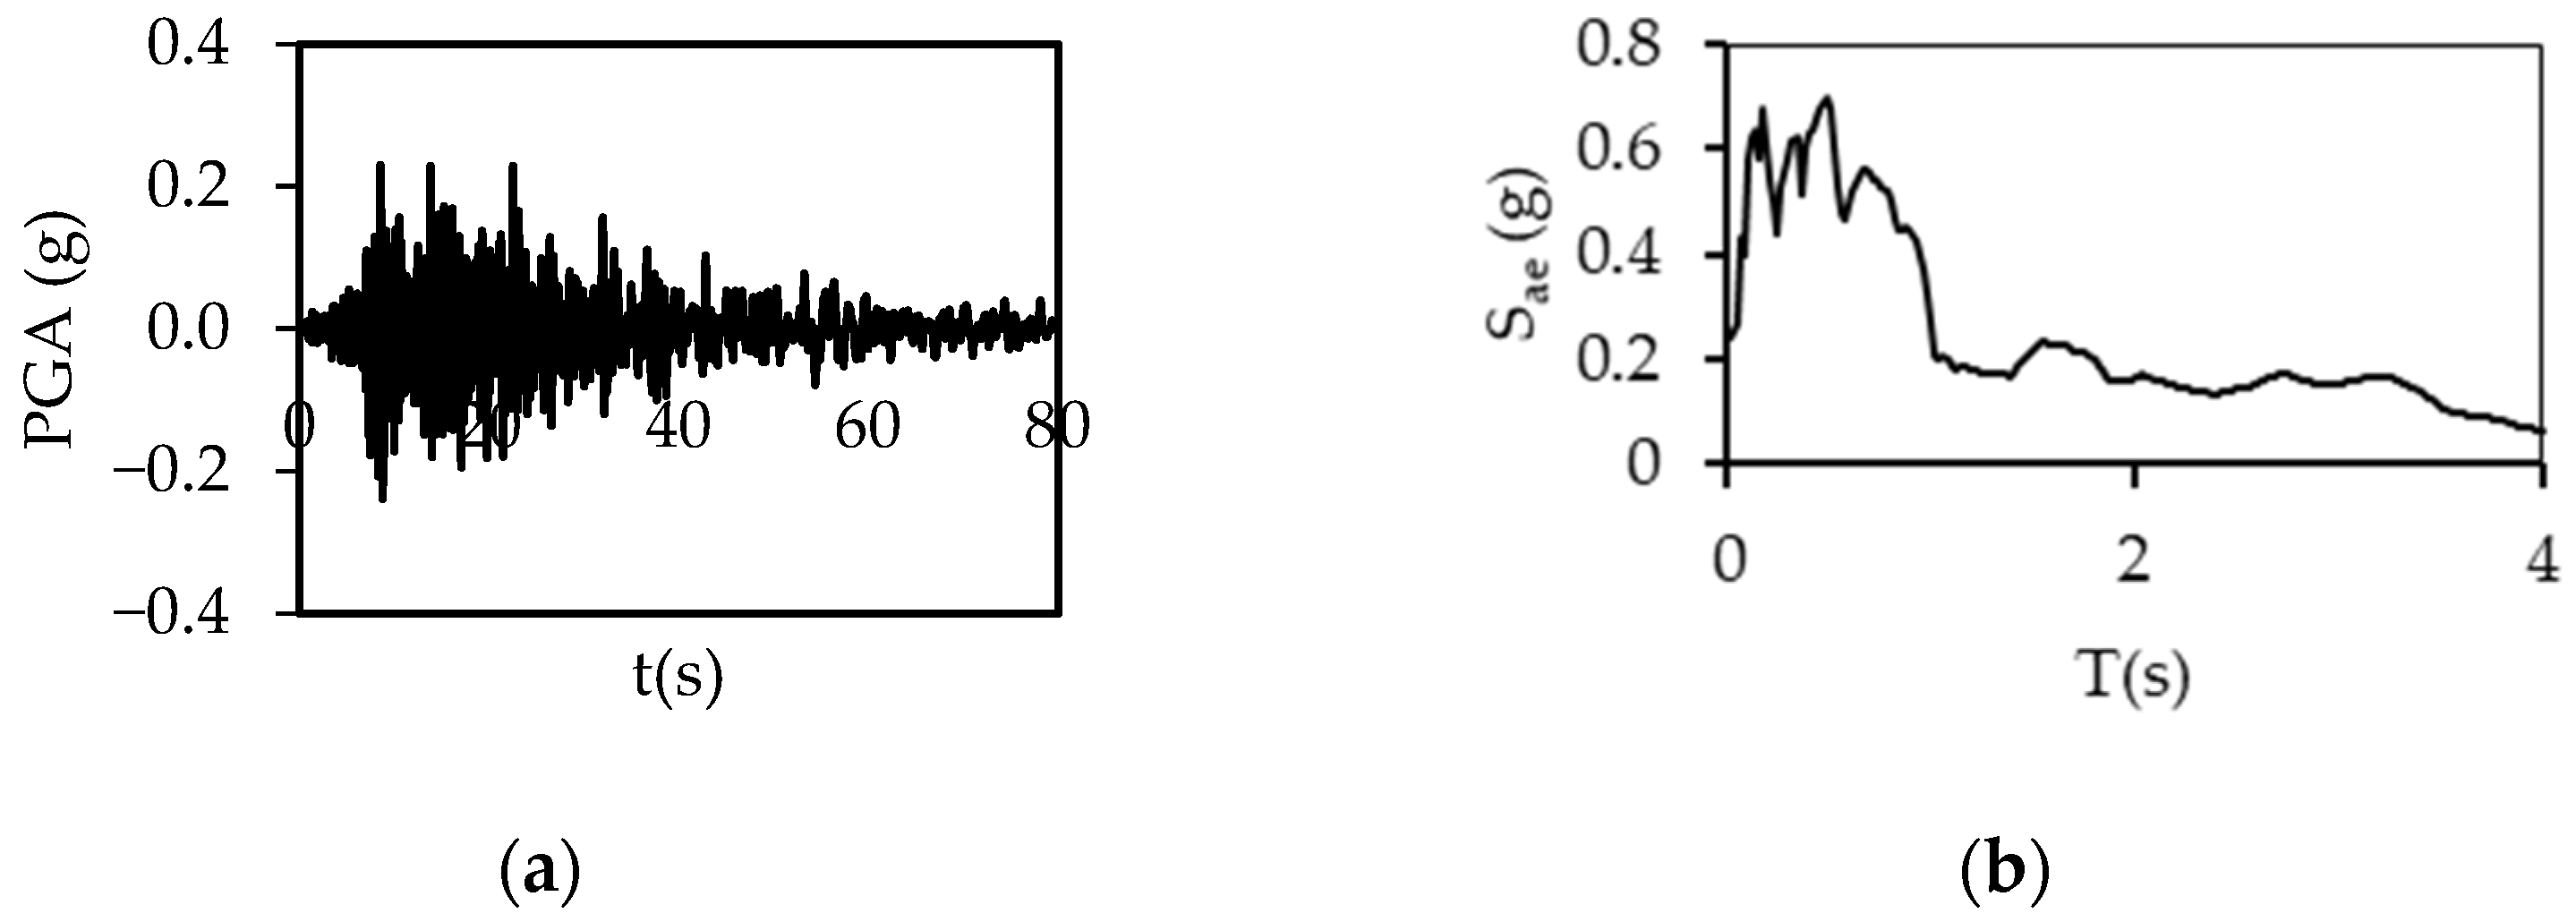
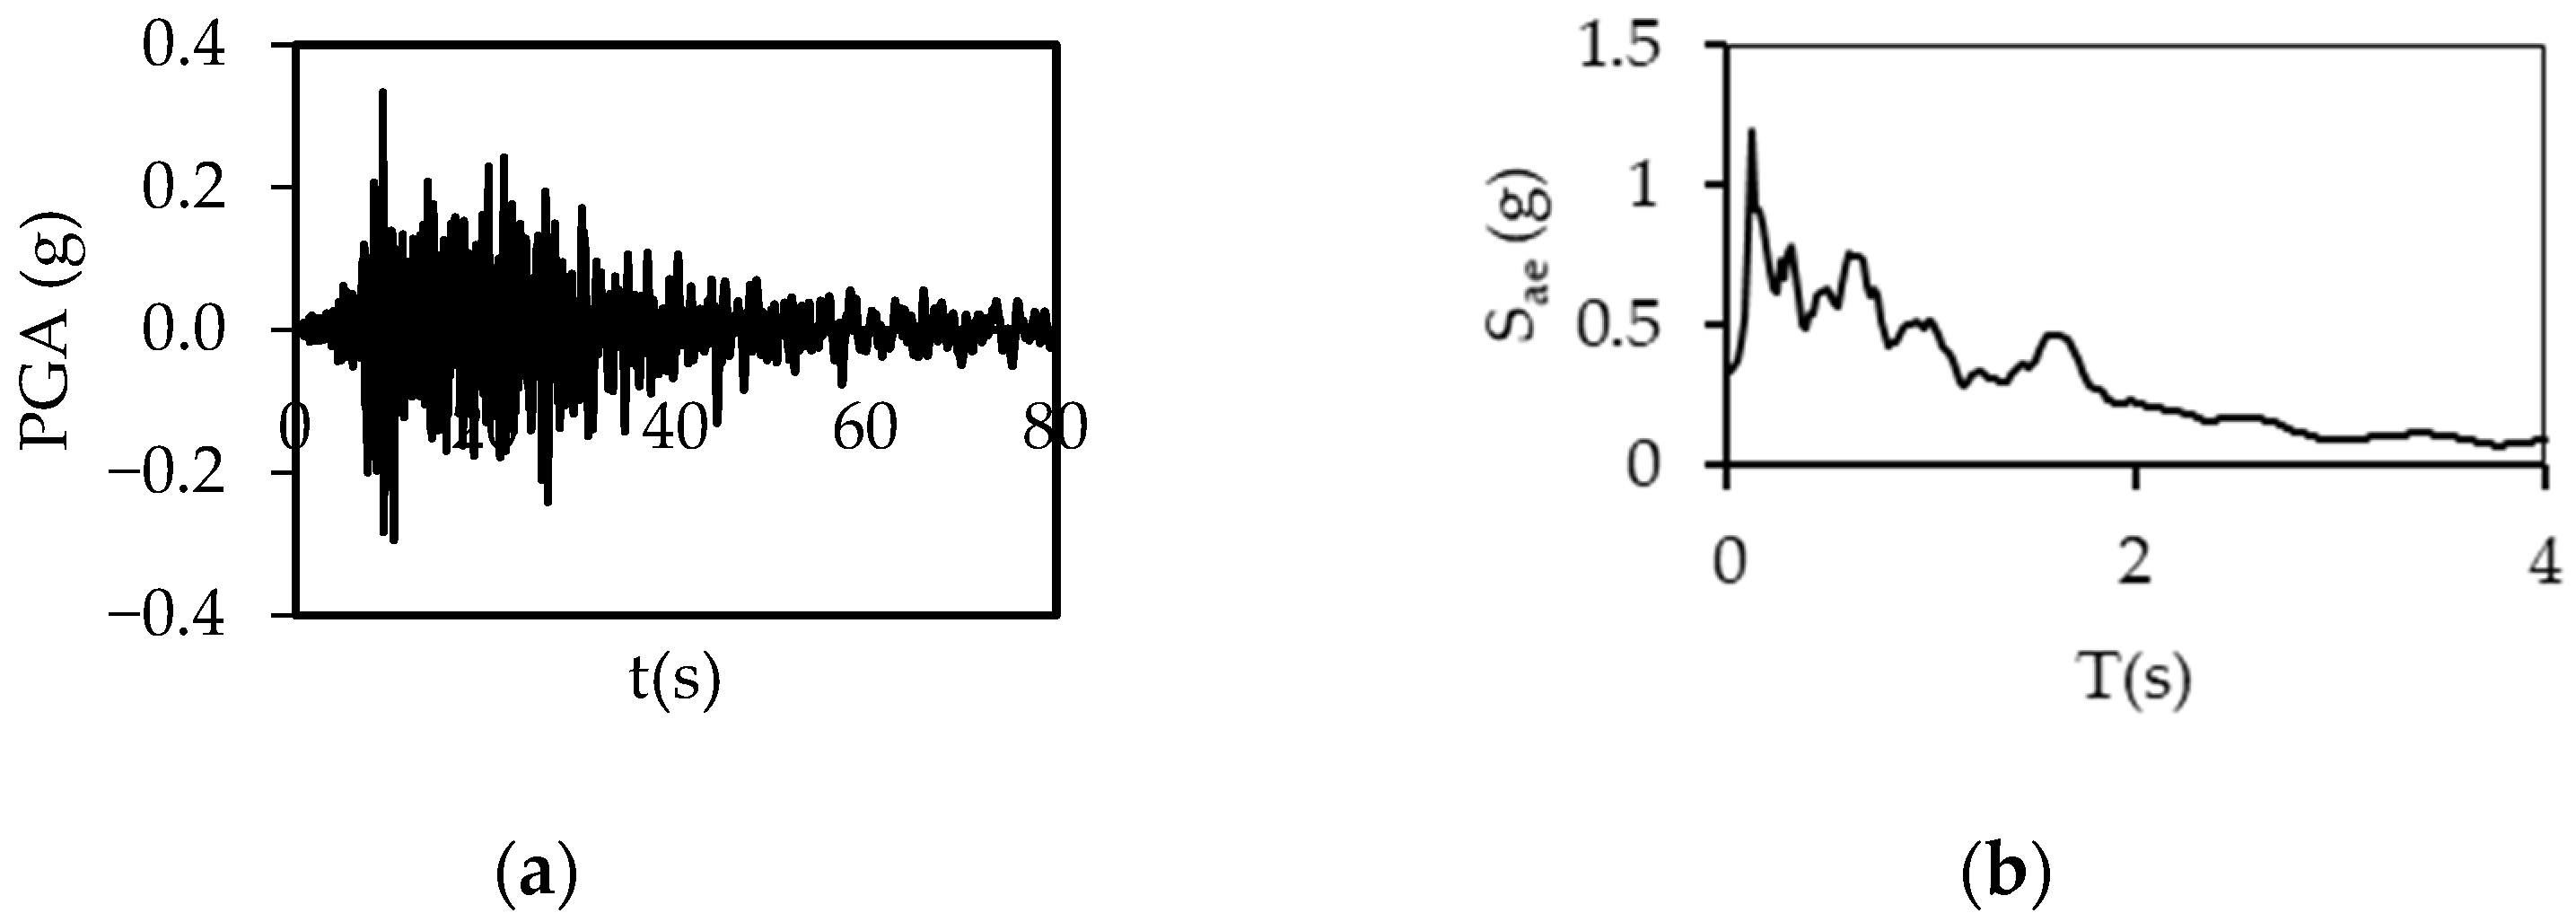
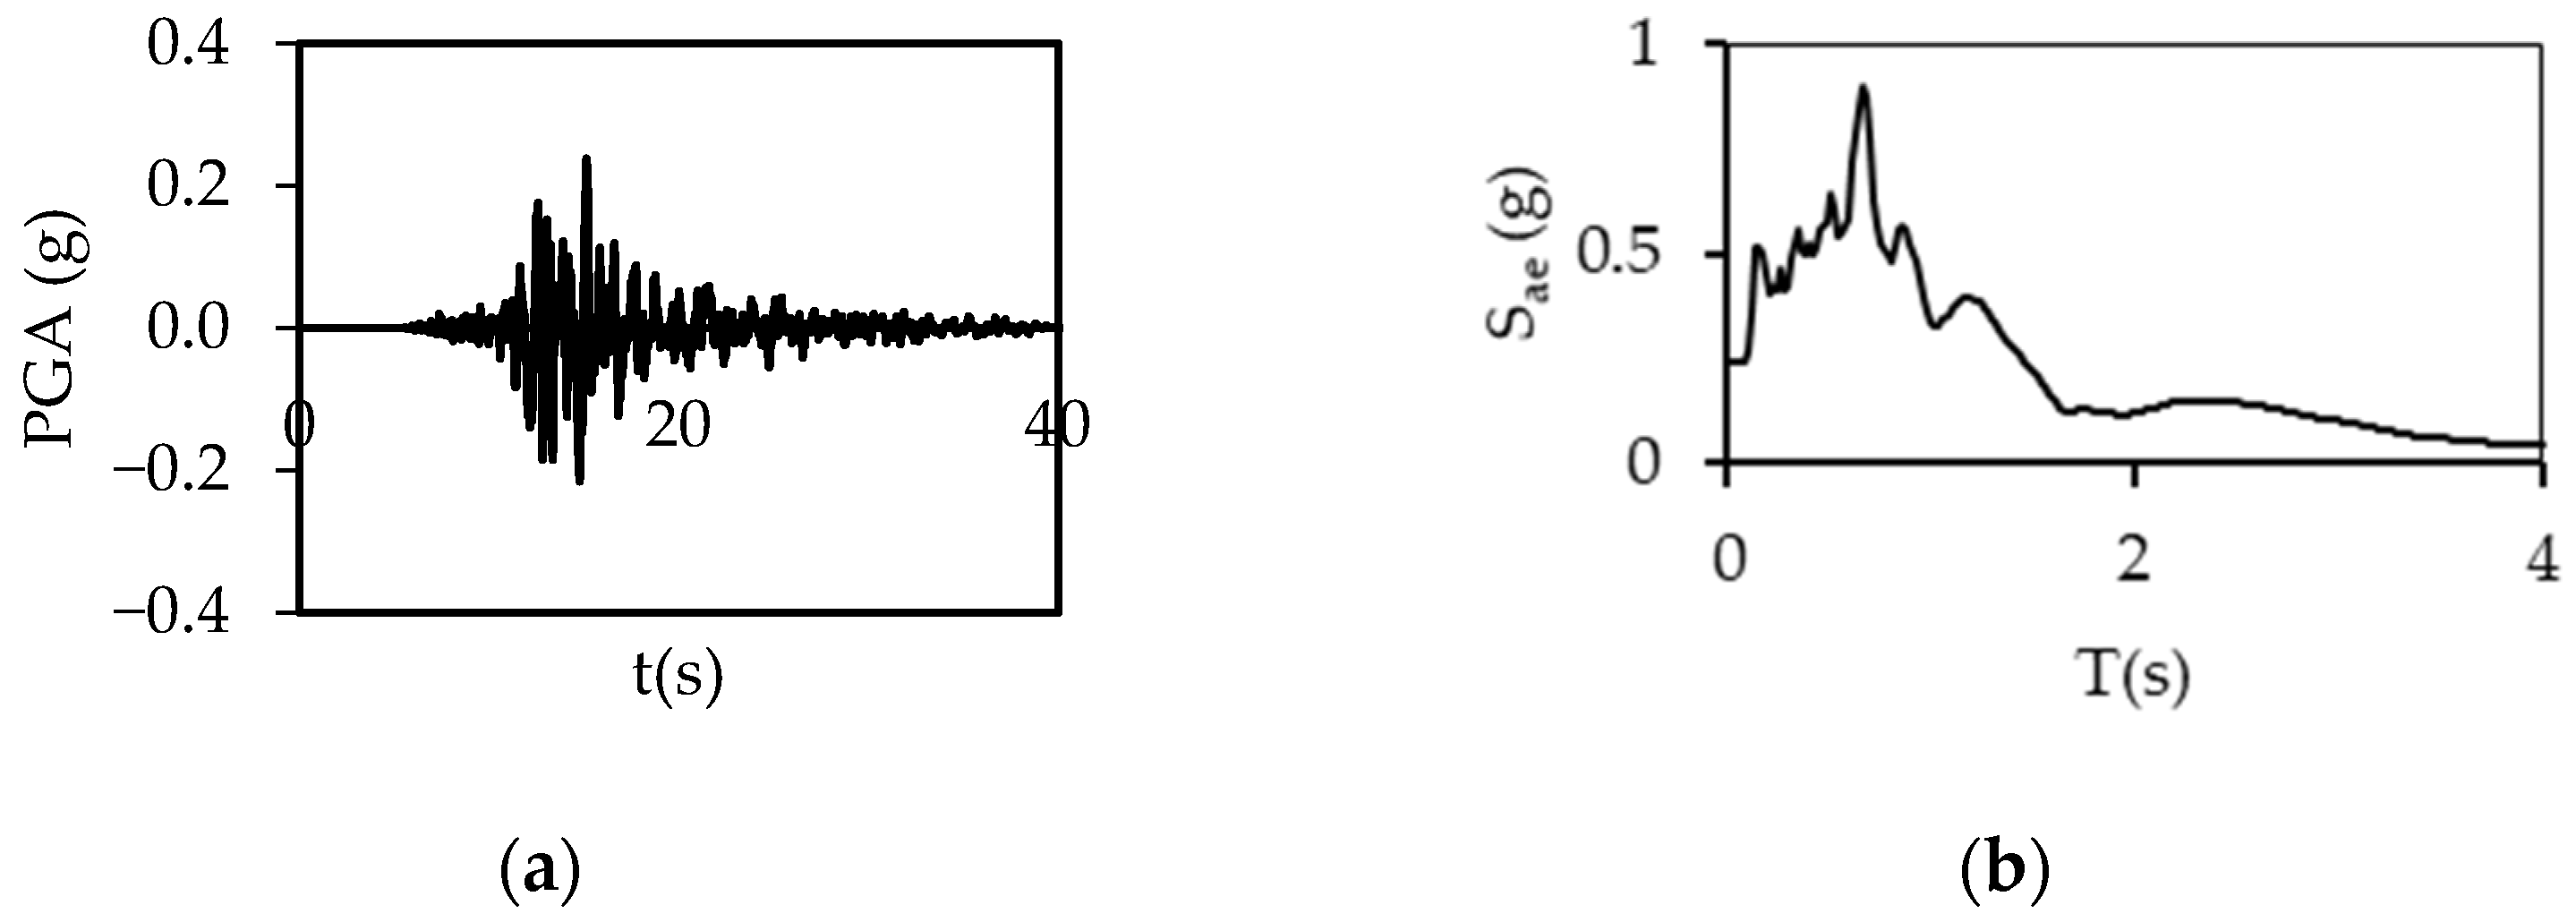
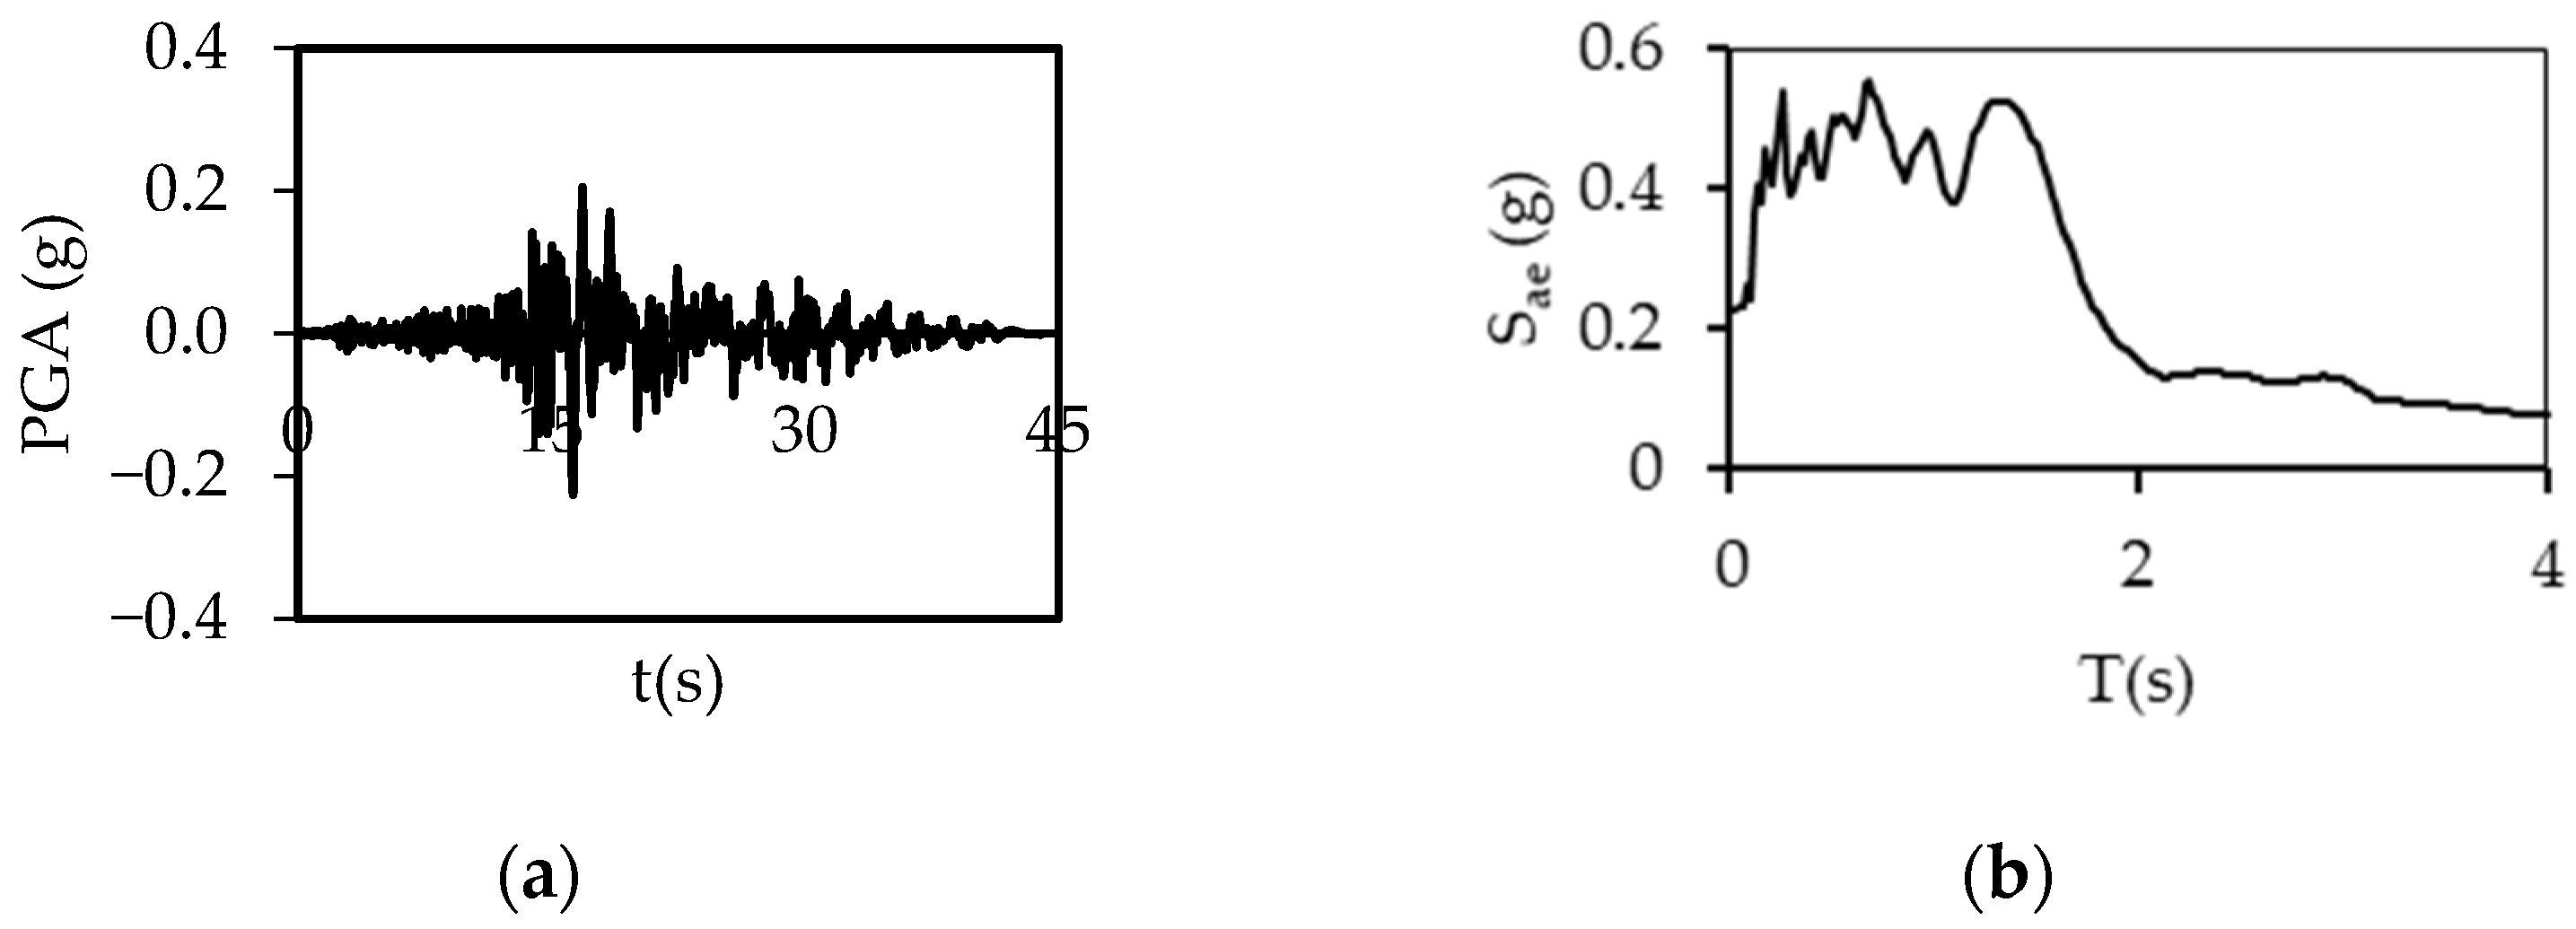
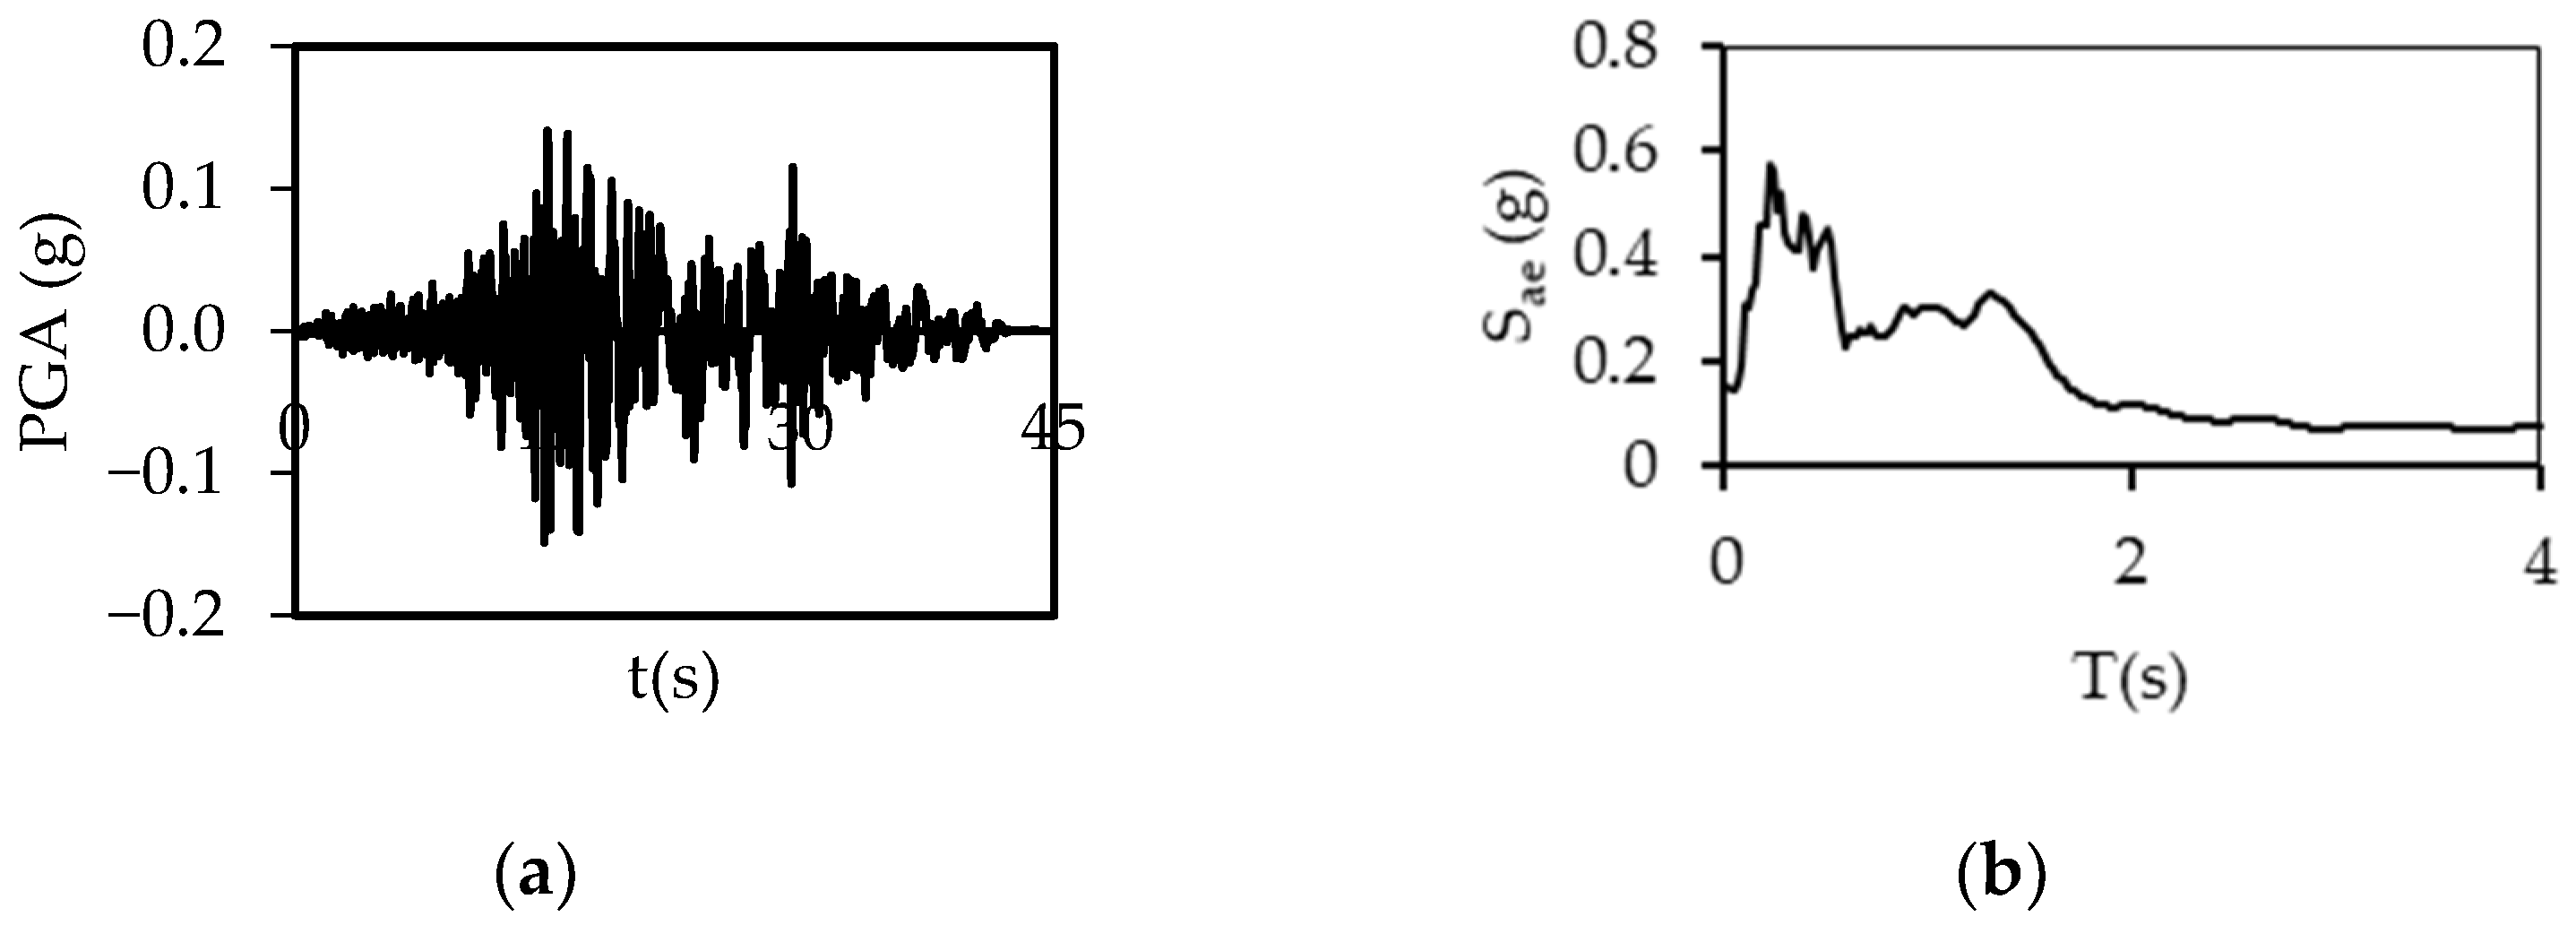
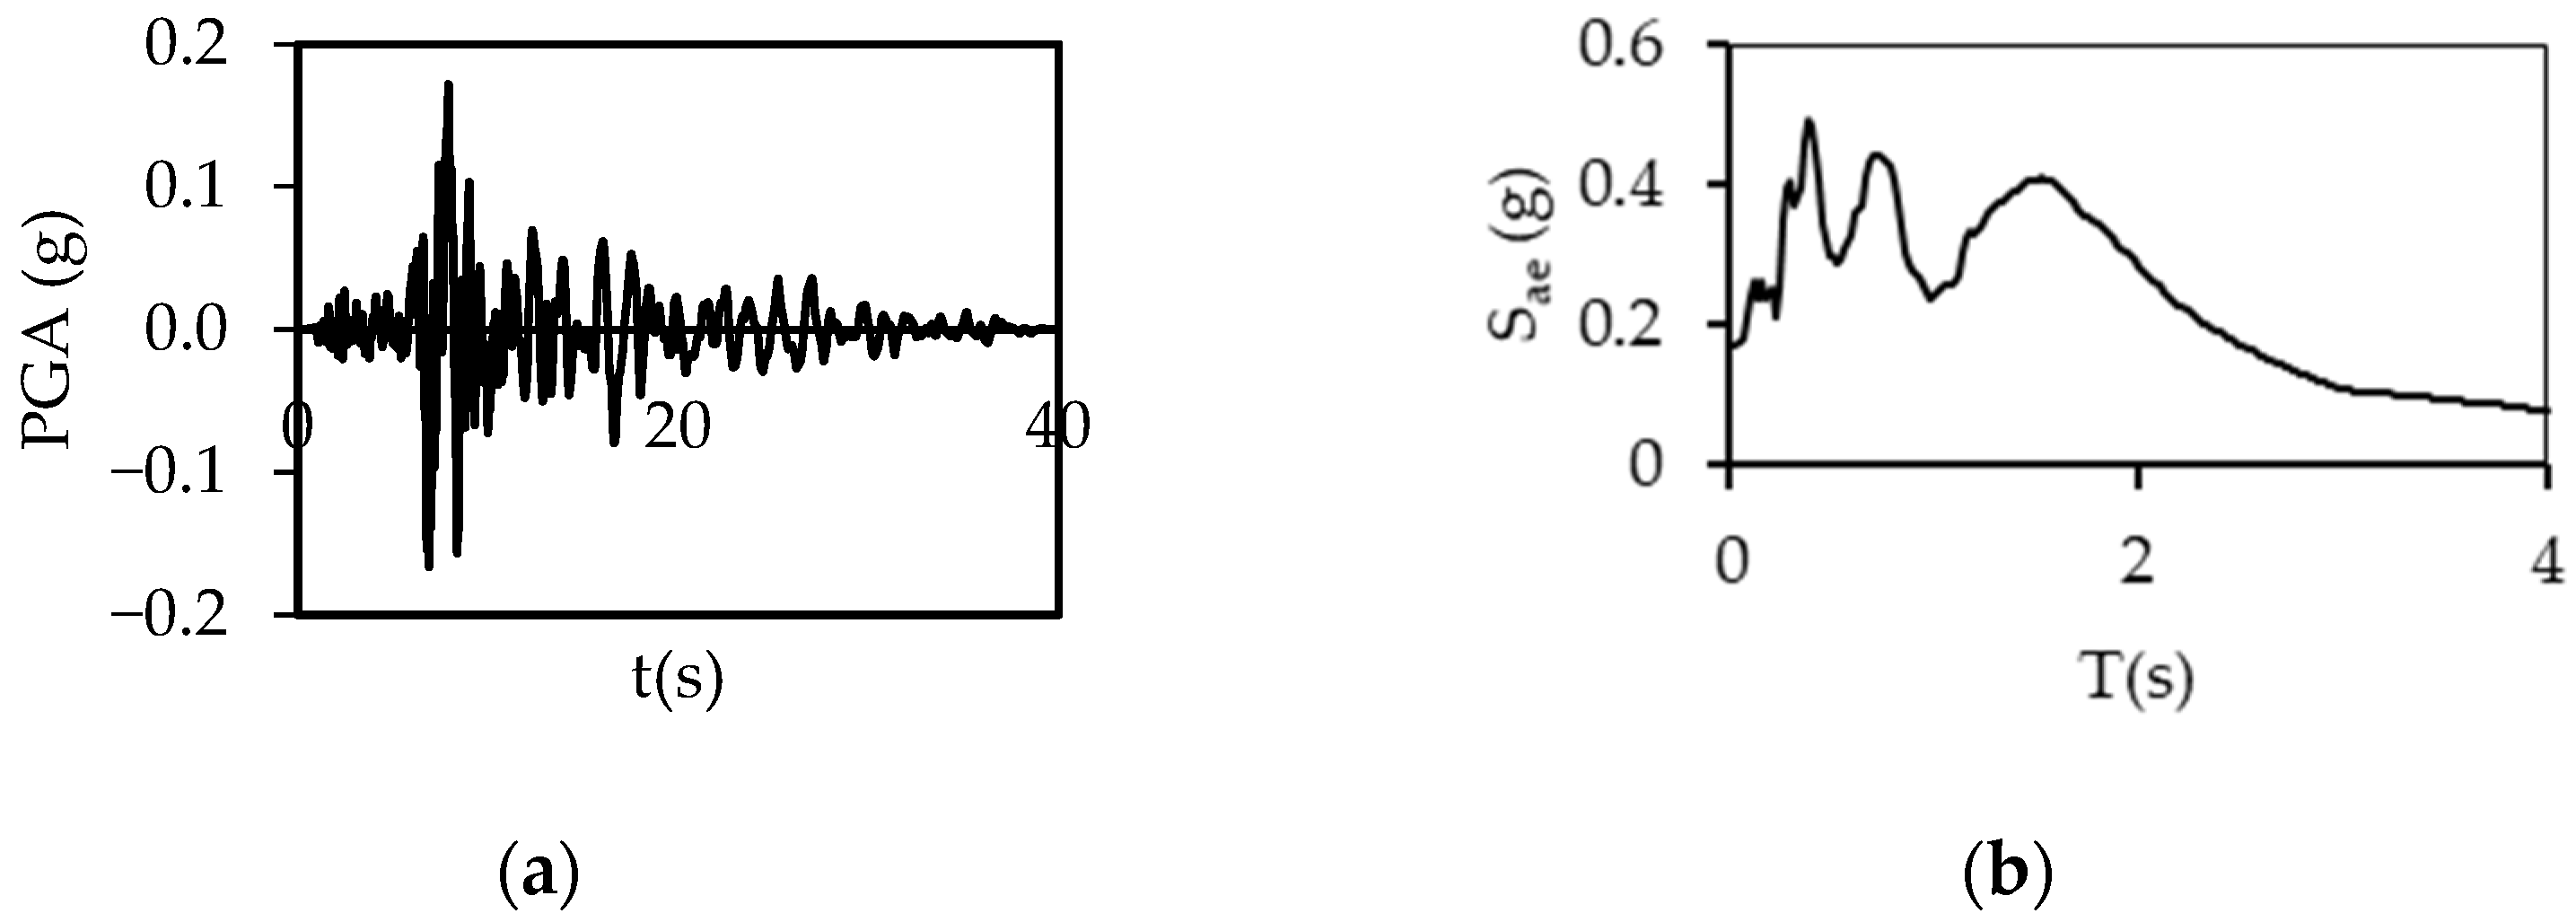
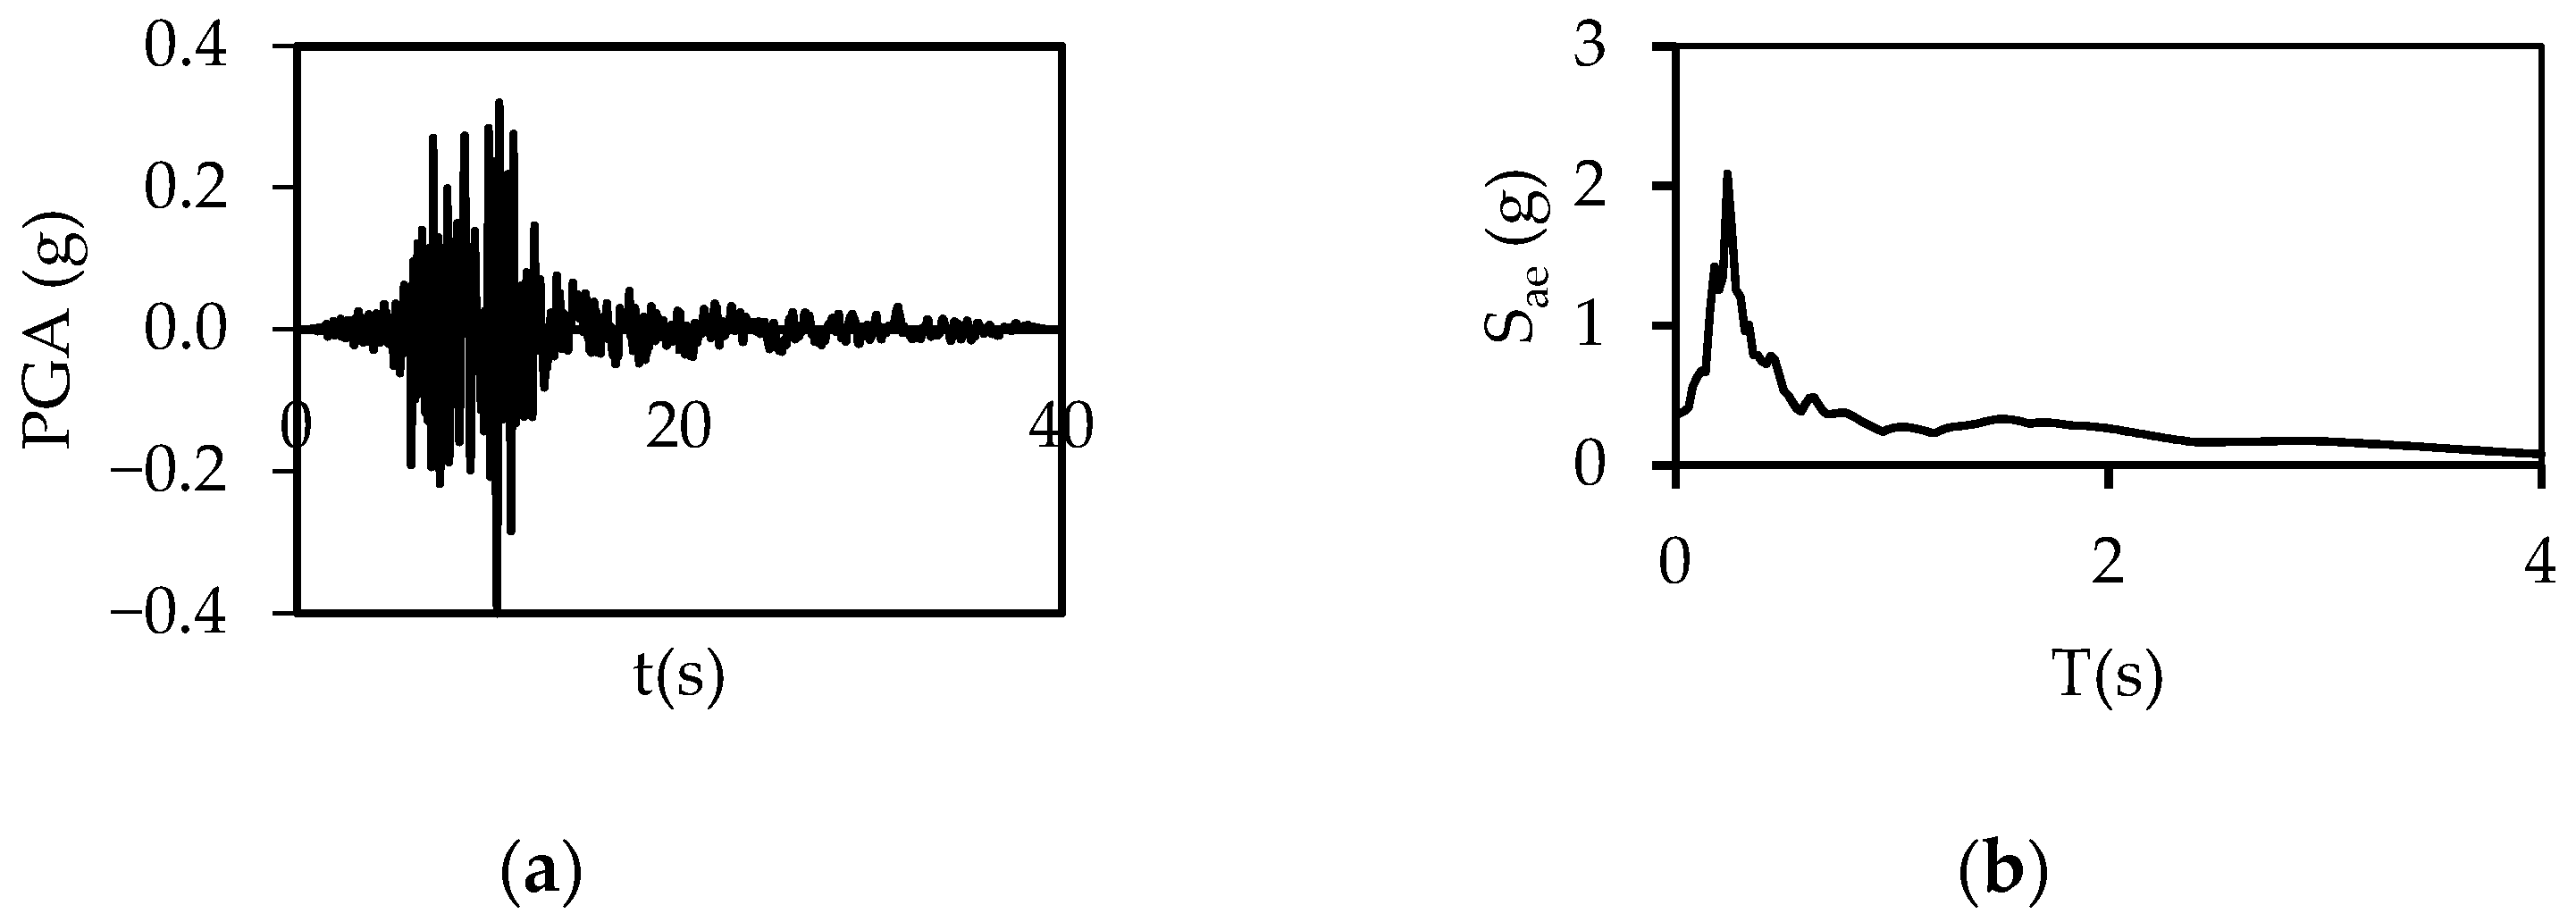
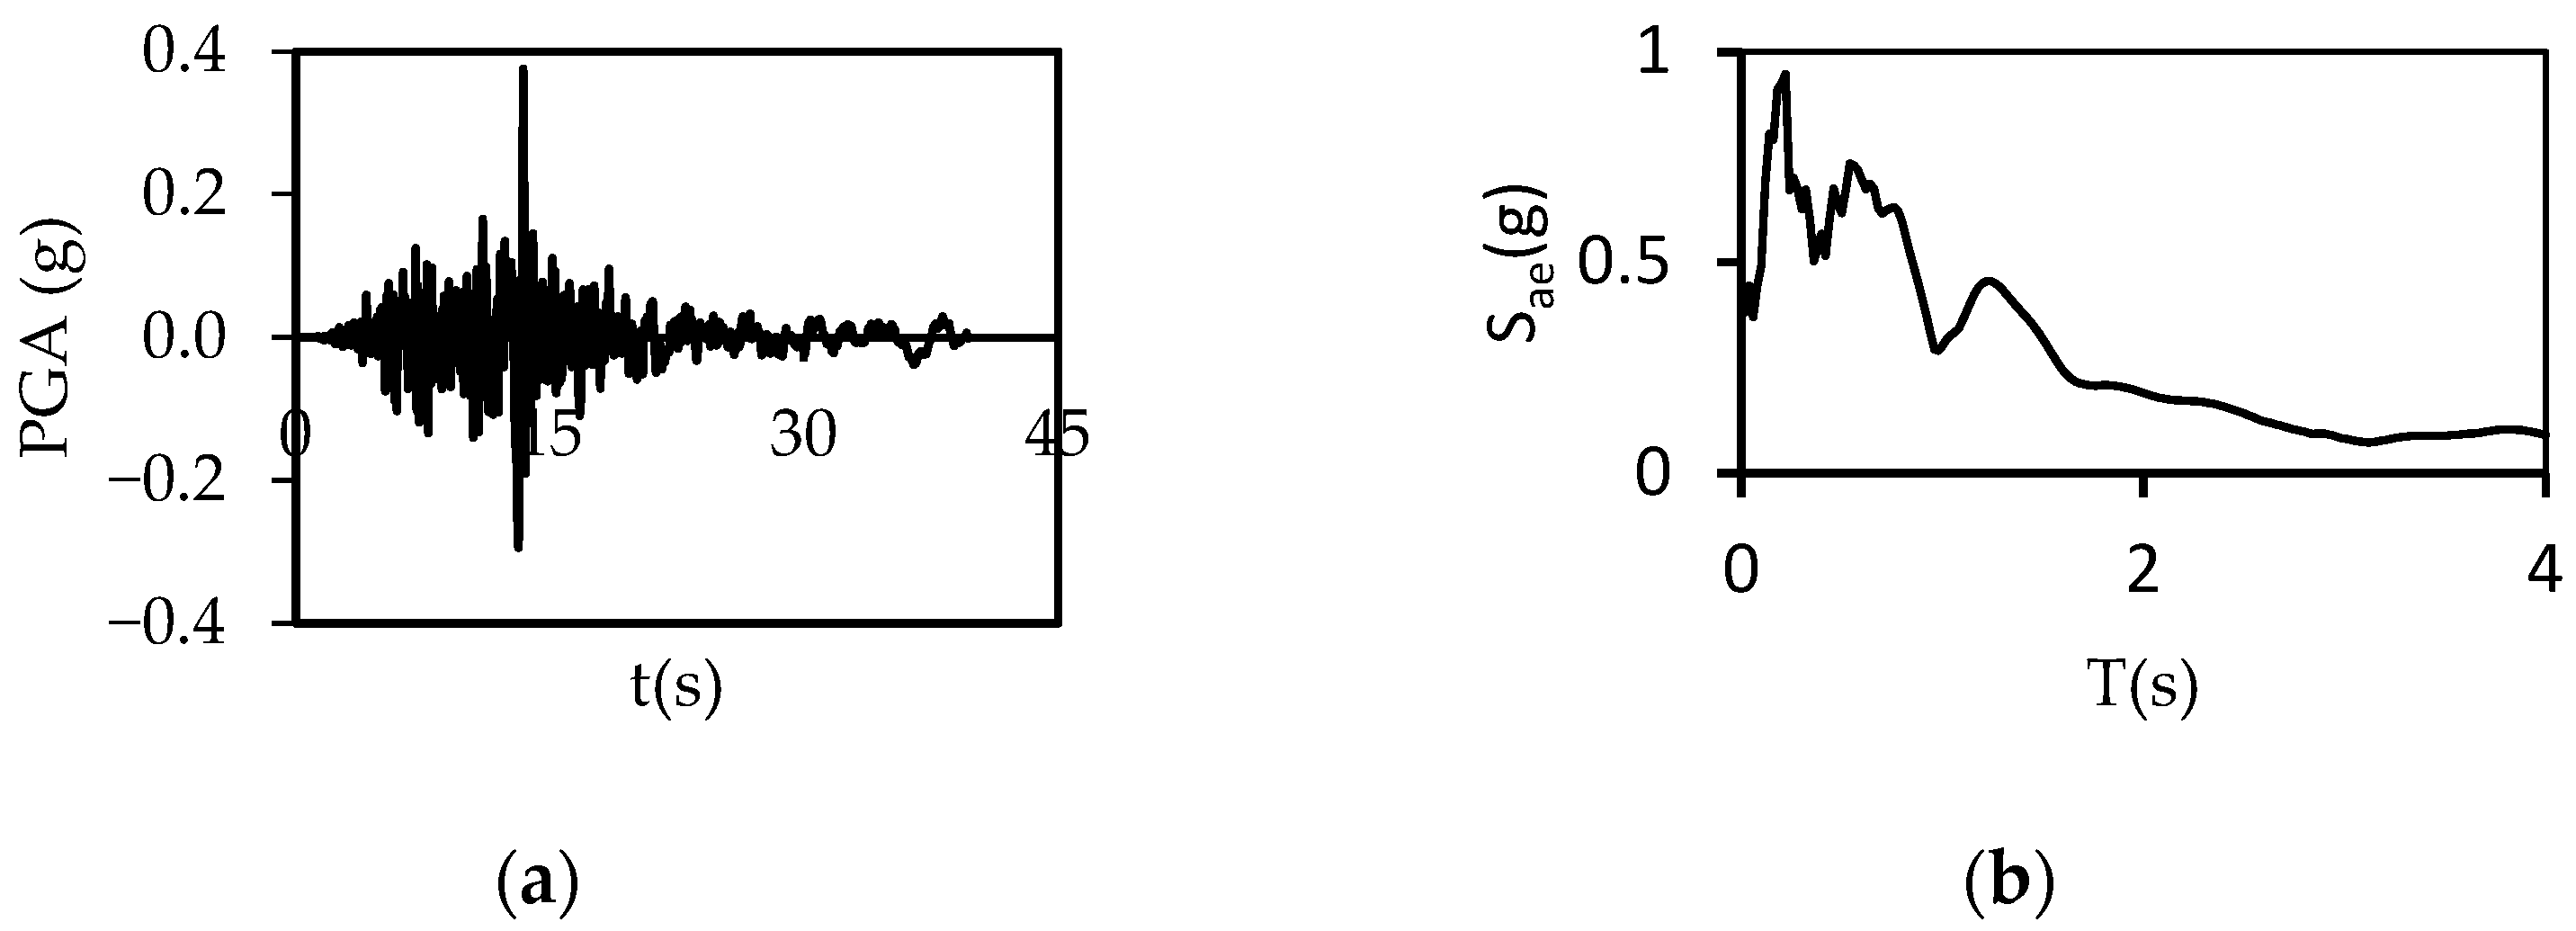
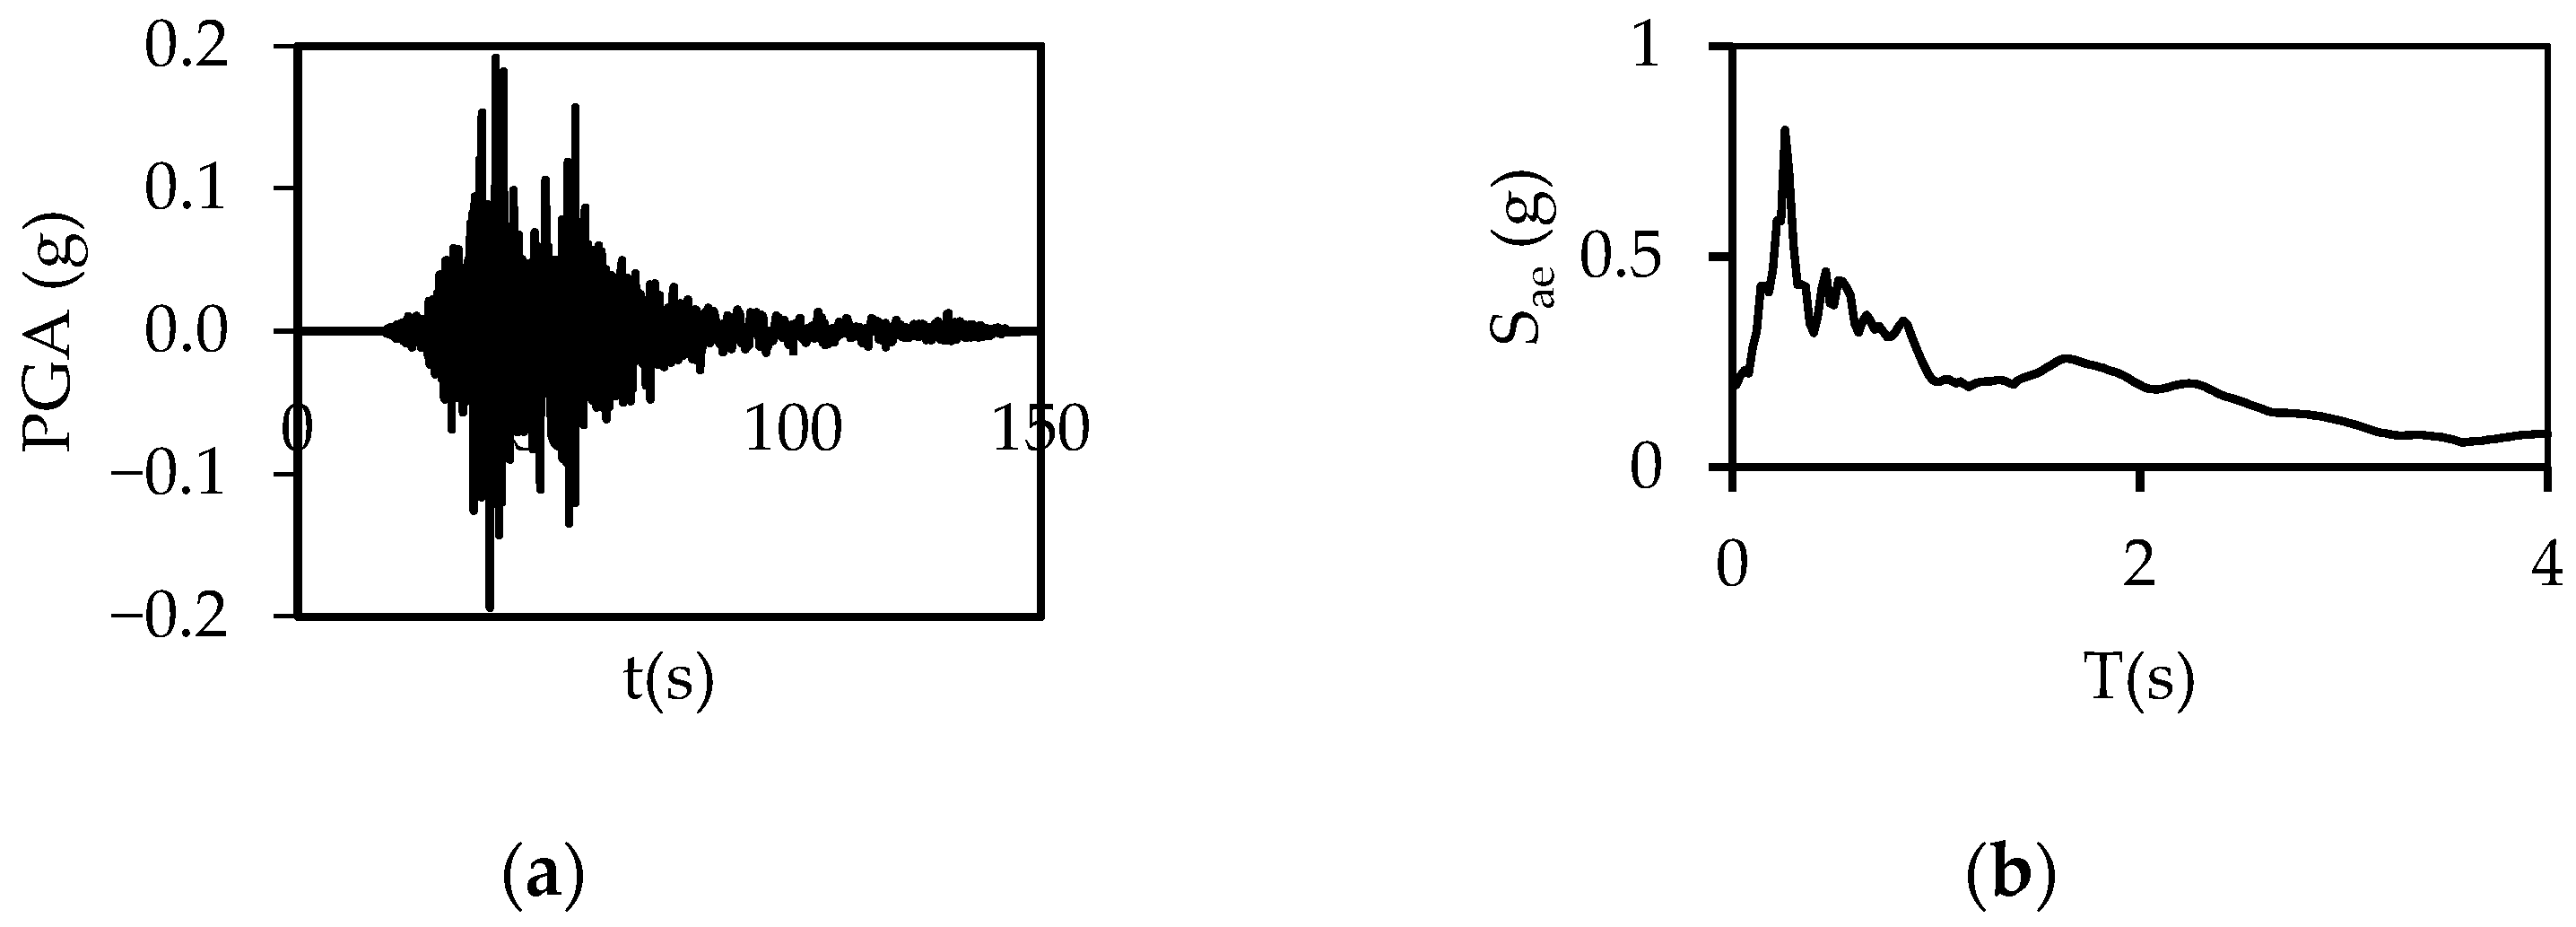
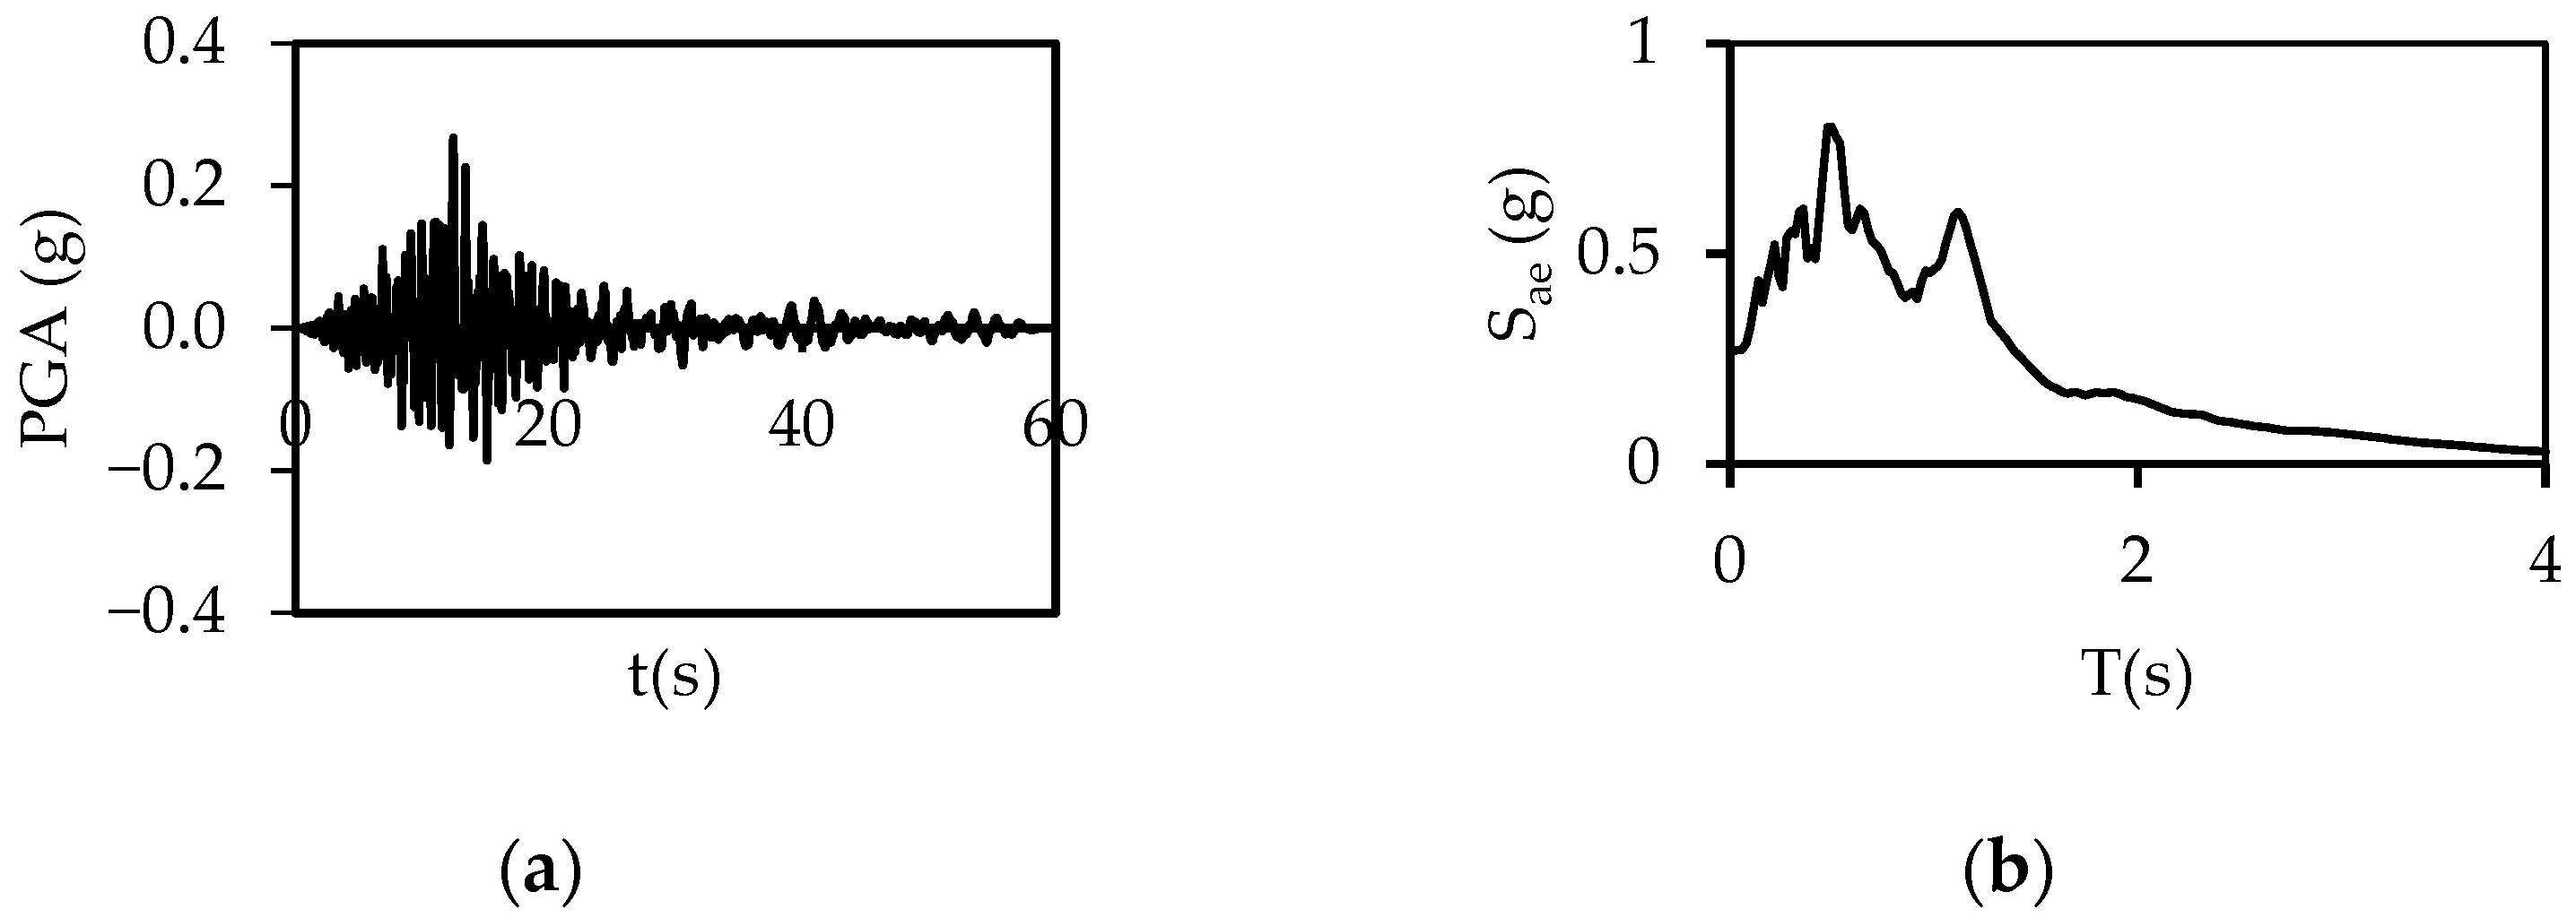
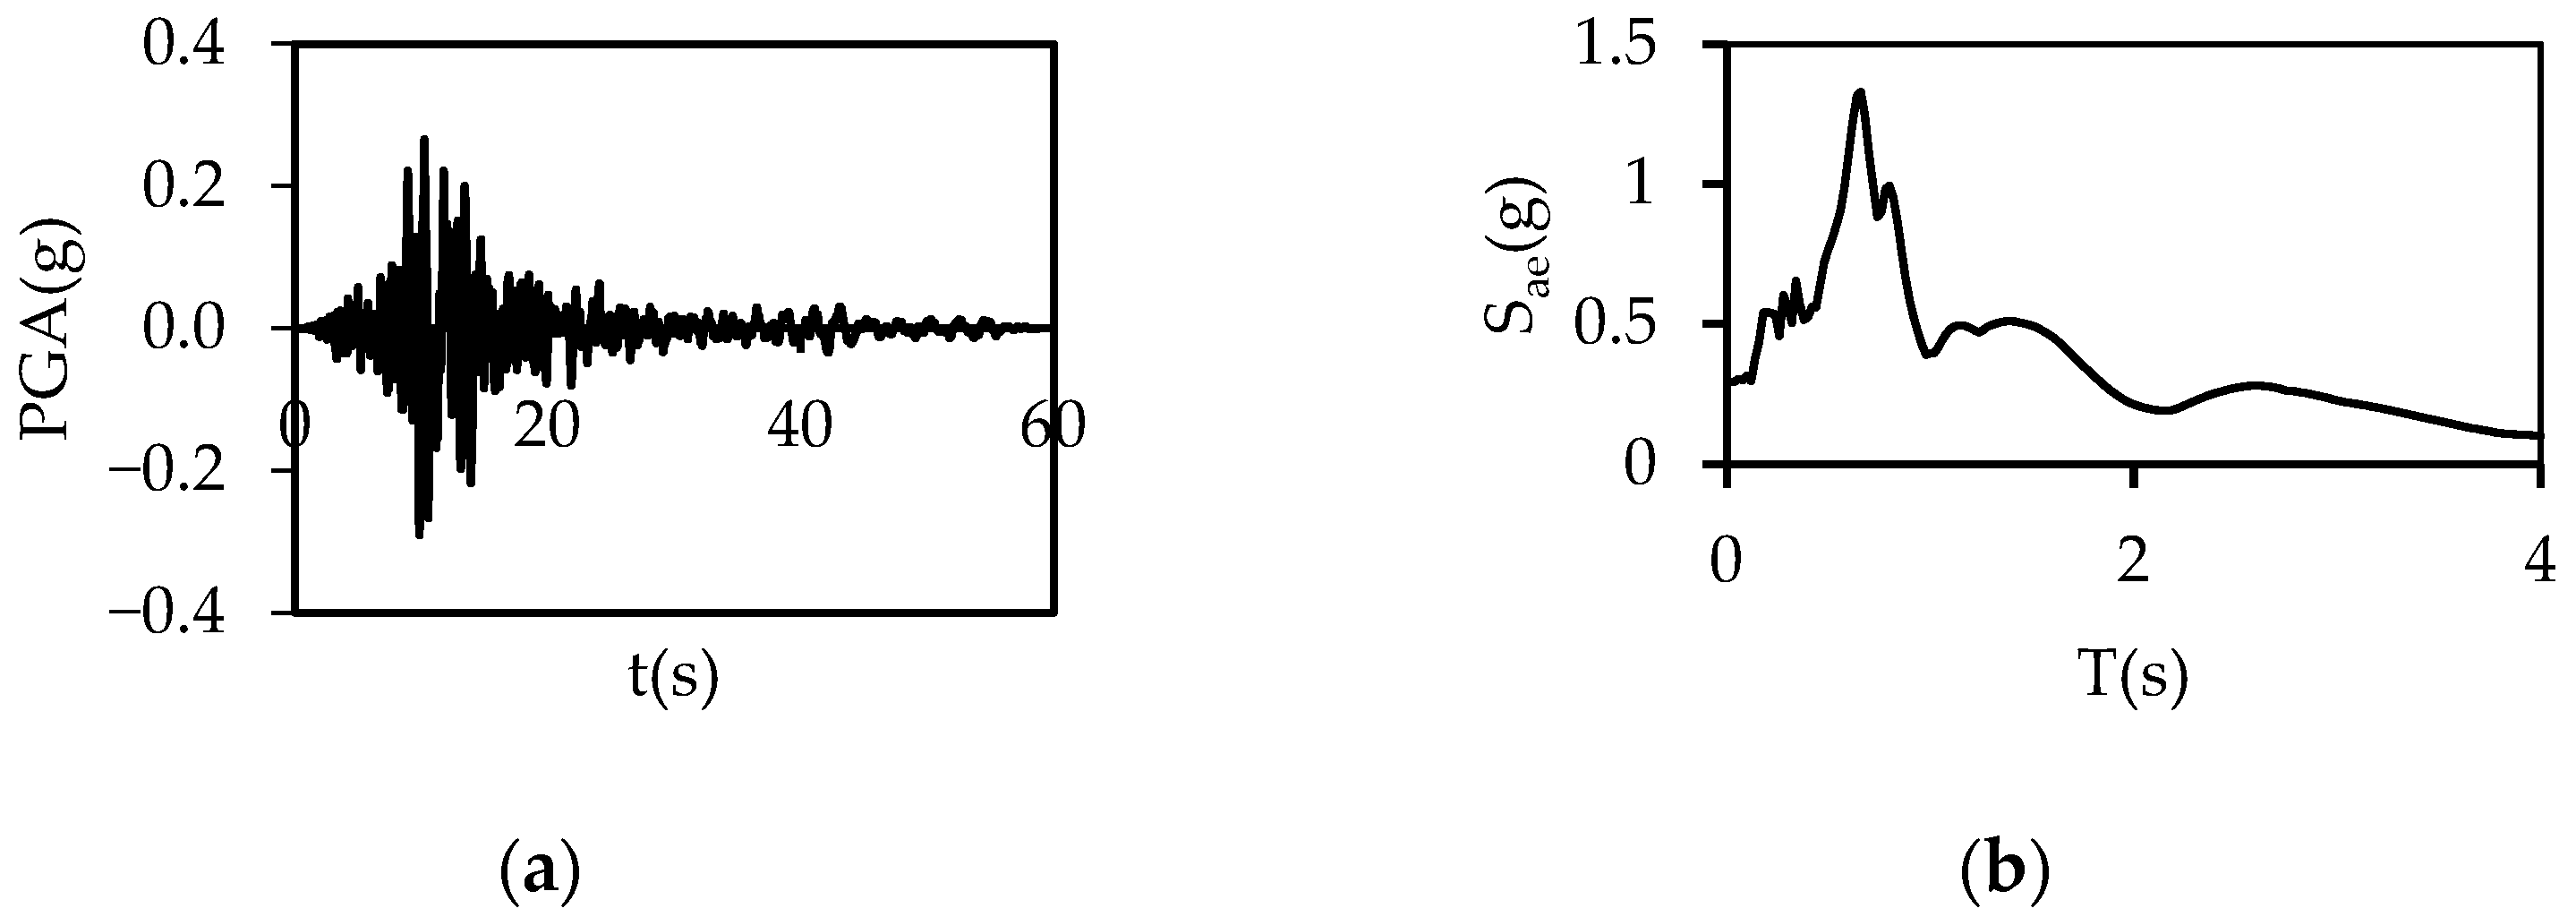
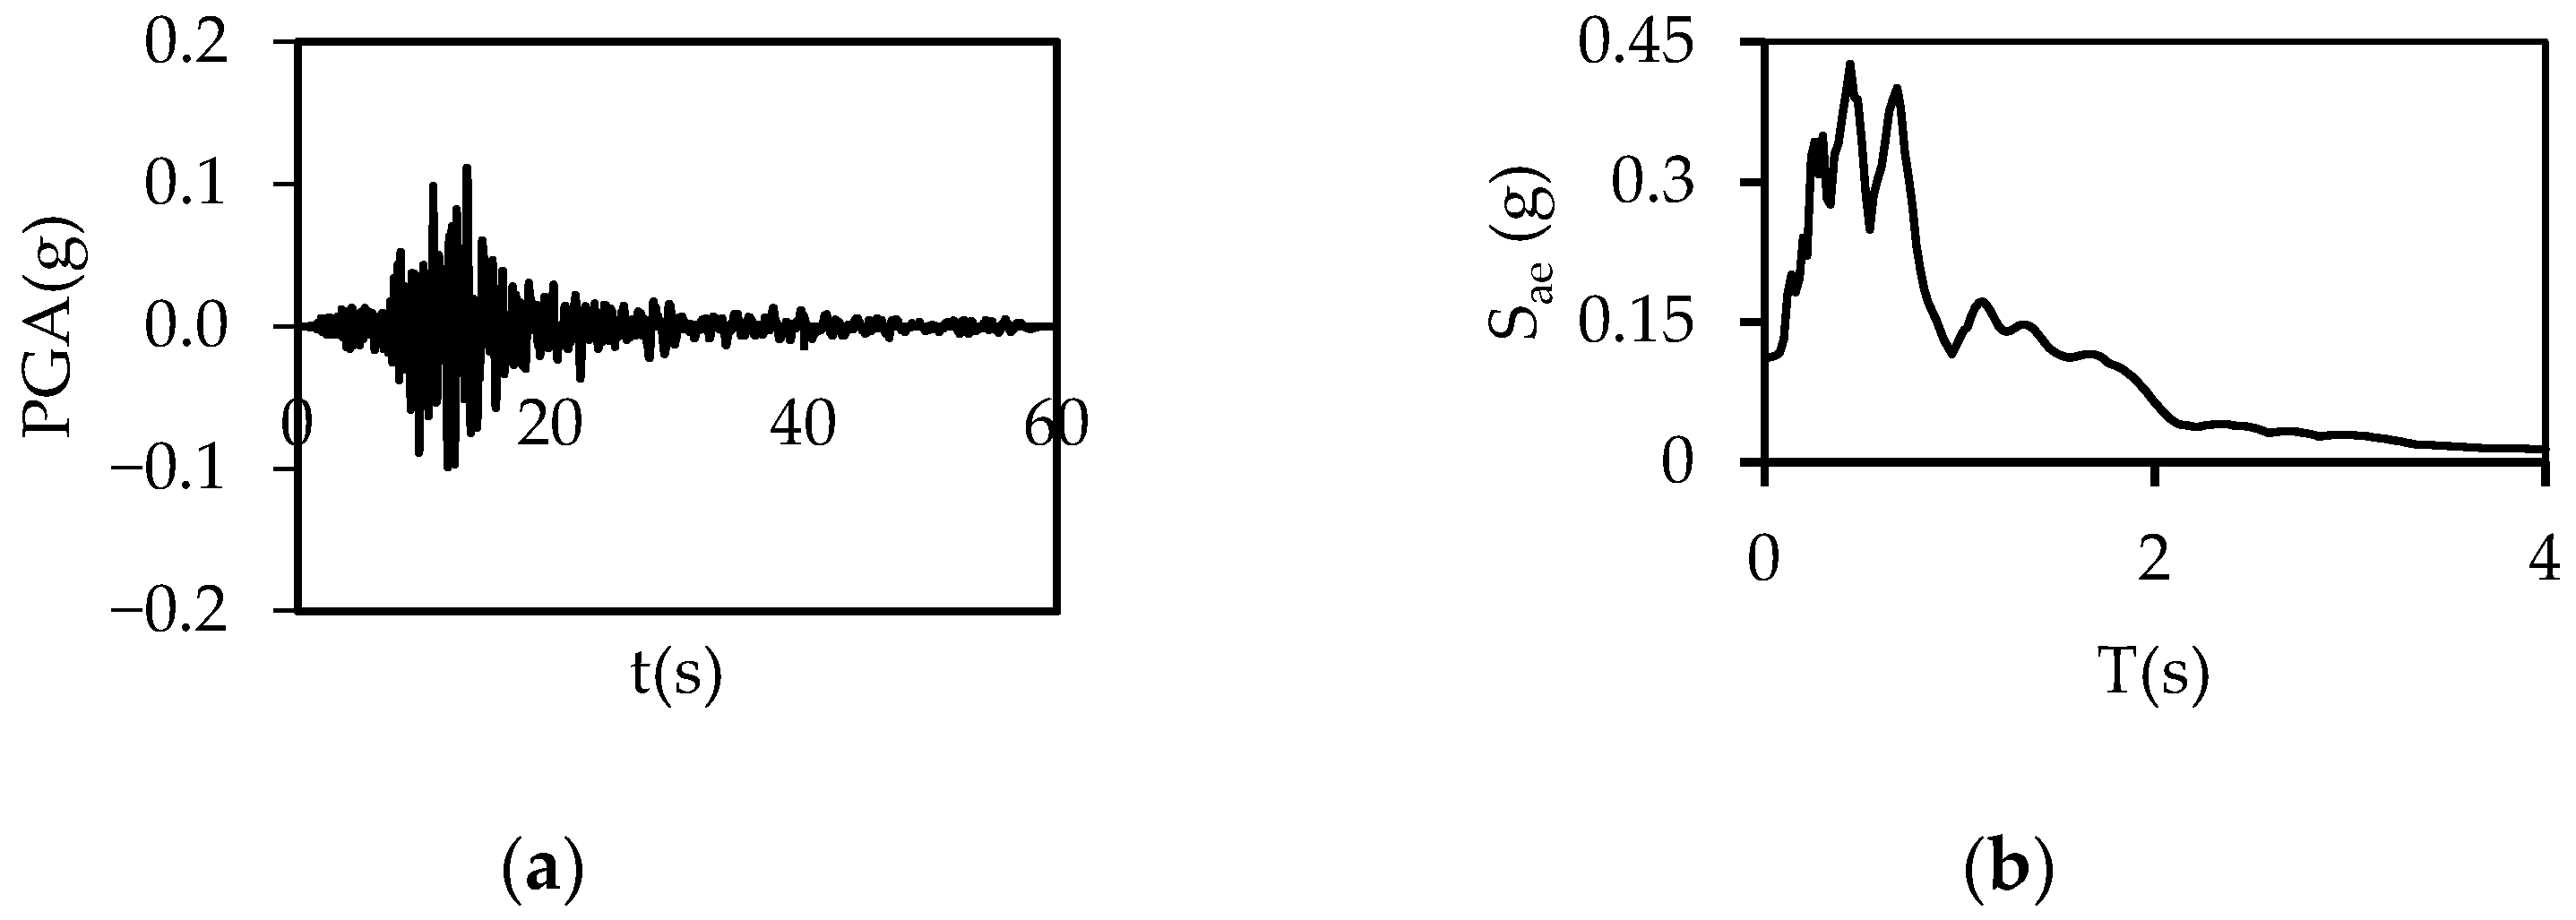
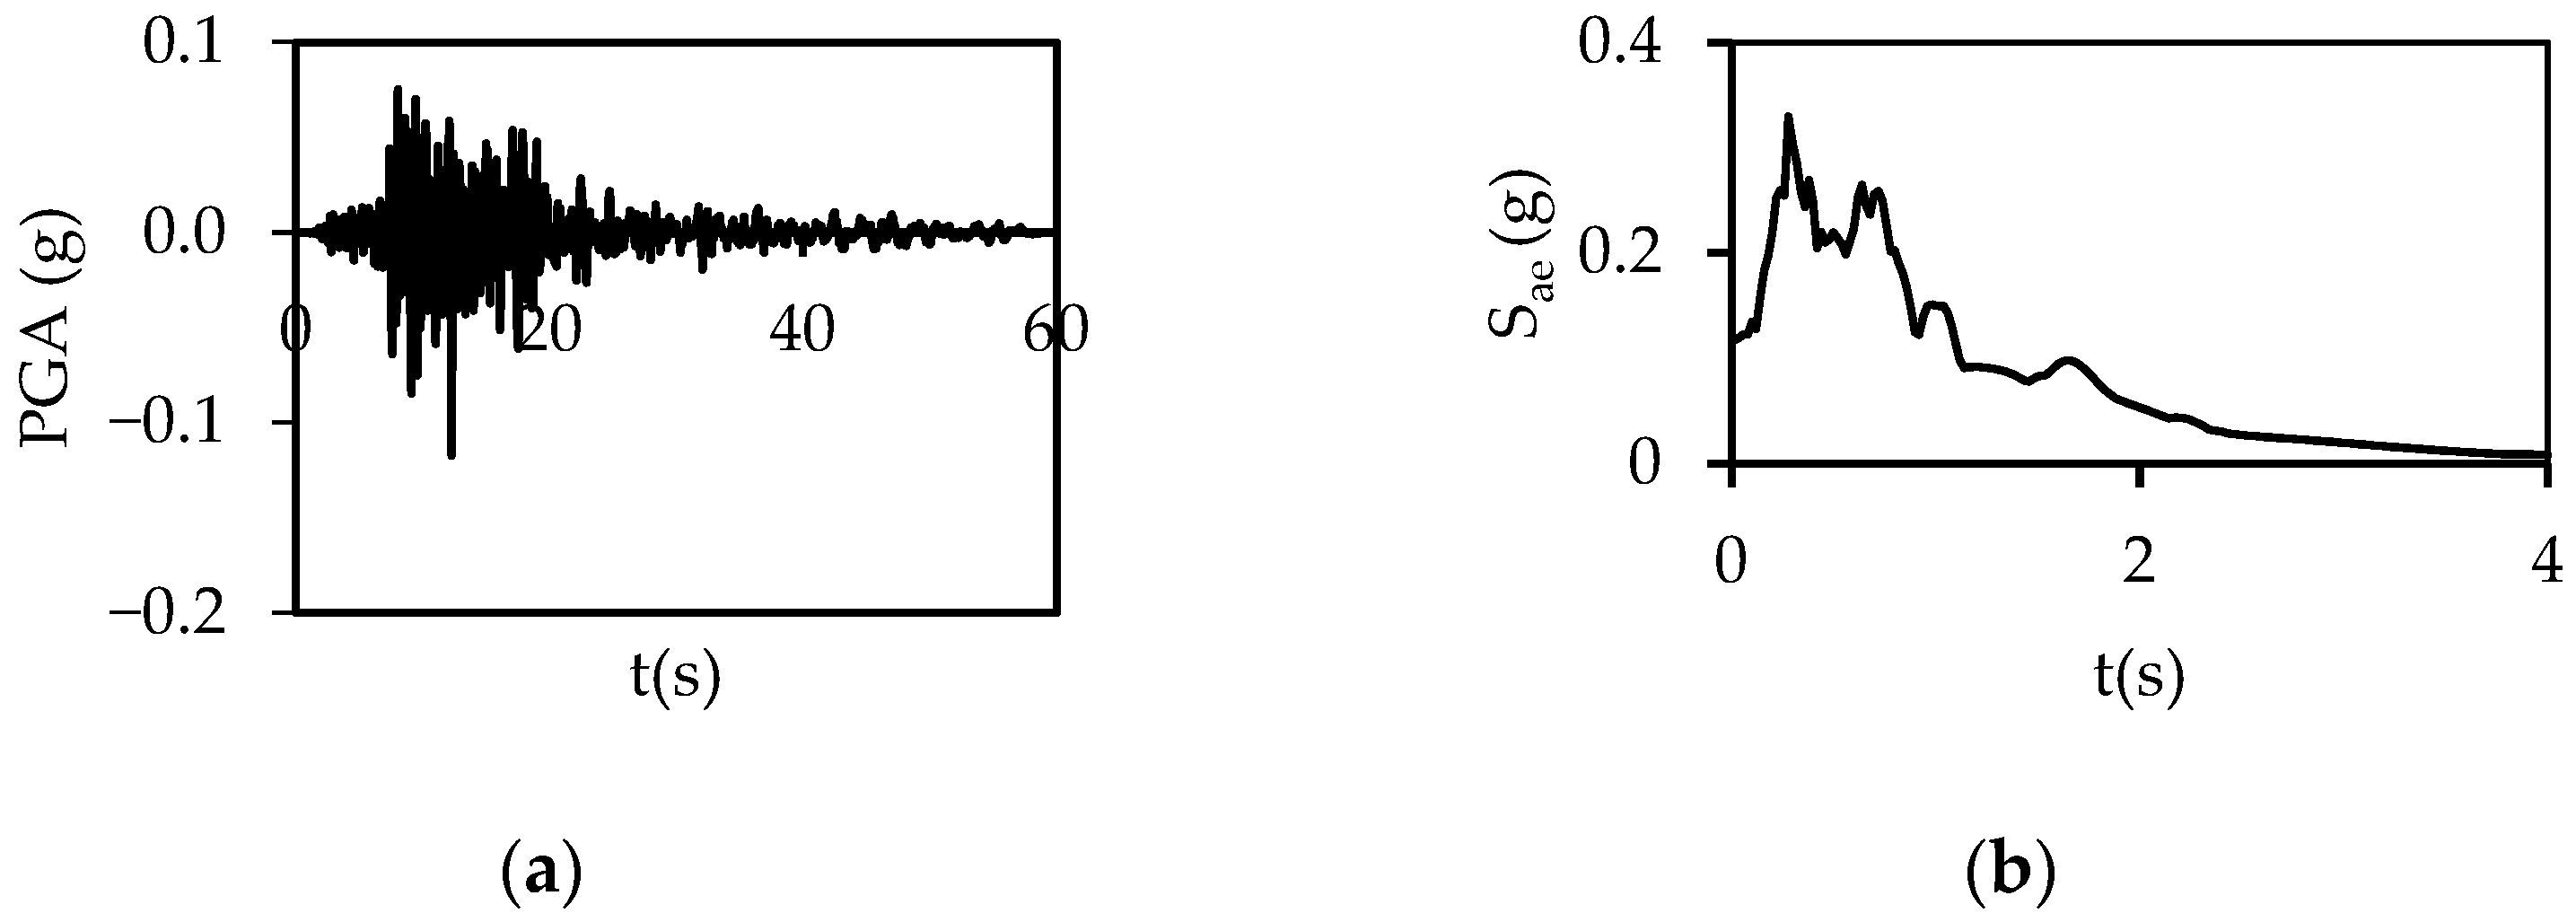
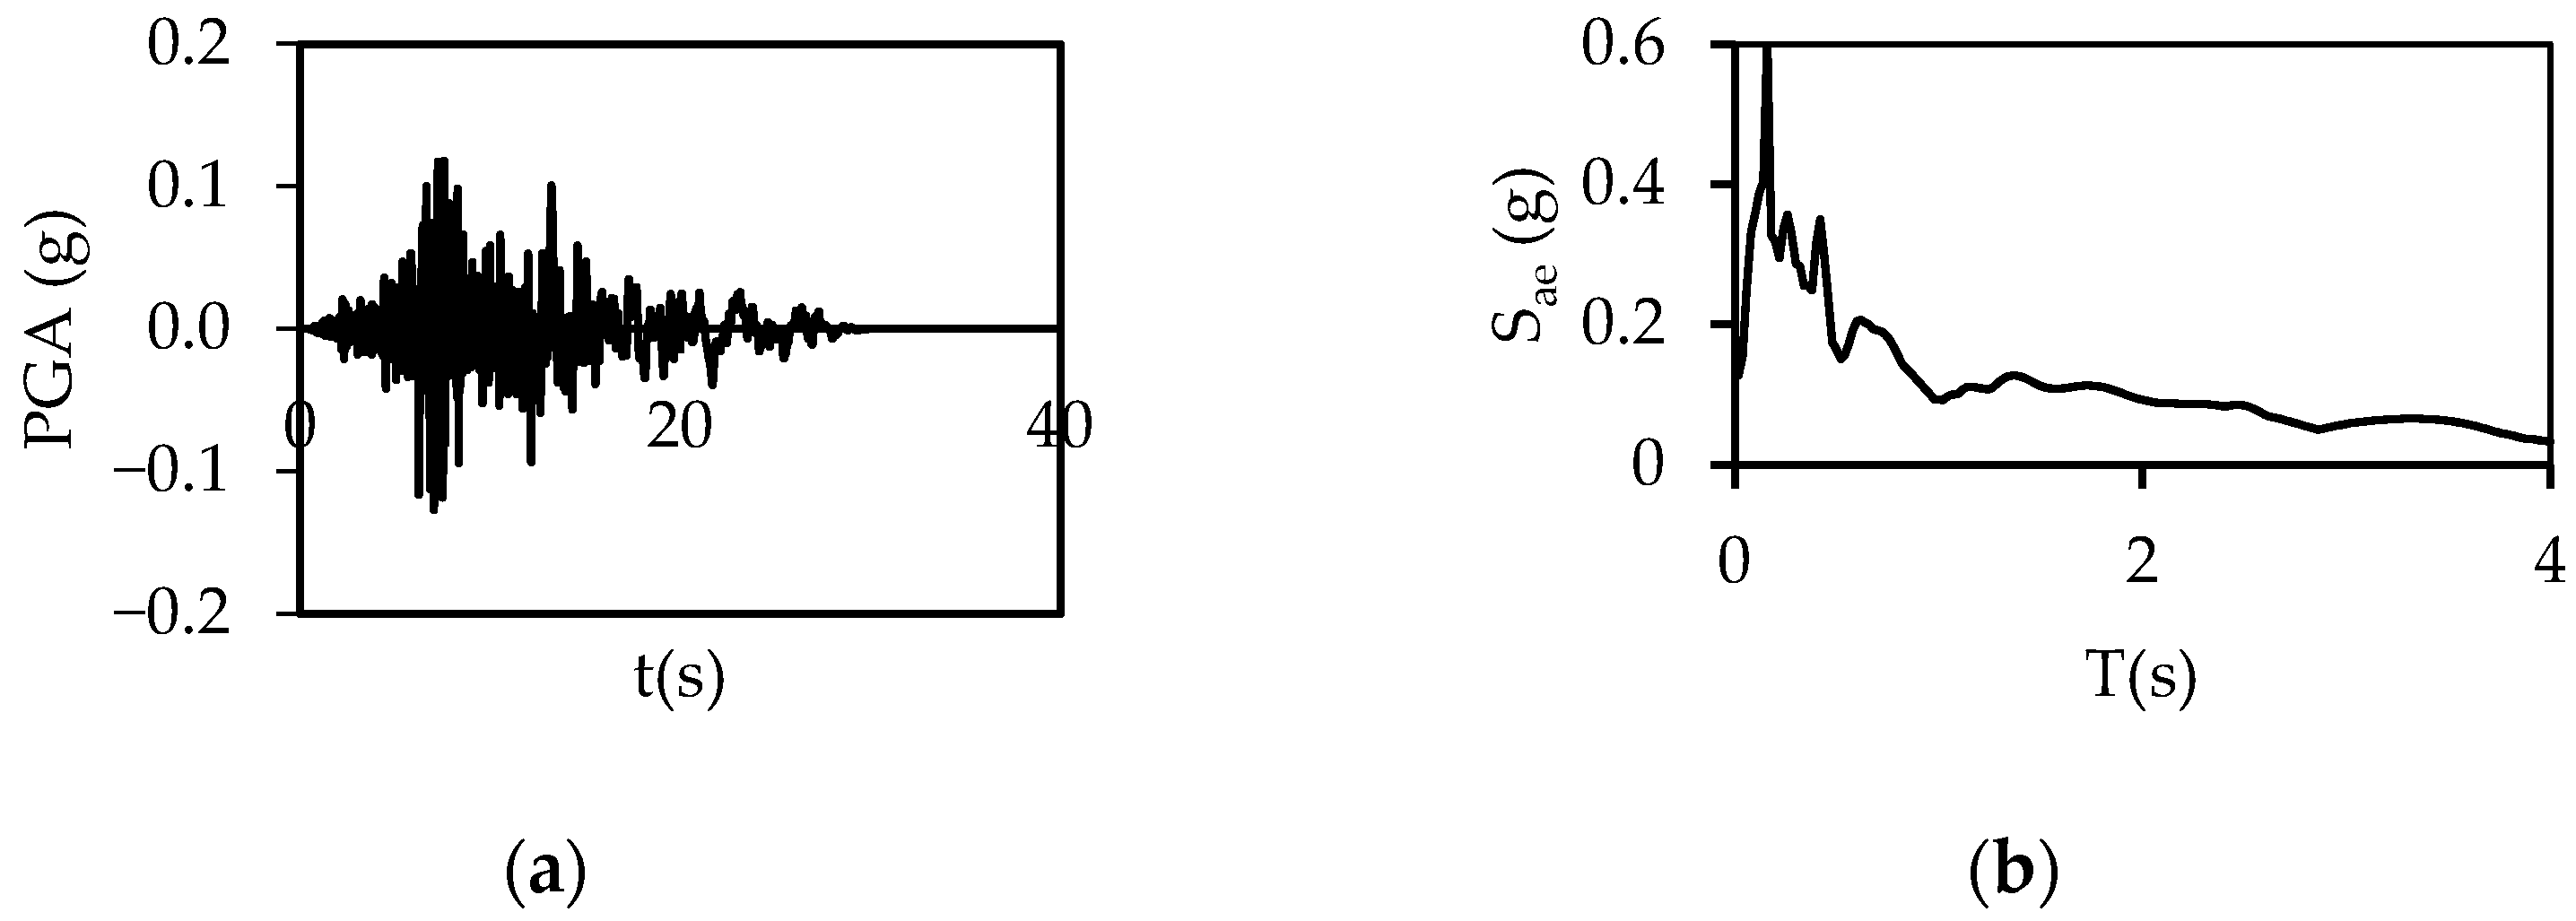
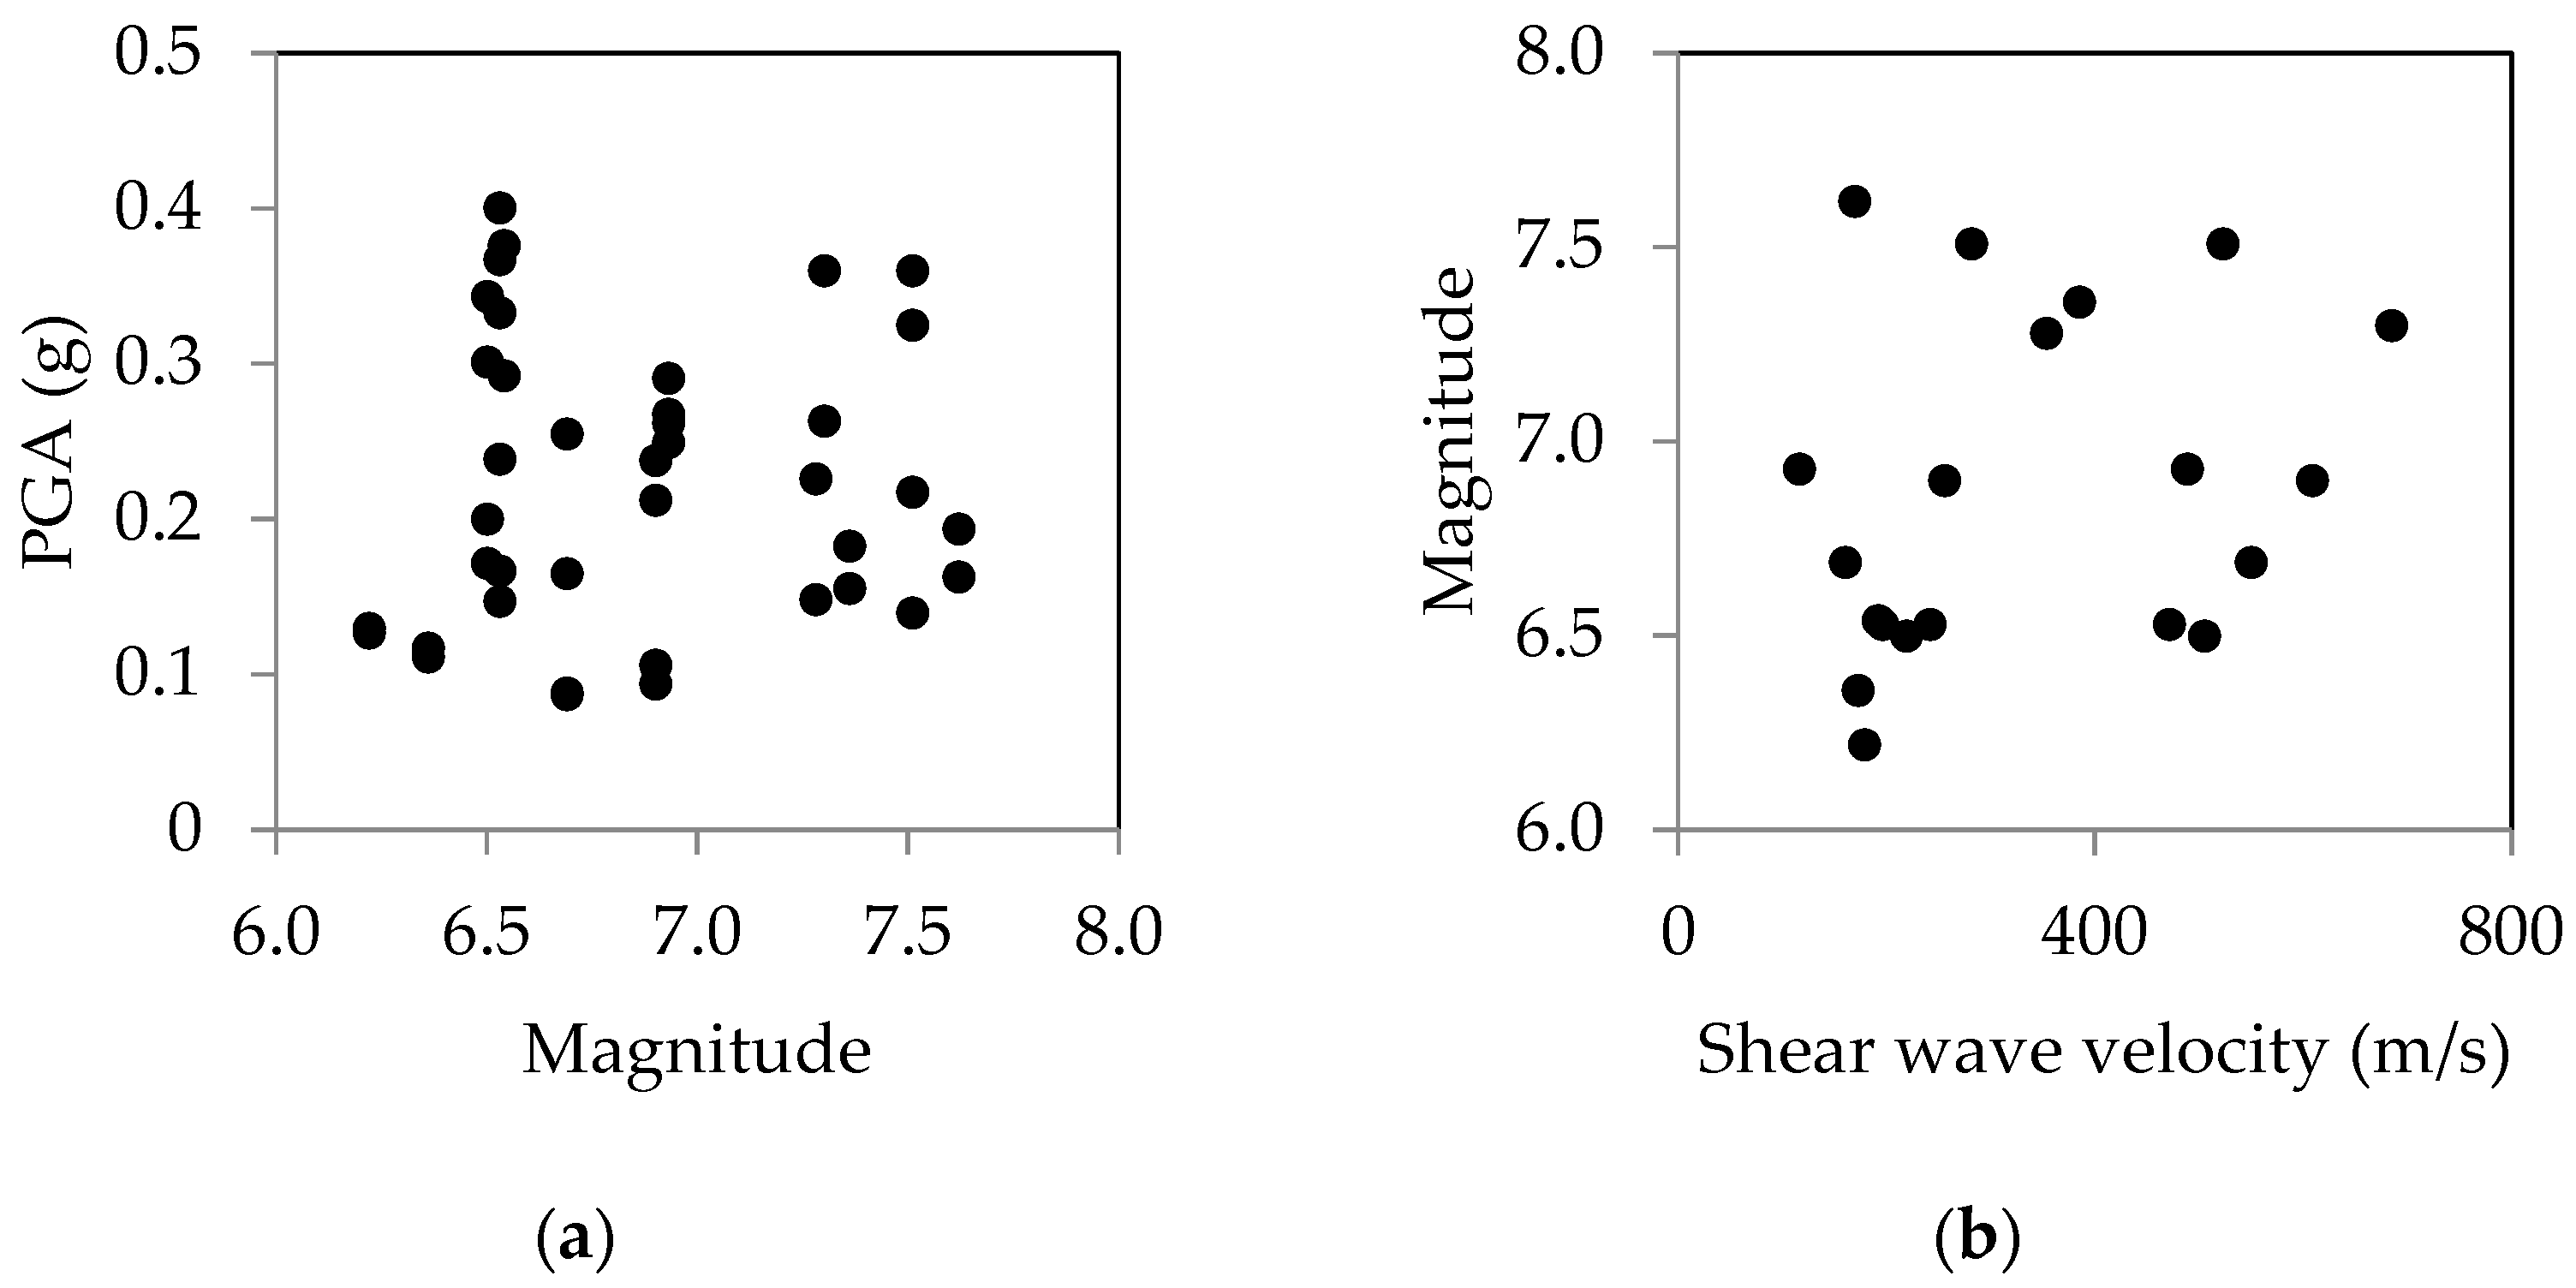
2.2. Ground Motions
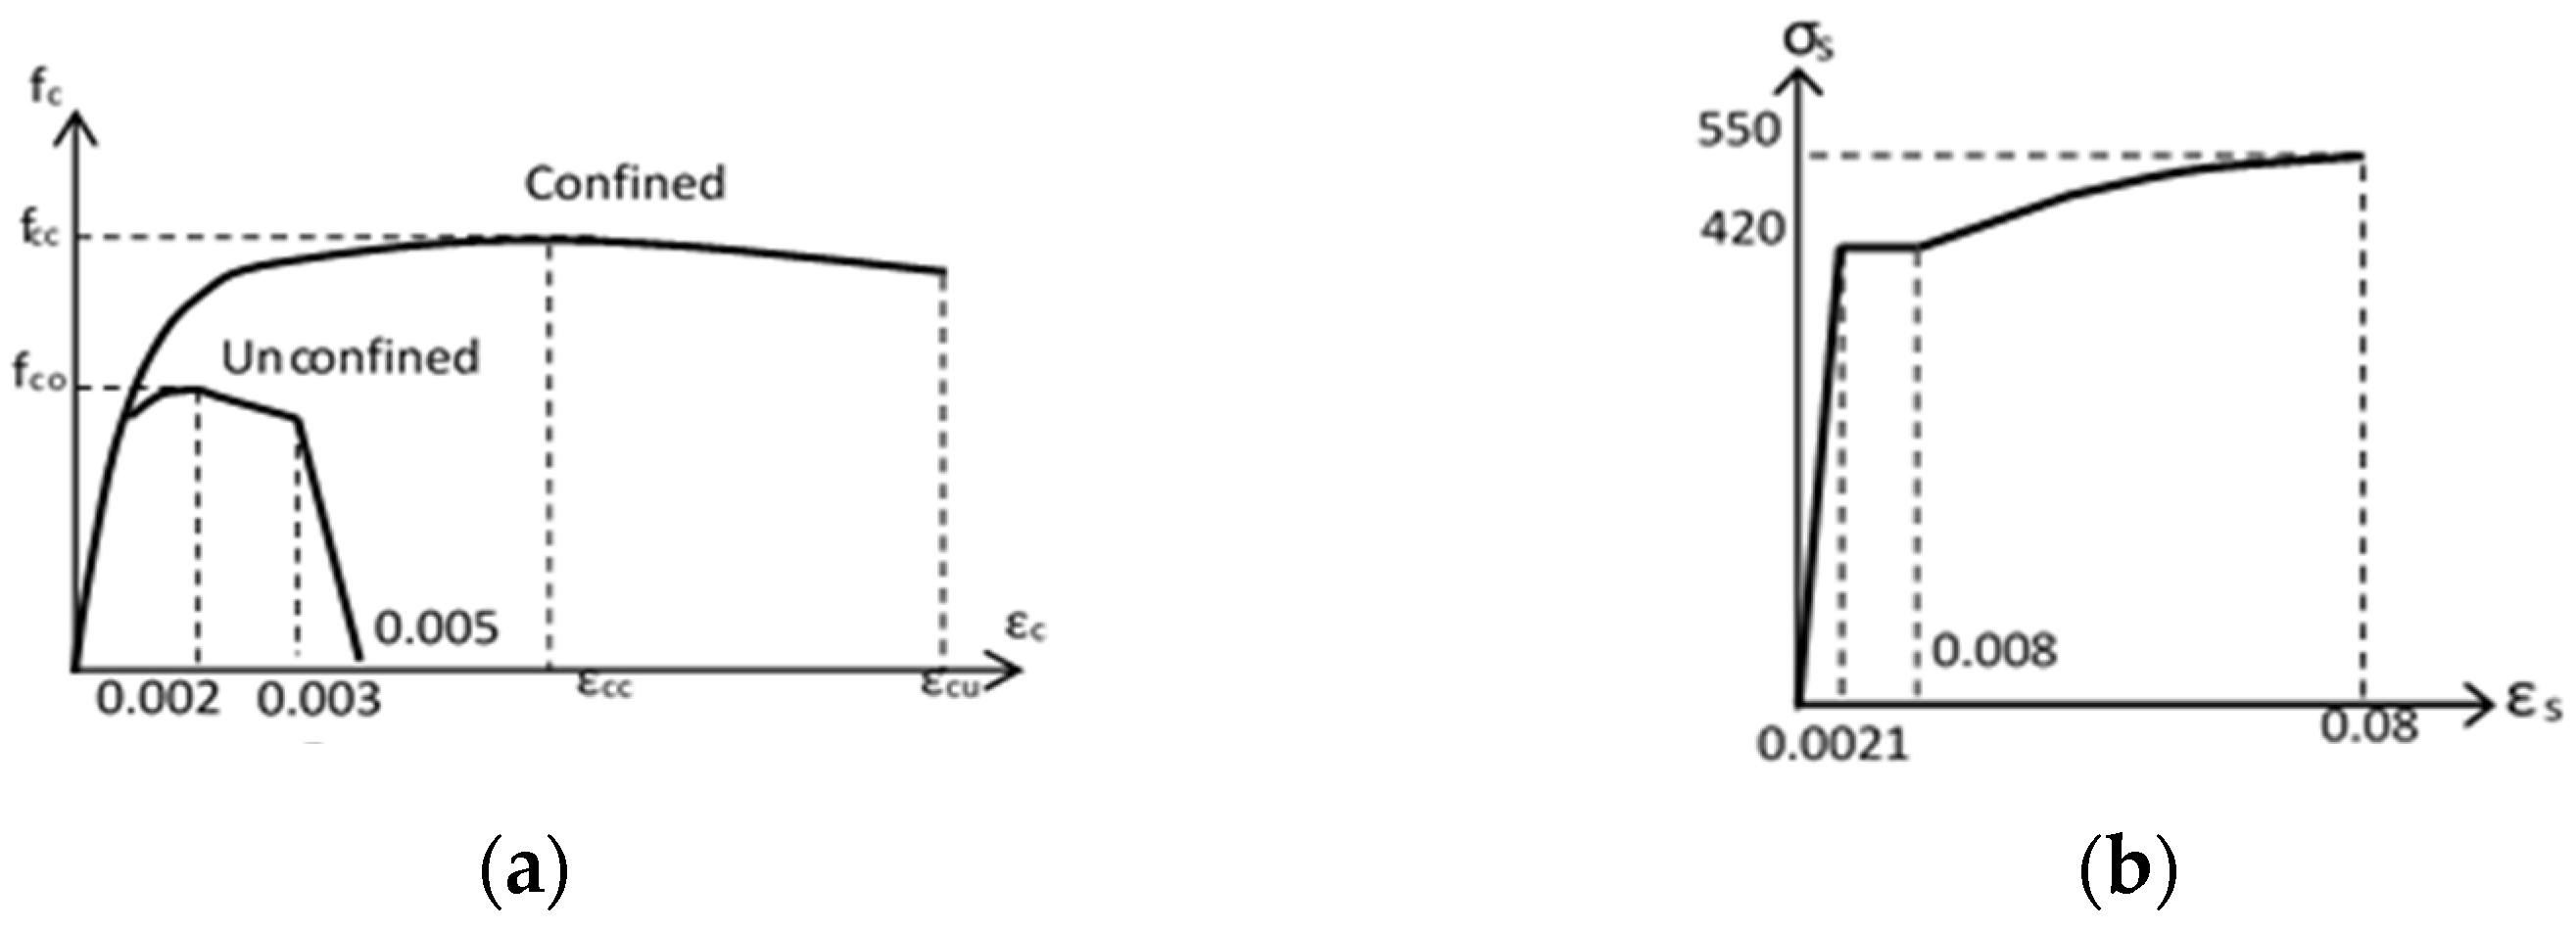
2.3. Damage Levels
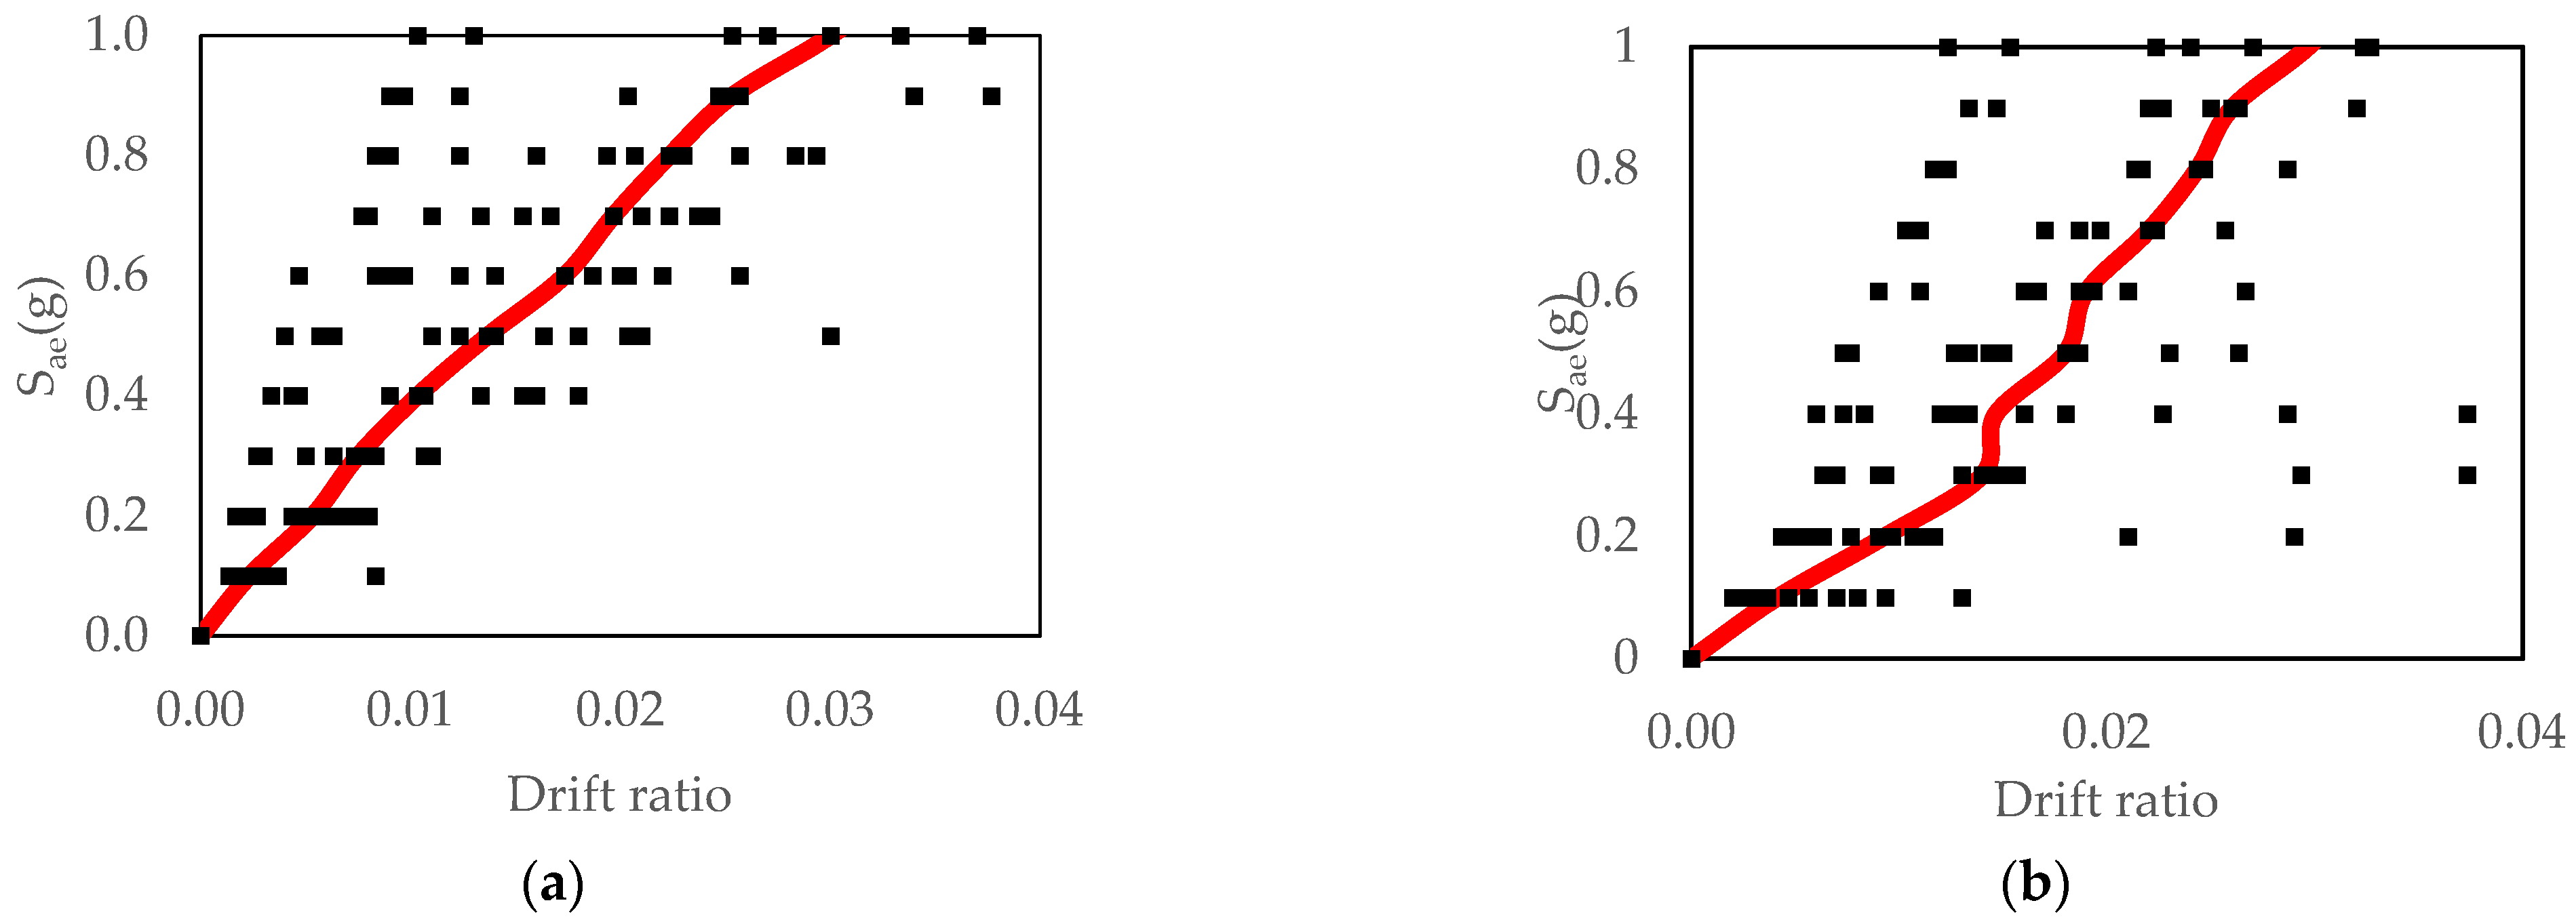
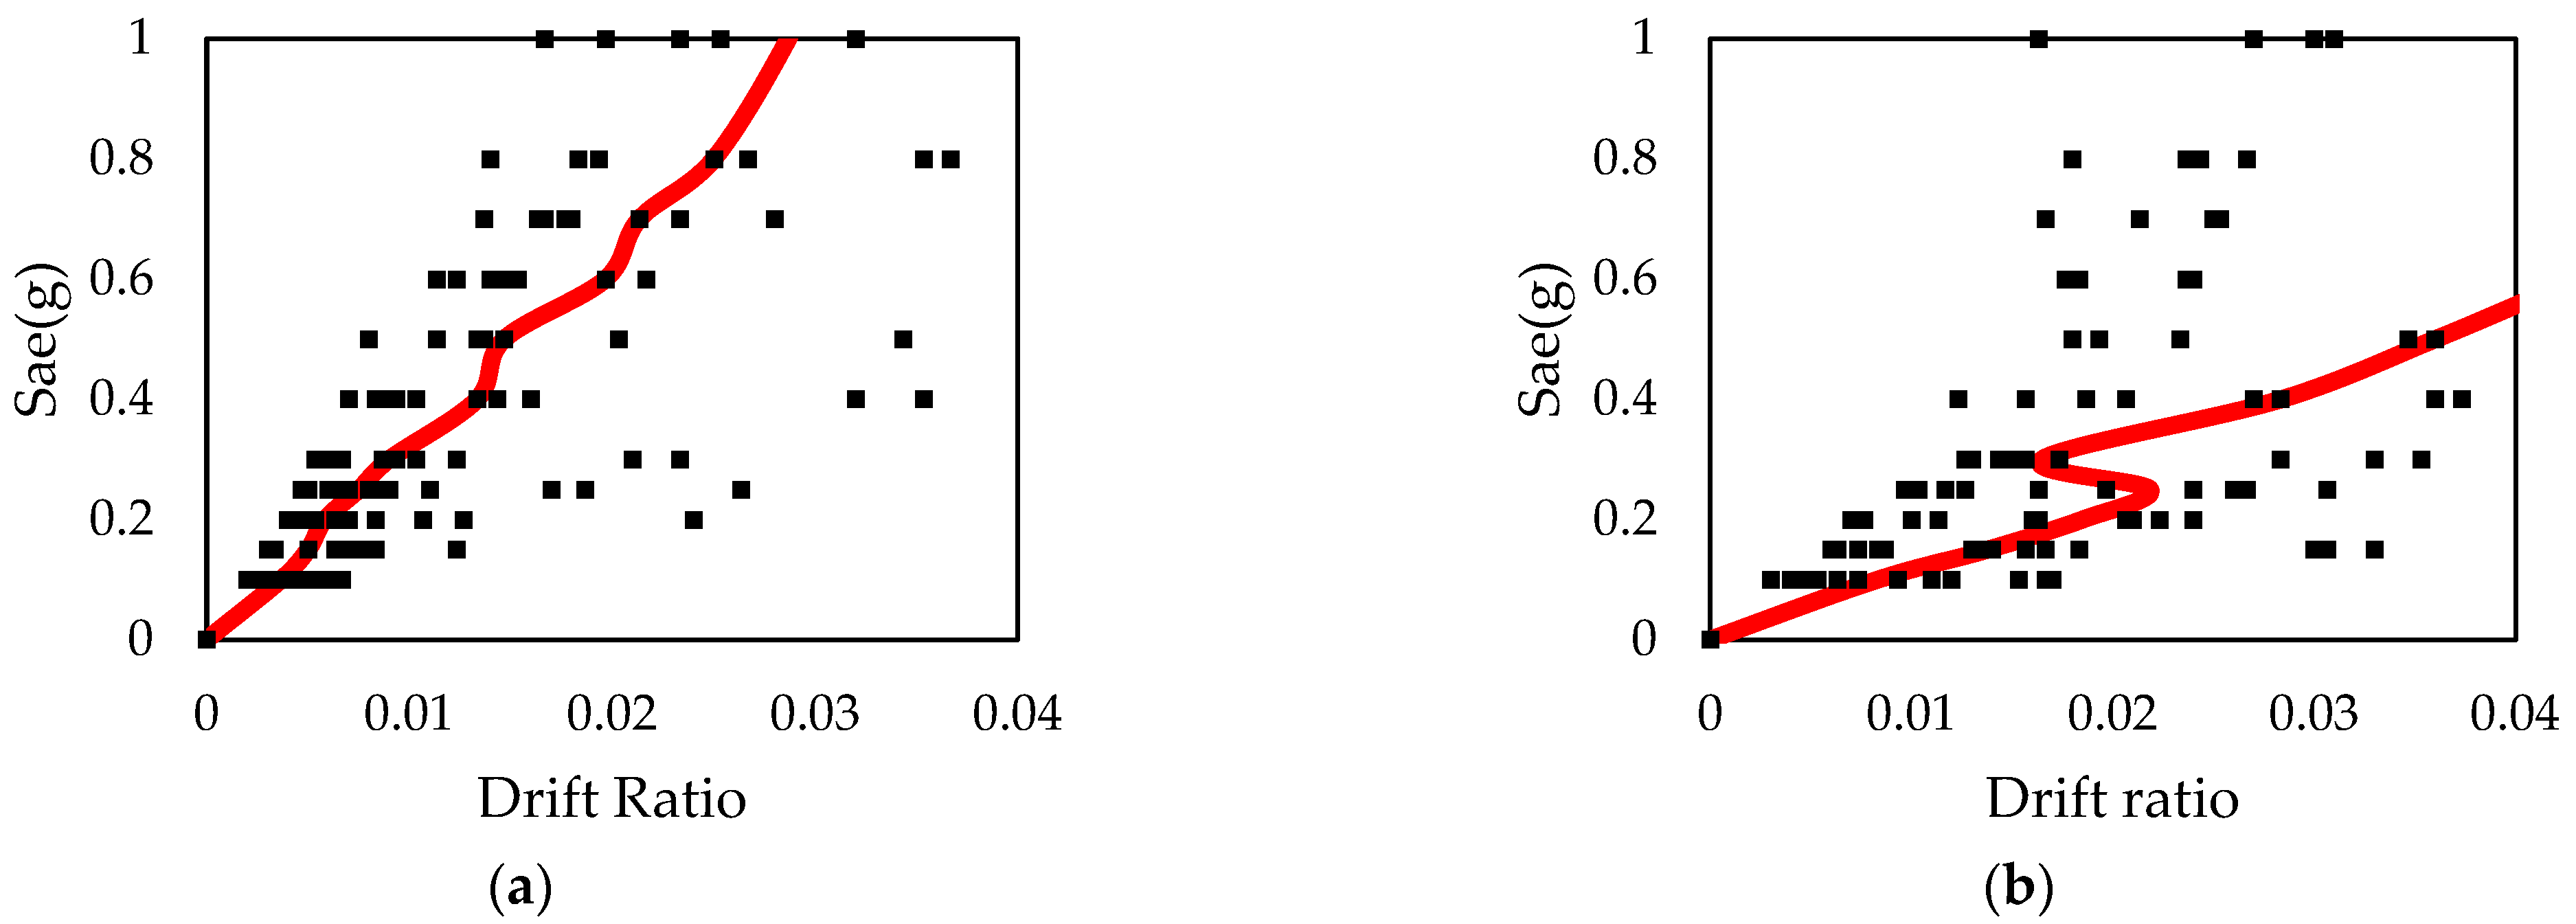
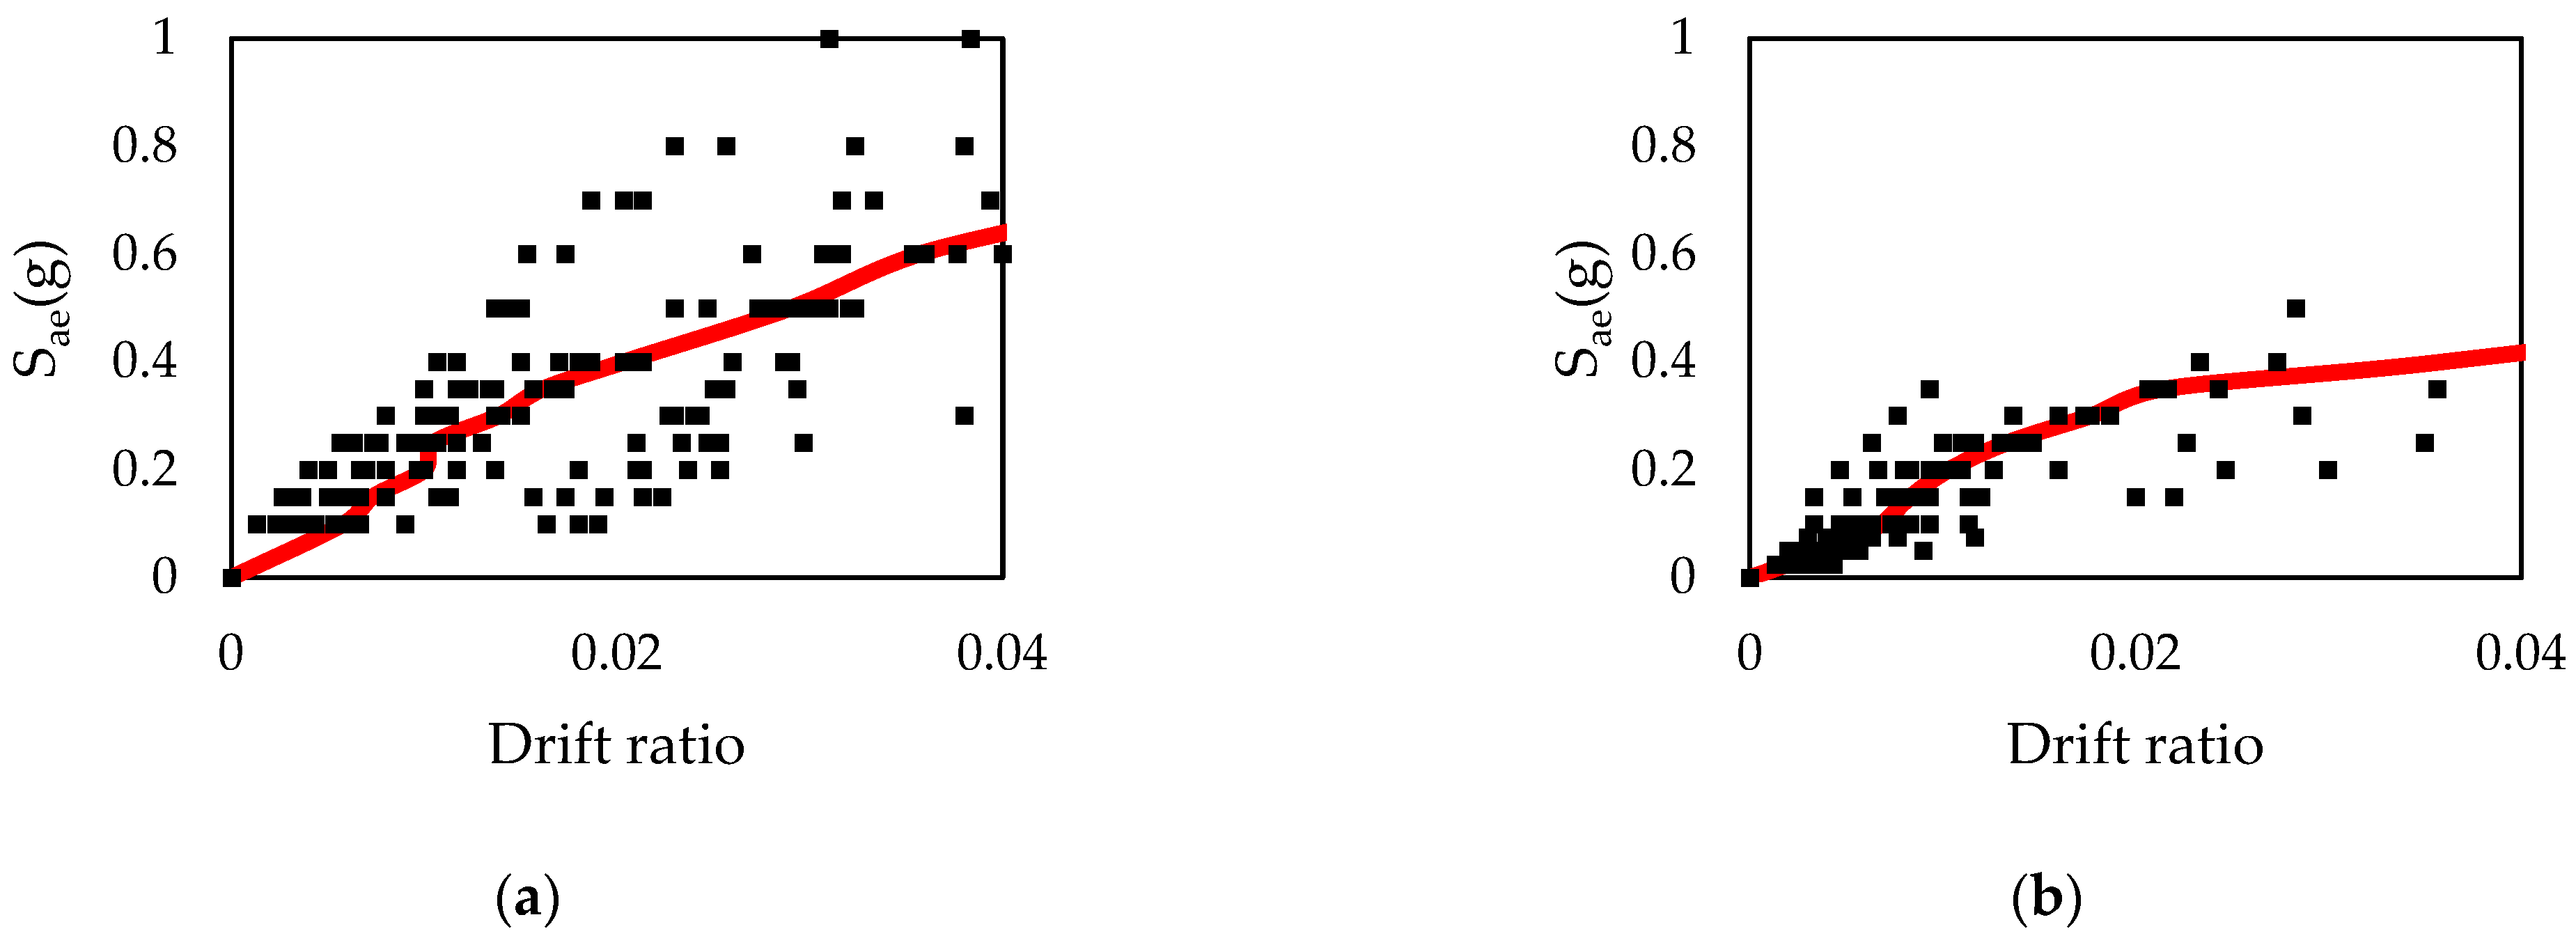
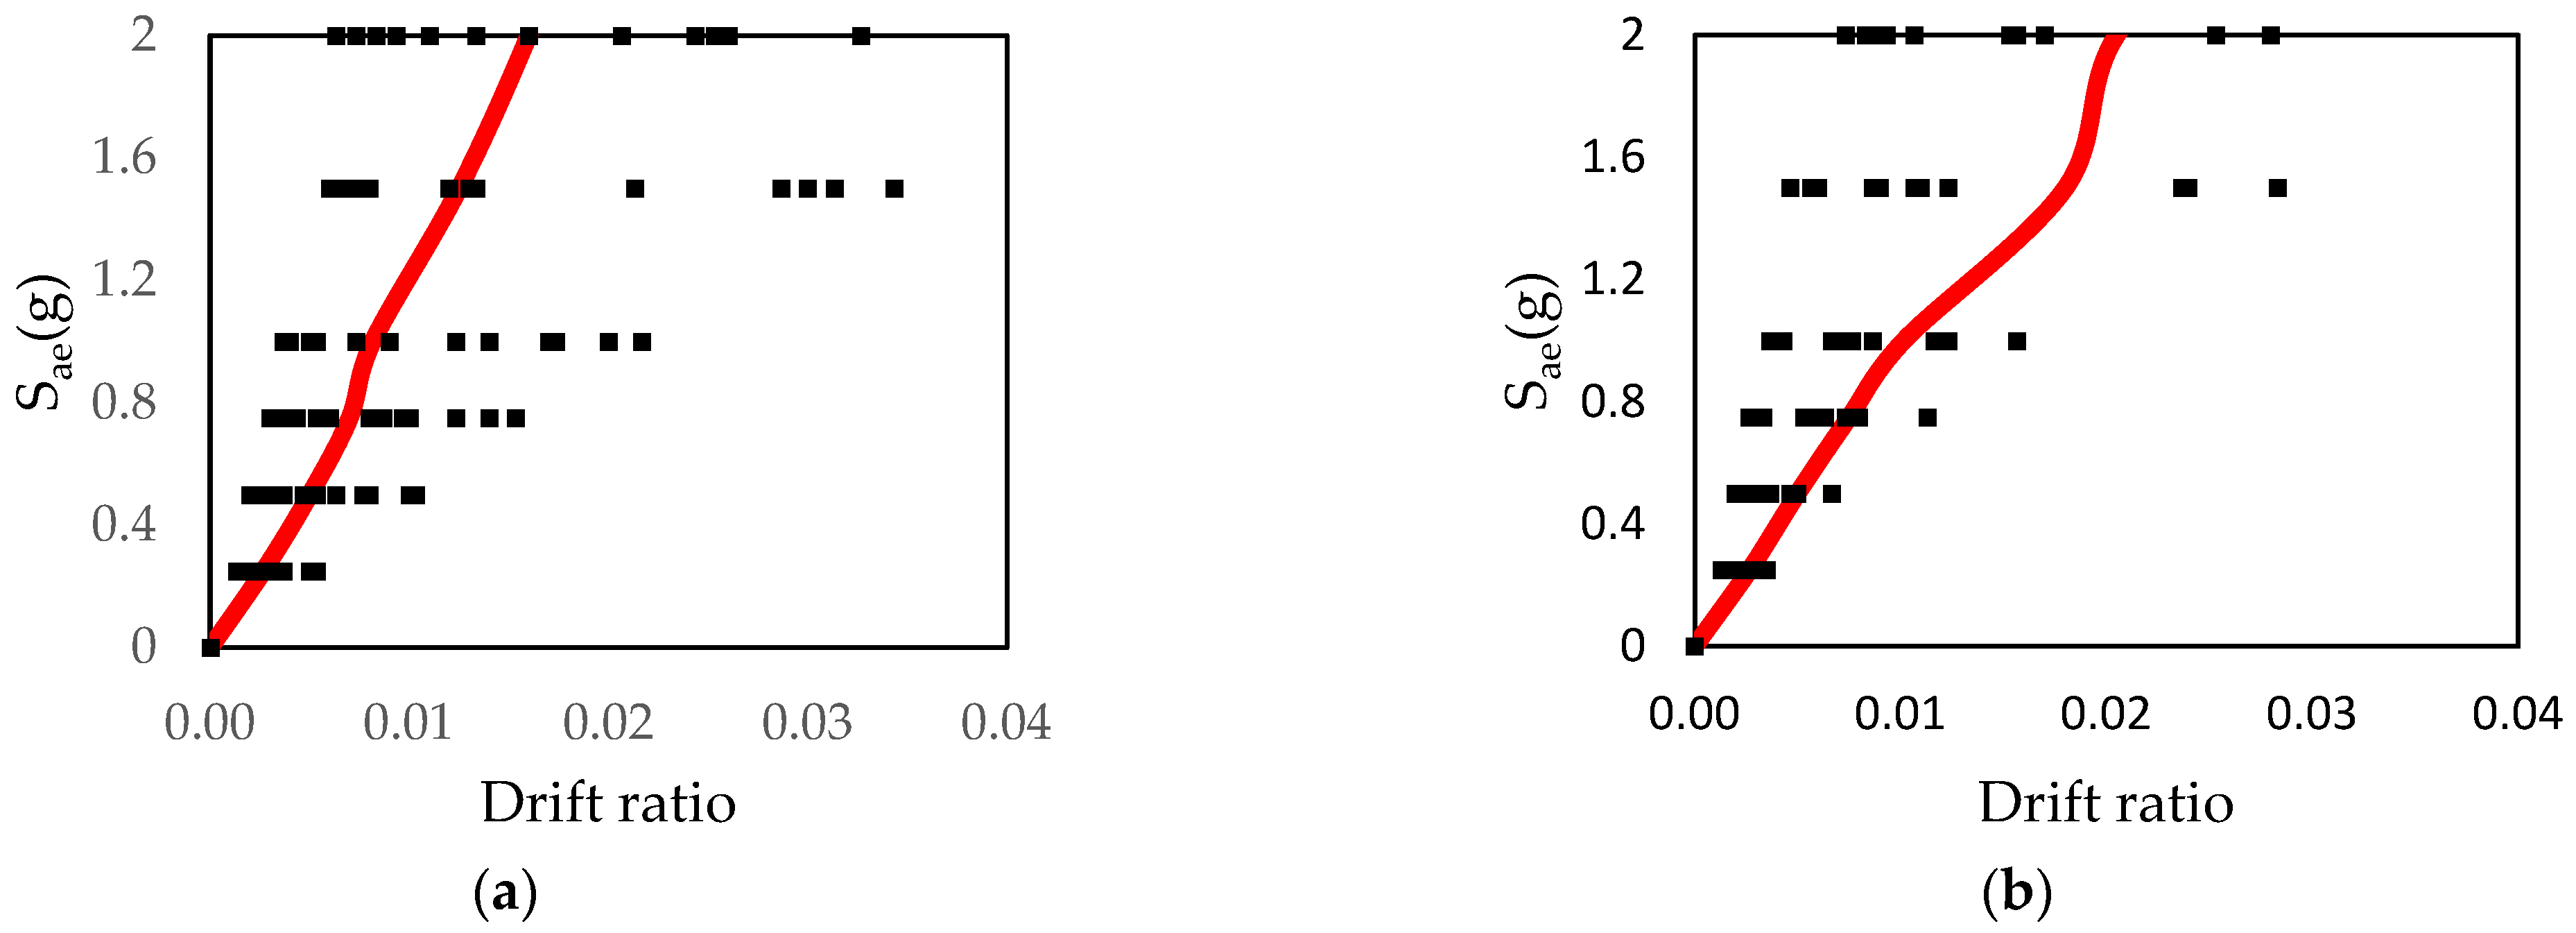
2.4. Incremental Dynamic Analysis
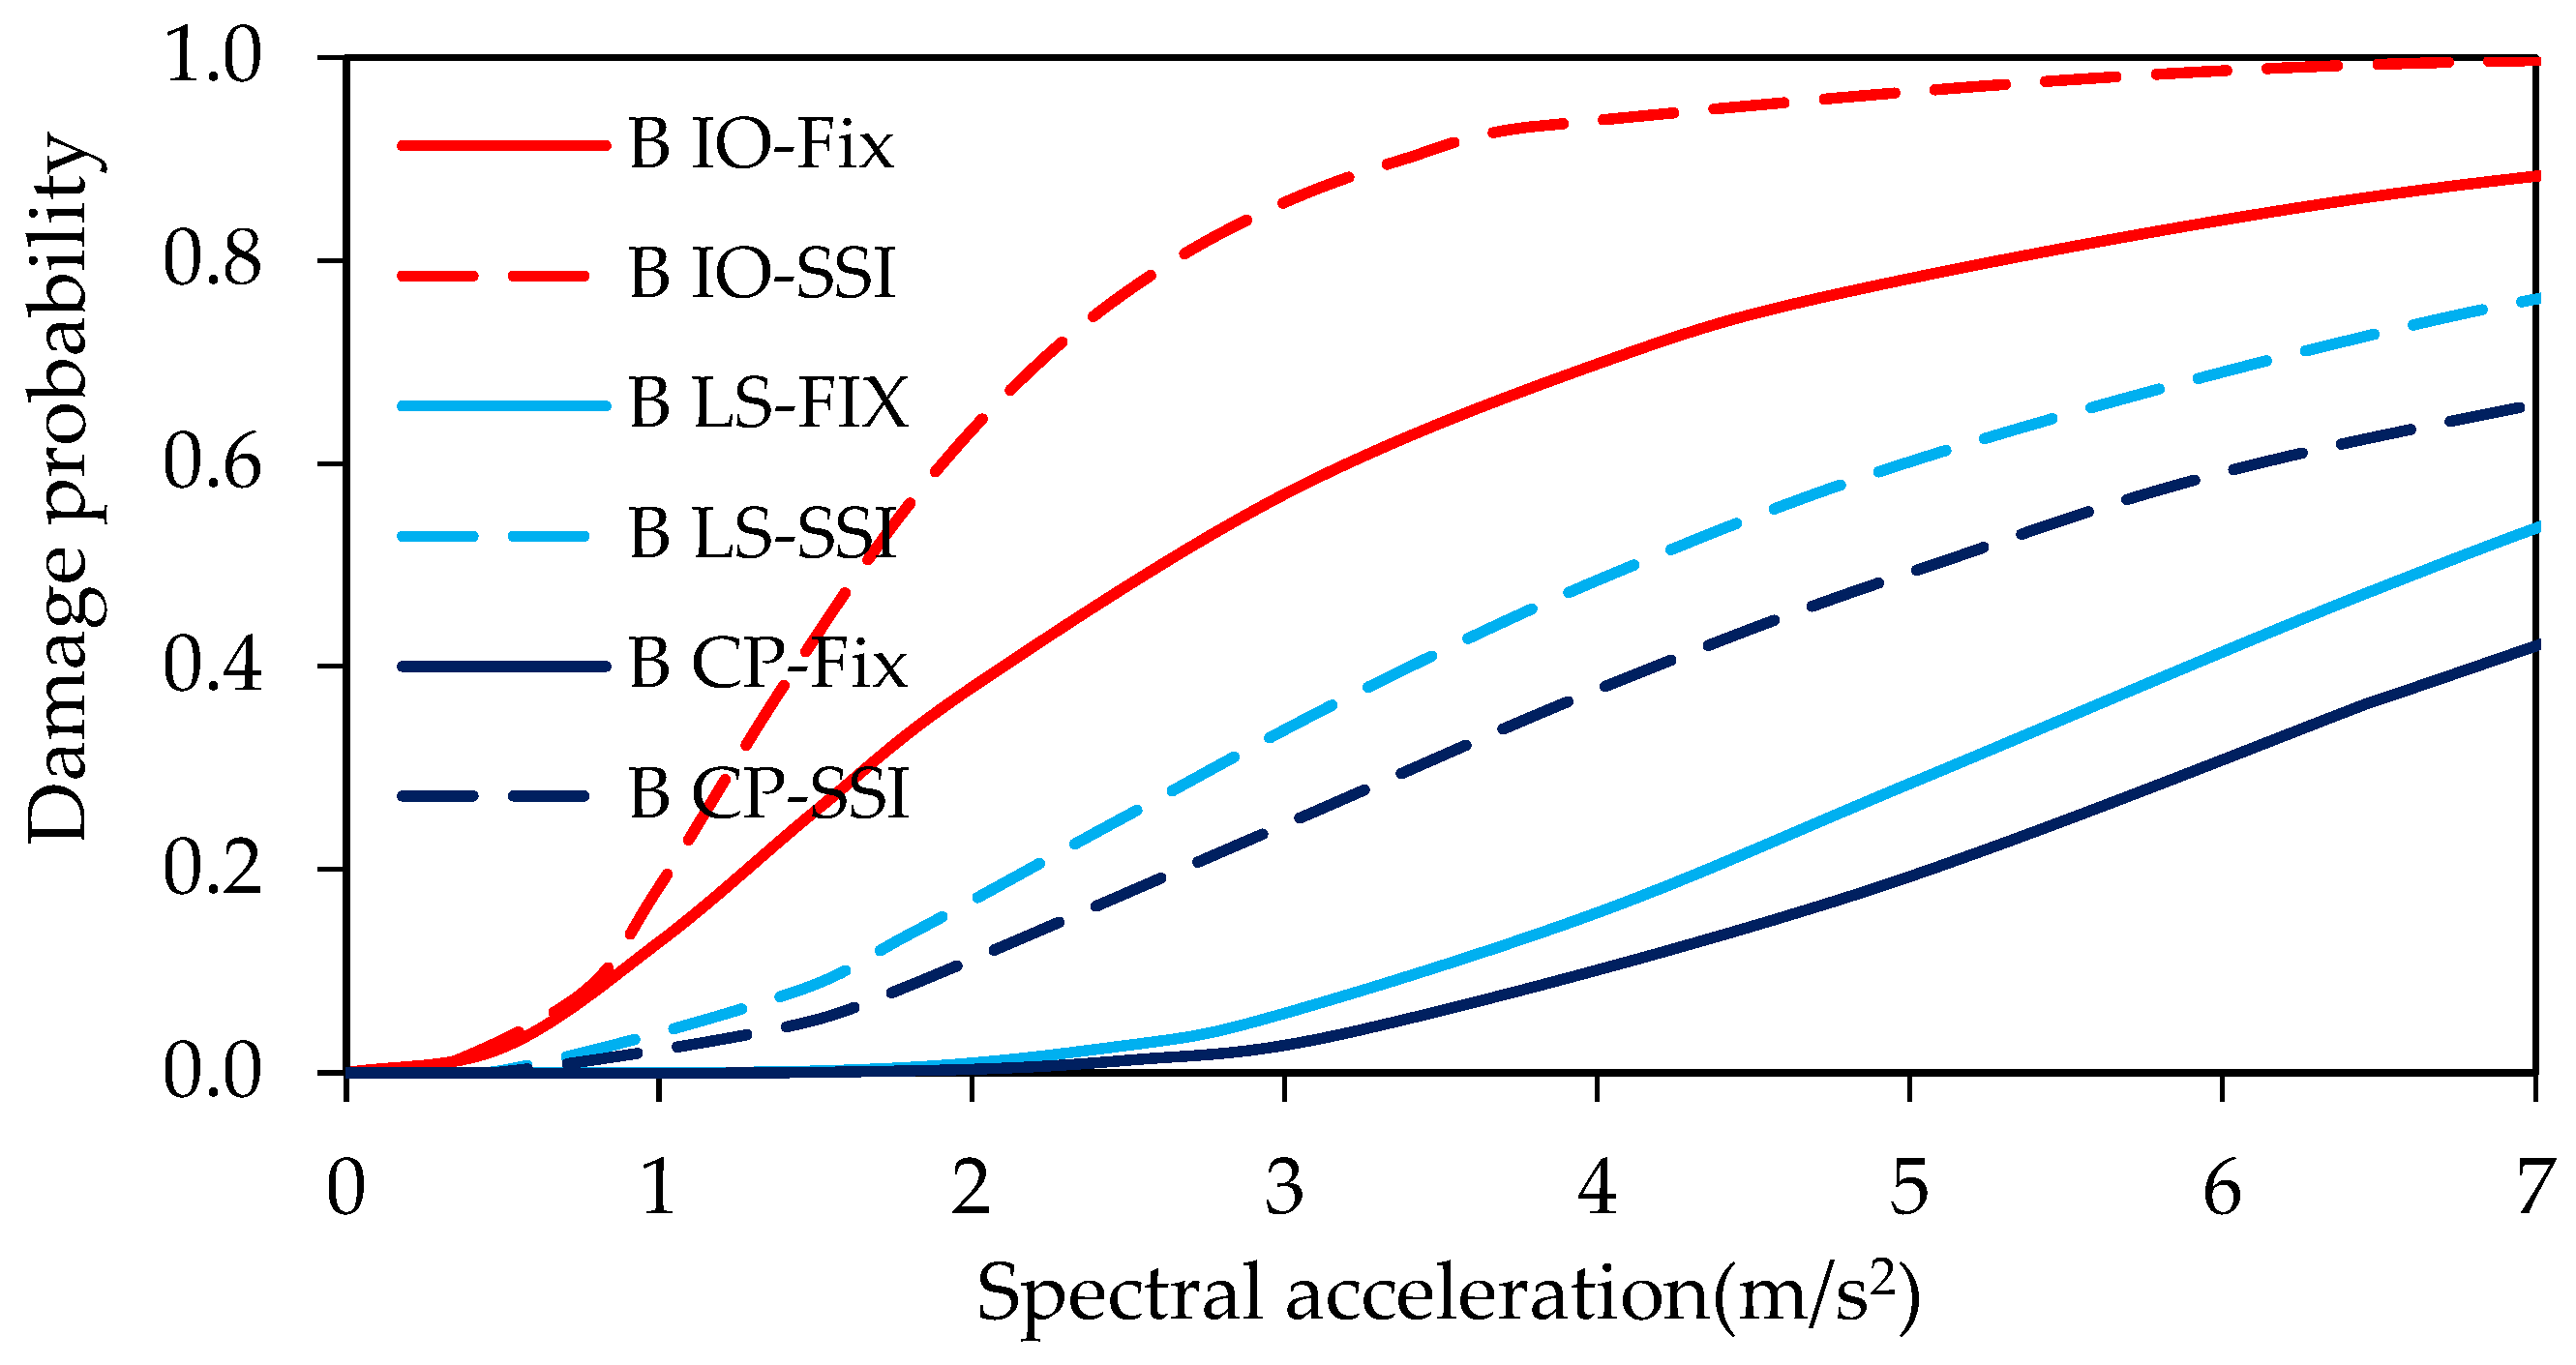
2.5. Fragility Curves
3. Results
4. Discussion
5. Conclusions
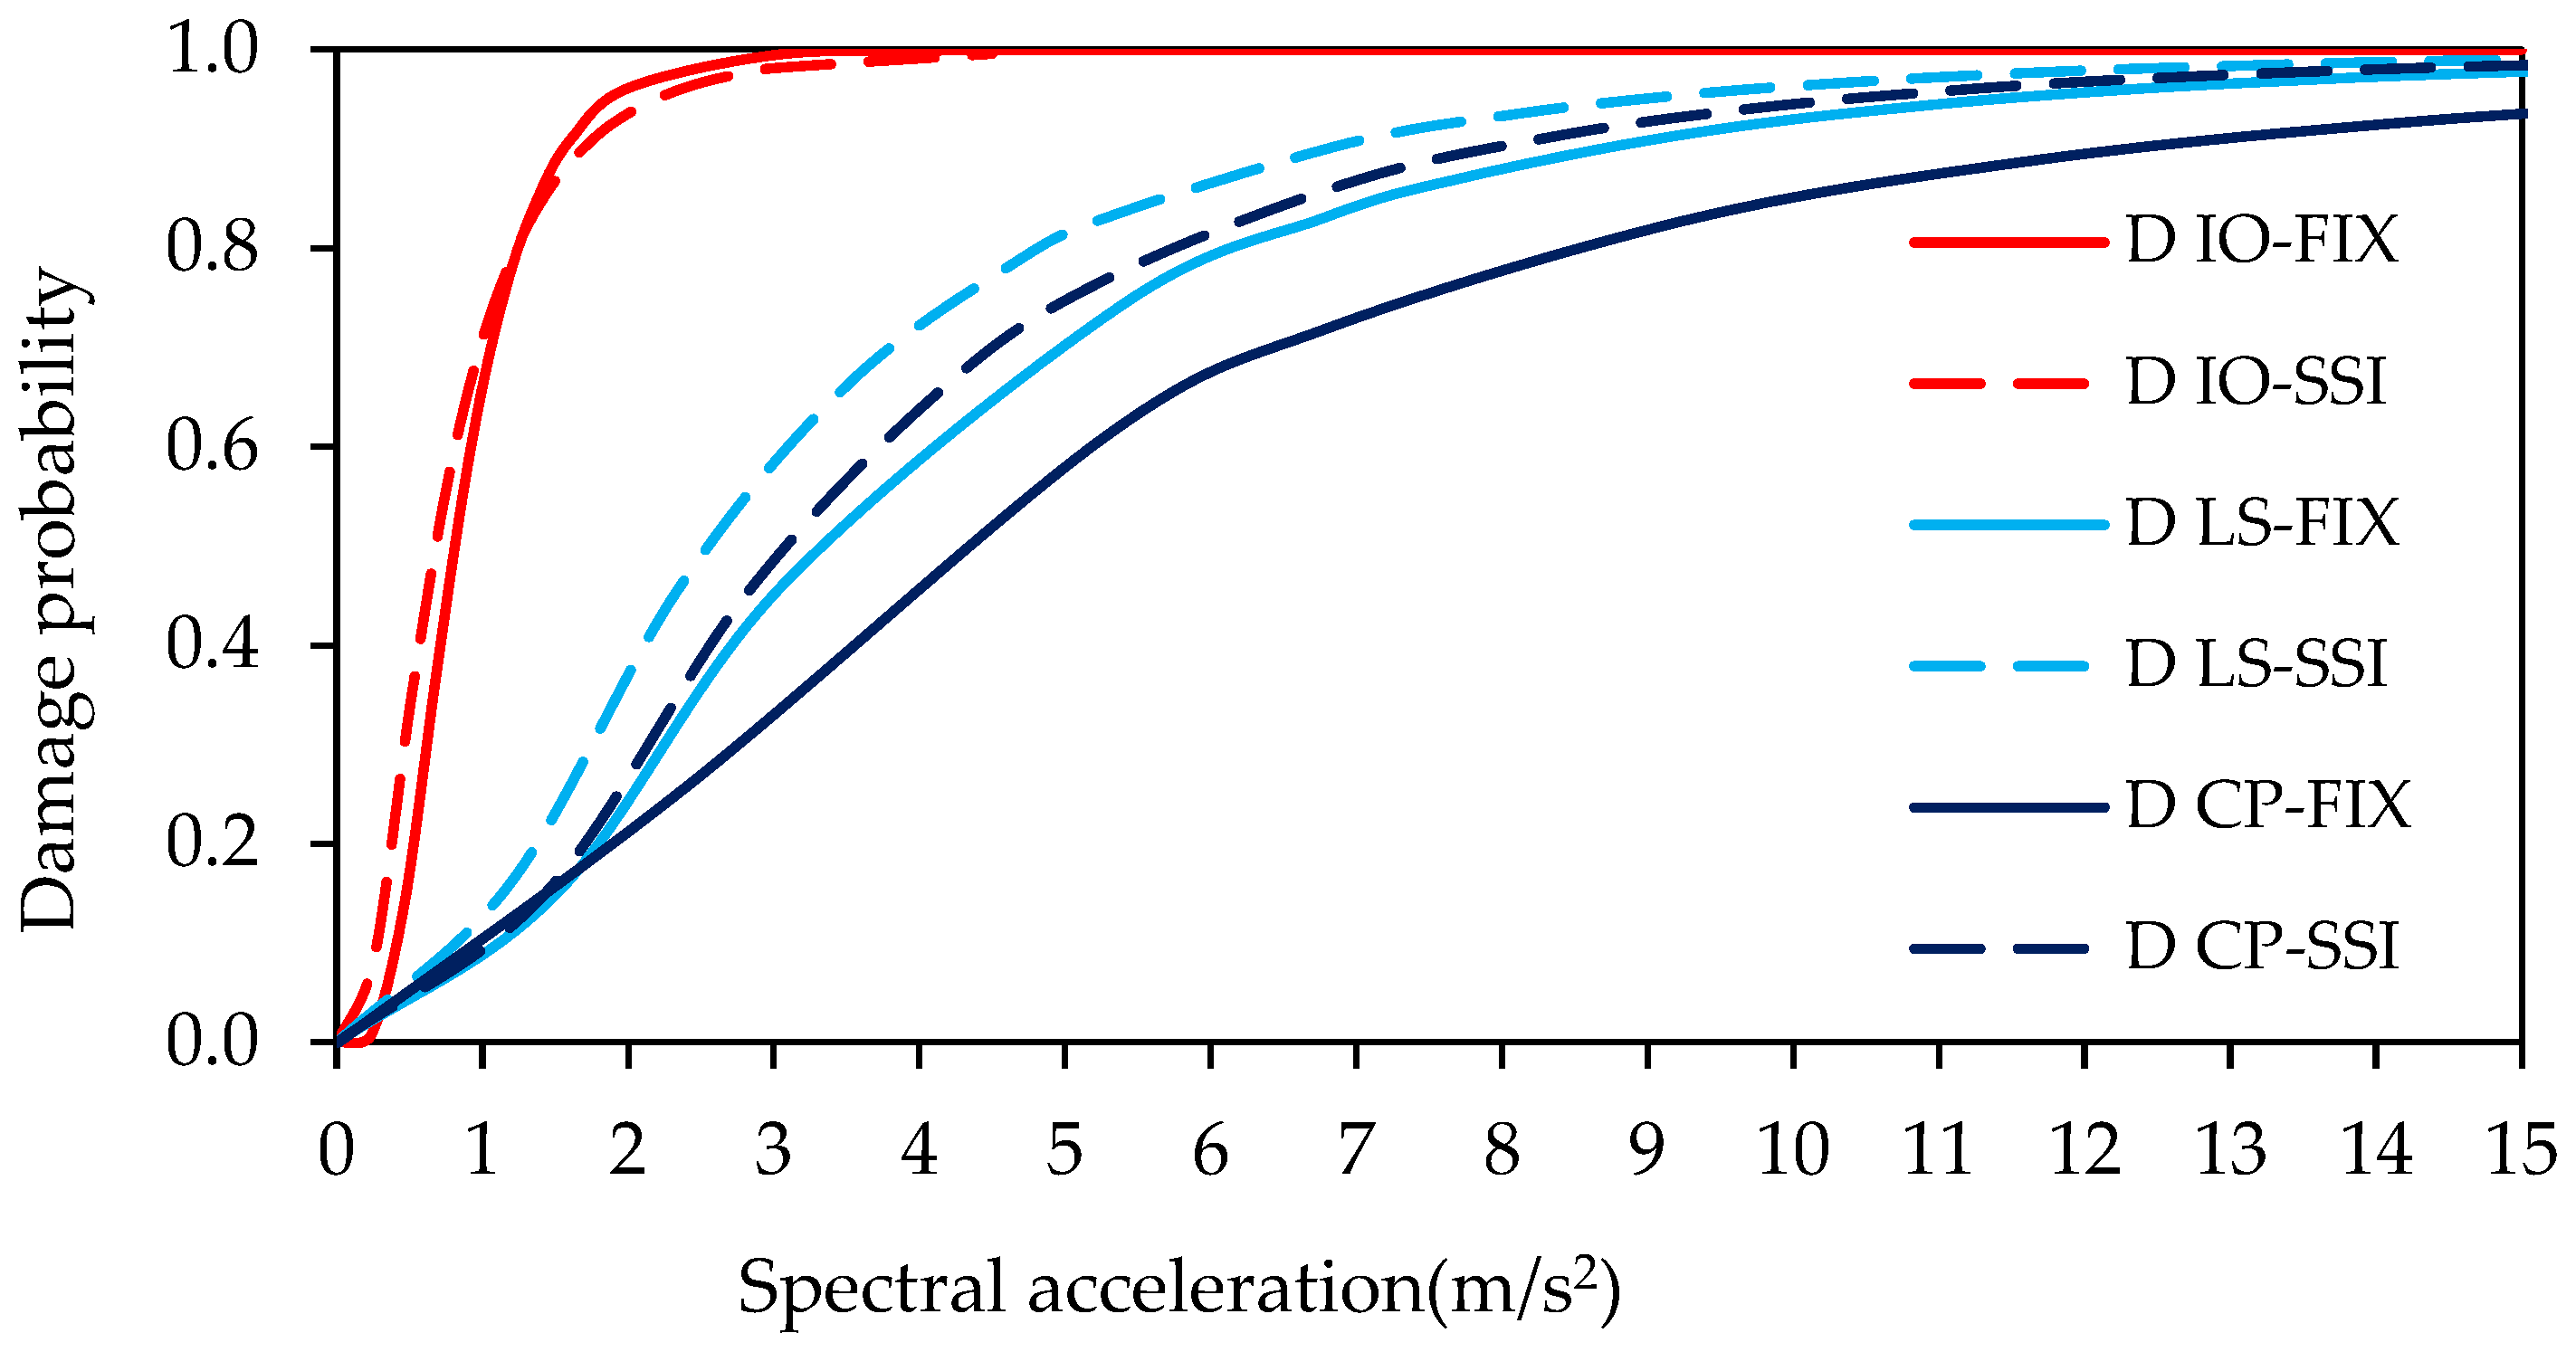
- At the immediate occupancy performance level for Site Class B, the probability of damage for the five-story building increases by a factor of 1.15 (from 86% to 99%) when SSI is taken into account. This ratio is 1.05 (from 95% to 100%) for Site Class C. There is a slight increase in damage probability, equal to 1.02 (from 98% to 100%), for Soil Class D. This slight increase may be misleading, since it is very low and may change under the effect of a different ground motion set and/or building type.
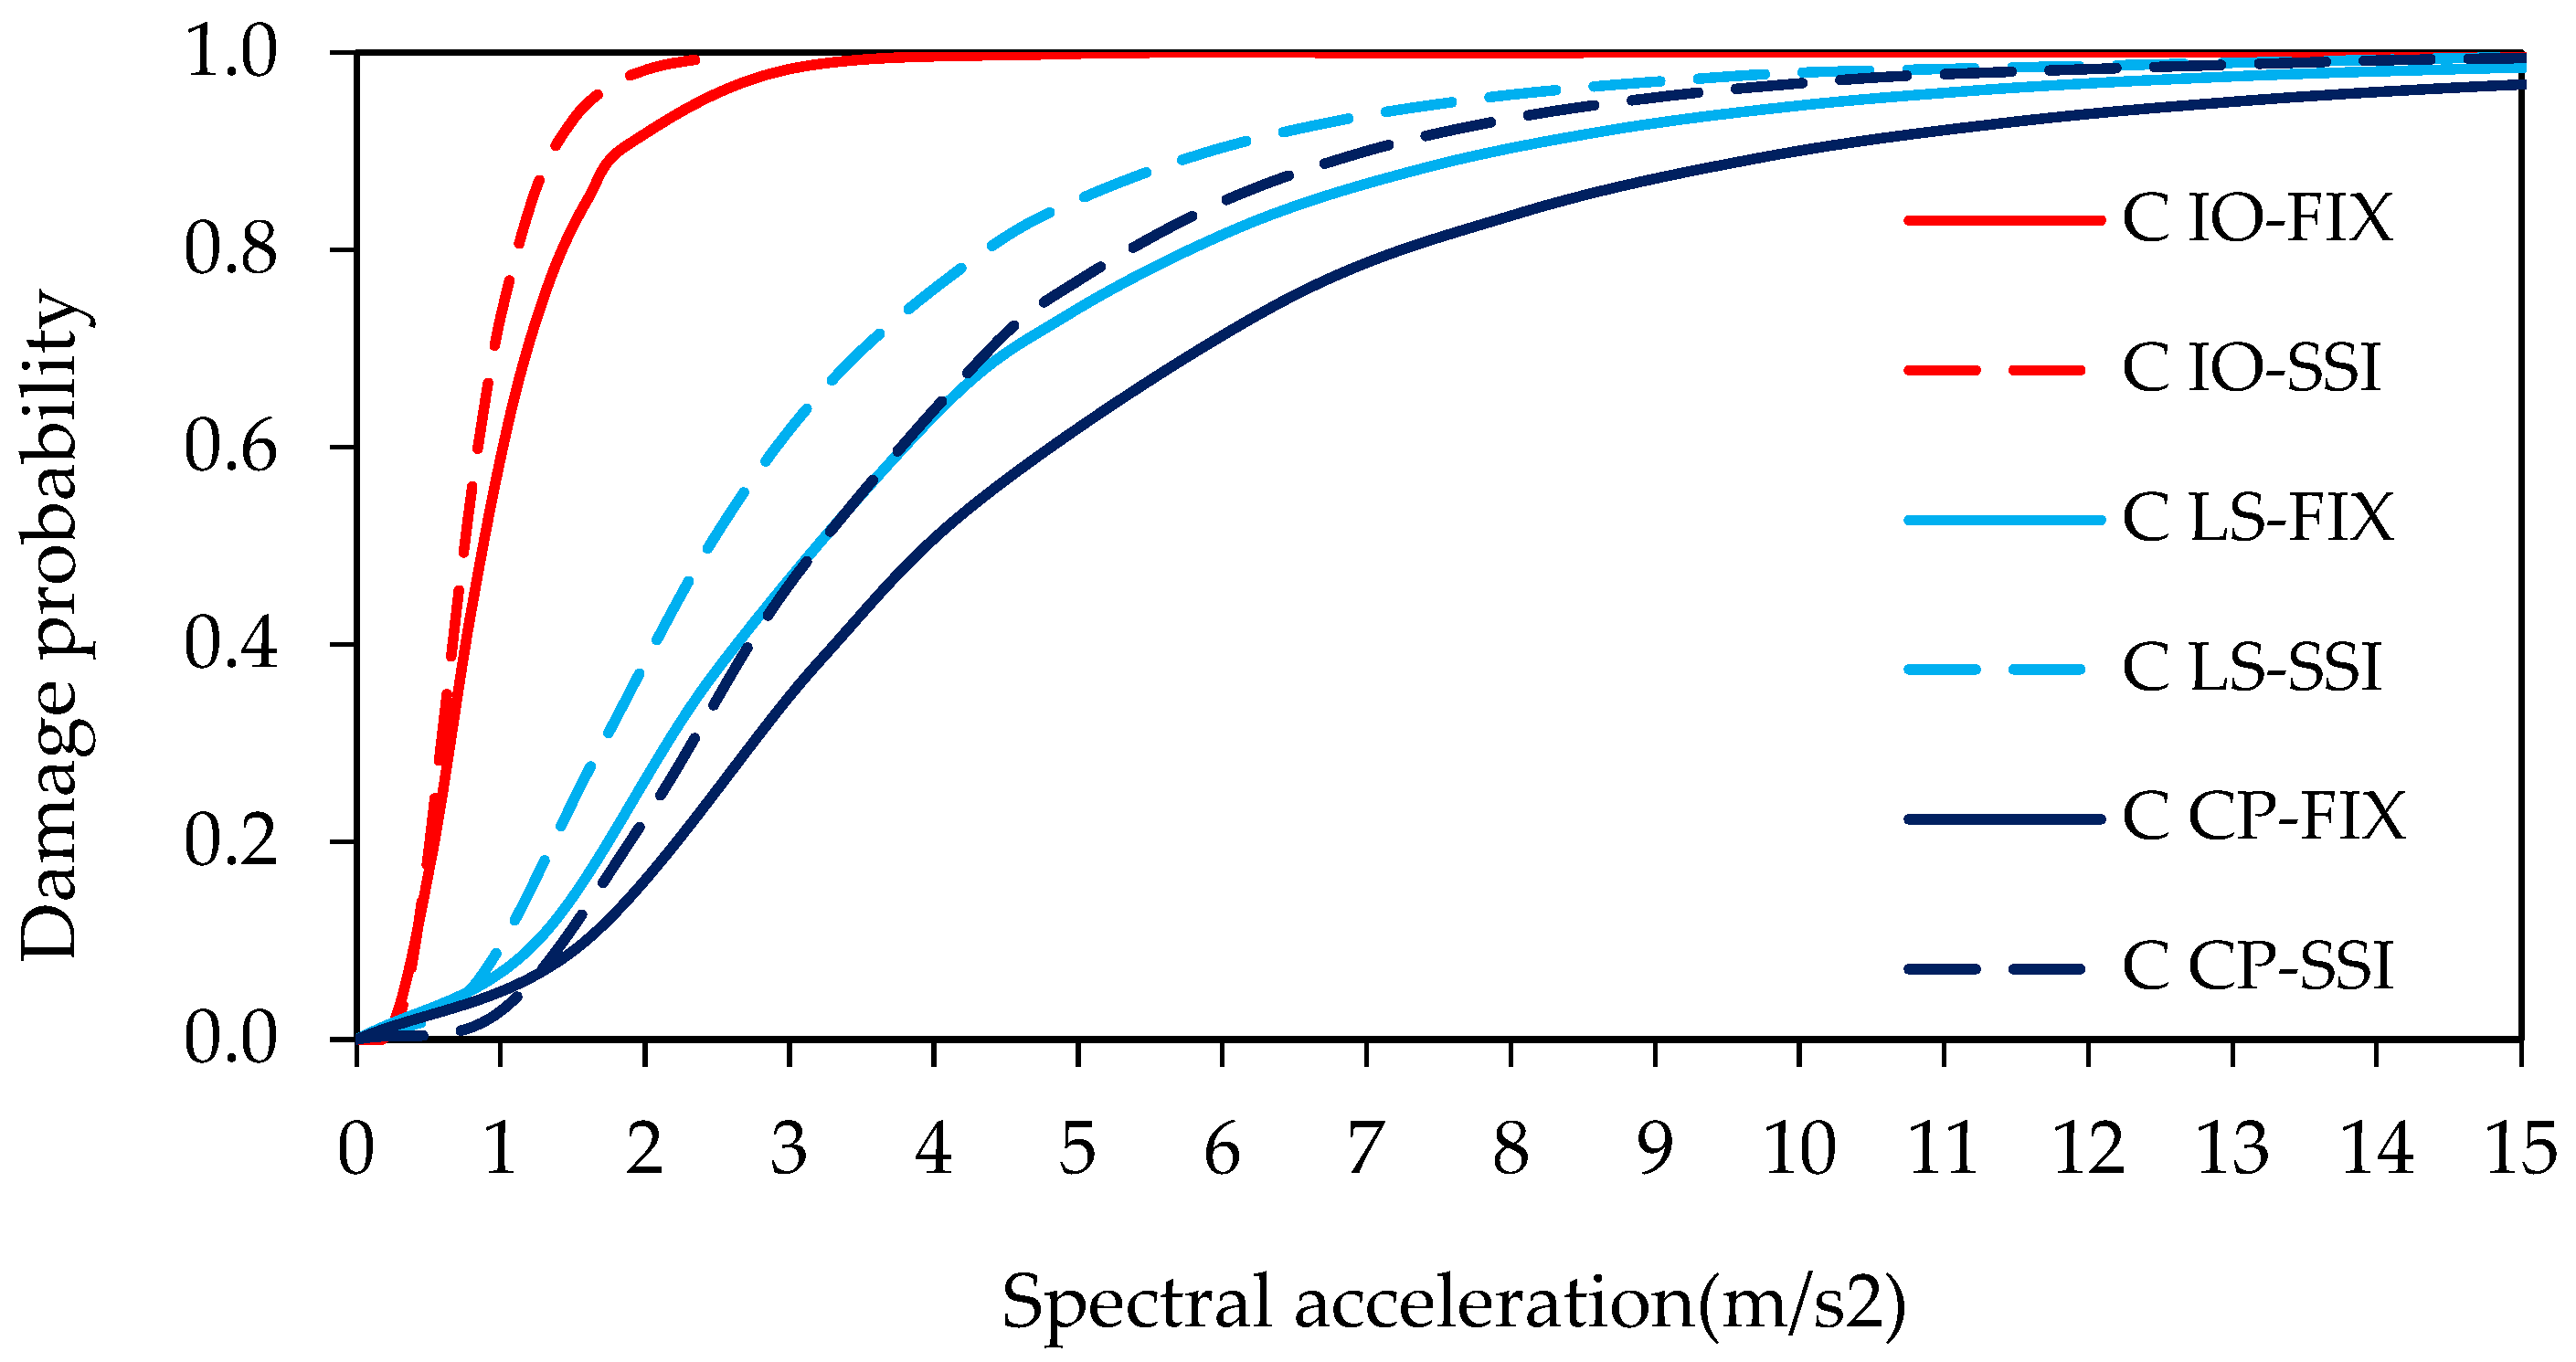
- At the life safety performance level for Site Class B, the probability of damage increases by a factor of 1.53 (from 47% to 72%) when SSI is taken into account. This ratio is 1.25 (from 72% to 90%) for Site Class C and 1.12 (from 81% to 91%) for Soil Class D.
- At the collapse prevention performance level for Site Class B, the probability of damage increases by a factor of 1.72 (from 36% to 62%) when SSI is taken into account. This ratio is 1.40 (from 63% to 88%) for Site Class C and 1.21 (from 72% to 87%) for Site Class D.
- At the immediate occupancy performance level, there is a slight difference between the two cases regardless of site class. However, this difference may be misleading, since it is very low and may change under the effect of a different ground motion set and/or building type.
- At the life safety performance level, the probability of damage increases by a factor of 1.69 (from 32% to 54%) for Site Class B, 1.25 (from 67% to 77%) for Site Class C, and 1.12 (from 72% to 91%) for Site Class D when SSI is taken into account.
- When SSI is taken into account, the probability of damage at the collapse prevention performance level for Site Class B increases by a factor of 1.64 (from 25% to 41%). This ratio is 1.22 (from 58% to 71%) for Site Class C and 1.30 (from 63% to 82%) for Site Class D.
- At the immediate occupancy performance level for Site Class B, the probability of damage slightly increases, by a factor of 1.03 (from 97% to 100%), when SSI is taken into account. There no is no difference between the probability of the two cases for Soil Classes C and D.
- At the life safety performance level, this ratio is 1.37 (from 73% to 100%) for Site Class B and 1.10 (from 73% to 80%) for Site Class C. However, there is no difference between the probabilities of the two cases for Soil Class D.
- When SSI is taken into account, the probability of damage at the collapse prevention performance level for Site Class B increases by a factor of 1.44 (from 68% to 98%). This ratio is 1.13 (from 62% to 70%) for Site Class C and 1.07 (from 72% to 77%) for Site Class D.
Author Contributions
Funding
Data Availability Statement
Conflicts of Interest
Appendix A


References
- Kwag, S.; Ju, B.S.; Jung, W. Beneficial and Detrimental Effects of Soil-Structure Interaction on Probabilistic Seismic Hazard and Risk of Nuclear Power Plant. Adv. Civ. Eng. 2018, 2018, 2698319. [Google Scholar] [CrossRef]
- Anand, V.; Kumar, S.R.S. Seismic Soil-structure Interaction: A State-of-the-Art Review. Structures 2018, 16, 317–326. [Google Scholar] [CrossRef]
- Rajeev, P.; Tesfamariam, S. Seismic fragilities of non-ductile reinforced concrete frames with consideration of soils tructure interaction. Soil Dyn. Earthq. Eng. 2012, 40, 78–86. [Google Scholar] [CrossRef]
- Hoseyni, M.S.; Yousefpour, F.; Araei, A.A.; Karimi, K.; Hoseyni, M.S. Effects of soil-structure interaction on fragility and seismic risk; a case study of power plant containment. J. Loss Prev. Process Indust. 2014, 32, 276–285. [Google Scholar] [CrossRef]
- Karapetrou, S.T.; Fotopoulou, S.D.; Pitilakis, K.D. Seismic vulnerability assessment of high-rise non-ductile RC buildings. Soil Dyn. Earthq. Eng. 2015, 73, 42–57. [Google Scholar] [CrossRef]
- Mitropoulou, C.C.; Kostopanagiotis, C.; Kopanos, M.; Lagaros, N.D. Influence of soil–structure interaction on fragility assessment of building structures. Structures 2016, 6, 85–98. [Google Scholar] [CrossRef]
- Banizadeh, M.; Behnamfar, F. Effects of soil–structure interaction on distribution of seismic vulnerability in RC structures. Soil Dyn. Earthq. Eng. 2016, 80, 73–86. [Google Scholar] [CrossRef]
- Mekki, M.; Elachachi, S.M.; Breysse, D.; Zoutat, M. Seismic behavior of R.C. structures including soil-structure interaction and soil variability effects. Eng. Struct. 2016, 126, 15–26. [Google Scholar] [CrossRef]
- Ghandil, M.; Behnamfar, F. Ductility demands of MRF structures on soft soils considering soil-structure interaction. Soil Dyn. Earthq. Eng. 2017, 92, 203–214. [Google Scholar] [CrossRef]
- Forcellini, D. Analytical fragility curves of shallow-founded structures subjected to Soil-Structure Interaction (SSI) effects. Soil Dyn. Earthq. Eng. 2021, 141, 106487. [Google Scholar] [CrossRef]
- Akhoondi, M.S.; Behnamfar, F. Seismic fragility curves of steel structures including soil-structure interaction and variation of soil parameters. Soil Dyn. Earthq. Eng. 2021, 143, 106609. [Google Scholar] [CrossRef]
- Cruz, G.R.M.V.; Bento, R.; Neyra, P.D.; Esteban, M.A. Analysis of the soil structure-interaction effects on the seismic vulnerability of mid-rise RC buildings in Lisbon. Structures 2022, 38, 599–617. [Google Scholar] [CrossRef]
- Cruz, G.R.M.V.; Sanchez, E.R.; Esteban, M.A. Numerical investigation of the contribution of the soil-structure interaction effects to the seismic performance and the losses of RC buildings. Dev. Built Environ. 2022, 12, 100096. [Google Scholar] [CrossRef]
- Mata, R.; Nuñez, E.; Hernández, M.; Correa, C.; Bustamante, G. Seismic Performance of RC Moment Frame Buildings Considering SSI Effects: A Case Study of the New Venezuelan Seismic Code. Buildings 2023, 13, 1694. [Google Scholar] [CrossRef]
- Wang, J.; Xie, Y.; Guo, T.; Du, Z. Predicting the Influence of Soil–Structure Interaction on Seismic Responses of Reinforced Concrete Frame Buildings Using Convolutional Neural Network. Buildings 2023, 13, 564. [Google Scholar] [CrossRef]
- Awchat, G.D.; Monde, A.S. Influence of Soil-Structure Interaction on the Seismic Response of the Structure on Mat Foundation. Civ. Eng. J. 2021, 7, 1679–1692. [Google Scholar] [CrossRef]
- Jamkhaneh, M.E. Pounding Risk Assessment through Soil–Structure Interaction Analysis in Adjacent High-Rise RC Structures. Buildings 2024, 14, 2779. [Google Scholar] [CrossRef]
- Turkish Seismic Design Code, Specifications for Buildings to Be Built in Seismic Zones; Ministry of Public Works and Settlement: Ankara, Turkey, 2007.
- Turkish Seismic Design Code, Specifications for Buildings to Be Built in Disaster Zones; Ministry of Public Works and Settlement: Ankara, Turkey, 2018.
- Kazemi, F.; Shafighfard, T.; Yoo, Y.D. Data-Driven Modeling of Mechanical Properties of Fiber-Reinforced Concrete: A Critical Review. Arch. Comput. Methods Eng. 2024, 31, 2049–2078. [Google Scholar] [CrossRef]
- FEMA P695; Quantification of Building Seismic Performance Factors. Federal Emergency Management Agency: Washington, DC, USA, 2009.
- Vamvatsikos, D.; Cornell, C.A. Incremental Dynamic Analysis. Earthq. Eng. Struc. Dyn. 2001, 31, 491–514. [Google Scholar] [CrossRef]
- SeismoStruct—A Computer Program for STATIC and Dynamic Nonlinear Analysis of Framed Structures (2018); Seismosoft: Pavia, Italy, 2018.
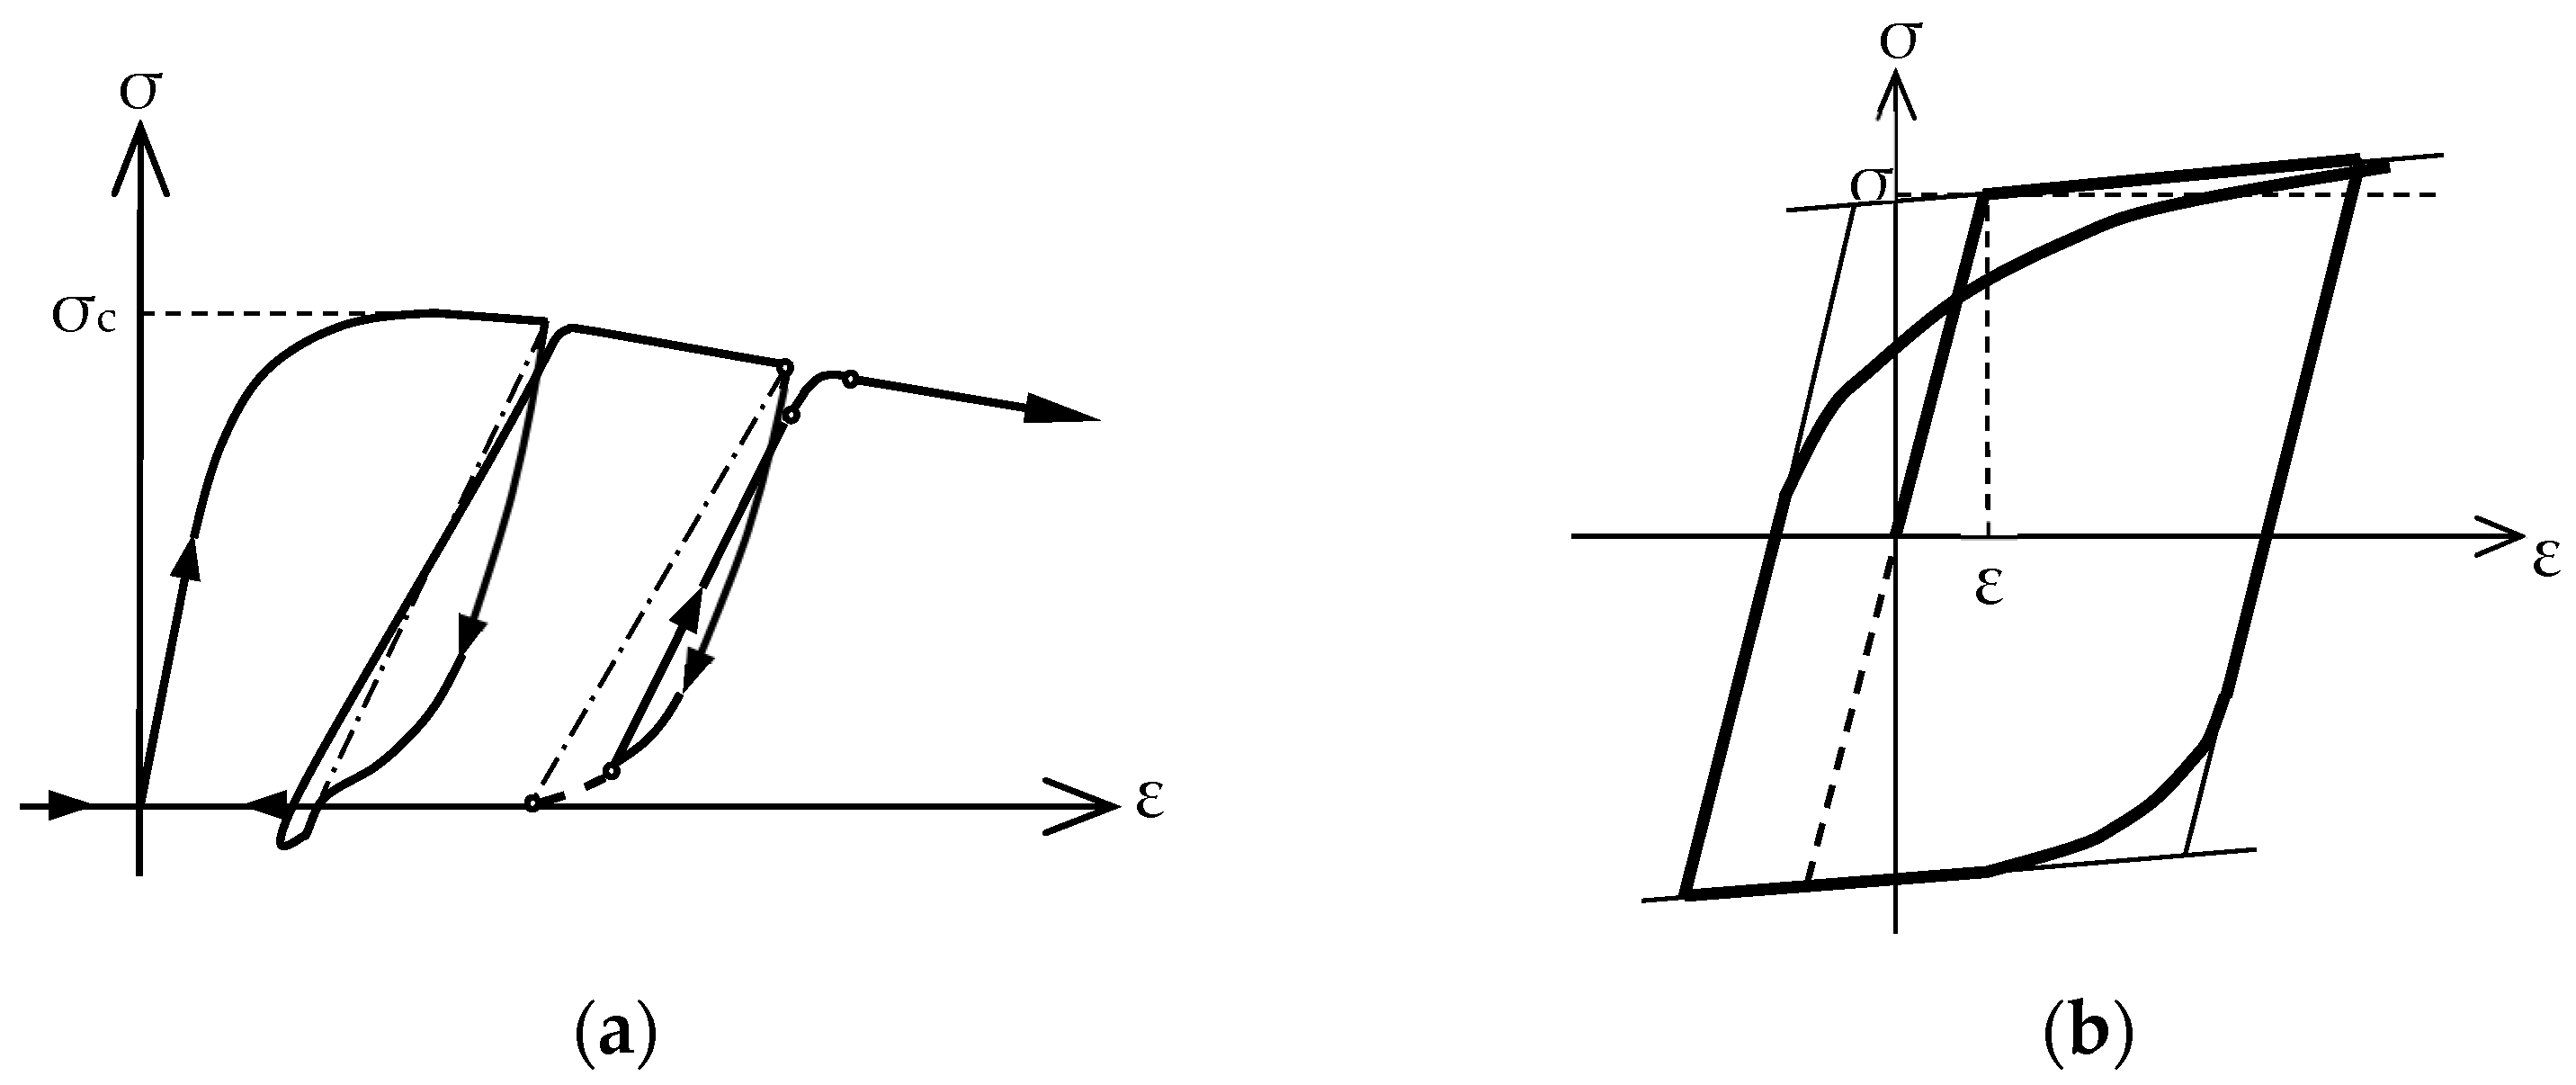
- Mander, J.B.; Priestly, M.J.N.; Park, R. Theoretical stress-strain model for confined concrete. J. Struct. Eng. 1998, 114, 1804–1826. [Google Scholar] [CrossRef]
- Menegotto, M.; Pinto, P.E. Method of analysis for cyclically loaded R.C. plane frames including changes in geometry and non-elastic behavior of elements under combined normal force and bending. In Proceedings of the Symposium on the Resistance and Ultimate Deformability of Structures Acted on by Well Defined Repeated Loads, Lisbon, Portugal, 13–14 September 1973. [Google Scholar]
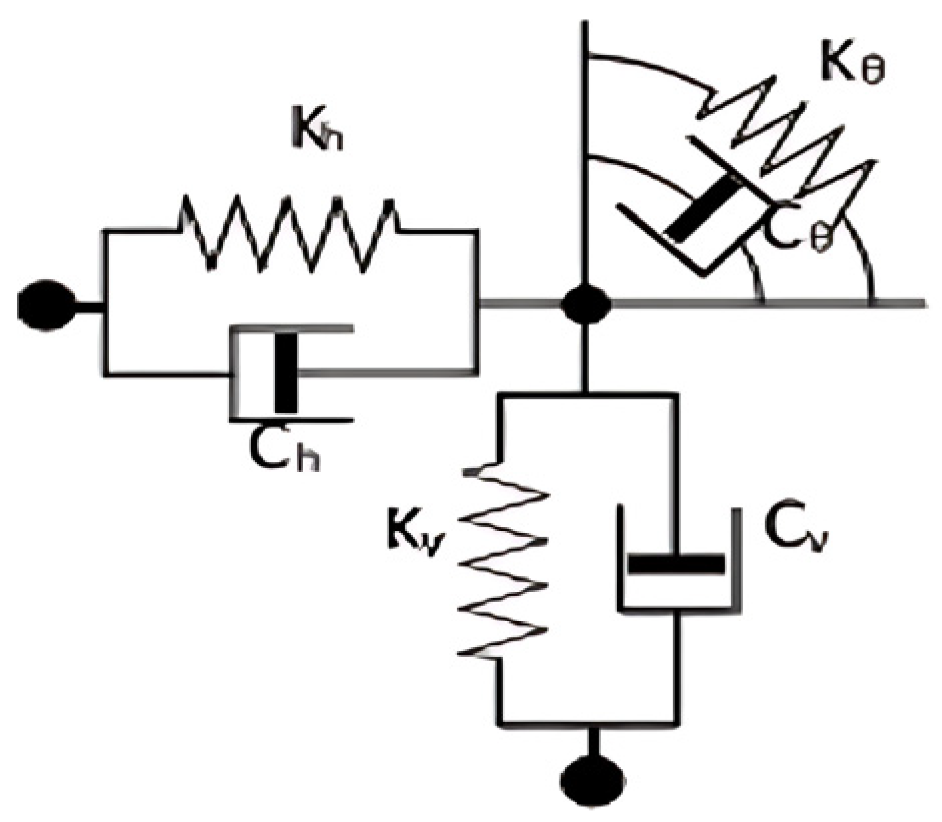
- Meek, J.W.; Wolf, J.P. Cone Models for Homogeneous Soil. J. Struct. Eng. 1992, 118, 667–685. [Google Scholar] [CrossRef]
- Boore, D.M. Some Notes Concerning the Determination of Shear-Wave Velocity and Attenuation. In Proceedings of the Workshop on Geophysical Techniques for Site and Material Characterization, Atlanta, GA, USA, 21–22 April 1993; pp. 129–134. [Google Scholar]


| Number of Stories | Fixed Base | SSI | ||
|---|---|---|---|---|
| B | C | D | ||
| 5 | 0.69 | 0.70 | 0.72 | 0.76 |
| 10 | 1.19 | 1.23 | 1.28 | 1.41 |
| 15 | 1.46 | 1.56 | 1.69 | 1.99 |
| Event | Mw | Station | Fault Dist. (km) | 1st Comp. | PGA (g) | 2nd Comp. | PGA (g) | Shear Wave Velocity (m/s) | Site Class |
|---|---|---|---|---|---|---|---|---|---|
| Hect. Mine, 1999 | 7.1 | Hector | 10.35 | HEC000 | 0.263 | HEC090 | 0.360 | 685 | B |
| Kocaeli, 1999 | 7.7 | Arçelik | 10.56 | ARE000 | 0.218 | ARE090 | 0.14 | 523 | B |
| Friuli, 1976 | 6.5 | Tolmezzo | 14.97 | TMZ000 | 0.344 | TMZ270 | 0.302 | 505 | B |
| Loma Pri., 1989 | 6.9 | Anderson | 19.90 | LOMAP 250 | 0.250 | LOMAP 340 | 0.262 | 489 | B |
| Northridge, 1994 | 6.7 | Big Tuj | 19.10 | TUJ262 | 0.165 | TUJ352 | 0.255 | 550 | B |
| Kobe, 1995 | 6.9 | Chihaya | 49.90 | CHY000 | 0.094 | CHY090 | 0.106 | 609 | B |
| Imper. Val., 1979 | 6.5 | Cerro Priet | 15.19 | CPE147 | 0.167 | CPE237 | 0.147 | 472 | B |
| Northern, 1967 | 5.6 | Ferndale | 27.36 | FRN224 | 0.268 | FRN314 | 0.110 | 219 | C |
| Kern Coun., 1952 | 7.4 | Taft | 38.42 | TAFT021 | 0.156 | TAFT111 | 0.183 | 385 | C |
| Imper. Val., 1979 | 6.5 | Delta | 22.03 | DLT262 | 0.239 | DLT352 | 0.333 | 242 | C |
| Kobe, 1995 | 6.9 | Shin | 19.14 | SHI000 | 0.238 | SHI090 | 0.212 | 256 | C |
| Kocaeli, 1999 | 7.5 | Duzce | 13.60 | DZC180 | 0.325 | DZC270 | 0.36 | 282 | C |
| Landers, 1992 | 7.3 | Yermo | 23.62 | YER270 | 0.226 | YER360 | 0.148 | 354 | C |
| Northern, 1954 | 6.5 | Ferndale | 26.72 | FRN044 | 0.172 | FRN314 | 0.200 | 219 | C |
| Imper. Val., 1979 | 6.5 | El Centro | 12.56 | E11140 | 0.367 | E11230 | 0.401 | 196 | D |
| Supers Hills, 1987 | 6.5 | El Centro | 18.20 | ICC000 | 0.376 | ICC090 | 0.293 | 192 | D |
| Chi Chi, 1999 | 7.6 | CHY047 | 24.13 | CHY047N | 0.194 | CHY047-W | 0.163 | 170 | D |
| Northridge, 1994 | 6.7 | Carson | 45.55 | WAT180 | 0.087 | WAT270 | 0.088 | 161 | D |
| Loma Pri., 1989 | 6.9 | Foster City | 43.77 | A01000 | 0.268 | A01090 | 0.291 | 116 | D |
| Coalinga, 1983 | 6.4 | Parkfield | 43.83 | H-C02000 | 0.112 | H-C-2090 | 0.117 | 173 | D |
| Supers Hills, 1987 | 6.2 | Imper. Val. | 17.59 | IVW090 | 0.130 | IVW360 | 0.127 | 179 | D |
| Site Class | Mean Shear Wave Velocity (m/s) |
|---|---|
| B | 547 |
| C | 280 |
| D | 170 |
| Section Damage | Strain Limit for Concrete | Strain Limit for Reinforcement |
|---|---|---|
| Limited damage | 0.0025 (unconfined) | 0.0075 |
| Controlled damage | (confined) | 0.75 (0.4 Ɛsu) |
| Collapse prevention | (confined) | 0.4 Ɛsu |
| Site Class | Mean Shear Velocity (m/s) | Soil Density (kN/m3) | Poisson Ratio |
|---|---|---|---|
| B | 400 | 21 | 0.3 |
| C | 250 | 20 | 0.4 |
| D | 150 | 18 | 0.5 |
| Number of Stories | Performance Level | Soil Type | |||||
|---|---|---|---|---|---|---|---|
| B | C | D | B | C | D | ||
| Fixed Base | SSI | ||||||
| 5 | IO | 0.0032 | 0.0052 | 0.0048 | 0.0039 | 0.0037 | 0.0035 |
| LS | 0.012 | 0.015 | 0.014 | 0.008 | 0.01 | 0.0097 | |
| CP | 0.018 | 0.02 | 0.018 | 0.01 | 0.015 | 0.012 | |
| 10 | IO | 0.0051 | 0.005 | 0.0049 | 0.0037 | 0.0038 | 0.0039 |
| LS | 0.014 | 0.013 | 0.014 | 0.01 | 0.018 | 0.012 | |
| CP | 0.016 | 0.015 | 0.018 | 0.015 | 0.02 | 0.017 | |
| 15 | IO | 0.002 | 0.0035 | 0.004 | 0.001 | 0.0032 | 0.0034 |
| LS | 0.011 | 0.012 | 0.015 | 0.009 | 0.01 | 0.014 | |
| CP | 0.013 | 0.015 | 0.017 | 0.011 | 0.016 | 0.018 | |
| Number of Stories | Performance Level | Soil Type | |||||
|---|---|---|---|---|---|---|---|
| B | C | D | B | C | D | ||
| Fixed Base | SSI | ||||||
| 5 | IO | 0.86 | 0.95 | 0.98 | 0.99 | 1.00 | 1.00 |
| LS | 0.47 | 0.72 | 0.81 | 0.72 | 0.90 | 0.91 | |
| CP | 0.36 | 0.63 | 0.72 | 0.62 | 0.88 | 0.87 | |
| 10 | IO | 0.99 | 0.98 | 0.99 | 1.00 | 1.00 | 1.00 |
| LS | 0.32 | 0.67 | 0.72 | 0.54 | 0.77 | 0.91 | |
| CP | 0.25 | 0.58 | 0.63 | 0.41 | 0.71 | 0.82 | |
| 15 | IO | 0.97 | 1.00 | 1.00 | 1.00 | 1.00 | 1.00 |
| LS | 0.73 | 0.73 | 0.83 | 1.00 | 0.80 | 0.93 | |
| CP | 0.68 | 0.62 | 0.72 | 0.98 | 0.70 | 0.77 | |
Disclaimer/Publisher’s Note: The statements, opinions and data contained in all publications are solely those of the individual author(s) and contributor(s) and not of MDPI and/or the editor(s). MDPI and/or the editor(s) disclaim responsibility for any injury to people or property resulting from any ideas, methods, instructions or products referred to in the content. |
© 2025 by the authors. Licensee MDPI, Basel, Switzerland. This article is an open access article distributed under the terms and conditions of the Creative Commons Attribution (CC BY) license (https://creativecommons.org/licenses/by/4.0/).
Share and Cite
Kirçil, M.S.; Ethemoglu, H. Effect of Soil–Structure Interaction on the Damage Probability of Multistory RC Frame Buildings with Shallow Foundations. Buildings 2025, 15, 624. https://doi.org/10.3390/buildings15040624
Kirçil MS, Ethemoglu H. Effect of Soil–Structure Interaction on the Damage Probability of Multistory RC Frame Buildings with Shallow Foundations. Buildings. 2025; 15(4):624. https://doi.org/10.3390/buildings15040624
Chicago/Turabian StyleKirçil, Murat Serdar, and Hulagu Ethemoglu. 2025. "Effect of Soil–Structure Interaction on the Damage Probability of Multistory RC Frame Buildings with Shallow Foundations" Buildings 15, no. 4: 624. https://doi.org/10.3390/buildings15040624
APA StyleKirçil, M. S., & Ethemoglu, H. (2025). Effect of Soil–Structure Interaction on the Damage Probability of Multistory RC Frame Buildings with Shallow Foundations. Buildings, 15(4), 624. https://doi.org/10.3390/buildings15040624