Article

Seismic Performance Assessment of an RC Building Due to 2023 Türkiye Earthquakes: A Case Study in Adıyaman, Türkiye

1
Department of Construction Technology, Darende Vocational High School, Malatya Turgut Ozal University, Malatya 44700, Türkiye
2
School of Architecture, Technology and Engineering, University of Brighton, Brighton BN2 4NU, UK
3
Department of Civil Engineering, Faculty of Engineering and Natural Sciences, Malatya Turgut Ozal University, Malatya 44900, Türkiye
*
Author to whom correspondence should be addressed.
Buildings 2025, 15(4), 521; https://doi.org/10.3390/buildings15040521
Submission received: 10 January 2025 / Revised: 3 February 2025 / Accepted: 5 February 2025 / Published: 8 February 2025

Abstract

:
The 7.7 and 7.6 magnitude Pazarcık and Elbistan earthquakes that struck Kahramanmaraş on 6 February 2023 caused widespread structural damage across many provinces and are considered rare in seismological terms. While many reinforced concrete (RC) buildings designed under current earthquake regulations sustained significant damage, some older RC buildings with outdated designs sustained only moderate damage. This study aims to analyze the seismic performance of such older RC buildings to understand why they did not collapse or suffer severe damage. An 8-story RC building in Adıyaman province, damaged by the earthquake, was considered for analysis. The region’s seismicity and local site conditions were assessed through borehole operations, geotechnical laboratory tests, and seismic field tests. The soil profile was modeled, and one-dimensional seismic site response analyses were performed using records from nearby stations (TK 4615 Pazarcık and TK 4612 Göksun stations) to determine the foundation-level earthquake record. Nonlinear static pushover analysis was carried out via SAP2000 and STA4CAD, utilizing site response analysis and test results taken from the reinforcement and concrete samples of the building. The findings, compared with the observed damage, provide insights into the performance of older RC buildings in this region.

1. Introduction

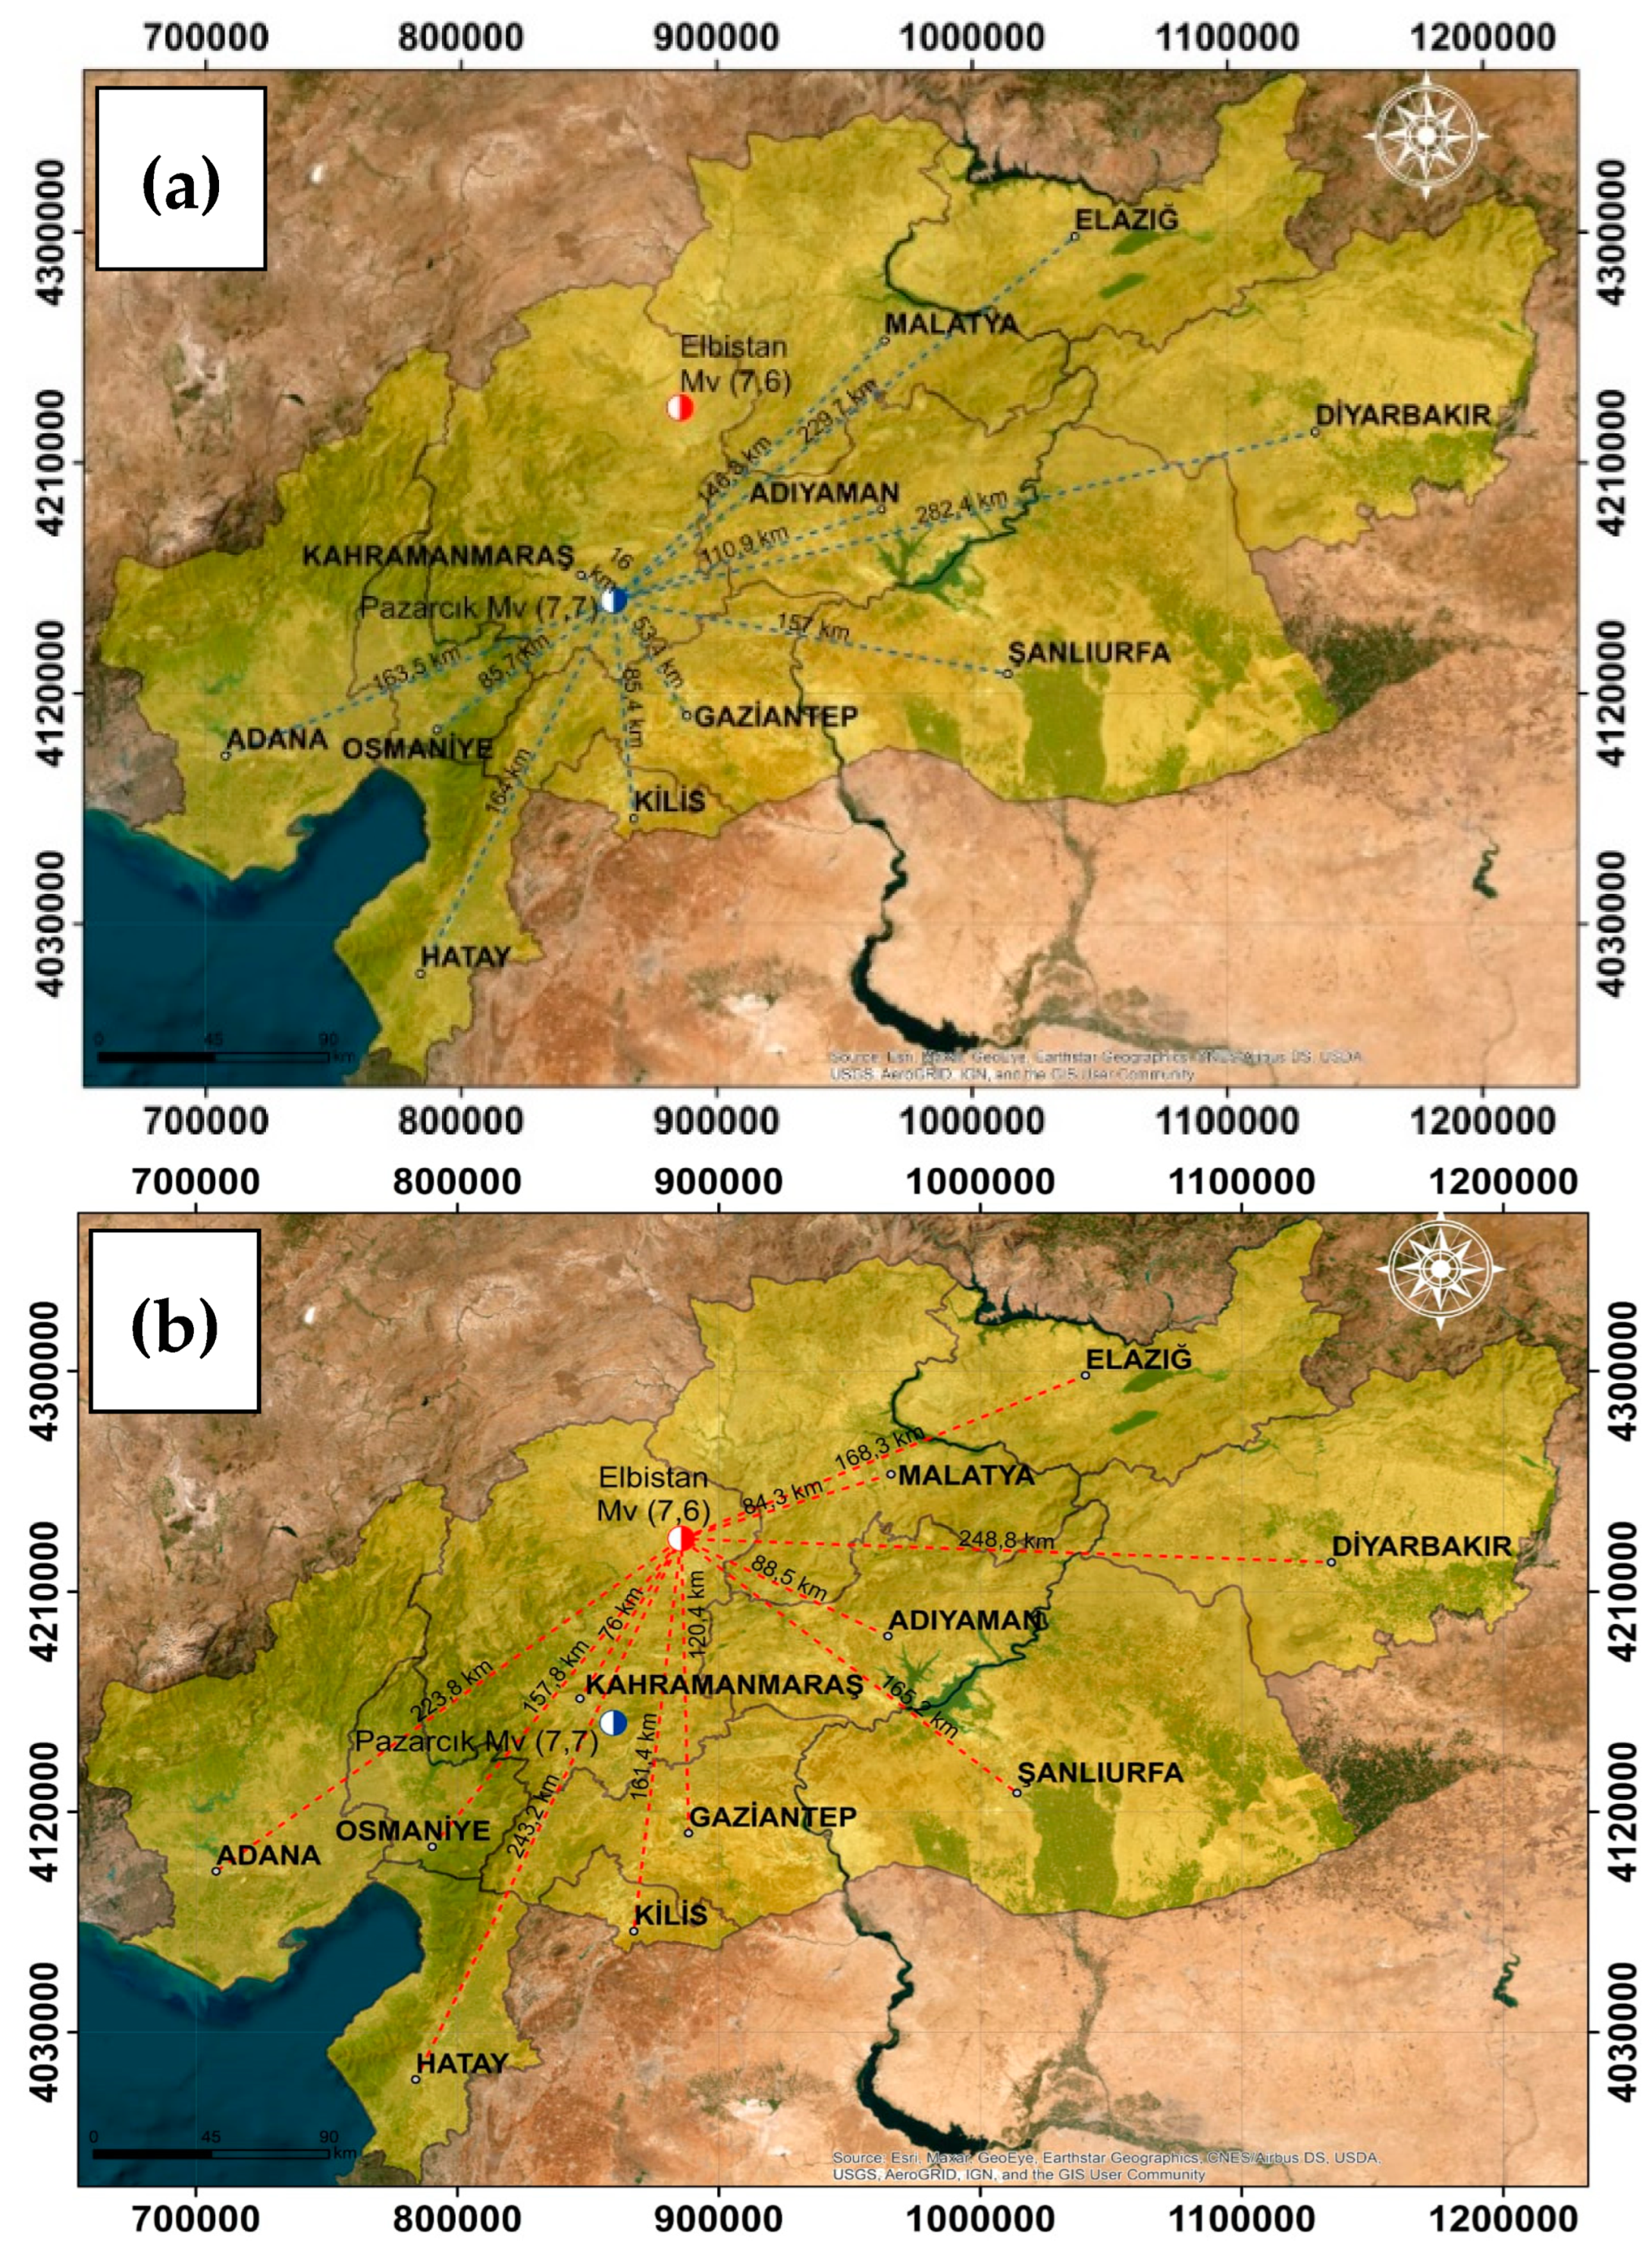
On 6 February 2023, two earthquakes with moment magnitudes of 7.7 and 7.6 Mw struck Pazarcık Kahramanmaraş at 04:17 local time and Elbistan Kahramanmaraş at 13:24, respectively. These earthquakes had devastating effects in the cities of Adana, Adıyaman, Diyarbakır, Gaziantep, Hatay, Kahramanmaraş, Kilis, Malatya, Osmaniye, Şanlıurfa, and Elazığ, as well as in Syria. Based on official records, hundreds of thousands of buildings were damaged/destroyed, while more than 50,000 people died. The Eastern Anatolian Fault mechanism on which the earthquakes occurred is a left lateral strike–slip fault. The hazard levels of residential areas under earthquake activity conditions with a recurrence period of 475 years can be seen in Figure 1. In terms of peak ground acceleration (PGA), regions on the fault segments extending from the Bingöl-Karlıova triple junction to Hatay are considered high-danger areas with levels of 0.50 g and above.
In Türkiye, a significant proportion of the building stock is made of reinforced concrete (RC) frame buildings with infill walls. Unfortunately, many earthquake damage assessment teams [1,2,3,4,5,6,7] have reported that after the devastating earthquakes in recent years, numerous buildings that lacked adequate engineering service have either collapsed or suffered severe damage. According to their observations [1,2,3,4,5,6,7], the main factors that trigger these RC buildings’ severe damage/collapse are structural system design errors (soft/weak stories, short columns, insufficient lateral stiffness, strong beam–weak column irregularity causing plastic hinge formation in columns before beams, etc.), construction errors (weaknesses in structural material quality, a lack of inspection, workmanship defects, etc.), and reinforcement-detailing errors (insufficient transverse reinforcement, insufficient wrapping in beam–column joints, etc.). On the other hand, it is very important to carefully design the column–beam joint in RC buildings to improve the strength and ductility properties of the structure [8,9]. Furthermore, the low mechanical properties of certain types of soil (such as alluvial soil) and architectural designs that do not comply with the earthquake-resistant building design philosophy have also resulted in an increase in the loss of life and property.
The behavior of local soil conditions under earthquake loads has significant effects on structural behavior, like many other engineering parameters [10,11,12]. This issue has been underlined in previous studies carried out in regions within the impact area of the Pazarcık and Elbistan earthquakes [5,13,14]. In this geographical region, where the bulk of structures consists of reinforced concrete buildings in city centers and masonry structures in rural settlements, comprehensive evaluations of damage type were made as a result of field investigations and surveys carried out immediately after the earthquakes [15]. Depending on the frequency content of an earthquake’s motions, site amplification due to the local soil conditions can generate shear forces above the structural demand during the earthquake. This level, defined as seismic demand, is a critical consideration in designing buildings and other structures to ensure they can withstand the potentially destructive forces generated by seismic activity in addition to analyzing these properties. Therefore, site amplification relies on whether a suitable ground motion model has been selected, as well as site properties [16]. In this context, seismic site response analysis, which examines structural behavior under the influence of earthquakes by considering the soil profile, fills an important gap [17,18,19]. Studies have shown that soil–structure interaction (SSI) can also significantly impact the responses of structures by increasing story drifts and accelerations [20,21].
Earthquakes should not result in severe damage to or collapse of buildings designed based on the earthquake engineering philosophy. Türkiye has developed quite strict earthquake regulations, which are constantly updated, namely, TEC-1975 [22], TEC-1998 [23], TEC-2007 [24], and TBEC-2018 [25]. Some simple assumptions were used in the performance-based design in TEC-1975 [22] since capacity design and performance were not available in the literature [26]. In TEC-1998 [23], force-based principles were utilized in the designs, and the spectral acceleration value was increased by 1.5 times by using the building importance factor multiplier for priority buildings. However, in TEC-2007 [24] and TBEC-2018 [25], a strong earthquake motion was defined for residential buildings that ensure life safety. In this sense, as also observed in the field studies after the earthquakes, the earthquake regulations in force during the construction years of buildings have a clear impact on the damage/collapse of the buildings.
Structural defects are observed in the field observations made after the earthquake, especially in the RC buildings built before 2000 in Türkiye. The enforcement of TBEC-2018 [25] and TS500 [27] after the 1999 Marmara Earthquake (Mw 7.6), in which more than 25,000 people died, also became a milestone for earthquake and structural engineering in Türkiye. The reason can be explained by the TS500 [27] design code, which mandated using ductile low-carbon steel and ready-mixed concrete. Moreover, the use of non-deformed bars has been banned, and the detailing of steel bars has been improved. On the other hand, failure to obey some requirements, such as concrete quality, stirrup spacing, overlapping lengths, etc., also negatively influences the structural performance.
In the literature, some researchers [28,29,30,31,32,33] investigated the seismic behavior of damaged RC buildings during earthquakes via 3D modeling and on-site investigations. Ozturk et al. [28] studied the seismic performance of RC school buildings in the 7.7 and 7.6 Mw Kahramanmaras earthquakes and investigated the causes of the damages using structural modeling. Peker and Altan [29] analyzed the RC building built in 2016, which was damaged in the 2023 Türkiye earthquakes, and examined the effects of errors on the structural system. In a study by Bikçe and Çelik [30], the failure analysis of newly constructed RC buildings designed based on the 2007 Turkish Earthquake Design Code during the 2011 Van Earthquake (Mw 7.2) was carried out. Avcil [31] investigated the analysis of precast RC structures during the 2023 Türkiye earthquakes via the SAP2000 program [34]. Cesare et al. [32] studied the structural behavior of damaged RC buildings after the 2002 Molise earthquake (Mw 5.4) to understand the revealed evolution of the damage through nonlinear analysis. Ozkul et al. [33] studied the effect of shear walls on the seismic performance of RC buildings damaged during the 2011 Van Earthquake (Mw 7.2) using an analytical model. On the other hand, to study the seismic behavior of existing buildings in areas with medium to high seismicity and to assess the potential impacts of seismic events on the current building stock, scientific communities are conducting various studies. As a result, the seismic fragility of larger areas is evaluated based on a set of buildings that exhibit several similar characteristics [35]. Rosti et al. [36] studied Italian unreinforced masonry buildings damaged by seismic events over the past 50 years. Del Gaudio et al. [37] studied the seismic vulnerability of the Italian building stock using data from approximately 320,000 units from the Observed Damage Database. Riga et al. [38] conducted a seismic risk assessment at an urban scale using the Capacity Spectrum method, applying this approach to the city of Thessaloniki. Additionally, the applied element model (AEM) has been widely used as a computational method for the analysis of the RC and masonry structures as introduced in the study by Meguro and Tagel-dın [39]. Domaneschi et al. [40] presented a parametric study of different collapse scenarios for 27 masonry buildings using AEM simulations. Sediek et al. [41] studied the collapse behavior of a seismically designed prototype four-story RC moment resisting frame via AEM.
As mentioned above, studies in the literature [28,29,30,31,32,33] examined the seismic performance of the existing RC buildings damaged during earthquakes or the potential impacts of seismic events on the building stock [35,36,37,38]. Unlike these works, as a novelty, in the current study, an old RC building built before the year 2000 was considered. Buildings constructed before the code of TS500 [27] and TBEC-2018 [25] had insufficient reinforcement detailing, material strength, and ductility due to their design principles. The interesting aspect of the current study is that contrary to expectations, not much damage was observed in the load-bearing elements of the building after the earthquake with moment magnitudes of 7.7 and 7.6 Mw. The main motivation of this work is to understand the seismic performance of old, code non-compliant RC buildings that do not comply with earthquake requirements. For this purpose, damage assessment was attempted in the 8-story RC building in Adıyaman province. To understand the local soil characteristics on which the building was built, site investigation data of 3 drilling boreholes and 2 MASW tests in the investigation area were compiled. The behavior of the local geology under real earthquake records was examined with 1D seismic site response analyses. The soil profile was analyzed, and its dynamic behavior was simulated through one-dimensional seismic site response analyses, utilizing real earthquake records from stations closest to the investigation area (TK 4615 Pazarcık and TK4612 Goksun stations). These simulations aimed to determine the earthquake motion at the building’s foundation level, representing a transformed version of the original record due to changes in seismic characteristics influenced by the soil conditions. Then, the numerical model of the building, whose structural features were taken from the architectural and static projects obtained from the local authorities, was developed with SAP2000 [34] and STA4CAD V14.1 [
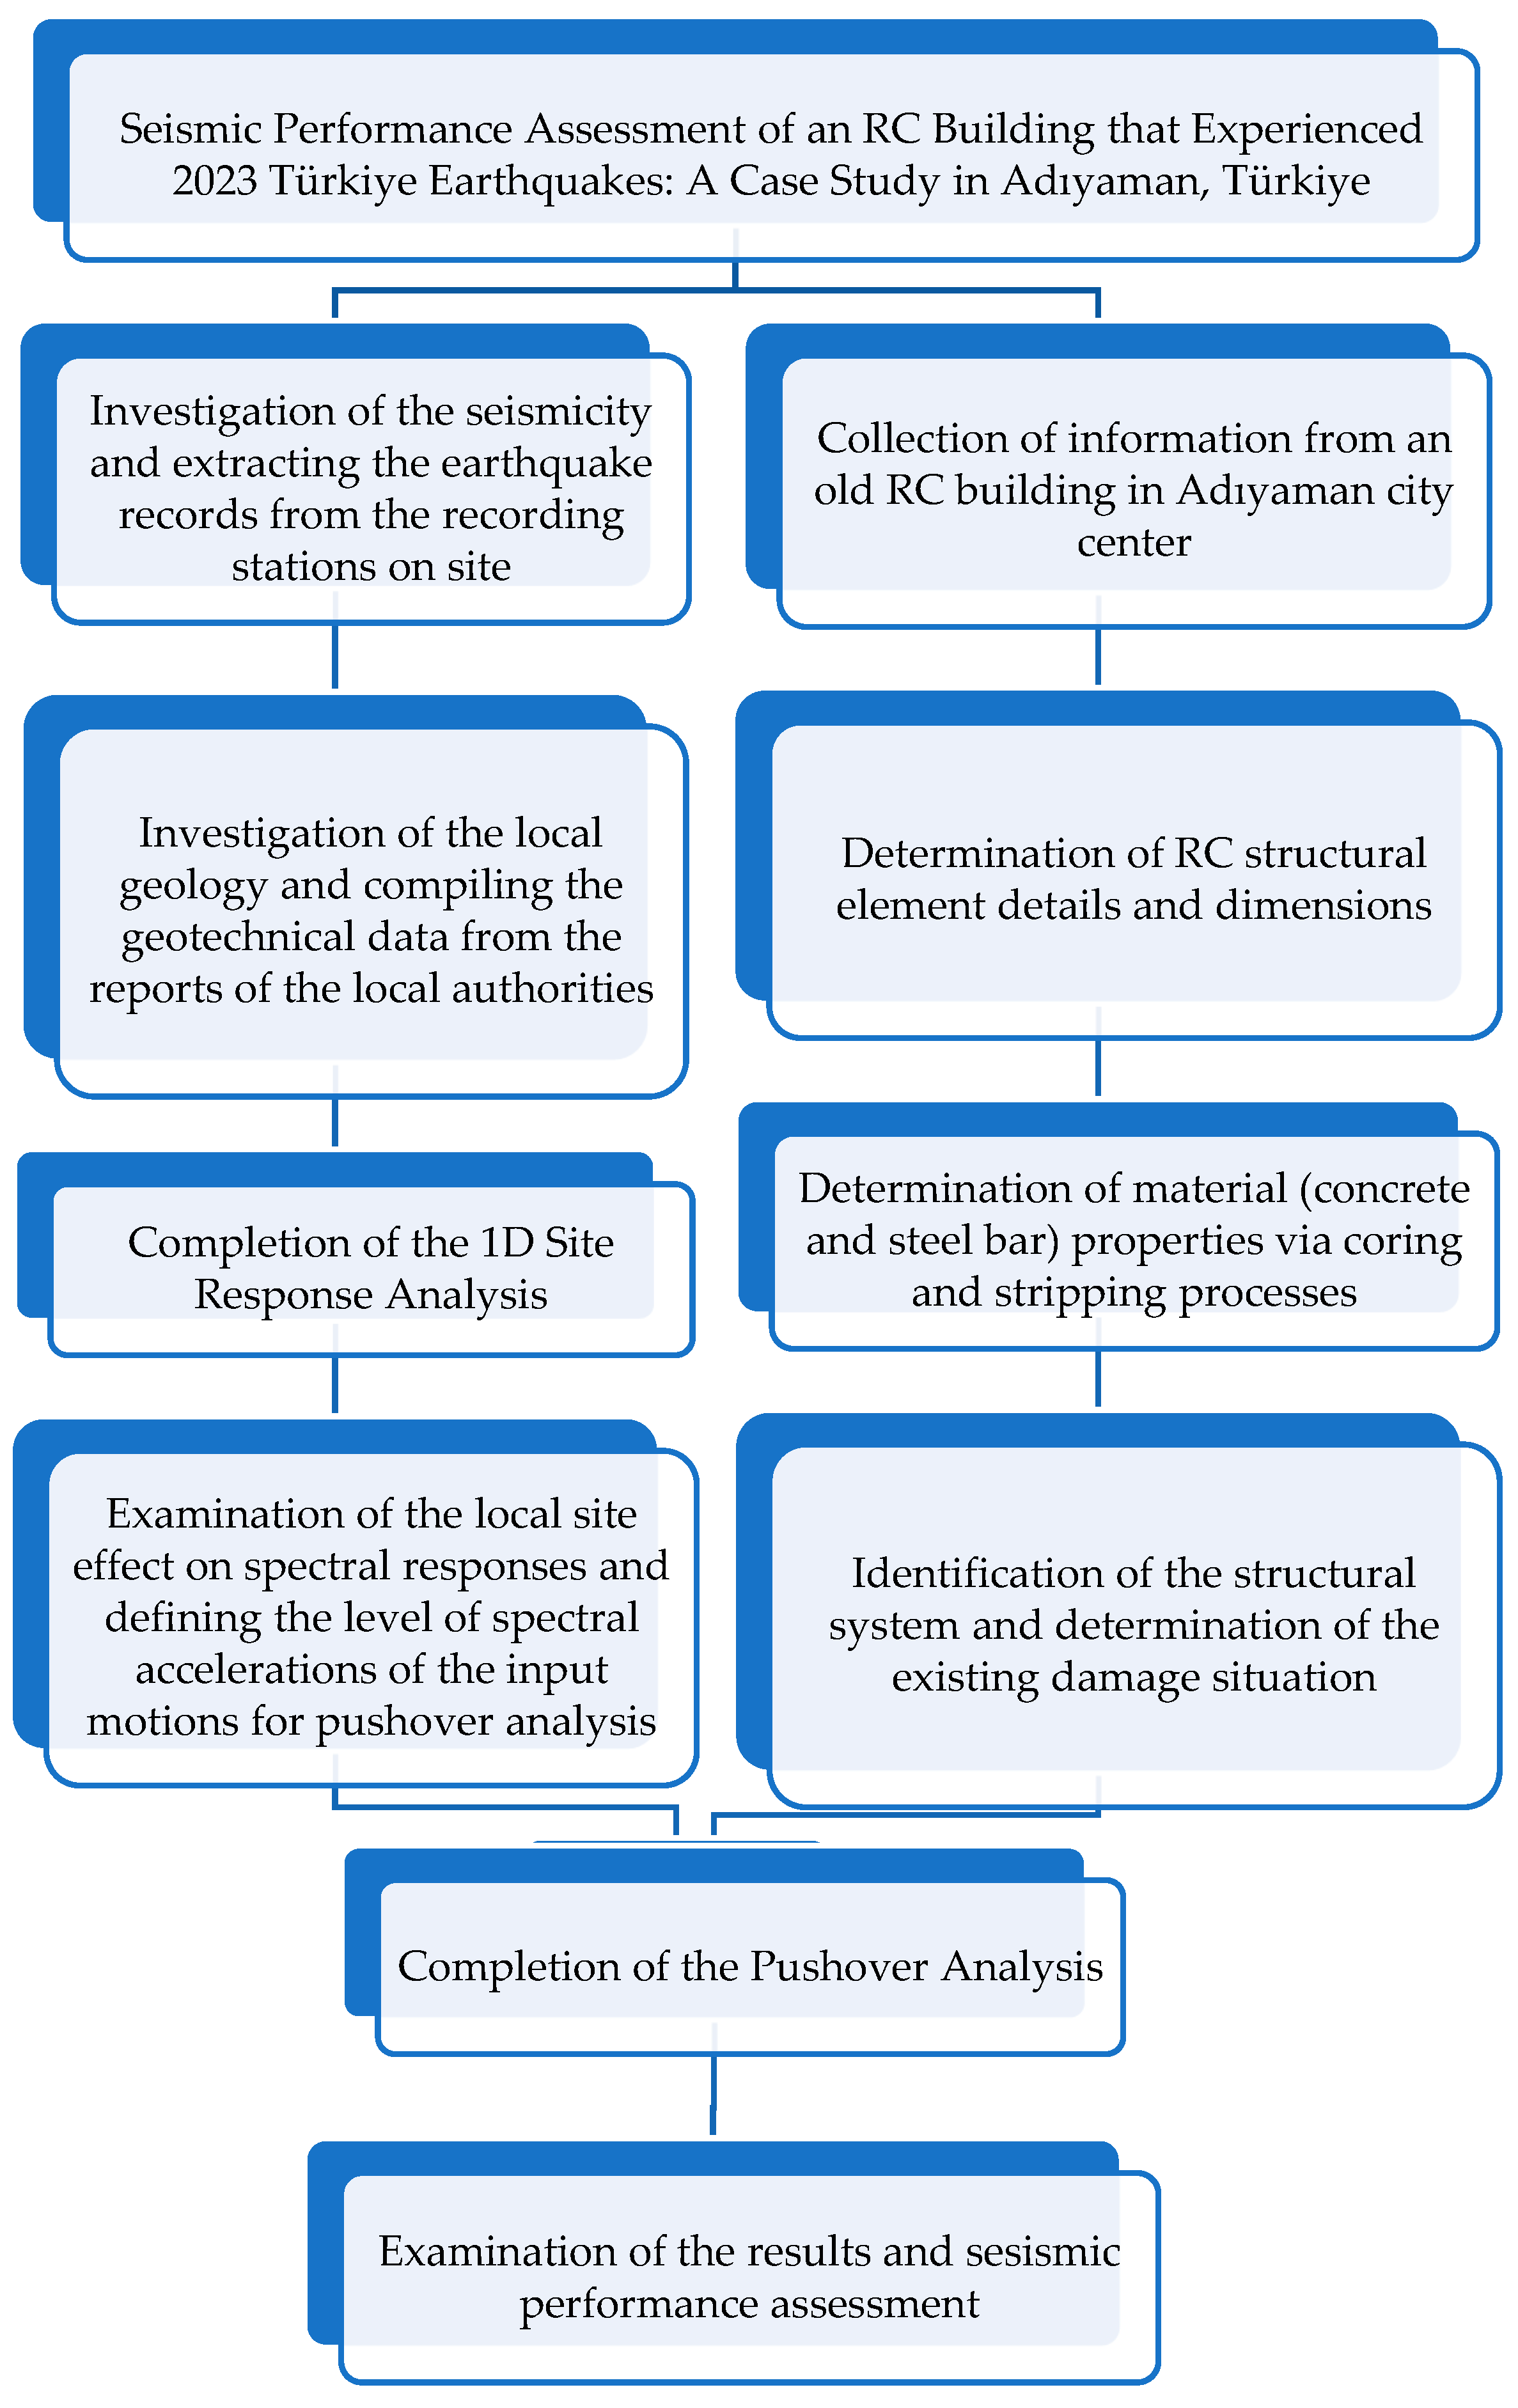
42] finite element software. Performance analyses were conducted using the test results taken from the reinforcement and concrete of the building. Finally, a comparative evaluation was made by considering the results obtained from the performance analysis of the building with the current situation of the building. The flowchart presented in Figure 2 provides a comprehensive summary of the study. It outlines the following key steps: (i) collecting local geological unit information for the study area and obtaining the closest earthquake records from the Pazarcık and Elbistan events, (ii) modeling the ground profile using this data and performing 1D seismic site response analyses, (iii) determining the earthquake record impacting the structure based on spectral acceleration values at the foundation level derived from the 1D analyses, (iv) determining RC structural element details, and (v) conducting a pushover analysis as the final step.

2. Seismicity of the Region and Site Description

Analyzing the seismicity of the study area, including past earthquakes and potential future magnitudes, offers engineering insights for making informed structural decisions and optimizing the functional service processes of structures with similar characteristics already present in the region. The Eastern Anatolian Fault Zone (EAFZ) is a 550 km long left strike–slip fault between the Anatolian and Eurasian plates, consisting of a parallel fault series [43,44,45,46,47,48,49]. It is in a fold–collision zone formed at the boundary between the African and Anatolian plates. This collision causes stress accumulation and earthquake activity along the EAFZ. Historically, large earthquakes have occurred along this fault zone, one of the most seismically active regions of Türkiye, and it carries the risk of major earthquakes. Earthquakes that occurred on the EAFZ in the recent historical period are listed in Table A1 in the Appendix A. These shallow, strong ground motions can potentially cause greater surface shaking and significantly impact structures and infrastructure.
On 6 February, two major earthquakes with epicenters in Pazarcık and Elbistan caused structural damage and destruction in 11 provincial centers and districts, resulting in a loss of life. The epicentral distances of both earthquakes to settlements are given in Figure 3. Both earthquakes occurred at shallow depths (8.6 and 7.6 km). Of all three components, the highest PGA of earthquakes was measured with the EW and NS components (i.e., 2.2 g and 0.65 g) for Pazarcık and Elbistan, respectively. The acceleration time history and response spectra obtained from TK 4615 Pazarcık and TK4612 Göksun stations, where the highest accelerations were recorded, are shown in Figure 4. The striking finding is that earthquakes reach significant acceleration magnitudes in the vertical direction as well as in the two horizontal directions. This situation will also be carefully considered when structural evaluations are made. Accelerations of this magnitude entail that station records be checked repeatedly and eliminated in suspicious cases. For this reason, some station records much closer to the study area were excluded from the evaluation and analysis.

3. Site Response Analysis

Seismic waves travel from the source to the surface level as a result of fault ruptures occurring kilometers below the ground, and during this process, they change depending on the characteristics of the geological environment they pass through. This change in both frequency content and amplitudes causes the structure to be exposed to an earthquake record that is different from the original. The result of this process, known as the “Convolution of Seismic Waves”, is a recorded seismic trace, which is the seismogram. The seismic site response analyses performed in this study are carried out for this purpose, to obtain the seismic wave that will transmit to the structure that has traveled from the source to the foundation base level of the structures.
The soil properties of the investigation area were reached through a detailed site investigation consisting of borehole drillings, MASW, and geotechnical laboratory tests. One-dimensional site response analysis was performed using actual records from the Kahramanmaras earthquake, specifically the TK 4615 Pazarcık and TK4612 Göksun stations, as shown in Figure 4, to simulate the propagation of seismic waves through the soil layers. The distribution of shear wave velocity and soil parameters used in the analysis are schematized in Figure 5. Mathematical models, such as the one-dimensional wave equation, were applied to the soil profile to represent the wave propagation. Time domain non-linear analyses were performed to predict dynamic soil behavior accurately. Non-masing re/unloading rules deviate from this assumption and allow for variations in stress paths during the loading and unloading cycles [50].
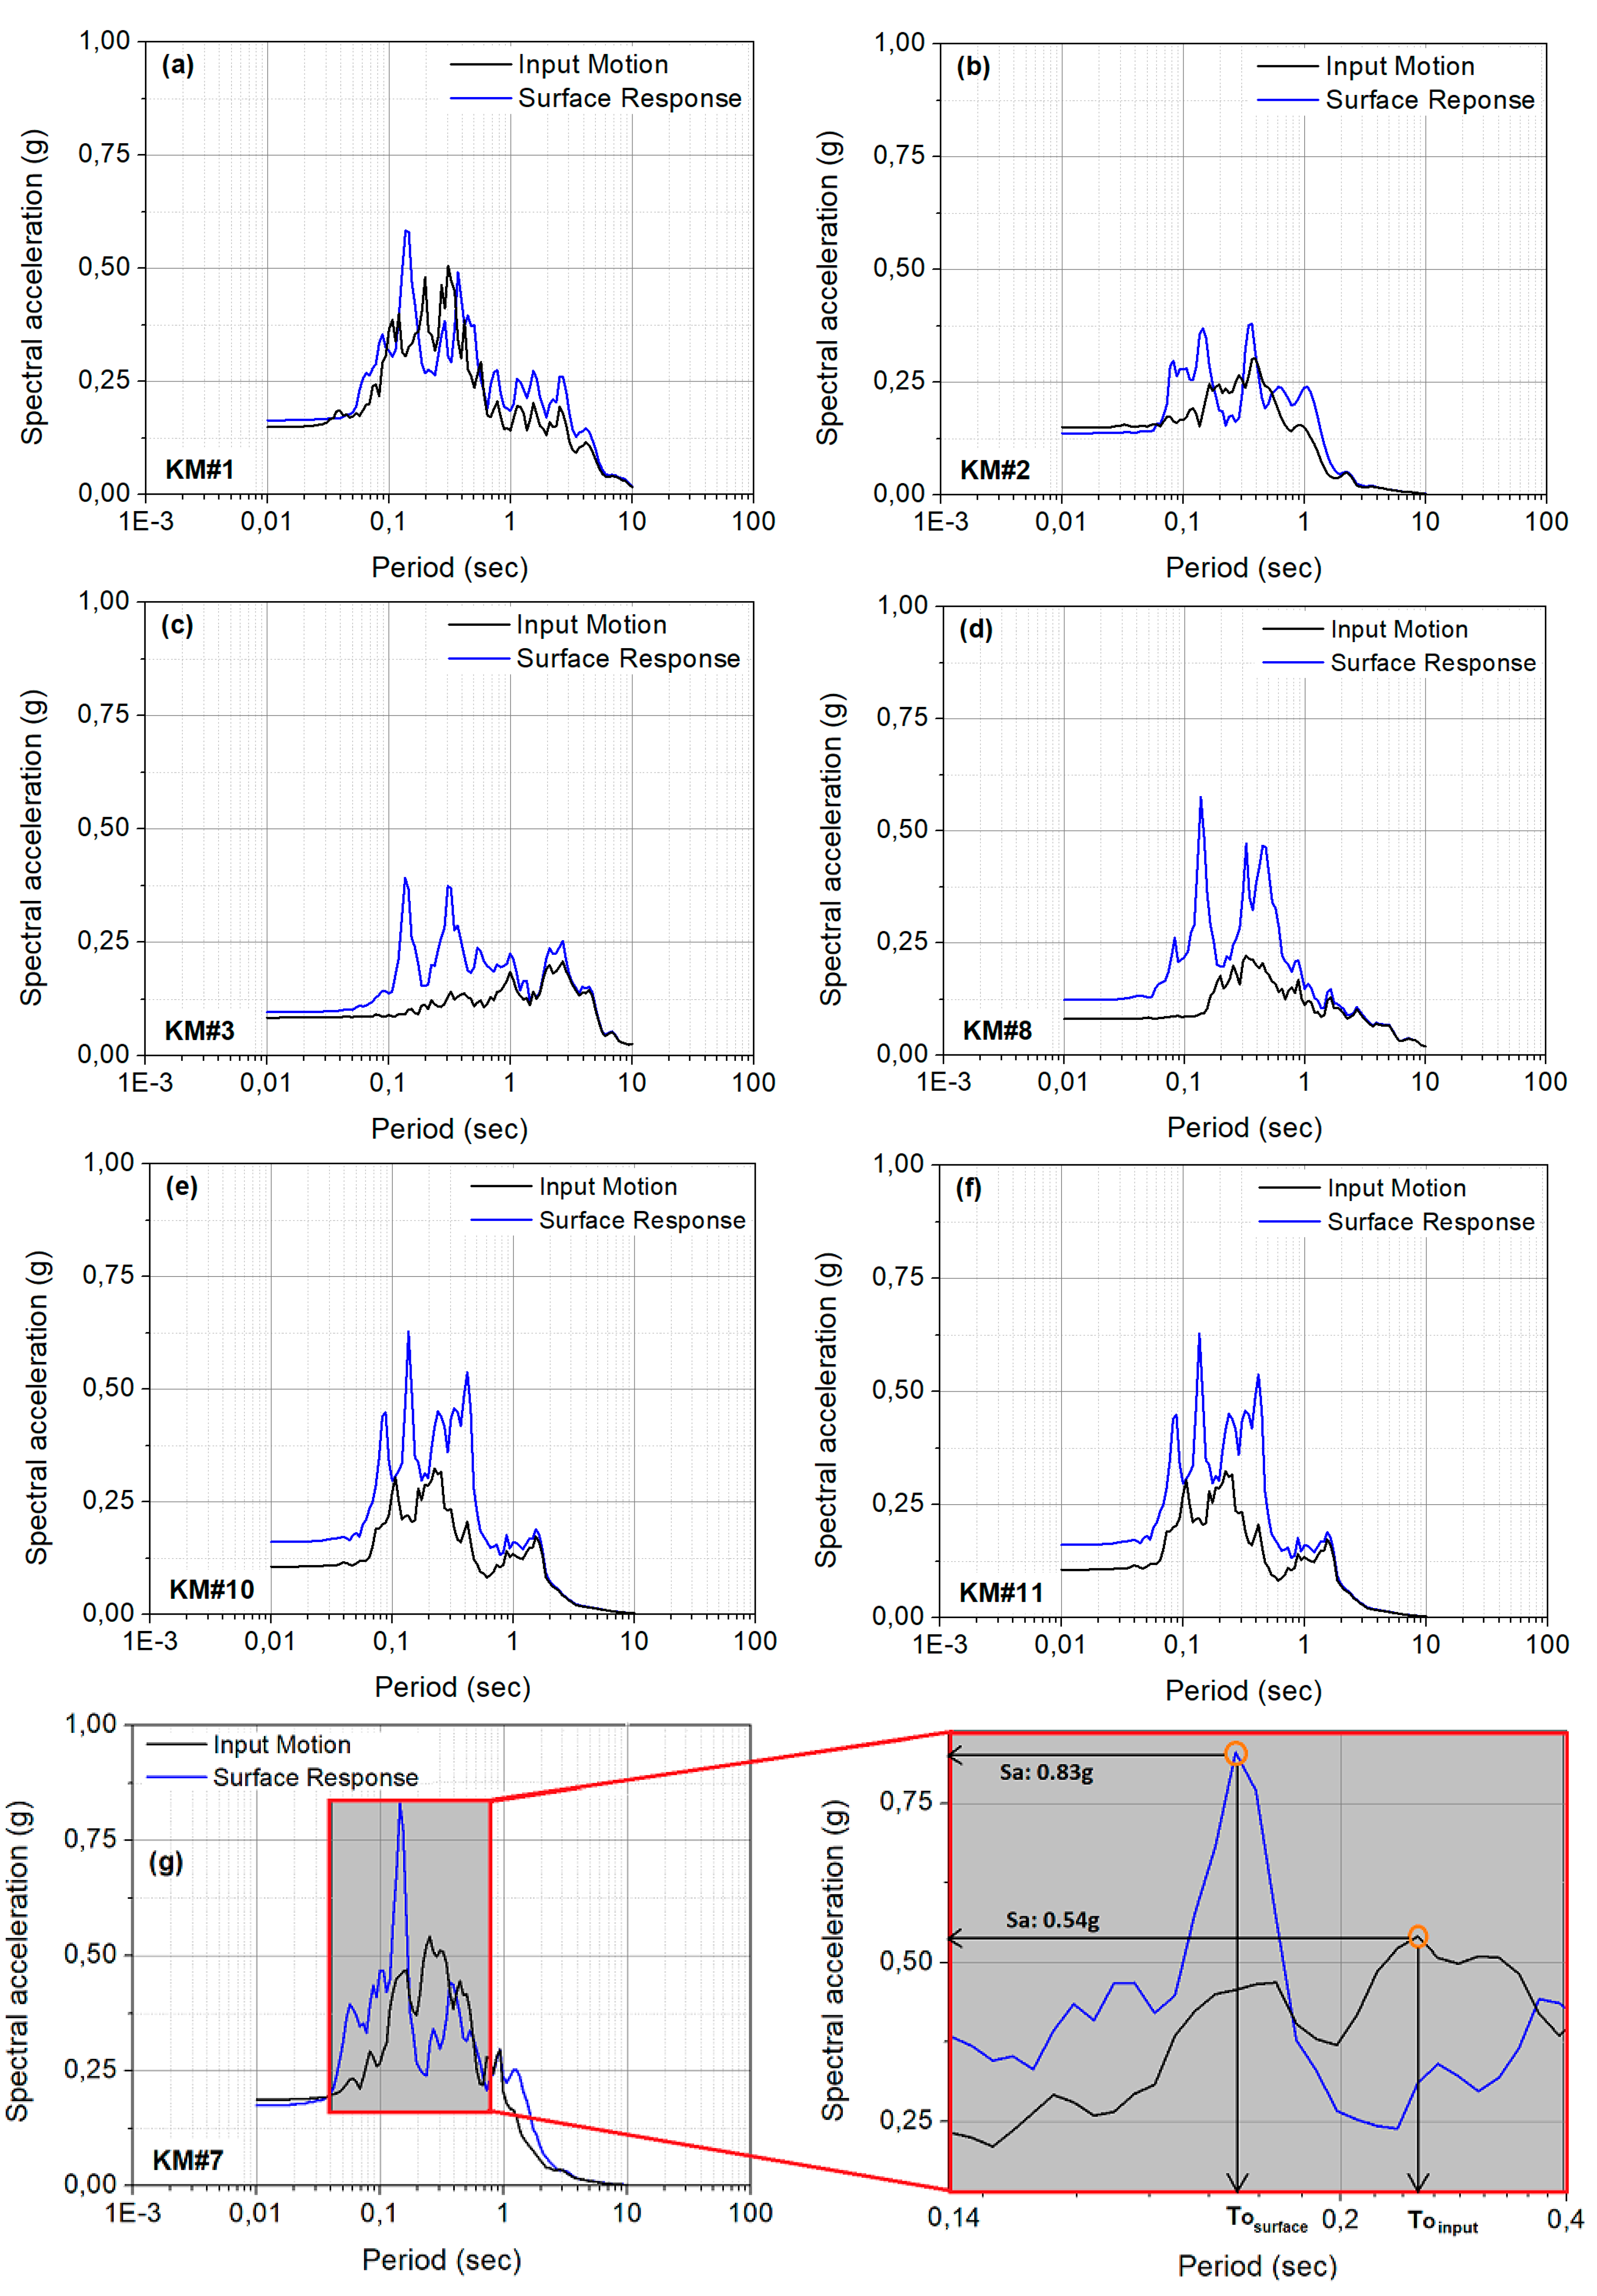
Simulations were carried out under 6th February Kahramanmaraş earthquake excitations (Pazarcık Mw 7.7 and Elbistan Mw 7.6) recorded by several stations of AFAD in the impacted region. The spectral responses demonstrate the amplification of seismic waves under Pazarcık EW earthquake motion by the soil profile (Figure 6). The modeled soil profile herein mainly consists of gravelly and silty clay layers overlying bedrock. It is assumed to be a reason for higher spectral responses [51]. The PGA values of all input motions where the amplification behavior is observed are above 0.75 g. The average shear wave velocity in the upper 30 m of the soil is measured as 218 m/s; hence, the soil is classified as ZD. The Vs30 and the fundamental period are used as predictors of the potential amplification of seismic shaking [52]. The random vibration theory explains the higher amplification of seismic waves with period intervals closer to the natural period of the site [53]. Moreover, depending on the epicentral distance, the thickness of soil layers with higher periods is assumed to be an additional reason for shaking intensity [52]. The predominant vibration period of the soil column is around 0.20 s. The seismic wave was noticeably amplified in the vicinity of this period. The intensity of seismic waves varied significantly based on local site conditions (Figure 6e). The spectral acceleration of the input motion was amplified from 0.54 g to 0.83 g at the surface level, corresponding to a 56% increase and decrease from 0.25 s to 0.15 s. The site’s characteristics, such as soil type, layering, topography, and local geology, can amplify seismic waves. These features affect the dynamic behavior of the soil profile and have significant implications on the performance of superstructures and the frequency content of seismic waves [54]. Lower fundamental periods tend to amplify the energy content at higher frequencies at closer distances [55]. Accordingly, the provisions of building regulations, including the Turkish Building Design Code (TBDY), need to consider those potential site amplifications of the accelerations and shear forces.
The ground motion changes both intensity and frequency content as it propagates through the soil profile [52]. Depending on the specific characteristics of the soil at a given site, there are noticeable variations in ground motion amplification at particular frequency levels [53]. Consequently, different motions are observed, considering factors such as the source (depth and magnitude), motion characteristics (intensity, frequency content, and duration), and geological variability incorporated in the simulations. Thus, the soil column displayed either amplification or attenuation behavior, deviating from the typical response to each motion. When the same soil column was simulated under input motions with high PGA, a deamplification behavior was observed on the seismic waves (Figure 7). The simulations under KM9 motion demonstrated the deamplification of the explicit attenuation on the seismic wave transmitted to the surface layer. The spectral response of the input motion decreased from 1.86 g to 1.30 g, corresponding to 43%. The fundamental period decreased from 0.21 s to 0.15 s, which was also observed. The analyses presented here were carried out under earthquake records with PGAs lower than 0.70 g. However, while PGA is a critical parameter, it lacks information regarding the frequency content and duration of the motion [51]. Therefore, site conditions can influence the duration, amplitude, and frequency content of incoming seismic waves, a phenomenon referred to as the site effect [54]. As seismic waves propagate, their amplitude decreases with distance. This attenuation effect is particularly true for high-frequency waves responsible for the intense shaking that leads to higher peak ground acceleration. Indeed, seismic waves undergo attenuation, meaning a reduction in their amplitude, as they propagate away from the fault plane. This attenuation is frequently dependent on frequency, with high-frequency waves leading to a more significant decrease in amplitude due to inelastic energy loss [55,56].
The site effects caused by the layered geological structure, composed of multi-layered units, were analyzed to determine the spectral accelerations experienced at the foundation level of the structure. Seismic site response analyses conducted in the impact zones of the Pazarcık and Elbistan earthquakes, particularly in the study area of Adıyaman province, reveal the significant role of local ground conditions in influencing structural damage [56,57,58]. Local geological features, such as soft soils or thick sedimentary layers, can amplify seismic waves as they propagate from bedrock to the surface [59]. This amplification increases the seismic demand on buildings, subjecting structural elements to forces that may exceed their design capacities, potentially leading to larger deformations and reduced seismic performance.
Seismic site response simulations, performed to understand how local geology modifies original earthquake records, demonstrate significant variations in spectral accelerations at the foundation level (Figure 6 and Figure 7). For instance, under the Pazarcık earthquake, spectral accelerations at the foundation level exhibited deamplification, decreasing from 0.83 g to 0.54 g. (Figure 6). Conversely, under the Elbistan earthquake, significant amplification was observed, with spectral accelerations increasing from 1.30 g to 1.56 g (Figure 7). These findings emphasize the importance of site response analyses in understanding site-specific seismic effects on the building prior to the pushover analysis. To observe the impact of this notable phenomenon on structural behavior, pushover analysis was conducted, where the acceleration levels at the base of the structure were applied, both reduced and amplified. This is crucial for understanding the ultimate effects of soil–structure interaction on structural behavior, which is one of the main motivations of the study.

4. Structural Properties of RC Building

Significant destruction and widespread collapses were particularly noted in the city center and surrounding areas of Adıyaman due to the earthquakes centered in Kahramanmaraş. It is important to note that the buildings constructed based on TEC-1975 [22] were the most severely damaged and collapsed in the areas affected by the earthquakes centered in Kahramanmaraş. This can be attributed to the fact that the total horizontal earthquake load on structures defined by TEC-1975 [22] is based on a simplified formulation, whereas TBEC-2018 [25] explains this load using various methods that consider multiple parameters. According to a report prepared by the Strategy and Budget Directorate of the Presidency of the Republic of Türkiye, the Ministry of Environment, Urbanization, and Climate Change conducted damage assessment studies that revealed the following for Adıyaman province: 56,256 houses were assessed as needing urgent demolition, having been destroyed, or deemed severely damaged, while an additional 18,715 houses were categorized as having moderate damage [60].
An examination of the building stock in the city center of Adıyaman reveals that most medium-height reinforced concrete buildings (ranging from 1 to 12 floors) were constructed according to earthquake-resistant structural design principles of the building design code in force at the time of construction and thus received engineering services. The structural systems employed in these buildings are primarily pure frame and shear-frame (mixed) designs. However, significant damage and widespread collapses have been observed in these structures, largely due to issues with materials and workmanship. Additionally, it has been noted that designers tend to favor hollow block flooring systems over beamed plate flooring in reinforced concrete constructions. It has been found that wholesale collapses or severe damage often occur in buildings with hollow block flooring systems when there are insufficient shear walls to manage horizontal loads. Although chosen for its architectural advantages, this type of flooring has led to high casualty rates in affected buildings.
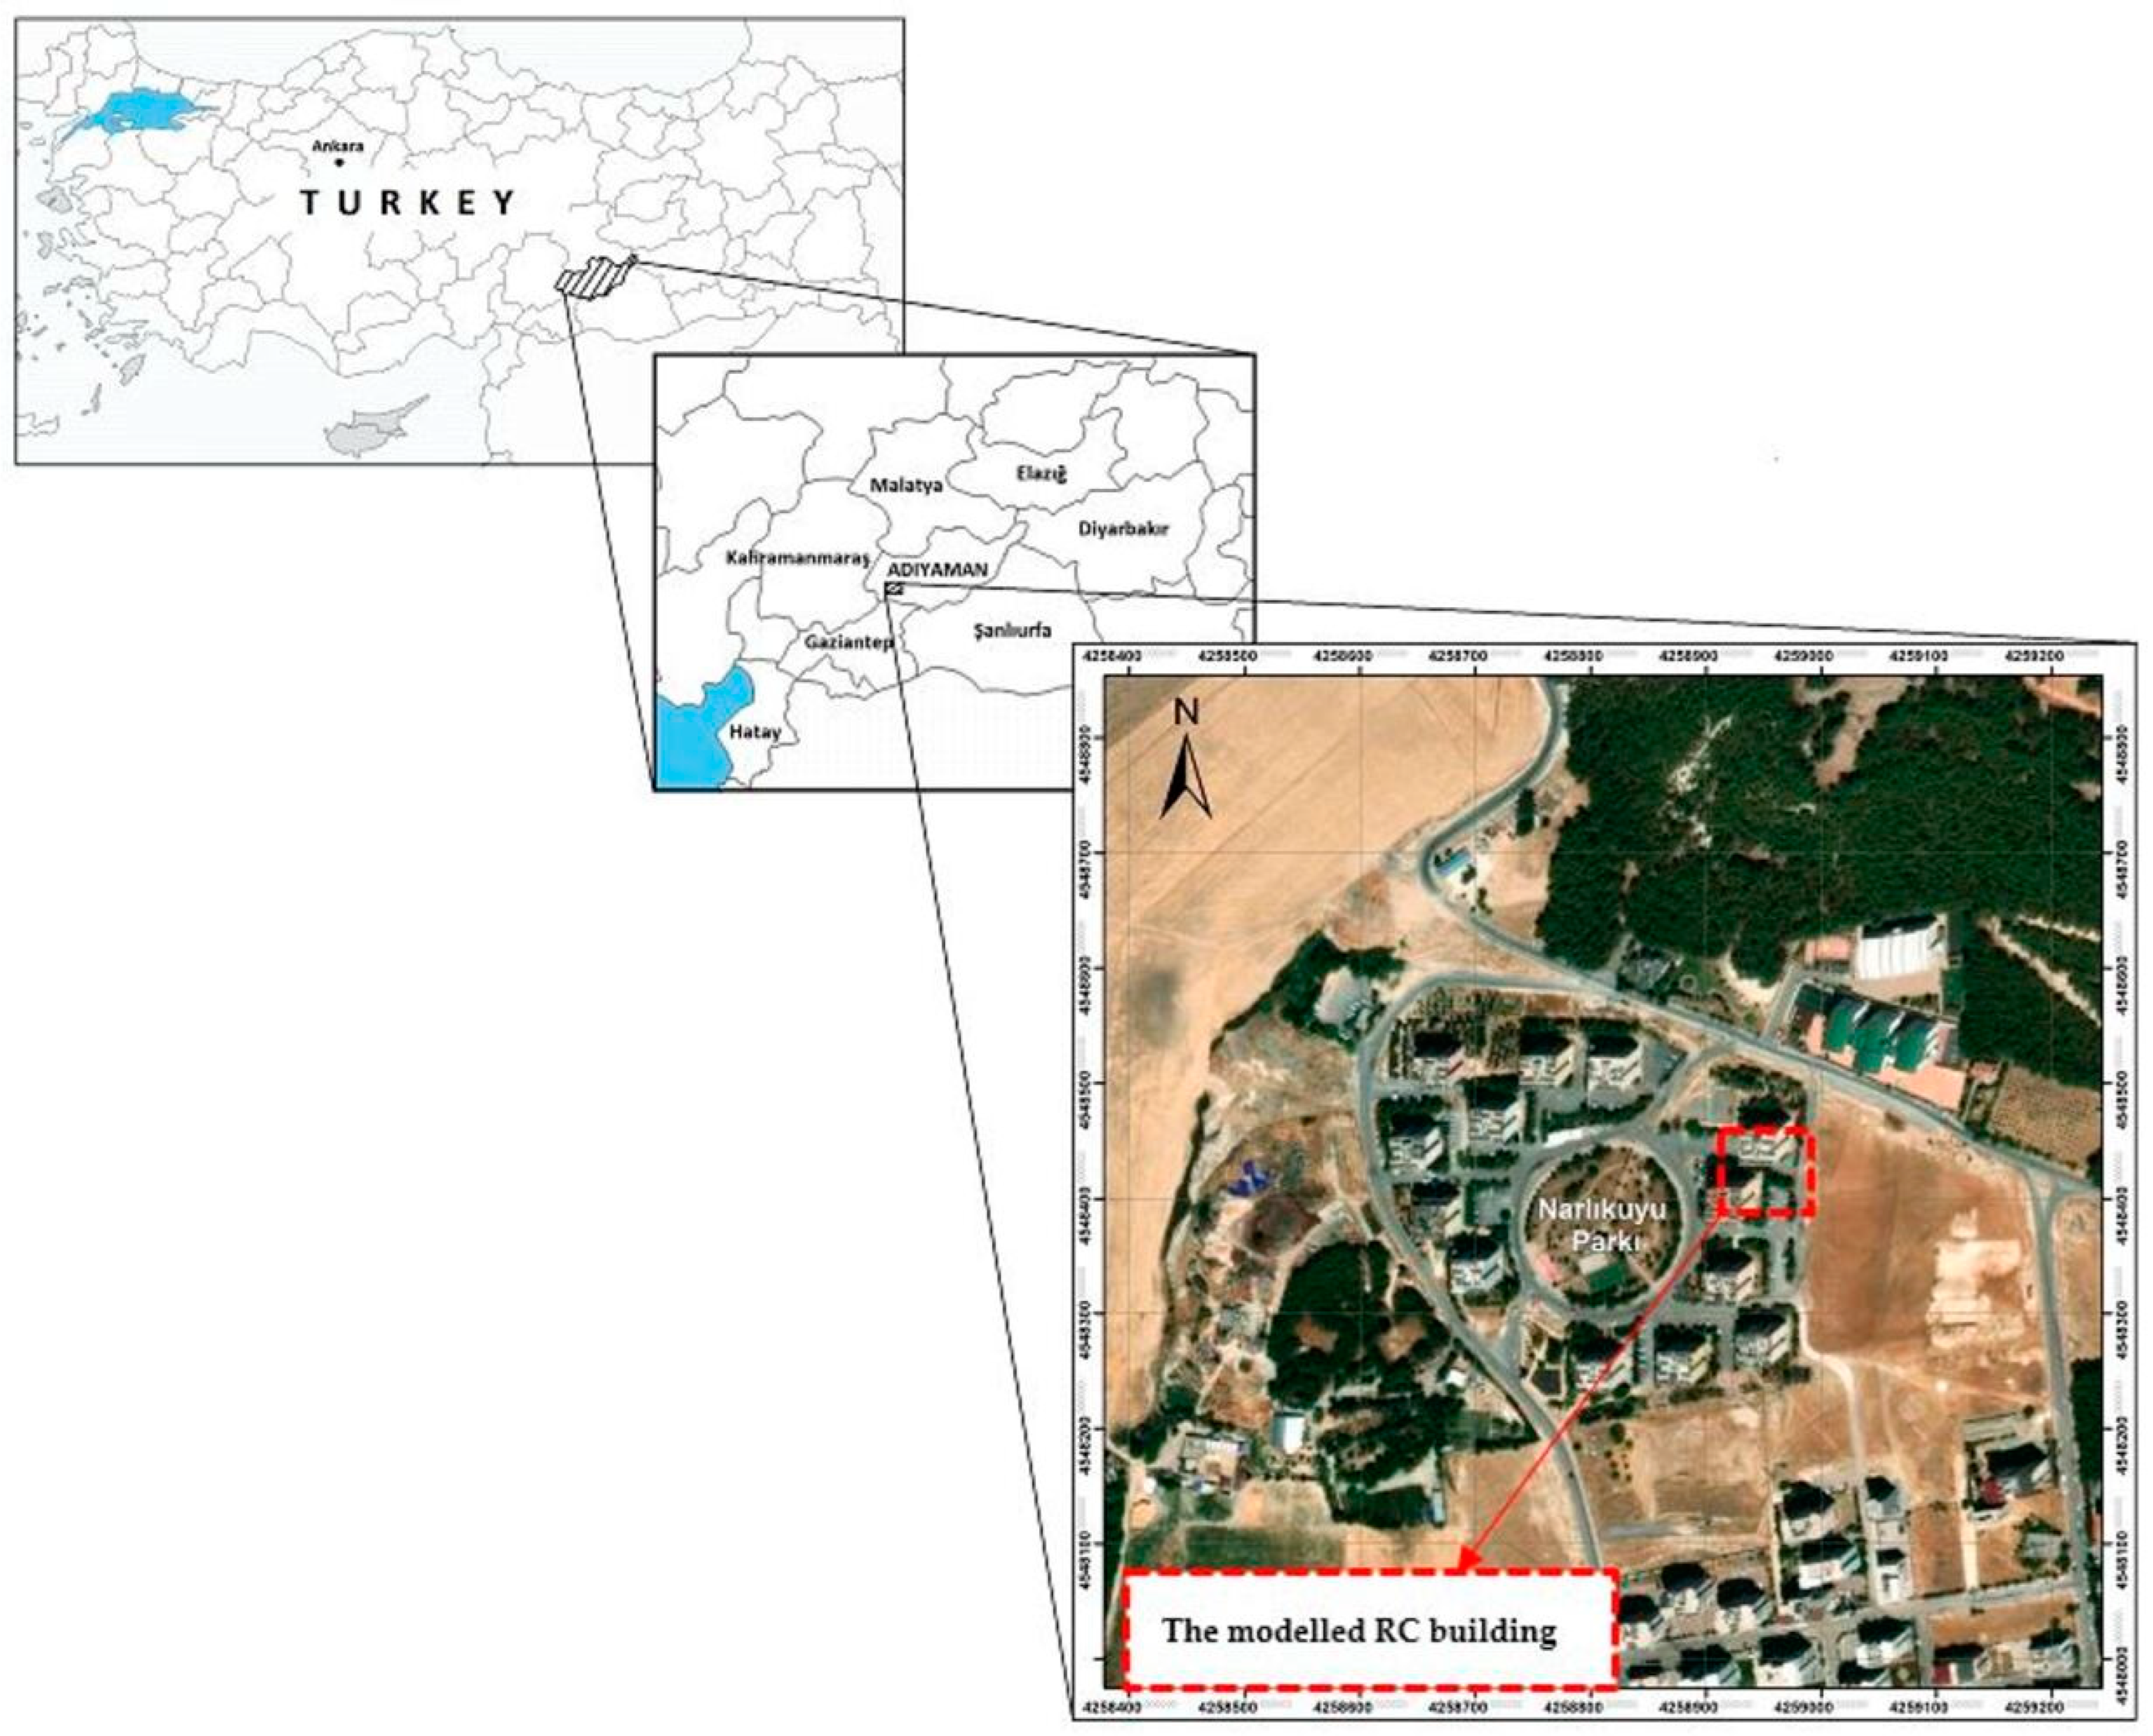
The building analyzed is located in the Central District of Adıyaman City (Figure 8). The total area of the building is calculated to be 4043 m2. The building consists of a basement and eight normal stories. The construction year of the building is 1999, and the TEC-1998 [23] code is used in the design of the building. Many multi-story reinforced concrete structures in the study area with similar properties have reached almost half of their economic lifespan. It is important to note that this building exhibits distinct characteristics within the city’s building stock.
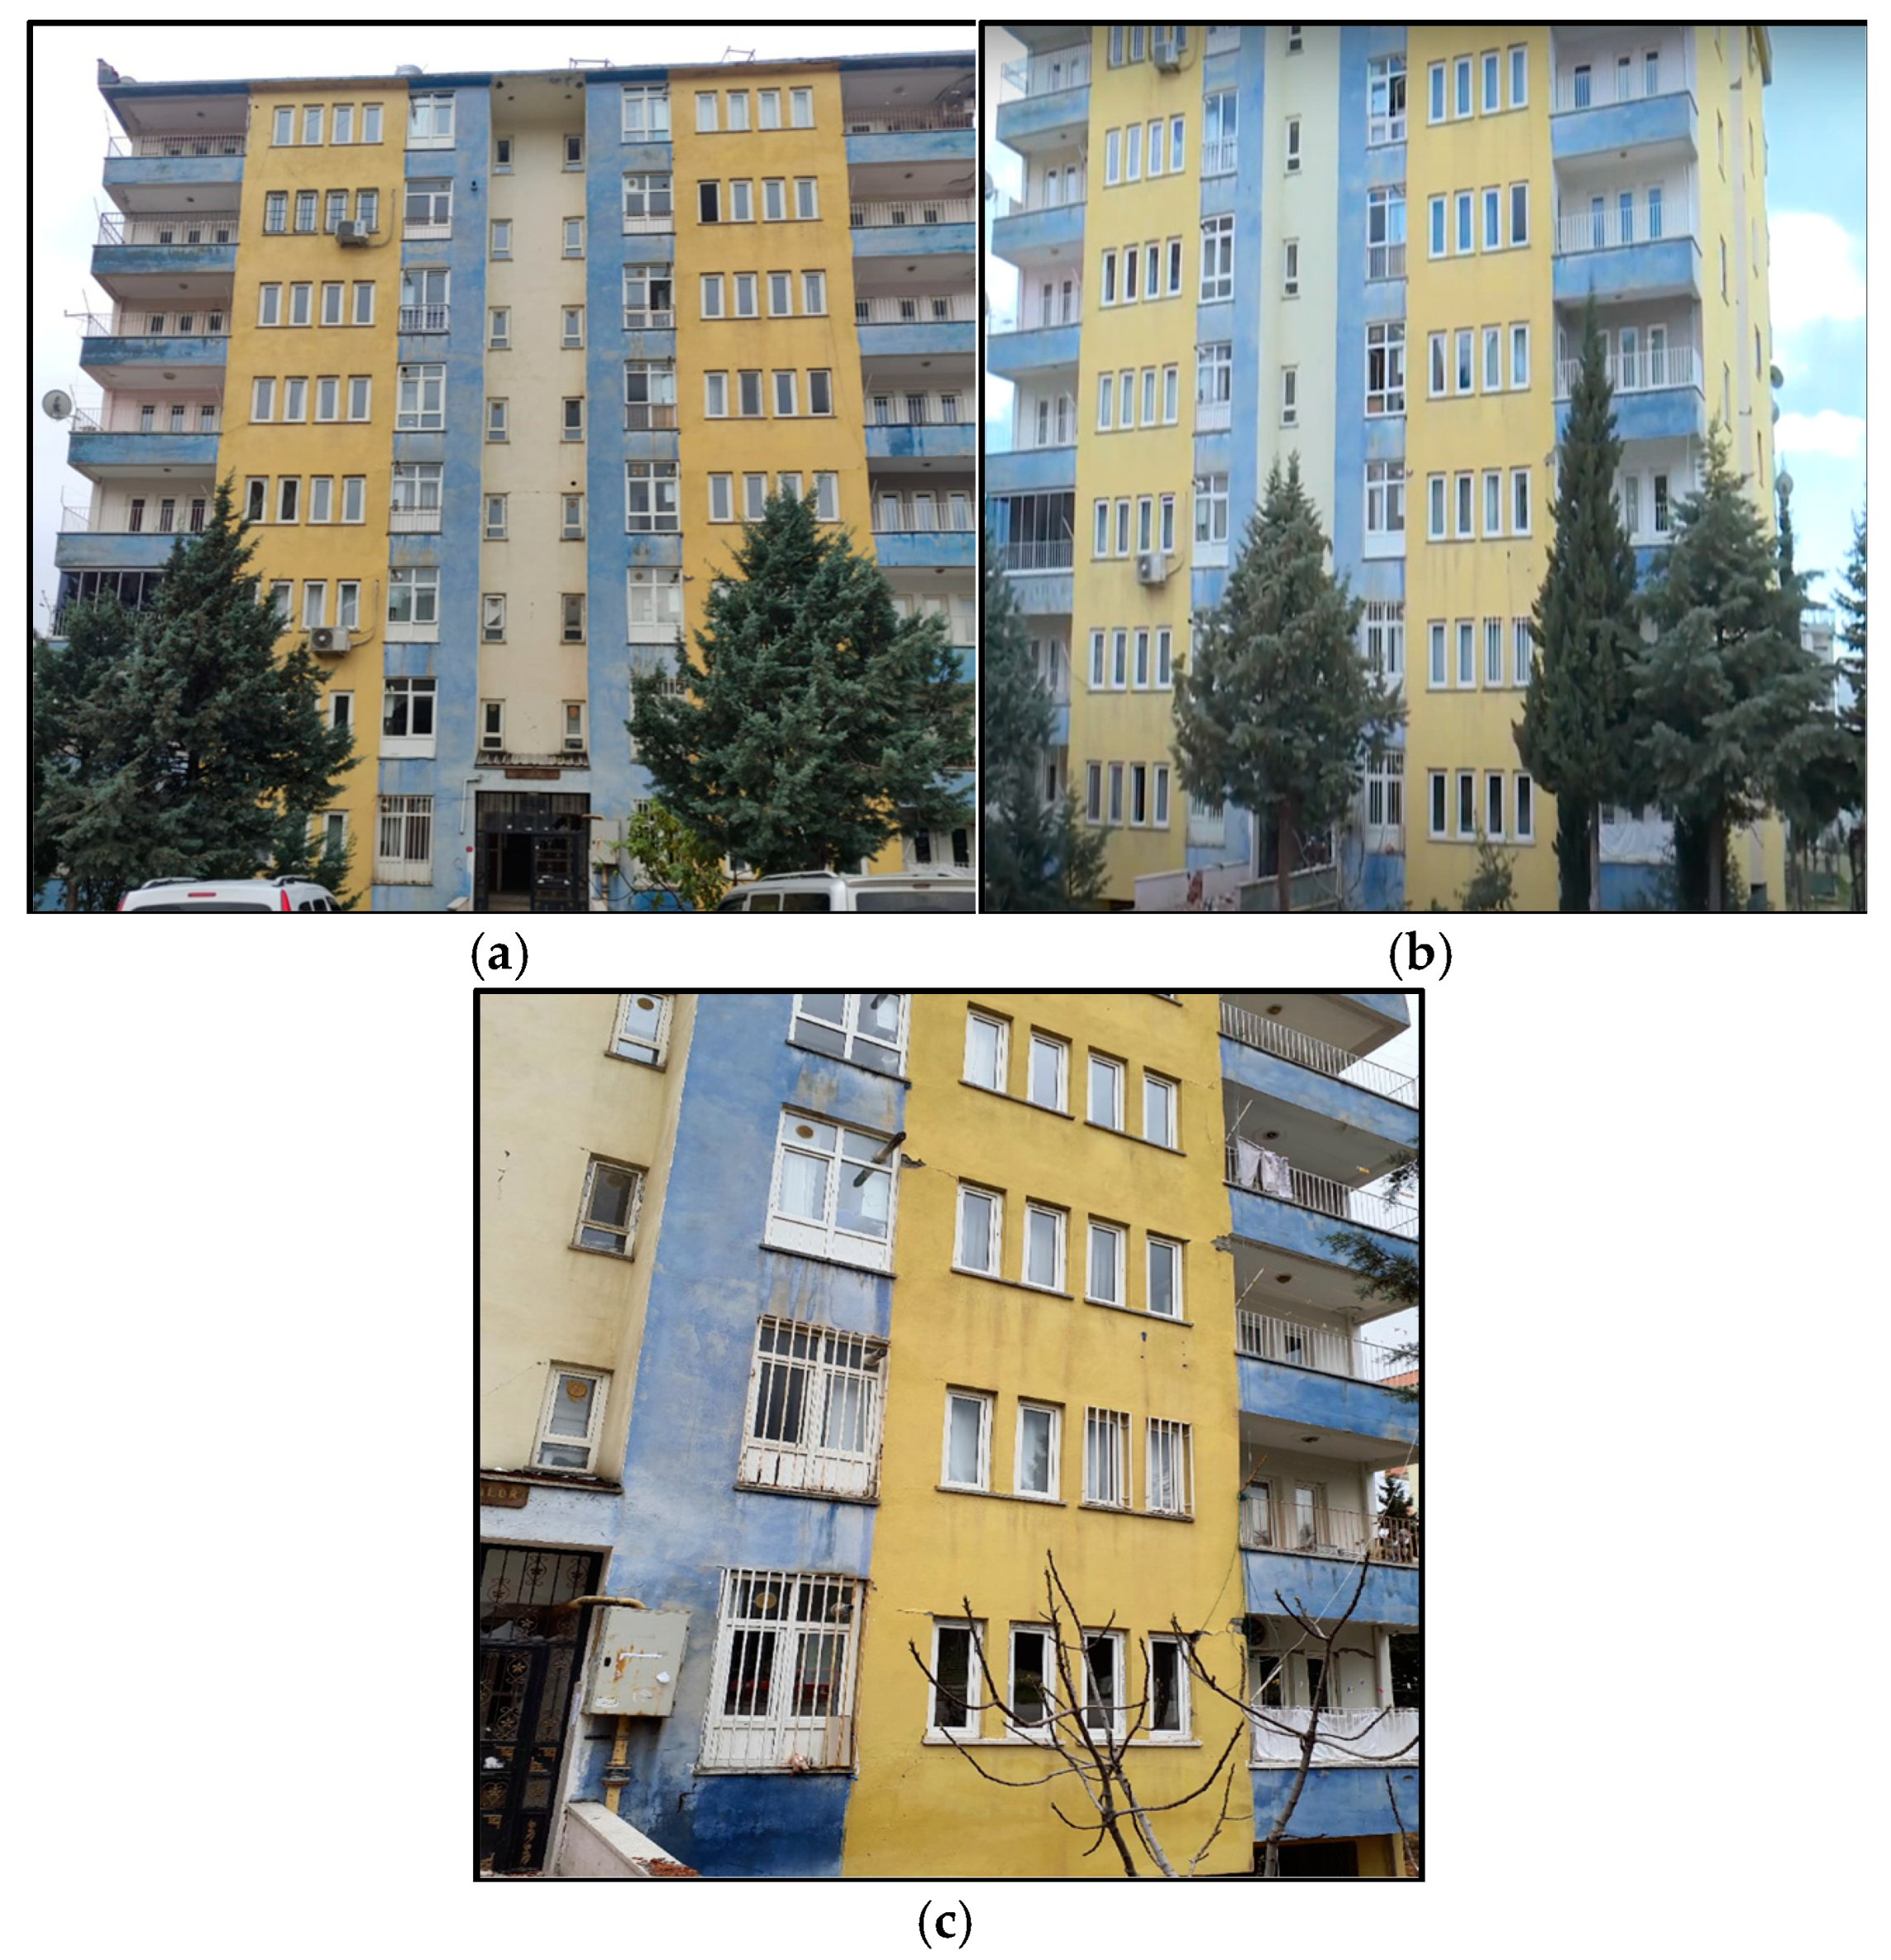
The analyzed RC building is located in the central district of Adıyaman. The construction year of the building was 1999, and it was built on a continuous foundation. It consists of one basement + one ground + seven normal floors; its total height over the ground is 24.0 m. The floor height of the building is 3 m. The view of the building constructed in 1999 is shown in 
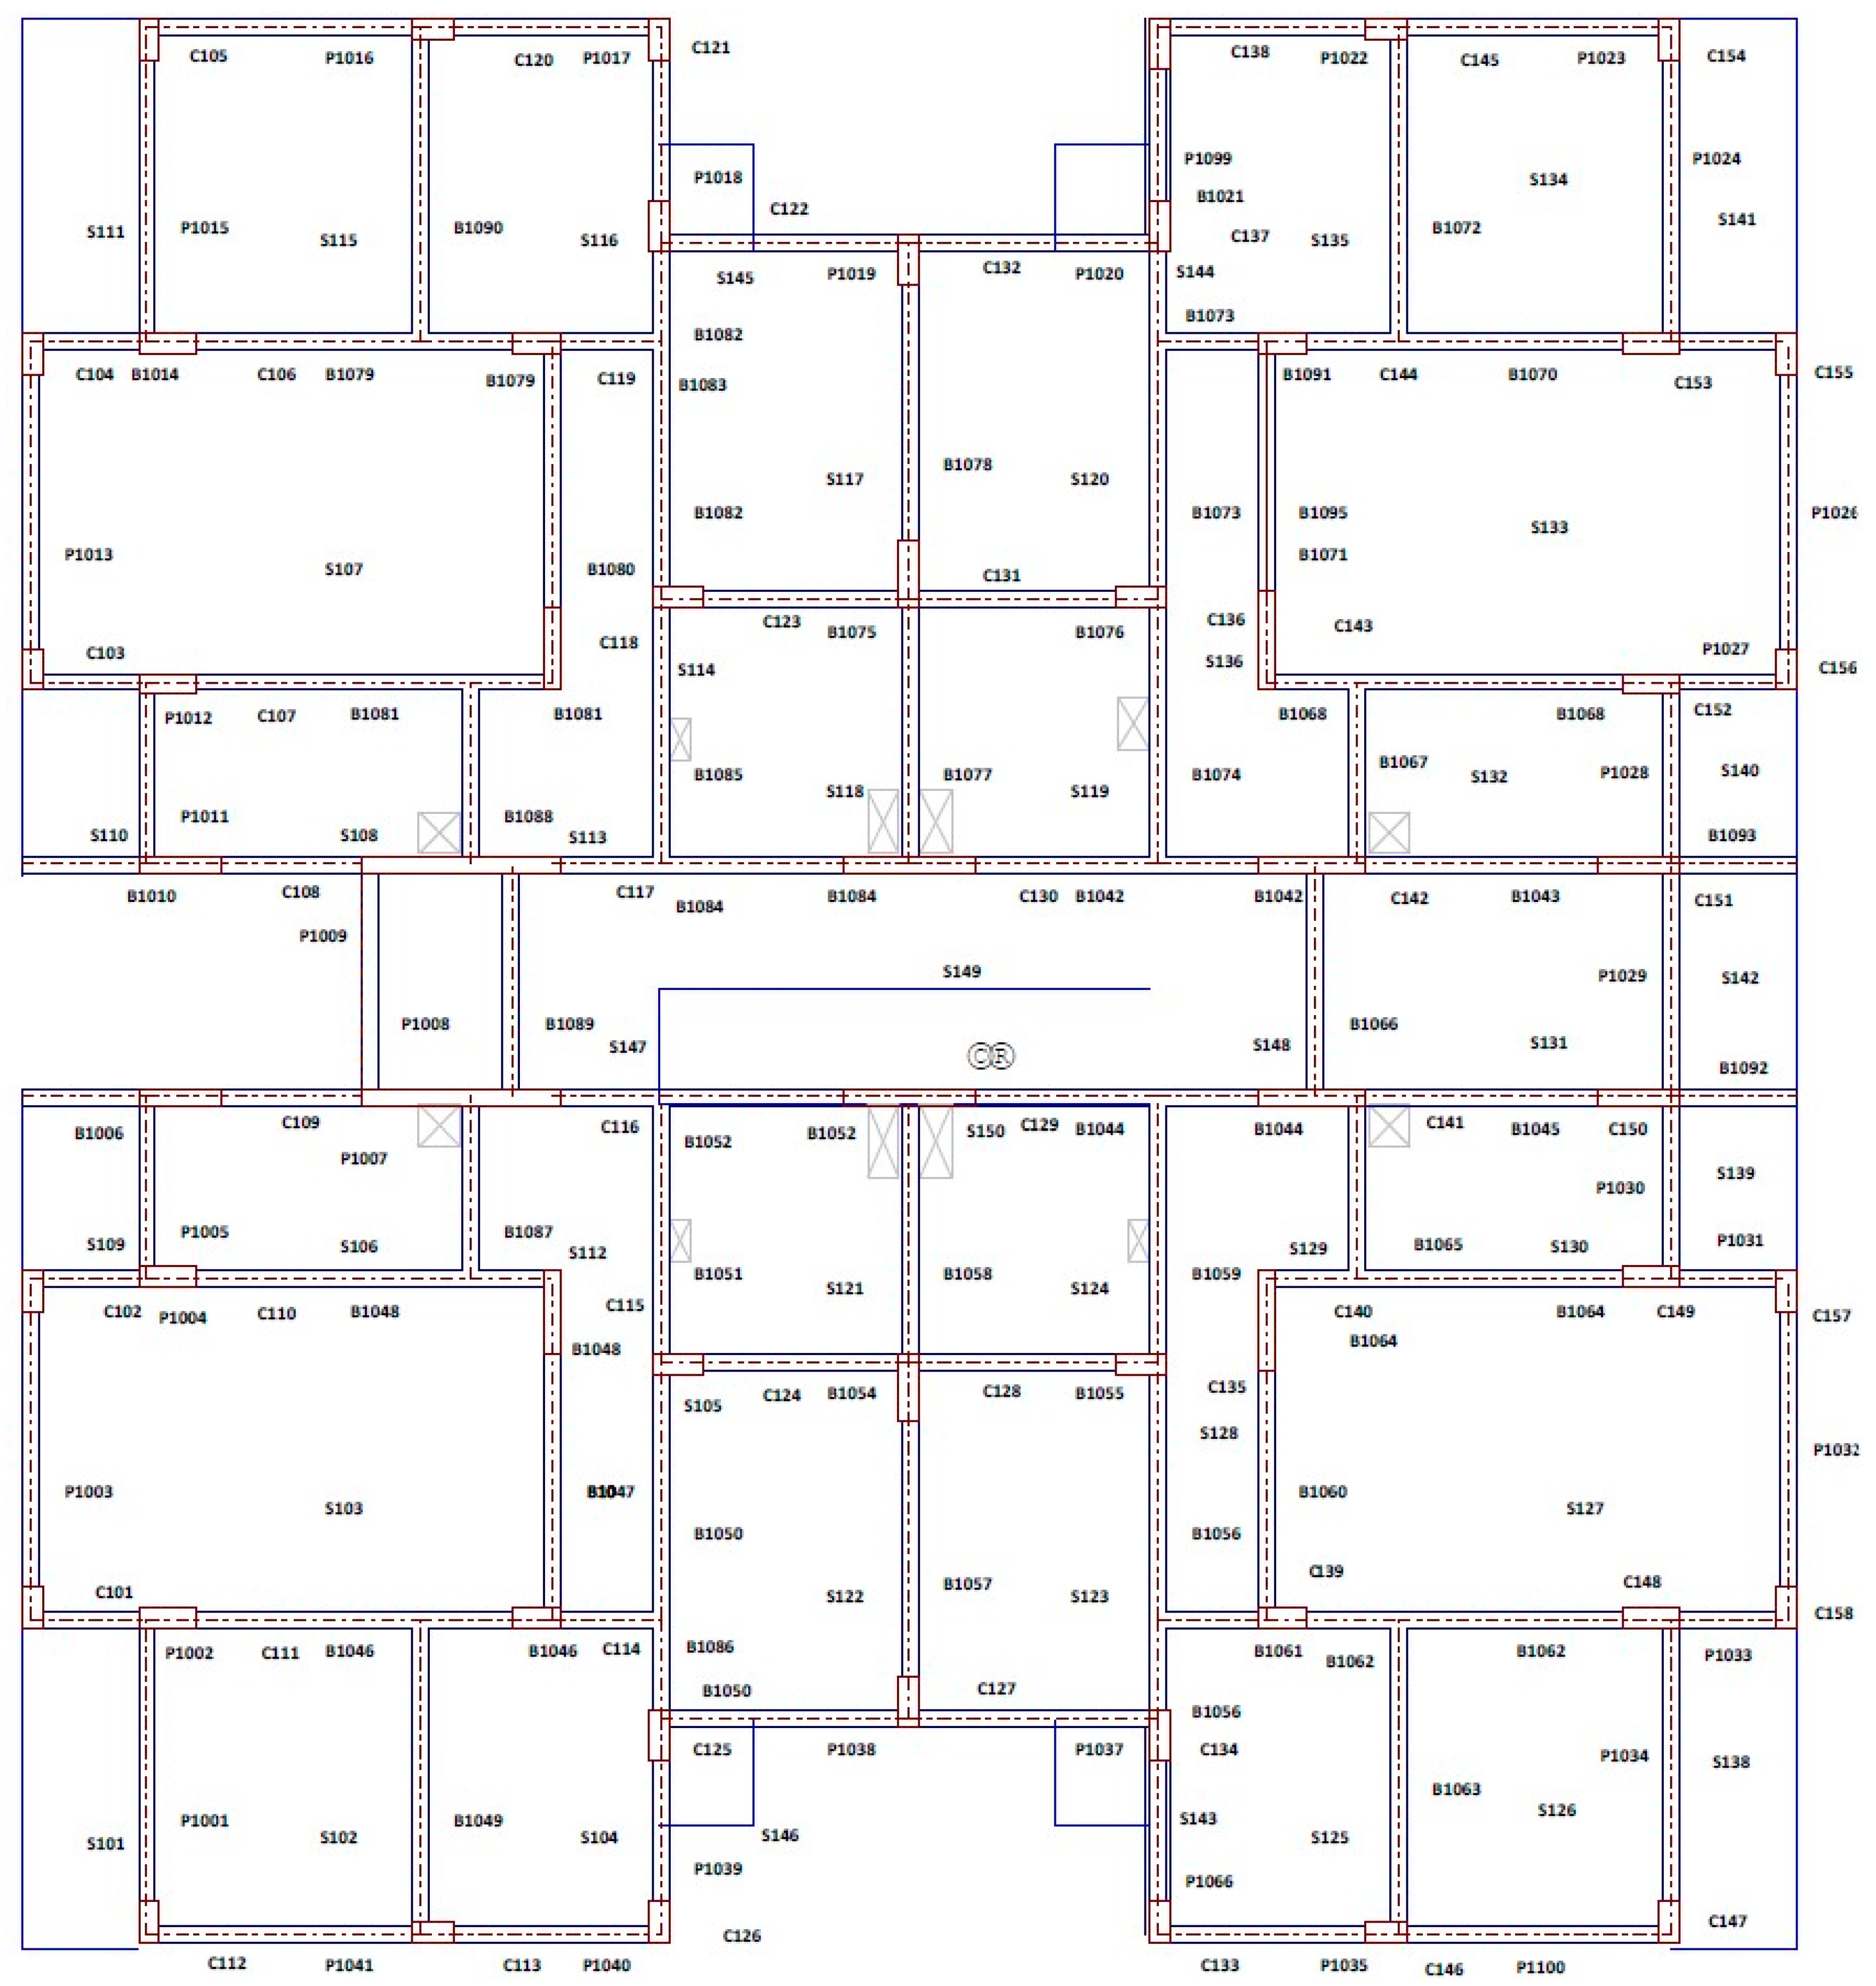
Figure 9a–c. The load-bearing system is formed with RC frames, and the floor system is made of a beam-RC plate with a slab thickness of 12 cm. The normal floor plan of the related building is given in Figure 10. Moreover, the cross-sectional dimensions and reinforcement details of the columns and beams determined by the stripping process are presented in Table 1.
Performance analysis studies were carried out for the existing reinforced concrete structure with moderate damage after the earthquake, as described in TBEC-2018 [25]. It is very important to determine the material (concrete and steel bar) properties in the evaluation of the performance analysis of the existing structure. Coring and stripping processes were performed on the structural elements on each floor of the building, and the locations of the structural elements are presented in Table 1 and Table 2. The characteristic compressive strength of the existing building was determined by taking three drilling cores from the columns on both basement and ground floors and two from the other normal floors (Figure 11a and Table 2). The test results of these 20 samples with 82 mm diameter and 82 mm height are evaluated according to TBEC 2018 [25]. The concrete compressive strength of the building was determined to be 8.81 MPa and used as 8.81 MPa in the performance analysis. In the seismic code used during the construction of the existing building, the minimum design concrete strength is stated as 14 MPa, while it is determined to be 18 MPa in the building project. It is thought that the compressive strength of the existing concrete is low due to the lack of ready-mixed concrete technology during construction, insufficient concrete curing process, and durability problems. To determine the reinforcements, the core cover of the columns from which the core samples were taken was stripped, and the ultrasound device measured the stirrup spacings. It was observed that while ribbed bars were used in the longitudinal reinforcement of the RC structural elements of the building, the transverse reinforcement was plain (Figure 11b). Moreover, the characteristic yielding strength of reinforcement bars was 420 MPa and 220 MPa. Therefore, it can be said that based on the properties of the existing old RC building, it has a low compressive strength of concrete, and there are problems with the reinforcement detailing, including the use of plain transverse reinforcement. These situations are important examples of the design and structural errors of the existing old building. In fact, as a result of the performance analysis studies conducted for the existing moderately damaged building, demolition was decided by the relevant municipality, especially due to the insufficient quality of concrete.
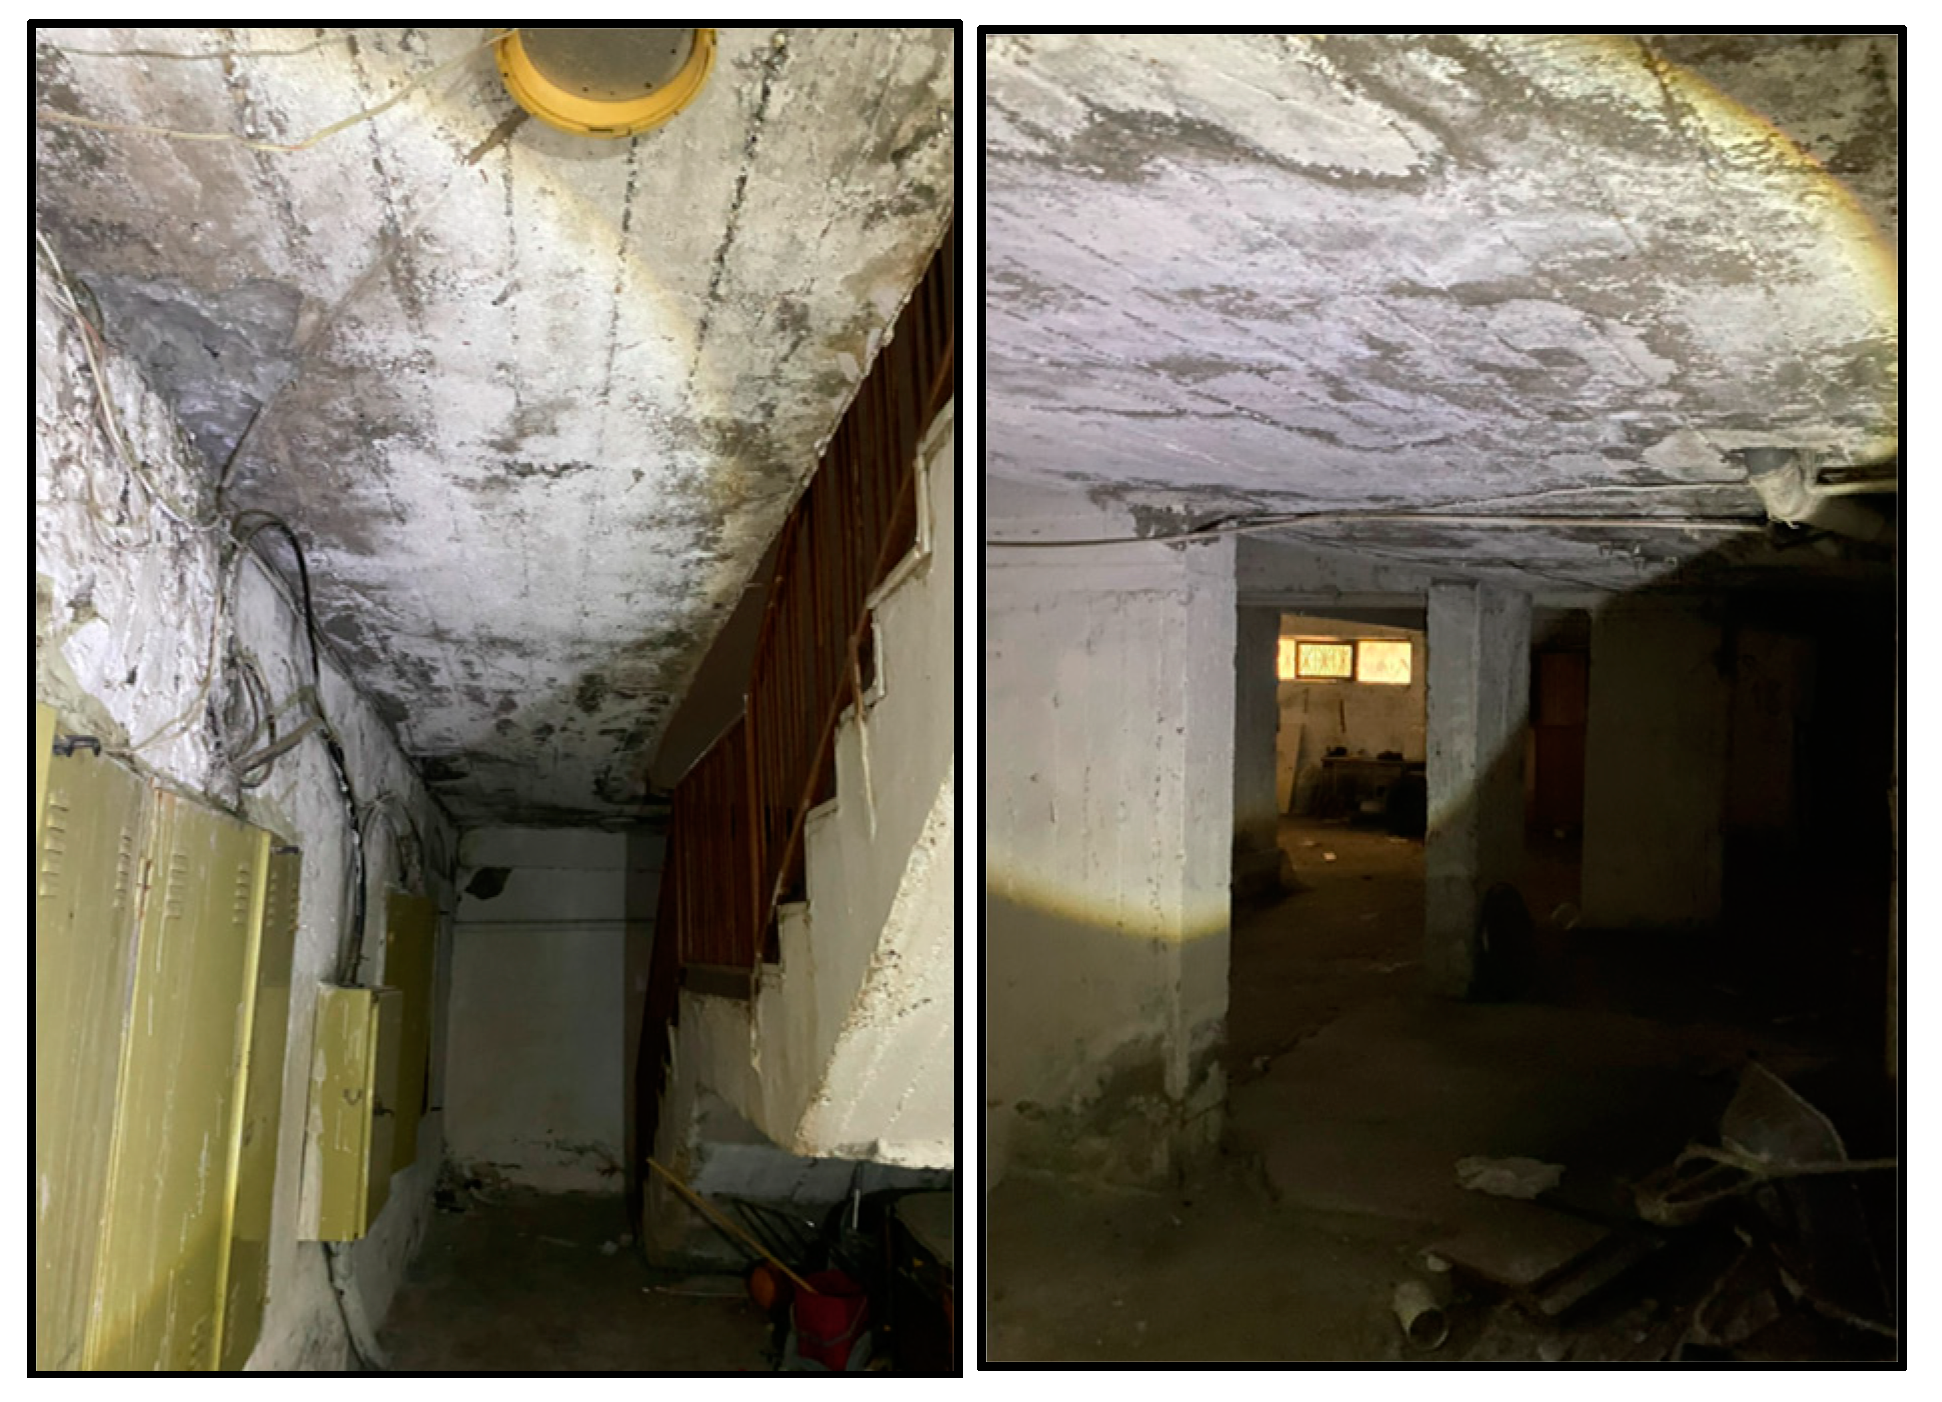
Efflorescence, an important durability problem in concrete, was also observed on the basement floor, as shown in Figure 12. It is a crystalline deposit that appears as a white stain on the concrete surface and is associated with humidity. The occurrence of efflorescence is caused by having soluble salts in concrete aggregate or mixing water. The optimum humidity conditions within the concrete pores, combined with these factors, contribute to its formation. Water migrates due to hydrostatic pressure, leading to superficial evaporation, which allows salts to accumulate on the concrete surface. This accumulation can result in a reduction in the concrete’s strength.

Observed Damages

Following two earthquakes with moment magnitudes of 7.7 and 7.6 Mw in Kahramanmaraş on 6 February 2023, an old RC building described in the above section was selected to be analyzed as a result of the on-site investigations in Adıyaman.
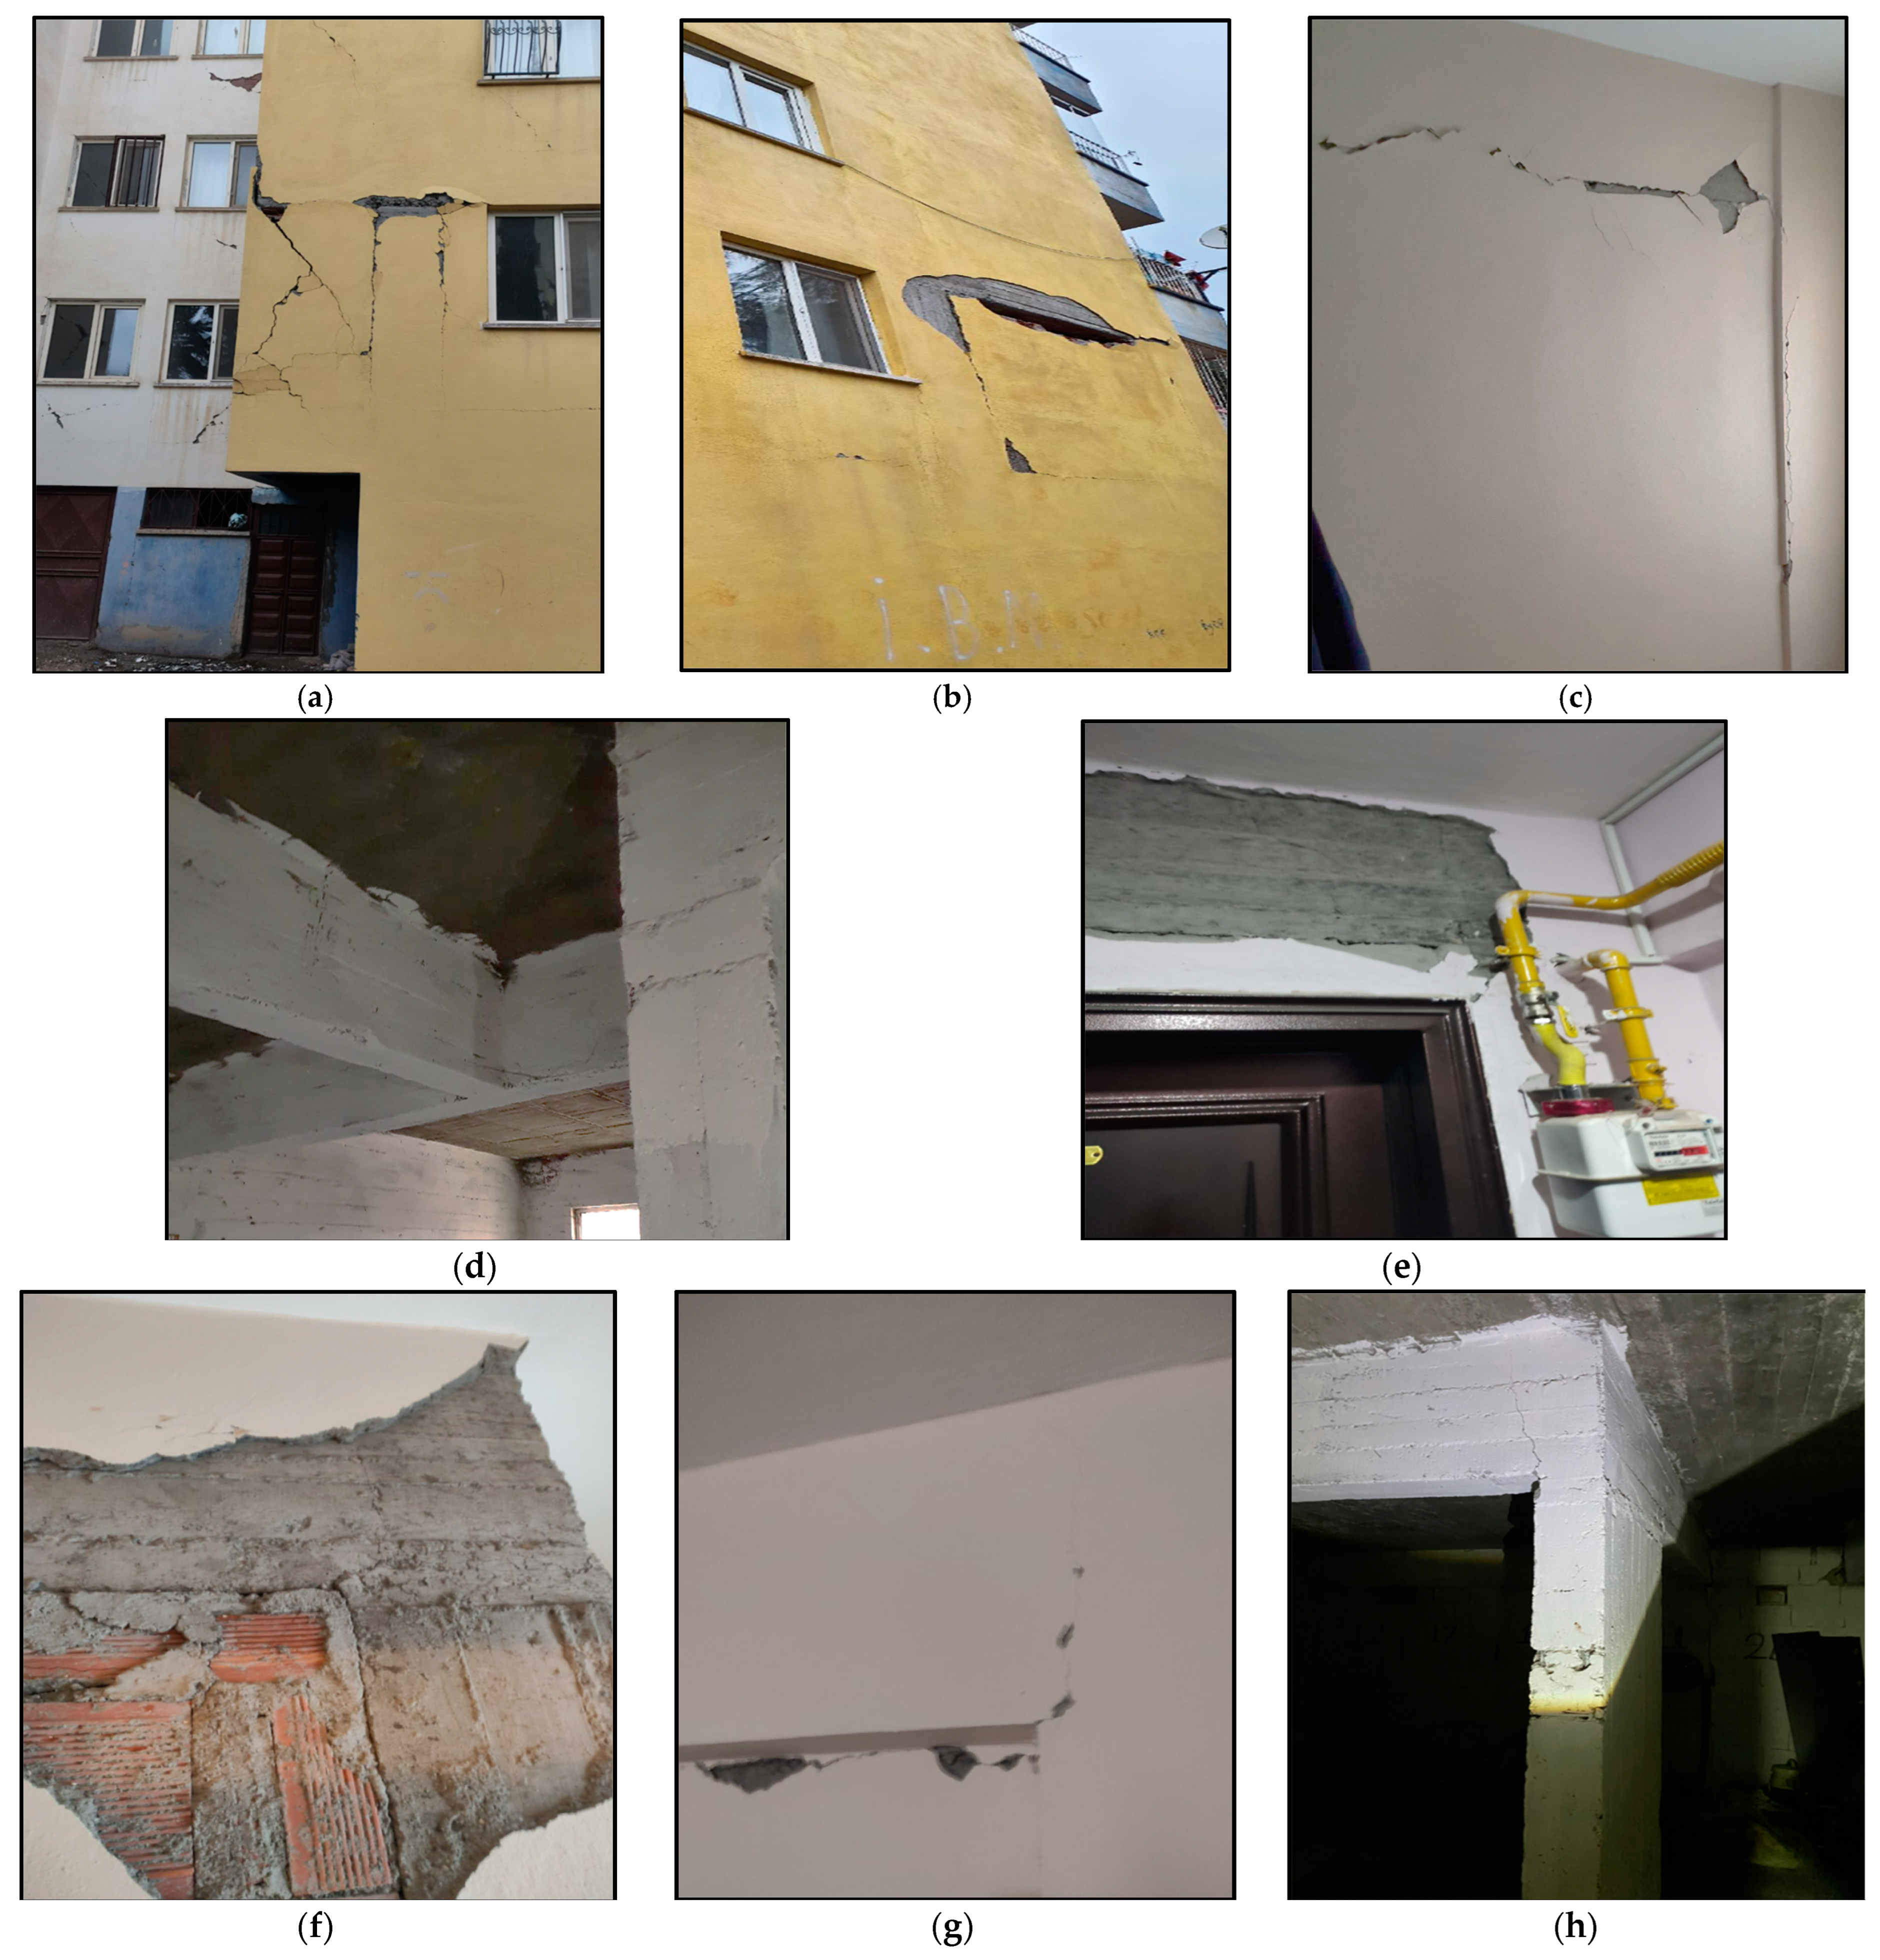
The interesting aspect of the current study is that, contrary to expectations, not much damage was observed in this structure after the earthquakes with moment magnitudes of 7.7 and 7.6 Mw. The main motivation of this work is to understand the seismic performance of old RC buildings that do not comply with the earthquake requirements, and for this purpose, damage assessment was attempted in the 8-story RC building in Adıyaman province. Shear cracks and out-of-plane damages were observed in the walls used to partition the areas, especially on the ground floor of the RC building, due to workmanship problems and the low mechanical properties of the wall material (Figure 13a–c). The observational investigations on the building revealed that shear and/or flexural cracks occurred in a small number of basement, ground, and first normal floor beams and beam/column joints due to poor concrete quality and insufficient transverse reinforcement (Figure 13d–h). Apart from these structural damages, no other damage was observed in the RC building.
FEMA P-58 defines earthquake hazards based on shaking characteristics, varying according to performance assessments. It accounts for uncertainty and employs performance measures relevant to stakeholders. A probabilistic framework predicts consequences such as repair costs, repair time, risks to human life, and environmental impacts [61]. The performance levels defined by FEMA P-58 are Operational, Immediate Occupancy, Life Safety, and Collapse Prevention [62]. The existing RC building is safe for occupation, with only minor repairs needed, indicating it is at the Immediate Occupancy level according to FEMA P-58.

5. Performance-Based Evaluation of Existing Old RC Building

Establishing the relationships between the damages observed in the field study and analytical modeling results is important to better reveal the field-analysis relations in earthquake engineering. Earthquakes create a unique environment that serves as a natural laboratory, making it crucial to interpret the resulting damage through analysis. In the current study, an analytical model was performed on the old RC building that did not comply with the earthquake requirements to make this comparison. After the damage assessment of this RC building, the earthquake behavior of the building was simulated, and the effects of the 6 February 2023 earthquakes were compared to the model. Within this scope, the seismic performance of the selected old RC building was evaluated based on the actual strength of the building, the seismic code, and the earthquakes that occurred on 6 February 2023.
Knowing all design parameters that affect the behavior of building elements in the design of RC structures is important for earthquake performance as it will influence the elements as well as the entire building. To determine the earthquake performance of buildings, the following steps can be applied: (i) determining demand curves resulting from earthquake effects, (ii) making a comparison between the demand and capacity values and determining the capacity values, and (iii) evaluating the earthquake performance defined in the earthquake regulations. Building performance is evaluated based on the damage zones of the building elements. Turkish Earthquake Design Code recommends a deformation-based evaluation approach to determine the earthquake performance of designed RC structures by taking into account the buildings’ Earthquake Design Class, Building Height Class, and Building Usage Class. The deformation evaluation and design method considers nonlinear behavior models and calculation models.

5.1. Nonlinear Static Pushover Analysis in TBEC-2018

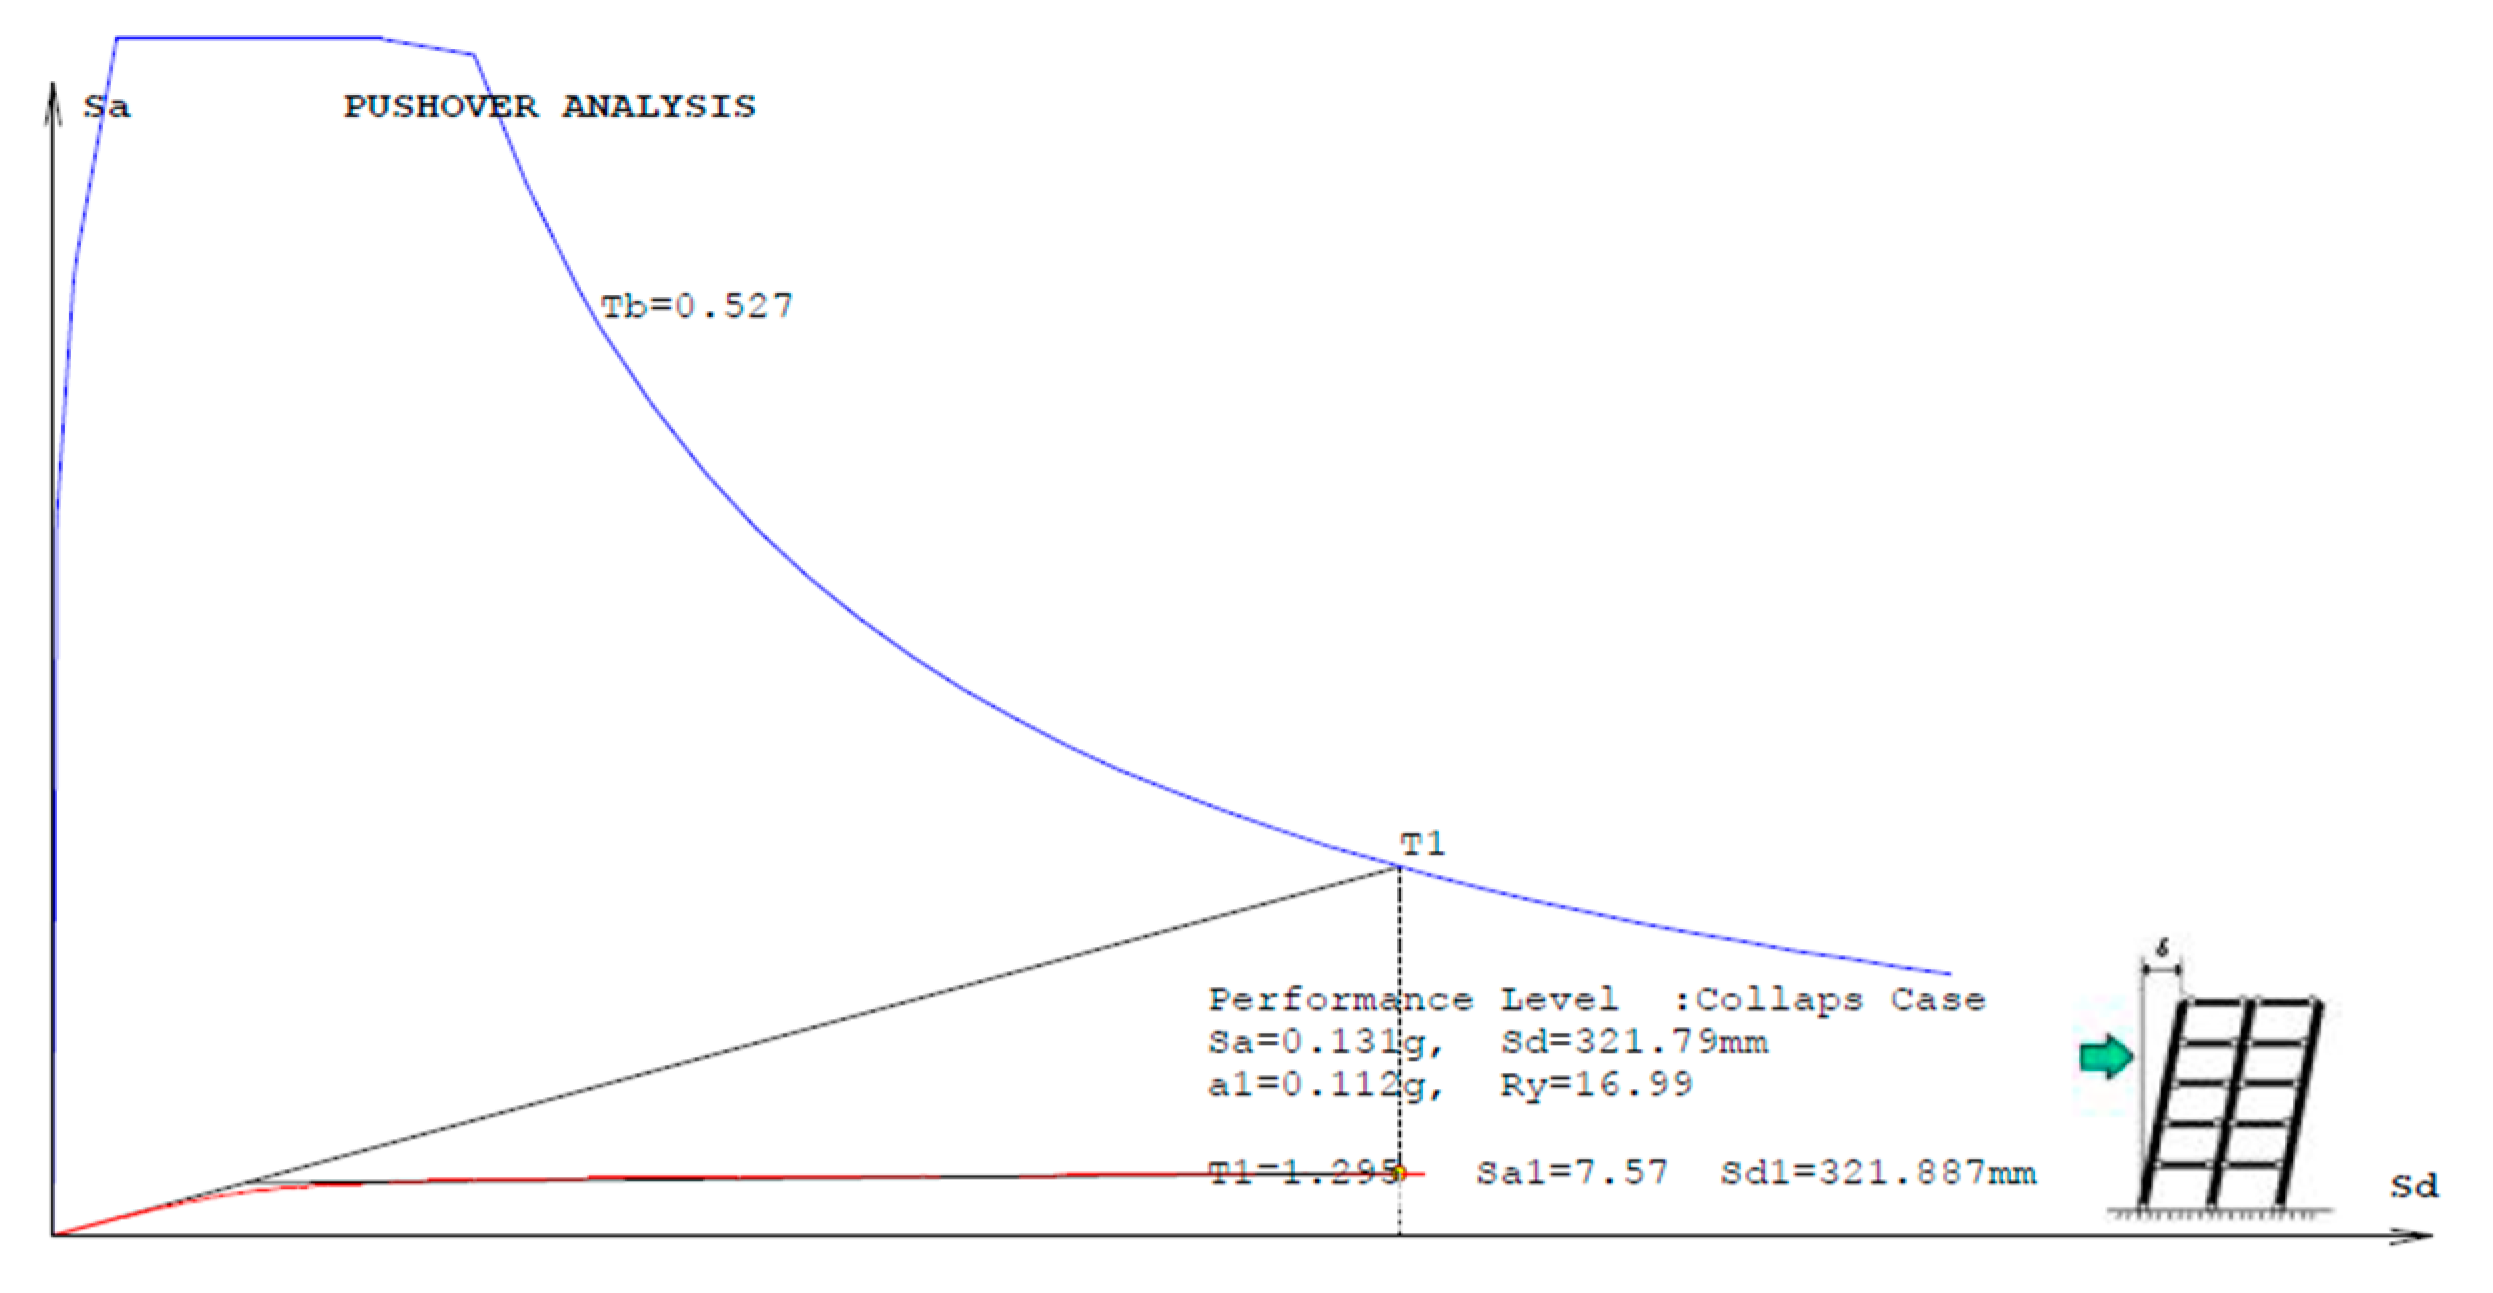
In the pushover analysis performed with the increasing equivalent earthquake load method, the horizontal earthquake forces acting on the load-bearing system are distributed along the building height till the earthquake displacement demand is reached. The structural performance is established through the pushover curves obtained from the base shear force–peak horizontal displacement curve and the demand curve obtained using the specific local soil conditions and earthquake characteristics. To determine the earthquake performance of the building, the demand curve of the structural system is examined by the determination of the target performance of the structural system and the earthquake effect based on the target performance.
When the development history of the earthquake regulations in Türkiye and the construction year of the building are examined, it can be said that the performance analysis of the existing building was made using TEC-1975 [22]. The performance evaluation of the existing building was made using Nonlinear Static Pushover Analysis in TBEC-2018 [25], which includes design provisions based on deformation as well as force-based methods.
The performance of the building depends on the distribution and magnitude of the damage that occurred during the earthquake [63,64,65]. TBEC-2018 [25] defines four performance levels for RC buildings: Immediate Occupancy, Life Safety, Collapse Prevention, and Collapse Zone. To evaluate these performance levels, it is crucial to identify the types of damage in structural elements. Brittle damage occurs due to inadequate force capacity, while ductile damage happens when sufficient ductility allows plastic hinges to form. The ductility ratio is defined as the ratio of total strains to linear strains. In the systems where this ratio is large, and the nonlinear strains are spread over a small region, the nonlinear flexural strains are assumed to be concentrated in plastic hinges, while linear elastic behavior is observed in other regions. This is called the plastic joint hypothesis. Stacked plastic joints are placed at both ends of elements, and a linear behavior is modeled for the regions outside these joints.
According to the stacked plastic behavior in the Turkish Earthquake Design Code, the effective section stiffness of beams and columns is modeled using Equations (1) and (2).
( E I ) e = M y Q y L y 3
Q y = ϕ y L s 3 + 0.0015 η 1 + 1.5 h L s       + ϕ y d b f y e 8 f c e
where L s is the shear span, and M y and Q y are the average of effective yield moments and yield rotations of the plastic joints, respectively. d b is the average diameter of the bar in the support, h is the section height, and f y e , and f c e are the yield strength of the bar and the compressive strength of the concrete, respectively. ϕ y is the yield curvature at the plastic joint. η is used as 1.00 for columns and beams.
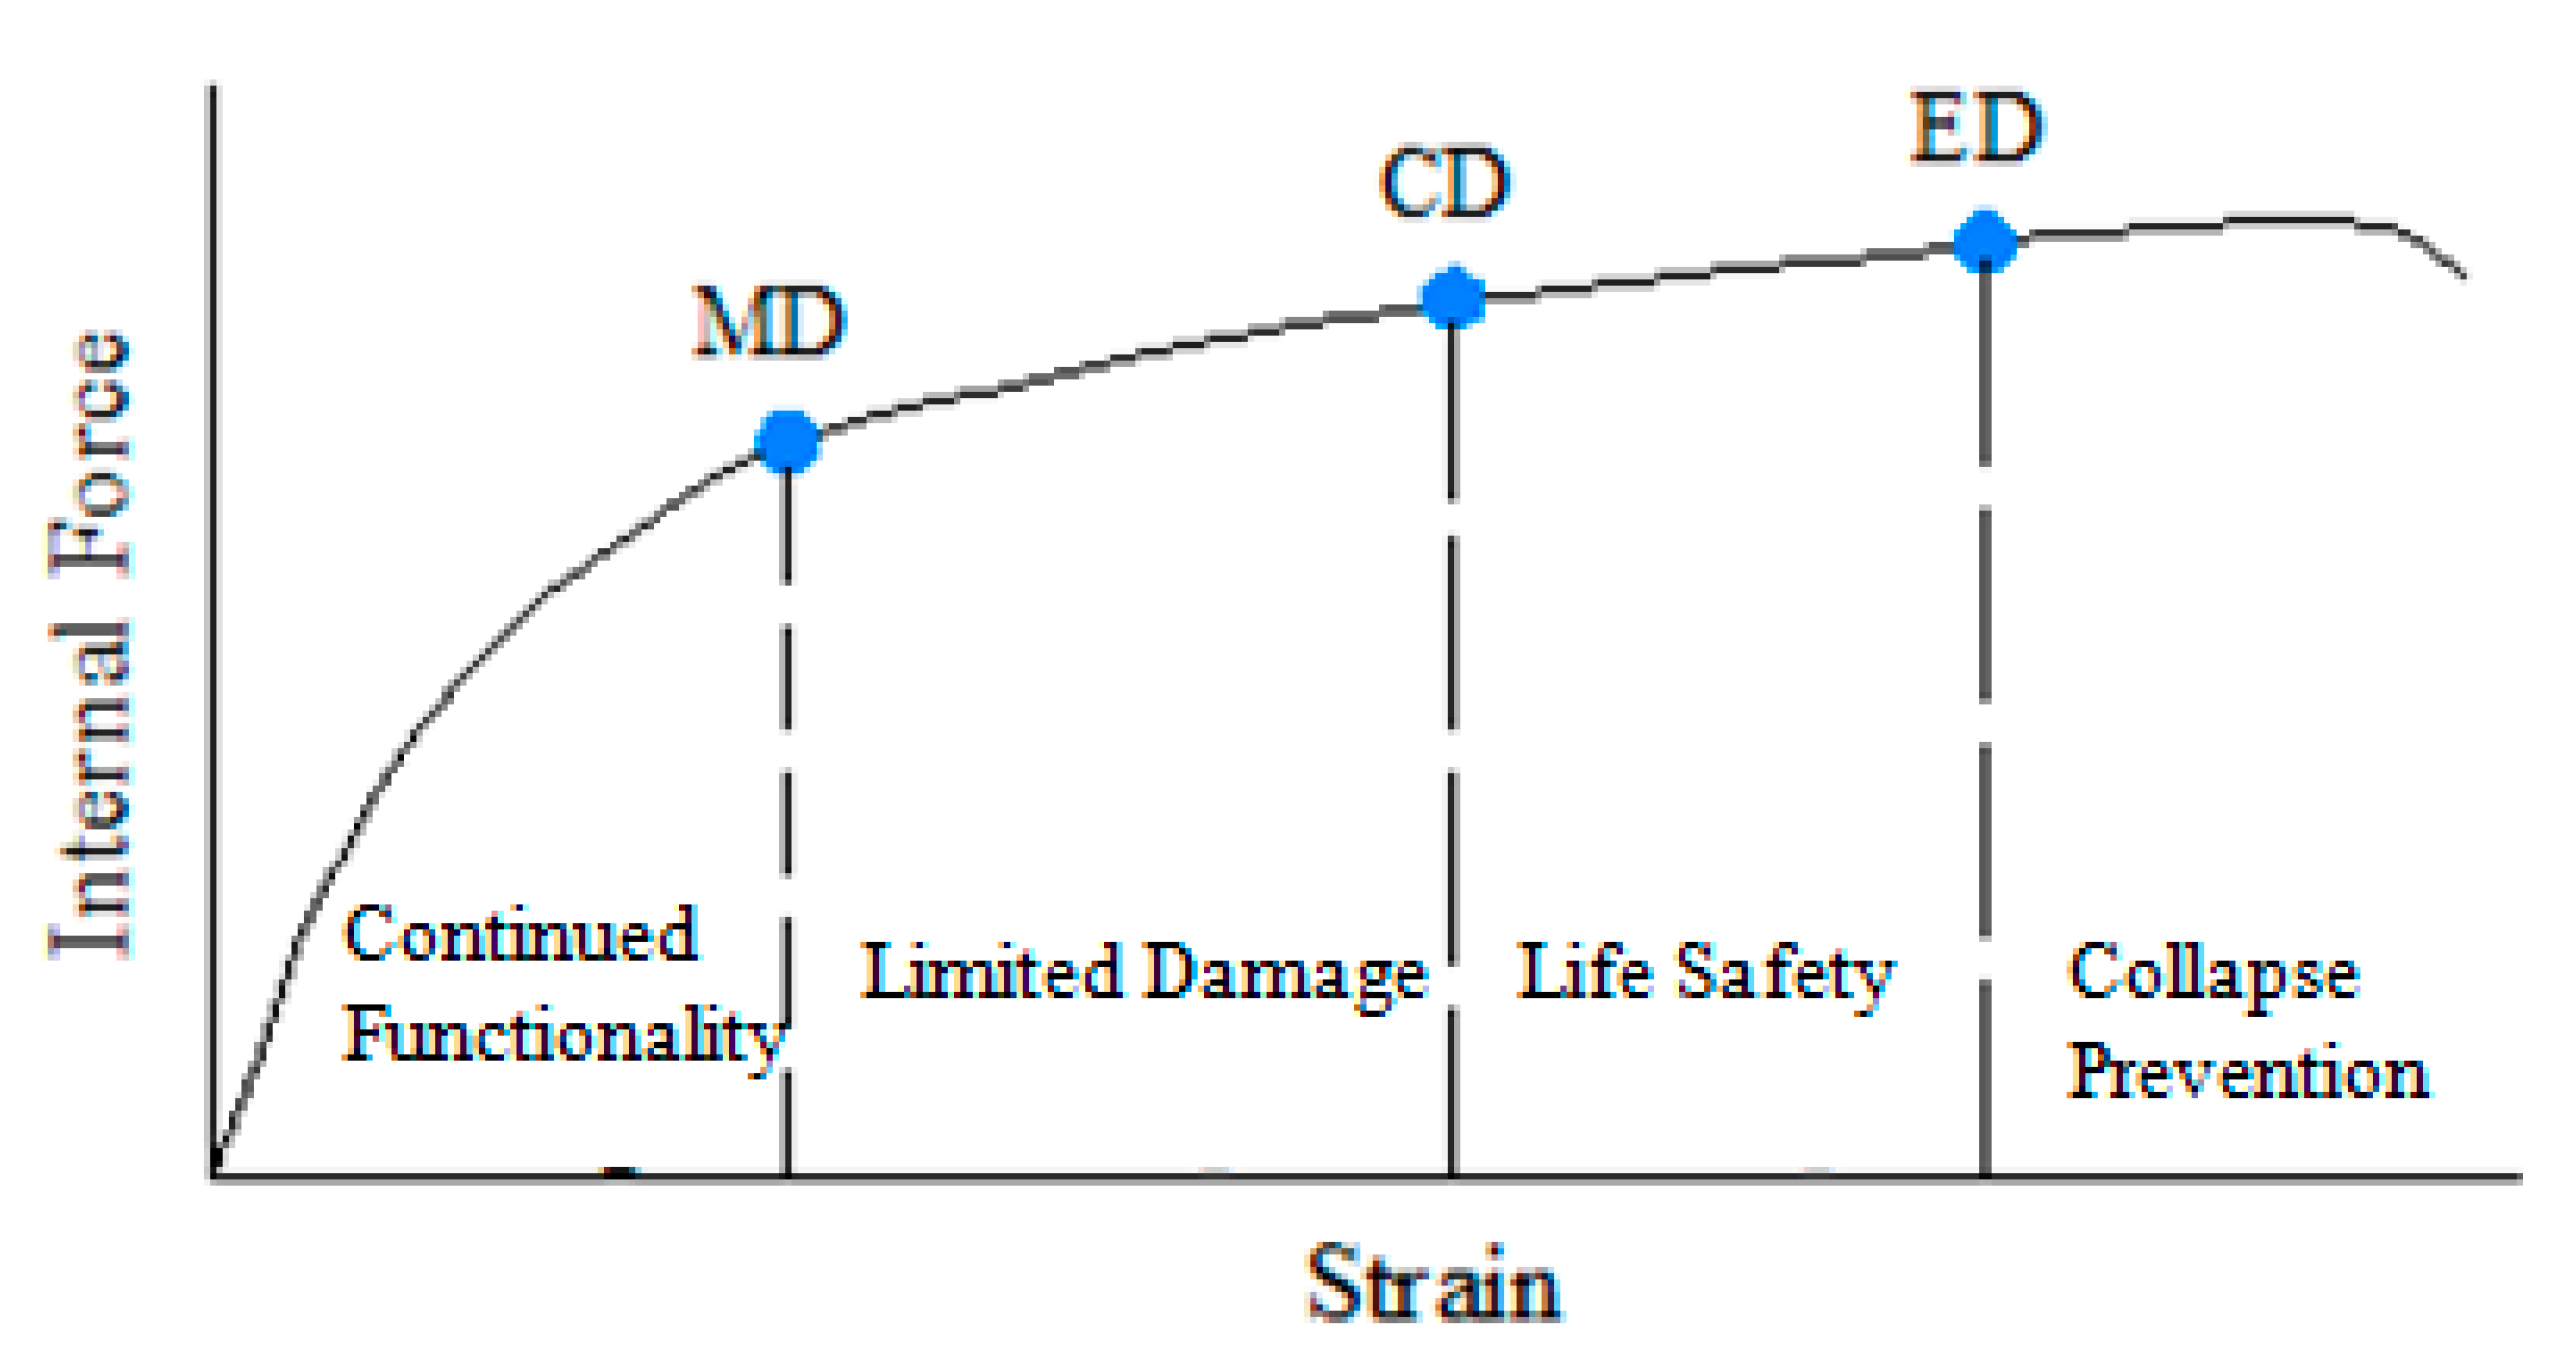
Moment–curvature relations and Axial Force–Moment interaction diagrams of the sections are utilized in the definition of plastic hinges. The damages are concentrated at the ends of the members based on the lumped plastic hinge assumption. The damage conditions related to the rotation capacity and damage areas for ductile sections are defined in TBEC-2018 [25], as given in Table 3 and Figure 14. The plastic hinge length ( l p ) for the bending direction is considered as half of the cross-sectional dimension. Moreover, vertical loads are evaluated by the equation of G + n x Q , which means that the dead loads ( G ) are multiplied by the reduced live loads Q .

5.2. Structural Model

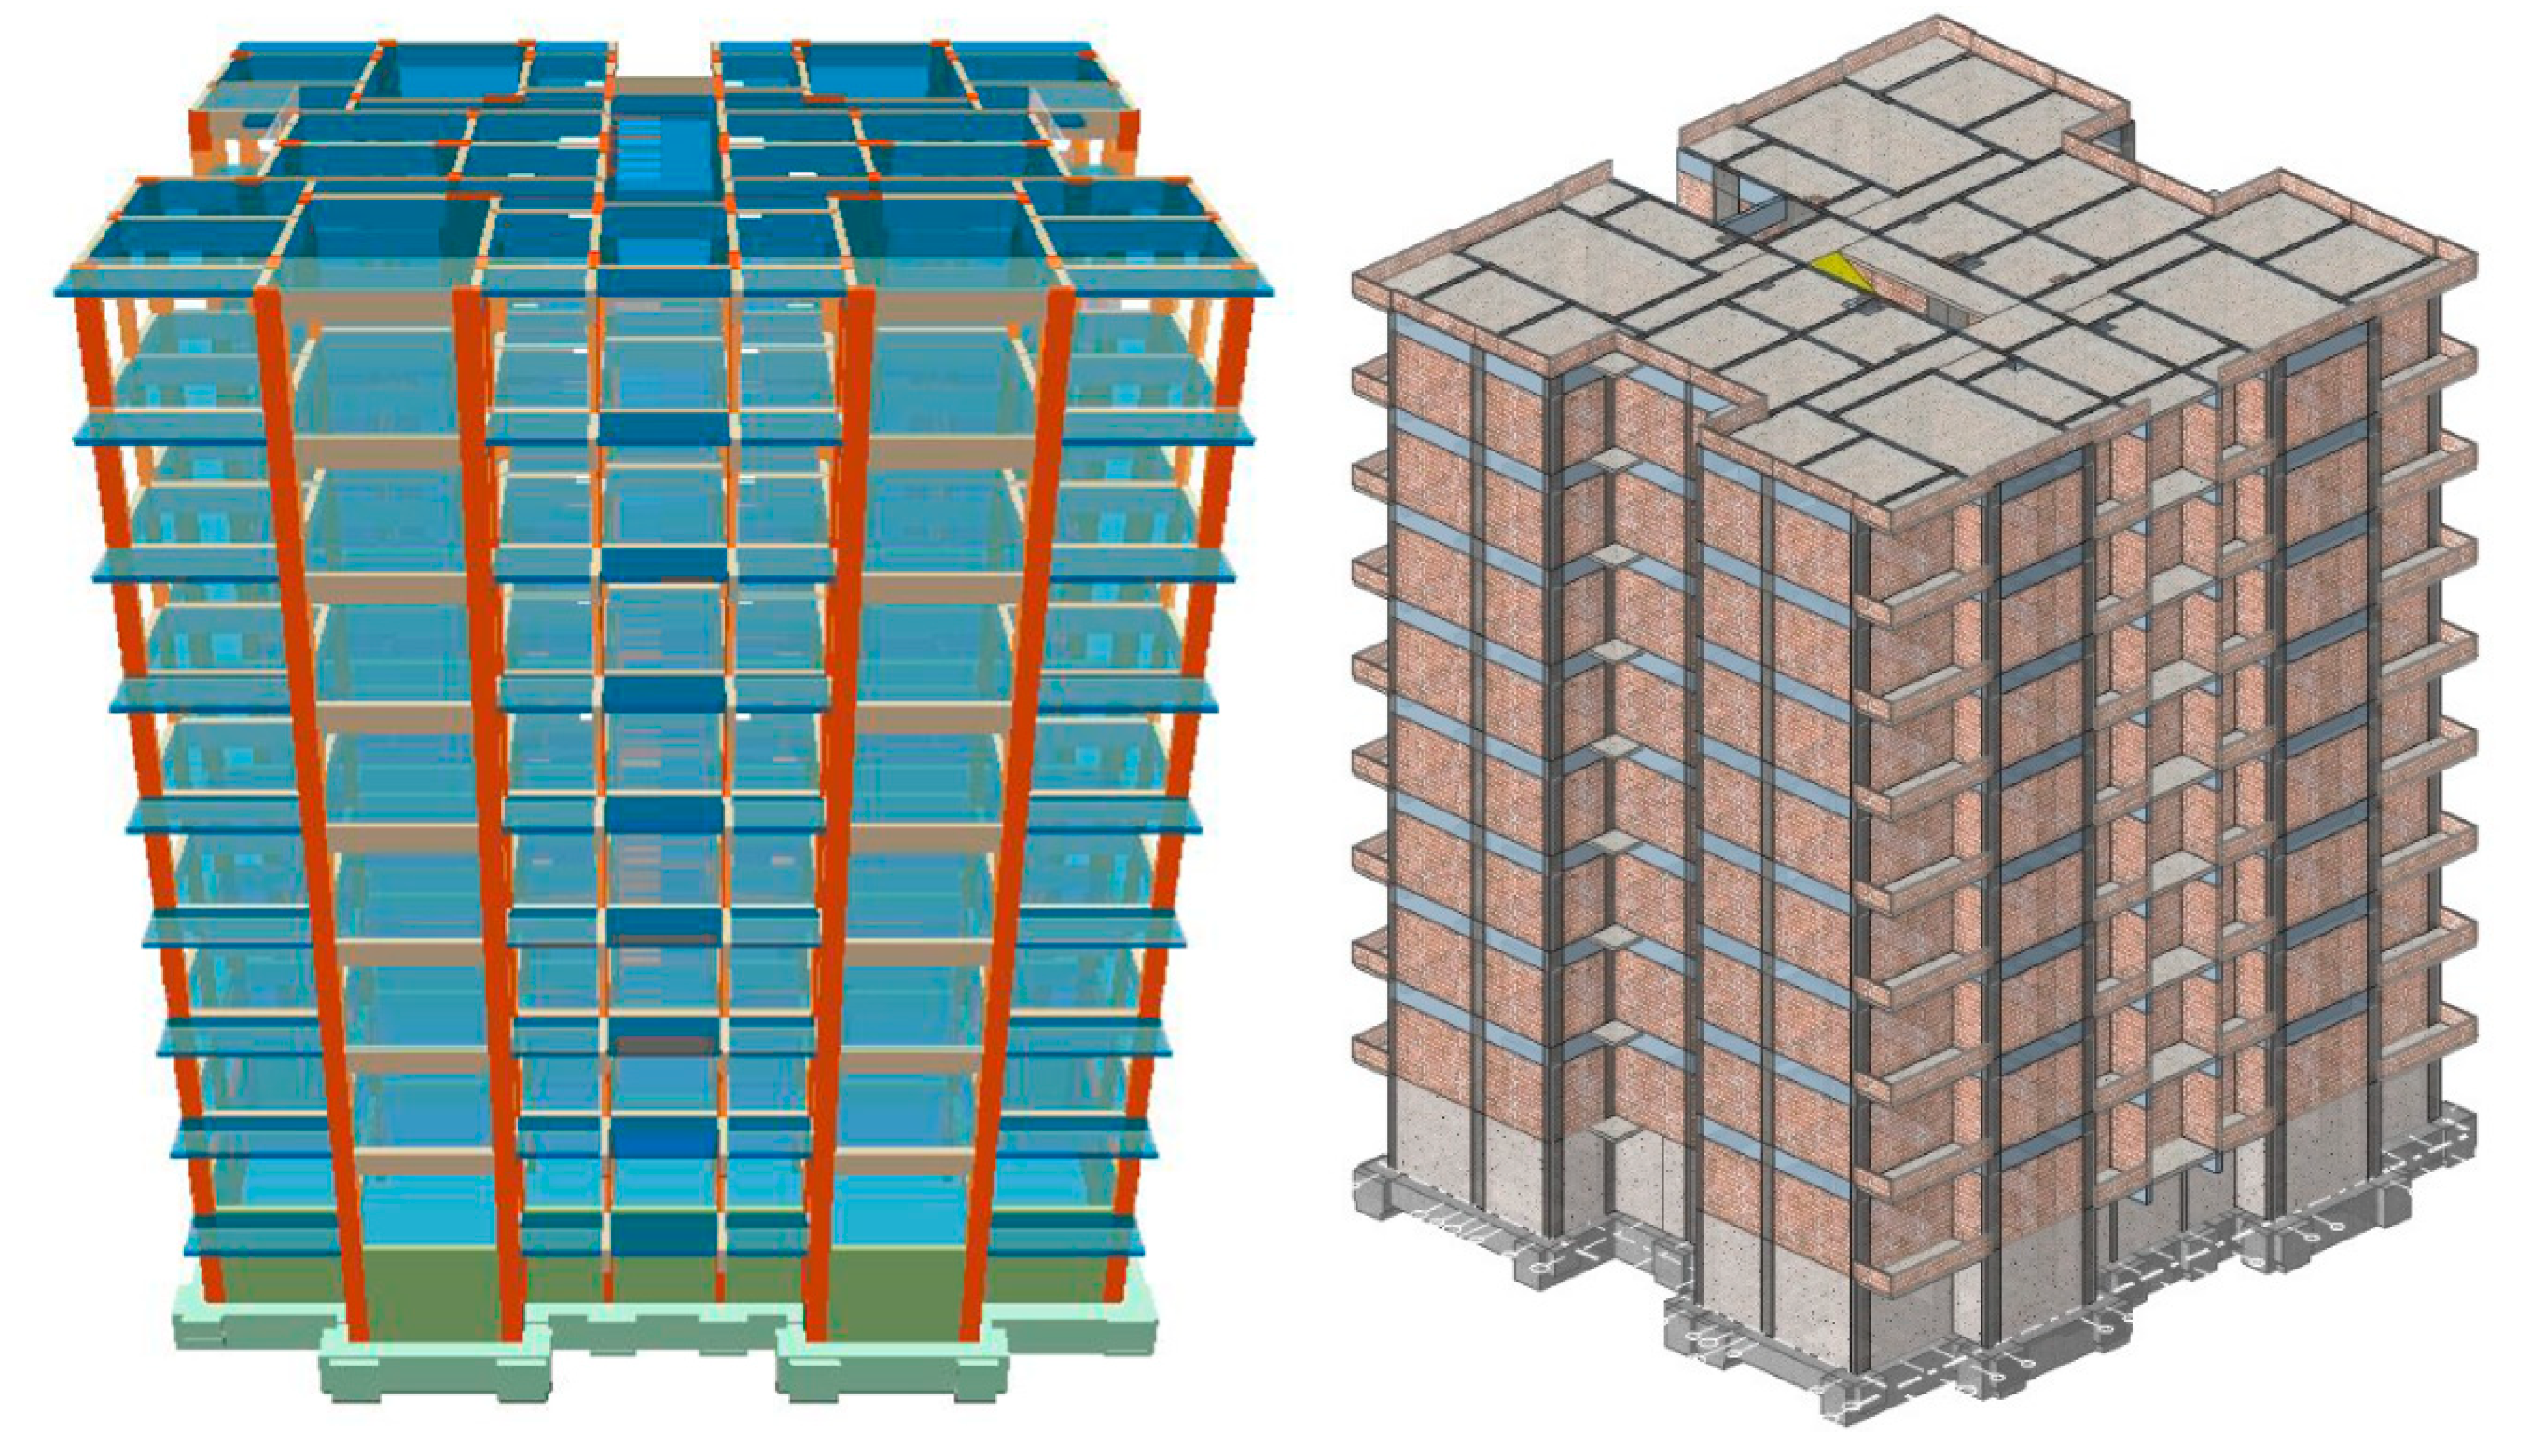
The modeling and nonlinear analyses of the reinforced concrete building were carried out through SAP2000 [34] and STA4CAD V14.1 [42] programs, and the three-dimensional image of the building is presented in Figure 15 and Figure 16.
The reinforced concrete structure presented in Figure 10 was modeled in STA4CAD software with acceleration parameters SD1 = 0.4529 g, SDs = 0.807 g, and soil class ZD selected for the construction area. Moreover, a dead load of 4.7 kN/m2 and a live load of 2 kN/m2 were applied on all floors of the building. In STA4CAD software, static and RC analyses can be performed according to different codes. The software uses the rigid floor diaphragm in static analysis and applies the 3D stiffness method with 6° of freedom at each point. For the performance analysis, the column and beam elements are modeled using a frame element. In column–beam connections, all six degrees of freedom are considered. On the other hand, the value of 8.81 MPa obtained as a result of core tests was used as concrete compressive strength. Nonlinear analysis was performed as per TBEC-2018, and the stress–strain relationship was determined using the Mander model [66]. The four ground motion levels were introduced in TBEC-2018, as outlined in Table 4. The levels DD1 and DD2 correspond to the design earthquake levels specified in ASCE 7 [67]. In this study, the DD2 defined for the earthquake ground motion level of the buildings was considered.
The current study considers the four performance levels and three damage limits defined in TBEC-2018. The performance levels include Continued Functionality, Limited Damage, Life Safety, and Collapse Prevention. The damage limit states are categorized as minimum damage, controlled damage, and excessive damage, as illustrated in Figure 14. There have also been several studies [68,69,70,71] that conducted the structural analysis based on TBEC 2018. The limit states defined in Eurocode 8 [72]—damage limitation, significant damage, and near collapse—were also extensively utilized by researchers [73,74,75]. Regarding the various types of buildings in Türkiye, other studies [12,76,77,78] utilized different limit states to examine seismic performance. In the study by Karimzadeh et al. [76] on seismic damage assessment using a regional synthetic ground motion dataset in Erzincan, limit states were defined for each subclass based on maximum displacement. These states included immediate occupancy, life safety, and collapse prevention. Altindal et al. [78] focused on the probabilistic seismic risk assessment of earthquake-prone old urban centers. They defined two limit states for their analysis. The first limit state was between the none/slight damage state and the moderate damage state. The second limit state was between the moderate damage state and the severe/collapse damage state. Kelam et al. [12] evaluated seismic hazards and potential damage in Gaziantep, Turkiye, using site-specific models for sources, velocity structure, and building stock based on limit states of no/slight damage, moderate damage, and severe damage/collapse.
In the nonlinear analysis, iteration of the pushover analysis continued until the target performance level was achieved according to the modal capacity of mode 1 from the spectral acceleration–displacement diagram. The iteration was completed after reaching the peak spectral displacement level of the structure. As a result of the analysis, the damage ratios were calculated according to the reinforcement elongation and concrete shortening values at the plastic hinges in the whole structure. In conclusion, damage classes were assigned according to the limit states, and the building performance was obtained by determining the damage percentages on all floors.

6. Results and Discussion

6.1. Results of Pushover Analysis

The existing building was analyzed based on the rules specified in TBEC-2018 [25], which includes design provisions based on deformation as well as force-based methods to determine the damage condition of the structure prior to the earthquake. The horizontal elastic design spectrum and the formulas are given in Figure 17.
The nonlinear analysis spectrum/seismic force–deflection curves of the nonlinear pushover analysis in both the x and y directions of the buildings are given in Figure 18 and Figure 19, respectively. In these graphs, the gradually descending line shows the horizontal elastic design spectrum. A line starting from the origin and crossing the horizontal elastic design spectrum with an oblique line shows the spectrum/seismic force–deflection that would occur if material nonlinearity was not considered. The horizontal red line is drawn based on the plastic deformations that may occur in the building, considering the material’s nonlinearity. The structure period was 1.48 s and 1.29 s for the x and y directions, respectively.
The distribution of plastic hinges in the buildings based on the nonlinear pushover analysis is given in Figure 20. The locations of plastic hinges are presented on the deformed structure in the pre-collapse stage. As given in Figure 14, four damage states were defined, including limited damage (LD), significant damage (SD), advanced damage (AD), and collapse (C). The detailed damage distributions of the beams and columns after loading are summarized as a percentage on a story basis in Table 5 and Table 6, respectively. Accordingly, LD and SD levels were detected in all beams for fourth to seventh normal ceilings. However, most of the beams were at the damage state of AD and C, for +X and –X direction loadings, up to the second normal ceiling. As expected, stress concentrations occurred in the columns for lower stories.
Moreover, as a result of the performance analysis, it was determined that a significant number of columns suffered brittle failure, indicating that the structure was at risk of collapse. However, during the on-site observations, no heavy damage or collapse was detected on the beams and columns. Considering Figure 13a–h, a limited number of shear and/or flexural cracks were observed in some beams and beam/column joints, along with damage to the partition walls.

6.2. Discussion

Based on the nonlinear pushover analysis, a significant number of load-bearing reinforced concrete elements suffered brittle failure, leading to the potential collapse of the structure. In contrast, as mentioned in the previous section, only a few shear and/or flexural cracks were observed instead of collapse or heavy damage to these elements during the on-site observations. This result can be attributed to some reasons, which will be discussed in this section.
When examined chronologically, the primary factors influencing the seismic waves’ content are delineated as the source, path, and site effects. However, this study does not examine the initial two effects. Notably, in the current study, the site effect was deemed significant and yielded consistently uniform outcomes across all analyses. Moreover, local soil conditions in the region exhibit a tendency to amplify waves with low PGA motions, as illustrated in Figure 6, which leads to a deamplification effect on seismic waves with higher PGAs, as can be seen in Figure 7. This observation implies the influence of overlapping or diverging frequencies of the seismic motions and the structure. The fact that the 8-story reinforced concrete building, whose natural vibration period is close to 1 s, shows resistant behavior after the earthquake, although its structural features are considered, is indicative of this situation.
In TEC-2007 [24], one of the irregularities in the plan is defined as a torsional irregularity, which seriously affects the damaged state of the building during the earthquake. It occurs when the ratio of the largest relative displacement of each floor in the direction of the earthquake to the average relative displacement of the same floor is greater than 1.2. The story of seismic displacement in the building is given in Table 7. Moreover, in the existing building used in the current study, the center of mass and stiffness of the structure are overlapped, as given in Figure 21. Also, the plan geometry of the structure is almost symmetrical, and significant irregularities are not included in the design. These factors effectively prevented the building from torsion and collapse/heavy damage. Erdem [79] found that if the center of the mass and stiffness do not coincide in structures, force distribution changes and torsion will occur due to seismic loading, resulting in the necessity of large amounts of reinforcement areas. Abdel Raheem et al. [80] reported that irregular structures could be damaged more easily than regular structures due to torsional behavior and stress concentration. Akçaer et al. [81] suggested that in order to limit the relative displacement and reduce torsion, the center of the mass and stiffness should be closer to each other. It was found in a study by Gokdermir et al. [82] that increasing the strength of the structural elements in the weak direction of the building can prevent the effect of torsion on structures.
As shown in the red-labeled beams in Figure 21, according to the performance evaluation results of the examined structure, a significant part of the reinforced concrete structural elements collapsed. The distance between stirrups in RC columns has a great impact on the location, number, and width of cracks in the concrete during an earthquake. As a result of the stripping process of the columns of the existing building, it was determined that the stirrup spacing was, on average, 12 cm, which caused the columns to become stiffer. Although the concrete strength of the structure is quite poor, the reinforcement arrangement is good, as given in Table A2 in the Appendix A. Moreover, it is known that transverse reinforcement in columns increases strength and ductility with the wrapping effect. It is clear that under axial load, the lateral compression applied to the concrete core by limiting the lateral deformation due to the Poisson effect provides this improvement in behavior [83]. As a result, it is thought that the good stirrup spacing in the RC structural elements of the structure is one factor preventing the structure from collapsing.
Another reason for the results is that the building has a high density of vertical load-bearing structural elements, resulting in the formation of numerous nodes. It is worth saying that an increased number of nodes enhances the structure’s energy absorption capacity during an earthquake.

7. Summary and Conclusions

The 6 February earthquakes correspond to a threshold in Türkiye’s history in terms of their social, economic, and humanitarian effects. This study was carried out to examine the effects of earthquakes, which caused significant structural damage and destruction, resulting in many losses of life, on the structural stock. It should be known that structural damage and destruction are often easy to understand and explain with engineering knowledge and experience, but performance evaluation of surviving structures is not always that simple and practical. For this reason, detailed engineering studies and analyses need to be carried out. This study is a comprehensive and highly instructive case analysis that meticulously models both local soil conditions and the structural state separately, then compares the results with the post-earthquake condition of the structure. As a novelty in the literature, in the current study, a moderately damaged old multi-story RC building located in the center of Adıyaman was considered instead of a severely damaged one. Since the existing RC building, considered a case study, was constructed before the regulations of TS500 [27] and TBEC-2018 [25], it is possible to say that this structure does not comply with the earthquake regulations. First, the soil profile was modeled using one-dimensional seismic site response analyses with real earthquake records from nearby stations to determine the modified seismic motion the building would be subjected to at the foundation level. Then, the nonlinear static pushover analysis was carried out via SAP2000 [34] and STA4CAD V14.1 [42] finite element software, using the data obtained from site response analysis and test results taken from the reinforcement and concrete of the building. The following conclusions can be drawn as a result of these analyses:
  • Under the 15 earthquake records, local soil properties exhibited amplification and deamplification behavior. Damping effects of up to 50% were observed in earthquake records with PGA above 0.75 g. On the other hand, 54% amplification of seismic waves was observed in input motions with PGA below 0.70g. This observation demonstrated the effect of overlapping or diverging the frequencies of seismic motions and the structure.
  • The nonlinear pushover analysis showed that a significant number of load-bearing RC elements suffered brittle failure, and the structure collapsed. Conversely, during the field survey, only a few shear and/or flexural cracks were observed instead of collapse or heavy damage of these elements. This situation highlights the importance of various factors, including overlap or divergence of seismic frequencies with the structure’s frequencies, plan regularity, arrangement of the load-bearing elements of the structures, amount of transverse reinforcement, and density of the vertical load-bearing elements of the structures.
In summary, this study demonstrates how key structural parameters—such as the load-bearing element distribution, column–beam connections, and transverse reinforcement—affect dynamic performance and align with engineering principles. It also emphasizes the role of well-conducted geotechnical site investigations in assessing local soil conditions and understanding site effects on the seismic performance of structures. By addressing gaps in local construction practices and emphasizing the role of soil–structure interaction, the findings offer a framework for optimizing load-bearing system configurations, enhancing earthquake resilience, and improving regulatory oversight to ensure safer and sustainable structural designs. The findings of this research are particularly relevant to project designers and construction authorities, providing key insights that can inform local regulatory bodies in evaluating structural safety compliance.

Author Contributions

Conceptualization, M.B., O.Y. and C.K.; methodology, M.B., O.Y. and C.K.; writing—original draft preparation, M.B., O.Y. and C.K. All authors have read and agreed to the published version of the manuscript.

Funding

This research received no external funding.

Data Availability Statement

The datasets generated during and/or analyzed during the current study are available from the corresponding author upon reasonable request.

Conflicts of Interest

The authors declare no conflicts of interest.

Appendix A

Table A1. Historical earthquakes that occurred on EAFZ.
DateLatitudeLongitudeDepth (km)MagnitudeLocation
24.01.202038.4239.21106.8ÇEVRİMTAŞI, SİVRİCE, (ELAZIĞ) [South 60 km]
17.08.201638.6538.132.74.5FETHIYE-YAZIHAN (MALATYA) [North 3.1 km]
9.12.201538.8137.8554.6DURSUNLU-HEKIMHAN (MALATYA) [North West 59 km]
29.11.201538.8237.847.15.1DURSUNLU-HEKIMHAN (MALATYA) [North 1.5 km]
8.01.201337.8637.9854.7AKCATEPE-TUT (ADIYAMAN) [North West 6.6 km]
16.02.201238.6337.4354.8CUKURKAYA-DARENDE (MALATYA) [West 2.7 km]
24.08.200738.1337.4354.6BAKIS-ELBISTAN (KAHRAMANMARAS) [South East 0.8 km]
26.02.200438.0138.2465CELIKHAN (ADIYAMAN) [South 2.6 km]
8.08.198638.0137.7194.6KUCUKLU-DOGANSEHIR (MALATYA) [South East 0.4 km]
15.06.198638.0437.28104.5GOZPINAR-EKINOZU (KAHRAMANMARAS) [NorthEast 4 km]
6.06.198638.0137.91115.6SAVAKLI-DOGANSEHIR (MALATYA) [South 3.7 km]
5.05.198638.0637.79364.6SOGUT-DOGANSEHIR (MALATYA) [East 2.0 km]
5.05.198638.0237.7945.8KADILI-DOGANSEHIR (MALATYA) [South East 1.9 km]
15.07.198438.7638.04104.6YAGCA-HEKIMHAN (MALATYA) [South West 4.3 km]
24.07.198138.137.9104.5DOGANSEHIR (MALATYA) [North East 2.1 km]
4.12.197838.0737.43375AGCASAR-NURHAK (KAHRAMANMARAS) [East 7.1 km]
8.06.197538.2737.64284.5TOPALLI-ELBISTAN (KAHRAMANMARAS) [South East 2.5 km]
1.12.197438.0138.24364.8CELIKHAN (ADIYAMAN) [South 2.6 km]
18.01.197437.8737.86284.5CANKARA-GOLBASI (ADIYAMAN) [East 2.0 km]
13.10.197038.2836.98344.9KARAGOZ-AFSIN (KAHRAMANMARAS) [North West 0.8 km]
7.10.197038.0138.24334.6CELIKHAN (ADIYAMAN) [South 2.6 km]
2.07.197038.8736.81195KARAHALKA-PINARBASI (KAYSERI) [South West 1.4 km]
5.09.196938.9437.22474.5BOGRUDELIK-GURUN (SIVAS) [South West 6.2 km]
8.07.196838.0138.24574.8CELIKHAN (ADIYAMAN) [South 2.6 km]
3.10.196438.0138.24254.5CELIKHAN (ADIYAMAN) [South 2.6 km]
25.08.196338.9938.3504.9YESILYAYLA-ARAPGIR (MALATYA) [South West 2.5 km]
19.06.196038.8737.75704.7KARACAYIR-KULUNCAK (MALATYA) [East 0.6 km]
19.06.195338.0138.24154.7CELIKHAN (ADIYAMAN) [South 2.6 km]
9.05.195038.2438.32705.3KOZLUK-YESILYURT (MALATYA) [North East 2.1 km]
20.12.194038.338.3105.8GUNDUZBEY-YESILYURT (MALATYA) [North East 3.9 km]
25.11.19383938304.9CIMENLIK-HEKIMHAN (MALATYA) [East 2.3 km]
2.01.193338.0138.24504.8CELIKHAN (ADIYAMAN) [South 2.6 km]
1.02.19223837305.5KABAKTEPE-EKINOZU (KAHRAMANMARAS) [South 3.9 km]
Table A2. Stirrup distance values determined using reinforcement detection device for beams and columns.
Structural ElementSection NameStirrup Distance (cm)
BeamBasement T (10-15) Axis11-11-11-11-11-11-11-12-10-11-11-11
Basement 3 (D-C) Axis11-10-10-10-11-11-11-11-11-10-11-11
Basement 21 (Q-U) Axis10-11-10-11-11-11-11-10-11-11-11-11
Ground 9 (T-O) Axis11-14-13-11-11-11-11-11-11-11-11-11
Ground 13 (D-G) Axis11-10-14-11-11-11-11-11-11-11-11-11
Ground 22 (R-V) Axis11-11-11-10-11-11-11-11-10-11-11-11
1Th Normal Floor 10 (M-O) Axis11-10-10-10-11-11-12-11-11-10-11-10
1Th Normal Floor 15 (M-Q) Axis11-11-10-10-10-11-10-11-10-11-10-11
1Th Normal Floor 1 (C-B) Axis11-10-11-11-13-11-13-11-11-11-10-11
2Th Normal Floor U (21-23) Axis11-12-11-11-11-10-11-11-14-11-12-11
2Th Normal Floor W (15-21) Axis13-11-13-13-11-11-12-11-11-13-11-11
2Th Normal Floor 6 (C-A) Axis11-11-11-12-12-12-12-12-11-11-11-12
3Th Normal Floor B (2-6) Axis12-11-12-13-13-12-12-13-12-12-12-12
3Th Normal Floor 7 (G-E) Axis12-11-13-12-11-12-11-11-12-13-13-13
3Th Normal Floor Q (15-23) Axis13-13-13-13-13-13-13-13-13-12-12-13
4Th Normal Floor 24 (N-R) Axis11-13-13-11-13-11-11-13-12-13-13-11
4Th Normal Floor 8 (S-W) Axis12-12-12-12-12-13-12-11-12-12-11-11
4Th Normal Floor G (1-5) Axis14-13-12-12-13-13-13-13-12-13-13-12
5Th Normal Floor Q (15-21) Axis11-12-13-11-11-12-12-11-11-11-11-11
5Th Normal Floor 7 (G-E) Axis11-12-13-11-11-12-11-12-11-12-11-11
5Th Normal Floor I (9-17) Axis11-14-11-11-11-11-11-12-11-11-11-11
6Th Normal Floor 23 (B-Q) Axis11-10-10-10-11-11-12-11-11-10-11-10
6Th Normal Floor 1 (C-B) Axis10-12-10-10-10-11-10-11-10-11-10-11
6Th Normal Floor 9 (O-T) Axis11-11-11-10-11-11-11-11-10-11-11-11
7Th Normal Floor 7 (G-D) Axis11-11-11-10-10-11-10-11-11-11-11-11
7Th Normal Floor 5 (G-E) Axis10-10-11-10-11-10-11-11-11-11-11-11
7Th Normal Floor 10 (M-O) Axis11-11-13-11-12-11-11-13-13-11-11-11
ColumnBasement G-3 Axis17-16-17-15-15-15-14-15-15-15-14-14
Basement W-8 Axis14-14-14-14-15-14-15-15-15-15-14-14
Ground Q-23 Axis15-15-15-15-15-15-15-15-15-15-15-15
Ground U-23 Axis14-14-14-14-14-14-14-14-14-14-14-14
1Th Normal Floor O-4 Axis14-14-15-15-15-15-14-15-13-15-14-15
1Th Normal Floor J-24 Axis14-13-13-14-14-15-15-15-15-15-14-14
2Th Normal Floor F-1 Axis15-15-15-15-14-15-15-15-13-13-15-15
2Th Normal Floor R-26 Axis15-15-14-14-14-14-14-14-14-14-14-14
3Th Normal Floor R-26 Axis15-15-15-15-15-15-15-15-15-15-15-15
3Th Normal Floor S-4 Axis15-15-14-15-15-15-15-15-15-15-15-15
4Th Normal Floor W-4 Axis14-14-14-14-13-14-17-14-14-14-14-14
4Th Normal Floor D-3 Axis13-13-13-13-13-13-13-13-14-10-13-15
5Th Normal Floor W-8 Axis13-19-14-14-14-11-14-11-14-14-10-11
5Th Normal Floor P-24 Axis15-15-14-15-15-15-15-16-15-15-14-14
6Th Normal Floor I-9 Axis15-15-15-15-15-15-15-14-14-14-14-14
6Th Normal Floor F-8 Axis14-14-15-15-15-15-15-14-15-15-14-15
7Th Normal Floor Q-15 Axis15-14-16-15-15-14-15-14-14-14-14-14
7Th Normal Floor O-4 Axis14-14-14-14-15-15-15-15-16-16-16-16

References

  1. Cenan Mertol, H.; Tunc, G.; Akis, T. Damage Observation of Reinforced Concrete Buildings after 2020 Sivrice (Elazığ) Earthquake, Turkey. J. Perform. Constr. Facil. 2021, 35, 5. [Google Scholar] [CrossRef]
  2. Dogan, G.; Ecemis, A.S.; Korkmaz, S.Z.; Arslan, M.H.; Korkmaz, H.H. Buildings Damages after Elazığ, Turkey Earthquake on January 24, 2020. Nat. Hazards 2021, 109, 161–200. [Google Scholar] [CrossRef]
  3. Doǧangün, A. Performance of reinforced concrete buildings during the May 1, 2003 Bingöl Earthquake in Turkey. Eng. Struct. 2004, 26, 841–856. [Google Scholar] [CrossRef]
  4. Işık, E.; Avcil, F.; Büyüksaraç, A.; İzol, R.; Hakan Arslan, M.; Aksoylu, C.; Harirchian, E.; Eyisüren, O.; Arkan, E.; Şakir Güngür, M.; et al. Structural damages in masonry buildings in Adıyaman during the Kahramanmaraş (Turkiye) earthquakes (Mw 7.7 and Mw 7.6) on 06 February 2023. Eng. Fail. Anal. 2023, 151, 107405. [Google Scholar] [CrossRef]
  5. Yıldız, Ö.; Kına, C. Geotechnical and Structural Investigations in Malatya Province after Kahramanmaraş Earthquake on February 6, 2023. Bitlis Eren Üniversitesi Fen Bilim. Derg. 2023, 12, 686–703. [Google Scholar] [CrossRef]
  6. Yakut, A.; Gülkan, P.; Sadik Bakir, B.; Tolga Yilmaz, M. Re-examination of damage distribution in Adapazari: Structural considerations. Eng. Struct. 2005, 27, 990–1001. [Google Scholar] [CrossRef]
  7. Korkmaz, S.Z. Observations on the Van Earthquake and Structural Failures. J. Perform. Constr. Facil. 2015, 29, 1. [Google Scholar] [CrossRef]
  8. Zhou, Y.J.; Wang, X.T.; Sun, H.R.; Chen, X.; Wang, T. Residual seismic performance for damaged RC frame based on beam-to-column joint subassemblies. Structures 2025, 71, 107980. [Google Scholar] [CrossRef]
  9. Nicoletti, V.; Carbonari, S.; Gara, F. Nomograms for the pre-dimensioning of RC beam-column joints according to Eurocode 8. Structures 2022, 39, 958–973. [Google Scholar] [CrossRef]
  10. Yildiz, Ö. Influence of input motion and surface layer properties on seismic site response: A stochastic simulation method–based MLR model. Near Surf. Geophys. 2023, 21, 195–216. [Google Scholar] [CrossRef]
  11. Yildiz, Ö. Nonlinear and Equivalent Linear Site Response Analysis of Istanbul Soils. NATURENGS MTU J. Eng. Nat. Sci. Mal. Turgut Ozal Univ. 2021, 2, 88–101. [Google Scholar] [CrossRef]
  12. Arslan Kelam, A.; Karimzadeh, S.; Yousefibavil, K.; Akgün, H.; Askan, A.; Erberik, M.A.; Koçkar, M.K.; Pekcan, O.; Ciftci, H. An evaluation of seismic hazard and potential damage in Gaziantep, Turkey using site specific models for sources, velocity structure and building stock. Soil Dyn. Earthq. Eng. 2022, 154, 107129. [Google Scholar] [CrossRef]
  13. Yıldız, Ö. Seismic site characterization of Battalgazi in Malatya, Turkey. Arab. J. Geosci. 2022, 15, 867. [Google Scholar] [CrossRef]
  14. Sonmezer, Y.B.; Celiker, M.; Simsek, H. Evaluation of the seismic site characterization of Kovancilar (Elazig), Turkey. Bull. Eng. Geol. Environ. 2024, 83, 1–27. [Google Scholar] [CrossRef]
  15. Malatya Turgut Ozal Üniversitesi Insaat Mühendisligi Bolümü. 6 Subat 2023 Pazarcık (Mw 7.7) ve Elbistan (Mw 7.6) Depremleri On Degerlendirme Raporu; Malatya Turgut Ozal Üniversitesi: Battalgazi/Malatya, Turkey, 2023. [Google Scholar]
  16. Ozsarac, V.; Ricardo, M.; Askan, A.; Calvi, G.M. Impact of local site effects on seismic risk assessment of reinforced concrete bridges. Soil Dyn. Earthq. Eng. 2023, 164, 107624. [Google Scholar] [CrossRef]
  17. Dao, N.D.; Ryan, K.L. Soil–structure Interaction and Vertical-horizontal Coupling Effects in Buildings Isolated by Friction Bearings. J. Earthq. Eng. 2022, 26, 2124–2147. [Google Scholar] [CrossRef]
  18. Yıldız, Ö.; Doğan, E. Soil-structure interaction analysis of Çelebiağa Mosque, Pertek-Türkiye. Rev. De La Constr. 2022, 21, 749–766. [Google Scholar] [CrossRef]
  19. Yildiz, Ö.; Doğan, E.; Yamak, F.B. Seismic Soil-Structure Interaction of a Masonry Structure: Sungurbey Mosque. Int. J. Innov. Eng. Appl. 2021, 5, 237–249. [Google Scholar] [CrossRef]
  20. Mylonakis, G.; Gazetas, G. Seismic soil-structure interaction: Beneficial or detrimental? J. Earthq. Eng. 2000, 4, 277–301. [Google Scholar] [CrossRef]
  21. Vratsikidis, A.; Pitilakis, D.; Anastasiadis, A.; Kapouniaris, A. Evidence of soil-structure interaction from modular full-scale field experimental tests. Bull. Earthq. Eng. 2022, 20, 3167–3194. [Google Scholar] [CrossRef]
  22. TEC. Specifications for Structures to Be Built in Disaster Areas; Ministry of Public Works and Settlement; Government of Republic of Turkey: Ankara, Turkey, 1975.
  23. TEC. Ministry of Public Works and Settlement. Specification for Structures to Be Built in Disaster Areas; Government of Republic of Turkey: Ankara, Turkey, 1998.
  24. TEC. Turkish Earthquake Design Code, Ministry of Public Works and Settlement; Government of Republic of Turkey: Ankara, Turkey, 2007.
  25. TBEC. Turkey Building Earthquake Code; Republic of Turkey Ministry of Interior Disaster and Emergency Management Authority: Ankara, Turkey, 2018.
  26. Krawinkler, H. A few basic concepts for performance based seismic design. In Proceedings of the 11th World Conference on Earthquake Engineering, Acapulco, Mexico, 28 June 1996; p. 1133. [Google Scholar]
  27. TS500; Requirements for Design and Construction of Reinforced Concrete Structures. Turkish Standards Institution: Ankara, Turkey, 2000.
  28. Ozturk, M.; Arslan, M.H.; Dogan, G.; Ecemis, A.S.; Arslan, H.D. School buildings performance in 7.7 Mw and 7.6 Mw catastrophic earthquakes in southeast of Turkey. J. Build. Eng. 2023, 79, 107810. [Google Scholar] [CrossRef]
  29. Peker, O.; Fatih Altan, M. The Effect of Errors in Structural System Design on the Structure Damaged in 2023 Turkey Earthquakes: A Case Study. Eng. Fail. Anal. 2023, 157, 107923. [Google Scholar] [CrossRef]
  30. Bikçe, M.; Çelik, T.B. Failure analysis of newly constructed RC buildings designed according to 2007 Turkish Seismic Code during the October 23, 2011 Van earthquake. Eng. Fail. Anal. 2016, 64, 67–84. [Google Scholar] [CrossRef]
  31. Avcil, F. Investigation of Precast Reinforced Concrete Structures during the 6 February 2023 Türkiye Earthquakes. Sustainability 2023, 15, 14846. [Google Scholar] [CrossRef]
  32. Di Cesare, A.; Ponzo, F.C.; Vona, M.; Dolce, M.; Masi, A.; Gallipoli, M.R.; Mucciarelli, M. Identification of the structural model and analysis of the global seismic behaviour of a RC damaged building. Soil Dyn. Earthq. Eng. 2014, 65, 131–141. [Google Scholar] [CrossRef]
  33. Ozkul, T.A.; Kurtbeyoglu, A.; Borekci, M.; Zengin, B.; Kocak, A. Effect of shear wall on seismic performance of RC frame buildings. Eng. Fail. Anal. 2019, 100, 60–75. [Google Scholar] [CrossRef]
  34. CSI-SAP2000; Analysis Reference Manual. Computers and Structures Inc.: Berkeley, CA, USA, 2014.
  35. Ruggieri, S.; Calò, M.; Cardellicchio, A.; Uva, G. Analytical-mechanical based framework for seismic overall fragility analysis of existing RC buildings in town compartments. Bull. Earthq. Eng. 2022, 20, 8179–8216. [Google Scholar] [CrossRef]
  36. Rosti, A.; Del Gaudio, C.; Rota, M.; Ricci, P.; Di Ludovico, M.; Penna, A.; Verderame, G.M. Empirical fragility curves for Italian residential RC buildings. Bull. Earthq. Eng. 2021, 19, 3165–3183. [Google Scholar] [CrossRef]
  37. Del Gaudio, C.; Ricci, P.; Verderame, G.M.; Manfredi, G. Urban-scale seismic fragility assessment of RC buildings subjected to L’Aquila earthquake. Soil Dyn. Earthq. Eng. 2017, 96, 49–63. [Google Scholar] [CrossRef]
  38. Riga, E.; Karatzetzou, A.; Mara, A.; Pitilakis, K. Studying the uncertainties in the seismic risk assessment at urban scale applying the Capacity Spectrum Method: The case of Thessaloniki. Soil Dyn. Earthq. Eng. 2017, 92, 9–24. [Google Scholar] [CrossRef]
  39. Meguro, K.; Tagel-Din, H. Applied element method for structural analysis: Theory and application for linear materials. Struct. Eng. Earthq. Eng. 2000, 17, 31–45. [Google Scholar] [CrossRef] [PubMed]
  40. Domaneschi, M.; Cimellaro, G.P.; Scutiero, G. A simplified method to assess generation of seismic debris for masonry structures. Eng. Struct. 2019, 186, 306–320. [Google Scholar] [CrossRef]
  41. Sediek, O.A.; El-Tawil, S.; Mccormick, J.P. Impact of earthquake-induced debris on the seismic resilience of road networks. In Proceedings of the 17th World Conference of Earthquake Engineering, Sendai, Japan, 27 September–2 October 2020; pp. 13–18. [Google Scholar]
  42. STA4-CAD Structural Analysis for Computer Aided Design. 2020, V13.1. Available online: https://www.sta4.net/site/linked/sta4catolog.pdf (accessed on 4 February 2025).
  43. Sengor, A.M.C.; Gorur, N.; Saroglu, F. Strike-slip faulting and related basin formation in zones of tectonic escape: Turkey as a case study. Strike-Slip Deform. Basin Form Sediment. 1985, 37, 227–264. [Google Scholar] [CrossRef]
  44. Westaway, R. Present-day kinematics of the Middle East and eastern Mediterranean. J. Geophys. Res. 1994, 99, 12071–12090. [Google Scholar] [CrossRef]
  45. Dewey, J.F.; Hempton, M.R.; Kidd, W.S.F.; Saroglu, F.; Şengör, A.M.C. Shortening of continental lithosphere: The neotectonics of Eastern Anatolia-A young collision zone. Geol. Soc. Spec. Publ. 1986, 19, 1–36. [Google Scholar] [CrossRef]
  46. Arpat, E.; Saroglu, F. The East Anatolian Fault System: Thoughts on Its Development. Miner. Res. Explor. Inst. Turk. 1972, 78, 33–39. [Google Scholar]
  47. Arpat, E.; Şaroğlu, F. Türkiye’deki Bazı Önemli Genç Tektonik Olaylar Some recent tectonic events in Turkey. Maden Tetk. Ve Aram. Enstitüsü 1975, 18, 91–101. [Google Scholar]
  48. Saroglu, F.; Emre, O.; Kuscu, I. The East Anatolian Fault Zone of Turkey. Ann. Tectonicae 1992, 6, 99–125. [Google Scholar]
  49. Askan, A.; Altindal, A.; Aydin, M.F.; Erberik, M.A.; Kockar, M.; Tun, M.; Balaban, M.S.; Uygucgil, H.; Kop, A.; Karimzadeh, S.; et al. Assessment of urban seismic resilience of a town in eastern Turkiye: Turkoglu, Kahramanmaras before 2 and after 6 February 2023 M7.8 Kahramanmaras earthquake. Earthq. Spectra 2024, 41, 146–175. [Google Scholar] [CrossRef]
  50. Masing, G. Eigenspannungen Und Verfestigung Beim Messing. In Proceedings of the Proceedings, Second International Congress Of Applied Mechanics, Zurich, Switzerland; 1926; pp. 332–335. [Google Scholar]
  51. Chala, A.; Ray, R. Effects of Local Soil Profiles on Seismic Site Response Analysis. Period. Polytech. Civ. Eng. 2023, 68, 403–410. [Google Scholar] [CrossRef]
  52. Hosseinpour, V.; Saeidi, A.; Salsabili, M.; Nastev, M.; Nollet, M.J. Development of a probabilistic seismic microzonation software considering geological and geotechnical uncertainties. Georisk 2024, 18, 727–747. [Google Scholar] [CrossRef]
  53. Horri, K.; Mousavi, M.; Motahari, M.; Farhadi, A. Modeling and studying the impact of soil plasticity on the site amplification factor in ground motion prediction equations. J. Seismol. 2019, 23, 1179–1200. [Google Scholar] [CrossRef]
  54. Bapir, B.; Abrahamczyk, L.; Wichtmann, T.; Prada-Sarmiento, L.F. Soil-structure interaction: A state-of-the-art review of modeling techniques and studies on seismic response of building structures. Front. Built Environ. 2023, 9, 1120351. [Google Scholar] [CrossRef]
  55. Kramer, S.L. Geotechnical Earthquake Engineering; Prentice-Hall: Upper Saddle River, NJ, USA, 1996. [Google Scholar]
  56. Yıldız, Ö.; Çabalar, A.F. Analyzing seismic impact across regions: A comprehensive study of the Pazarcık and Elbistan earthquakes in Türkiye (February 6, 2023). J. Afr. Earth Sci. 2025, 223, 105463. [Google Scholar] [CrossRef]
  57. Yıldız, Ö. Integrated GIS-Based Mapping and ANFIS Modelling for Seismic and Geotechnical Characterization of Soil Properties. KSCE J. Civ. Eng. 2024, 28, 3708–3721. [Google Scholar] [CrossRef]
  58. Yıldız, Ö.; Zeybek, A.; Sönmezer, Y.B. Investigation of the earthquake-induced liquefaction and seismic amplifications after Pazarcık (Mw 7.7) and Elbistan (Mw 7.6) earthquakes. Environ. Earth Sci. 2024, 83, 1–21. [Google Scholar] [CrossRef]
  59. Cabalar, A.F.; Karabas, B.; Mahmutluoglu, B.; Yildiz, O. An IDW-based GIS application for assessment of geotechnical characterization in Erzincan, Turkey. Arab. J. Geosci. 2021, 14, 1–14. [Google Scholar] [CrossRef]
  60. T.C. Cumhurbaşkanlığı Strateji ve Bütçe Başkanlığı Kahramanmaraş ve Hatay Depremleri Raporu; 2023. Available online: https://www.sbb.gov.tr/wp-content/uploads/2023/03/2023-Kahramanmaras-ve-Hatay-Depremleri-Raporu.pdf (accessed on 4 February 2025).
  61. Ghasemof, A.; Mirtaheri, M.; Karami Mohammadi, R. Effects of demand parameters in the performance-based multi-objective optimum design of steel moment frame buildings. Soil Dyn. Earthq. Eng. 2022, 153, 107075. [Google Scholar] [CrossRef]
  62. FEMA (Federal Emergency Management Agency). Seismic Performance Assessment of Buildings; FEMA P-58-1; FEMA: Washington, DC, USA, 2018. [Google Scholar]
  63. Fajfar, P.; Gašperšič, P. The N2 method for the seismic damage analysis of RC buildings. Earthq. Eng. Struct. Dyn. 1996, 25, 31–46. [Google Scholar] [CrossRef]
  64. Yurdakul, Ö.; Duran, B.; Tunaboyu, O.; Avşar, Ö. Field reconnaissance on seismic performance of RC buildings after the January 24, 2020 Elazığ-Sivrice earthquake. Nat. Hazards 2021, 105, 859–887. [Google Scholar] [CrossRef]
  65. Baran, E.; Mertol, H.C.; Gunes, B. Damage in Reinforced-Concrete Buildings during the 2011 Van, Turkey, Earthquakes. J. Perform. Constr. Facil. 2014, 28, 466–479. [Google Scholar] [CrossRef]
  66. Mander, J.B.; Priestley, M.J.N.; Park, R. Theoretical Stress-Strain Model for Confined Concrete. J. Struct. Eng. 1988, 114, 8. [Google Scholar] [CrossRef]
  67. ASCE7 Minimum Design Loads and Associated Criteria for Buildings and Other Structures; ASCE: Reston, VA, USA, 2021.
  68. Kocaman, İ. The effect of the Kahramanmaraş earthquakes (Mw 7.7 and Mw 7.6) on historical masonry mosques and minarets. Eng. Fail. Anal. 2023, 149, 107225. [Google Scholar] [CrossRef]
  69. Erdik, M.; Ülker, Ö.; Şadan, B.; Tüzün, C. Seismic isolation code developments and significant applications in Turkey. Soil Dyn. Earthq. Eng. 2018, 115, 413–437. [Google Scholar] [CrossRef]
  70. Genç, A.F.; Ergün, M.; Günaydin, M.; Altunişik, A.C.; Ateş, Ş.; Okur, F.Y.; Mosallam, A.S. Dynamic analyses of experimentally-updated FE model of historical masonry clock towers using site-specific seismic characteristics and scaling parameters according to the 2018 Turkey building earthquake code. Eng. Fail. Anal. 2019, 105, 402–426. [Google Scholar] [CrossRef]
  71. Yel, N.S.; Arslan, M.H.; Aksoylu, C.; Erkan, İ.H.; Arslan, H.D.; Işık, E. Investigation of the Earthquake Performance Adequacy of Low-Rise RC Structures Designed According to the Simplified Design Rules in TBEC-2019. Buildings 2022, 12, 1722. [Google Scholar] [CrossRef]
  72. NA to SS EN 1998-1 : 2013 Design of structures for earthquake resistance-Part 1 : General rules, seismic actions and rules for buildings. Singap. Stand. 2004, 1, 231.
  73. Karasin, I.B. Comparative Analysis of the 2023 Pazarcık and Elbistan Earthquakes in Diyarbakır. Buildings 2023, 13, 2474. [Google Scholar] [CrossRef]
  74. Alpyürür, M.; Ulutaş, H. Comparison of Performance Analysis Results with Developed Site-Specific Response Spectra and Turkish Seismic Design Code: A Case Study from the SW Türkiye Region. Buildings 2024, 14, 1233. [Google Scholar] [CrossRef]
  75. Büyüksaraç, A.; Işık, E.; Bektaş, Ö. A Comparative Evaluation of Earthquake Code Change on Seismic Parameter and Structural Analysis; A case of Turkey. Arab. J. Sci. Eng. 2022, 47, 12301–12321. [Google Scholar] [CrossRef]
  76. Karimzadeh, S.; Askan, A.; Erberik, M.A.; Yakut, A. Seismic damage assessment based on regional synthetic ground motion dataset: A case study for Erzincan, Turkey. Nat. Hazards 2018, 92, 1371–1397. [Google Scholar] [CrossRef]
  77. Koc, A.B.; Erberik, M.A.; Askan, A.; Karimzadeh, S. The Sensitivity of Global Structural Parameters for Unreinforced Masonry Buildings Subjected to Simulated Ground Motions. Buildings 2023, 13, 2060. [Google Scholar] [CrossRef]
  78. Altindal, A.; Karimzadeh, S.; Erberik, M.A.; Askan, A.; Anil, O.; Kockar, M.K.; Sahmaran, M. A case study for probabilistic seismic risk assessment of earthquake-prone old urban centers. Int. J. Disaster Risk Reduct. 2021, 61, 102376. [Google Scholar] [CrossRef]
  79. Erdem, H. BuruDüzensïzlïğïnïn BetonarmKïrïşler Ve KolonlarÜzerïnEtkïlerï. Ömer Halisdemir Üniversitesi Mühendislik Bilim. Derg. 2016, 5, 148–156. [Google Scholar] [CrossRef]
  80. Abdel Raheem, S.E.; Ahmed, M.M.M.; Ahmed, M.M.; Abdel-shafy, A.G.A. Evaluation of plan configuration irregularity effects on seismic response demands of L-shaped MRF buildings. Bull. Earthq. Eng. 2018, 16, 3845–3869. [Google Scholar] [CrossRef]
  81. Akçaer, G.; Banu, N.; Soyluk, A. Earthquake resistant building design education and architecture. In Proceedings of the Third National Conference on Earthquake Engineering and Seismology (3TDMSK); Dokuz Eylul University (DEU), İzmir, Turkey; Dokuz Eylul University (DEU): İzmir, Turkey, 2015. [Google Scholar]
  82. Gokdemir, H.; Ozbasaran, H.; Dogan, M.; Unluoglu, E.; Albayrak, U. Effects of torsional irregularity to structures during earthquakes. Eng. Fail. Anal. 2013, 35, 713–717. [Google Scholar] [CrossRef]
  83. Richart, F.E.; Brandtzæg, A.; Brown, R.L. A Study of the Failure of Concrete Under Combined Compressive Stresses; University of Illinois at Urbana Champaign: Hampaign, IL, USA, 1928; Volume 26. [Google Scholar]
Figure 1. A seismic hazard map of Türkiye.
Buildings 15 00521 g001
Figure 2. The flowchart of the utilized methodology.
Buildings 15 00521 g002
Figure 3. The epicentral distances to the city centers in the impact region of (a) Pazarcık and (b) Elbistan earthquakes.
Buildings 15 00521 g003
Figure 4. Ground motion records showing velocity, displacement, and spectral acceleration for (ad) Pazarcık EW (TK 4615 Pazarcık station) and (eh) Elbistan NS earthquakes (TK 4612 Goksun station).
Buildings 15 00521 g004
Figure 5. Adopted parameters along the soil profile.
Buildings 15 00521 g005
Figure 6. Site response analysis results of the soil profile under Pazarcık (EW) earthquake motion recorded by (a) KM1, (b) KM2, (c) KM3, (d) KM8, (e) KM10, (f) KM11, and (g) KM7 stations.
Buildings 15 00521 g006
Figure 7. Site response analysis results of the soil profile under Elbistan (NS) earthquake motion recorded by (a) KM4, (b) KM5, (c) KM6, (d) KM14, and (e) KM9 stations.
Buildings 15 00521 g007
Figure 8. Site location map of the building.
Buildings 15 00521 g008
Figure 9. The outside views of the building: (a) front view, (b) right frontal view, and (c) left frontal view.
Buildings 15 00521 g009
Figure 10. Normal floor ceiling plan.
Buildings 15 00521 g010
Figure 11. Determination of (a) characteristic compressive strength of concrete by drilling core and (b) reinforcement detail by stripping the concrete.
Buildings 15 00521 g011
Figure 12. The efflorescence of concrete in the basement floor.
Buildings 15 00521 g012
Figure 13. Damages caused by earthquake in the building: (ac) damages to the partition walls, (dh) damages to the load-bearing system elements.
Buildings 15 00521 g013
Figure 14. Damage areas for ductile sections.
Buildings 15 00521 g014
Figure 15. Three-dimensional STA4CAD model of building.
Buildings 15 00521 g015
Figure 16. Three-dimensional SAP 2000 model of building.
Buildings 15 00521 g016
Figure 17. Determination of horizontal elastic design spectrum.
Buildings 15 00521 g017
Figure 18. X-direction nonlinear pushover analysis results.
Buildings 15 00521 g018
Figure 19. Y-direction nonlinear pushover analysis results.
Buildings 15 00521 g019
Figure 20. The view of the plastic hinges of the building.
Buildings 15 00521 g020
Figure 21. The mass and stiffness center locations of the structure.
Buildings 15 00521 g021
Table 1. Dimensions and reinforcement details of the columns and beams.
Structural ElementDimension (cm/cm)Section NameLongitudinal Bars
Column25/60Basement G-11 Axis8Ø16
25/50Basement K-9 Axis6Ø14
25/60Ground I-12 Axis12Ø16
25/80Ground J-5 Axis12Ø16
25/601Th Normal Floor C-12 Axis12Ø16
25/601Th Normal Floor G-2 Axis8Ø16
25/502Th Normal Floor K-10 Axis6Ø14
25/502Th Normal Floor E-12 Axis6Ø14
25/703Th Normal Floor D-10 Axis10Ø16
25/503Th Normal Floor J-12 Axis8Ø14
25/504Th Normal Floor J-12 Axis8Ø14
25/504Th Normal Floor K-4 Axis8Ø14
25/705Th Normal Floor K-4 Axis10Ø16
25/705Th Normal Floor H-10 Axis10Ø16
25/506Th Normal Floor H-10 Axis8Ø14
25/506Th Normal Floor K-3 Axis6Ø14
25/507Th Normal Floor E-12 Axis6Ø14
25/607Th Normal Floor G-2 Axis8Ø16
Beam30/70Basement 10 (J-K) Axis3Ø14
30/70Ground 10 (J-I) Axis3Ø14
20/651Th Normal Floor E (11-12) Axis2Ø14
20/652Th Normal Floor 12 (B-C) Axis2Ø14
20/653Th Normal Floor E (11-12) Axis2Ø14
20/654Th Normal Floor A (8-10) Axis2Ø14
20/655Th Normal Floor 12 (B-C) Axis2Ø14
20/656Th Normal Floor 12 (I-J) Axis2Ø14
20/657Th Normal Floor E (11-12) Axis2Ø14
Table 2. Concrete compressive strength values obtained from core samples of the building.
Structural ElementSection NameCompressive Strength (MPa)
ColumnBasement K-3 Axis10.31
Basement M-12 Axis10.07
Basement H-10 Axis3.47
Ground J-12 Axis9.51
Ground G-2 Axis12.69
Ground E-12 Axis9.63
1Th Normal Floor J-12 Axis10.86
1Th Normal Floor K-3 Axis13.82
2Th Normal Floor F-10 Axis16.44
2Th Normal Floor C-3 Axis8.48
3Th Normal Floor K-10 Axis13.02
3Th Normal Floor A-10 Axis6.13
4Th Normal Floor D-5 Axis12.55
4Th Normal Floor A-10 Axis9.37
5Th Normal Floor F-13 Axis6.13
5Th Normal Floor I-12 Axis7.21
6Th Normal Floor K-5 Axis11.00
6Th Normal Floor K-3 Axis10.06
7Th Normal Floor G-9 Axis6.48
7Th Normal Floor D-10 Axis13.18
Average10.02
Standard Deviation3.13
Table 3. Plastic rotations based on damage limits [23].
Damage Limits Plastic   Rotations   ( Q p )
Minimum Damage (MD) Q P M D = 0
Controlled Damage (CD) Q P C D = 0.75 Q P E D
Excessive Damage (ED) Q P E D = 2 3 ϕ u ϕ y L p 1 0.5 L p L s + 4.5 ϕ u d b
  ϕ u : maximum curvature, ϕ y : yield curvature, L p : plastic hinge length, L s : shear span, d b : diameter of longitudinal reinforcement.
Table 4. Earthquake ground motion levels based on TBEC-2018.
Ground MotionRepetition YearProbability of Exceedance (%)Definition
DD124752Maximum expected earthquake
DD247510Standard design earthquake
DD37250Frequent earthquake
DD44368Service earthquake
Table 5. Beam damage percentages of beams after loading.
Story No.(−X)(+X)(−Y)(+Y)
LDSDADCLDSDADCLDSDADCLDSDADC
792.08.00.00.096.04.00.00.022.977.10.00.022.977.10.00.0
632.068.00.00.038.062.00.00.08.391.70.00.08.391.70.00.0
58.092.00.00.08.092.00.00.08.391.70.00.08.391.70.00.0
48.092.00.00.08.092.00.00.08.391.70.00.08.391.70.00.0
318.054.028.00.018.058.024.00.08.389.62.10.08.391.70.00.0
218.02.072.08.020.00.076.04.08.389.62.10.08.391.70.00.0
116.02.010.072.016.02.014.068.016.779.24.20.016.783.30.00.0
Ground16.00.04.080.016.00.04.080.016.783.30.00.016.783.30.00.0
Basement100.00.00.00.0100.00.00.00.096.23.80.00.01000.00.00.0
LD: limited damage, SD: significant damage, AD: advanced damage, C: collapse.
Table 6. Column damage percentages of beams after loading.
Story No.(−X)(+X)(−Y)(+Y)
LDSDADCLDSDADCLDSDADCLDSDADC
7100.00.00.00.0100.00.00.00.099.20.80.00.097.82.20.00.0
687.512.50.00.087.612.40.00.090.19.90.00.086.413.60.00.0
554.145.90.00.053.946.10.00.068.231.80.00.066.833.20.00.0
446.947.95.20.046.749.53.80.050.249.80.00.052.647.40.00.0
336.158.12.43.436.757.52.43.438.062.00.00.033.360.43.13.2
218.974.30.06.819.573.91.84.920.077.71.21.022.070.51.26.2
112.877.26.93.115.077.83.63.612.276.38.53.011.477.28.43.0
Ground10.574.86.97.910.975.59.04.54.580.60.014.95.578.16.310.1
Basement49.449.50.01.149.449.60.01.183.016.60.00.488.110.90.80.2
LD: limited damage, SD: significant damage, AD: advanced damage, C: collapse.
Table 7. Story seismic displacement of buildings.
Story No.9. Combination10. Combination11. Combination12. Combination
δx (m)ϴz (rad)δx (m)ϴz (rad)δx (m)ϴz (rad)δx (m)ϴz (rad)
70.05794960.00003790.05794960.0000379−0.0502650.0000089−0.0502650.0000089
60.05436920.00003360.05436920.0000336−0.0468840.0000083−0.0468840.0000083
50.04905680.00002960.04905680.0000296−0.0422160.0000075−0.0422160.0000075
40.04239350.00002440.04239350.0000244−0.0363840.0000065−0.0363840.0000065
30.03478500.00001830.03478500.0000183−0.0296260.0000052−0.0296260.0000052
20.02645230.00001150.02645230.0000115−0.0221690.0000037−0.0221690.0000037
10.01750830.00000470.01750830.0000047−0.0143010.0000021−0.0143010.0000021
Ground0.0082529−0.0000000.0082529−0.000000−0.0066370.0000008−0.0066370.0000008
Basement0.0007090−0.0000000.0007090−0.000000−0.0009050.0000000−0.0009050.0000000
Disclaimer/Publisher’s Note: The statements, opinions and data contained in all publications are solely those of the individual author(s) and contributor(s) and not of MDPI and/or the editor(s). MDPI and/or the editor(s) disclaim responsibility for any injury to people or property resulting from any ideas, methods, instructions or products referred to in the content.

