1. Introduction
Noise pollution in cities is a widespread source of discomfort and psychological issues, affecting speech comprehension, sleep quality, concentration, productivity, and children’s learning abilities [
1]. The primary sources of urban noise pollution are human activities, particularly road traffic [
2]. Rapid urbanization has led to overcrowding and a disconnect between environmental noise considerations and urban planning. Limited building space often results in construction along major thoroughfares, exposing residents to severe noise pollution [
3,
4].
Green walls in urban environments provide a wide array of ecosystem services, such as enhanced biodiversity, improved water management, energy conservation in buildings, reduction of the urban heat island effect, particulate matter capture, improved air quality, and noise mitigation. These benefits are essential for climate change adaptation and mitigation in cities [
5,
6,
7,
8,
9,
10,
11,
12,
13,
14]. In addition to these environmental advantages, various studies highlight the potential of vertical gardens to improve acoustics both outdoors and indoors. A significant study revealed that green walls can reduce environmental noise levels by up to 10 decibels, significantly outperforming traditional materials like concrete or glass [
15]. The acoustic effectiveness of these walls depends on factors such as plant species composition, vegetation density, and substrate characteristics. Further research provides evidence of the efficiency of green walls as sound-absorbing systems, noting that specific substrate depths and plant configurations can achieve sound absorption coefficients exceeding 0.60 [
16]. In interior spaces, vertical gardens also offer considerable acoustic benefits. It has been demonstrated that indoor green walls can reduce reverberation time in mid-frequency ranges, significantly enhancing speech intelligibility in enclosed spaces [
8,
17,
18]. Additionally, indoor vertical gardens can absorb up to 70% of sound energy at certain frequencies, effectively dampening noise from office equipment and human activities [
19]. In summary, research has shown that urban vegetation can positively impact human health by reducing noise [
20,
21]. Specifically, the sound absorption coefficient of green walls has been studied using various methods [
6,
17,
22,
23,
24,
25]. Most studies have focused on laboratory tests using impedance tubes or reverberation chambers to analyze the behavior of components like stems, branches, leaves, and substrates. However, there is growing interest in understanding how these systems perform under real-world conditions [
26,
27].
In a green wall, the substrate absorbs 80% of the energy received at frequencies above 1000 Hz, behaving like other porous materials with sound reduction proportional to noise frequency [
21]. Some studies have observed decreased absorption coefficients with increased substrate humidity, especially at medium and high frequencies, due to reduced porosity [
18,
28]. Regarding vegetation, although it is complex and challenging to model it theoretically for sound absorption coefficient prediction, density is the most significant factor. While individual leaves have minimal effect on sound attenuation, their cumulative effect or density contributes to increased absorption. Leaf vibration and multiple scattering aid in dissipating the incident sound wave energy. Studies have shown that above 2000 Hz, the absorption coefficient slightly decreases with increasing vegetation cover, attributed to increased reflection from larger leaf areas [
21]. However, the overall acoustic performance of green walls is a result of the combined effects of different plant components. Stems and branches contribute to sound scattering, particularly at mid to high frequencies, while leaves play a crucial role in sound absorption across a wide frequency range. The thickness of the plant layer also influences its acoustic properties, with thicker vegetation generally providing better sound absorption [
17,
18].
In general, the majority of published research on green walls has predominantly focused on thermal aspects, design considerations, vegetation characteristics, phytoremediation capabilities, and economic factors. Nevertheless, the growing trend of interdisciplinary research and the exploration of sustainable materials continue to make the study of their acoustic behavior highly intriguing, particularly the investigation of their acoustic performance post-installation. In this context, this study evaluates the acoustic performance of green modules by measuring the substrate’s absorption coefficient and examining how various plant species influence the sound absorption coefficient in both controlled laboratory environments and real-world settings. The research uses an impedance gun, a tool that allows for measurements in controlled lab environments and in situ conditions. This study appears to be the first instance where an impedance gun has been used to measure the sound absorption coefficient in green modules. The objective is to verify whether the findings obtained in the laboratory are maintained once these green modules are installed under real conditions, such as on the facade of a building. Although it would be desirable to conduct parallel tests, we will use the data published in the literature to date, primarily those obtained from standardized techniques, as a starting point to confirm that the results obtained with the impedance gun are consistent.
2. Materials and Methods
This section details the geometry of the modules and the plant species examined in the laboratory. A subsequent section is devoted to the on-site installation and the species evaluated in field conditions. Finally, the impedance gun technique and the methodology employed are described.
2.1. Green Wall Modules
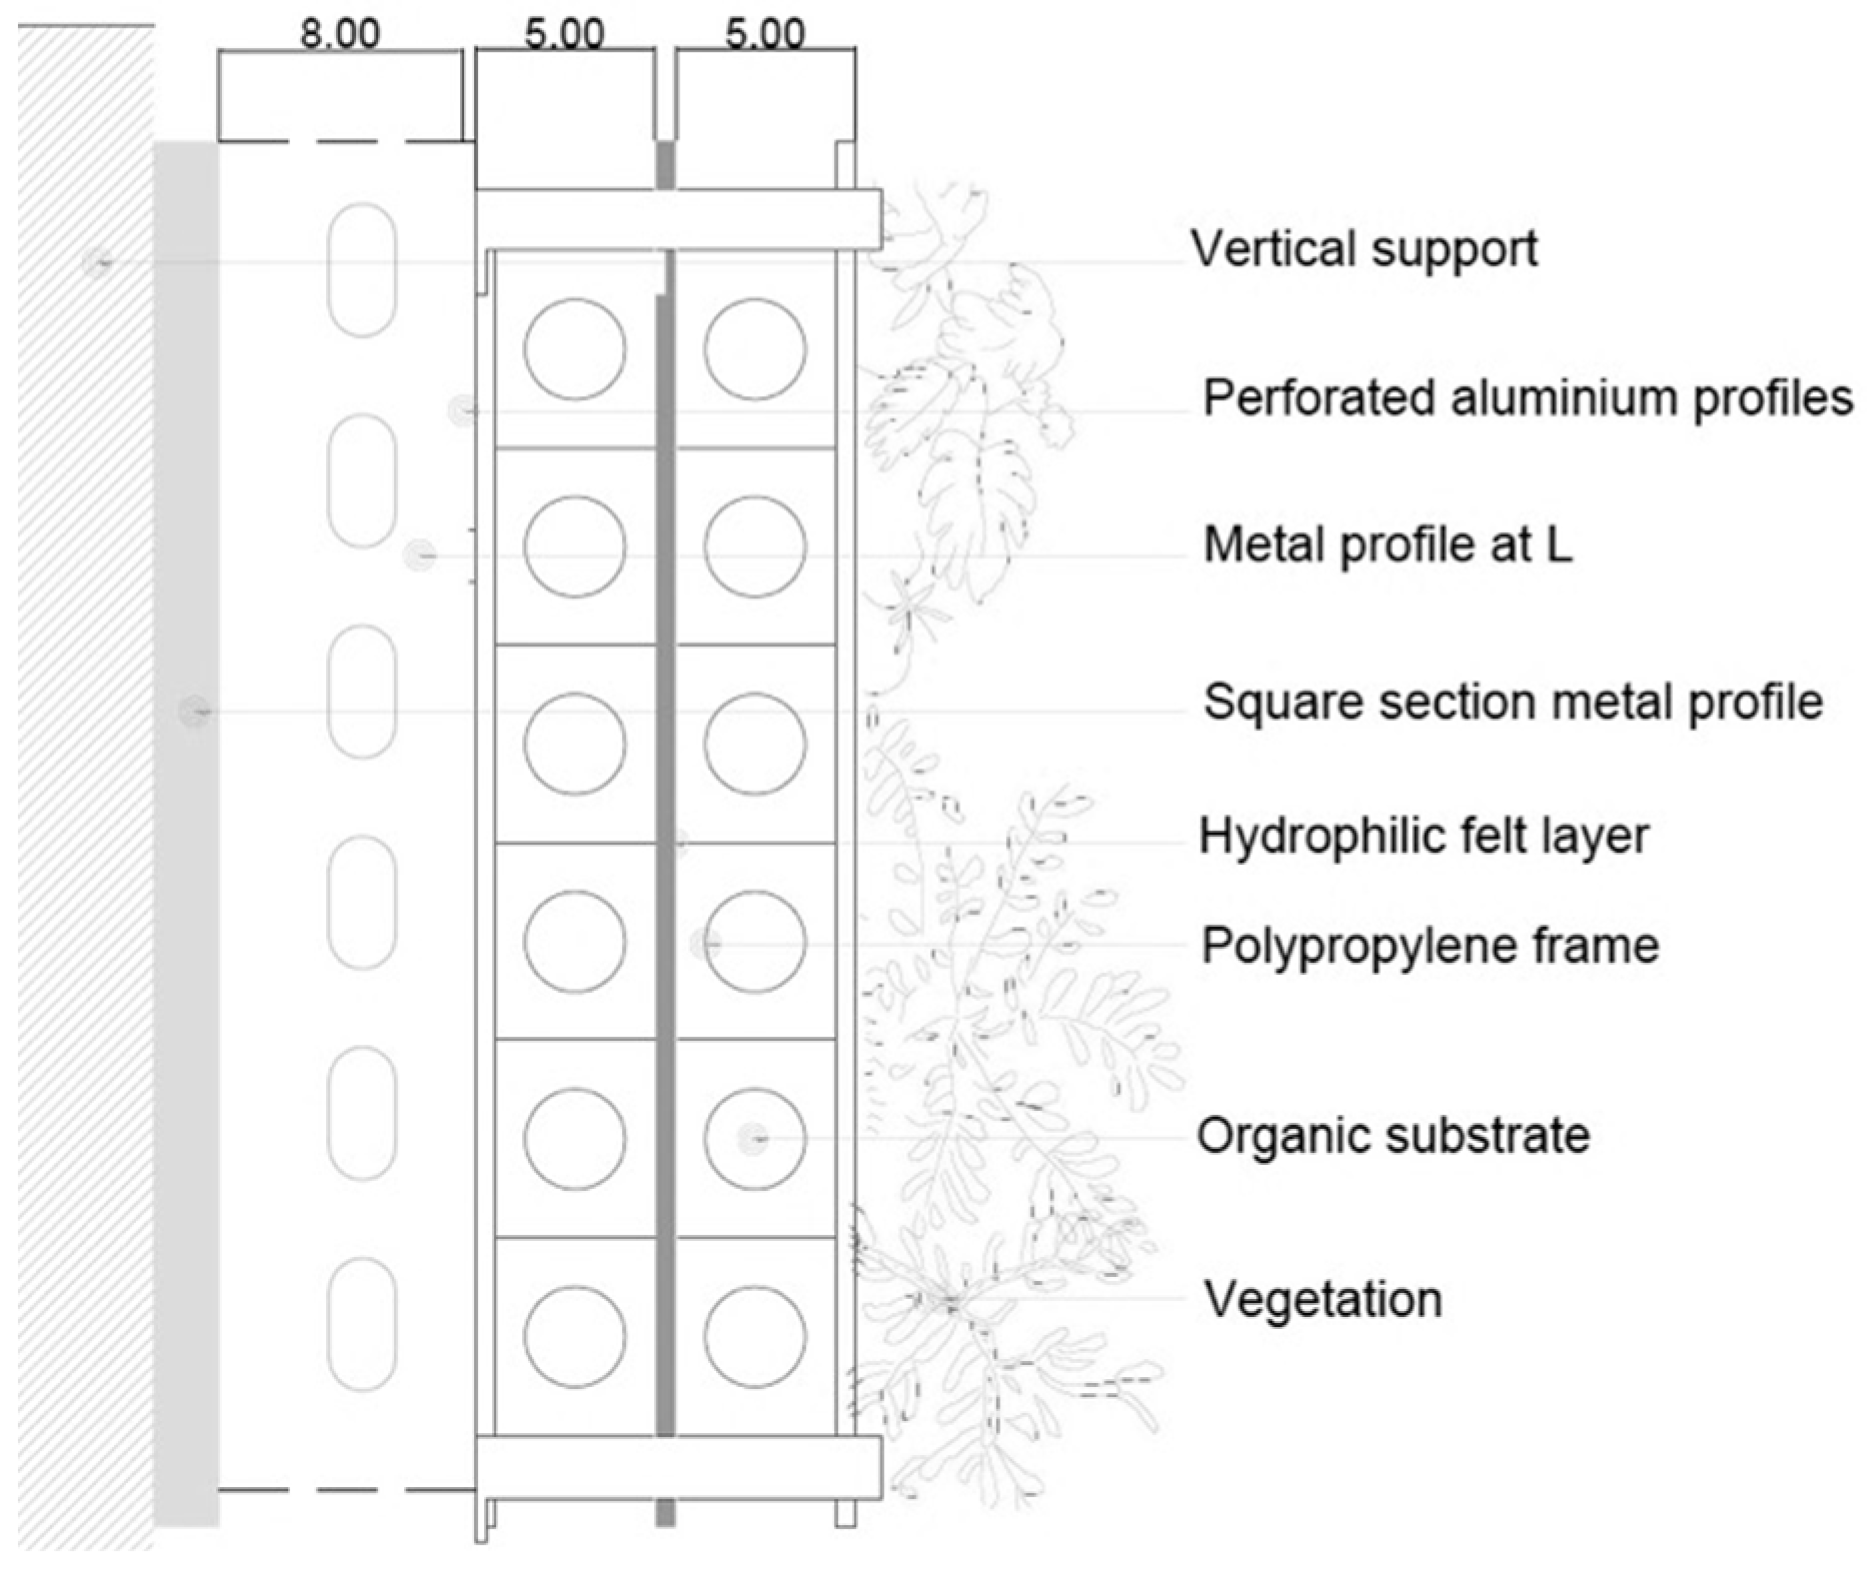
Experiments have been conducted on a green wall module, primarily used for façades and green roofs. The module consists of a three-dimensional structure made from recycled polyethylene with a cellular design, filled with substrate and plants. A felt layer forms the module’s outer surface, serving dual purposes: maintaining humidity within the module and preventing vegetation detachment. Each modular unit contains an organic and sustainable substrate comprising coconut fiber, turf, and humus.
Figure 1 and
Table 1 provide detailed information about the system components.
This organic system offers several advantages. It significantly reduces water consumption, requiring only about 8 L/m2 per day in extreme heat and as little as 2 L/m2 under normal conditions. The system’s organic substrate minimizes or eliminates the need for fertilizers by leveraging natural processes to provide essential nutrients for plant growth. Furthermore, maintenance requirements are minimal, as the natural substrates promote balanced plant nutrition and growth, typically necessitating pruning just once or twice annually.
2.2. Lab Measurements
Acoustic absorption coefficient measurements were conducted on a single vegetation module under laboratory conditions. The study evaluated the effects of both substrate and vegetation on the module’s acoustic absorption. For the laboratory tests, two plant species were selected:
Hedera helix (common ivy) and grass.
Hedera helix was chosen due to its prevalence and its status as one of the most studied species in vertical green modules for evaluating thermal regulation capacity and atmospheric particle fixation [
29,
30,
31]. Grass was selected for its markedly different morphology compared to
Hedera helix.
Additionally, these measurements served to validate the methodology by comparing the obtained results with those of other researchers who used impedance tubes or reverberation chambers. Furthermore, they provided a reference point for evaluating the results of in situ measurements.
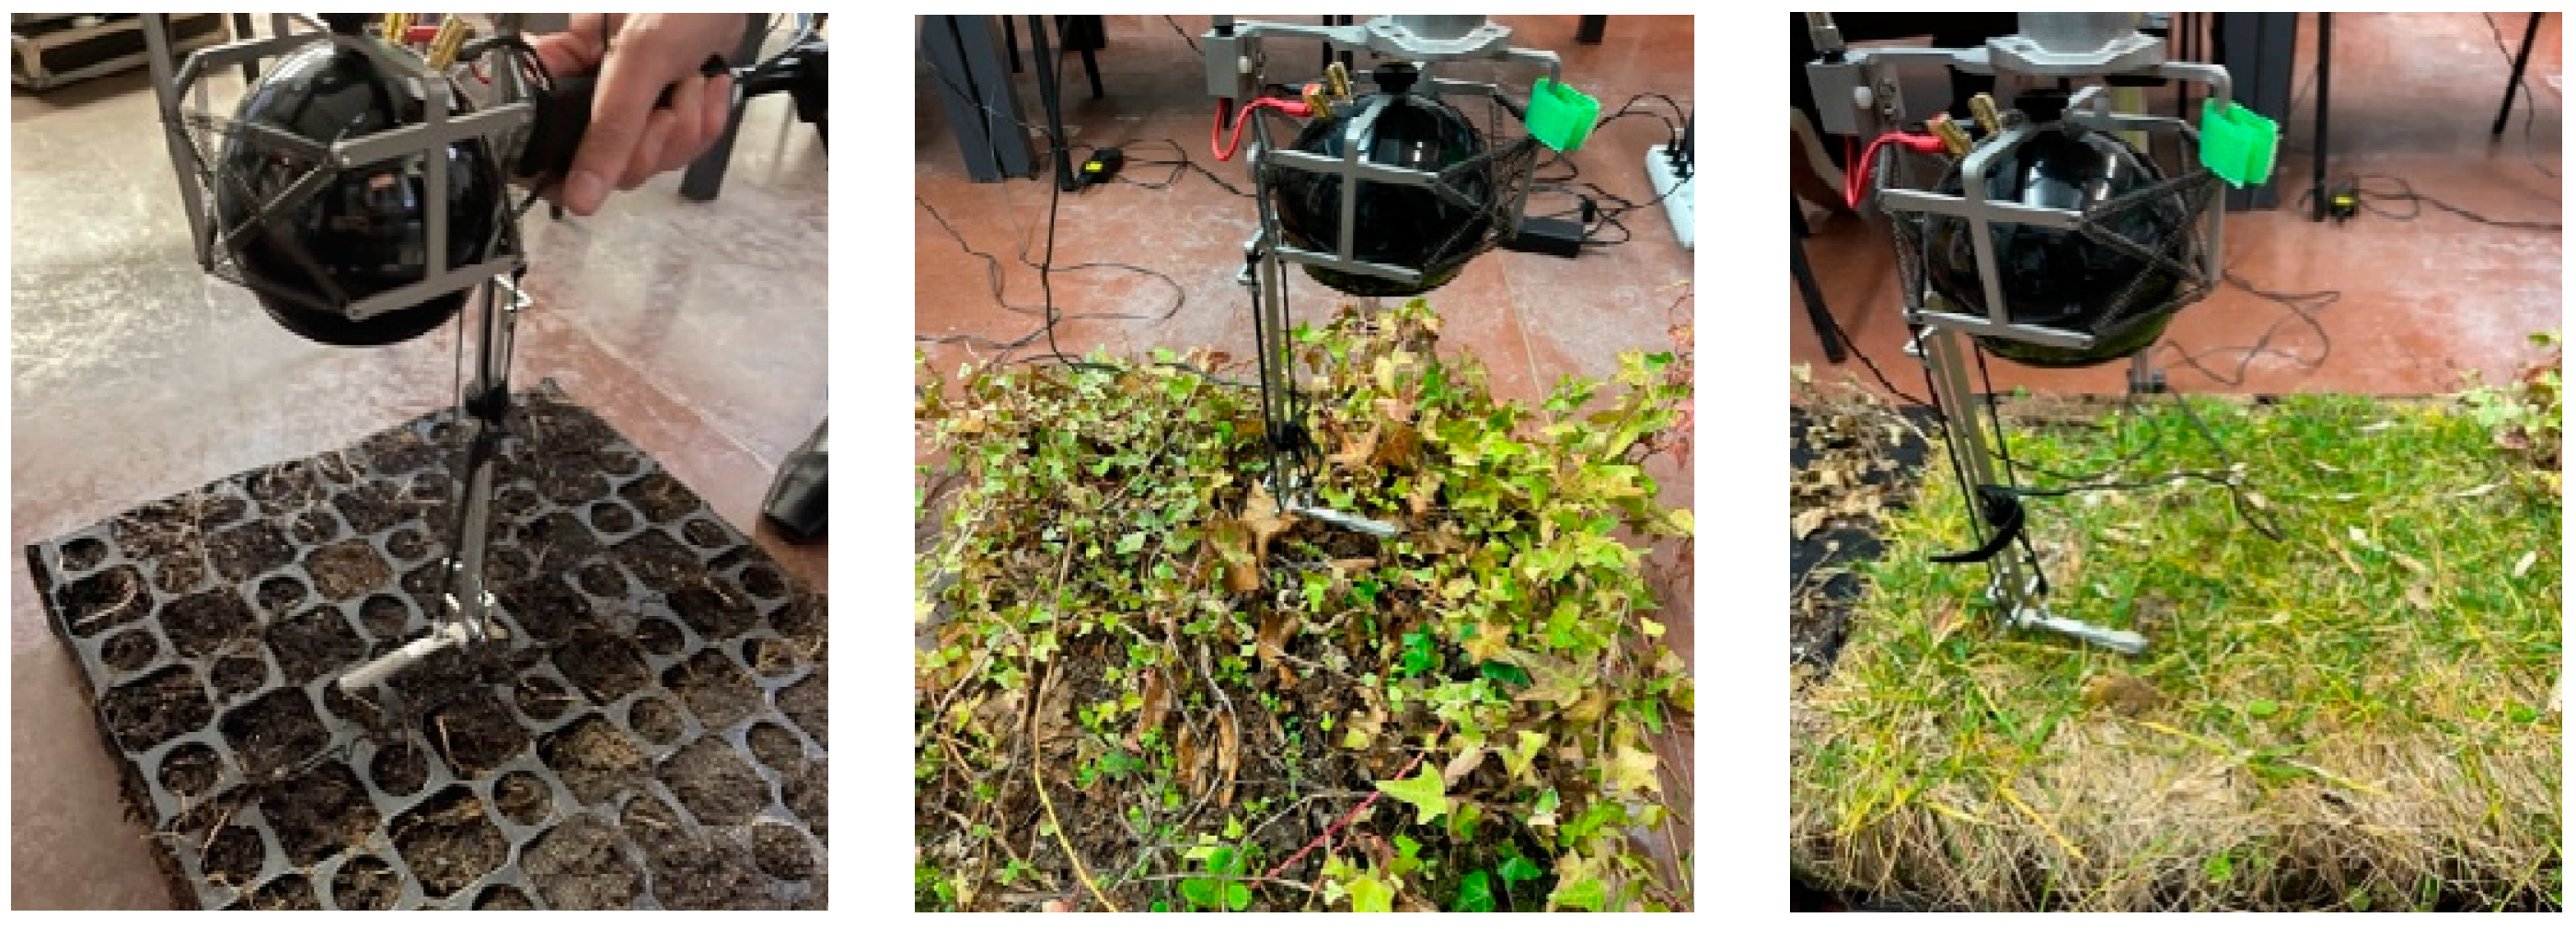
Figure 2 displays images of the module and the plant species assessed in the laboratory. The characteristics of the two species chosen for laboratory testing are detailed in
Table 2.
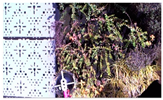
2.3. Green Wall Façade
In situ measurements were conducted at the Innovation and Technology for Development Center (itdUPM) of the Technical University of Madrid in Spain. The building features a perforated metal plate façade that envelops all sides, creating a 20 cm air gap between the concrete wall and the outer skin. Green modules cover select areas of the façade, specifically 11.25 m2 on the south-facing side and 10 m2 on the west-facing side.
The green modules used in the façade construction are identical to those employed in laboratory tests. These modules are mounted onto the façade’s metal structure using an empty polypropylene framework, as illustrated in
Figure 3. This configuration creates a hollow space for air circulation. The façade comprises several layers, arranged from interior to exterior as follows: vertical support, square-section metal profile, air gap, L-shaped metal profile, perforated aluminum profiles, polypropylene structure, hydrophilic felt layer, and finally, a polypropylene structure containing substrate and vegetation. The façade is equipped with an exudation irrigation system, ensuring uniform water distribution across the entire surface. Each module houses 16 plants, resulting in a density of 64 plants per square meter.
The sound absorption coefficient was measured for ten plant species integrated into the green modules of the building’s façade.
Table 3 provides a detailed description of the morphological characteristics of these evaluated species, while
Figure 4 presents photographic images of each plant.
2.4. Impedace Gun
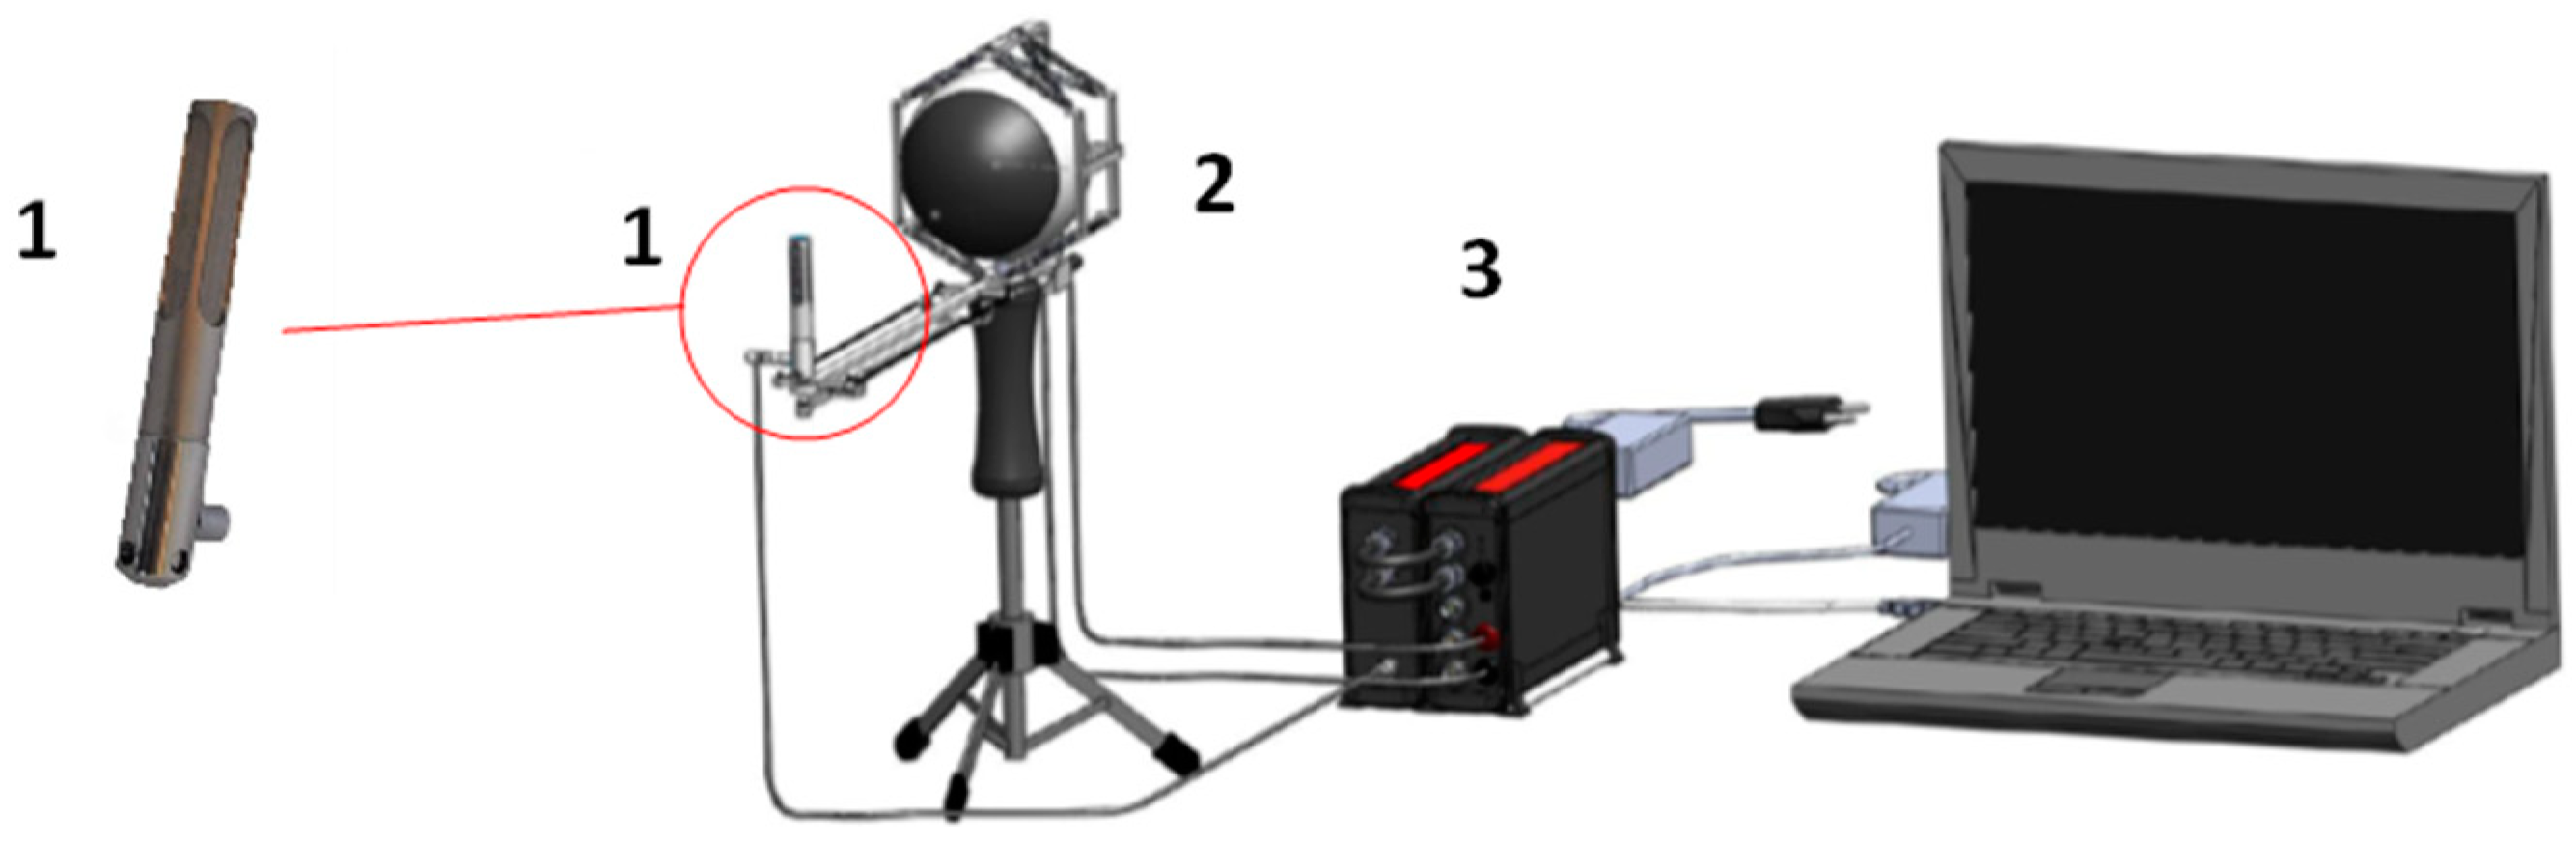
The sound absorption coefficient measurements, conducted both in laboratory settings and in situ, were performed using an impedance gun supplied by Microflown Technologies [
32,
33,
34,
35,
36]. The impedance gun comprises a small 15 cm diameter spherical loudspeaker as a sound source, a pressure–particle velocity (PU) sensor (model 2019-07) that measures both sound pressure and particle velocity, and a hand-held bracket allowing the user to manipulate the device while maintaining a constant 27 cm distance (
Figure 5) [
34]. Vibrations through the set-up frame, which can affect measurements, were reduced using multiple springs and elastic bands.
In any sound field, two complementary acoustic properties describe a single point: a scalar sound pressure and a vector particle velocity. For a single-frequency sound field in each direction, the specific acoustic impedance Z in a medium is defined as the complex ratio of sound pressure p to particle velocity u
dir in the specified direction at the same point:
The p-u probe, due to its compact design, can simultaneously measure sound pressure and acoustic particle velocity at a single point near the sample surface. This simultaneous measurement capability allows for the direct calculation of acoustic impedance at that specific point [
32,
33,
34]. When a known sound source is used, a model can describe the sound field, and the absorption of the sample’s surface can be calculated from the measured impedance. It assumes that the material under test is exposed to a plane wave of normal incidence, and the specific impedance from the material is related to the reflection coefficient R by:
and the absorption coefficient can directly be calculated from the reflection coefficient [
37].
The calculations were performed using Velo software (32 BIT) from the same company. A handheld device was connected to a laptop computer via a Microflown MFSC-2 signal conditioner [
3]. The laptop collected the measured signals and performed the required calculations. The software implemented plane wave, mirror source, and Q-term models, which can be applied to calculate material impedance. Atmospheric conditions, pressure and temperature, are incorporated into the calculation models. Previous research has demonstrated that not all models exhibit equal sensitivity to factors such as the distance between the probe and the measured surface, as well as the measurement environment. As a result, the plane wave model was chosen to calculate the sound absorption coefficient in this work. This model was selected due to its near-insensitivity to changes in the measurement environment and the distance from the surface. However, it is advisable to conduct measurements at shorter distances [
38]. The frequency measurement range was set between 200 and 8000 Hz. The user must specify the measurement range and frequency resolution at which results are displayed (e.g., octave bands, third-octave bands, or narrow frequency bands). While reflections from surrounding objects can potentially influence results, research has shown that in most relevant environments, their impact on test outcomes is minimal, primarily due to the small distances between the sample and the p-u probe. Nevertheless, the impedance gun was calibrated [
36] prior to conducting measurements. This calibration process involved pointing the impedance gun towards the best achievable free field conditions, far from any reflective surfaces.
The Velo software enables the operation of the impedance gun in Scan and Paint mode, facilitating continuous acquisition of pressure and particle velocity data and rapid visualization of surface sound fields [
39,
40,
41]. This process involves manually moving the p-u probe across the material’s measurement surface while simultaneously recording surface images using a webcam positioned at a specific distance. To determine the probe’s position from the video footage, an automatic tracking algorithm detects the probe’s color marking.
The measurement area is discretized into numerous grid sections, incorporating an additional time dimension to segment the original signal and assign each segment to a position within the measurement area. This data can then be linearly interpolated to represent the variation of the sound absorption coefficient across the surface. Furthermore, from the data acquired during the scan, the Velo software enables the calculation of the average sound absorption coefficient for any selected area within the scanned zone.
2.5. Metodology
The acoustic absorption curve of the modules is obtained by averaging the values acquired using Scan and Paint in the central region of the module, approximately 20 cm × 20 cm. One of the main concerns when measuring the absorption coefficient of an acoustic sample under laboratory conditions using the impedance gun is the influence of the sample’s finite dimensions. Generally, the mathematical model used to derive surface impedance assumes that the sample is infinite. The effect of finiteness results in a series of oscillations around the absorption curve [
36,
42,
43]. Calculating the absorption curve based on the average values obtained from a central area measuring 20 cm × 20 cm—approximately 15 cm from the edge of the module—minimizes the effects associated with its finite size while providing a representative value of its acoustic behavior. The absorption coefficient results are presented in octave bands, as this is the conventional format utilized in regulations and widely adopted in standard design and simulation tools in the field of acoustics.
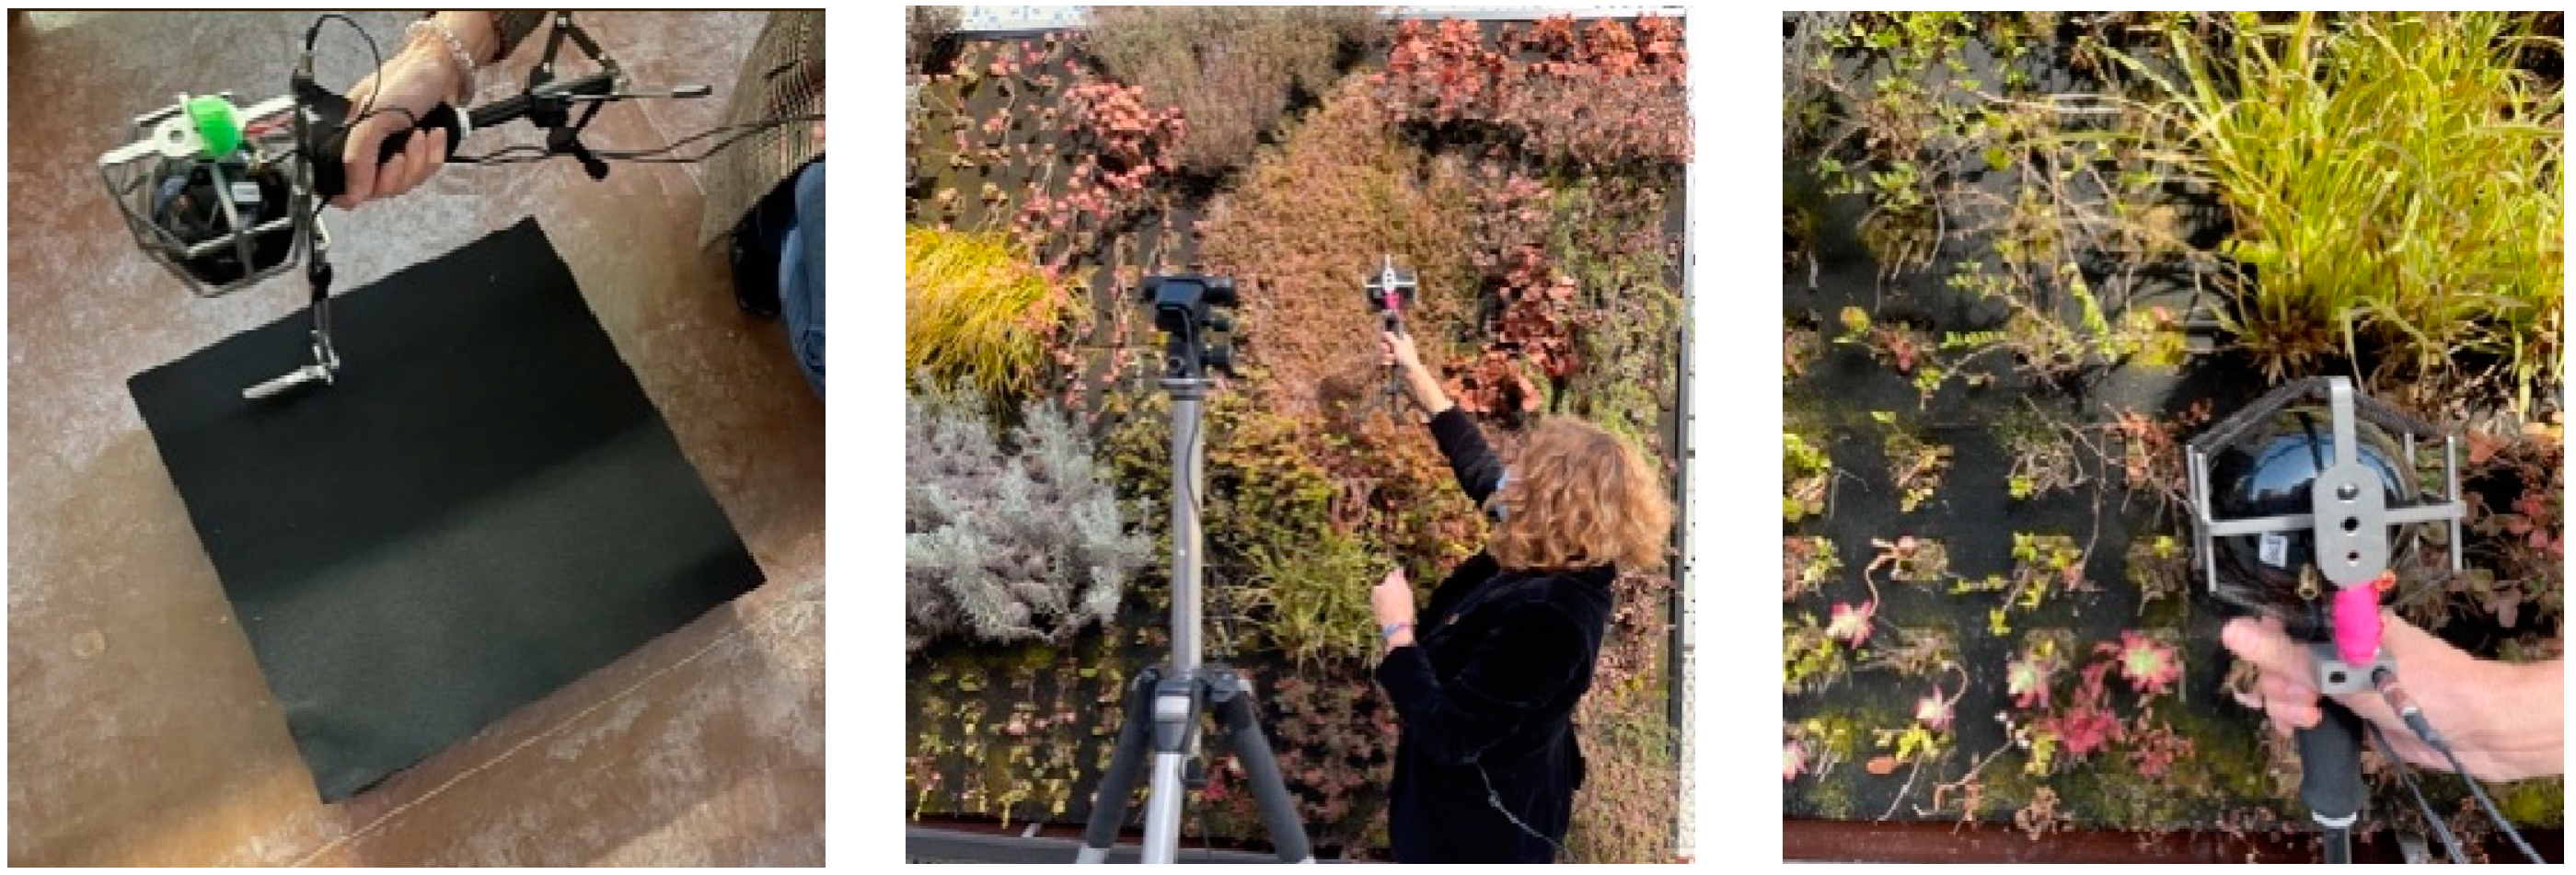
Figure 6 shows photos of measurements processes in the laboratory and in situ.
Scan and Paint is an effective sound visualization technique with diverse applications, including vibroacoustic assessment, material characterization, intensity vector field mapping, and far-field localization on various surface types. Various examples demonstrating the technique’s capabilities have been presented [
39,
40,
43,
44]. The technique’s designers [
39,
40,
41] have thoroughly analyzed factors affecting the results to ensure a design that guarantees the quality of measured data, including the influence of errors related to manual probe movement. The manual sweep is conducted while maintaining a consistent distance of approximately 1 cm between the sensor and the vegetation. Previously, this technique has shown promising results in detecting lesions involving material loss, which form non-flat surfaces in stone ashlar blocks [
43]. Consequently, Scan and Paint is proposed as a versatile tool, and this study aims to explore its potential in examining the acoustic behavior of green wall modules.
3. Results and Discussion
The results analysis and discussion is divided into two sections, one focusing on laboratory measurements and the other on in situ measurements.
3.1. Laboratory Measurements
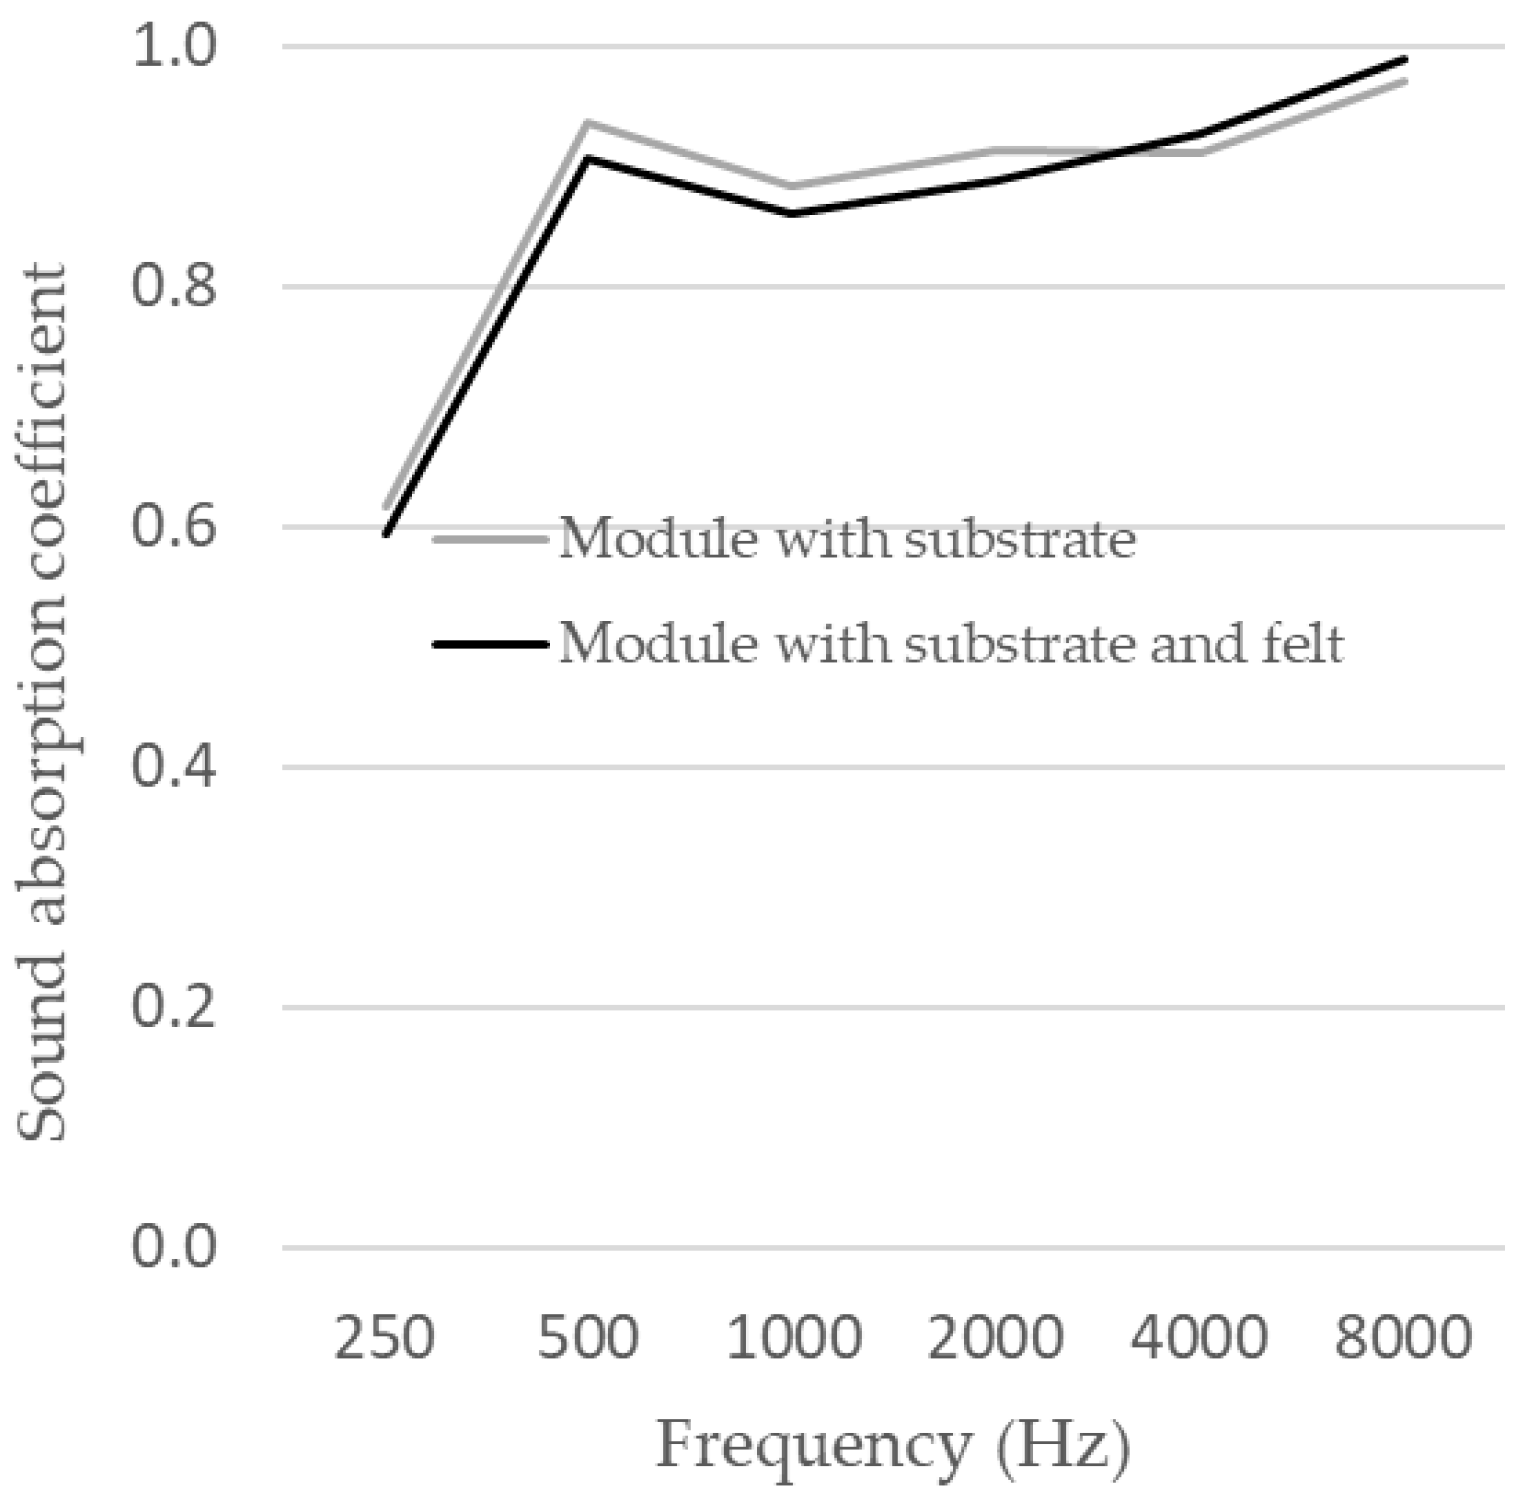
Figure 7 shows the sound absorption curve of the 5 cm thick substrate in the module, with and without felt. The substrate’s absorption curve resembles that of a porous material. The 2 mm thick felt does not significantly change the substrate’s absorption coefficient. Although the structure of the modules used in this study differs from those in similar studies in the literature, results obtained with the impedance gun resemble those already described by other authors, where the substrate behaves as a porous material [
18]. In this context, the methodology developed using the impedance gun proves to be effective. However, it is important to emphasize that the results are applicable at frequencies exceeding 200 Hz. To ensure the reliability of the proposed methodology for measuring the absorption coefficient of vegetation modules with the impedance gun, its standard deviation of repeatability was evaluated [
38,
45]. The standard deviation of the proposed methodology is comparable to that of the impedance tube above 200 Hz, demonstrating similar levels of precision within this frequency range. Previous results, obtained using impedance tubes and reverberation chambers, have shown that a layer of soil generates notable absorption at medium and high frequencies, reaching a coefficient close to 0.9 at 1000 Hz for a 5 cm thickness [
17,
18]. An increase in substrate thickness only translates into a considerable increase in the absorption coefficient when it exceeds 20 cm. The acoustic absorption of the substrate is influenced not only by its thickness but also by its porosity and compaction level. Generally, as the soil’s water content increases, the absorption coefficient decreases, primarily due to a reduction in porosity. In this study, the substrate was tested under a single set of conditions, specifically at a degree of compaction, moisture content, and thickness comparable to those of the substrate used in modules installed on the building façade.
To evaluate the impact of vegetation cover, measurements of the sound absorption coefficient were conducted on the modules with the substrate and the two selected plant species,
Hedera helix (ivy) and grass.
Figure 8 illustrates the measured curves, including the curve for the module with only the substrate and felt. The effect of ivy results in enhanced sound absorption compared to that of the substrate alone across the entire frequency range, with absorption coefficients approaching unity at and above the 2000 Hz octave band. In the case of ivy, the plant’s growth creates a porous structure that continues to allow the substrate to contribute to sound absorption. In this context, the overall increase in the absorption coefficient and the increase that occurs especially at low frequencies may reflect the behavior of a porous material that increases in thickness. For grass, a significant decrease in absorption capacity is observed, approximately 40% less than that of the substrate alone, except for frequencies above 4000 Hz. An in situ study on the acoustic absorption of soil and grass with varying leaf lengths revealed that the acoustic absorption of grass varies significantly depending on leaf length and frequency [
46]. In fact, it was found that when grass forms a very dense layer over the soil, a decrease in sound absorption can occur. In the case of grass, acoustic absorption is determined by the plant cover, which entirely conceals the soil’s porosity, resulting in lower absorption associated with a less porous and more reflective surface [
18]. Although overall findings suggest that vegetation cover enhances substrate absorption, not all species exhibit this behavior. The effect on the substrate’s absorption curve depends on the plant species, the shape of its leaves, and plant density [
18,
20,
21]. Measurements taken in reverberation chambers with vegetation modules from various species often indicate a reduction in reverberation time [
17]. However, this effect is not observed consistently across all species. Similarly, impedance tube measurements have shown that substrate absorption decreases for certain species within specific frequency ranges [
18]. It is important to note that the findings related to grass should be interpreted with caution. Additional measurements of grass specimens in different growth stages are necessary for a more comprehensive understanding.
These effects must be considered when modeling such structures. However, there is currently no valid theoretical model based on clear physics that can explain the observed absorption spectra. The evidence gathered so far suggests that three main mechanisms are responsible for sound absorption in plants. Below 400–500 Hz, thermal dissipation mechanisms are significant. When sound waves strike the plant, vibrations occur within its elements, dissipating energy by converting sound energy into heat. This mechanism could explain the increase in absorption coefficients at lower frequencies measured with ivy and, to a lesser extent, with grass. Generally, at low frequencies, what is measured is an increase in sound absorption of a material as its thickness increases. Between 400 and 2000 Hz, where the wavelength remains much larger than the characteristic dimension of the leaf, viscous dissipation is the primary absorption mechanism. In the high-frequency range, above 2000 Hz, where the acoustic wavelength becomes comparable to or smaller than the characteristic dimension of the leaf, leaf vibrations begin to contribute to energy dissipation in the incident sound wave [
18,
25,
47,
48]. This may explain why both cases show an increase in absorption at high frequencies compared to that presented by modules containing only substrate. Other studies also confirm that substrates perform better at low and medium frequencies, while vegetation performs better at high frequencies. From these results in lab, it should be noted that the presence of substrate is fundamental because it provides good sound absorption; however, when a dense plant is included, overall absorption improves compared to that obtained with just the substrate. This aligns with findings from other studies that state that vegetation’s impact on sound absorption is observed at high frequencies [
17,
18]. Increasing leaf mass in vertical garden modules can be considered an aspect to optimize their noise absorption capacity, either by increasing thickness or using dense plant species [
7,
9,
48]. Furthermore, more studies confirm that greater vegetation cover leads to enhanced noise absorption, with improvements in the absorption coefficient ranging between 0.2 and 0.3 [
17].
3.2. In Situ Measurements
Measurements were conducted on ten different species (
Table 3 and
Figure 4) contained in the plant modules installed on the facade of the itdUPM building. These measurements were taken in November and provide insight into the system’s performance during a specific growth state, as illustrated by the photographs included in this section. The results have been categorized based on the improvement that the vegetation cover produces in the absorption coefficient of the substrate obtained in laboratory tests. Since it was not possible to measure the substrate alone in the façade, the absorption curve for the laboratory module with felt, prepared for vegetation placement, serves as a reference for in situ measurements to assess how different plant species affect the sound absorption properties of the substrate. As previously noted, installing the module on the building requires maintaining a gap between these modules and the facade to facilitate watering and air circulation, and previous studies have indicated that this installation does not significantly impact the sound absorption capabilities of the module [
19,
21].
3.2.1. Low Sound Absorption Increase
In this section, the species incorporated into the plant module that show the smallest increase in the absorption coefficient compared to that of the module alone are included. The four species are
Heuchera americana “Dale’s Strain”,
Sedum acre “Golden Carpet”,
Gazania rigens, and
Heuchera americana “Palace Purple”. A photo of these species is included in
Table 4. These species vary in the shape and width of their leaves. The density of the vegetation is such that the substrate is not completely covered; some areas remain visible, as seen in the photos. However, all of them exhibit changes in the absorption coefficient compared to the module without vegetation.
Figure 9 presents the absorption coefficient curves for four plant species, along with the curve for the bare substrate. All species exhibit increased absorption coefficients at mid and high frequencies, with
Heuchera americana (species 1) and
Sedum acre (species 2) also showing improvements in the 250 Hz octave band. Interestingly, despite their distinct morphologies, these two species produce remarkably similar absorption curves.
To compare the measured changes in absorption coefficient values relative to the bare substrate with various theoretical mechanisms of sound energy dissipation in vegetation discussed in the literature, an average absorption coefficient has been calculated for three frequency intervals.
Table 5 presents the average numerical values of the sound absorption coefficient. The table includes three columns: the first corresponds to the measured value for the octave band at 250 Hz; the second column provides the average of the values measured at frequencies of 500 and 1000 Hz; and the third column displays the average value for the bands at 2000, 4000, and 8000 Hz. The table also includes the difference between these averages for the absorption curve of the substrate alone and that of the substrate with plant species.
In the low frequency range, the predominant mechanisms of absorption in vegetation may be related to resonance effects and thermal dissipative effects. Vegetal layers can act as resonant cavities, optimizing absorption at specific low frequencies depending on their thickness and porosity. Research shows that low-frequency sound absorption is enhanced when vegetation forms a dense layer, as the increased mass facilitates more effective energy dissipation through thermal dissipative effects and resonance [
18]. Additionally, the absorption coefficient tends to increase with material thickness at low frequencies. This could explain why the greatest increase at low frequency is measured when species 2 provides a more uniform coverage; absorption tends to increase with material thickness. A study found that species with a denser arrangement of leaves not only improve sound absorption but also create a more uniform acoustic environment, leading to better overall performance in sound attenuation. However, a similar behavior is observed for species 1, which clearly does not cover the substrate (see photo in
Table 4). The growth form of this species might generate a structure of cavities, whose resonances contribute to increased absorption compared to what is measured for the substrate alone. Research has suggested that specific growth patterns can enhance the acoustic properties of vegetation by creating microenvironments that facilitate sound wave interaction. There are many studies conducted on the effect of plant morphology on acoustic absorption, and in general, the results are inconclusive. Measurements carried out in an impedance tube with individual leaves indicate that there is an improvement in the acoustic absorption of a porous surface in the case of a low-density leaf [
22]. This result could explain why, for species 6 and 9, when substrate coverage is not possible, the individual absorption of the leaves predominates over thermal effects, and no increase in absorption is observed. Other research also suggests that broader and thicker leaves should be more effective at low frequencies; however, the larger leaves correspond to species number 6, which presents the lowest absorption at low frequencies [
17]. This may indicate that at low frequencies, the most significant effects are thermal dissipative effects, where the wavelength is much larger than the size of the leaf, requiring a high density of vegetation.
In the mid-frequency range, leaf area density becomes a critical factor; higher leaf area density correlates with greater sound absorption. Studies indicate that as leaf area density increases, the surface area available for sound wave interaction also increases, leading to improved absorption characteristics [
17,
22]. At high frequencies, one of the predominant mechanisms involves leaf vibration, which converts sound energy into heat through friction. Plant leaves vibrate in response to sound waves or due to sound waves scattered by vegetation. Research shows that vegetation significantly scatters sound waves, especially above 1000 Hz. Canopies, branches, and stems absorb acoustic energy through viscous damping, which is primarily effective at high frequencies. In cases where density is low, it seems that the increase in absorption at high frequencies remains consistent without a clear relationship between plant morphology and measured results. At intermediate and high frequencies, the difference between the average absorption values for the substrate alone and the substrate combined with vegetation ranges from 0.03 to 0.07 (
Table 4). This range is consistent with values reported in the literature regarding the contribution of vegetation to sound absorption, as determined through laboratory methods [
17]. It is evident that the porous substrate or soil plays a crucial role in overall sound absorption, with its effects being particularly significant in the frequency range of 200 to 1000 Hz. Furthermore, the results obtained in situ confirm the viability of the proposed methodology using the impedance gun for on-site measurements.
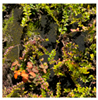
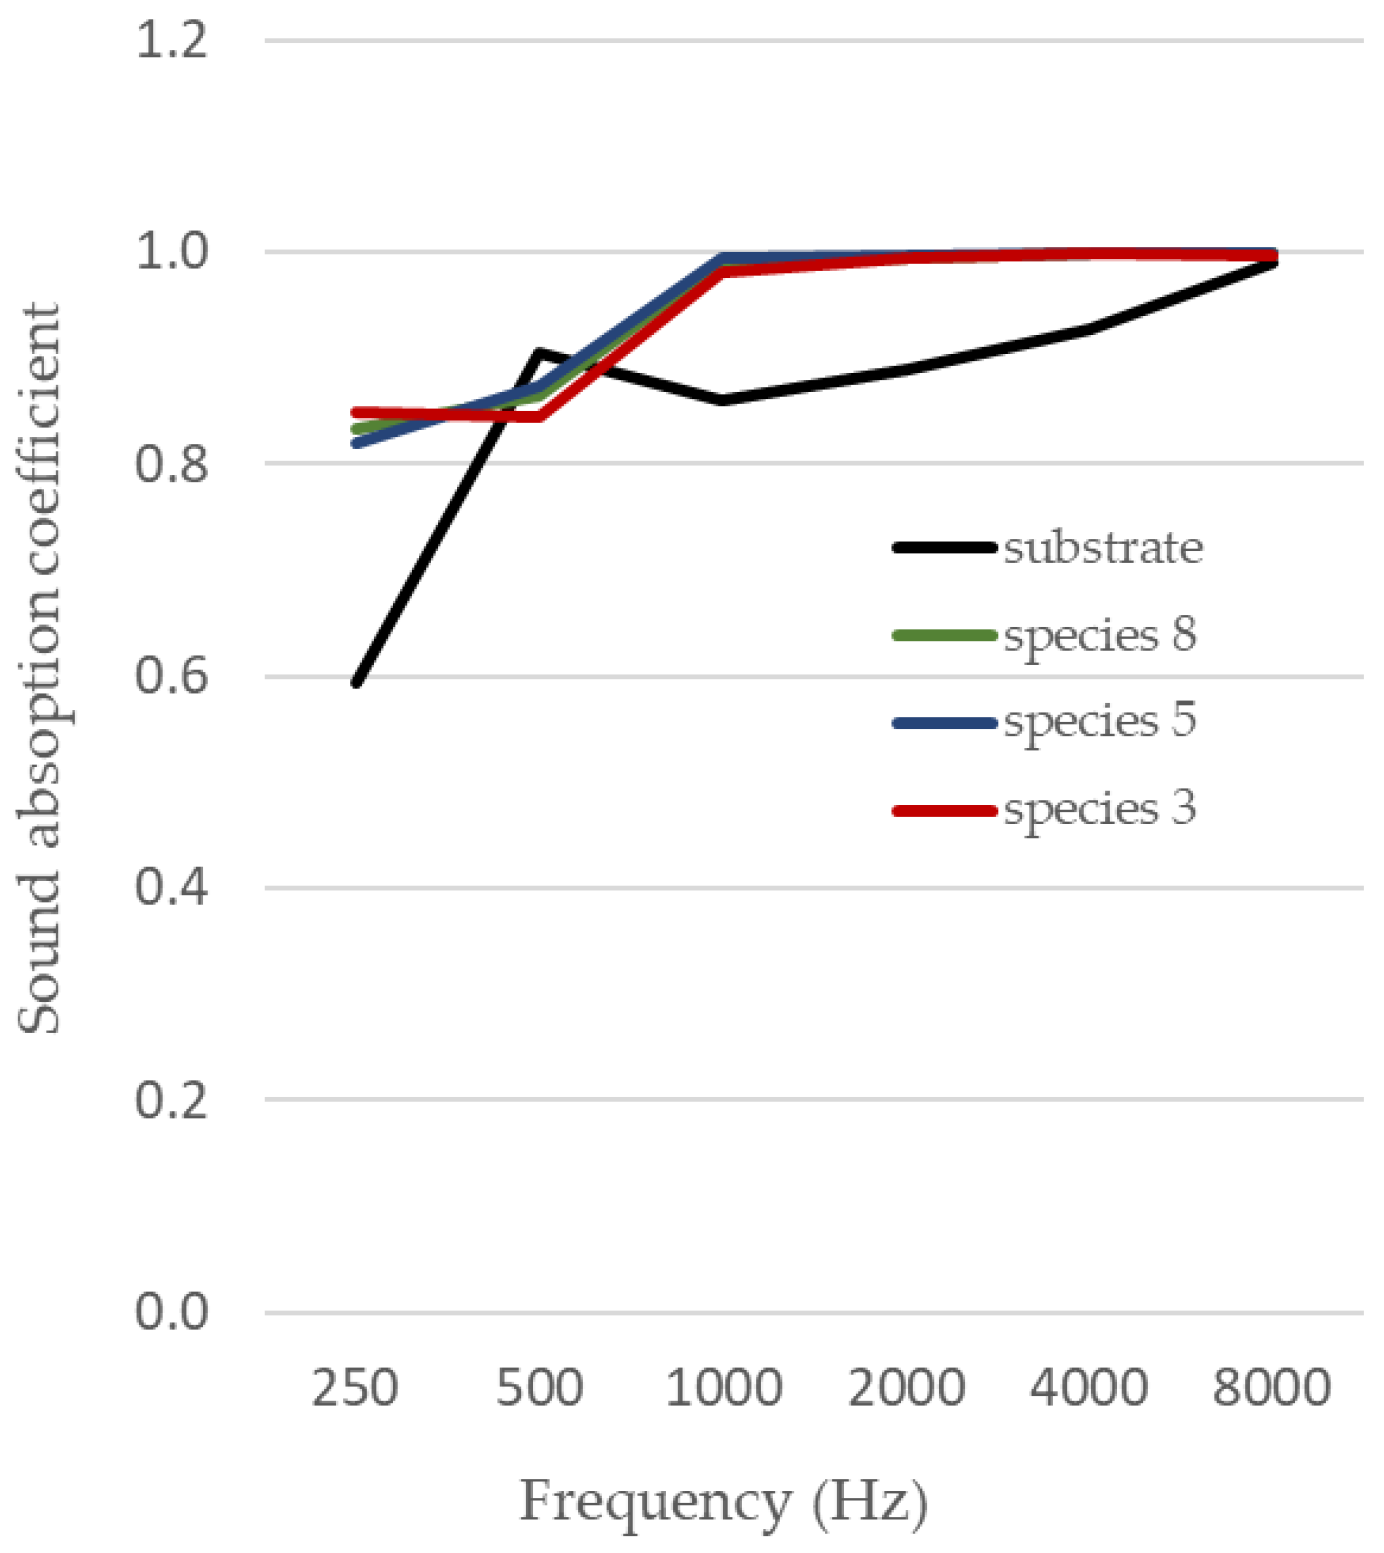
3.2.2. Medium Sound Absorption Increase
Three species have been included in what has been considered a medium increase regarding the absorption presented by the substrate alone:
Delosperma cooperi (8),
Lonicera nitida “Maigrun” (5), and
Sedum album “Coral Carpet” (3).
Table 6 shows the photos of the species, and
Figure 10 presents their sound absorption curves. The three species have different morphological characteristics but similar absorption capacities: specifically,
Delosperma cooperi is a medium-sized climbing shrub with a pendulous habit and persistent foliage, with a length between 2.5 and 4 mm;
Lonicera nitida “Maigrun” is a dense, evergreen, rustic shrub, reaching a maximum height of 80–100 cm; and
Sedum album “Coral Carpet” is a rhizomatous, evergreen, spreading, bushy plant with a height of 5–8 cm. Compared to the results obtained in the module without plants, the findings indicate a consistent increase in the sound absorption coefficient across all three analyzed plant species and throughout the entire frequency range. In this case, the substrate surface is fully covered by all species.
Table 7 summarizes the sound absorption coefficient values for the bare substrate and with vegetation, comparing their performance across the different frequency ranges. Given the morphological differences among the three species, their absorption capacities appear to be more influenced by their biomass than by the type of plant or the individual shape of the leaves. Mechanisms such as thermal dissipation, which predominates at low frequencies, viscous dissipation at low and medium frequencies, and multiple scattering at higher frequencies may play a more significant role than the individual vibration of the leaves. All of these mechanisms are enhanced by the density and height of the vegetation cover.
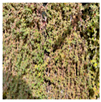
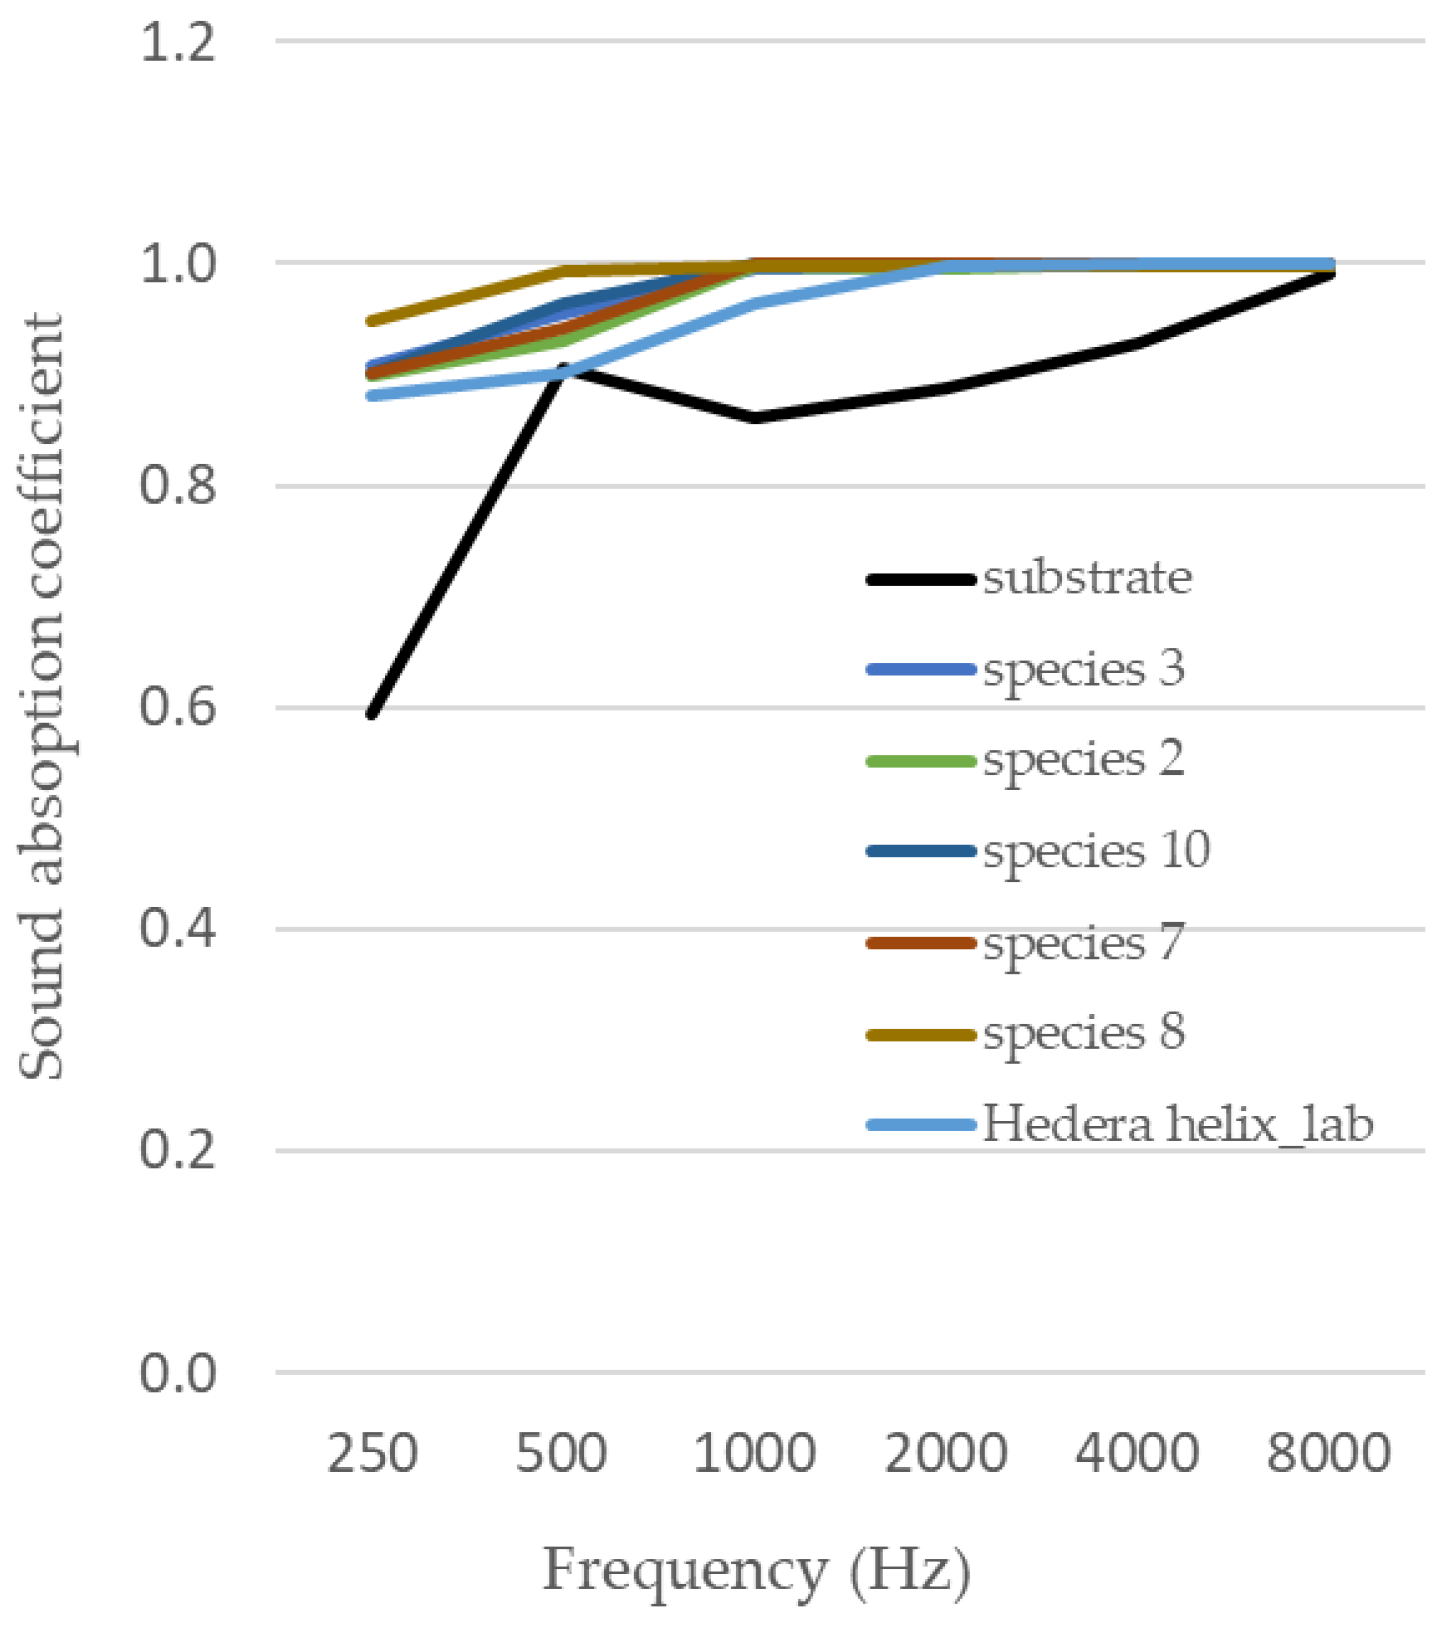
3.2.3. High Sound Absorption Increase
Five species of the tested plants are considered to significantly enhance the acoustic absorption of the substrate:
Sedum album “Coral Carpet”,
Thymus communis,
Sedum acre “Golden Carpet”,
Thymus vulgaris, and
Carex oshimensis. According to
Table 8, each species exhibits specific morphological characteristics:
Species 3 (Sedum album “Coral Carpet”): Measured at two different developmental stages, initially classified as medium density and later as high density.
Species 2 (Sedum acre “Golden Carpet”): A succulent, perennial, evergreen plant characterized by short, dense leaves that do not exceed 15 cm in height.
Species 10 (Thymus vulgaris): A shrub featuring woody stems at the base and herbaceous stems at the top, with abundant minute leaves measuring between 5 and 8 mm in length.
Species 7 (Carex oshimensis): An herbaceous perennial plant with thin, narrow leaves forming rounded, compact clumps spanning 25–30 cm in diameter.
Species 4 (Thymus communis): An aromatic, perennial plant with a robust habit, reaching a height of 30–45 cm.
Despite their morphological differences, the effect of all these species results in a significant increase in absorption compared to the substrate alone across the entire frequency spectrum. The absorption curves are represented in
Figure 11. Once again, the result indicates that the increase in substrate absorption seems to be dependent on density and biomass rather than on the specific type of species. In these cases, the vegetation forms a uniform porous layer over the module, increasing its thickness and, therefore, its absorption coefficient at all frequencies. In this case of extensive coverage, the differences between substrate alone and substrate with vegetation included in
Table 9 would be in the order of the absorption coefficient measured for a 10 cm thick layer of vegetation measured in an impedance tube [
17]. However, compared to the previously analyzed cases, the most significant increase in absorption relative to the substrate occurs at lower frequencies in this instance. Notably, species 4 demonstrates the greatest enhancement in low-frequency absorption. This species generates the largest and thickest porous layer, suggesting that substantial improvement in substrate absorption is achieved when the vegetation cover forms a porous layer of considerable thickness above the substrate. In the case of species 2, included in both the low and high contribution sections to the substrate’s absorption, it is the degree of coverage of the substrate and the thickness of the vegetation layer that determine its level of improvement in substrate absorption. This result is consistent across both in situ and laboratory measurements.
Figure 11 presents the acoustic absorption curve obtained in the laboratory for the species Hedera helix, demonstrating this effect in both exterior and interior environments.
Horoshenkov et al. [
22] conducted a systematic study to explore how leaf morphology and area affect the acoustic absorption coefficient of five low-growing plants with relatively high leaf area density. The researchers used the impedance tube method to measure the normal incidence acoustic absorption coefficient t. Plants with larger and more complex leaf structures tend to have higher absorption coefficients. The results suggest that plants with larger or more numerous leaves (i.e., greater leaf area) tend to have better acoustic absorption properties. However, leaf area density was also found to be a key factor influencing sound absorption.
From this study, it cannot be concluded which species would be the most appropriate to choose, as plant selection often depends on various factors related to their location, whether indoors or outdoors, as well as the geographical area or region. The results of the research conducted in Madrid, in a continental climate and focusing on a specific number and types of species, suggest that the increase in absorption is less about the specific morphology of the plants and more about the coverage and thickness of the vegetation layer over the substrate, provided it forms a porous layer. The effectiveness of these systems depends on how well plant species adapt to local conditions. Using native or well-adapted plants to create a porous layer of suitable thickness would optimize their performance and reduce maintenance needs according to the climate and environment.
In this context, proper maintenance of these green modules is crucial for their optimal performance. This includes regular checks of the irrigation system, ongoing monitoring of plant health to identify and address pests or diseases, and replacing plants when necessary. It is vital to select resilient species that thrive in vertical environments, particularly those maintaining a relatively uniform appearance year-round. Despite this, the study confirms that the substrate plays a pivotal role in acoustic performance, accounting for approximately 80% of sound absorption. This means that even during seasonal changes or periods of plant deterioration, the overall acoustic absorption remains at consistently good levels. Organic substrates are particularly effective, as they retain their acoustic properties longer than other materials. This characteristic contributes significantly to the system’s ability to maintain high acoustic absorption regardless of the vegetation’s condition. In this line, the maintenance costs of green modules vary depending on factors such as system type, plant species, installation size, and local climate, which can result in significant expenses. Despite the need for attentive care, these modules offer consistent acoustic and thermal benefits, along with additional advantages.
In line with this discussion, the fundamental difference between indoor and outdoor green walls lies primarily in the selection of plant species. For indoor environments, species that can thrive in indoor climatic conditions should be chosen. These plant-based solutions can enhance indoor environmental quality by reducing noise levels and contributing to a decrease in reverberation time. The acoustic absorption data presented in this work can be utilized to select species and design green walls that improve acoustics in specific interior spaces, such as open offices or restaurants. The data can assist architects in combining green walls with other absorbent materials to achieve the desired acoustic performance or in using them in indoor acoustic modeling software. Furthermore, green modules can act as sound-absorbing elements in urban environments, reducing urban noise when installed on building facades or barriers, provided they cover large surfaces.
4. Conclusions
In this paper, the sound absorption capacity of a green wall module was evaluated by analyzing the sound absorption coefficient of its main components. As far as the authors are aware, this study is the first of its kind carried out with an impedance gun, which, compared to the standardized methods, allows for the evaluation of the absorption coefficient in situ. It is essential to study the behavior of the components in depth, as well as to innovate the methods used, in order to obtain data on their properties in the laboratory and verify them under natural operating conditions, so as to be able to offer results that guarantee the dissemination and use of this type of solution. These statements are verified by comparing the results obtained with those of the module without vegetation, from which an increase in the sound absorption coefficient is demonstrated after the introduction of vegetation.
In this context, the impedance gun and the methodology based on the Scan and Paint method presented in this work prove to be an ideal technique for studying the acoustic behavior of nature-based solutions. This technique produces results comparable to those obtained using standardized methods (reverberation chamber and impedance tube) for this type of module, and it enables the analysis of a considerably larger surface area than the impedance tube. It constitutes a viable alternative for the analysis of inhomogeneous samples and facilitates the in situ study of green modules once installed, both in outdoor and indoor spaces.
With respect to the presented research, the most significant conclusions are as follows. The substrate is the module’s component with the greatest influence on sound absorption. The absorption coefficient increases with frequency, behaving similarly to a porous material. Additionally, the felt placed on the substrate makes a slight contribution to enhancing the substrate’s sound absorption coefficient.
Improvements in the acoustic absorption of the substrate were found when vegetation was inserted. Twelve different species were evaluated, two in the laboratory and ten in situ, with modules arranged on a building facade. Improvements in acoustic absorption compared to the substrate without vegetation were found, ranging from 4 to 20% depending on the thickness and degree of coverage of the plant species over the substrate. The results obtained with the impedance gun in the laboratory and in situ confirm results obtained through standardized techniques, indicating that broadly speaking, 80% of the absorption comes from the substrate and 5–20% from the vegetation. However, it is noteworthy that not all species with high substrate coverage necessarily improve acoustic absorption. Laboratory measurements conducted on a grass module with a highly compact configuration revealed a significant decrease in absorption. Similar phenomena have been reported by other researchers in the field.
The study demonstrates that sound absorption improvement relative to the substrate increases with more extensive substrate coverage and thicker vegetation layers, provided a porous structure is formed. While measurements have highlighted the significance of these two factors, the specific influence of plant species morphology remains unclear. To optimize the acoustic absorption performance of vertical vegetation systems, it is advisable to select plant species that create a complex and porous structure over the substrate, as well as to enhance the absorption properties of the soil layer. These strategies can significantly contribute to improving the acoustic efficacy of green wall systems.
Acoustic mitigation is an important component of their environmental performance, both in outdoor and indoor settings. The results obtained demonstrate that the sound absorption coefficients of these solutions are comparable to other materials used in acoustic conditioning. In this context, it would be valuable to analyze the real impact of these systems on overall noise reduction. Studies should consider aspects such as the influence of substrate saturation levels, compaction, and composition, different types of hydrophilic layers, and various support systems on the sound absorption coefficient. Plant morphology is a crucial factor that determines the effectiveness of green walls in noise reduction. A better understanding of these mechanisms and how they interact with the specific characteristics of plants will allow for the optimization of green walls as effective solutions for environmental and indoor noise control, contributing significantly to urban acoustic ecology and sustainable design.
Author Contributions
Conceptualization, M.Á.N. and V.O.-D.C.; methodology, M.Á.N. and V.O.-D.C.; validation, M.Á.N. and V.O.-D.C.; formal analysis, M.Á.N. and V.O.-D.C.; investigation, M.Á.N., V.O.-D.C., L.R.-G. and F.O.; resources, M.Á.N., V.O.-D.C., L.R.-G. and F.O.; data curation, M.Á.N., V.O.-D.C., L.R.-G. and F.O.; writing—original draft preparation, M.Á.N. and V.O.-D.C.; writing—review and editing, M.Á.N., V.O.-D.C., L.R.-G. and F.O.; visualization, M.Á.N., V.O.-D.C., L.R.-G. and F.O.; supervision, M.Á.N., V.O.-D.C., L.R.-G. and F.O. All authors have read and agreed to the published version of the manuscript.
Funding
This research received no external founding.
Data Availability Statement
Data are contained within the article.
Conflicts of Interest
The authors declare no conflicts of interest.
References
- European Parliament. Directive 2002/49/EC of the European Parliament and of the Council of 25 June 2002 relating to the assessment and management of environmental noise. Off. J. Eur. Communities 2002, 189, 12–26. [Google Scholar]
- Den Boer, L.C.; Schroten, A. Traffic Noise Reduction in Europe. Health Effects, Social Costs and Technical and Policy Options to Reduce Road and Rail Traffic Noise; Report Commissioned by T&E; CE Delft: Delft, The Netherlands, 2007. [Google Scholar]
- Salomons, E.M.; Janssen, S.A. Practical ranges of loudness levels of various types of environmental noise, including traffic noise, aircraft noise, and industrial noise. Int. J. Environ. Res. Public Health 2011, 8, 1847–1864. [Google Scholar] [CrossRef]
- Klæboe, R.; Amundsen, A.H.; Fyhri, A.; Solberg, S. Road traffic noise—The relationship between noise exposure and noise annoyance in Norway. Appl. Acoust. 2004, 65, 893–912. [Google Scholar] [CrossRef]
- Oquendo-Di Cosola, V.; Olivieri, F.; Ruiz-García, L. A systematic review of the impact of green walls on urban comfort: Temperature reduction and noise attenuation. Renew. Sust. Energ. Rev. 2022, 162, 112463. [Google Scholar] [CrossRef]
- Manso, M.; Teotónio, I.; Silva, C.M.; Cruz, C.O. Green roof and green wall benefits and costs: A review of the quantitative evidence. Renew. Sust. Energ. Rev. 2021, 135, 110111. [Google Scholar] [CrossRef]
- Lacasta, A.M.; Peñaranda, A.; Cantalapiedra, I.R. Green streets for noise reduction. In Nature Based Strategies for Urban and Building Sustainability; Butterworth-Heinemann: Oxford, UK, 2018; pp. 181–190. [Google Scholar] [CrossRef]
- Paull, N.J.; Krix, D.; Torpy, F.R.; Irga, P.J. Can green walls reduce outdoor ambient particulate matter, noise pollution and temperature? Int. J. Environ. Res. Public Health 2020, 17, 5084. [Google Scholar] [CrossRef]
- Van Renterghem, T.; Dekoninck, L.; Botteldooren, D. Multi-stage sound planning methodology for urban redevelopment. Sustain. Cities Soc. 2020, 62, 102362. [Google Scholar] [CrossRef]
- Aletta, F.; Kang, J.; Astolfi, A.; Fuda, S. Differences in soundscape appreciation of walking sounds from different footpath materials in urban parks. Sustain. Cities Soc. 2016, 27, 367–376. [Google Scholar] [CrossRef]
- Xiao, X.D.; Dong, L.; Yan, H.; Yang, N.; Xiong, Y. The influence of the spatial characteristics of urban green space on the urban heat island effect in Suzhou Industrial Park. Sustain. Cities Soc. 2018, 40, 428–439. [Google Scholar] [CrossRef]
- Teotónio, I.; Silva, C.M.; Cruz, C.O. Economics of green roofs and green walls: A literature review. Sustain. Cities Soc. 2021, 69, 102781. [Google Scholar] [CrossRef]
- Jamei, E.; Rajagopalan, P.; Seyedmahmoudian, M.; Jamei, Y. Review on the impact of urban geometry and pedestrian level greening on outdoor thermal comfort. Renew. Sust. Energ. Rev. 2016, 54, 1002–1017. [Google Scholar] [CrossRef]
- Tong, Z.; Baldauf, R.W.; Isakov, V.; Deshmukh, P.; Zhang, K.M. Roadside vegetation barrier designs to mitigate near-road air pollution impacts. Sci. Total Environ. 2016, 541, 920–927. [Google Scholar] [CrossRef]
- Van Renterghem, T.; Botteldooren, D.; Verheyen, K. Road traffic noise shielding by vegetation belts of limited depth. J. Sound Vib. 2012, 331, 2404–2425. [Google Scholar] [CrossRef]
- Pérez, G.; Coma, J.; Barreneche, C.; De Gracia, A.; Urrestarazu, M.; Burés, S.; Cabeza, L.F. Acoustic insulation capacity of Vertical Greenery Systems for buildings. Appl. Acoust. 2016, 110, 218–226. [Google Scholar] [CrossRef]
- D’Alessandro, F.; Asdrubali, F.; Mencarelli, N. Experimental evaluation and modelling of the sound absorption properties of plants for indoor acoustic applications. Build. Environ. 2015, 94, 913–923. [Google Scholar] [CrossRef]
- Scamoni, F.; Scrosati, C.; Depalma, M.; Barozzi, B. Experimental evaluations of acoustic properties and long-term analysis of a novel indoor living wall. J. Build. Eng. 2022, 47, 103890. [Google Scholar] [CrossRef]
- Davis MJ, M.; Tenpierik, M.J.; Ramírez, F.R.; Pérez, M.E. More than just a Green Facade: The sound absorption properties of a vertical garden with and without plants. Build. Environ. 2017, 116, 64–72. [Google Scholar] [CrossRef]
- Wong, N.H.; Kwang Tan, A.Y.; Tan, P.Y.; Chiang, K.; Wong, N.C. Acoustics evaluation of vertical greenery systems for building walls. Build. Environ. 2010, 45, 411–420. [Google Scholar] [CrossRef]
- Azkorra, Z.; Pérez, G.; Coma, J.; Cabeza, L.F.; Bures, S.; Álvaro, J.E.; Erkoreka, A.; Urrestarazu, M. Evaluation of green walls as a passive acoustic insulation system for buildings. Appl. Acoust. 2015, 89, 46–56. [Google Scholar] [CrossRef]
- Horoshenkov, K.V.; Khan, A.; Benkreira, H.; Smyrnova, Y.; Rehioui, K.; Kang, J. Acoustic properties of low growing plants. In Proceedings of the 42nd International Congress and Exposition on Noise Control Engineering, Innsbruck, Austira, 15–18 September 2013; pp. 3912–3917. [Google Scholar] [CrossRef]
- Thomazelli, R.; Caetano FD, N.; Bertoli, S.R. Acoustic properties of green walls: Absorption and insulation. Proc. Meet. Acoust. 2016, 28, 015017. [Google Scholar] [CrossRef]
- Yang, H.S.; Kang, J.; Cheal, C. Random-incidence absorption and scattering coefficients of vegetation. Acta Acust. United Acust. 2013, 99, 379–388. [Google Scholar] [CrossRef]
- Attal, E.; Côté, N.; Shimizu, T.; Dubus, B. Sound absorption by green walls at normal incidence: Physical analysis and optimization. Acta Acust. United Acust. 2019, 105, 301–312. [Google Scholar] [CrossRef]
- Romanova, A.; Horoshenkov, K.V.; Hurrell, A. An application of a parametric transducer to measure acoustic absorption of a living green wall. Appl. Acoust. 2019, 145, 89–97. [Google Scholar] [CrossRef]
- Liu, C.; Georgiou, F.; Hornikx, M. Characterization of the acoustic impedance of in-situ vegetated roofs. Appl. Acoust. 2021, 171, 107514. [Google Scholar] [CrossRef]
- Attal, E.; de l’Epine, Y.B.; Dauchez, N.; Dubus, B. Experimental investigation of the effect of moisture on the acoustic properties of lightweight substrates used in green envelopes. Appl. Acoust. 2021, 180, 108108. [Google Scholar] [CrossRef]
- Cameron RW, F.; Taylor, J.; Emmett, M. A Hedera green façade—Energy performance and saving under different maritime-temperate, winter weather conditions. Build. Environ. 2015, 92, 111–121. [Google Scholar] [CrossRef]
- Hoelscher, M.T.; Nehls, T.; Jänicke, B.; Wessolek, G. Quantifying cooling effects of facade greening: Shading, transpiration and insulation. Energ. Build. 2016, 114, 283–290. [Google Scholar] [CrossRef]
- Benkreira, H.; Horoshenkov, K.V.; Khan, A.; Mandon, A.; Rohr, R. The Effect of Drying on the Acoustic Absorption of Novel Green Noise Insulation. In Proceedings of the European Drying Conference, Palma, Spain, 26–28 October 2011; pp. 26–28. [Google Scholar]
- De Bree, H.E.; Tijs, E. Two complementary Microflown based methods to determine the reflection coefficient in situ. In Proceedings of the ISMA International Conference on Noise and Vibration Engineering, Heverlee, Belgium, 18–20 September 2006. [Google Scholar]
- De Bree, H.E.; Tijs, E.; Basten, T. An Ultra Miniature Measurement Tool to Measure the Reflection Coefficient of Acoustic Damping Materials in Situ. In Proceedings of the SAE 2007 Noise and Vibration Conference and Exhibition, St. Charles, IL, USA, 15–17 May 2007. [Google Scholar] [CrossRef]
- Tijs, E.; de Bree, H.E. Recent developments free field PU impedance technique. In Proceedings of the SAPEM 2008, Symposium on Acoustic Poro-elastic Materials, Bradford, UK, 17–19 December 2008. [Google Scholar]
- De Bree, H.E.; Nosko, M.; Tijs, E. A handheld device to measure the acoustic absorption in situ. In Proceedings of the SNVH 2008, 5th International Styrian Noise Vibration & Harshness Congress, Graz, Austria, 4–6 June 2008. [Google Scholar]
- Tijs, E. Study and Development of an In Situ Acoustic Absorption Measurement Method. Ph.D. Thesis, University of Twente, Enschede, The Netherlands, 2013. [Google Scholar]
- Kinsler, L.E.; Frey, A.F.; Coppens, A.B.; Sanders, J.V. Fundamentals of Acoustics, 4th ed.; John Wiley & Sons: Hoboken, NJ, USA, 2000. [Google Scholar]
- Pedrero, A.; Navacerrada, M.Á.; de la Prida, D.; Iglesias, L.; Díaz-Chyla, A. On the accuracy of the sound absorption measurement with an impedance gun. Appl. Acoust. 2020, 158, 107039. [Google Scholar] [CrossRef]
- Comesaña, D.F.; Steltenpool, S.; Carrillo Pousa, G.; de Bree, H.E.; Holland, K.R. Scan and Paint: Theory and Practice of a Sound Field Visualization Method. Int. Sch. Res. Not. 2013, 2013, 241958. [Google Scholar] [CrossRef]
- Fernandez Comesaña, D.; Holland, K.R.; Fernandez-Grande, E. Spatial resolution limits for the localization of noise sources using direct sound mapping. J. Sound Vib. 2016, 375, 53–62. [Google Scholar] [CrossRef]
- Tijs, E.; de Bree, H.E.; Steltenpool, S. Scan and Paint: A novel sound visualization technique. In Proceedings of the 39th International Congress on Noise Control Engineering 2010 (Inter-noise 2010), Lisbon, Portugal, 13–16 June 2010. [Google Scholar]
- Brandao, E.; Lenzi, A.; Cordioli, J. Estimation and minimization of errors caused by sample size effect in the measurement of the normal absorption coefficient of a locally reactive surface. Appl. Acoust. 2012, 73, 543–556. [Google Scholar] [CrossRef]
- Navacerrada, M.A.; Barbero-Barrera, M.M.; Fort, R.; de la Prida, D.; Núñez, J.C.; Gómez, T.S. Application of acoustic impedance gun to non-destructively monitor stone damage. Constr. Build. Mater. 2022, 323, 126510. [Google Scholar] [CrossRef]
- Siano, D.; Viscardi, M.; Panza, M.A. Automotive Materials: An Experimental Investigation of an Engine Bay Acoustic Performances. Energy Procedia 2016, 101, 598–605. [Google Scholar] [CrossRef]
- Navacerrada, M.A.; Oquendo-Di Cosola, V.; Ruíz García, L.; Olivieri, F. Absorción acústica de una fachada vegetal mediante una pistola de impedancia. In Proceedings of the XIII Congreso Ibérico de Acústica, Faro, Portugal, 11–13 September 2024. [Google Scholar]
- Londhe, N.; Rao, M.D.; Blough, J.R. Application of the ISO 13472-1 in situ technique for measuring the acoustic absorption coefficient of grass and artificial turf surfaces. Appl. Acoust. 2009, 70, 129–141. [Google Scholar] [CrossRef]
- Attal, E.; Dubus, B.; Leblois, T.; Cretin, B. An optimal dimensioning method of a green wall structure for noise pollution reduction. Build. Environ. 2021, 187, 107362. [Google Scholar] [CrossRef]
- Bullen, R.; Fricke, F. Sound propagation through vegetation. J. Sound Vib. 1982, 80, 11–23. [Google Scholar] [CrossRef]
Figure 1.
Schematic representation of the green wall modules utilized in this research.
Figure 1.
Schematic representation of the green wall modules utilized in this research.
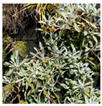
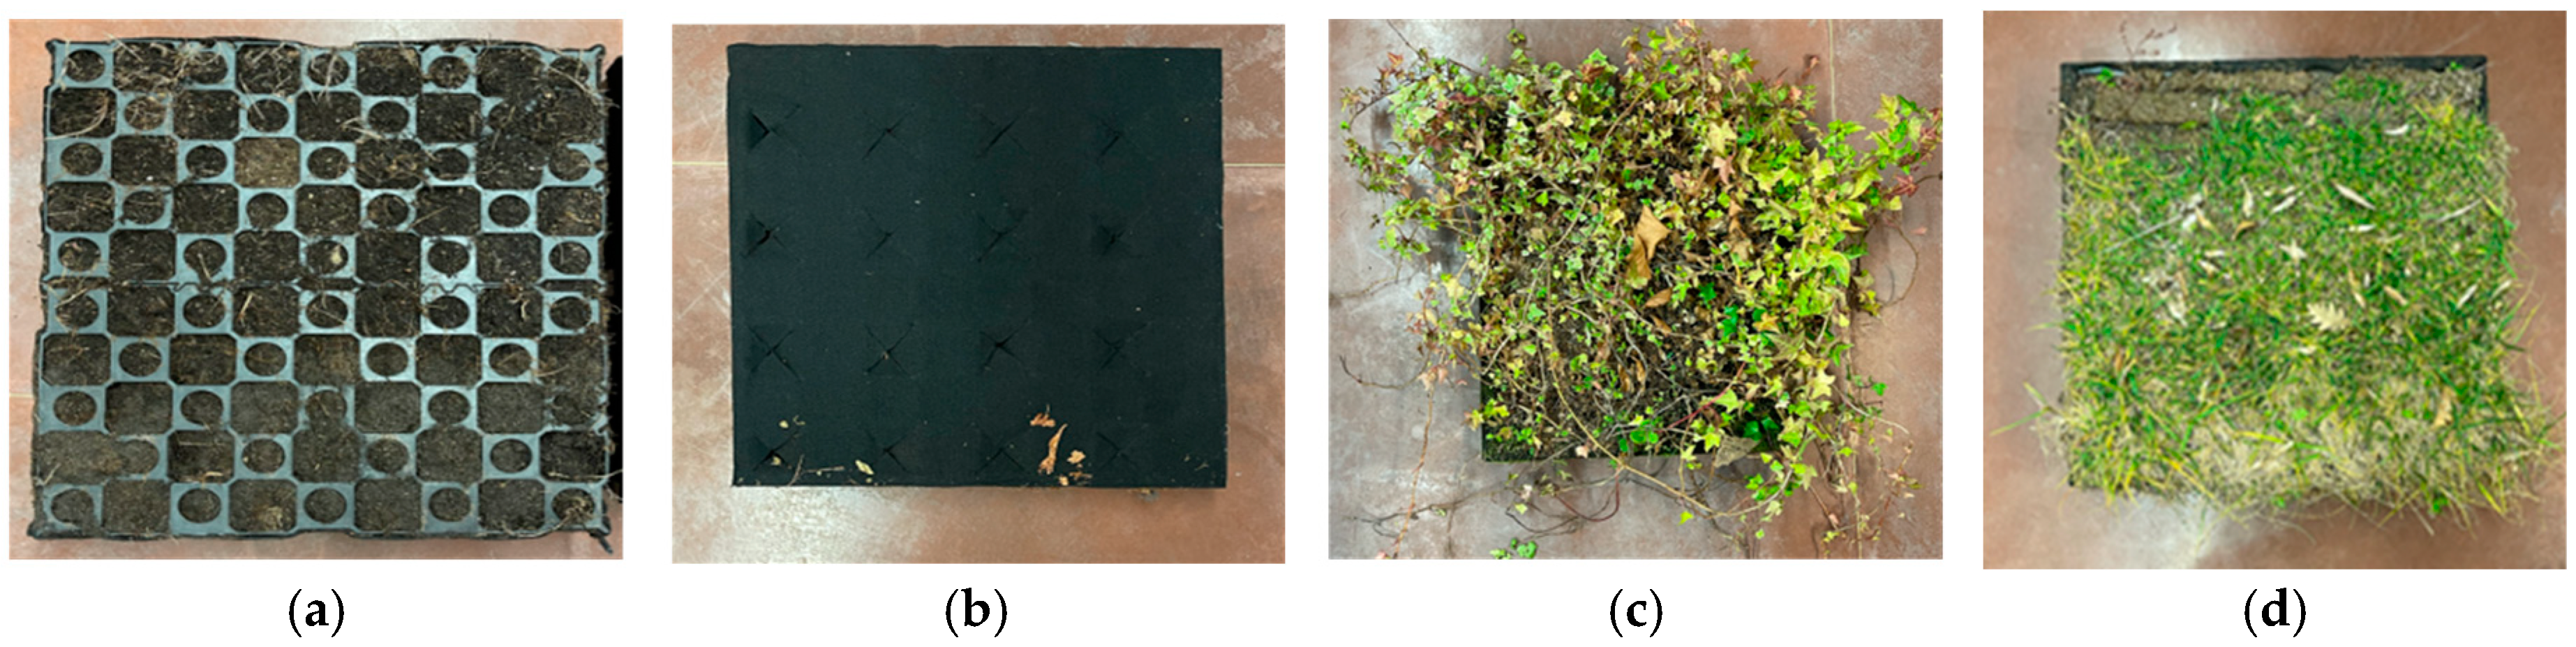
Figure 2.
Modules used in laboratory measurements: (a) substrate without felt layer and (b) with felt layer, with cuts made to insert plants, (c) substrate with Hereda helix, and (d) substrate and grass.
Figure 2.
Modules used in laboratory measurements: (a) substrate without felt layer and (b) with felt layer, with cuts made to insert plants, (c) substrate with Hereda helix, and (d) substrate and grass.
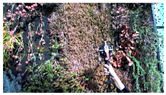
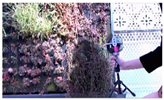
Figure 3.
Green wall module installed in the itdUPM.
Figure 3.
Green wall module installed in the itdUPM.
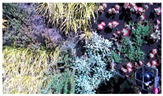
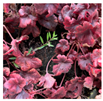
Figure 4.
Plant species tested on the green wall at the itdUPM façade.
Figure 4.
Plant species tested on the green wall at the itdUPM façade.
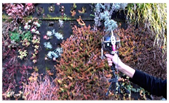
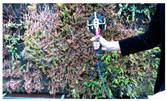
Figure 5.
Measurement system assembly provided by Microflown Technologies (
https://www.microflown.com/, accessed on 19 January 2025). Impedance gun consists of (1) PU (pressure–particle velocity) probe model 2019-07 (enlarged photo is also shown) and (2) 15 cm loudspeaker mounted on structure enabling both components to be handled together and to maintain a fixed 27 cm separation distance between them. The impedance gun is connected through (3) signal conditioner (Microflown MFSC-2) to the computer that collects signals and performs the necessary calculations.
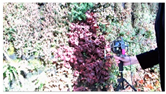
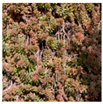
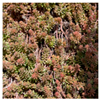
Figure 6.
Images of measurements carried out in the laboratory and in situ on the green wall.
Figure 6.
Images of measurements carried out in the laboratory and in situ on the green wall.
Figure 7.
Sound absorption curves of the 5 cm thick substrate in the module. The curve measured directly on the substrate and covered with a 2 mm thick felt is included.
Figure 7.
Sound absorption curves of the 5 cm thick substrate in the module. The curve measured directly on the substrate and covered with a 2 mm thick felt is included.
Figure 8.
Acoustic absorption curves of the module with the substrate and felt and when two vegetation species have been inserted: Hedera helix (ivy) and grass.
Figure 8.
Acoustic absorption curves of the module with the substrate and felt and when two vegetation species have been inserted: Hedera helix (ivy) and grass.
Figure 9.
Curves of the sound absorption coefficient for the plant species listed in
Table 4. The curve for the sound absorption coefficient of the substrate measured in the laboratory is included.
Figure 9.
Curves of the sound absorption coefficient for the plant species listed in
Table 4. The curve for the sound absorption coefficient of the substrate measured in the laboratory is included.
Figure 10.
Absorption curves for modules with medium-density vegetation.
Figure 10.
Absorption curves for modules with medium-density vegetation.
Figure 11.
Absorption curves for modules with high density vegetation.
Figure 11.
Absorption curves for modules with high density vegetation.
Table 1.
Description of the components and features of the system.
Table 1.
Description of the components and features of the system.
| System Components and Characteristics | Description |
|---|
| Polyethylene module | 50 × 50 × 5 cm |
| Weight without plants | 2 kg/module |
| Number of plants | 12 per module |
| External finishing layer | Polyester |
| Bearing structure | Polypropylene boxes |
| Hydrophilic layer | Polyester |
| Growing medium | Coconut fiber, turf, and humus |
Table 2.
Characteristics of the plant species tested in laboratory.
Table 2.
Characteristics of the plant species tested in laboratory.
| Name | Leaf Shape | Leaf Area (cm2) | Approximate Leaf Count per Plant |
|---|
| Hedera helix | 3–5 lobed | 26.94 | Medium |
| Grass | Long and narrow, with parallel margins | 5.00 | High |
Table 3.
Characteristics of the plant species tested in laboratory and tested in situ.
Table 3.
Characteristics of the plant species tested in laboratory and tested in situ.
| Species | Name | Leaf Shape | Leaf Area (cm2) | Approximate Leaf Count per Plant |
|---|
| 1 | Heuchera americana “Dale’s Strain” | 7–9 shallowly lobed | 5.00 | Low |
| 2 | Sedum acre “Golden Carpet” | Alternate, fleshy and shortly cylindrical with a rounded tip | 2.00 | Medium-high |
| 3 | Sedum album “Coral Carpet” | Alternate, fleshy and shortly cylindrical with a rounded tip | 2.00 | High |
| 4 | Thymus communis | Narrow and elliptical | 0.10 | High |
| 5 | Lonicera nitida “Maigrun” | Ovate | 4.00 | Low |
| 6 | Heuchera americana “Palace Purple” | 7–9 shallowly lobed | 7.06 | Medium |
| 7 | Carex oshimensis | Narrow, sword-shaped | 30.00 | High |
| 8 | Delosperma cooperi | Cylindrical | 0.40 | High |
| 9 | Gazania rigens | Lanceolate | 12.70 | High |
| 10 | Thymus vulgaris | Narrow and elliptical | 0.15 | High |
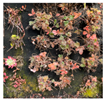
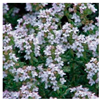
Table 4.
Species categorized as exhibiting a low increase in acoustic absorption compared to the substrate in the laboratory.
Table 5.
Average numerical values of sound absorption coefficients for species classified as “Low sound absorption increase” at low (250 Hz), medium (500 and 1000 Hz) and high frequencies (2000, 4000 and 8000 Hz). The Table includes the differences in these averages between substrate with vegetation species and substrate.
| Samples | Sound Absorption Coefficient | Δ Sound Absorption Coefficient |
|---|
| Low | Medium | High | Low | Medium | High |
|---|
| Substrate | 0.59 | 0.88 | 0.96 | | | |
| Species 1 | 0.76 | 0.93 | 0.99 | 0.17 | 0.05 | 0.03 |
| Species 2 | 0.77 | 0.95 | 0.99 | 0.18 | 0.07 | 0.03 |
| Species 9 | 0.68 | 0.93 | 0.99 | 0.09 | 0.05 | 0.03 |
| Species 6 | 0.60 | 0.95 | 0.92 | 0.01 | 0.07 | −0.04 |
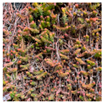
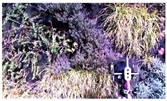
Table 6.
Species categorized as exhibiting a medium increase in acoustic absorption compared to the substrate in the laboratory.
Table 7.
Average numerical values of sound absorption coefficients for species classified as “Medium sound absorption increase” at low (250 Hz), medium (500 and 1000 Hz) and high frequencies (2000, 4000 and 8000 Hz). The Table includes the differences in these averages between substrate with vegetation species and substrate.
| Samples | Sound Absorption Coefficient | Δ Sound Absorption Coefficient |
|---|
| Low | Medium | High | Low | Medium | High |
|---|
| Substrate | 0.59 | 0.88 | 0.96 | | | |
| Species 8 | 0.83 | 0.99 | 0.99 | 0.24 | 0.11 | 0.03 |
| Species 5 | 0.82 | 0.99 | 0.99 | 0.23 | 0.11 | 0.03 |
| Species 3 | 0.85 | 0.99 | 0.99 | 0.26 | 0.11 | 0.03 |
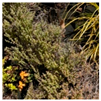
Table 8.
Species categorized as exhibiting a high increase in acoustic absorption compared to the substrate in the laboratory.
Table 9.
Average numerical values of sound absorption coefficients for species classified as “High sound absorption increase” at low (250 Hz), medium (500 and 1000 Hz) and high frequencies (2000, 4000 and 8000 Hz). The Table includes the differences in these averages between substrate with vegetation species and substrate.
| Samples | Sound Absorption Coefficient | Δ Sound Absorption Coefficient |
|---|
| Low | Medium | High | Low | Medium | High |
|---|
| Substrate | 0.59 | 0.88 | 0.96 | | | |
| Species 3 | 0.90 | 0.99 | 0.99 | 0.31 | 0.11 | 0.03 |
| Species 2 | 0.90 | 0.99 | 0.99 | 0.31 | 0.11 | 0.03 |
| Species 10 | 0.90 | 0.99 | 0.99 | 0.31 | 0.11 | 0.03 |
| Species 7 | 0.90 | 0.99 | 0.99 | 0.31 | 0.11 | 0.03 |
| Species 8 | 0.92 | 0.99 | 0.99 | 0.31 | 0.11 | 0.03 |
| Disclaimer/Publisher’s Note: The statements, opinions and data contained in all publications are solely those of the individual author(s) and contributor(s) and not of MDPI and/or the editor(s). MDPI and/or the editor(s) disclaim responsibility for any injury to people or property resulting from any ideas, methods, instructions or products referred to in the content. |
© 2025 by the authors. Licensee MDPI, Basel, Switzerland. This article is an open access article distributed under the terms and conditions of the Creative Commons Attribution (CC BY) license (https://creativecommons.org/licenses/by/4.0/).


 ,
, 


