Article

Effect of Shaft Roughness on the Bearing Capacity of Rock-Socketed Friction Piles

1
School of Physics and Telecommunication Engineering, Yulin Normal University, Yulin 537000, China
2
School of Architecture and Transportation Engineering, Guilin University of Electronic Technology, Guilin 541004, China
*
Authors to whom correspondence should be addressed.
Buildings 2025, 15(24), 4509; https://doi.org/10.3390/buildings15244509
Submission received: 7 November 2025 / Revised: 4 December 2025 / Accepted: 10 December 2025 / Published: 13 December 2025

Abstract

Rock-socketed piles are a common type of end-bearing pile, but when there is deep sediment or holes at the pile bottom, the load is primarily supported by side resistance. In this study, based on such conditions and considering the influence of pile shaft roughness, model tests were conducted to investigate the bearing characteristics of rock-socketed friction piles. The results show that the failure mode of rock-socketed friction piles is the formation of a penetrating cylinder in the rock layer, with the cylinder diameter directly approximating the pile diameter. The load–displacement curves of the test piles are steeply variable. After reaching the ultimate bearing capacity, the residual bearing capacity of rough test pile is approximately 60% of the ultimate bearing capacity, while that of smooth test pile is 72.4%. The maximum side resistance of the test pile is located within a depth range of 25 mm below the soil–rock interface, and the upper load of 41.0% to 48.9% on the test piles was born by the pile side resistance within this depth range. As the roughness factor (RF) increases gradually from 0.0 to 0.3, the ultimate bearing capacity of the test pile shows nearly linear growth, the ultimate displacement increases sharply first and then decreases slowly, and both the axial force attenuation and the percentage of side resistance within the depth range of 25 mm below the soil–rock interface gradually increase slightly. In this paper, two existing methods are employed to calculate the ultimate bearing capacity of friction piles under the conditions of this study. Based on a comparison of the results, the applicable conditions for each method are proposed. The findings of this study can serve as a reference for the design of rock-socketed piles in similar geological formations.

1. Introduction

Rock-socketed piles are widely used in engineering projects such as high buildings, large bridges, and high-speed railways due to their high bearing capacity, good seismic performance, and minimal settlement [1]. The influence of formation conditions, pile depth, pile length, and other factors on the side resistance of rock-socketed piles has been widely studied [2,3,4]. The distribution characteristics of pile side resistance under these conditions are revealed [2,5]. The side resistance significantly influences the bearing capacity of rock-socketed piles, and it is closely related to the roughness of the pile shaft [6]. Horvath, Williams, Pells et al. [7,8,9] defined the roughness factor (RF) of the pile shaft. Based on these definitions, many researchers have studied the influence of rock-socketed pile bearing characteristics, and revealed that the roughness of the pile–rock interface is positively correlated with the bearing capacity of the rock-socketed pile. The greater the roughness, the greater the bearing capacity [10,11]. The roughness also has an effect on the ultimate displacement of the pile. When the displacement of the pile top with 1% pile diameter occurs, the rough pile–rock mass interaction occurs serious damage [12]. The influence of the rough shape of the pile shaft has also been studied. The destruction of the triangular rough shape of the pile goes through four processes, which are initial sliding, subsequent sliding, initial localized shearing, and subsequent shearing, respectively [13]. Assuming regular triangular concrete-rock rough joints, Yang [14], Zhang [15], and Zhou et al. [16] proposed various pile-side friction transfer models suitable for weak embedded rock piles based on the shear dilation and failure mechanism of the pile–rock and surrounding rock interface. Ma, and Tolun et al. [17,18] indicated that the pile–soil interaction force is positively correlated with the natural density, specific gravity, compression deformation, and plasticity index of the soil layer. Li et al. [19] investigated the influences of parameters such as rock-socketed depth, pile length, pile diameter, and pile shaft elastic modulus on the uplift characteristics of rock-socketed piles using ABAQUS FE software. Li et al. [20] discussed the influence law of aspect ratio and rock-socketed length on the bearing characteristics of rock-socketed short piles using the finite element method. Xing et al. [21] established a strain-softening model via numerical simulation, and investigated the influences of various parameters such as support structure type, rock-socketed depth, pile diameter, pile spacing, and rock shoulder width on pile performance. Huang et al. [22] investigated the vertical bearing characteristics of rock-socketed piles in soft rock under different overburden pressures and rock-socketed depths. Xing et al. [23] investigated the bearing characteristics of single rock-socketed piles under different overburden thicknesses and rock-socketed lengths, as well as the mechanical behavior of rock-socketed pile groups under the condition of an inclined bedrock surface. Zhang et al. [24] investigated the bearing characteristics of large-diameter rock-socketed pile groups in valley areas under different slope angle conditions. Chen et al. [25] assembled the global stiffness matrix equation of rock-socketed pile groups using the finite element method. The flexibility matrix equation of the rock–soil mass corresponding to the pile groups was derived via the boundary element method. By combining the force balance conditions and displacement compatibility conditions of the rigid pile cap, a solution method for rock-socketed pile groups in layered saturated rock-soil masses was established.
In existing studies on rock-socketed piles, numerous scholars have revealed the bearing characteristics of such piles through various methods, including model tests, numerical simulations, and theoretical derivations, while investigating the influences of stratum conditions, rock-socketed depth, pile length, and other factors on pile shaft resistance. However, the aforementioned achievements are mainly based on research conducted under the condition that pile tip resistance is fully mobilized, with relatively few studies focusing on pure friction piles that exclude pile tip resistance. In engineering practice, defects such as cavities and thick sediment are often present at the pile tip, leading to significant weakening or complete failure of the pile tip’s supporting effect. Under such circumstances, the load transfer mechanism transforms into a friction pile mode dominated by shaft resistance. Under the special condition of missing tip bearing capacity, the influence mechanism of pile shaft roughness on the bearing capacity evolution law, load transfer path, and failure mode of rock-socketed friction piles has not been fully explored, and relevant designs still lack clear theoretical basis.
Based on the stratum conditions of a low-rise building site in Guangxi, this study adopts Horvath’s definition of roughness to conduct model load tests, exploring the bearing characteristics of rock-socketed friction piles under different roughness conditions. Additionally, two existing methods are used to calculate the ultimate bearing capacity under this working condition, so as to reveal the applicability of the two methods. This study is the first to systematically reveal the unique influence mechanism of pile shaft roughness on bearing characteristics (especially failure mode and residual bearing capacity) under the specific condition of missing tip resistance. It aims to fill the research gap in the bearing characteristics of rock-socketed friction piles without pile tip resistance and provide scientific basis and theoretical support for relevant engineering practices.

2. Experimental Program

2.1. Similarity Ratio Design

The geological strata of a low-rise building in Guangxi are mainly strongly weathered dolomite and moderately weathered dolomite. According to the investigation report, the pile length is designed to be 6000 mm, the pile diameter is set to 600 mm, and the moderately weathered dolomite is used as the pile foundation bearing layer.
The relationships between the principal physical quantities are derived from the second theorem of similarity:
σ = f Q , L , γ , E , c ,
where Q, L, γ, E, and c represent load, geometric dimension, unit weight, elastic modulus, and cohesion, respectively. Dimensional relationships exist among them:
σ = Q a , L b , γ c , E d , c e ,
where a, b, c, d represent the exponents to be determined.
In Equation (2), the dimensions of the physical quantities are as follows:
σ = Q L 2 γ = Q L 3 E = Q L 2 c = Q L 2 ,
By substituting the dimensions of the aforementioned physical quantities into Equation (2), the following is obtained:
Q L 2 = Q a , L b , Q L 3 c , Q L 2 d , Q L 2 e ,
It is derived from the principle of dimensional homogeneity.
a = 1 c d e b = 2 + 3 c + 2 d + 2 e ,
By substituting into Equation (4), the following is obtained:
σ L 2 Q = γ L 3 Q c , E L 2 Q d , c L 2 Q e ,
σ L 2 Q = ϕ γ L 3 Q , E L 2 Q , c L 2 Q ,
Letting σ L 2 Q = π 1 , γ L 3 Q = π 2 , E L 2 Q = π 3 and c L 2 Q = π 4 , Equation (7) can be expressed as:
π 1 = ϕ π 2 , π 3 , π 4 ,
It also holds true for the model:
σ m = f F m , L m , γ m , E m , μ m π 1 m = ϕ π 2 m , π 3 m , π 4 m ,
Assuming π 2 m = π 2 , π 3 m = π 3 and π 4 m = π 4 , the following can be obtained:
E m L m 2 Q m = E L 2 Q ,
C Q = C E C L 2 ,
γ m L m 3 Q m = γ L 3 Q ,
C Q = C λ C L 3 ,
By combining Equations (12) and (14), the following is obtained:
C E = C γ C L C c = C σ = C E ,
where C Q represents the similarity ratio of concentrated load, C E represents the similarity ratio of elastic modulus, C c represents the similarity ratio of cohesion, C σ represents the similarity ratio of stress, C L represents the geometric similarity ratio, and C γ represents the similarity ratio of unit weight.
In this study, the similarity ratios are mainly selected based on geometric similarity. According to similarity theory and existing experimental conditions, the geometric similarity ratio C L is set to 30. This ratio enables the fabrication of a sufficiently large test model within the allowable size of the test loading equipment to avoid severe boundary effects, while ensuring that the pile shaft roughness characteristics can be accurately fabricated and measured. For the convenient preparation of model materials, the unit weight similarity ratio C γ is set to 1.2. This ratio not only facilitates the availability of model materials but also meets the deformation stiffness requirements of the model materials. Based on these values, the rock parameters for the model test are determined. The parameters of in situ bedrock and model test rock are listed in Table 1.

2.2. Experimental Design

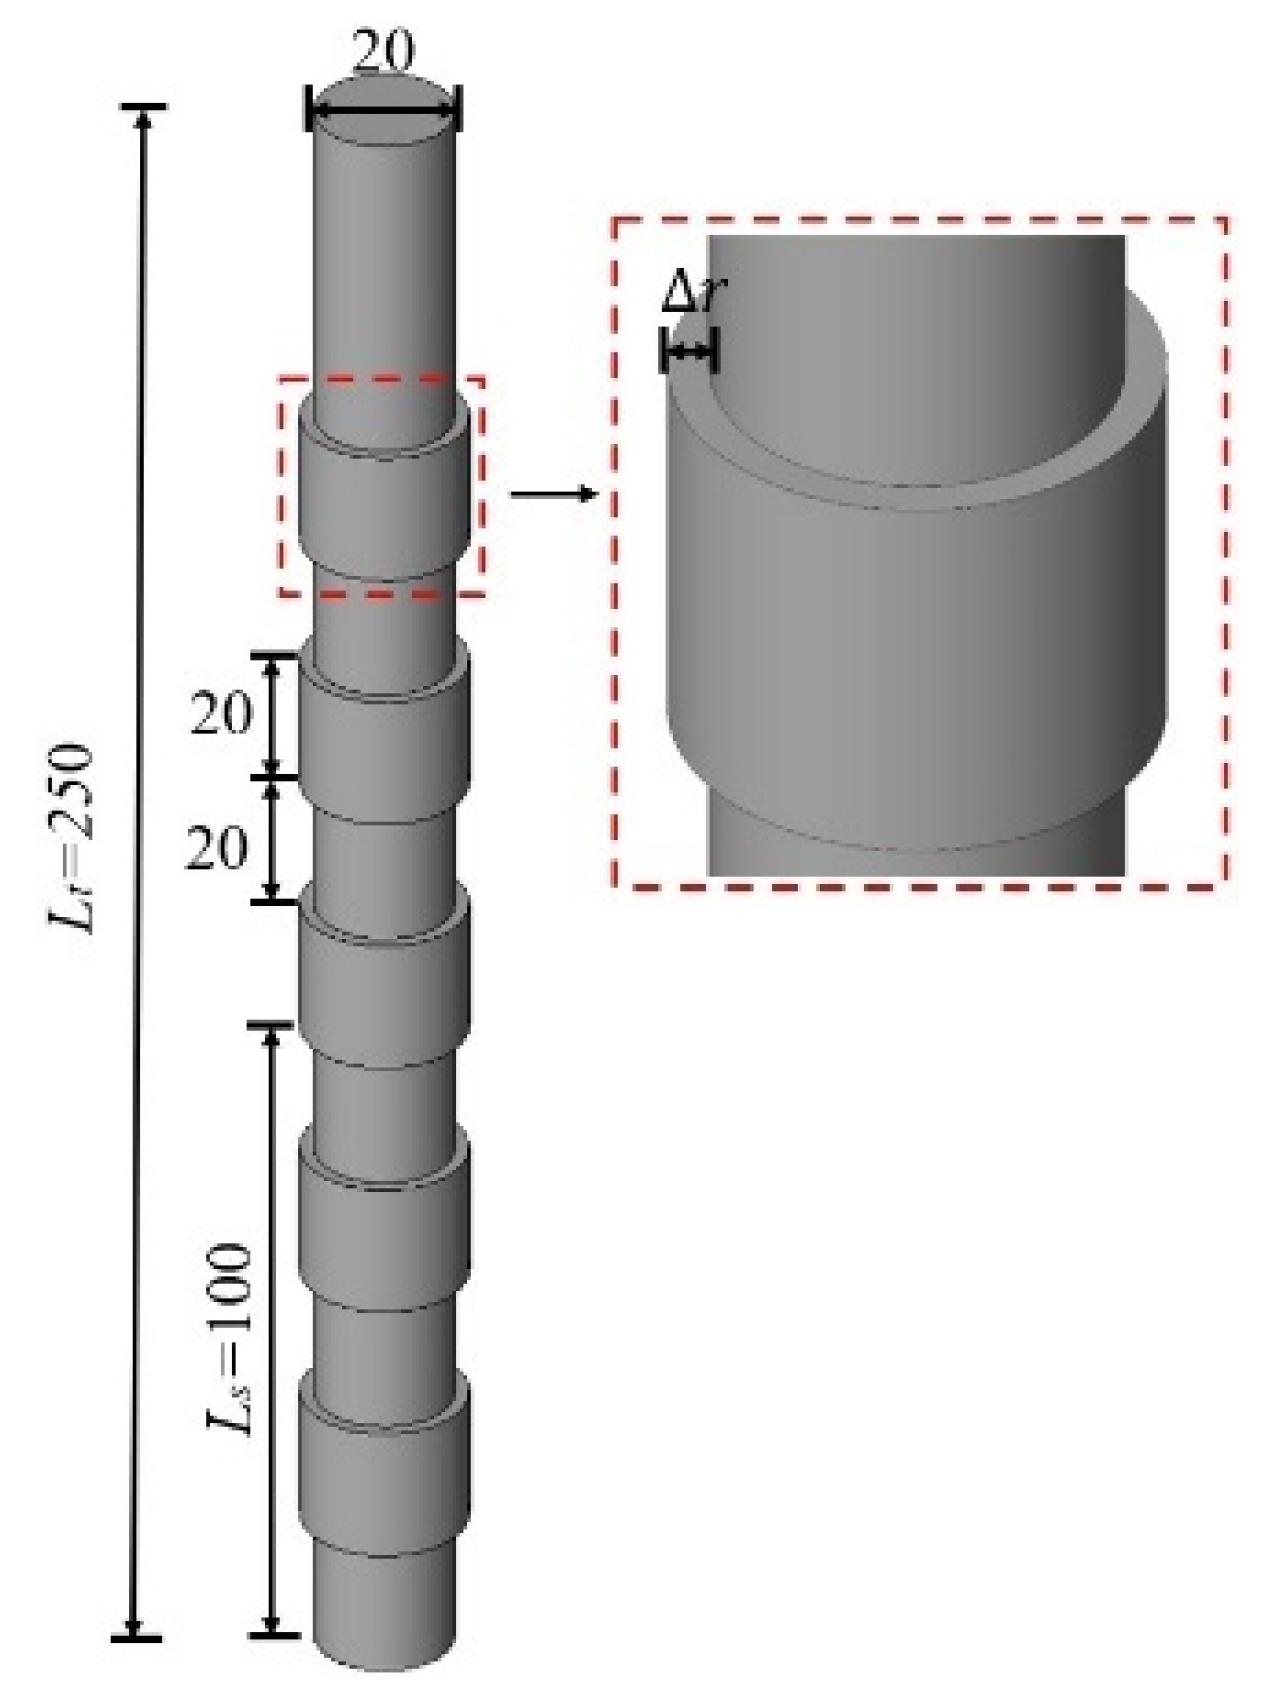
Horvath [7] proposed a method to quantify the roughness (RF) of the pile-rock interface. The calculation model is shown in Figure 1, and the calculation formulas are as follows.
R F = Δ r ¯ r s L t L s ,
Δ r ¯ = 1 n i = 1 n r i ,
where the average value of the roughness heights r ¯ of the pile–rock interface; r s is the average radius of the pile hole; L t is the total length of the profile curve along the depth of the pile hole; L s is the pile hole depth; w is average span (the smaller w, the more accurate the roughness calculation).
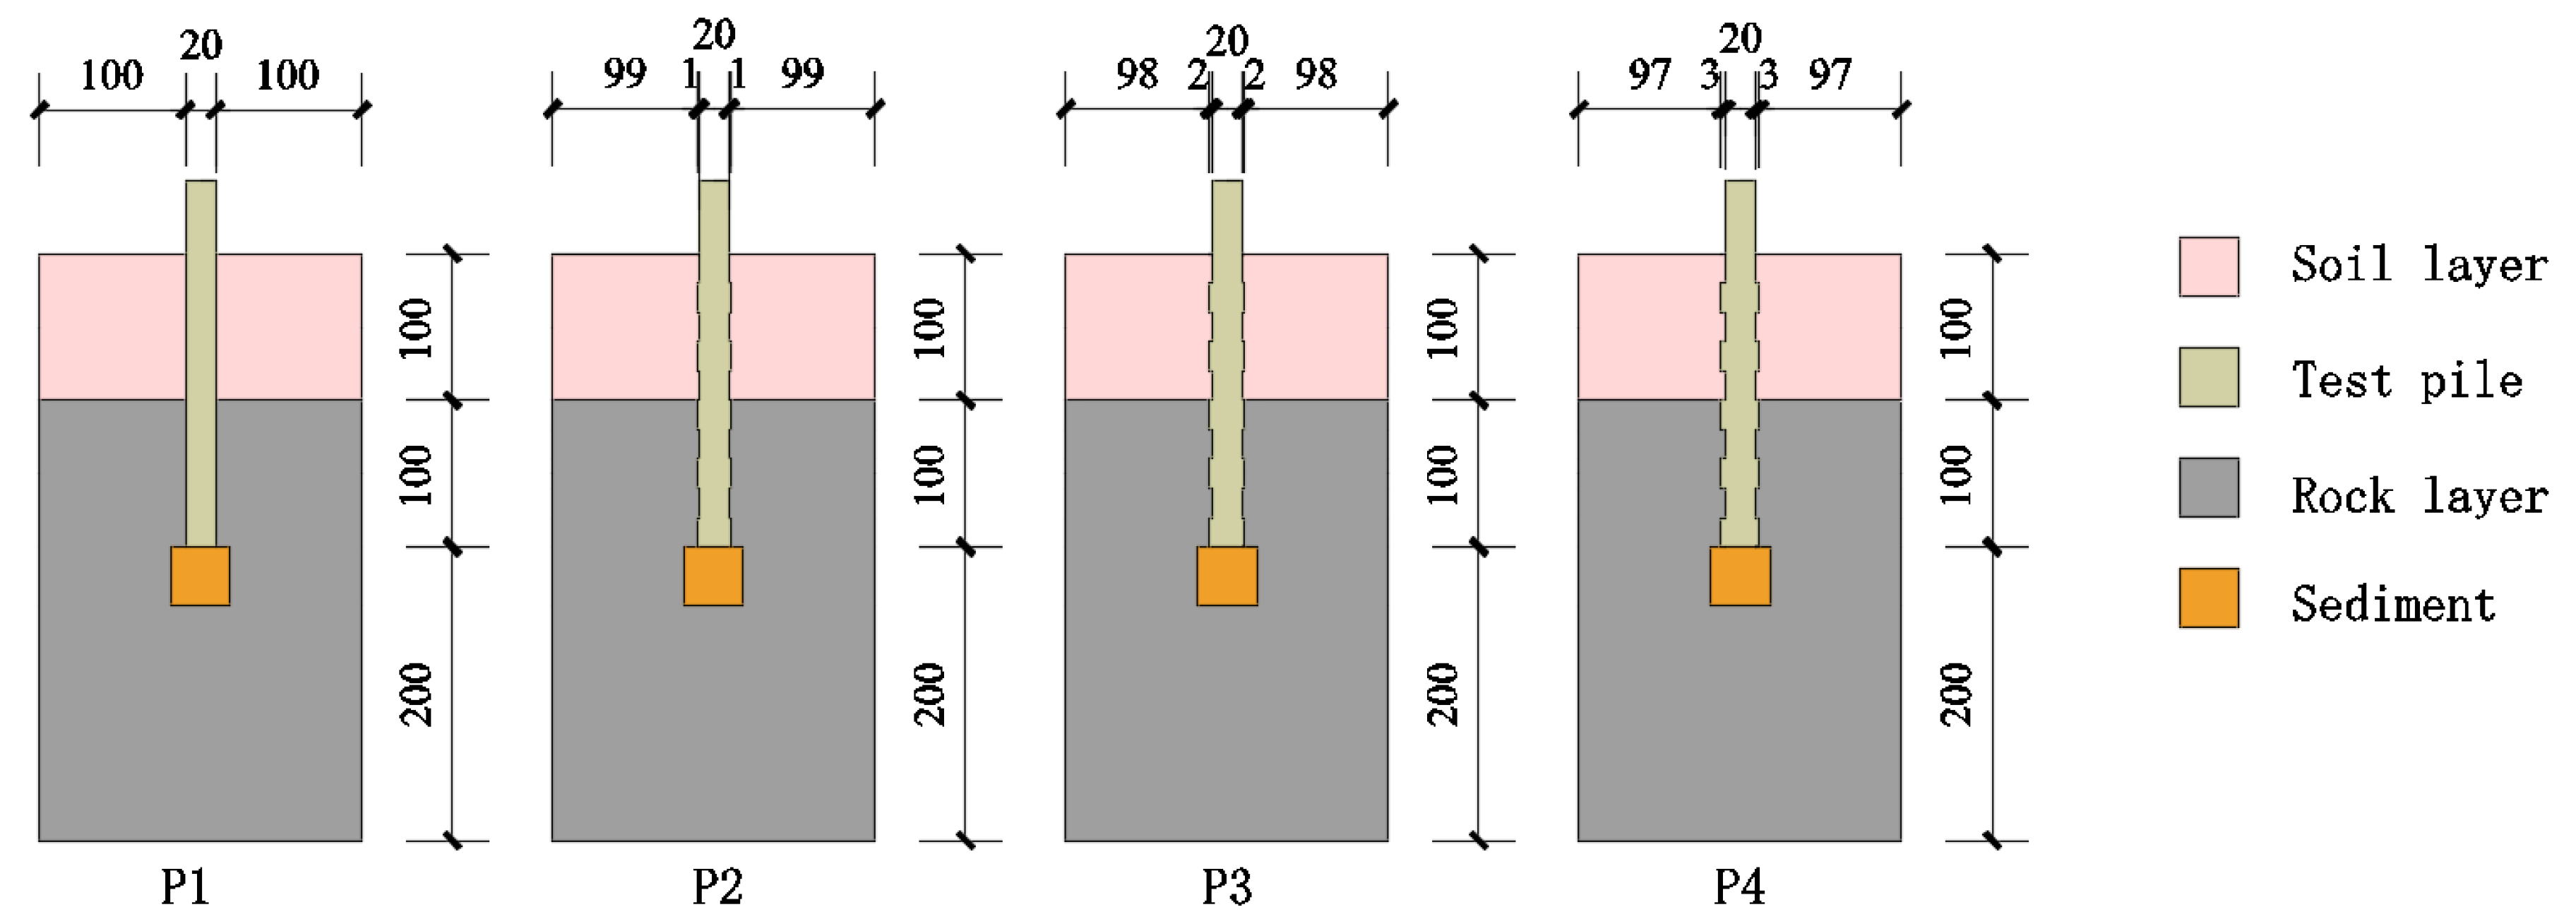
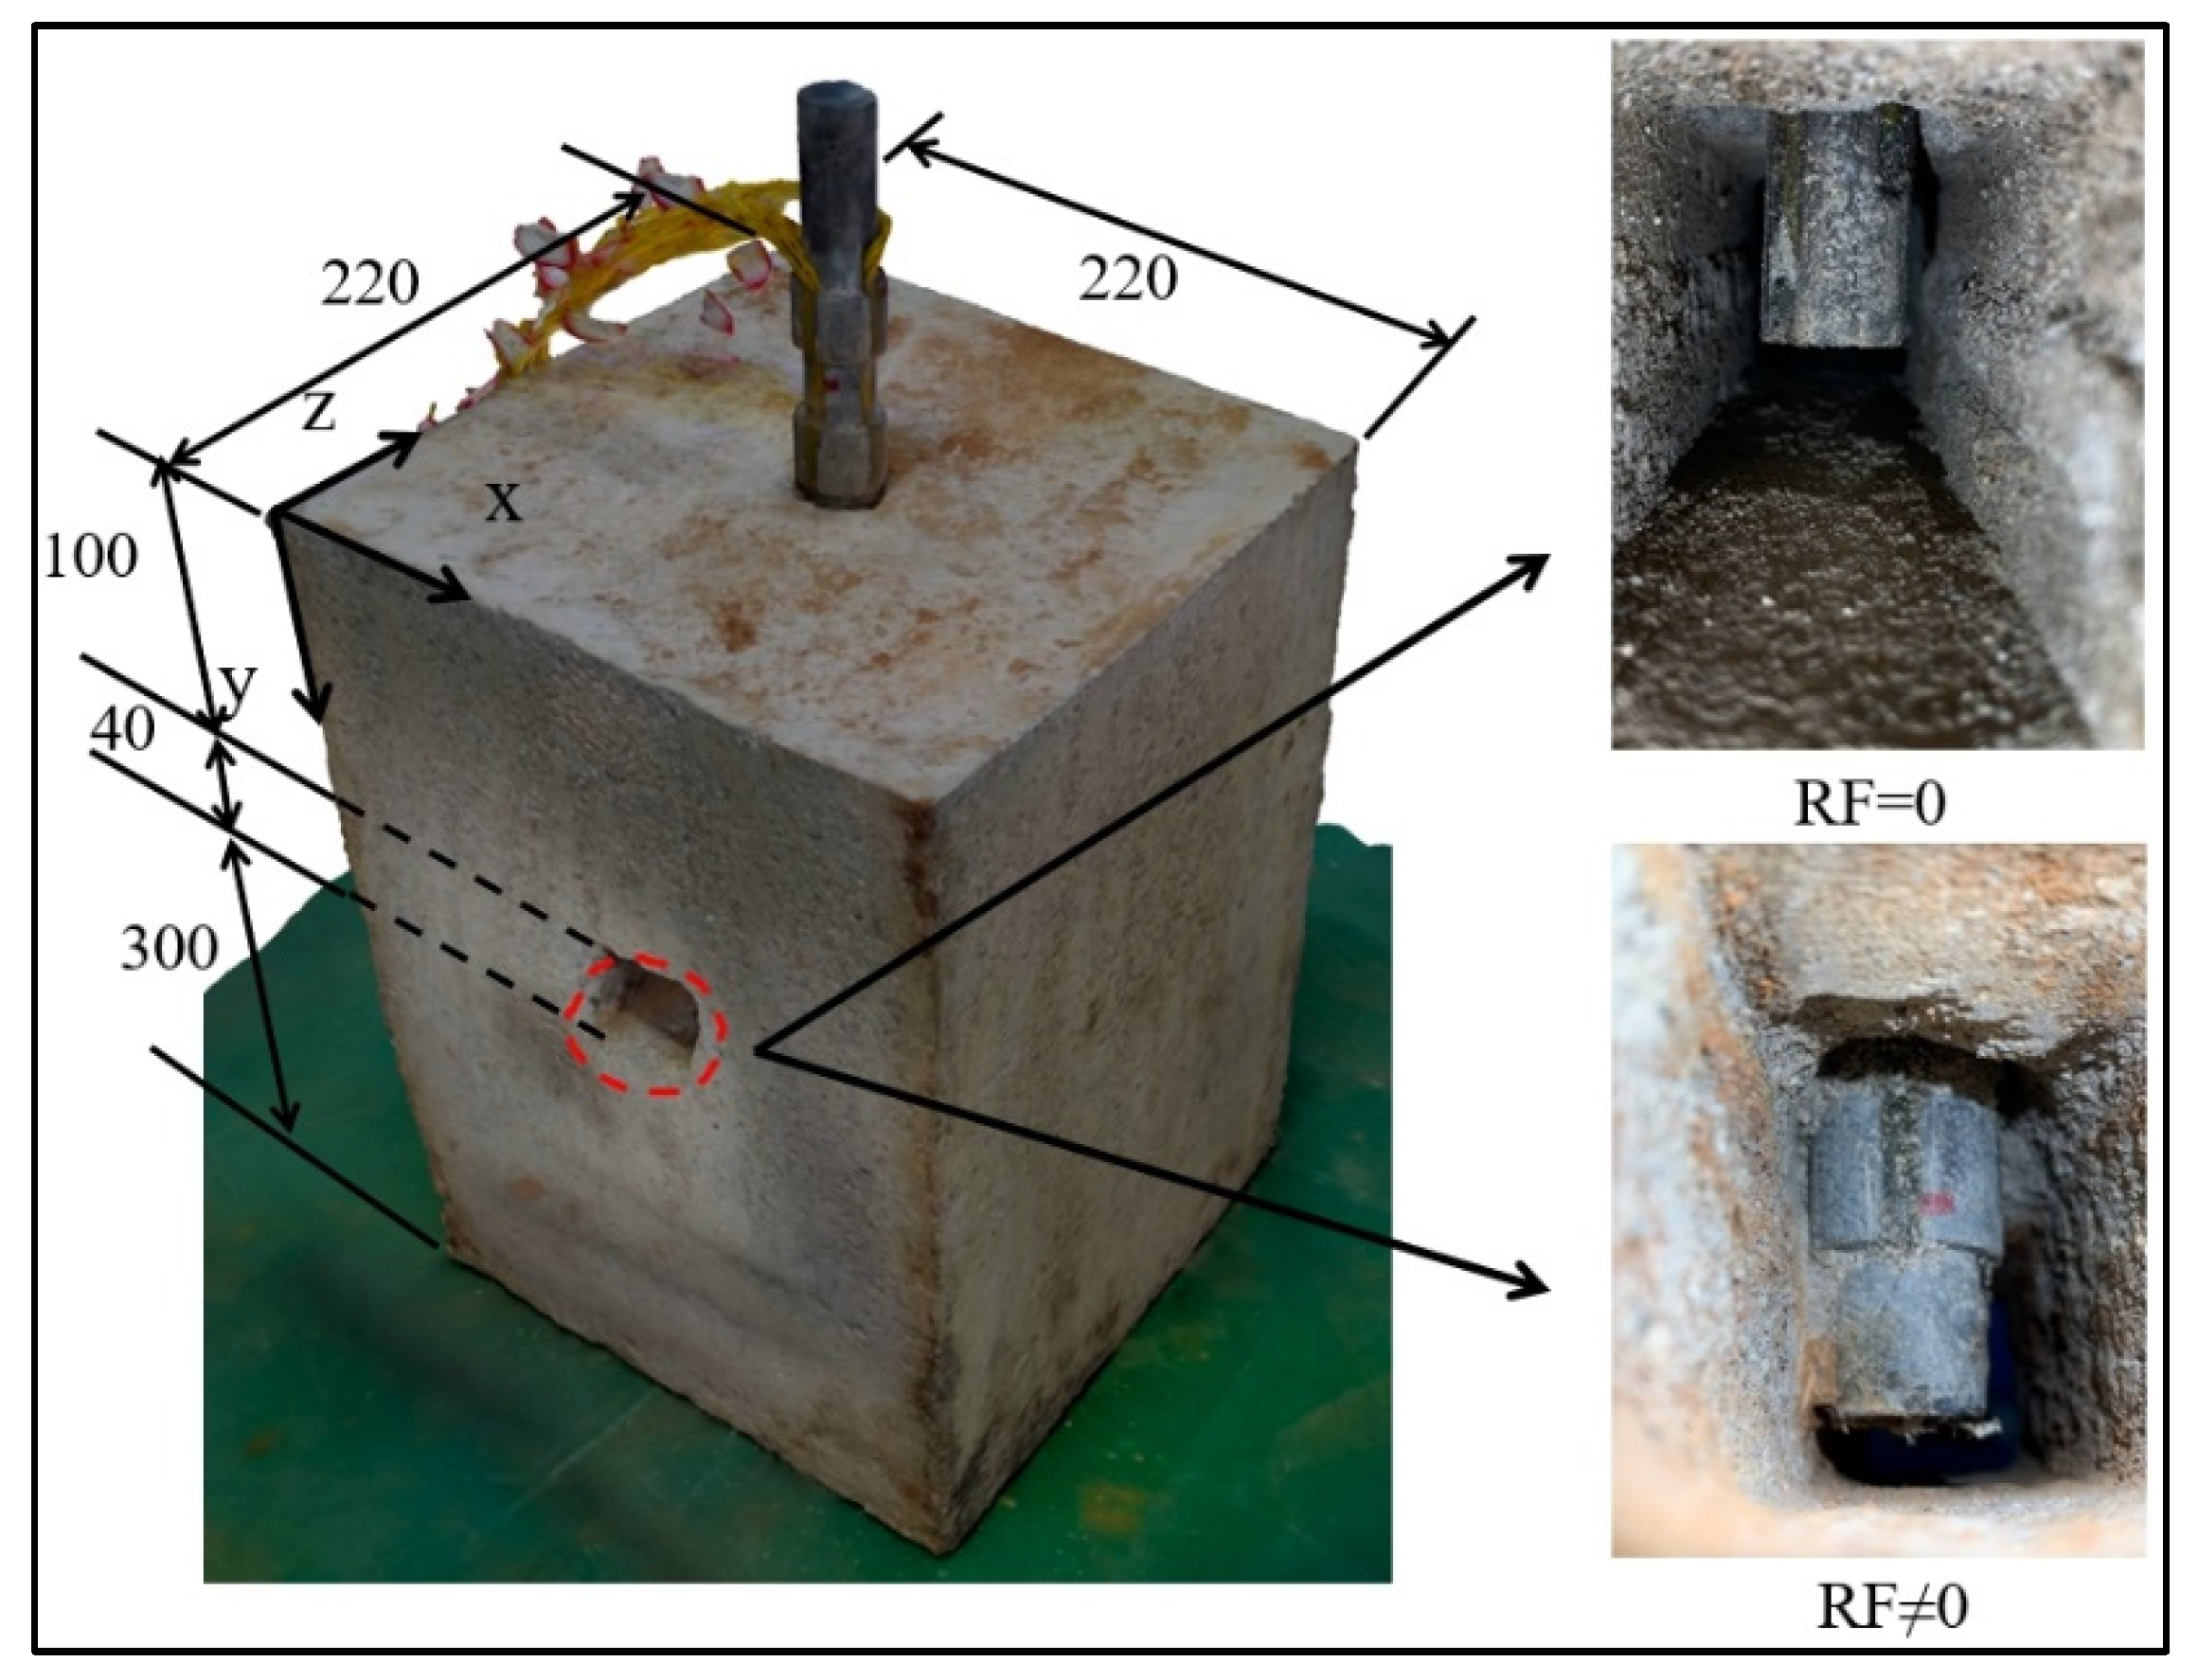
The roughness morphology of the pile–rock interface in this experiment is rectangular, as shown in Figure 2. The designed roughness heights r are 0 mm, 1.0 mm, 2.0 mm, and 3.0 mm, with RF of 0.0, 0.1, 0.2, and 0.3, respectively. The design scheme and schematic diagram of the experimental model in this study are presented in Table 2 and Figure 3, where the clearance between the test pile and model boundary is 5D to avoid boundary effects [26]. Moreover, to mitigate tip resistance, the pile tip was configured with sediment scum measuring 30 cm × 40 cm × 220 cm.

2.3. Model Materials and Fabrication

The pile materials are composed of cement, silica fume, steel slag powder, quartz sand, water, and water-reducing agent, corresponding to a mass proportion of 1:0.525:0.2:0.25:0.5:0.017. The compressive strength and elastic modulus of the test block are measured to be 65 MPa and 30 GPa, respectively. The rock simulation materials are composed of cement, medium sand, water, and rapid hardener, corresponding to a mass proportion of 1:6.5:1.196:0.02. Cement type is P-O 42.5, medium sand is dry density of 1800 kg/m3 and passes through 2 mm fine sieve. The compressive strength and elastic modulus of the test block are measured to be 5.0 MPa and 0.6 GPa, respectively.
To avoid the impact of model pile deformation on the test results, the designed elastic modulus of the model pile is greater than the designed elastic modulus of the prototype pile converted by the similarity ratio. The elastic modulus of the prototype pile ranges from 30~40 GPa. According to the similarity ratio of this test, the converted elastic modulus of the model pile is 0.83~1.12 GPa. The elastic modulus of the model pile is 30 GPa, which is much larger than 1.12 GPa, thus preventing model pile deformation from affecting the test results.
The bottom dimensions of the test model box are 220 mm × 220 mm, with a height of 400 mm. The fabrication of the test model mainly consists of two parts: pile fabrication and rock layer casting.
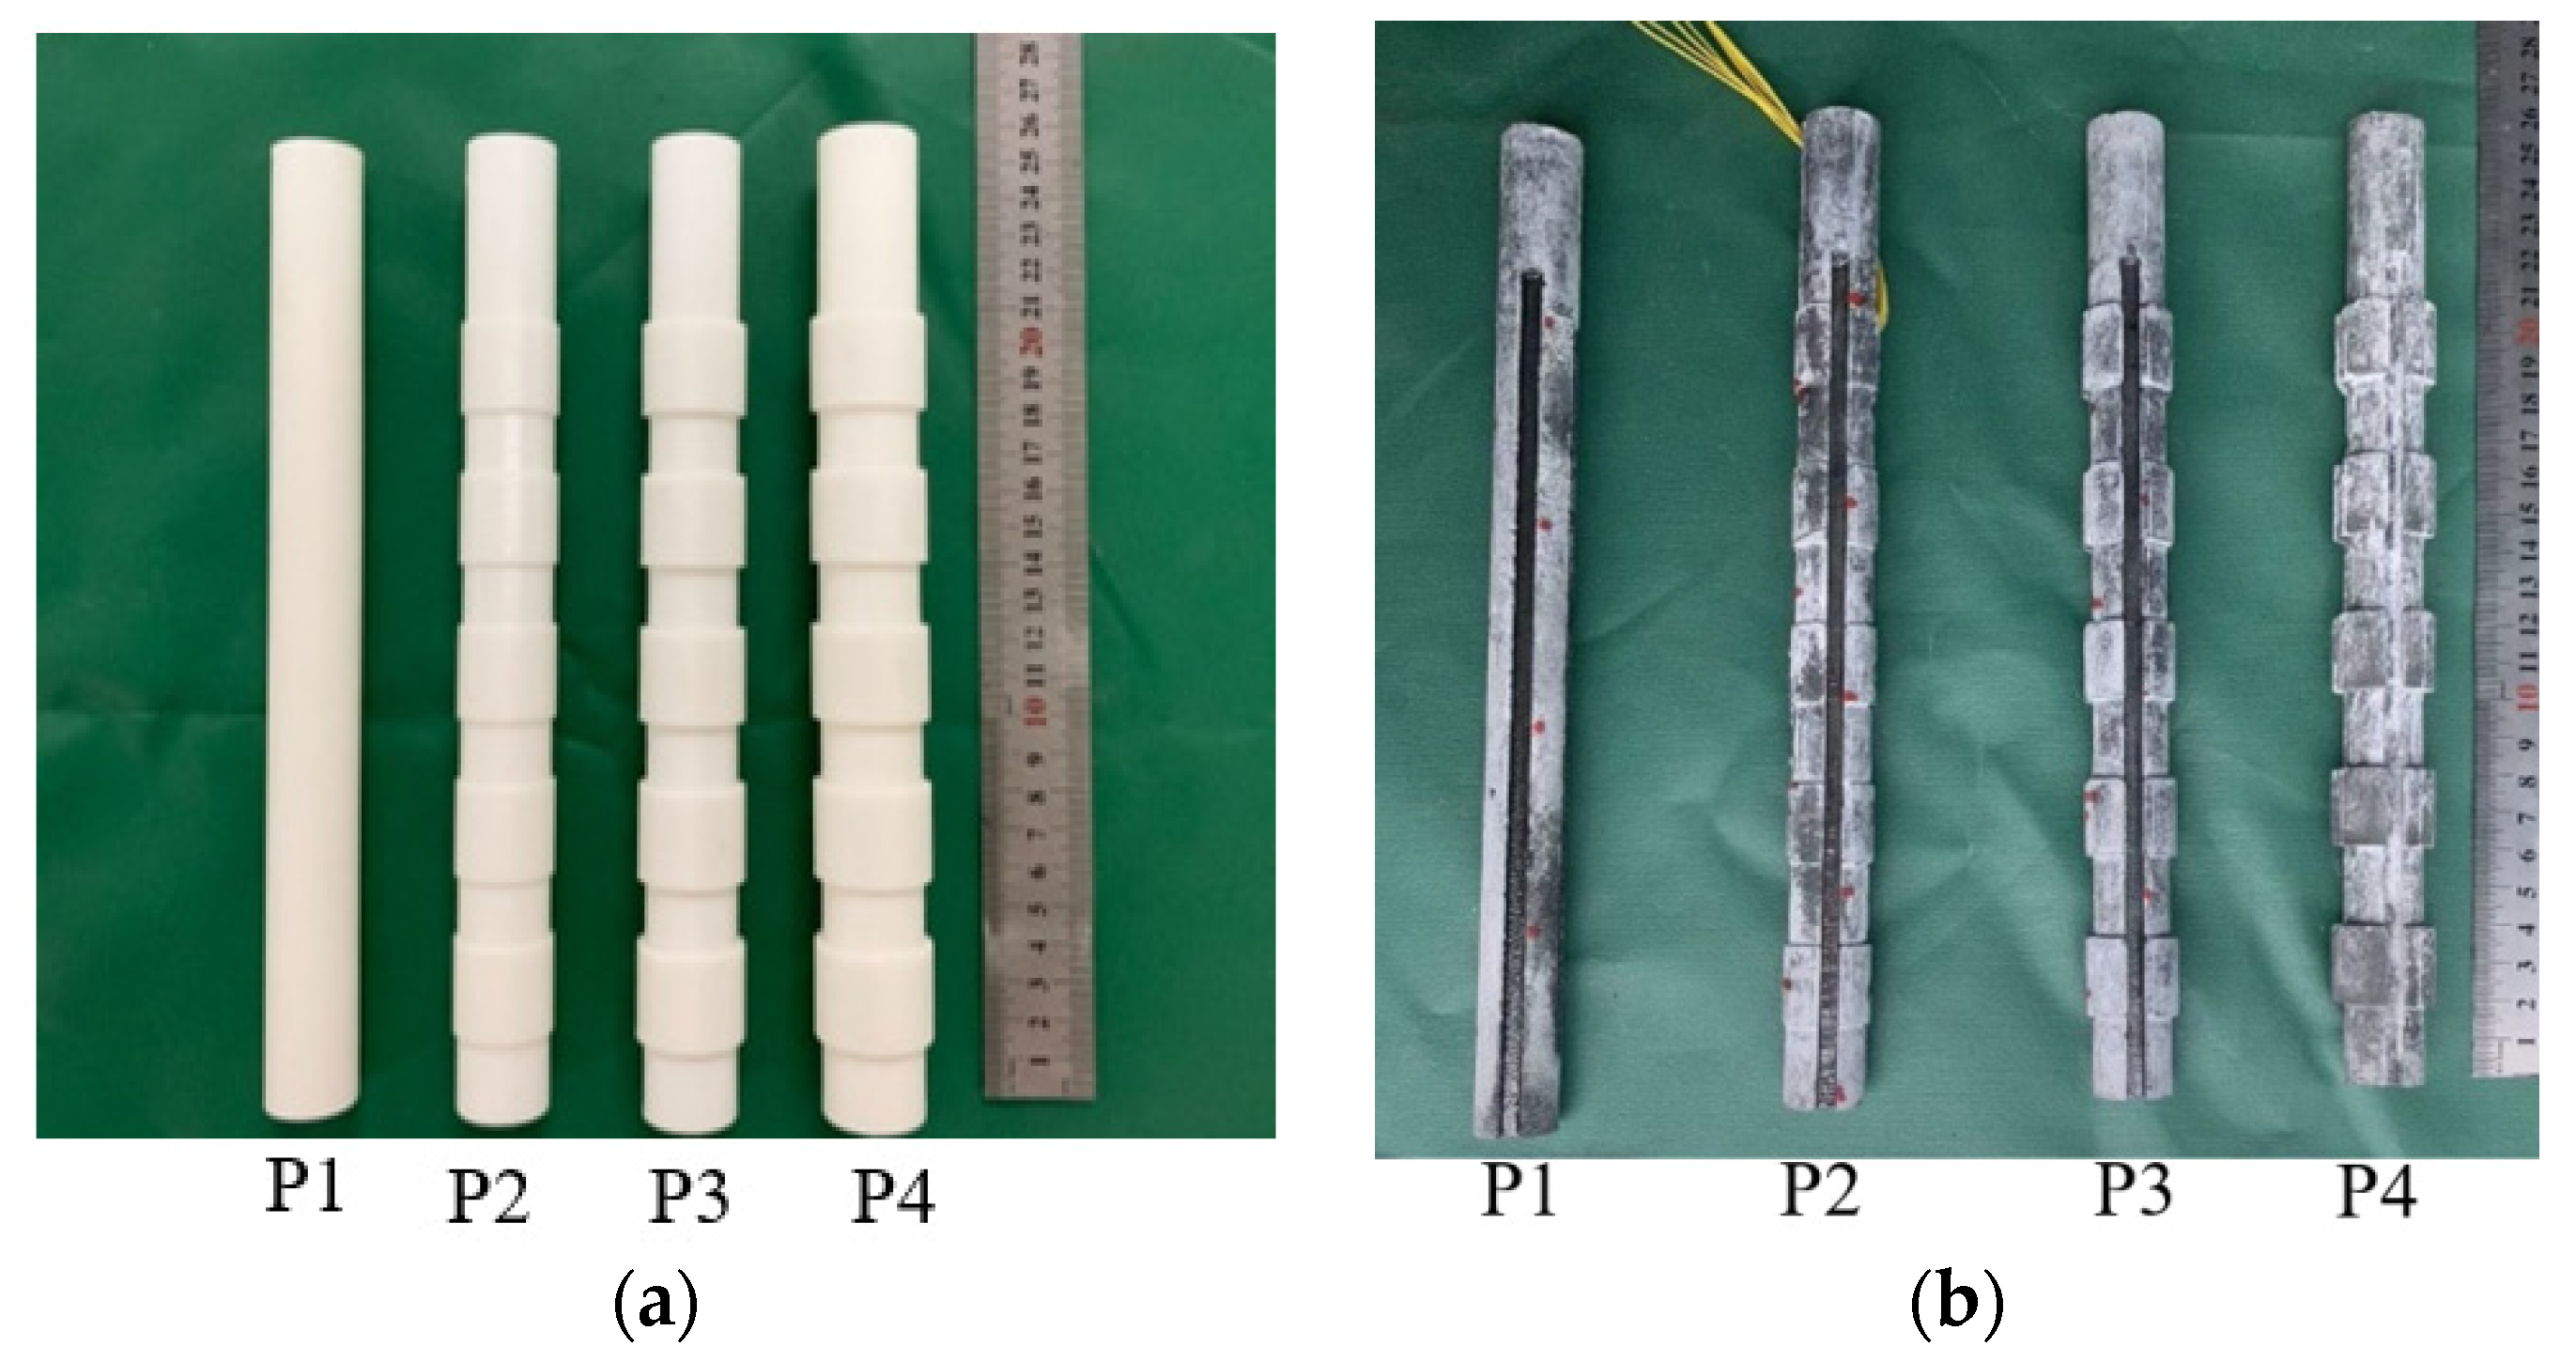
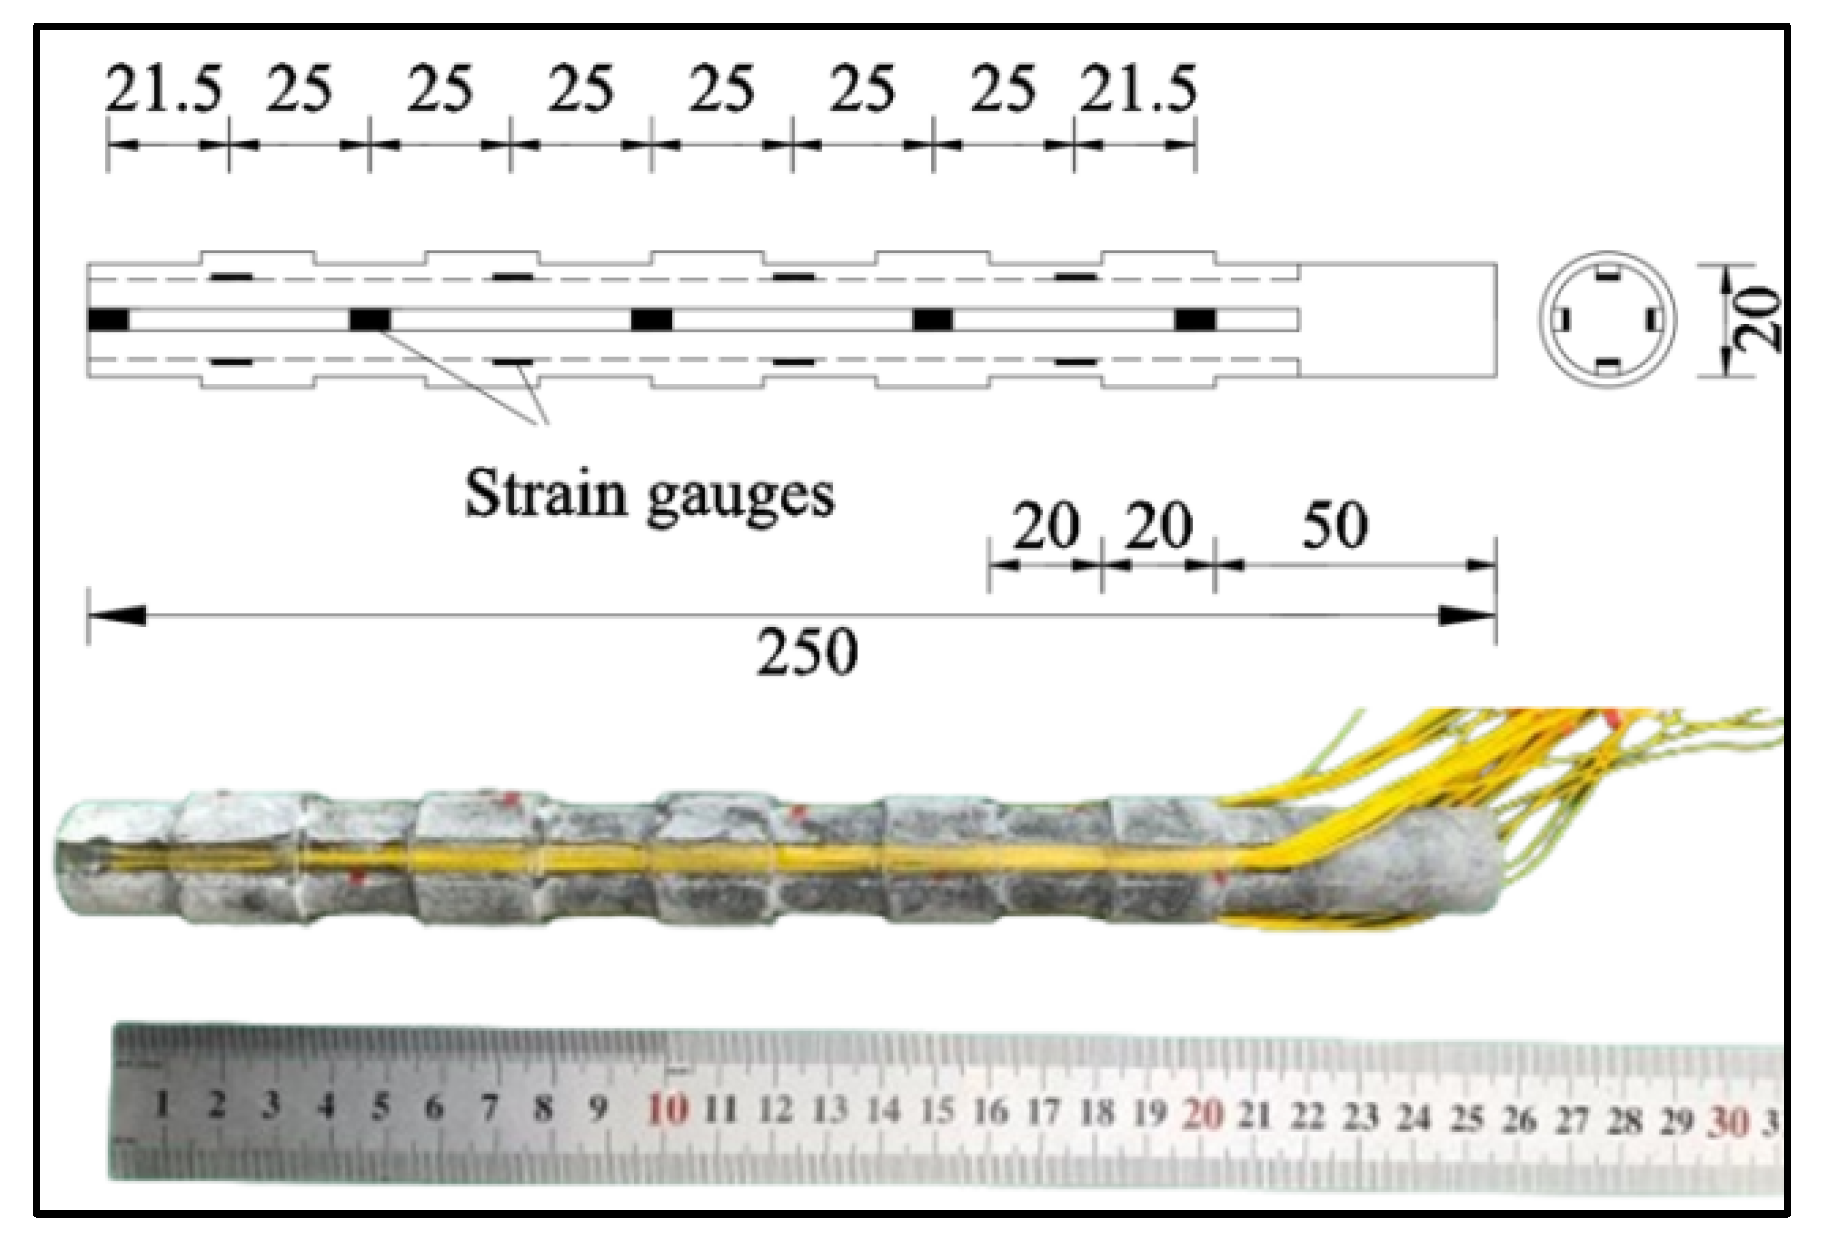
The test piles were prefabricated using 3D-printed molds, and the materials was mixed according to the designed mix proportions. The pile strength meets the requirements after curing at room temperature for 2 days and subsequent high-temperature and high-humidity curing for 7 days. The pile and pile mold are shown in Figure 4. The strain gauges are placed in the grooves reserved on the piles, and the wires are led out along the grooves. The epoxy resin is used to fill the grooves to protect the strain gauges. Since the strength and elastic modulus of the pile material are large enough and the grooves in the pile are arranged symmetrically, the grooving of the pile will not significantly change its physical characteristics, and the influence on the stiffness of the pile body after epoxy resin hardening is relatively small.
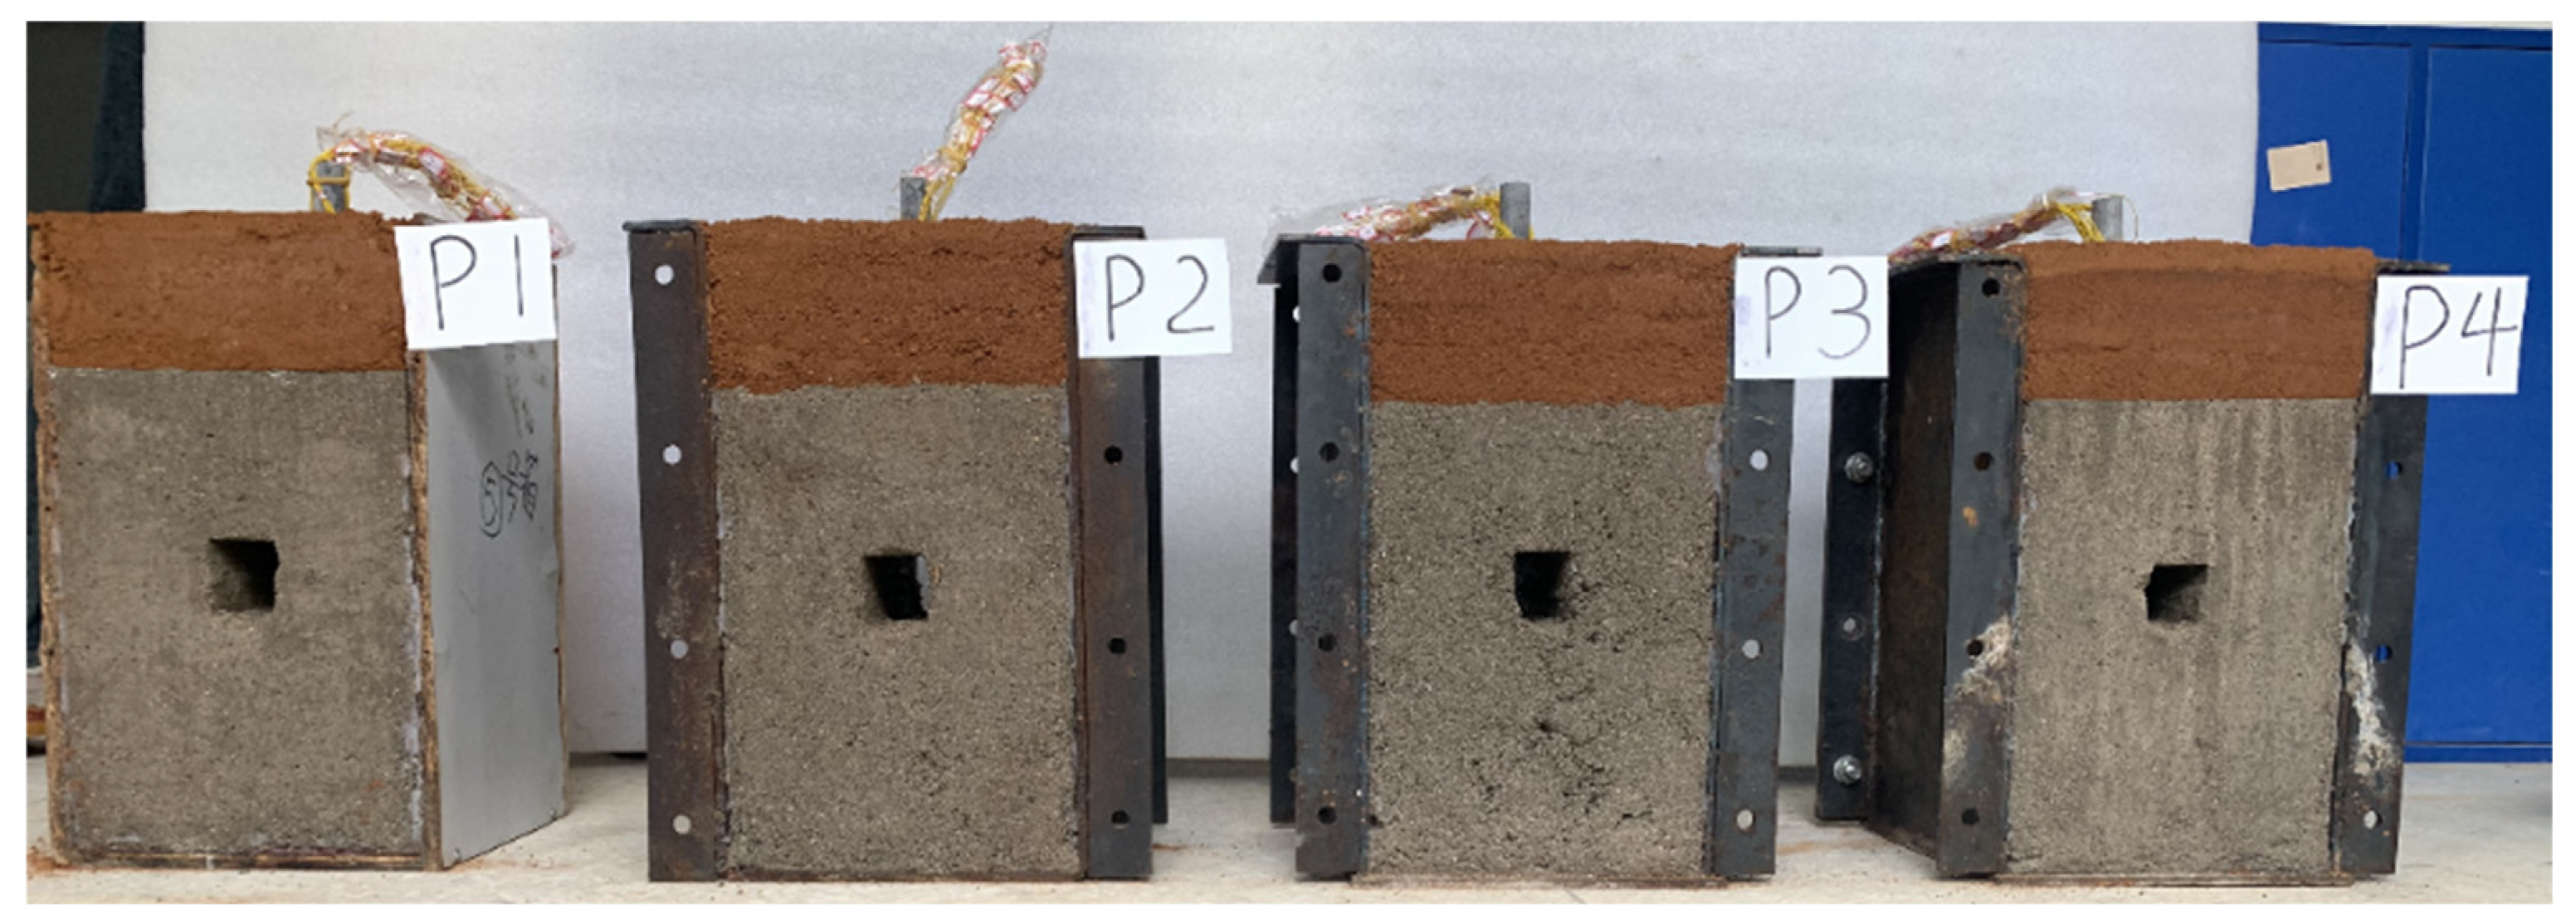
During the pouring of the rock layer, wooden strips with cross-sectional dimensions of 30 mm × 40 mm and a length of 220 mm were pre-installed at the bottom of the pile. The cement mortar is prepared and poured into the model box. When the cement mortar reaches below the wooden strips, the piles are fixed in the predetermined positions, and the mortar is further poured until the design elevation. The wooden strips are removed to create voids at the pile tip after curing for 2 days. The rock strength meets the requirements after curing for 7 days. The remaining space in the upper part of the test model is backfilled and compacted with red clay until the design elevation. The unit weight of red clay is 18 kN/m3, the water content is 26%, the compactness is 88%, the cohesion is 19.1 kPa, the internal friction angle is 11°, and the shear strength is 38.5 kPa. The test model is shown in Figure 5. The red clay is filled into the voids and sealed to simulate sediment at the pile tip.

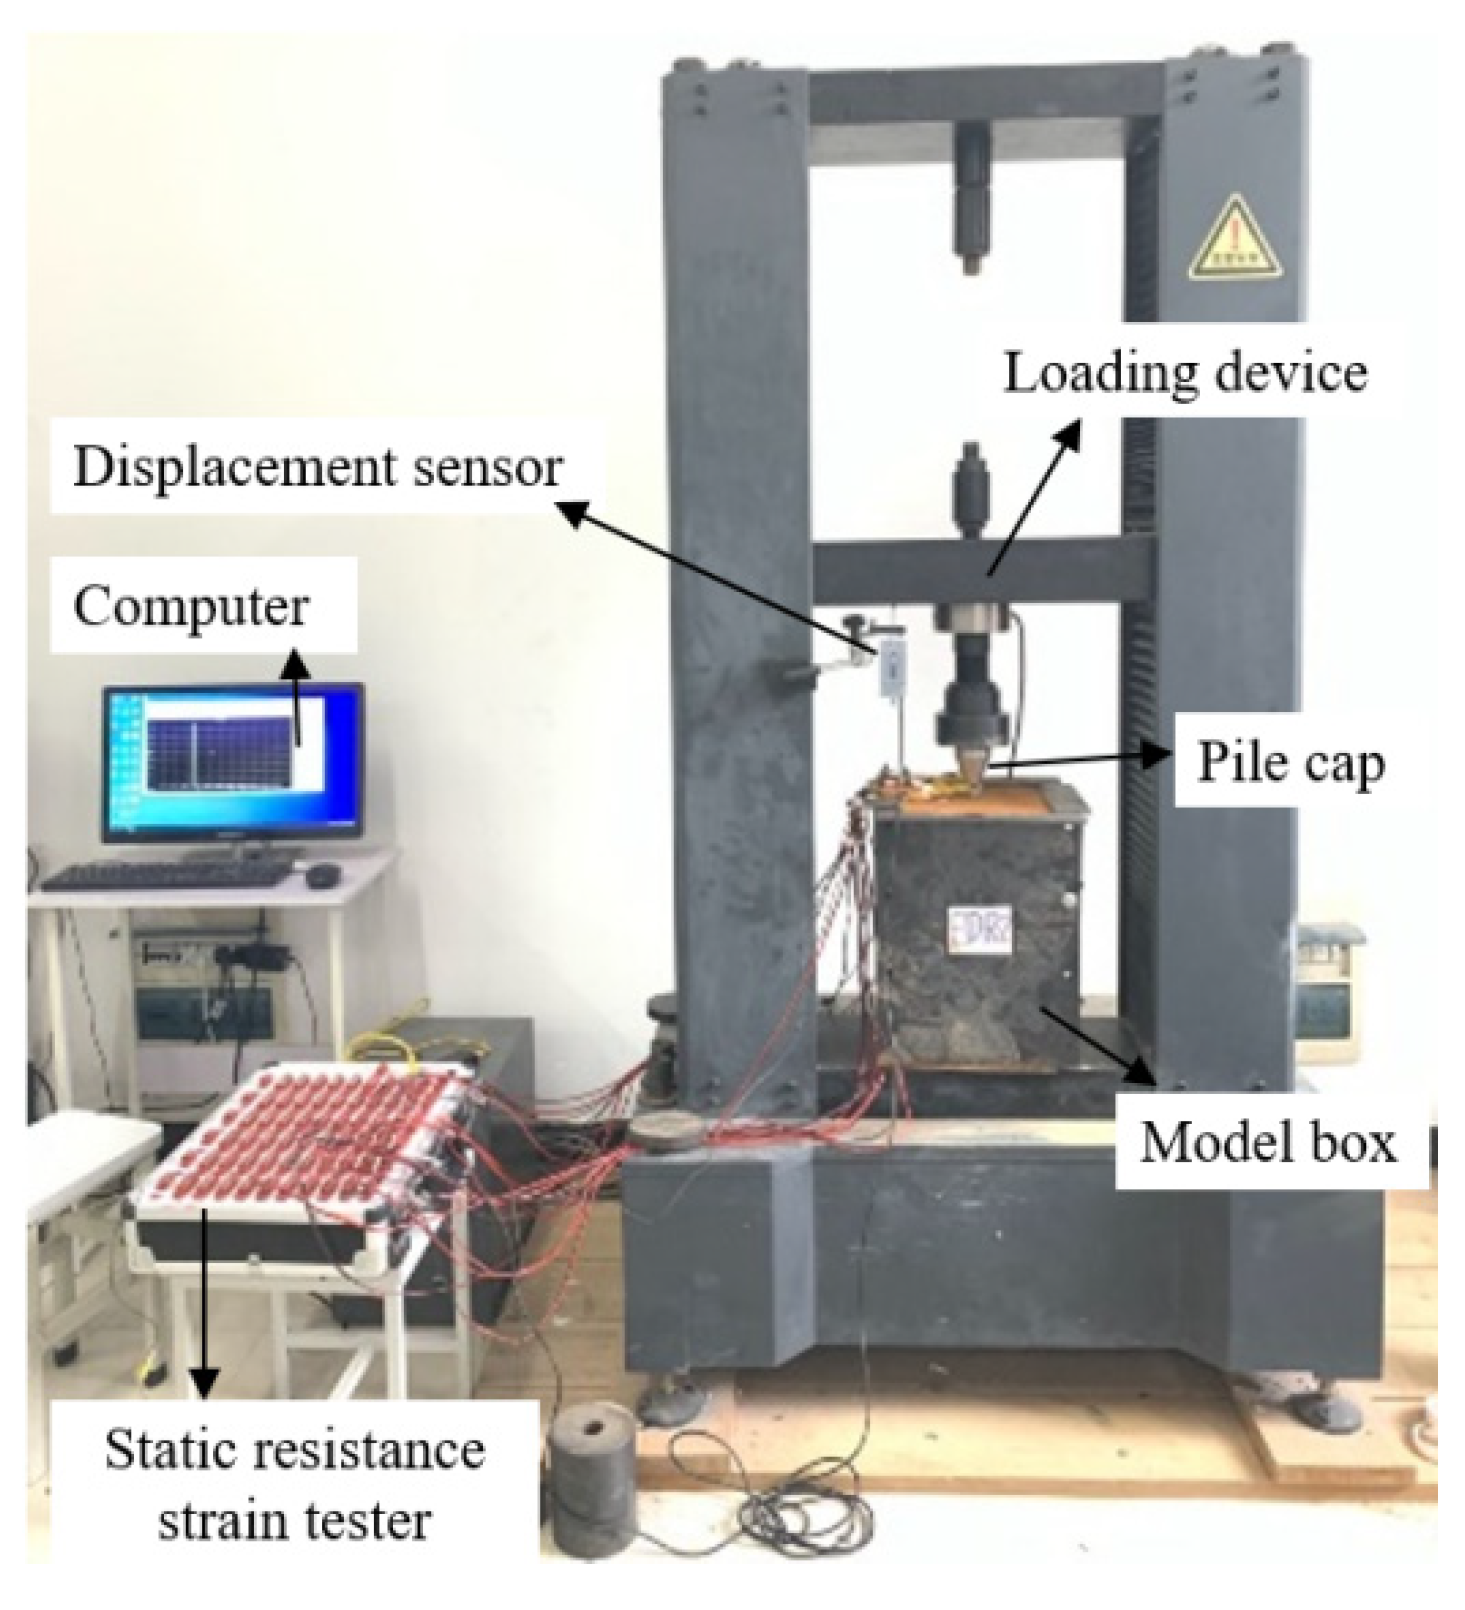
2.4. Loading and Data Acquisition

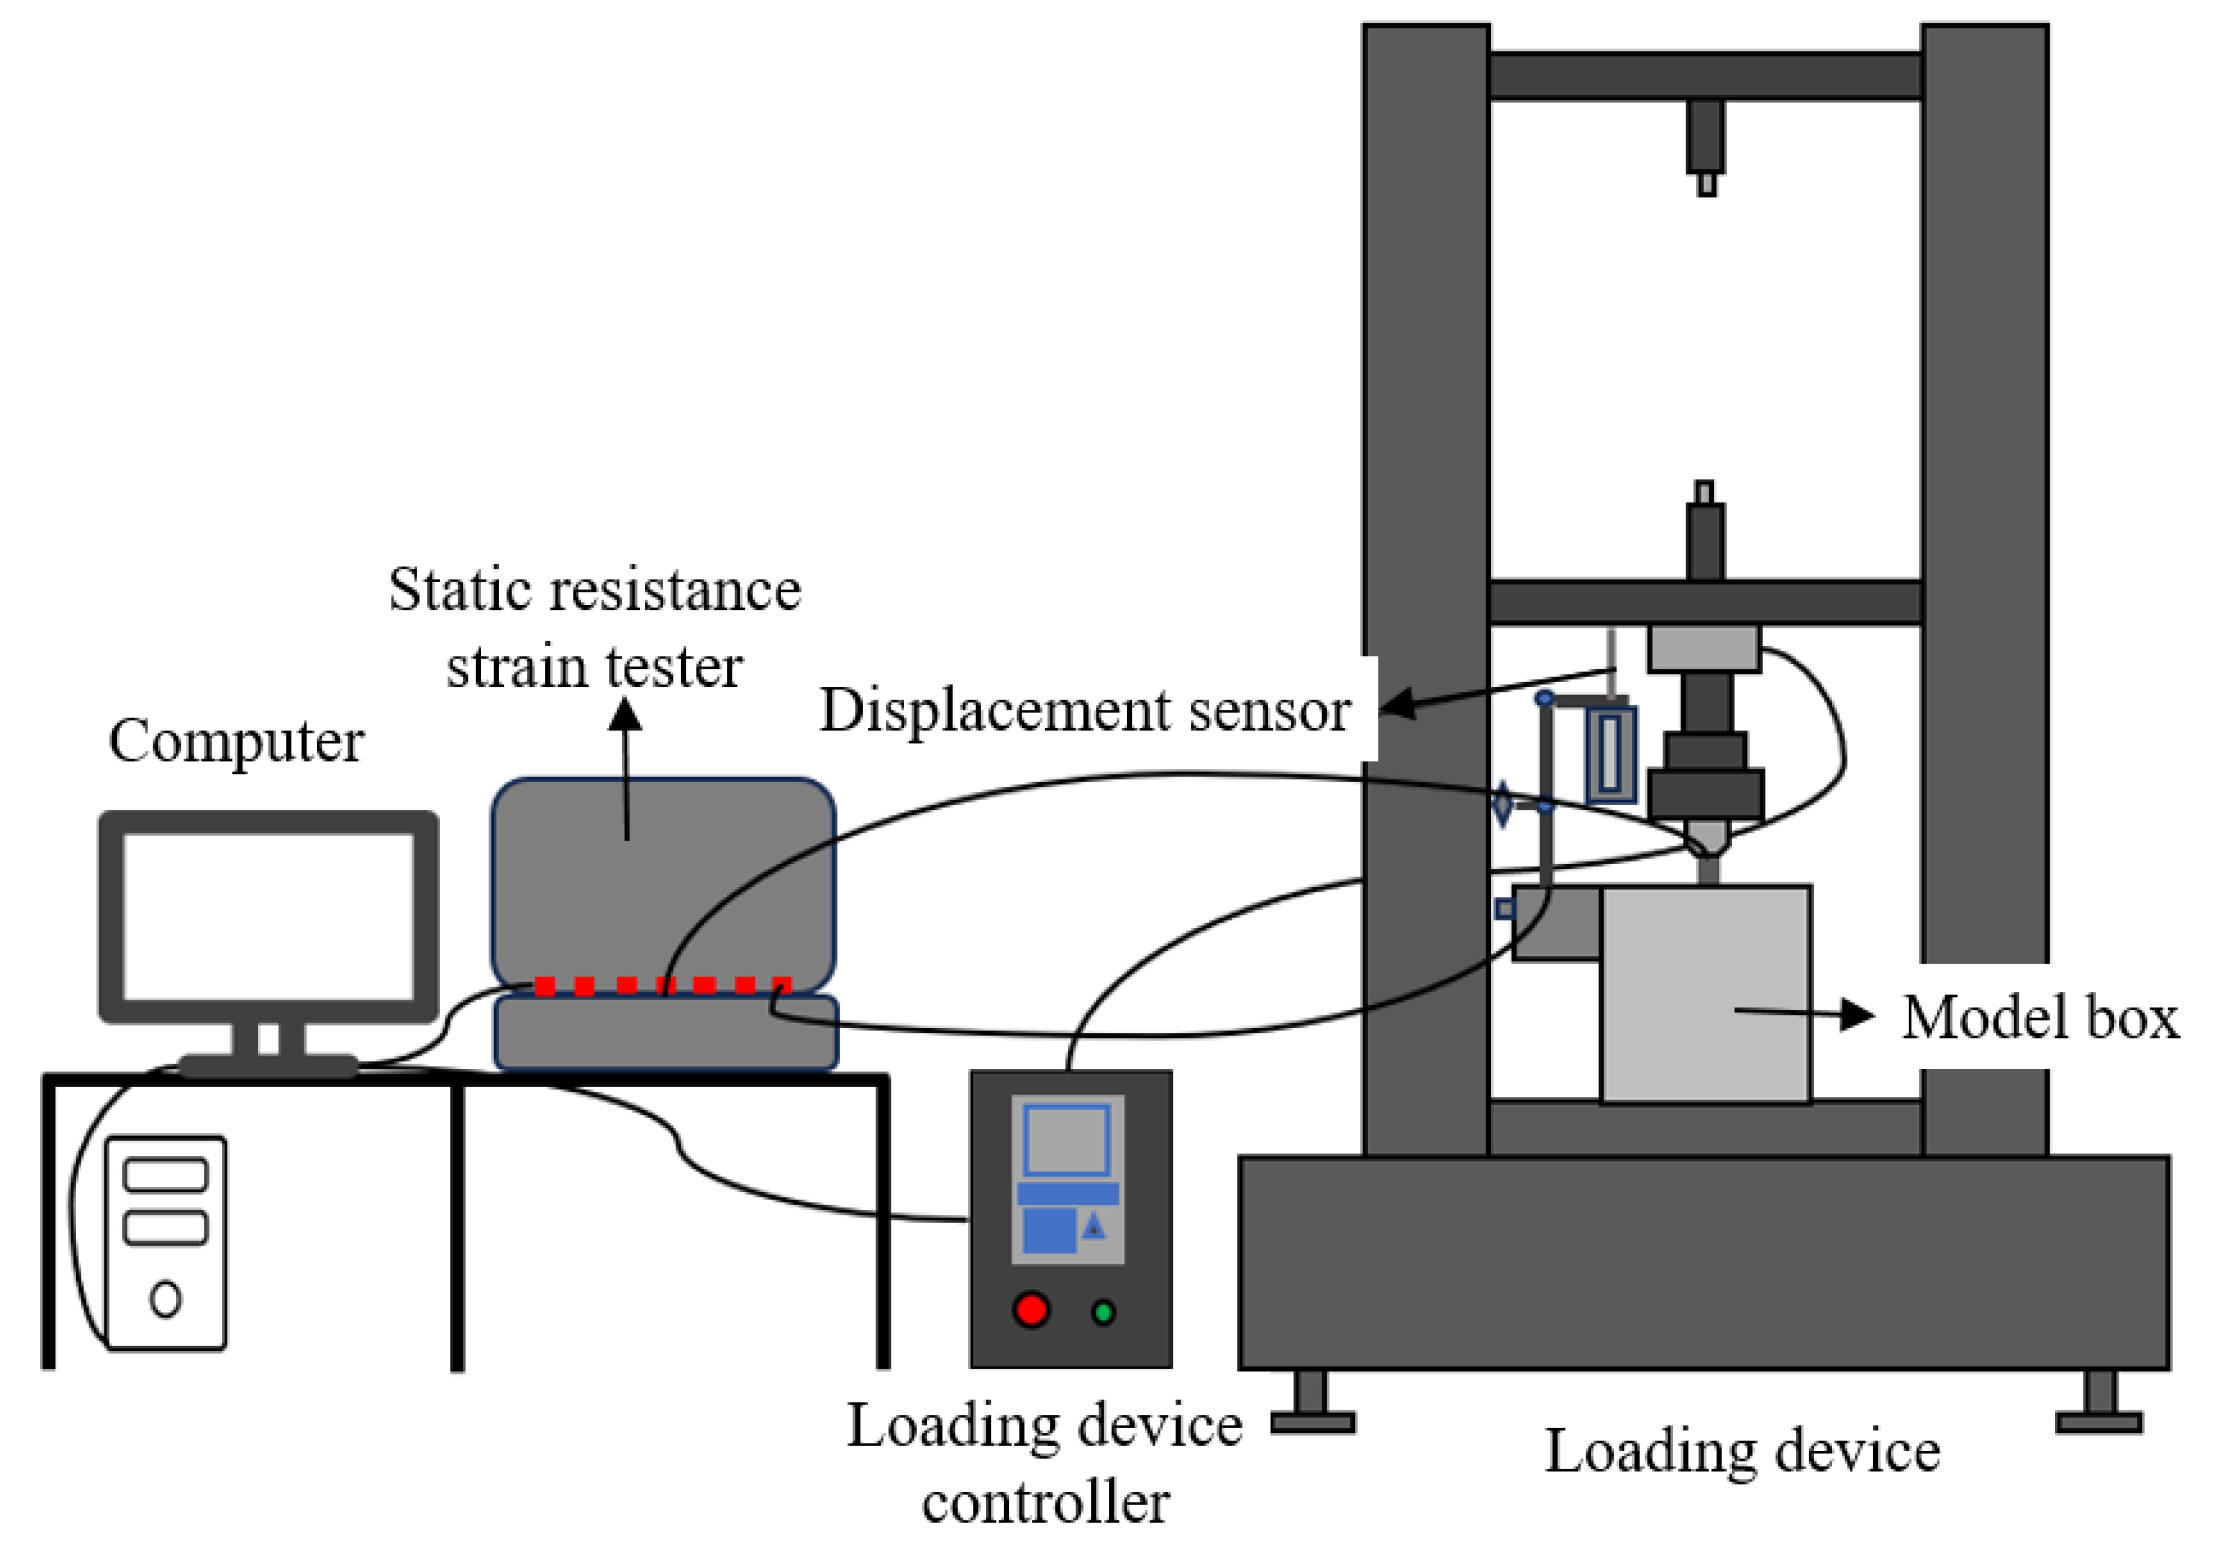
The loading equipment used is the XS(082)F universal testing machine, Shanghai Xusai Instruments Co., Ltd., Shanghai, China, from Guilin University of Electronic Technology, and the test load range is 200 kN. The loading rate adopted in the test is 1 mm/min. Although the loading rate may affect the peak strength of the rock mass [27], the core purpose of this study is to explore the influence of pile shaft roughness, so the loading rate variable has been controlled. Therefore, the loading rate of this test is minimum rate of the universal testing machine, 1 mm/min. The model box is placed in the preloading position, and the wires are connected to the dynamic and static stress–strain gauges. After the universal testing machine has been calibrated, 50 N load was applied for pre-compression, so that the pile cap was in full contact with the loading plate, the strain gauge and displacement transducers were set to zero, and loading was started according to the loading program until the pile or geotechnical body failed. Subsequently, the model box is removed, and the overlying fill soil and sediment at the pile tip are cleaned to observe the displacement at the pile tip and the condition of rock failure. The loading device for the test is illustrated in Figure 6 and Figure 7. The pile top load is collected via computer. The pile axial force is measured by strain gauges. The 1/4-bridge connection method is used to connect strain gauges arranged symmetrically on the same cross section of the pile. The arrangement of the strain gauges is shown in Figure 8. And the pile top displacement is measured by a displacement sensor. Both data are collected using the dynamic and static stress–strain gauges. The frequency of data collection is 4 Hz. The electrical resistance value of the strain gauge is 120 ± 0.3 Ω, the sensitivity coefficient is 2.11 ± 1%, and the strain gauge size is 6.8 mm × 3.3 mm. Displacement sensor model is YWD-30, measuring range is 30 mm. The range of miniature earth pressure cell is 20 MPa.

3. Experimental Results and Analysis

3.1. Failure Mode

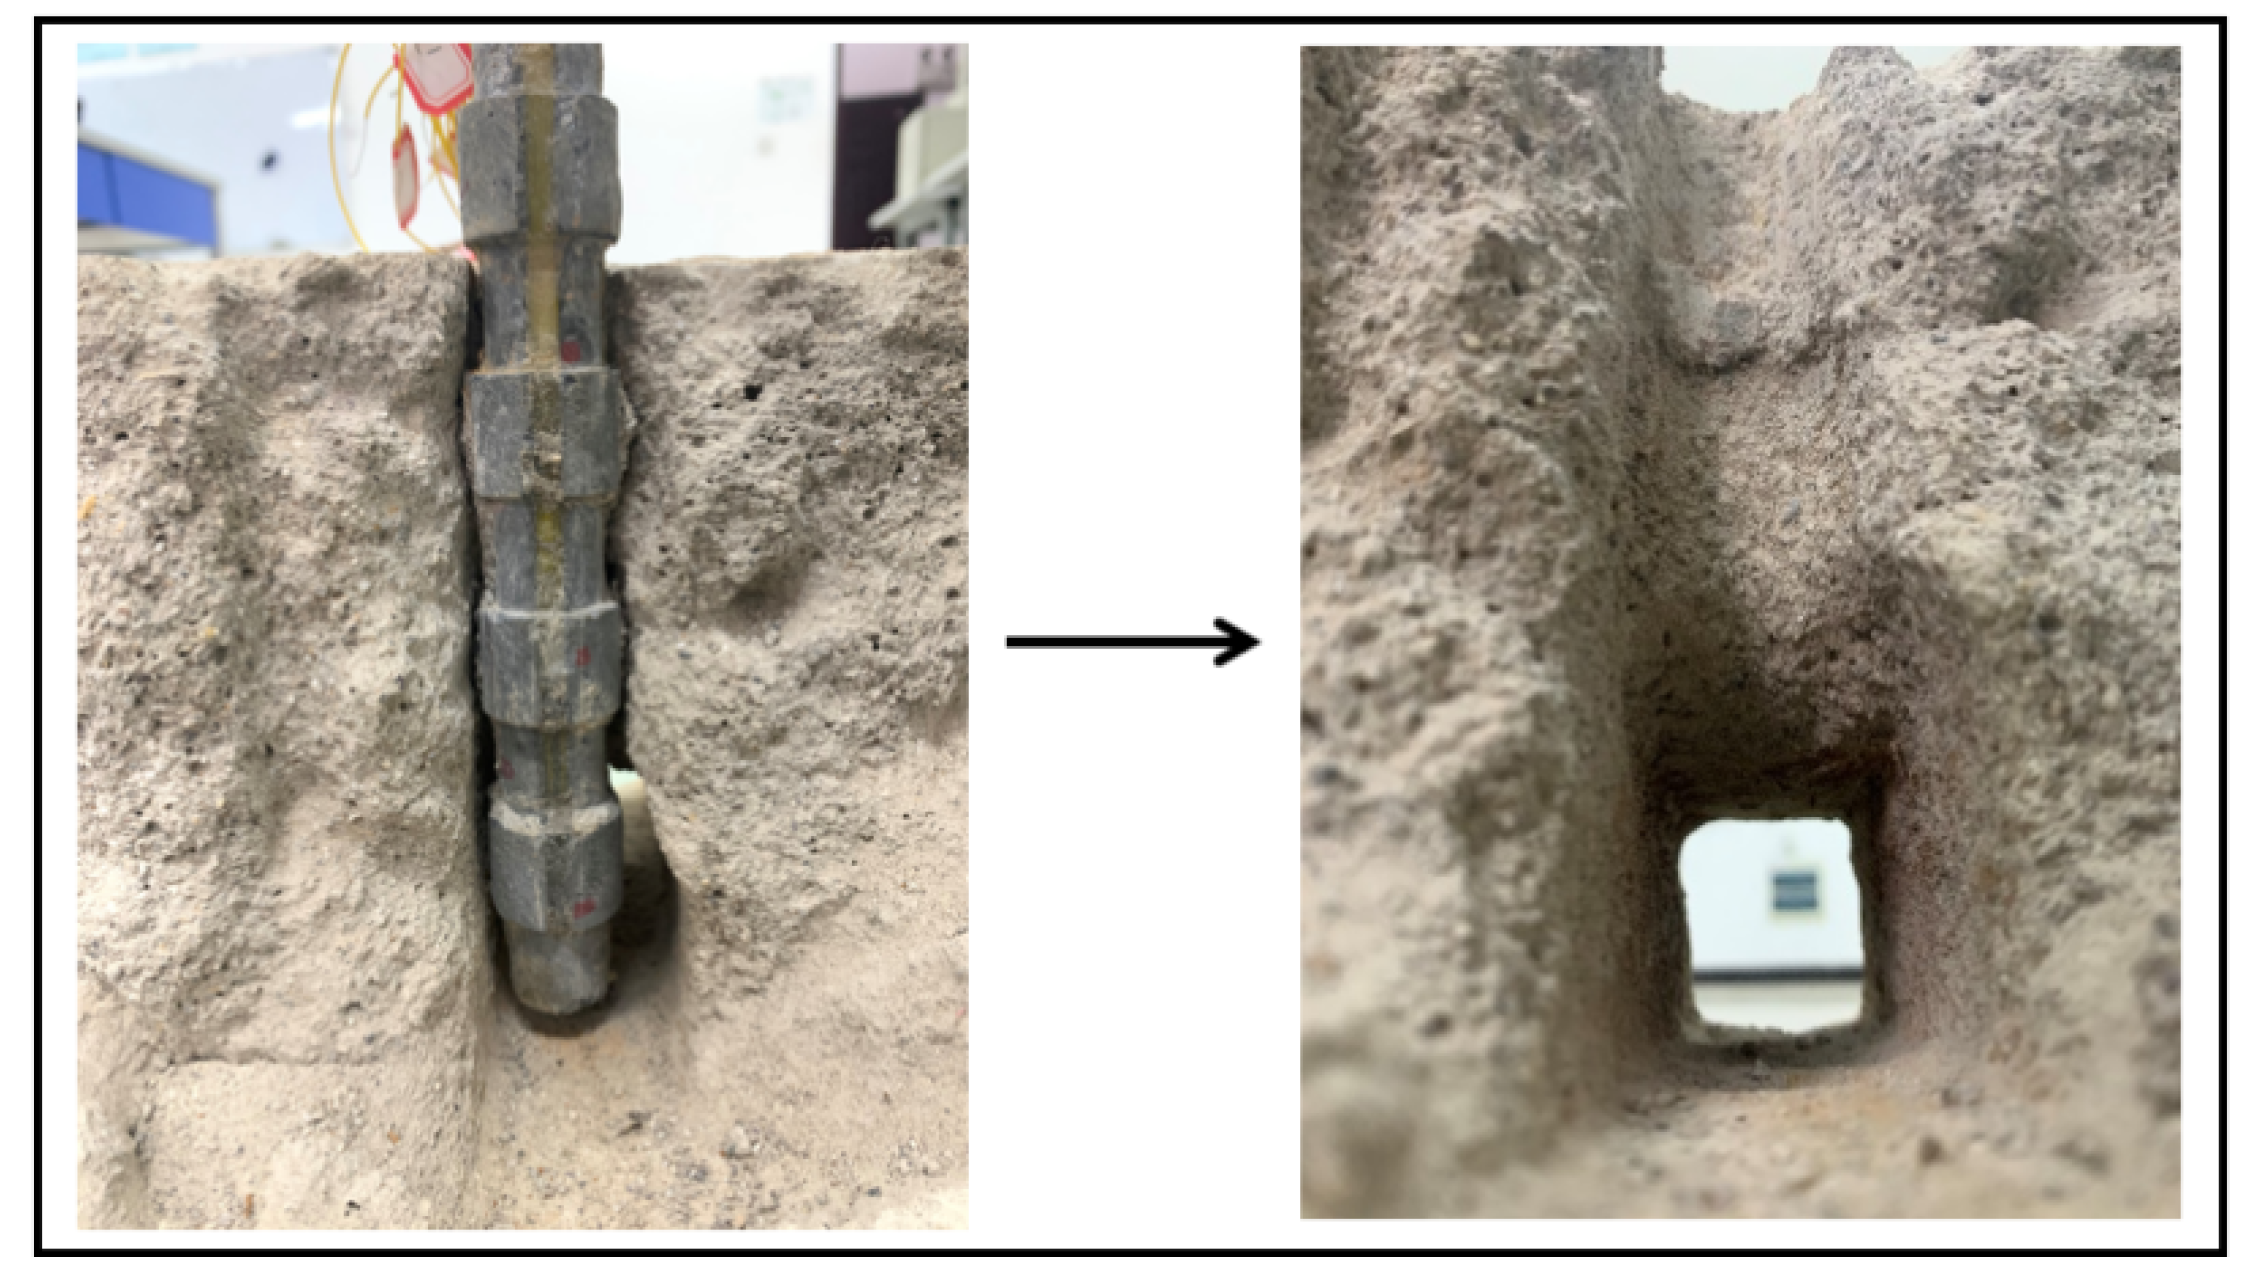
The failure mode of the pile and rock–soil mass is illustrated in Figure 9. The pile tip exhibits a downward movement, accompanied by a slight tilt. The degree of settlement at the pile tip is comparable to the displacement observed at the pile top, suggesting that the pile body underwent minimal compression. For the test pile TP1 (RF is 0.0), the surface of the pile shaft is relatively smooth. The failure surface occurs at the pile–soil/rock interface. For the test pile TP2~TP4 (RF is not 0.0), observing the pile–rock interface after splitting the rock reveals the failure mode, as illustrated in Figure 10. It is observed that the failure mainly occurs within the rock layer, presenting a cylindrical shape overall. The pile is kept intact, and the roughness of the pile–rock interface is no longer regular. Most of the roughness is sheared or compressed during the settlement process of the pile. Therefore, the failure mode of the pile is considered to be the formation of a cylindrical surface within the rock layer, with the cylinder’s diameter approximately equal to the outer diameter of the pile. The primary cause for this failure mode is that the strength of the pile roughness is much higher than that of the rock roughness. The rock roughness is the first to be damaged during the loading process and eventually forms an approximate cylindrical shape.

3.2. Load–Displacement Curves

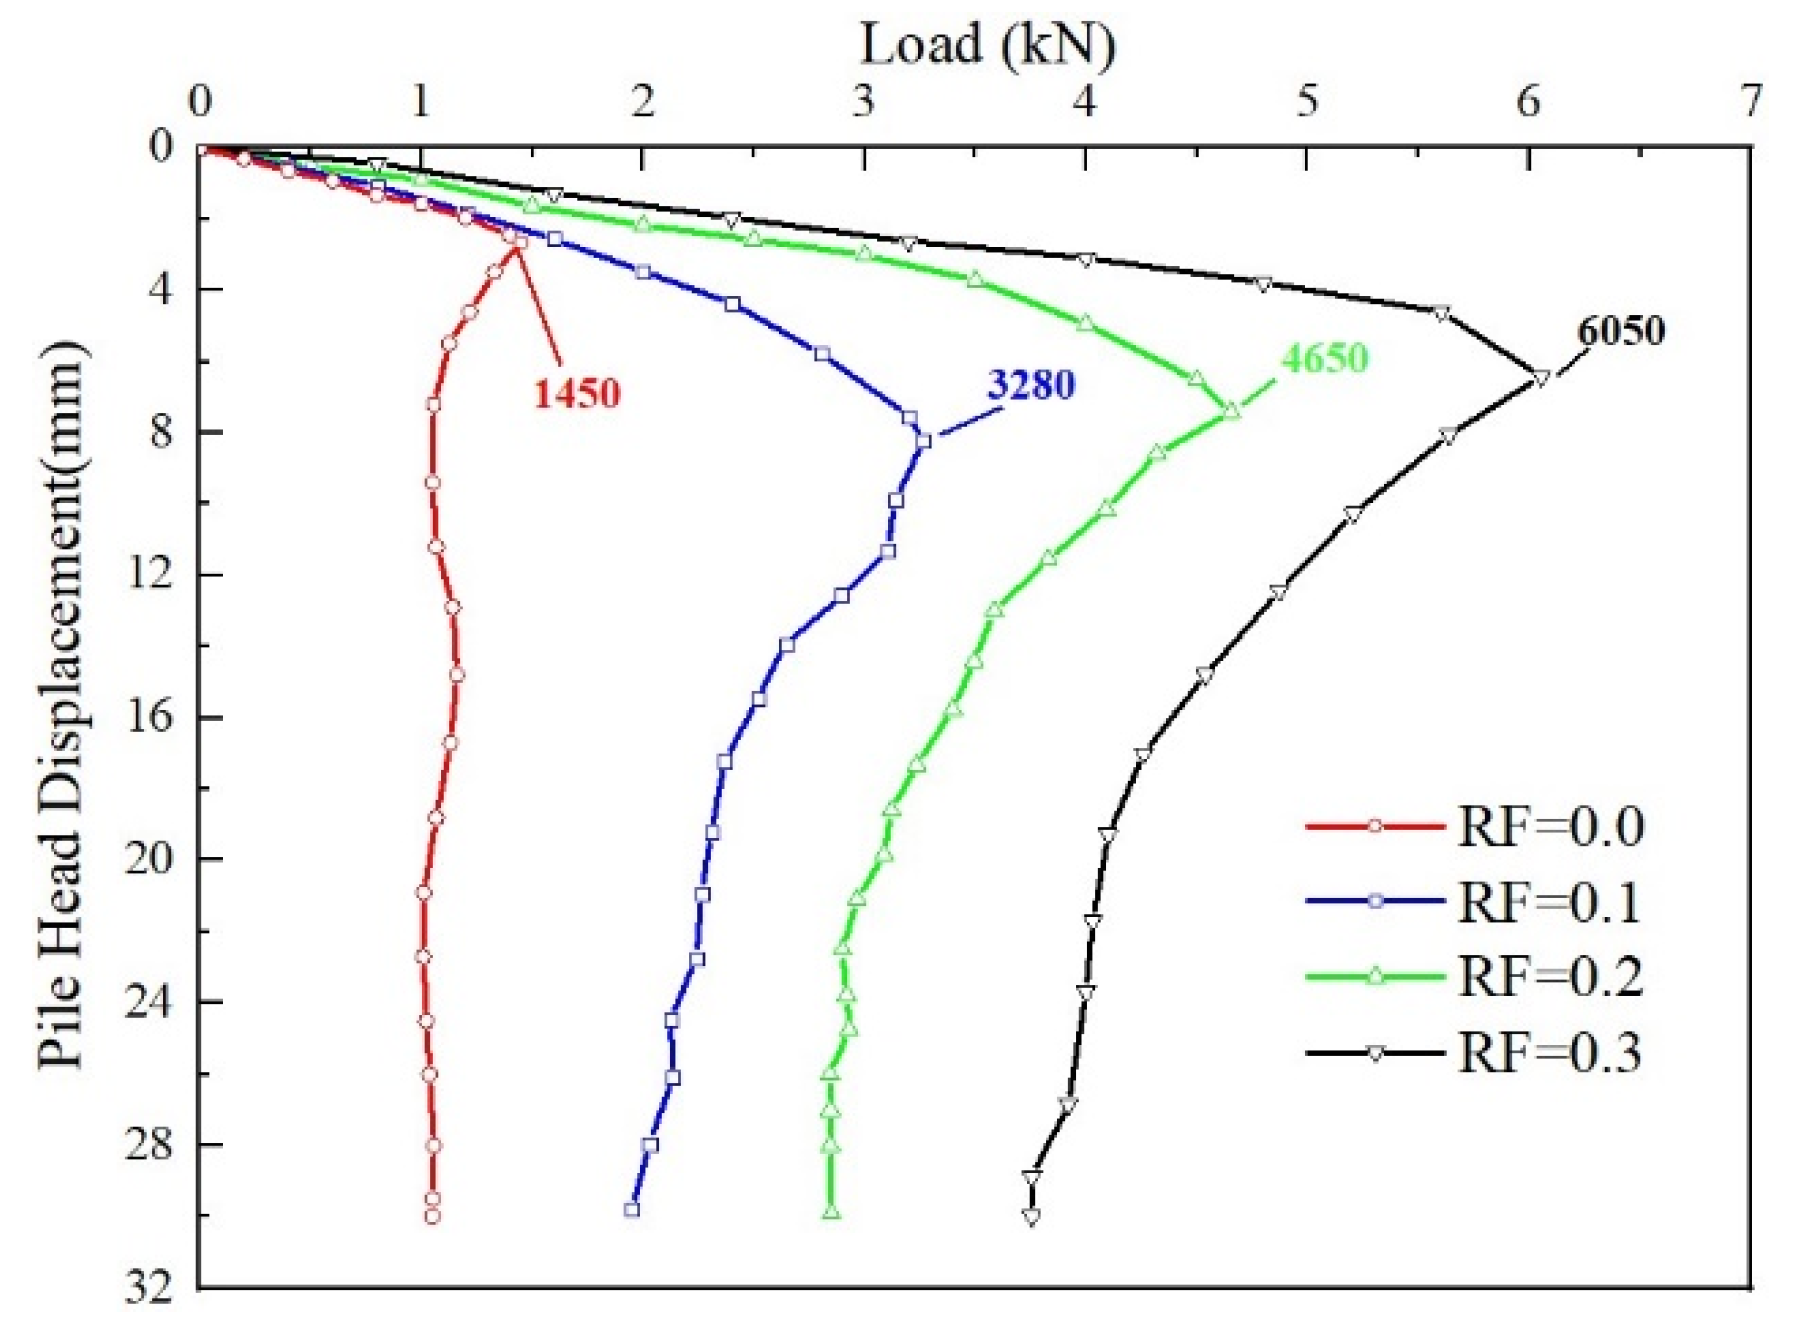
The load–displacement curves of the piles are illustrated in Figure 11, all of them are steeply variable. Initially, with the increase in pile top load, the pile top displacement increased nearly linearly. Upon reaching a certain load, the rate of pile top displacement growth increased continuously until the rock–soil mass failed. At this point, the pile top displacement sharply increased, while the load dropped sharply. As displacement increases further, the load values gradually stabilize. Until the displacement increases to 1.5D, it is far greater than the failure standard 0.05D specified in the pile foundation specification [28]. Therefore, the load corresponding to the displacement of 1.5D is taken as the residual load. The residual loads for the four piles are 1050 N, 1950 N, 2840 N, and 3756 N, respectively. In this experiment, the load value at the steep change point is taken as the ultimate bearing capacity of the piles. The residual load values represent 72.4%, 59.45%, 61.07%, and 62.08% of the respective piles’ ultimate bearing capacities. The residual bearing capacity of the rough piles is about 59% to 62% of the ultimate bearing capacity, with a reduction of 40%, which is higher than that of the smooth piles. The experimental results are shown in Table 3.
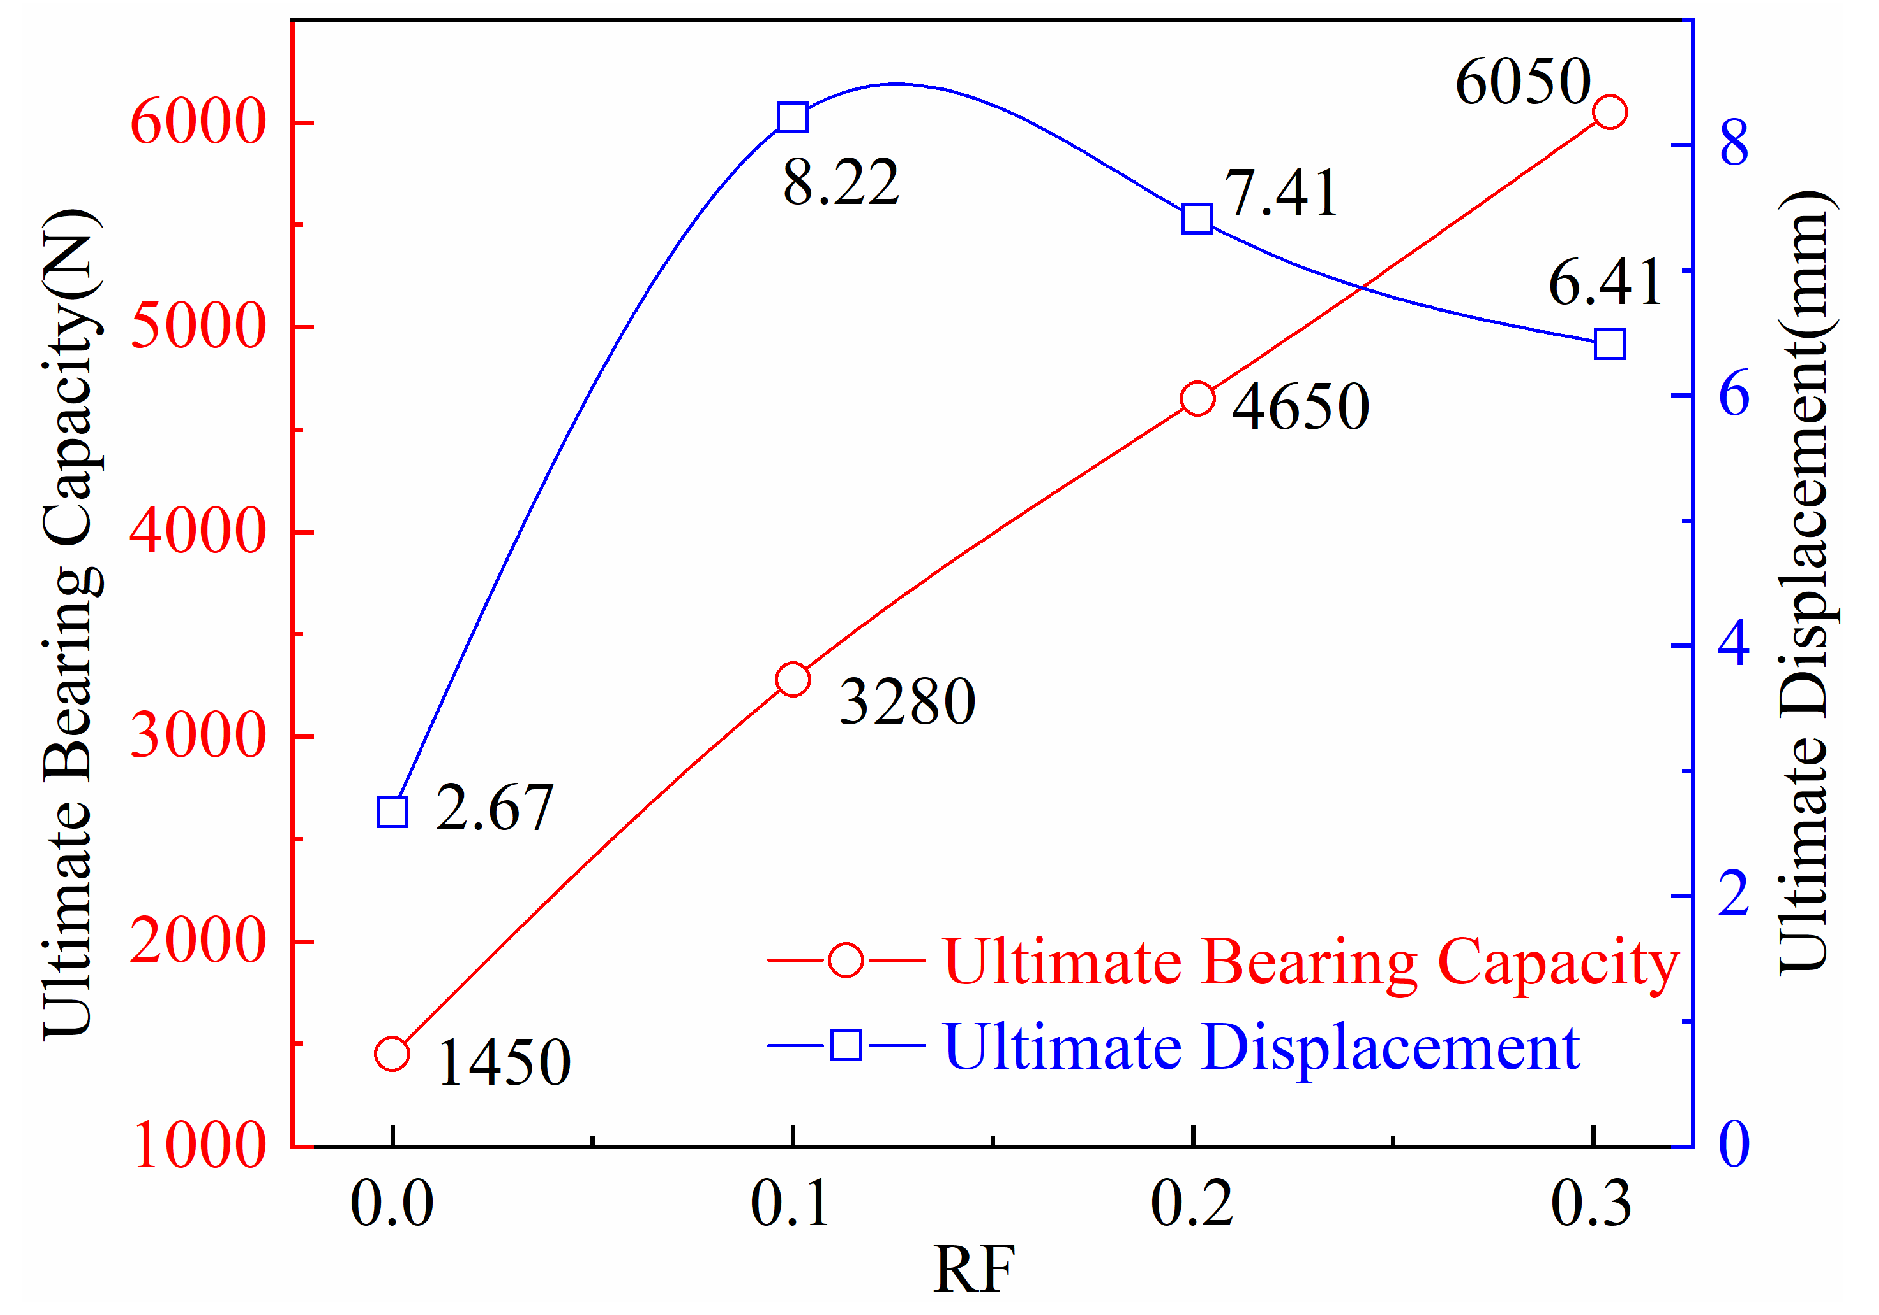
As shown in Figure 12, the ultimate bearing capacities of the four piles are 1450 N, 3280 N, 4650 N, and 6050 N, respectively. As the roughness factor (RF) increases from 0.0 to 0.3 in increments of 0.1, the ultimate bearing capacity exhibits a nearly linear growth trend. The ultimate displacements of the four piles are 1.34D, 4.11D, 3.67D, and 3.23D, respectively. The pile with an RF of 0.1 requires a displacement 3.07 times that of the smooth pile to reach the failure point. When RF increases from 0.0 to 0.1, the ultimate displacement increases sharply; however, as RF further increases from 0.1 to 0.3, the ultimate displacement gradually decreases. This phenomenon may be attributed to the fact that at RF = 0.1, a larger displacement is needed to fully mobilize the shearing dilatancy effect of the rock mass. In contrast, when RF increases further, the rock mass enters the stage of localized fracturing and plastic zone connectivity earlier, leading to the peak strength being reached at a smaller displacement.

3.3. Axial Force and Side Resistance of Piles

According to the strain value of each pile shaft section, the formula for calculating the axial force of the pile is as follows:
N m n = ε m n E c A c m ,
where N mn is the axial force of the m th measured section under the n th level load; ε mn is the strain of the m th measured section under the n th level load; E c is the elastic modulus of the pile; A c m is the m th section area of the pile shaft.
The formula for calculating the average side resistance of the pile according to the pile axial force as follows:
f mn = N mn N ( m 1 ) n A n ,
where f mn is the side resistance of the pile between the m ~ m 1 measured sections under the n th level load; N mn is the axial force of the pile on the m th measured section under the n th level load; N ( m 1 ) n is the axial force of the m 1 measured section under the action of the n th level load; A n is the pile side area between the n ~ n 1 measured sections.
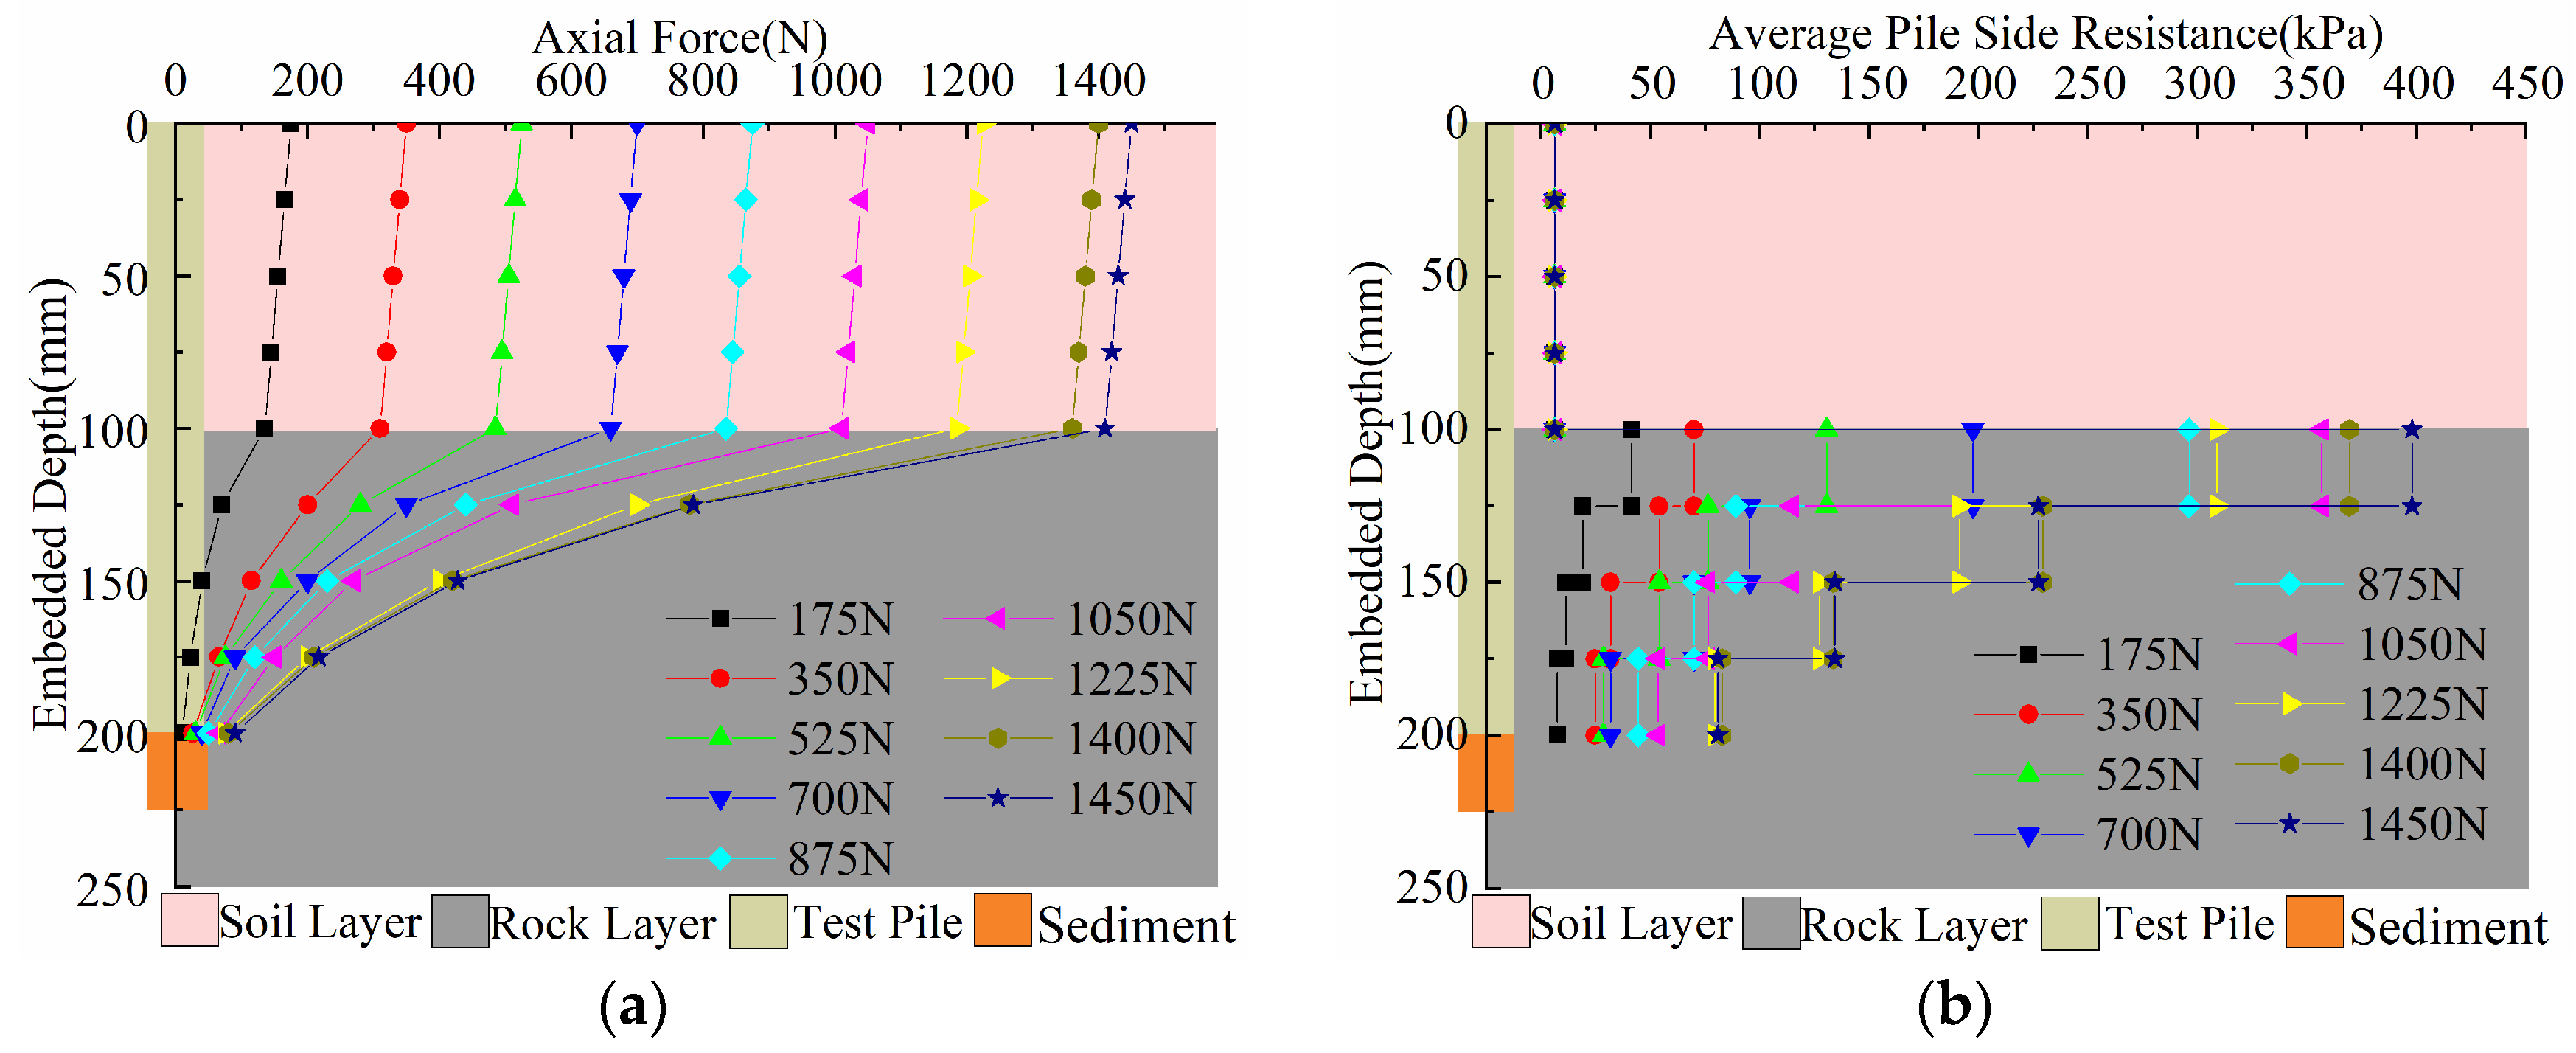
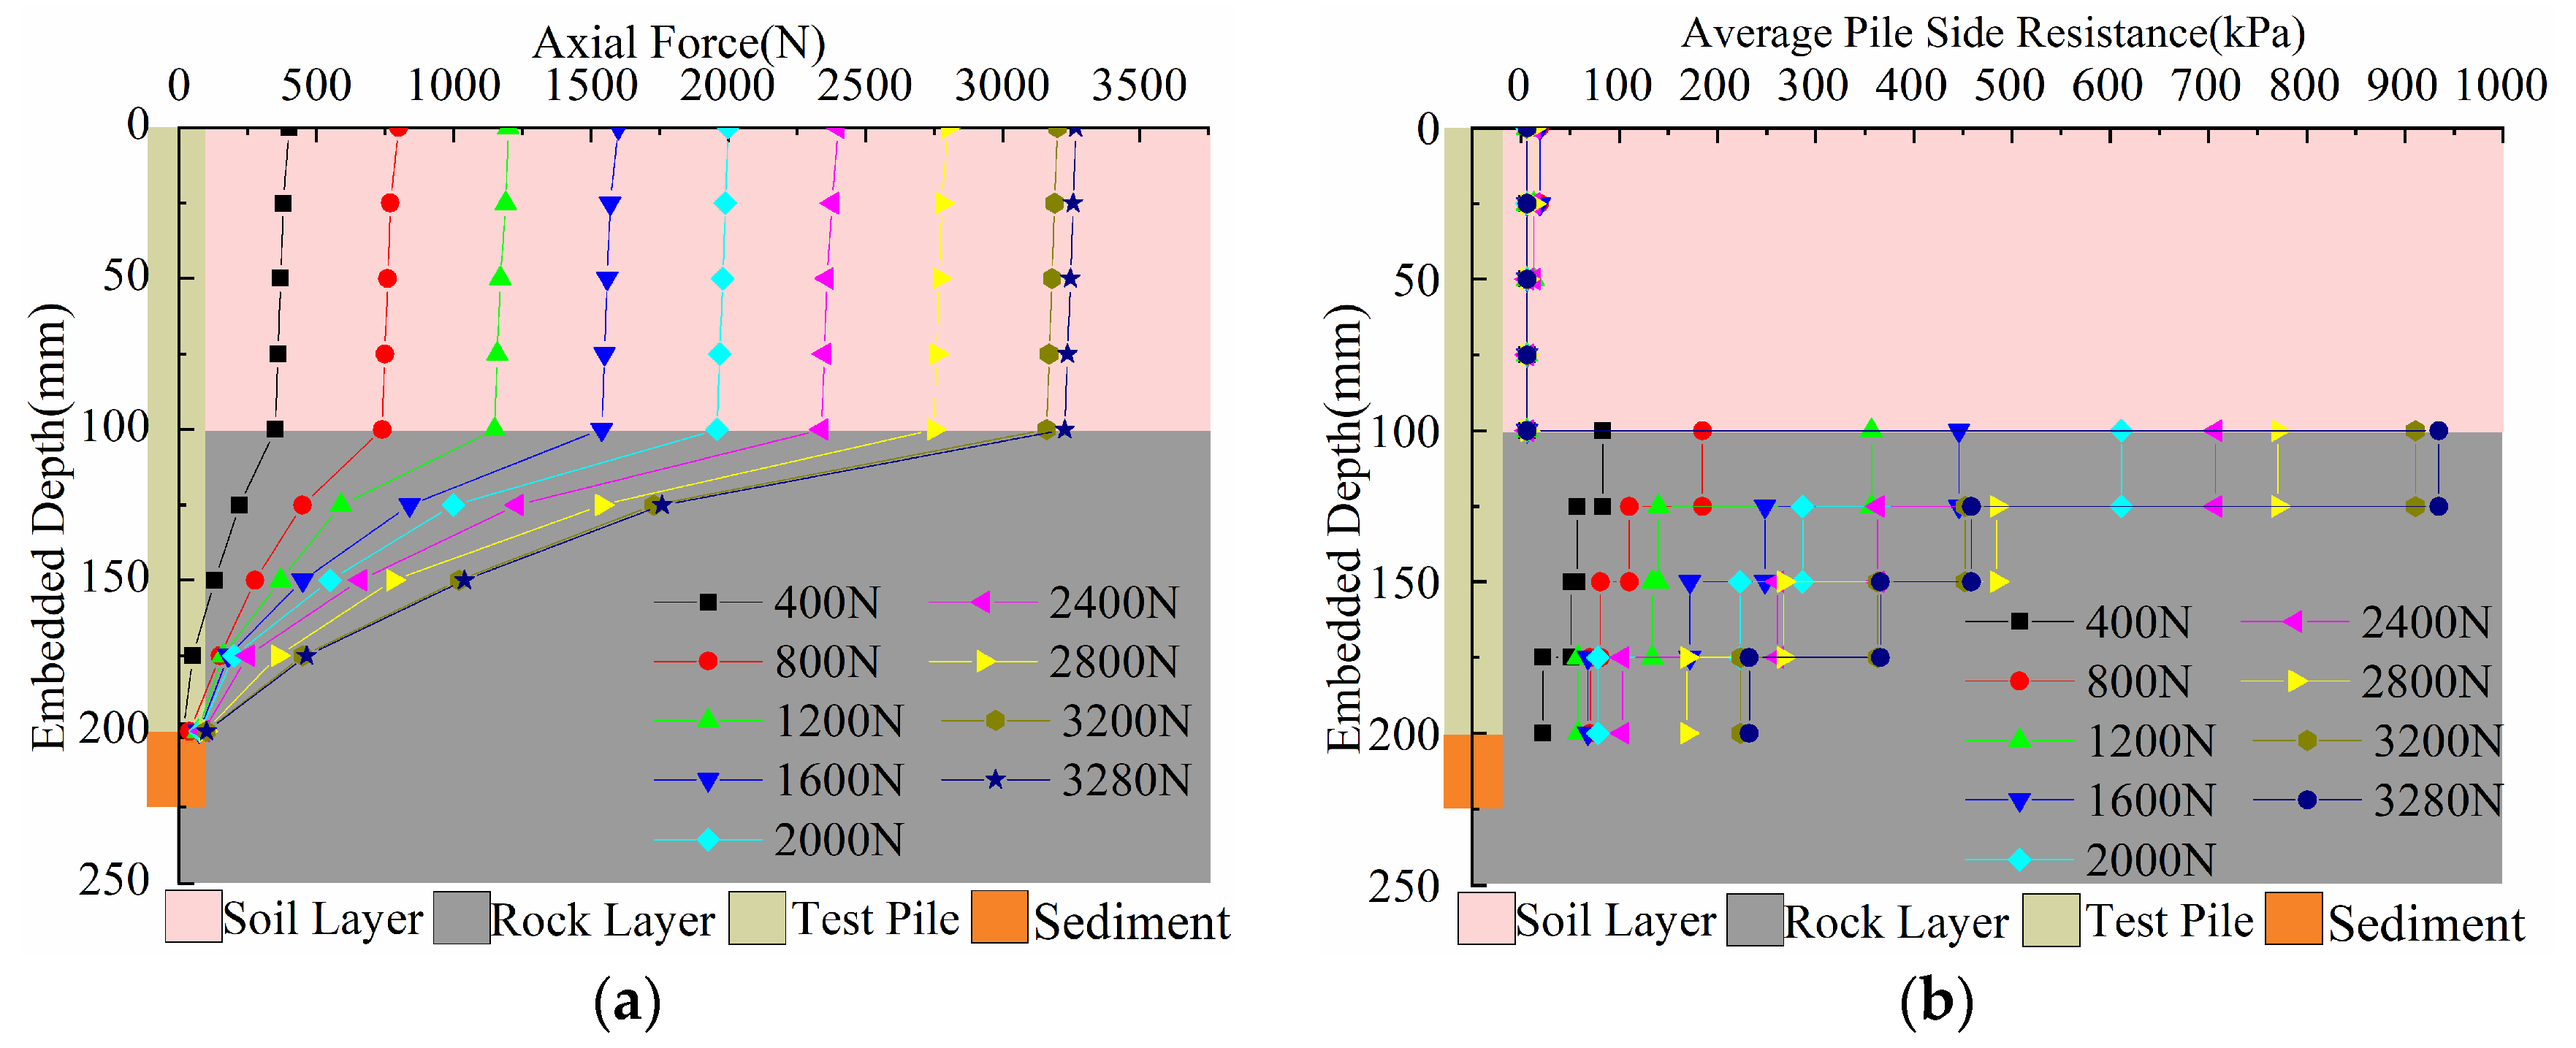
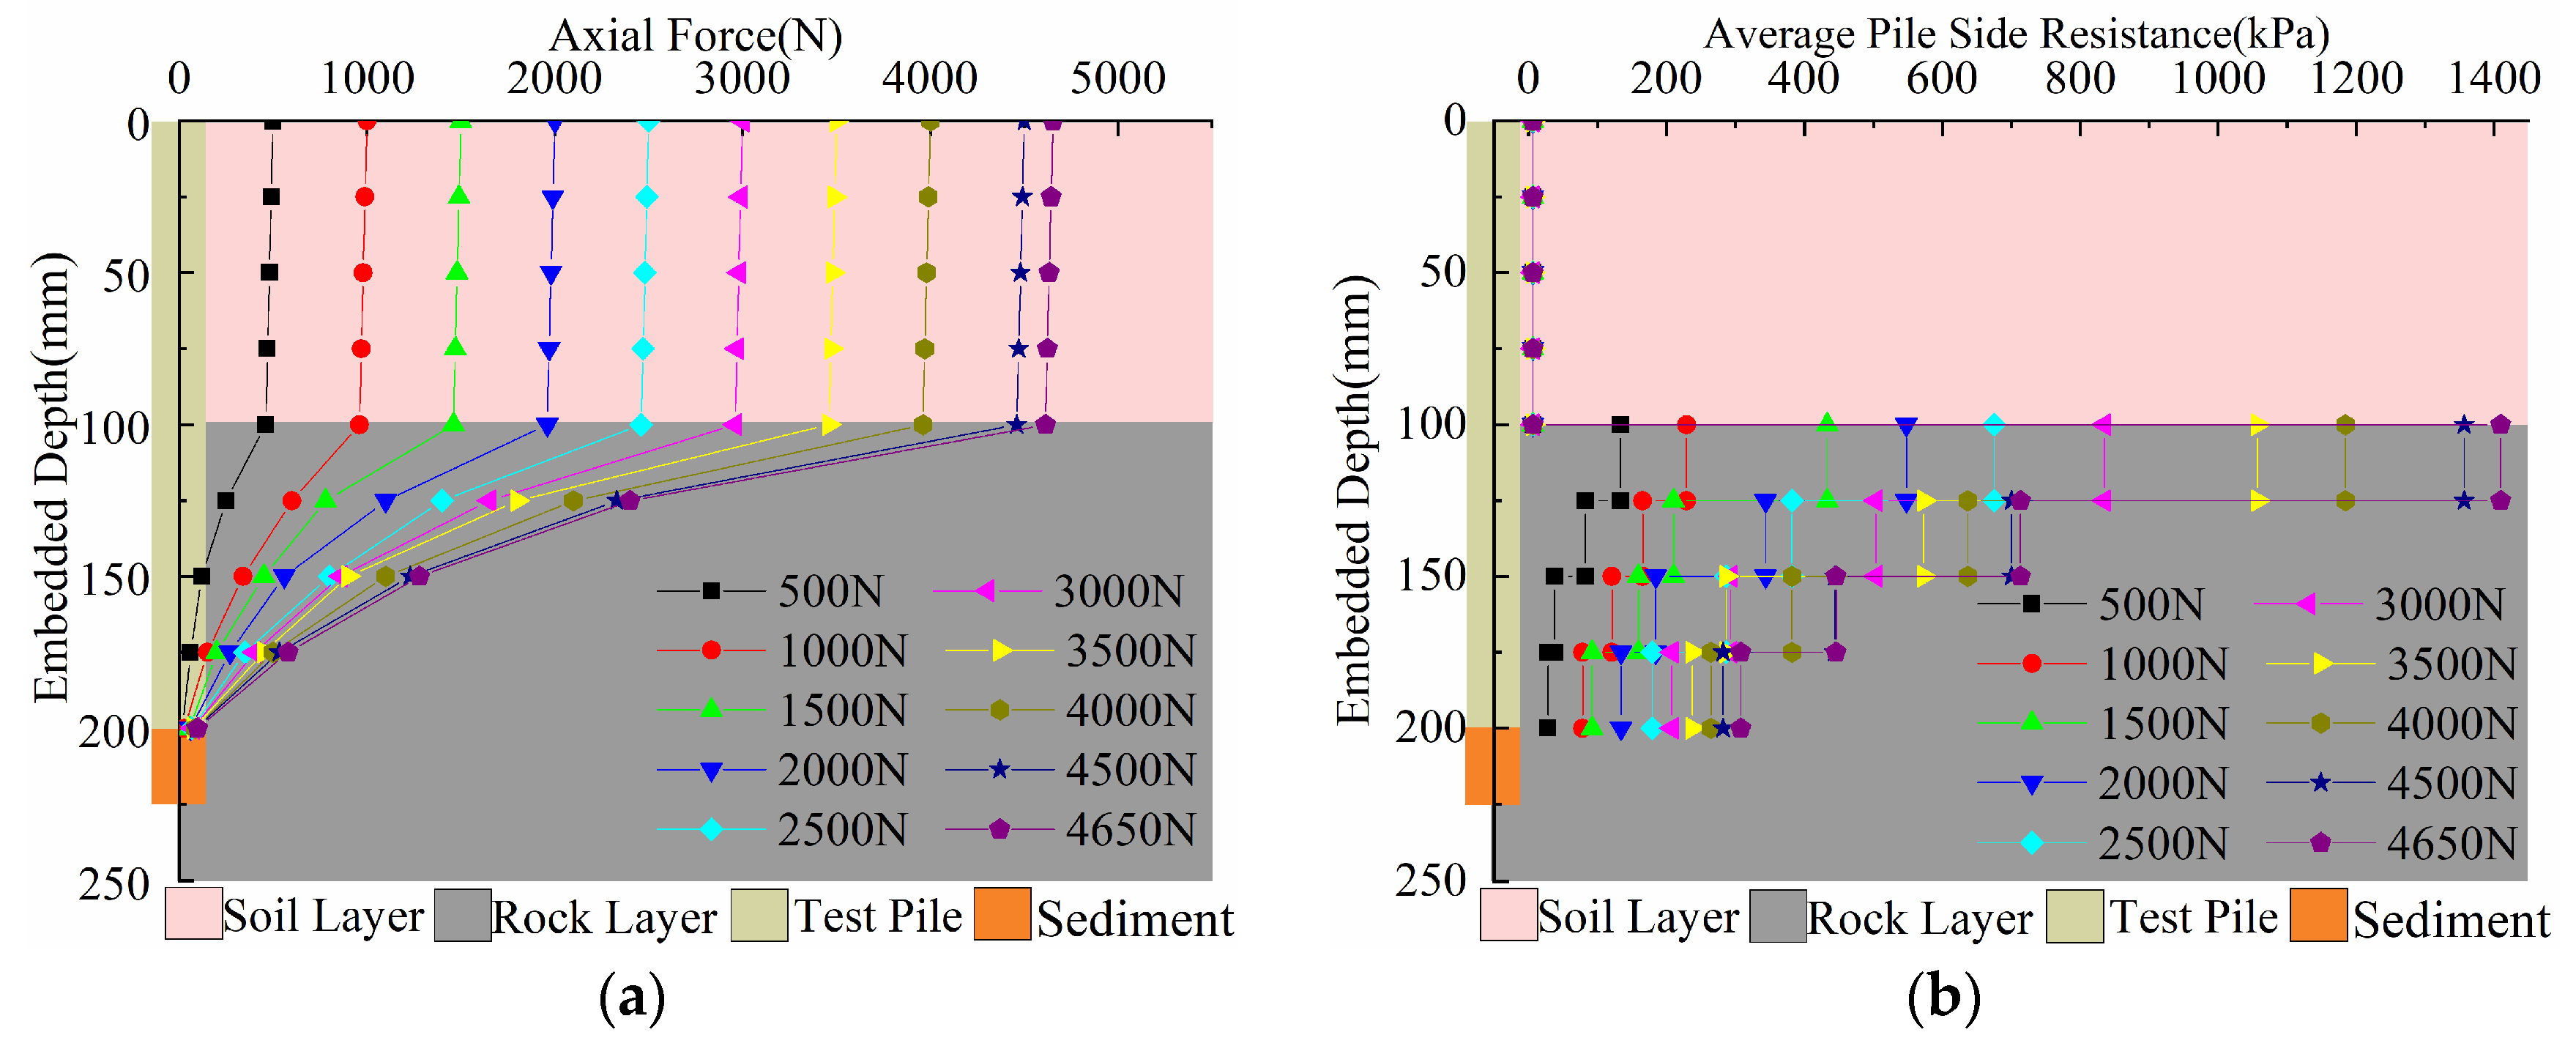
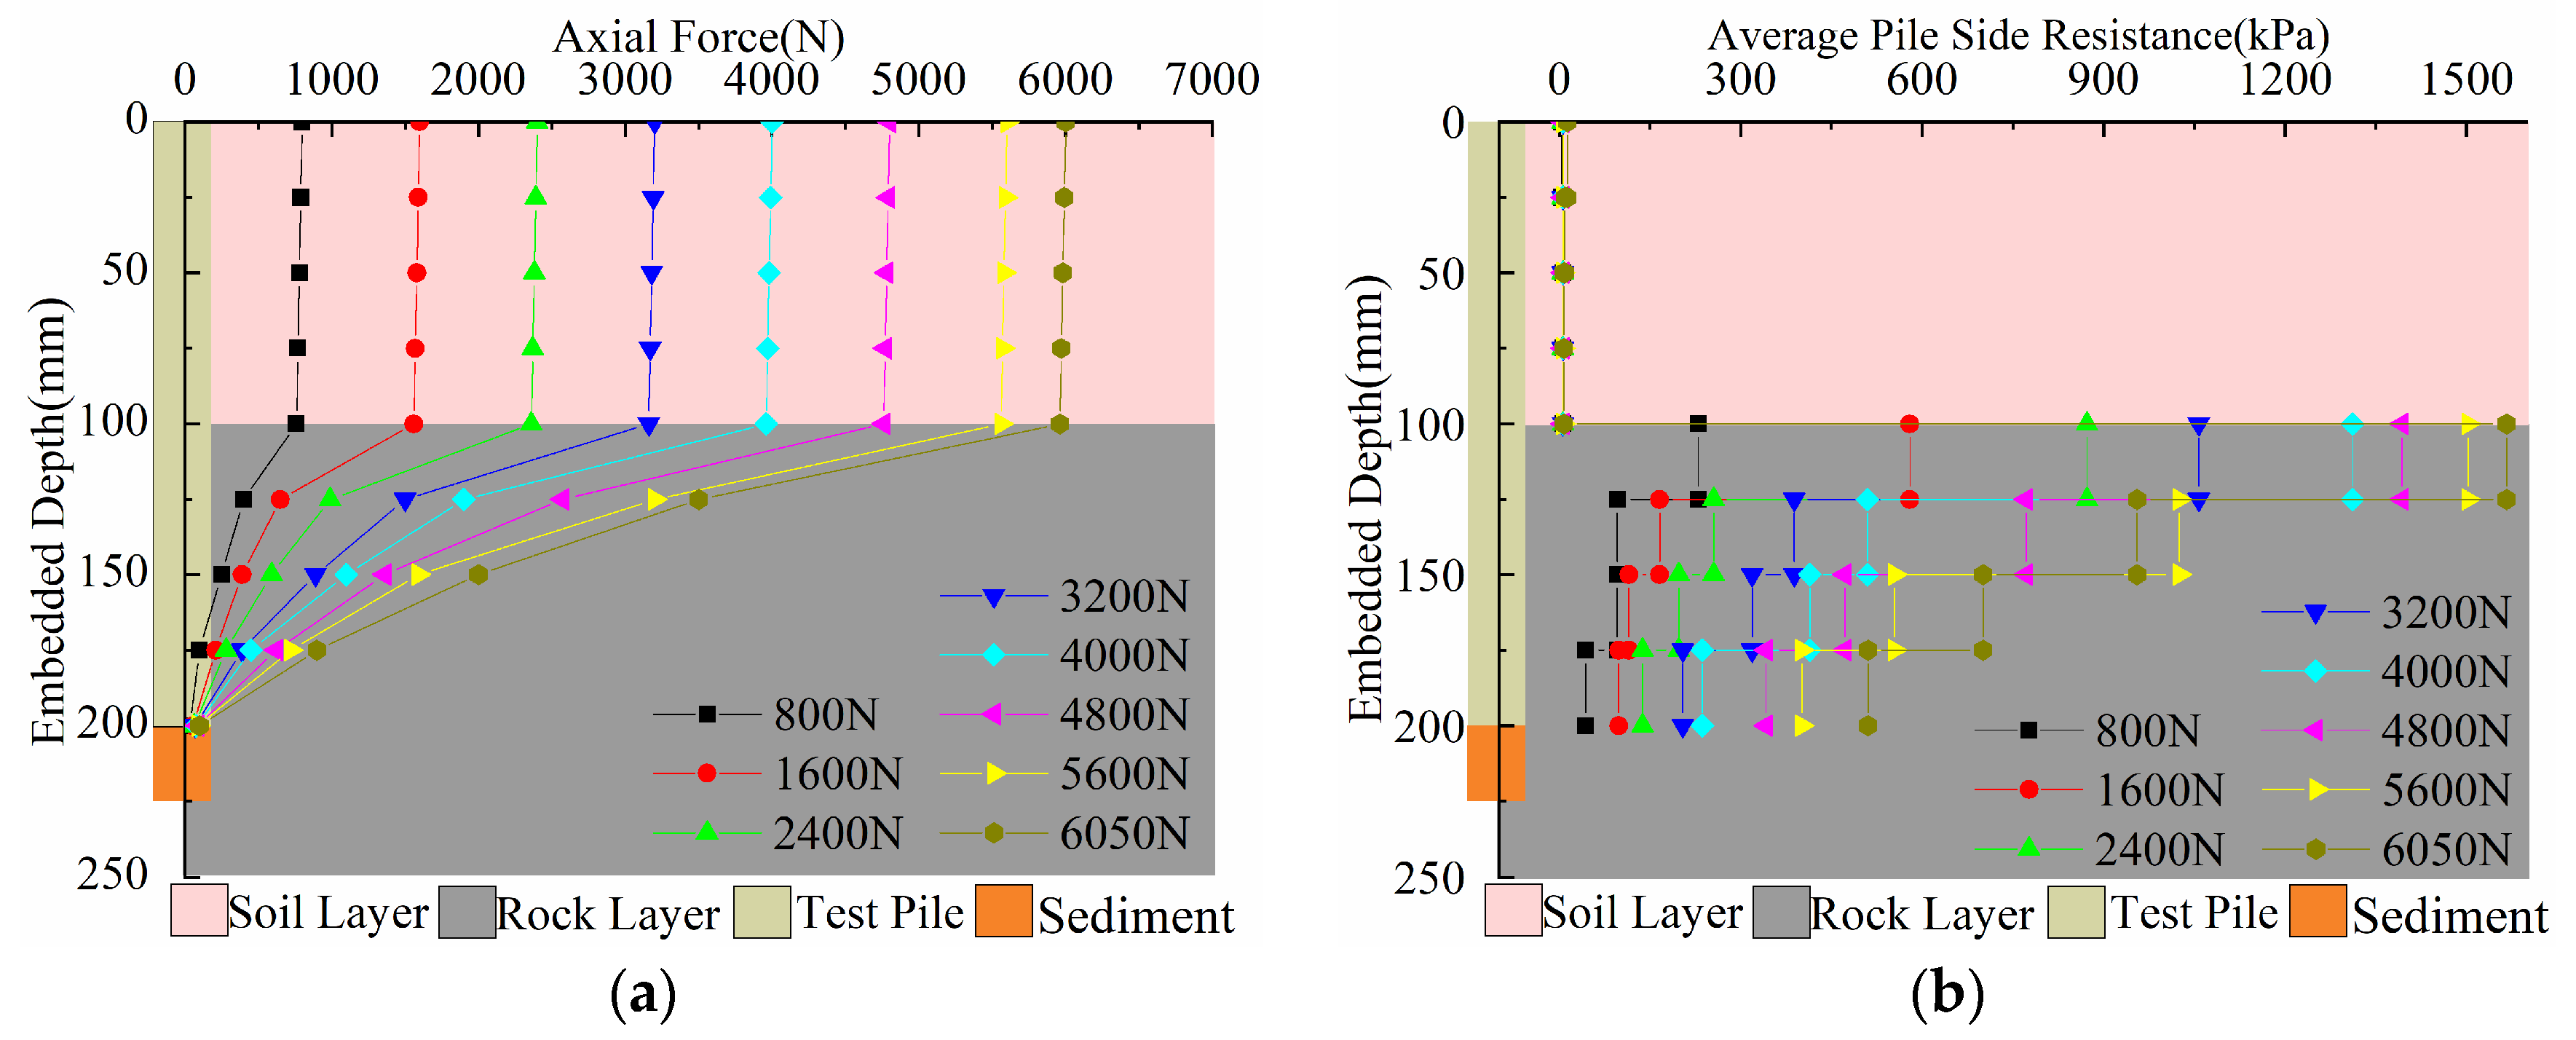
The curves in Figure 13a, Figure 14a, Figure 15a and Figure 16a illustrate the variation in axial force along the depth of the piles under different loads. As can be seen, the axial force decreases gradually with depth, exhibiting a nearly vertical distribution in the soil layer, indicating a minimal rate of axial force attenuation with depth. A precipitous decline in axial force is observed at a depth of 100 mm, which coincides with the soil–rock interface. In the rock layer, the axial force continues to decrease with depth, albeit at a slightly lower rate compared to the initial segment within the rock.
The axial force of the pile shaft attenuates slowly in the soil layer and rapidly in the rock layer. This phenomenon is attributed to the differences in mechanical properties between soil and rock materials. In the soil layer, the deformation modulus and shear strength of the soil are limited, resulting in a limited lateral resistance provided by the soil. When the load borne by the pile cross-section at any depth is transferred downward, only a portion can be transferred to the surrounding soil, while the remaining load continues to be transmitted to deeper areas, which manifests as a roughly linear and slow decrease in axial force along the depth. In the rock layer, the axial force of the pile shaft attenuates rapidly. The fundamental reason is that the rock mass has significantly higher deformation modulus and shear strength. When the pile shaft displaces, the rock mass can provide greater lateral resistance. Therefore, a large amount of the pile load is transferred to the surrounding rock mass within a relatively shallow depth after entering the rock layer, which is reflected as a sharp drop in the axial force curve.
Figure 13b, Figure 14b, Figure 15b and Figure 16b show the distribution curves of average lateral resistance of test piles under various load levels. It can be seen from the figures that the lateral resistance in the soil layer is much smaller than that in the rock layer. In the soil layer, the lateral resistance of the pile remains relatively stable with the change in depth. After entering the rock layer, the lateral resistance of the pile increases sharply, but it gradually decreases with the increase in the buried depth of the test pile. For test piles with different roughness factors, the characteristics of lateral resistance development are basically the same, with the peak value appearing within 25 mm below the soil-rock interface.
The fundamental reason why the lateral resistance in the soil layer is much smaller than that in the rock layer and has a stable distribution lies in the differences in mechanical properties between soil and rock materials. The shear strength of the soil is low. When the foundation pile displaces, the lateral resistance in the soil layer is fully developed, showing a relatively stable curve. However, the rock mass has high shear strength and can provide large lateral resistance, so the lateral resistance of the pile in the rock layer increases sharply first. The reason why the lateral resistance in the rock layer first increases and then decreases is that the lateral resistance of the pile in the rock mass is developed gradually. After reaching the peak value, the upper rock mass has borne and transferred most of the pile top load, so the axial force that can continue to be transmitted to the deeper rock layer decreases significantly. The relative displacement between the deep foundation pile and the rock mass is reduced, and the lateral resistance in the deep part is less developed. Therefore, the lateral resistance of the pile in the rock layer shows a trend of first increasing and then decreasing.
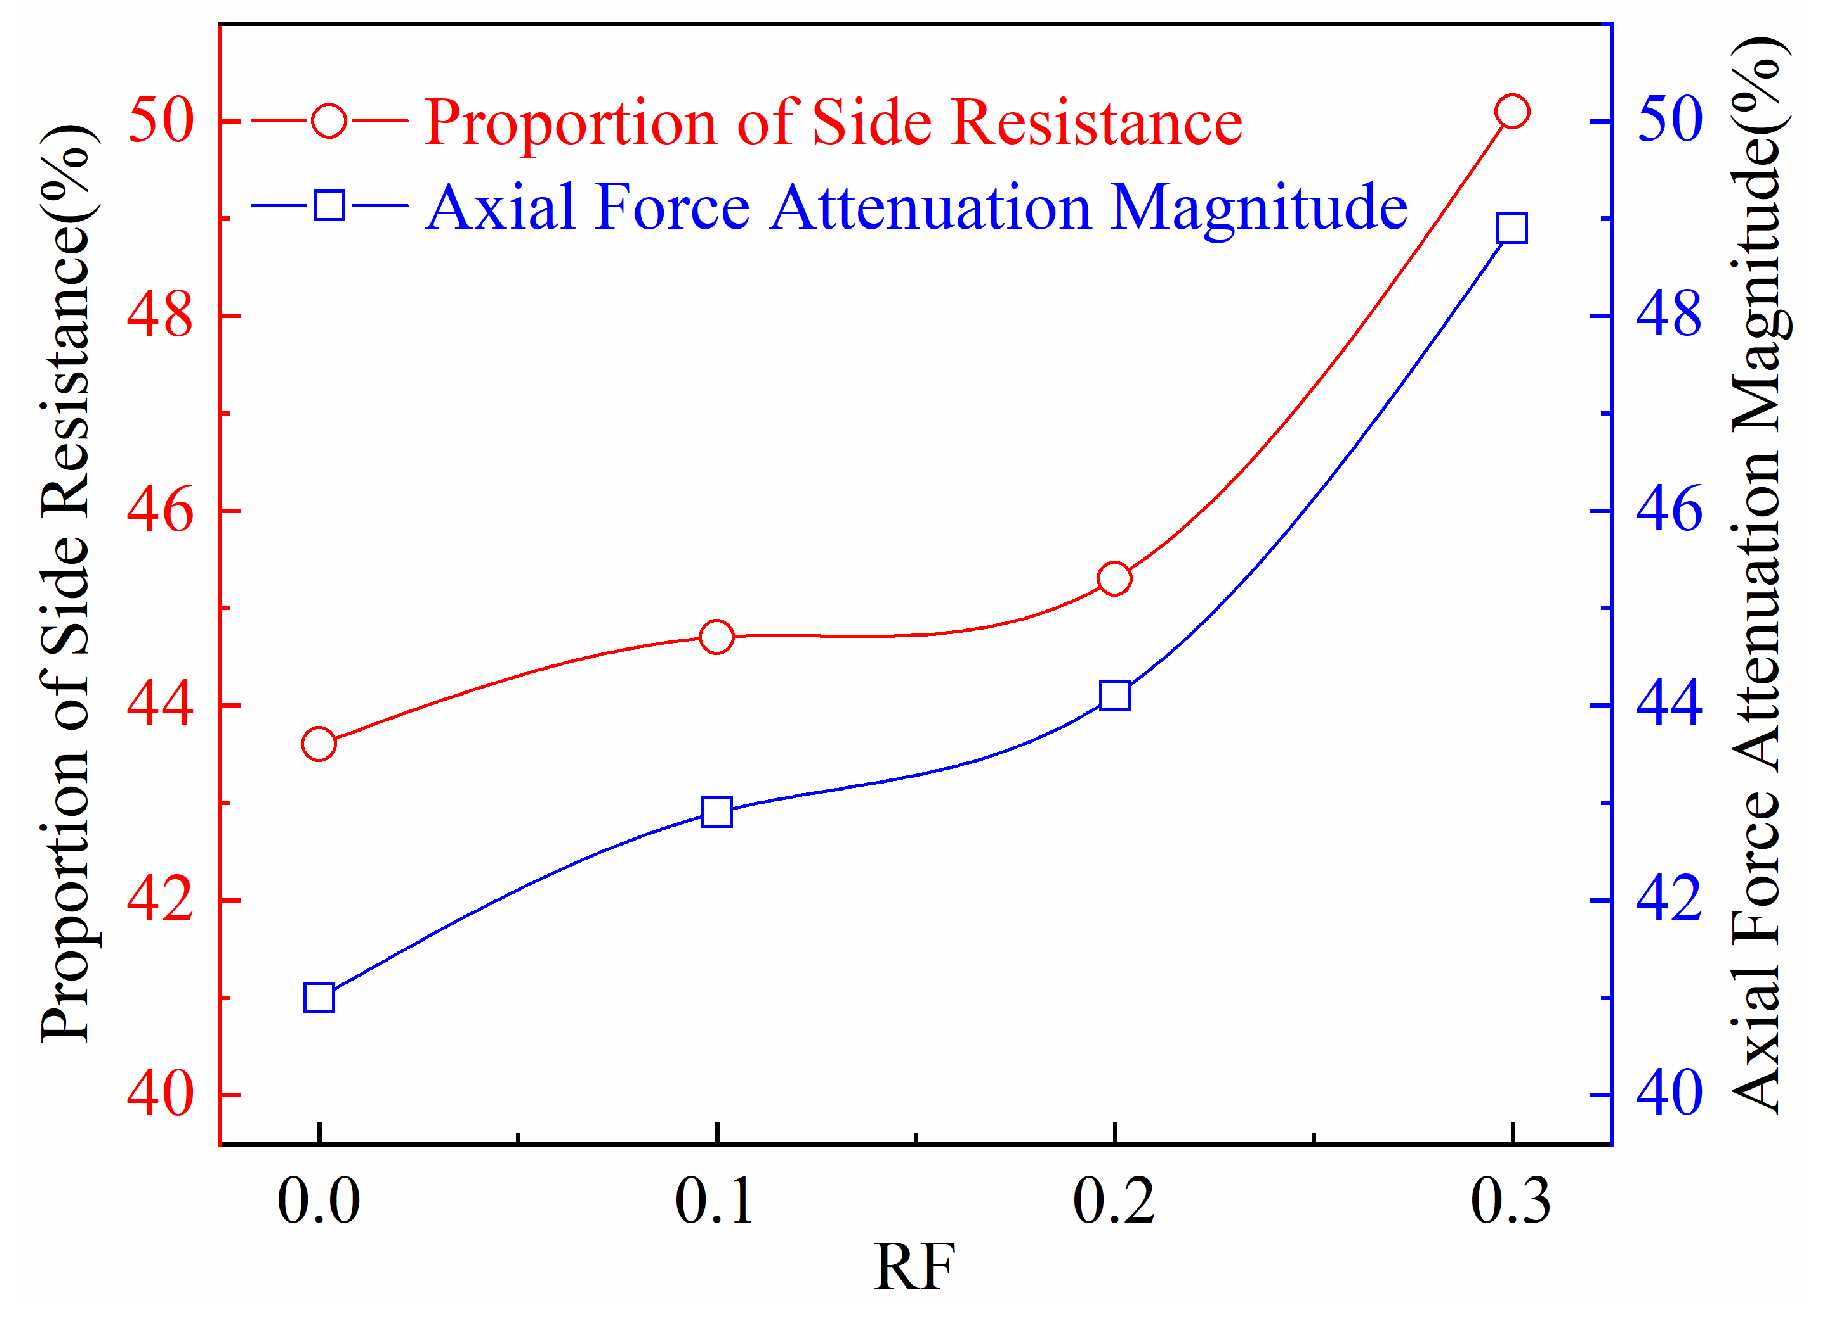
As illustrated in the above figures, the axial force attenuation and the proportion of side resistance are maximal within 25 mm below the soil–rock interface. The attenuation magnitude of axial force and the proportion of side resistance under the action of ultimate load were statistically analyzed, the results are shown in Table 4 and Figure 17. For rock-socketed pure friction piles with an unsupported tip, the entire load is transferred through side resistance. In the overlying soil segment, significant pile settlement occurs, but the soil itself also undergoes compression, resulting in a progressive development of relative pile–soil displacement along the shaft. When the pile penetrates into the hard rock layer, the low compressibility of the rock leads to a sharp stiffness transition. This abrupt change in stiffness prevents the smooth downward transfer of load along the pile, as typically observed in soil. Instead, the load is preferentially transferred laterally to the surrounding rock mass. This creates a stress concentration zone, with the maximum shear deformation occurring within 25 mm below the soil–rock interface. In this region, the upper section of the pile tends to displace downward under load, while the lower section remains largely stationary due to the restraint provided by the deeper rock. This “moving upper part and fixed lower part” mechanism induces intense shear deformation in the pile segment, mobilizing the peak unit side resistance. Beyond this depth, the relative displacement between the pile and rock decreases rapidly, followed by a corresponding attenuation of side resistance.
From Table 4 and Figure 17, with the roughness coefficient progressively increasing from 0.0 to 0.3, both the pile shaft axial force attenuation magnitude and the side resistance contribution ratio within the 25 mm depth below the soil–rock interface exhibit gradual minor increments. The side resistance within this depth range sustains 41.0% to 48.9% of the upper load applied to the test piles. The significant axial force attenuation observed at 25 mm below the soil–rock interface primarily arises from: during the loading process, the side resistance at 25 mm below the soil–rock interface becomes mobilized first, consequently demonstrating elevated side resistance values. With increasing socketed depth of the test pile, the mobilization of side resistance progresses relatively slowly and fails to reach full development potential.

4. Calculation of Ultimate Bearing Capacity

The objective of this experiment is to investigate the bearing characteristics of rock-socketed friction piles, and the role of pile end resistance is weakened in the design of the experiment. The ratios of pile tip resistance to the total load were calculated from the pile shaft axial force curves of each test pile in Figure 13, Figure 14, Figure 15 and Figure 16. The results show that P1 is 6.2%, while P2~P4 are all 0%. Therefore, in calculating the ultimate bearing capacity of rock-socketed friction piles, the contribution of pile end resistance is excluded from the equation. Consequently, the ultimate bearing capacity of the piles comprises the ultimate side resistance in the soil layer and the rock-socketed segment.
Q = Q s + Q r ,
where Q is the ultimate bearing capacity; Q s is the ultimate side resistance in the soil layer; Q r is the ultimate side resistance in the rock-socketed segment.
In the current specifications, the calculation of side resistance in the soil layer is determined by Equation (20):
Q s = u i n l i q s i ,
where u is the perimeter of the base pile section; l i is the thickness of each soil layer; q s i is the standard value of the ultimate soil frictional resistance.
The calculation of ultimate side resistance in the rock-socketed segment is determined by Equation (21):
Q r = q r A u ,
where q r is the side friction resistance of the rock-socketed segment; A u is the side surface area of the rock-socketed segment.
This study employs both the Horvath method and the Zhao method to calculate Q r Horvath defines the RF and proposes a method to calculate side resistance:
q r = 0.8 q u ( R F ) 0.45 ,
where q u is the unconfined compressive strength of the rock.
Zhao [29] based on the Hoek-Brown strength criterion, proposes a method for calculating the side resistance of the rock-socketed segment:
q r = q u m 0 8 exp R M R 100 a × ( K 0 γ r l r q u m 0 8 exp R M R 100 a + 8 m 0 2 exp R M R 100 c ) 0.75 ,
where m 0 is the m value of complete rock block; a and c are coefficients related to the disturbance of the rock mass. (For disturbed rock mass, a = 14, b = 6, for undisturbed rock mass, a = 28, b = 9, c = ab/(a − 2b)); RMR is the evaluation index of rock mass quality; γ r is the rock unit weight; l r is the depth of the rock-socketed segment; K 0 is the coefficient of static earth pressure.
The rock parameters of the test are scaled according to the undisturbed rock parameters, and the value of q u is obtained through unconfined compressive strength tests on test rock block. The standard value q s i of the ultimate soil frictional resistance is specified in Table 6.3.5-1 of “Code for Design of Highway Subgrade and Foundation” (JTG D63-2007) [30]. The rock mass rating RMR and γ are related to the rock mass quality, and their values are determined based on Appendix 2 and Appendix 4 of “Large diameter rock-socketed pile bearing mechanism and design theory and engineering application” [31]. The specific parameters are listed in Table 5, and the results are calculated by substituting the parameters into Equations (19)–(23), as shown in Table 6.
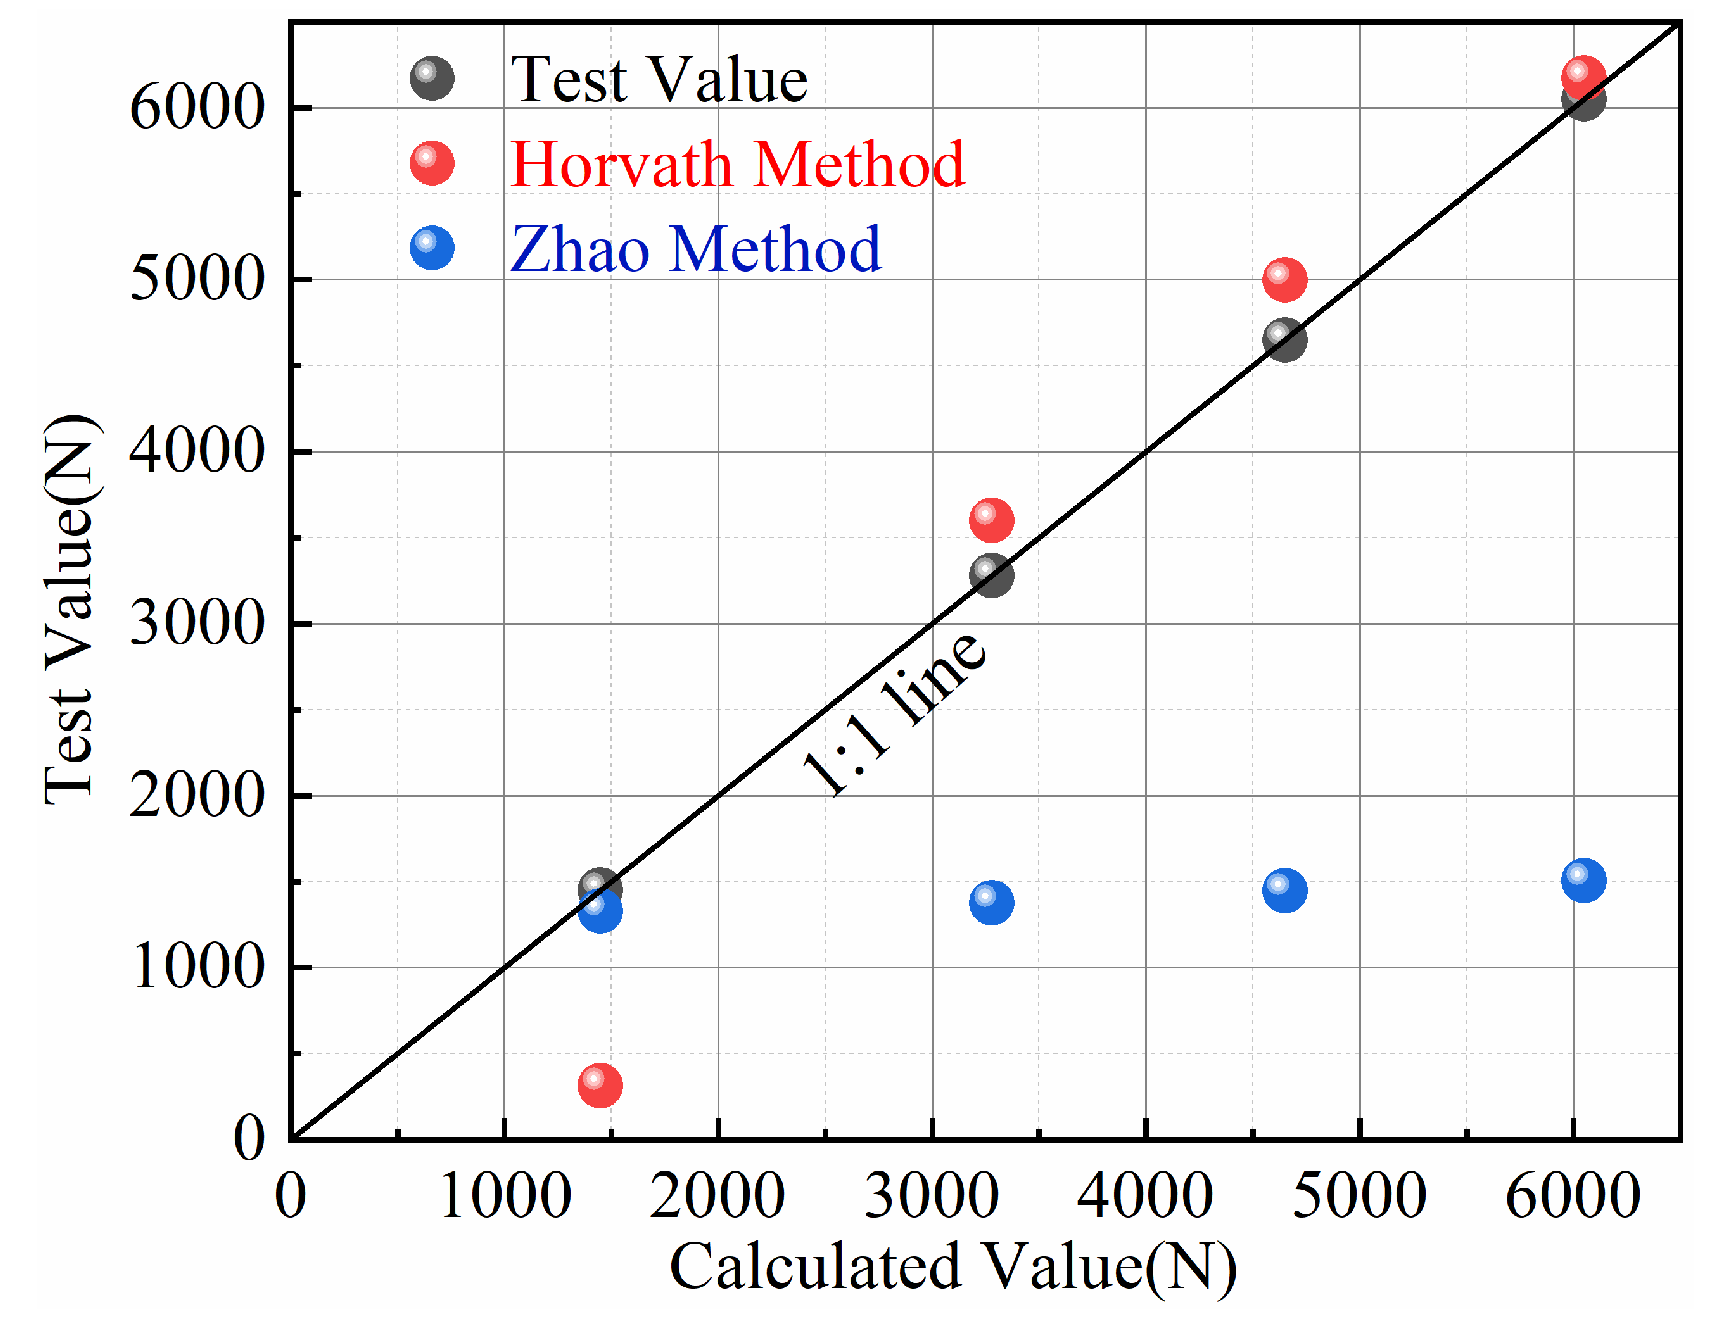
As depicted in Figure 18, the calculated results of the ultimate bearing capacity of the piles are compared with the experimental values. It is evident from the graph that the results obtained using the Horvath method closely match the experimental values overall, with differences generally below 10%, except for P1, where a significant discrepancy exists. This discrepancy arises because the roughness factor of P1 is 0, resulting in a calculated value of rock-socketed segment side resistance of 0, significantly underestimating the result. In contrast to the Horvath method, the Zhao method yields relatively large discrepancies compared to the experimental values overall. However, the results for P1 are relatively close, with differences also below 10%. The reason for the large discrepancies in the calculated results of P2, P3, and P4 using the Zhao method is that the Zhao method primarily calculates the side resistance based on factors such as rock mass quality and weathering degree, without considering the influence of pile roughness, leading to underestimated results. Thus, the Zhao method is suitable for P1-type piles, where the roughness of the pile is ignored, and the side resistance is calculated based on factors such as rock mass quality. Conversely, the Horvath method is suitable for P2, P3, and P4-type piles, where the roughness of the pile needs to be considered. In engineering practice, the Zhao method is applicable to the calculation of bearing capacity of foundation piles with smooth pile hole wall, and the Horvath method is applicable to the calculation of bearing capacity of foundation piles with certain roughness of pile hole wall.

5. Discussion

This study investigates the influence of roughness on the bearing behavior of friction piles; however, certain limitations remain. In this study, cement mortar is used to simulate rock mass, which is an idealized simplification of complex natural rock mass. Using cement mortar to simulate rock mass can effectively reveal the basic action mechanism of pile shaft roughness in homogeneous media; however, the conclusions are mainly applicable to working conditions with underdeveloped joints or good rock mass integrity. For heterogeneous and anisotropic rock masses controlled by structural planes (such as joints, fractures, and weak interlayers), the actual failure path may be dominated by structural planes rather than roughness, and the development of shaft resistance may be lower than the results of this model. The bearing characteristics of friction piles revealed in this study can be used as an upper limit reference for evaluating the contribution of roughness in practical engineering, but comprehensive reduction and correction should be performed in combination with factors such as rock mass quality and structural plane characteristics.
In this study, the pile shaft roughness morphology is designed as rectangular protrusions. Such rectangular protrusions may exhibit distinct local stress concentration characteristics, shear dilation behaviors, and progressive failure mechanisms under loading. Therefore, the conclusions of this study are more suitable for understanding the macroscopic influence of roughness (RF). For rock masses controlled by complex structural planes, the shaft resistance in practical engineering may be lower than the test values obtained in this study. The use of model piles with a high elastic modulus has minimized the impact of pile shaft deformation on the test results as much as possible. However, under the same load, model piles with a high elastic modulus undergo smaller axial compression, resulting in a more uniform distribution of pile-rock relative displacement along the pile shaft. Particularly in the upper rock-socketed section, the shaft resistance may be mobilized earlier and more fully, which may lead to higher measured shaft resistance in the model tests. In practical engineering predictions, it is recommended to appropriately correct the shaft resistance mobilization coefficient based on the pile shaft material and modulus.
This study explores the influence of pile shaft roughness on the bearing characteristics of pile foundations under the premise that pile tip resistance is not mobilized. The conclusions of this study are mainly applicable to working conditions where the pile tip is characterized by well-connected cavities with dimensions relatively larger than the pile diameter, or the pile base is overlain by thick sediment.
The findings of this study also offer practical insights for engineering design. Analysis of the test results indicates that the residual bearing capacity of a rough pile is approximately 60% of its ultimate value. This suggests that even after a pile experiences a certain degree of “failure” (reaching ultimate capacity), it does not abruptly lose all load-bearing capability but rather enters a residual strength phase, retaining 60% of its peak capacity. This implies the existence of a hidden, deeper safety margin for engineering structures under unexpected overload conditions. This discovery highlights that the actual safety reserve of a pile foundation may be greater than that predicted by conventional calculations. In design, it is essential to fully recognize and utilize this residual strength as a final line of defense against extreme conditions, thereby enhancing the overall resilience and safety of the structure.
Traditional pile foundation design often assumes that deeper rock-socketing leads to greater safety, resulting in unnecessary material and cost inefficiencies. The test results from this study demonstrate that the maximum side resistance occurs within 25 mm below the soil–rock interface. This depth can serve as a reference for optimizing pile design, focusing on the “effective embedded depth.” In practice, the target rock-socketed depth could be set between 1.0~1.5D, with emphasis placed on ensuring high construction quality within this critical zone.

6. Conclusions

This study adopts Horvath’s definition of roughness to conduct model load tests, investigating the bearing characteristics of rock-socketed friction piles under four different roughness conditions (RF = 0.0, 0.1, 0.2, 0.3). Additionally, the methods proposed by Horvath and Zhao are used to calculate the ultimate bearing capacity of the test piles, so as to explore the applicability of these two methods. It is found that with the increase in RF, the ultimate bearing capacity of the piles shows an approximately linear growth; the ultimate shaft resistance is distributed within a depth range of 25 mm below the soil–rock interface; the Horvath method is suitable for calculating the ultimate bearing capacity of rock-socketed piles with rough surfaces, while the Zhao method is applicable for those with relatively smooth surfaces. The specific research conclusions are as follows:
(1) The failure mode of rock-socketed friction piles is the formation of a penetrating cylinder in the rock layer, with the cylinder diameter directly approximating the pile diameter. The load–displacement curves of the test piles are steeply variable. Following pile failure, the residual bearing capacity of piles with rough bodies is approximately 60% of the ultimate bearing capacity, while piles with smooth bodies retain around 72.4% of the ultimate bearing capacity. The ultimate side resistance values of the piles are located within the 25 mm depth range below the soil–rock interface, where the side resistance accounts for 41.0% to 48.9% of the upper load.
(2) As RF gradually increases from 0.0 to 0.3, the ultimate bearing capacity of the piles demonstrates a nearly linear increase. However, the ultimate displacement increases markedly initially and then decreases gradually. The attenuation rate of pile axial force and the proportion of side resistance below the soil–rock interface within the 25 mm depth range gradually increase slightly.
(3) In this study, The Horvath method and the Zhao method are employed for the calculation of the ultimate bearing capacity of the test piles. It was found that the Horvath method is suitable for calculating the ultimate bearing capacity of rock-socketed piles with rough-textured surfaces (P2, P3, and P4), while the Zhao method, considering factors such as rock layer quality and weathering degree, is suitable for calculating the ultimate bearing capacity of rock-socketed piles with relatively smooth surfaces (P1). The ultimate bearing capacity of P2, P3, and P4 is calculated using the Horvath method, while that of P1 is calculated using the Zhao method. The calculated values were close to the test results, and the errors were less than 10%.
Based on the research findings and limitations of this paper, it is deemed necessary to conduct model tests considering irregular and natural rough morphologies to investigate the bearing characteristics of pile foundations under various rough morphologies. Additionally, long-term loading tests or cyclic loading tests should be carried out to study the bearing capacity degradation mechanism and interface damage evolution law of rough pile–rock interfaces under loads such as long-term loading and cyclic loading.

Author Contributions

Conceptualization, H.Y.; methodology, B.Y.; software, Y.Z.; validation, H.Y.; formal analysis, Y.Z.; investigation, Y.Z.; resources, X.F. and B.Y.; data curation, Y.Y. and Y.Z.; writing—original draft preparation, H.Y. and B.Y.; writing—review and editing, X.F. and Y.Y.; visualization, H.Y.; supervision, X.F.; project administration, B.Y.; funding acquisition, B.Y. All authors have read and agreed to the published version of the manuscript.

Funding

This research was funded by the Guangxi Natural Science Foundation (grant number 2024GXNSFBA010011), Guangxi Key Research and Development Program (Guike AB25069410), Research Basic Ability Improvement Project of Young and Middle-aged Teachers in Guangxi of China (grant number 2024KY0212).

Institutional Review Board Statement

Not applicable.

Informed Consent Statement

Not applicable.

Data Availability Statement

Data are contained within the paper.

Conflicts of Interest

The authors declare no conflicts of interest.

References

  1. Yan, N.; Zhao, X.M.; Bai, X.Y.; Jiang, C.; Wei, Y.F.; Zhang, J.; Zhang, M.Y.; Zhao, G.; Liu, Z.M. Research progress on vertical bearing performance test of rock-socketed piles. Sci. Technol. Eng. 2023, 23, 10625–10637. [Google Scholar]
  2. Wang, T.H.; Zhang, L.; Hao, Y.Z.; Jin, X. Side Friction of Rock-Socketed Piles Involving Thick Sediment. Adv. Civ. Eng. 2020, 2020, 8882698. [Google Scholar] [CrossRef] [Scilit]
  3. Liu, X.; Bai, X.; Zhang, M.; Wang, Y.; Sang, S.; Yan, N. Load-bearing characteristics of large-diameter rock-socketed piles based on ultimate load tests. Adv. Mater. Sci. Eng. 2020, 2020, 6075607. [Google Scholar] [CrossRef] [Scilit]
  4. Alnuaim, A.M.; Hamid, W.M.; Alshenawy, A.O. Numerical study of skin friction behavior of piles in limestone rock. Soil Mech. Found. Eng. 2020, 57, 265–269. [Google Scholar] [CrossRef] [Scilit]
  5. Abi, E.; Shen, L.; Liu, M.; Du, H.; Shu, D.; Han, Y. Calculation Model of Vertical Bearing Capacity of Rock-Embedded Piles Based on the Softening of Pile Side Friction Resistance. J. Mar. Sci. Eng. 2023, 11, 939. [Google Scholar] [CrossRef] [Scilit]
  6. Fu, Y.J.; Zhang, Y.F.; Li, G.F.; Xie, S.L.; Shi, J. Experimental study on vertical bearing properties of toothed pile in sandy soil. Yangtze River 2020, 51, 184–190. [Google Scholar] [CrossRef]
  7. Horvath, R.G.; Kenney, T.C.; Kozicki, P. Methods of improving the performance of drilled piers in weak rock: Reply. Can. Geotech. J. 2011, 20, 758–772. [Google Scholar] [CrossRef] [Scilit]
  8. Williams, A.F.; Pells, P.J.N. Side resistance rock sockets in sandstone, mudstone, and shale. Can. Geotech. J. 1981, 18, 502–513. [Google Scholar] [CrossRef] [Scilit]
  9. Pells, P.J.; Rowe, R.K.; Turner, R.M. An experimental investigation into side shear for socketed piles in sandstone. In Proceedings of the International Conference on Structural Foundations on Rock, Sydney, Australia, 7–9 May 1980. [Google Scholar]
  10. Hou, J.; Zhao, H.; Peng, W.; Zhao, M. A limit solution for predicting side resistance on rock-socketed piles. J. Eng. Mech. 2022, 148, 04021131. [Google Scholar] [CrossRef] [Scilit]
  11. Jiang, C.; Liang, D.; Li, P. Load transfer analysis of vertically loaded bored piles in sea reclamation areas considering the effect of the pile-gravel interface roughness. Ocean Eng. 2023, 271, 113742. [Google Scholar] [CrossRef] [Scilit]
  12. Gutiérrez-Ch, J.G.; Melentijevic, S.; Senent, S.; Jimenez, R. Distinct-element method simulations of rock-socketed piles: Estimation of side shear resistance considering socket roughness. J. Geotech. Geoenviron. Eng. 2020, 146, 04020133. [Google Scholar] [CrossRef] [Scilit]
  13. Xu, J.; Haque, A.; Gong, W.; Gamage, R.P.; Dai, G.; Zhang, Q.; Xu, F. Experimental study on the bearing mechanisms of rock-socketed piles in soft rock based on micro X-ray CT analysis. Rock Mech. Rock Eng. 2020, 53, 3395–3416. [Google Scholar] [CrossRef] [Scilit]
  14. Yang, K.X.; Zhao, H.; Zhao, M.H.; Jia, W.R.; Hua, X.G. Analytical solution of vertical load transfer for grouted piles considering volume shear shrinkage at pile-rock interface. Chin. J. Geotech. Eng. 2025, 47, 1229–1238. [Google Scholar] [CrossRef]
  15. Zhang, Q.Q.; Ma, B.; Liu, S.W.; Feng, R.F. Behaviour analysis on the vertically loaded bored pile socketed into weak rocks using slip-line theory arc failure surface. Comput. Geotech. 2020, 128, 103852. [Google Scholar] [CrossRef] [Scilit]
  16. Zhou, J.Q.; Zhou, C.B.; Feng, Q.G.; Gao, T. Analytical model for load-transfer mechanism of rock-socketed drilled piles: Considering bond strength of the concrete–rock interface. Int. J. GeoMech. 2020, 20, 04020059. [Google Scholar] [CrossRef] [Scilit]
  17. Tolun, M.; Emirler, B.; Ertugrul, O.L.; Yildiz, A. Effect of dilatancy on tension response of completely rough piles embedded in granular soils. Ocean Eng. 2024, 292, 116507. [Google Scholar] [CrossRef] [Scilit]
  18. Ma, D.; Zhang, M.; Shi, Y.; Zhu, W. Analysis of load-settlement curve based on load transfer at pile-soil interface. Appl. Sci. 2022, 12, 7150. [Google Scholar] [CrossRef] [Scilit]
  19. Li, G.; Zhang, J.L.; Liu, J.; Li, H. Study on the uplift bearing capacity of rock-socketed piles. Soil Mech. Found. Eng. 2021, 58, 203–208. [Google Scholar] [CrossRef] [Scilit]
  20. Li, X.Y.; Bai, X.Y.; Zhang, M.Y. Study on bearing capacity characteristics of rock socketed short pile in weathered rock site. J. Eng. Res. 2019, 7, 76–89. [Google Scholar] [CrossRef] [Scilit]
  21. Xing, X.B.; Li, X.Y.; Li, W.; Lu, T.; Duan, X.; Jin, Q. Numerical analysis of the bearing capacity of end-suspended piles and rock-socketed piles in a soil-rock composite foundation pit. Adv. Civ. Eng. 2022, 2022, 1199548. [Google Scholar] [CrossRef] [Scilit]
  22. Huang, B.; Zhang, Y.T.; Lv, B.; Yang, Z.; Fu, X.; Zhang, B. Vertical bearing characteristics of rock-socketed pile in a synthetic soft rock. Eur. J. Environ. Civ. Eng. 2021, 25, 132–151. [Google Scholar] [CrossRef] [Scilit]
  23. Xing, H.F.; Zhang, Z.; Meng, M.H.; Luo, Y.; Ye, G. Centrifuge tests on bearing characteristics of superlarge-diameter rock-socketed piles. J. Bridge Eng. 2014, 19, 04014010. [Google Scholar] [CrossRef] [Scilit]
  24. Zhang, H.; Tannant, D.; Xing, H.F.; Zhu, L.; Guo, X. Centrifuge model tests on the bearing behavior of large-diameter rock-socketed pile group in valley area. Bull. Eng. Geol. Environ. 2025, 6, 331. [Google Scholar] [CrossRef] [Scilit]
  25. Chen, Y.F.; Ai, Z.Y.; Ma, Z.G.; Ye, Z.K. Vertical performance of rock-socketed pile group in layered saturated rock-soil mass. Comput. Geotech. 2023, 157, 105322. [Google Scholar] [CrossRef] [Scilit]
  26. Ovesen, N.K. The use of physical models in design: The scalinglaw relationship. In Proceedings of the 7th European Conference on Soil Mechanics and Foundation Engineering, Brighton, UK, 10–13 September 1979; Volume 4, pp. 318–323. [Google Scholar]
  27. Audibert, J.M.; Dover, A.R. Discussion of “Pile Load Tests: Cyclic Loads and Varying Load Rates”. J. Geotech. Eng. Div. 1982, 108, 501–505. [Google Scholar] [CrossRef] [Scilit]
  28. JGJ106-2014; China Academy of Construction Science. Technical Code for Testing of Building Foundation Piles. China Architecture & Building Press: Beijing, China, 2014.
  29. Zhao, M.H.; Lei, Y.; Ma, H.B. Determination of ultimate bearing capacity of rock-socketed piles based on Hoek-Brown strength criterion. J. Hydraul. Eng. 2011, 42, 1058–1064+1074. [Google Scholar]
  30. JTGD63-2007; China Academy of Construction Science. Code for Design of Highway Subgrade and Foundation. China Architecture & Building Press: Beijing, China, 2007.
  31. Gong, W.M.; Dai, G.L.; Song, H. Large Diameter Rock-Socketed Pile Bearing Mechanism and Design Theory and Engineering Application; China Communications Press: Beijing, China, 2010. [Google Scholar]
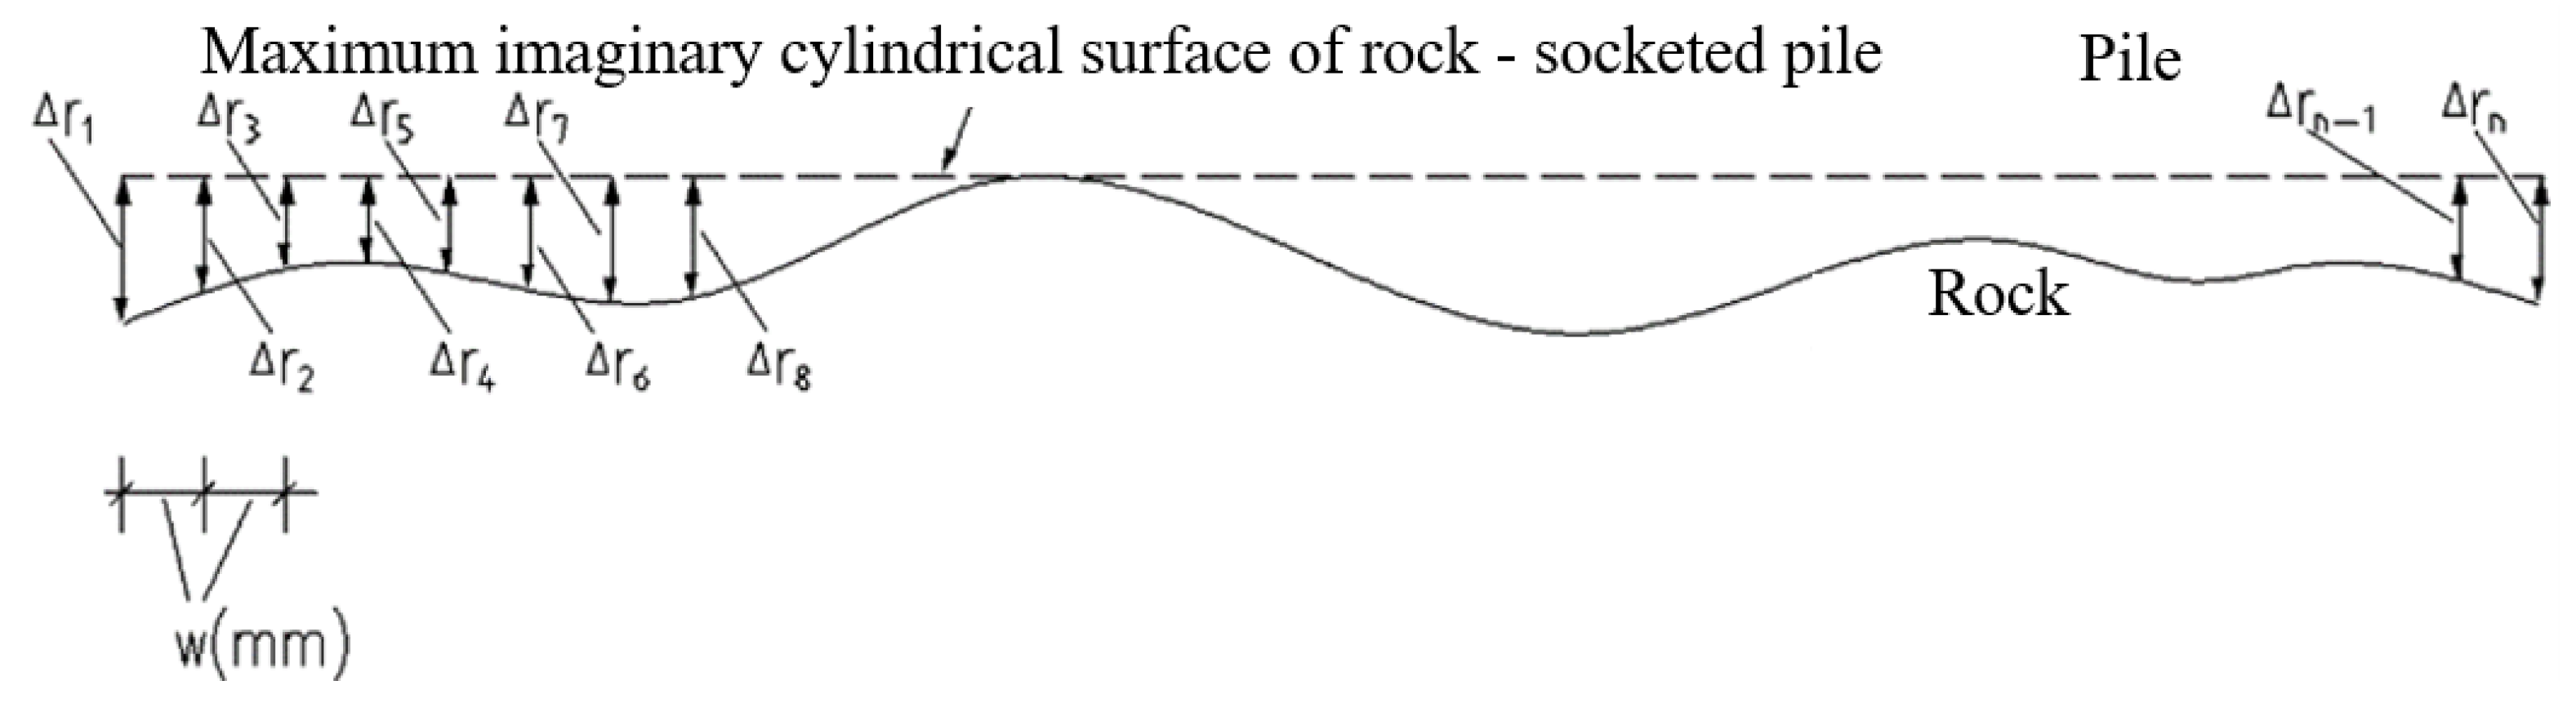
Figure 1. Pile-rock interface roughness model proposed by Horvath.
Buildings 15 04509 g001
Figure 2. Schematic diagram of the test pile (mm).
Buildings 15 04509 g002
Figure 3. Schematic diagram of test scheme (mm).
Buildings 15 04509 g003
Figure 4. Pile molds and piles. (a) Pile molds; (b) Piles.
Buildings 15 04509 g004
Figure 5. Test model.
Buildings 15 04509 g005
Figure 6. Schematic diagram of model test.
Buildings 15 04509 g006
Figure 7. Physical diagram of model test.
Buildings 15 04509 g007
Figure 8. Strain gauge arrangement of pile.
Buildings 15 04509 g008
Figure 9. Pile tip settlement (mm).
Buildings 15 04509 g009
Figure 10. Failure mode of the side rock mass.
Buildings 15 04509 g010
Figure 11. Load–displacement curve.
Buildings 15 04509 g011
Figure 12. Relationship curve between ultimate bearing capacity and RF.
Buildings 15 04509 g012
Figure 13. Axial Force and side resistance of P1. (a) Axial force of P1; (b) Side resistance of P1.
Buildings 15 04509 g013
Figure 14. Axial force and side resistance of P2. (a) Axial force of P2; (b) Side resistance of P2.
Buildings 15 04509 g014
Figure 15. Axial force and side resistance of P3. (a) Axial force of P3; (b) Side resistance of P3.
Buildings 15 04509 g015
Figure 16. Axial force and side resistance of P4. (a) Axial force of P4; (b) Side resistance of P4.
Buildings 15 04509 g016
Figure 17. Percentage curve of pile axial force and pile side resistance.
Buildings 15 04509 g017
Figure 18. Comparison between calculated and experimental results.
Buildings 15 04509 g018
Table 1. On-site bedrock and model test rock parameters.
GroupUnit Weight (kN/m3)Unconfined Compression Strength (MPa)Elastic Modulus (GPa)Cohesive Force (kPa)Internal Friction Angle (°)
On site bedrock26.7~27.235.8~66.912~806000~12,00035~50
Model test rock22~22.70.89~1.680.33~2.23167~33335~50
Table 2. Test scheme.
Pile No.Pile Length Lt
(mm)
Pile Diameter D
(mm)
Rock Embedment Depth Ls
(mm)
Roughness Height r
(mm)
RF
P125020100(5D)00.0
P225020100(5D)10.1
P325020100(5D)20.2
P425020100(5D)30.3
Table 3. Experimental results.
Pile NumberUltimate Bearing Capacity (N)Ultimate Displacement (mm)Residual Bearing Capacity (N)Residual Bearing Capacity/Ultimate Bearing Capacity (%)
P114502.67105072.4
P232808.22195059.45
P346507.41284061.07
P460506.41375662.08
Table 4. Percentage of pile axial force and pile side resistance.
Range Below Soil-Rock Interface: 25 mmRF
0.00.10.20.3
Axial Force Attenuation Magnitude41.0%42.9%44.1%48.9%
Proportion of Side Resistance43.6%44.7%45.3%50.1%
Table 5. Rock parameters of the test.
q u q s i m 0 RMR K 0 γ r ac
5 MPa50 kPa770124 kN/m3289
Table 6. Calculation results of pile ultimate bearing capacity.
Pile NumberP1P2P3P4
Ultimate bearing capacity (N)Experimental value1450328046506050
Horvath Method Calculated Values314360049976173
Zhao Method Calculated Values1328138714461506
Disclaimer/Publisher’s Note: The statements, opinions and data contained in all publications are solely those of the individual author(s) and contributor(s) and not of MDPI and/or the editor(s). MDPI and/or the editor(s) disclaim responsibility for any injury to people or property resulting from any ideas, methods, instructions or products referred to in the content.