Abstract
Walls in masonry structures exhibit sensitive behavior under out-of-plane displacements. Although numerous studies address in-plane behavior, research focusing on out-of-plane response remains limited. The performance of masonry walls is influenced by several factors, including material characteristics, construction defects, mortar quality, support conditions, wall slenderness, and the properties of openings. Because of those parameters, detailed experimental and numerical studies are required to understand the behavior. Double- or multi-wythe masonry is commonly used, and header (or through) bricks are often placed to ensure interlocking between the wythes. The number and arrangement of the header bricks directly influence the wall behavior. Particularly after recent earthquakes, significant damage has been observed in multi-wythe walls, and the role of header bricks in wall performance is not yet fully understood. This study investigates the out-of-plane behavior of double-wythe, two-sided brick walls, in which header bricks are used only in the out-of-plane direction. Numerical analyses were performed on eight different wall models. In these models, header bricks with varying quantities and arrangements were placed perpendicular to the wythes. Lateral load analyses were conducted using the finite element method and micro-modeling technique implemented in ABAQUS software (Version 2022). Two models were validated using the referenced experimental results. The findings indicate that all walls that incorporate header brick exhibit higher lateral capacities. When compared to the reference wall model, the load-to-weight ratio increased with the increase in the number of header bricks. The lateral capacity ratio increased by factors of 1.29, 1.50, 1.68, and 1.81 in walls containing one, two, three, and four vertical rows of header bricks, respectively. When the header bricks were distributed uniformly throughout the wall, the capacity increased by a factor of 1.61. These results demonstrate that the header brick pattern also affects the wall capacity. Additionally, the presence of header bricks directly influences the failure mechanism of the wall.
1. Introduction
1.1. Background on Unreinforced Masonry (URM) Behavior
Following recent earthquakes, masonry structures have experienced significant damage, and their structural behavior remains insufficiently understood. Although there are many structural guidelines and regulations that exist in the literature, many masonry structures are constructed without adequate engineering input. Therefore, the seismic resistance of masonry structures built with traditional techniques is found to be quite low. Various parameters, such as wall slenderness, masonry units, mortar properties, in-plane or out-of-plane (OOP) loading direction, presence of side walls, openings, support conditions, and horizontal and vertical confining elements, affect the behavior of masonry walls [1,2,3,4,5].
Investigating masonry walls, which involve numerous variables, requires a detailed and comprehensive study. Especially after the 6 February 2023 Kahramanmaraş-Pazarcık (Mw = 7.7) and Elbistan (Mw = 7.6) earthquakes in Turkiye, many masonry structures were observed to experience OOP damage. While natural stone, brick, and adobe are predominantly used in historical structures, modern masonry construction increasingly incorporates materials such as pumice and aerated concrete [6,7,8,9,10,11,12]. Due to the natural structure of the materials and their bonding quality, unreinforced masonry structures exhibit brittle behavior. For this reason, many structures experienced premature collapse during recent seismic events, resulting in loss of life and property.
Various studies indicate that enhancing ductile behavior delays structural collapse [13,14,15,16,17,18]. The degree of ductility is largely influenced by construction techniques and material properties. In masonry, adhesion between units is achieved through the mortar; therefore, the characteristic properties of the mortar directly affect wall capacity [19,20,21,22]. The use and quality of mortar between units mostly depend on the construction practices. Additionally, some historical buildings either lack mortar or exhibit mortars that have been eroded over time due to environmental factors [2,23]. In this case, the interaction between units is governed solely by friction.
The mechanical performance of masonry walls is mainly dependent on the brick arrangement, which is an essential factor determining load transfer and stress distribution within the structure. Experimental and numerical studies have demonstrated that different brick arrangements significantly influence the stiffness, strength, and failure mode of masonry elements such as walls, domes, and vaults.
Alforno et al. emphasized the role of brick bonding patterns in historical structures, noting that radial, diagonal, and pitched brick patterns in cross vaults generate different failure mechanisms and horizontal stress distributions [24]. Similarly, Szabó et al. determined that incorporating the correct masonry bonding pattern in numerical models improves the accuracy of pushover analyses [25]. Their study indicated that the masonry brick pattern is a main parameter affecting the load capacity and deformation behavior.
Masonry wall thickness, length, height, and the number of wythes are also known to influence structural behavior. As wall thickness, length, and the number of wythes increase, wall slenderness decreases and lateral load capacity increases [26,27]. However, the increase in wall height and the existence of door or window openings cause the slenderness to increase and the lateral resistance to decrease [5,27,28].
Openings introduced for structural or aesthetic purposes also affect the behavior of masonry walls. Such openings cause stress discontinuities, alter failure mechanisms, and reduce wall capacities [29,30]. An increase in the number or size of openings consequently decreases overall building safety. Several studies have indicated that stress concentration develops around openings, often leading to premature wall collapse [29,30,31]. In structures subjected to seismic actions, the presence and configuration of openings become particularly important.
In addition, the fixed side-wall condition, which is commonly preferred in wall construction, directly affects the structural behavior [32]. In structures exposed to seismic actions, side walls were found to contribute to the seismic safety of the superstructure [10]. The foundation system, for which damage is rare in low-rise masonry structures, is expected to be resistant to effects such as translation and rotation.
Another parameter affecting the wall behavior is the presence of confining elements, which are structural elements used in the horizontal or vertical direction. Those elements provide load distribution between masonry units. Various studies have shown that the use of confining elements increases seismic resistance and thus reduces damage [33,34]. In dry-stack masonry systems, load transfer is achieved through mechanical contact between unit interfaces (interlocking, friction, and geometric restraint due to surface roughness) [35,36]. In numerical analyses, dry-stack contacts are modeled either by using surface-to-surface contact definitions with Mohr–Coulomb friction (and, when necessary, a small amount of cohesion), or by employing zero-thickness nonlinear interface elements [36]. In cohesive joints where mortar is used, traction/separation (cohesive zone) models are used to obtain the fracture behavior [37]. The elastic stiffness in the normal and shear directions, and in stress, displacement, or energy parameters, are required for the numerical model. In mortar systems, the interaction between units and the definition of the cohesive zone requires more parameters than in mortarless system mechanisms. In this study, due to the dry connection, contact behavior was defined using the Mohr–Coulomb approach. The definition details are explained in the Material Model and Contact Definition section.
1.2. Previous Studies on In-Plane and Out-of-Plane Behavior
Out-of-plane structural elements play a crucial role in resisting loads induced by seismic activity. While masonry walls exhibit high stiffness and strength against in-plane loading, they possess considerably lower capacity under OOP loading [8,38,39,40]. Walls working in the in-plane direction transfer the loads to the ground efficiently, while the stiffness in this direction increases the lateral resistance by limiting the displacements of the structure. However, when subjected to OOP actions, walls are more vulnerable in terms of stability, and damage mechanisms such as buckling, sliding, or overturning may occur at comparatively lower load levels [29,38,39]. Since the aim of the study was to examine OOP behavior, the side walls that could affect the wall behavior were not considered as a variable parameter in the study. Side walls can be connected with other walls in the shape of U, L, and T. Different studies indicate that side walls enhance the capacity of connected OOP walls, modify the failure mode, and restrict displacements [1,2,27,41]. In this context, all the investigated walls were supported on two sides in a U-shaped configuration.
1.3. Knowledge Gap on Dry Double-Wythe Masonry
Although various studies were conducted on the structural behavior of masonry walls, most of these investigations focused on single-wythe and mortared constructions [42,43,44,45,46]. The crack initiation, stiffness loss, failure mechanisms, and seismic behavior of single-wythe walls under vertical and horizontal loading have been widely investigated [45,46,47]. In most of these studies, the walls were evaluated primarily in the in-plane direction. Multi-wythe walls are common compared to single-wythe walls. In multi-wythe walls, load transfer is particularly low under mortarless or weakly bonded conditions, resulting in behavior that differs significantly from that of monolithic, mortar-based systems. In such walls, the units are connected to each other by friction and interlocking mechanisms. Because the units can move separately in mortarless systems, experimental work or micro-modeling analysis is generally preferred [27,37].
Multi-wythe walls are typically constructed from two parallel wythes. In many cases, wythes are bonded with mortar or interlocked with horizontal header bricks [48]. With the growing number of studies on masonry behavior, numerical modeling strategies aimed at capturing contact interactions have advanced significantly. In the study by Oktiovan et al., mortar and unit interfaces were modeled with zero-thickness Coulomb friction using a block-based modeling approach, penetration was evaluated, and damage mechanics were investigated [47]. The study revealed that contact parameters are critical in modeling mortarless systems.
The knowledge gap and the new contribution of this study arise from several limitations identified in the literature. While the literature focuses on single-wythe masonry systems, double-wythe systems have not been sufficiently investigated. Although many studies address in-plane wall behavior, recent earthquakes have demonstrated that out-of-plane performance is equally critical. Moreover, research focusing on the interlocking between wall wythes remains limited in the literature [22,49,50,51]. There is no systematic investigation in the literature on the out-of-plane effect of header bricks in double-wythe systems. The structural role of header bricks in governing out-of-plane response has not been sufficiently investigated. Consequently, there is a clear gap in understanding how the existence or absence of header bricks affects the general stability and failure mechanisms of dry-joined structures.
In this study, this research gap is addressed by varying both the arrangement and number of header bricks. The effects of header bricks on failure mechanisms, lateral load capacity, and displacement profiles were investigated. A numerical methodology employing micro-level modeling was applied to capture the realistic behavior of the walls. In this context, the study introduces a new and significant contribution to the existing literature. Experimental and more comprehensive studies are planned for future studies.
When experimental studies cannot be conducted on wall structures, numerical modeling methods are employed to predict their actual behavior and capacity. Considering construction details, such as brick interfaces, structure/wall size, and masonry unit arrangement, modeling becomes significant for realistic behavior. Accordingly, a micro-modeling approach based on distinct element modeling was chosen as one of the most suitable methods. In particular, in mortarless systems, the role of the contact interface and the determination of local separation behavior cannot be obtained through macro-modeling. In numerical studies using macro-modeling, contact interfaces are either neglected or modeled in a simplified way. Most of the existing numerical studies are based on macro-modeling approaches, which are unable to capture individual unit behavior, interaction failure, and local separation effects [52,53,54]. Therefore, the contact and friction-sliding behavior of dry double-wythe walls should be comprehensively investigated at the micro-level in numerical models. In detailed micro-modeling, the unit and mortar are modeled as separate solid elements. A detailed description of the basic modeling techniques for masonry structures is provided in Figure 1. In simplified micro-modeling, an expanded brick element is obtained by adding a horizontal and a vertical mortar thickness to the masonry unit [55,56,57].

Figure 1.
Basic modeling techniques for masonry structures.
Micro-modeling techniques have been found to be a reliable method for investigating the actual behavior of masonry walls [58]. Various studies reported quite consistent results in small wall models [57,59,60]. In micro-modeling, the mechanical properties of the mortar between units, such as cohesion, separation, and shear, are taken into account [61,62]. Because mortar was not considered in this study, the mortar thickness was not added to the unit height calculated in the simplified micro-modeling approach. Direct micro-modeling was considered in this study instead of simplified modeling due to the structure size and dry joint. This approach ensures that the walls exhibit their actual structural behavior. However, micro-modeling techniques significantly increase computational time and cost, especially in large-scale building models. In such a case, the macro-modeling technique is often preferred. In macro-modeling, the masonry structure is represented as a homogeneous material, and the individual units and mortar layers are not modeled separately. This approach is predominantly used for complex structural systems or full-building analyses [63,64].
1.4. Objectives and Novel Contributions
The reference study considered in this work was conducted using a tilting table [26]. In this technique, the table is tilted in one direction, causing the mass to move. The angle of the tilt is related to the lateral load applied to the structure. Force–displacement curves were obtained continuously during the test [5,26,27,29,65]. The tilting table has been used to determine the failure mechanisms, OOP stiffness, and lateral load capacities of masonry walls. The findings obtained from the experiment have been used to validate the numerical model [5,26,27,29,65].
In the reference study utilized in this paper, the tilting angle and OOP displacements of the walls were measured using LVDT (Linear Variable Displacement Transducer) sensors (TEKNİK DESTEK GRUBU (TDG), Ankara, Türkiye). A total of 15 LVDTs were placed on the OOP wall, positioned on five horizontal and three vertical lines. To ensure the accuracy of the measurements, the tilting speed of the table was set low; thus, there was an attempt to clearly identify the failure moment. Previous studies on OOP behavior demonstrated that the tilting-table test method provides a good consistency between experimental and numerical findings [2,27,37]. In the referenced experimental study, the tilting table was inclined at a slow rate, and the changes in the model were recorded. Accordingly, the analyses were performed by applying the load in small time increments, which ensured that displacements and failures were captured accurately without abrupt responses.
In this study, the effect of the number and arrangement of the header bricks on OOP masonry walls was numerically investigated. Eight different masonry wall types were modeled using a micro-modeling approach in ABAQUS software (Version 2022). The walls were built with fired red clay brick material, and no mortar was used between the units. Brick material properties and frictional contact were considered in the numerical model.
In the referenced experimental study, used for validating the numerical work, roof loads were not applied [26]. Similarly, in the present study, roof loads were neglected due to the potential complications they may introduce during collapse. The reason for not considering the roof diaphragm effect is explained in the specimen preparation section. Future studies may consider the influence of roof loads as well as possible retrofitting techniques.
Utilizing ABAQUS software for numerical modeling lateral load capacities of the walls, failure mechanisms, brick displacements, and damage relationships were investigated in detail. Lateral load ratio is referred to as the V/W ratio in this study, where V is the lateral force and W is the total weight of the wall model. Numerical and experimental results were compared to determine the reliability of the study.
2. Numeric Investigation
2.1. Specimen Preparation
In the study, different wall configurations were taken into account to determine the OOP behavior of double-wythe masonry walls incorporating header bricks. To prevent torsional effects in the OOP-loaded wall, a U-shaped configuration was modeled by placing side walls on both sides. This arrangement ensured that undesired stress concentrations were avoided. Header bricks were used only in the middle wall that exhibited OOP movement. The failure mechanisms and capacities of the walls were analyzed depending on the location and amount of header bricks. The effect of header bricks on failure mechanisms was identified. Eight different wall models were analyzed, as given in Figure 2. Walls were coded as W. The wall without a header brick was created for control purposes and coded as W-N. Header bricks are coded as I, II, III, and IV according to the number of vertical rows, and O, V, and A patterns according to their arrangement. “O” represents the bond pattern spread across the entire wall (Figure 2f). “V” represents the bond pattern starting from the middle of the front wall and spreading to the left and right corners and the upper section (Figure 2g). The “A” bond pattern is in the same section of the wall as ‘V’, but increases from the upper section towards the left and right lower edges (Figure 2h). In W-I, W-II, W-III, and W-IV wall models, header bricks were interlocked with the wall wythes in seven rows horizontally and one to four rows vertically, respectively.
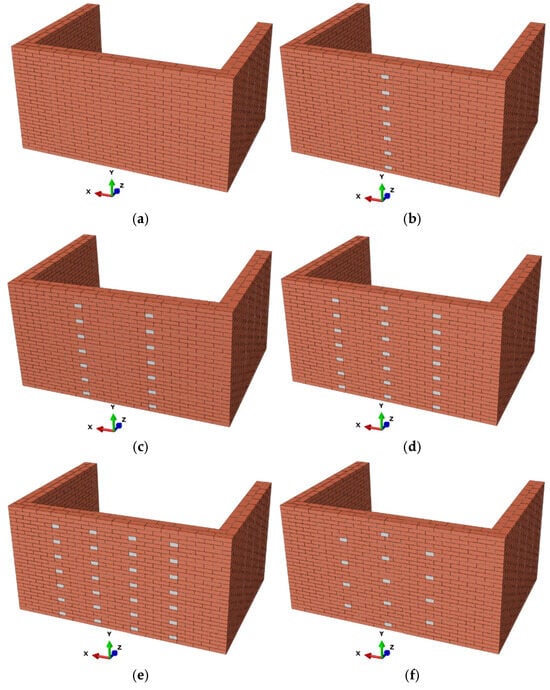
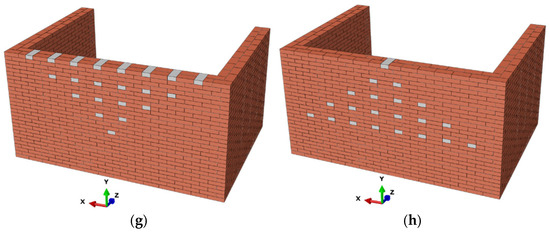
Figure 2.
Numerical wall models and header brick arrangement. (a) W-N: Reference model without header bricks. (b) W-I: A single vertical row of 7 header bricks. (c) W-II: Two vertical rows of 14 header bricks. (d) W-III: Three vertical rows of 21 header bricks. (e) W-IV: Four vertical rows of 28 header bricks. (f) W-O: 13 header bricks arranged in an O-pattern. (g) W-V: 21 header bricks arranged in a V-pattern. (h) W-A: 21 header bricks arranged in an A-pattern.
In the W-O model, the effect of the header bricks placed in the center and edges of the OOP wall was evaluated. In the W-V model, the effect of the header bricks increasing towards the top and edge of the OOP wall was evaluated. In the W-A model, the effect of the header brick increasing from the top to the middle of the OOP wall was evaluated. Three vertical rows of header bricks were used in the W-O and W-III models, but the number was reduced in the W-O model. Front walls experiencing OOP behavior were 1400 mm in height and 2800 mm in length, and the side wall length was 2000 mm. The ratio of front wall length to height (L/H slenderness) is 2. The roof effect is neglected as it is not effective when the connection between the wythes and the roof is weakened due to detachment of the walls in an out-of-plane direction [27]. Rather than addressing existing roofed structures, the study aims to examine the OOP behavior only, although different studies indicate that the roof limits wall displacements and increases lateral load capacity, provided that the interaction between the front and side walls is secured [29,66].
The walls were constructed using a running bond pattern. The bricks were laid in a staggered pattern to avoid vertical joint alignment. Figure 3 shows the wall dimensions and the header brick arrangement. The wall thickness is 200 mm for two wythes. The header bricks were carefully arranged in the double-wythe configuration to ensure interlocking between the two wythes.
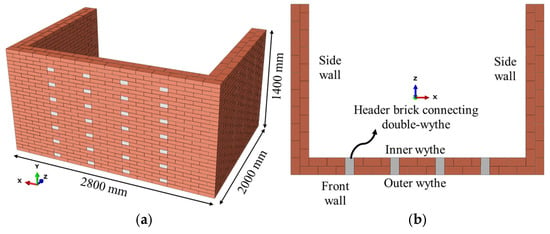
Figure 3.
W-IV wall model and header brick arrangement. (a) 3d view and dimensions. (b) Cross-sectional view.
2.2. Finite Element Modeling Approach
Various methods can be utilized to analyze the behavior of masonry walls. One of the most commonly employed techniques is the finite element method, which is widely used in different structural models, such as reinforced concrete, steel, masonry, and timber. In this approach, the structural element is discretized into appropriate parts to accurately capture mechanical responses, including load transfer, stress distribution, energy dissipation, and displacement behavior. In the ABAQUS software, which uses the finite element method, masonry units and contact properties are modeled with different details. Dynamic analysis is employed in problems involving dynamic actions, nonlinear behavior, plastic deformations, and uncertainties related to contact interactions [67,68,69]. In order to obtain consistent results in dynamic analysis, the analysis is performed with small steps. The use of the finite element method in the Explicit Dynamic Analysis (EDA) approach demonstrated satisfactory results in different studies [54,70]. Explicit solvers use small time steps to prevent oscillations. Implicit solvers can struggle with convergence in large systems, whereas explicit methods typically avoid such issues. Several previous studies showed that they perform well under low loading conditions, especially in cases with complex interactions and large deformations [71,72]. Therefore, the EDA approach in ABAQUS software is considered in this study. Wall displacements under the effect of gravity and lateral force were analyzed with small steps. In modeling, the number and duration of analyses, solid modeling, elastic properties for bricks, dry-stack contact, mesh size, reference points, boundary conditions, and linear load were defined. In order to optimize the analysis time and cost, the interactions between the bricks were defined with frictional contacts. At the end of the analysis, the maximum displacements and lateral reaction were taken into account for capacity curves.
2.3. Analysis Setup, Load Procedure, and Boundary Conditions
In the ABAQUS/EDA approach, the wall models were modeled in 3D. The dynamic analysis process was carried out for 4 s in the first step and 20 s in the second step. In the first step, only gravitational acceleration was applied with a smooth increase with a multiplier value of 9806 mm/s2, as given in Figure 4a. In the second step, the lateral pushing force was applied in linear increments to eight corners of each brick, as shown in Figure 4b. In pre-numerical studies, displacement, acceleration, and velocity were applied to bricks in the -z direction. As a result, when displacement was applied, all bricks moved in the same direction and by the same distance. In this case, unrealistic behavior was possible. Some analyses exhibited unrealistic behavior in the definition of acceleration and velocity. As a result, force-based analyses were found to lead to realistic behavior and to be consistent with experimental studies.
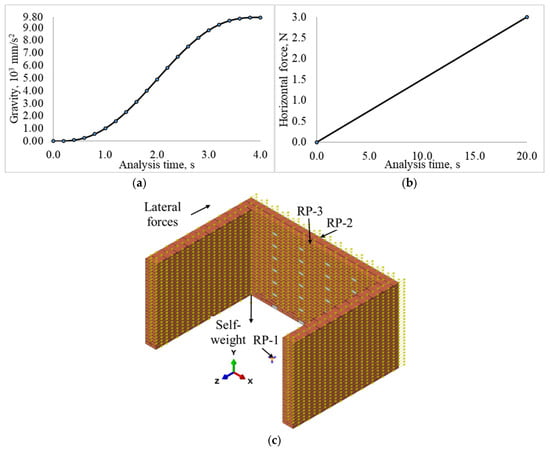
Figure 4.
Wall properties defined in numerical modeling. (a) Gravity. (b) lateral forces, and (c) force and reference points (The yellow arrows represent the applied forces).
In preliminary analyses, different mesh configurations were tested, and new loads were recalculated and assigned to all brick nodes. To avoid this confusion and to keep the analysis procedure the same for all models, loads were applied to eight specific points. Applying loads to all brick nodes was not expected to alter the results. The lateral pushing force reached 3 N after 20 s with a load multiplier of 1 N for full bricks and 0.5 N for half bricks. Displacement-controlled analysis was initially considered; however, movement of all bricks occurred concurrently at the defined displacement magnitude. Under these conditions, force-based analysis approach was adopted. As shown in Figure 4c, the OOP failure of the front wall was achieved by applying a force in the -z direction to the brick units. To calculate the vertical and horizontal total reaction of the wall, the reference point-1 (RP-1 point) is defined at the base of the wall. RP-1 was fixed to the bottom surfaces of the bricks in the base row using the coupling method. The base reaction of the wall was obtained from the RP-1. Out-of-plane displacements (OPD’s) data of the outer wythe at reference point-2 (RP-2) and the inner wythe at reference point-3 (RP-3) were measured. The capacity curves were compared, considering the base reaction force and OPD’s.
2.4. Mesh Configuration and Solver Settings
Some assumptions, which do not change the wall behavior but reduce the analysis time, were considered. Although bricks with dimensions of 191 × 93 × 47 mm have 118 × 3 × 15 mm cavities on the top surface, to simplify the modeling, those cavities were not considered. Since no mortar was used between the units, the dimensions remained constant. However, the dimensional digits were considered as integer numbers to correctly complete the analysis and modeling process: 200 × 100 × 50 mm full bricks and 100 × 100 × 50 mm half bricks were employed, although in reality, there was considerable roughness and distortion in the units. A full dimension of the brick size was taken into account, which will not change the results and will be appropriate for the wall size. This situation should not be confused with expanded brick in simplified micro-modeling. The brick unit was divided into rectangular prism meshes. The 8-point rectangular meshes varying between 20 and 50 mm are defined for the masonry unit as presented in various studies [69,73]. In addition, Moradi et al. reported that a mesh size of 50 mm is appropriate for modeling brick units for mesh sensitivity analyses on masonry wall types [74]. In this study, a mesh sensitivity analysis was performed to determine the brick mesh size, as shown in Figure 5. Four types of mesh sizes were compared: a-type: 20 mm, b-type: 25 mm, c-type: 50 mm, and d-type: 100 mm mesh patterns. The weight of a brick is 15.267 N. The horizontal slip limit is calculated as 12.53 N, based on a friction coefficient of µ = 0.82 [27]. Approximately the same maximum friction resistance was obtained for the a-, b-, and c-type mesh patterns. Because mortar was not used, the horizontal resistance is low. The analysis results, depending on the mesh size, were close to each other. Accordingly, the b-type mesh pattern was considered to shorten the analysis time. Consistent results were obtained in preliminary numerical analyses. Contact control was taken into account in the mesh sensitivity analyses. The penalty stiffness scaling factor (PSSF) value of this feature, explained in the Material Model and Contact Definition section, was taken as 1 × 10⁻³. Brick units were modeled as 8-point linear brick, reduced integration, hourglass control with an element label C3D8R in the ABAQUS/EDA approach. In the W-N wall model, 10,266 elements and 3360 nodes were created. EDA is defined according to the center-difference time integration method [73]. In this analysis, a total of 24 s of analysis was carried out using small time increments and all data was recorded for 0.02 s.
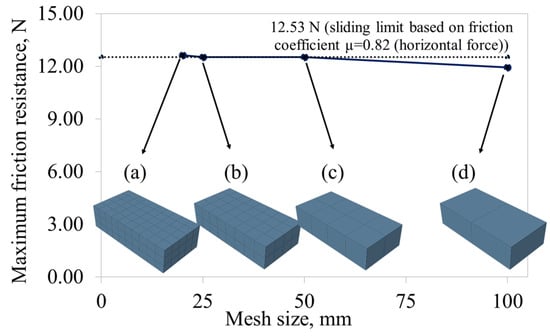
Figure 5.
Mesh sensitivity analysis of the numeric model. (a) 20 mm. (b) 25 mm. (c) 50 mm. (d) 100 mm.
2.5. Material Model and Contact Definition
Red clay bricks were considered for wall construction. The brick is formed by mixing, shaping, and firing sand, clay, and water. The mass of a full brick is 1556.8 g. In the model, an equivalent unit volume weight of 15.267 kN/m3 was defined based on the principle that the total mass of brick should be equal in both cases. This value represents the mass of the cavity structure of real brick in the solid model. The compressive strength of the brick was determined as 23 MPa [75]. In different studies, models such as the Drucker–Prager (DP) and Concrete Damage Plasticity (CDP) models are used to define brick material [76,77,78,79]. In some studies, the masonry units are modeled using the CDP approach to simulate crushing and cracking [76,80,81]. In the referenced experimental study, the stresses within the bricks remained below their elastic capacity. Because mortar was not used in the reference study, the strength of the walls was low and separation occurred at the interfaces. Post-experiment observations revealed that some bricks were damaged not during the failure stage but after collapse, due to impact with the ground. For this reason, the elastic modulus and Poisson’s ratio were taken for elastic material properties in the numerical study. When only elastic properties are used, there is no significant change in the analysis that can be attributed to the low stress level, as mentioned above. Elastic parameters for brick and contact properties are given in Table 1.
Brick samples, their dimensions, wall features, and contact interfaces are shown in Figure 6. The dry-joint contact between the vertical and horizontal interfaces of the bricks were taken into account. The friction coefficient for the brick was obtained from reference and different studies [27]. In the friction tests, specimens were examined both with and without applied vertical load and the coefficient was ultimately determined to be 0.82. Until the end of the analysis, friction was enabled to occur again at each contact. Hard contact was defined for direct load transfer. In this study, the bricks have surface roughness and voids, as graphically drawn in Figure 7a. This roughness was ignored in the modeling, and it was assumed that the bricks matched perfectly. Modeling was performed according to the perfect contact assumption. The contact surfaces were defined to prevent any penetration, with the transfer of forces controlled by their normal and tangential components. Normal contact transfers pressure by preventing the bricks from penetrating each other, while tangential contact represents the sliding movement between the bricks, depending on the friction coefficient and cohesion [82]. The normal/tangential behavior and interaction between the brick units are graphically illustrated in Figure 7b. Shear in the tangential direction is modeled based on the Mohr–Coulomb criterion and defined by the shear stress limit value [35,36], where is the tangential stress, μ is the friction coefficient, σ is the normal stress, and is the cohesion of the joint. When the tangential stress limit value is exceeded, sliding occurs on the contact interface. No additional shear stress was defined. Since there is no mortar cohesion for the walls, was assumed. In numerical models, the calibration of contact parameters, such as normal and shear stiffness and friction coefficient, must be performed carefully. This is because the contact properties are sensitive to surface roughness, brick geometry, and the level of compression [82]. In the finite element micro-modeling approach, discrete moving bricks can be modeled based on the Mohr–Coulomb criterion [36]. The correct definition of the separation conditions between units ensures that the predicted results are consistent with the nonlinear response observed in experimental studies.
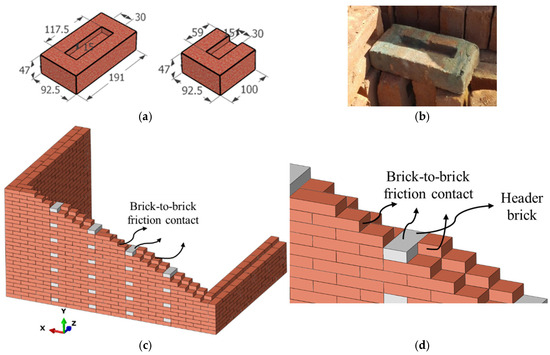
Figure 6.
Wall features and contact details (dimensions in mm). (a) Full and half brick. (b) Brick sample. (c) Header brick arrangement. (d) Contact surfaces.

Figure 7.
Graphical drawing of the roughness and interaction between the brick units. (a) Graphical representation of dry-joint irregularity with surface roughness (The drawing is not to scale, and the blue line represents the enlarged detail). (b) Interaction between the brick units.
The interaction between the units was weak due to the dry joint. In dynamic/explicit analysis, if normal/tangential behavior is taken as default for contact behavior, contact stiffness is affected by the brick elastic modulus. To limit the excessive contact stiffness resulting from the high elastic modulus of the brick units, a PSSF was defined using the contact control option [73]. This control allowed the interface stiffness to be managed independently of the elastic modulus. Thus, sliding only began when the friction limit (µ= 0.82) was exceeded. In the case of a general contact definition, local stresses may be unreadable, and in some cases, contact control cannot be defined. For this reason, surface-to-surface contact was considered. As shown in Figure 8a, a sensitivity analysis was performed for the PSSF value affecting the contact response between two bricks in the range of 0.0 to 1.0. The results indicate that when the PSSF value is below 0.2, the contact response successfully achieves 12.53 N. However, because the effect of this value may differ in the wall model, the analysis was performed for five different PSSF values for the W-N model. The results obtained from this are shown in Figure 8b. As a result, when the PSSF value in the wall was 5 × 10⁻³, 2 × 10⁻², and 5 × 10⁻², a more rigid behavior and higher V/W ratio were found compared to the experimental results. When PSSF was 1 × 10⁻⁴, the interaction stiffness decreased. The wall stiffness and V/W ratio were found to be quite low. This demonstrated the effectiveness of the PSSF value in dry-joint walls. When PSSF 1 × 10⁻³ was considered, the experimental and numerical results were found to be more consistent. Therefore, the PSSF value was taken as 1 × 10⁻³ for the other wall models. Dry-joint behavior was represented through this factor. As in the reference experiments, all the bricks were fixed at the bottom row.
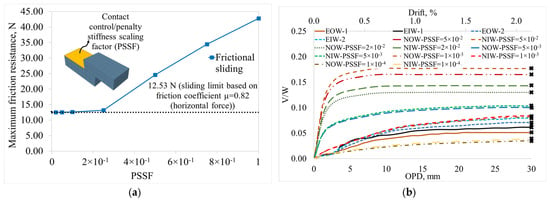
Figure 8.
Sensitivity analysis for PSSF defined within contact control (b-type mesh). (a) Sensitivity analysis for two-brick frictional sliding. (b) Sensitivity analysis for W-N model (The “×” represents the ultimate OPD).

Table 1.
Wall properties.
Table 1.
Wall properties.
| Brick Material | |||
| Definitions | Value | Notes | References |
| Density (γ), kN/m3 | 15.267 | [26,27,83] | |
| Compressive strength (fb), MPa | 23 | [26,27,83] | |
| Tension stress (fct), MPa | 0.218 | [27] | |
| Elastic modulus of brick (Eu), MPa | 16,700 | [57,80,84] | |
| Poisson’s ratio (νu) | 0.15 | ||
| Contact details | |||
| Tangential behavior Friction coefficient | 0.82 | Determined under different vertical loads | [26,27,83] |
| Normal behavior | Hard contact | To avoid penetration of nodes | |
| Allow separation after contact | This condition was allowed to enable separation after contact. | ||
| Cohesive behavior | This was omitted due to the absence of mortar | ||
| Contact control | PSSF = 1 × 10⁻³ obtained from sensitivity analysis | ||
2.6. Validation of Analysis
There are different test methods to determine the wall capacity. Most experimental studies focus on the investigation of horizontal and vertical load capacities, displacement capacities, and associated failure modes [16,29,85]. By using the tilting-table test method, the structural capacities can be determined by examining the failures that occur as a result of the structure’s mass mobilization. The numerical results for the walls analyzed in this study were compared with the tilting-table test results for verification. In the tilting-table method, the lateral force is associated with the wall mass a tilt angle [15,29]. Preliminary numerical analyses were conducted to accurately estimate the wall capacities. Analyses showed that the elastic modulus value defined for the material significantly affected the wall behavior. The elastic modulus of the brick unit is taken as 16,700 MPa, which was found to give consistent results with the experimental study.
Because of the different displacements of the brick units, force-based analysis was preferred over displacement-based analysis. In this condition, each brick was allowed to move with different displacements depending on gravity and its self-weight. This situation ensured that displacements occurring in the upper regions were higher than in the lower regions and contributed to representing the real behavior. The test results of U-, L-, and I-shaped single-wythe walls in Erdil et al. and U-shaped double-wythe walls in Açar et al. on the tilting table were taken into account for the validity of this study [26,27]. In the referenced experimental study, two repetitions were performed, and the study was reported to provide reliable results [26]. In the study by Erdil et al., the ratio of lateral load-to-weight (V/W) was found to be 6.2% in the U-shaped wall without openings and mortar, which was considered as the reference sample. When this ratio was evaluated for the W-N wall in the study, it was found to be 6.7% for the outer wythe and 4.0% for the inner wythe. The values were found to be close to the experimental results. Figure 9 shows the comparison of the experimental and numerical results. Because of the absence of header bricks on the W-N wall, the inner wythe and outer wythe moved separately, and the outer wythe collapsed earlier. The single row of header bricks on the W-I wall allowed the inner and outer wythes to move closer to each other, resulting in more arching behavior. In this respect, failure profiles were found to be consistent. Experimental and numerical results for the W-N wall show that the final V/W ratio was 6.5% and 8.8%, respectively. For W-I, the V/W ratio was found to be 10% and 10.3%, respectively. In general, a deviation between 5% and 10% was observed between the numerical and experimental results. This deviation was attributed to the rough surface texture of the brick units and their manual fabrication. These deviations remained within acceptable limits. The roughness of the brick changed the elastic modulus, and this was taken into account in the calculation. Apart from this, a unit with a regular rectangular geometry was modeled. Otherwise, determining the capacities of the walls in future numerical studies becomes quite difficult. Despite the change in brick roughness, experimental and numerical load capacities were found to be consistent. In Figure 9, the orange and yellow dashed lines indicate the movement of the inner and outer wythes, respectively.
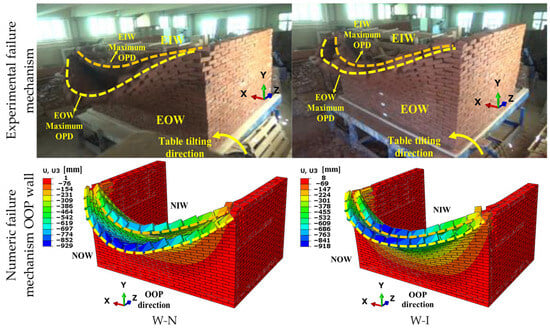
Figure 9.
Comparison of failure mechanisms based on the experimental study conducted by Açar (2022) [26] on U-shaped walls and the findings of the numerical analysis in this study.
The analysis confirmed that the assigned friction coefficient of 0.82 for the contact provided adequate experimental results. In tilting-table experiments, the lateral load Equation (1) was calculated using the table’s sinus angle and wall mass [26,27,37]. In the equation, m is the mass, and g is the acceleration of gravity. When the wall weight is substituted for mg in Equation (1), the lateral load-to-weight ratio (V/W) as shown in Equation (2) is obtained. Here, α represents the angle of rotation of the wall relative to the horizontal axis on the tilting table. This approach was used as a normalization method that evaluates wall capacity at an equivalent horizontal load level. The V/W ratio allows comparison and analysis between different wall types. The force-controlled loading was applied to reflect the actual behavior. This allowed the bricks to move relatively after reaching the sliding limit. The vertical load increases towards the base of the wall. Therefore, the horizontal force required for sliding is higher at the base. Bricks that exceed the sliding limit move and exhibit realistic behavior by moving relative to the conditions. The reaction forces R2RP−1 in the vertical -y direction and R3RP−1 in the lateral -z direction (out-of-plane) were obtained from the RP-1 base reference point given in Section 2.3. All reaction forces were obtained at 0.02 s intervals from point RP-1. This behavior is directly consistent with the V/W ratio determined in the experimental study. The obtained forces were used to provide a relation with the V/W ratio found from the tilting-table method using the equation given in Equation (3). In this way, experimental and numerical results were compared. When this ratio is correlated with displacement, capacity curves can be obtained. In this way, a mass-independent parameter is obtained, which can be compared with data available in the literature. Accordingly, despite variations in wall masses and horizontal load values in different studies, the V/W ratio can be compared. The loading process was applied gradually over a sufficiently long duration to minimize inertial effects. The ratio of kinetic/internal energy (KE/IE) was obtained in ABAQUS using ALLKE and ALLIE, respectively, and calculated as given in Equation (4). The history outputs were taken as whole-model totals from the ODB file. The ratio of kinetic to internal energy remained below 5% throughout the analysis, confirming that the explicit dynamic solution operated under quasi-static conditions [73]. The ratios of ALLKE/ALLIE for walls W-I, W-II, W-III, W-IV, W-O, W-V, and W-A were found to be 4.2%, 4.0%, 3.8%, 3.8%, 3.6%, 3.5%, and 3.5%, respectively, confirming the quasi-static conditions. ALLKE/ALLIE graph for the 24 s is given in Figure 10. The obtained results are not affected by artificial inertial forces:
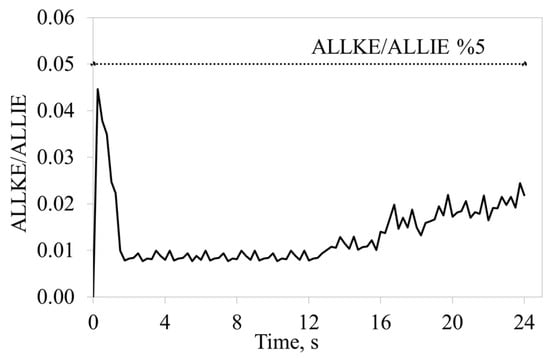
Figure 10.
ALLKE/ALLIE ratio graph for 24 s on W-N wall.
3. Results and Discussion
3.1. Effect of the Number and Arrangement of Header Bricks on OOP Failure
The U-shaped walls, with support provided by the side walls, generally collapsed by arching movement. The largest displacements occurred at the top of the front wall, while the lowest displacements occurred close to the side walls [27]. Figure 11 shows the results obtained from the numerical model for the walls without header bricks (W-N) and with a single vertical row of header bricks (W-I). In the Figure, the first row shows the displacement pattern of the walls at 30 mm OPD. The second row shows the large displacement during failure. The third row shows the side section view. The separation between the double-wythe of the sections can be observed at the distance from the foundation. The fourth row shows the curves of the V/W ratio in relation to OPD.
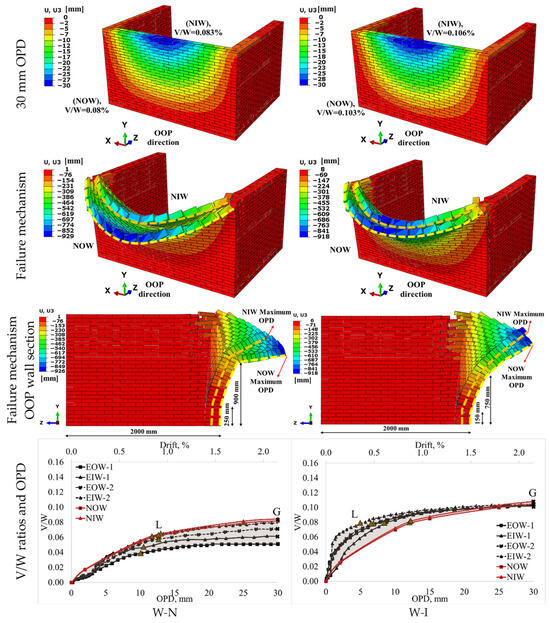
Figure 11.
Failure mechanism and V/W ratios for walls without header bricks and with single vertically arranged header bricks (The orange and yellow dashed lines indicate the inner and outer wythes, respectively).
The first and second significant fractures occurred at heights of 900 and 250 mm from the foundation, respectively, in W-N wall, whereas, in W-I wall, the fracture heights occurred closer to the foundation. Since the fracture occurred closer to the foundation, the load was transferred more effectively to the foundation, resulting in an increased V/W ratio. Since the walls are brittle in nature, after a certain load, the walls experienced a significant loss of stiffness. In the V/W graphs, the points indicated by L were calculated at 75% ultimate V/W ratio and represent the point at which stiffness changed by a certain amount. In the study by Kaushik et al., a value of 75% was defined as the limit at which the stress/strain curve of masonry bricks begins to deviate from linear behavior before reaching the peak V/W ratio. At this stage, fractures developed in the wythe were accompanied by a significant change in stiffness. The V/W ratio continued to increase beyond this level. This served as a suitable intermediate reference point in both numerical models and experimental observations [86]. In the same study, this point was proposed as decisive for the idealized curve of the masonry material. In addition, the V/W ratio and displacement changes can be evaluated. Point “L” was evaluated as the transition level to the collapsed region of the OOP wall.
The “G” point was determined as the ultimate point in the study. After reaching a displacement of 30 mm, the walls were observed to have completely collapsed at point G. This point was specified by comparisons of experimental measurements, visual observations, and video evidence [26]. Since there were no header bricks in the W-N wall, the inner and outer wythes moved separately and failure occurred. The inner and outer wythes moved independently with a more ductile movement. In this wall, the numerical results were slightly higher than the experimental results. This may be attributed to the rough surfaces of the bricks and their construction without mortar. Accordingly, maintaining equilibrium of these brittle walls during the experimental study proved difficult, resulting in lower-than-expected capacities. This conclusion was reached as a result of the observations in the reference study [26]. The use of a single vertical row of header bricks, as in the W-I wall, increased the initial stiffness and V/W ratio. The inner and outer wythes moved close to each other at the places where the header bricks interlocked. Although the numerical results were not consistent with the experimental results at the initial stiffness stage, they were found to be consistent at the ultimate V/W ratio. In the W-N wall, the displacements spread more towards the bottom section during 30 mm OPD compared to the W-I wall. This was due to the separate movements of the wythes. The use of one vertical row of header bricks in the W-I wall increased the V/W ratio by 29%. The arch form in the W-I wall was close for the inner and outer wythes. The interlocking in the single vertical row of header bricks and the side wall was observed to diminish for this reason, and the number of header bricks was increased in other wall models. When the W-I and W-N wall models were loaded to 75% of their ultimate V/W ratio, the V/W ratios were found to be 6.0% and 7.7%, respectively. These walls (W-N and W-I) began to fail at lower loads compared to other wall models.
In order to distinguish the results of experimental and numerical cases, some additional abbreviations were used. The term EIW represents the Experimental Inner Wythe, while NIW refers to the Numerical Inner Wythe. Similarly, EOW represents the Experimental Outer Wythe and NOW indicates the Numerical Outer Wythe. These abbreviations were used consistently throughout the paper for clarity in the figures, tables, and discussions.
In this subsection, it was determined that the use of header bricks in a single vertical row increased the V/W ratio by 29%. The fracture behavior improved, and arch-shaped displacement was observed in each wythe. The two wythes were seen to move relatively closer.
Figure 12 shows the failure mechanism and V/W ratio curves for W-II and W-III walls with two and three vertical rows of header bricks. As can be seen from the displacement profiles at 30 mm OPD for both walls, the initial displacements were similar. The largest displacement in both wall models was at the top center of the front wall, while the OPD decreased towards the lower and side walls. The initial stiffnesses of the two wall models were found to be close and exhibit similar brittle behavior. In the W-II wall, an arching failure mechanism was observed in the part where the inner and outer wythes were interlocked by header bricks. On the W-II wall, the first and second significant fractures occurred at heights of 750 and 100 mm from the foundation, respectively. On the W-III wall, these heights were found to be 650 and 100 mm, respectively. This situation occurred due to the increase in the number of header bricks and provided uniform load transfer. In the W-III wall, the curves were found to be quite consistent from the beginning to the ultimate V/W. In the W-III wall, with the increase in the header brick quantity, the inner and outer wythes moved closer, and their lateral load capacities increased. The contribution of the header bricks resulted in more controlled and consistent behaviors. This is due to the fact that small errors do not affect the behavior while reaching relatively higher capacities. The V/W ratio of the W-II wall increased 50% compared to the W-N reference wall. As for the W-III wall, a 68% increase was attained. Different studies highlight that header bricks in multi-wythe structures substantially increase the V/W ratio and enhance relative structural safety [51,87]. The W-II and W-III wall models reached capacities of 9.0% and 10.1% at point L, respectively. W-III can carry a higher load than W-II, demonstrating the difference achieved by increasing the number of header bricks by seven.
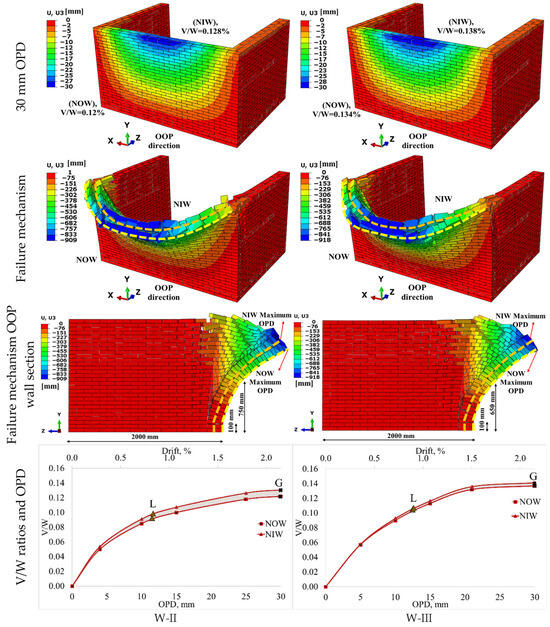
Figure 12.
Failure mechanism and V/W ratios for walls with two and three vertically arranged header bricks (The orange and yellow dashed lines indicate the inner and outer wythes, respectively).
The results obtained in this section demonstrate that header brick load transfer was improved, and cracks were closer to the base. Using header bricks in two and three vertical rows increased lateral resistance, and wall integrity was achieved as the number of header bricks increased.
Figure 13 shows the failure mechanism and V/W curves of the walls using four vertical rows (W-IV) and O-pattern (W-O) header bricks. The displacements of the W-O wall at 30 mm OPD were spread over a wider area than the W-IV wall. The low number header bricks in the W-O wall resulted in a decrease in the V/W ratio. The initial stiffness of the W-IV wall was found to be higher. The inner and outer wythes were observed to move in close coordination, with nearly similar response curves. However, for the W-O wall, the initial stiffness was found to be low, although the inner and outer wythes exhibited similar displacements. In the W-IV wall, the arching movement in the failure mechanism was observed in the inner and outer wall. In the W-O wall, the inner wythes moved behind in regions not interlocked by header bricks, resulting in wavy movement (Figure 13). For the W-IV wall, the damage to the side wall was realized in a wider area. The reason for this can be attributed to the increase in the efficiency of the inner wythe with header bricks. The increased and regular interlocking enhanced the contribution of the side walls. Increasing the contribution of the side walls caused some of the damage to move in that direction during collapse. The first and second significant fractures in the W-IV wall were quite close to the foundation. The failure mechanisms observed in the W-O and W-III walls were similar. In the W-IV wall, the V/W ratio increased by 81% compared to the reference wall. In the W-O wall, this value increased by 61%. With W-O, O-pattern header bricks were arranged in the front wall, and the inner and outer wythes were kept at the top-middle and, to a certain extent, at the edges. In this way, a 61% V/W ratio increase was achieved, although it was not as effective as in the W-III wall. The aim here was to determine the most efficient arrangement with the optimum number of header bricks. Under these conditions, the arrangement was found to be effective. The L point on the W-IV and W-O walls was found to be 10.8% and 9.7%, respectively. W-IV exhibited a higher fracture limit. W-O exhibited medium capacity and can be said to be close to W-III. The high capacity of W-IV indicated that the four-vertical-row header brick arrangement had a significant effect on capacity.
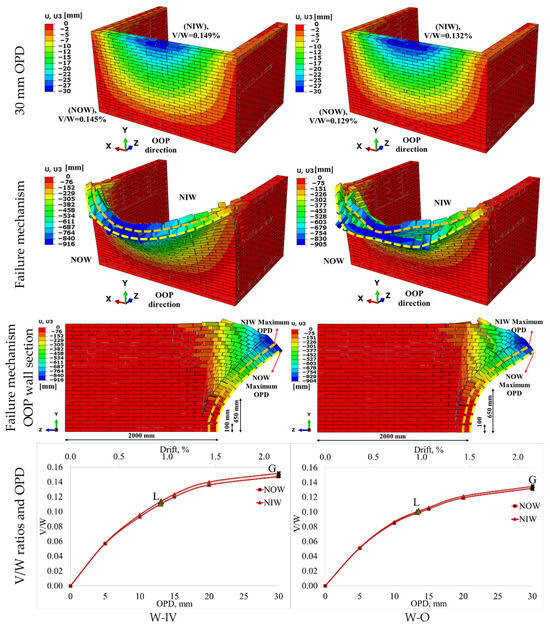
Figure 13.
Failure mechanism and V/W ratios for walls with four-vertical-row arrangement and O-pattern arranged brick (The orange and yellow dashed lines indicate the inner and outer wythes, respectively).
Significantly improved behavior was obtained in the W-IV wall in this subsection. The header brick significantly increased the resistance of this wall. The wythes moved closer. The importance of header brick arrangement was also observed in the W-O wall.
Figure 14 shows the effect of V-pattern (W-V) and A-pattern (W-A) header brick arrangement on wallop capacity. At 30 mm OPD, the displacements of the W-V wall were more distributed towards the bottom of the wall than the W-A wall. In the W-V wall, the interlocking of the top section with header bricks allowed the inner and outer wythes to relatively move together. In the W-A wall, the top sections without header bricks remained free. The stiffnesses of both walls were found to be similar, while their ultimate capacities differed. According to the results, the V/W ratio of the W-A wall was found to be higher. There was relatively little damage to the bottom part of the inner wythe on the W-V wall. However, in the W-A wall, the damage to the inner wall spread over a wider area. The reason for this is the strengthening of the interlocking between the inner and outer wythes due to the mechanical contribution of header bricks towards the bottom section of the wall. The damage levels in the side walls were close to each other. As shown in the sectional view of the W-V wall, the fracture height was observed to be higher compared to W-A. When the second fracture occurred in W-A, the interlocking between the double-wythe was found to be lower. The separate movement became more pronounced. The V/W ratio increased by 53% in the W-V wall and 74% in the W-A wall compared to the reference wall (W-N). Consequently, the header bricks located near the base of the wall were more effective. With the increase in the wall load on the header bricks, their contribution increased and provided V/W ratio increases. The V/W ratios of the W-V and W-A walls reached 9.1% and 10.4%, respectively. W-A belongs to the high strength wall models and can sustain a higher load than W-V. This indicates that the presence of header bricks closer to the foundation can delay the initiation of fracture.
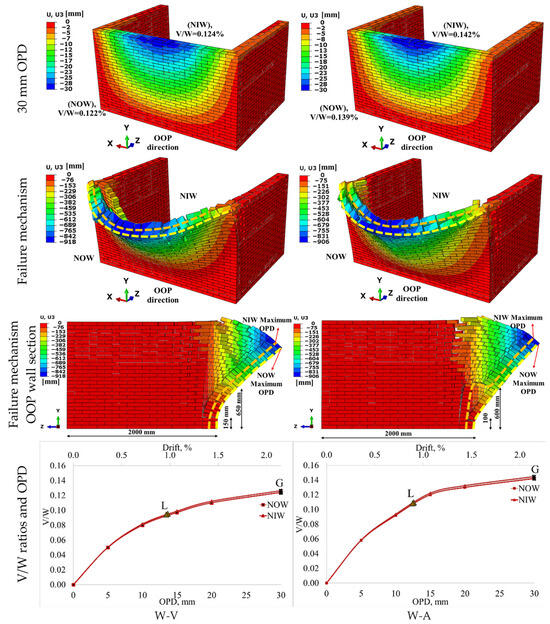
Figure 14.
Failure mechanism and V/W ratios for walls with V-pattern- and A-pattern-arranged header brick (The orange and yellow dashed lines indicate the inner and outer wythes, respectively).
This subsection examines the effect of header bricks arranged in V- and A-pattern on the upper part of the wall. The A-pattern header bricks significantly increased the wall resistance. The A-pattern improved the integrity between the wythes.
3.2. The Effect of Header Bricks on OOP Failure and the Parametric Approach Framework
V/W–displacement (pushover) curve of double-wythe brick walls changed significantly as the number and arrangement of header bricks changed. The pushover curve was an important indicator of both stiffness and overall strength.
Figure 15 shows the V/W ratio variation for all the walls investigated in this study. As shown in Figure 15a, the W-N was the reference wall without header bricks and resulted in the lowest V/W ratio. This demonstrated that if the inner and outer walls do not work in harmony, their resistance to lateral loads will decrease. As we moved from W-I to W-IV, the order and amount of header bricks increased, and the mechanical interlocking between the inner and outer wythes was strengthened. From the increase in V/W observed in W-II, W-III, and W-IV walls, the header bricks are found to be important for structural integrity. Towards the W-IV wall, the V/W ratio increased up to 73% owing to the increased and uniformly distributed header bricks. The W-IV wall with four rows of header bricks attained the highest rigidity and highest lateral load capacity. The increase in the number of header bricks between the wythes provided load transfer and allowed the wall to move as a whole.
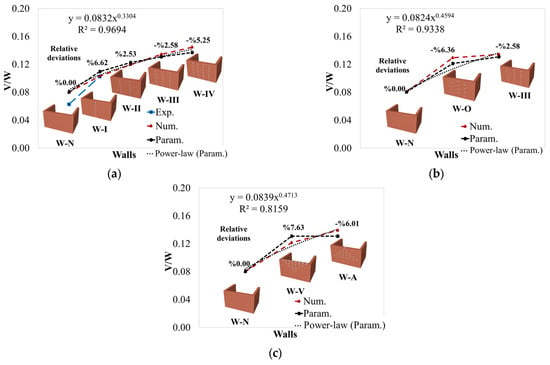
Figure 15.
Variation in V/W ratios. (a) Effect of the number of header bricks. (b) Effect of header brick in O-pattern. (c) Effect of header brick in V-pattern and A-pattern.
Figure 15b shows the variation in the geometrical pattern effect of the header bricks compared to the wall with a higher number of header bricks (W-III). In this change, a determination of the effect of the arrangement rather than the number of header bricks was attempted. In the W-O wall, the O-pattern placement of the header bricks increased the V/W ratio by approximately a factor of 1.5 compared to the reference wall. Although this marked a significant improvement over W-N, performance was lower than that of W-III. In the front wall, arranged in an O-pattern, the header bricks spread over the entire front wall. This arrangement did not provide an effective bond across the entire interlocking between the wythes. In contrast, in the W-III wall, three vertical rows of header bricks were all effective. This allowed the load transfer to take place in a more widespread and balanced manner. Regular geometric patterns were observed in W-V and W-A walls (Figure 15c). The header bricks placed in V- and A-patterns give a symmetrical arrangement in the center of the wall. Both wall models exhibited significant increases compared to the reference wall. The W-A wall had a higher V/W ratio, which might be due to the header bricks close to the bottom of the wall becoming more effective. This created a more stable bond and maximized the harmony of the walls. The reason for a relatively low capacity in the W-V wall can be attributed to the first moving part being at the top section and the low lateral load in this region. The number of header bricks in the top section had a relatively small effect compared to those in the bottom section. This comparison shows that the geometry of the arrangement is also important, in addition to the presence of header bricks.
In this study, wall capacities were estimated parametrically. Parametric studies can be obtained by modifying appropriate parameters, considering specific behaviors. In this case, the system’s response can be examined. The effect of design decisions can be evaluated, and reliable performance estimates can be obtained for various cases. Within the scope of the parametric study, the number of header bricks (n) was selected as the most important independent variable. The increase in the number of header bricks directly affects the collapse behavior and ultimate V/W ratio of the wall. The number of header bricks was considered as a multiplier, as given in Equation (5). Its effect was expressed as a power function with an exponent k. The parametric power-law coefficient k, representing the relationship between the numerical and parametric results, was determined to be 0.16. To obtain the wall’s V/W ratio () using a header brick, the reference W-N wall () without a header brick was used as a starting value. Despite the complexity of the equations, the number of header bricks was also incorporated into the capacity calculation in this study. This allowed the results derived from the parametric equations to be compared with the results. Equation (5) was derived from a limited dataset of eight numerical observations. Under these conditions, the proposed equation was valid for the wall geometry, loading condition, and material properties examined in this study. This equation should not be generalized for other wall types, mortar conditions, or loading conditions. The coefficient of determination (R2) and deviation values (in Table 2) demonstrated that this equation had an acceptable empirical fit within the examined parameter range (header brick arrangement and number).

Table 2.
Summary of the results.
Since the first and largest displacements under lateral loading occurred in the outer wythe, capacity comparisons were conducted based on this wall. This led to the development of an equation that may be employed in future studies. Another effect provided by the parametric study is the ability to quickly estimate wall capacities. To evaluate the validity of the equation, graphs are drawn in Figure 15, and the obtained values and deviations are given in Table 2. In the study, parametric estimates related to the header brick arrangement and number given in the W-I, W-II, W-III, and W-IV walls were found to be close. By evaluating the graphs, the capacities of walls with varying numbers of header bricks can be predicted based on their specific arrangement.
The W-I model exhibited a deviation of 6.6%, indicating that the parametric approach overestimated the V/W ratio compared to the numerical average of the outer wythe. Similarly, the W-II model exhibited a smaller positive deviation of 2.5%. In contrast, W-III and W-IV presented negative deviations of −2.6% and −5.3%, respectively, meaning that the parametric approach underestimated the V/W ratio for these wall types. The W-O model had a deviation of −6.4%, representing one of the largest underestimations, whereas the W-V model reached the highest positive deviation of 7.6%. Finally, the W-A model exhibited a negative deviation of −6.0%. Overall, these findings indicate that the parametric approach may either overestimate or underestimate the V/W ratio depending on the wall configuration, but the deviation was not above 8%. Figure 15 presents the deviations of the parametric approach from the numerical results, expressed as percentages. The limitations of the parametric study depend on the number of wall models. Future studies can investigate different arrangements of the header bricks.
The differences between the numerical and the parametric approach results of the models were determined using two error indicators. The absolute deviation ( and relative deviation ( were calculated according to Equations (6) and (7), respectively. These values were obtained by comparing the outcomes of the parametric equation with the numerical (NOW) results, and the computed deviations were included in Table 2 to provide a clearer assessment. The absolute and relative values for the confidence range using a parametric approach on all walls are provided in Table 2. As shown in Figure 15a, when the slope of the parametric approach was calculated for the W-N, W-I, W-II, W-III, and W-IV walls, R2 = 0.9694 was found. As shown in Figure 15b, when the W-N, W-O, and W-III walls were evaluated, R2 = 0.9338 was found, and as shown in Figure 15c, when the W-N, W-V, and W-A walls were evaluated, R2 = 0.8159 was calculated:
3.3. Discussion of Existing Applications
The OOP behavior of multi-wythe masonry walls under lateral loads, such as seismic activity, is of critical importance. There are a limited number of studies in the literature that investigate the contribution of header bricks to wall behavior. This study focused on the interlocking between wall wythes. With the exception of Açar (2022), the literature has not reported wall structures comparable to those analyzed in this study [26]. As a result, direct comparison of numerical capacity values is not possible. In his 1999 study, Tomazevic emphasized that in traditional double-wythe stone walls, the header bricks that enable the inner and outer wythes to work in harmony with each other were not constructed as required. This leads to a weakening of the structural behavior, particularly under the effect of lateral loads [88]. In one of his studies examining the relationship between URM wythes, Giuffrè (1996) experimentally and analytically investigated the effect of the spacing of header bricks on the OOP capacity of the wall [22]. The study concluded that there was a significant decrease in the OOP V/W ratio of double-wythe “opus quadratum” wythes as the number of header bricks was reduced. Giuffrè was demonstrated that sufficient header bricks are necessary for a multi-wythe wall to behave like a monolithic structure. These findings are also supported by De Felice [51]. In his numerical study, De Felice confirmed that header bricks positively contribute to the wall’s OPD capacity. These bricks prevent the wythe from separating and ensure that it acts as a uniform wall. El-Sayed et al. stated that multi-wythe masonry structures easily separated under OOP movements due to weak interlocking and that this situation caused collapse by reducing wall stiffness [89]. As a result of their experiments, the OOP load capacity increased by 30% owing to the reinforcement of the interlocking between wythes with a cement-based bonding material. Capacity increases depend not only on the presence of header bricks but also on their quality and the overall integrity of the wall wythe. In recent years, these findings were supported by Borri et al. [90]. In their study, critical factors such as material properties, wall type, brick arrangement, and the level of interlocking between wall wythes were considered when evaluating the structural quality of a wall using the Masonry Quality Index (MQI). A high MQI value indicated that the wall has structural integrity and has a lower probability of collapse. In their 2011 study on the OOP failure mechanisms of masonry walls, D’Ayala and Paganoni stated that insufficient interlocking between wall wythes significantly reduces the wall’s stiffness [91]. The existing literature clearly demonstrates that header bricks provide a significant contribution to the OOP behavior of multi-wythe masonry walls. Models with regular vertical rows were found to exhibit improved performance. The findings of the study offer a practical solution in terms of earthquake safety. Although this study focuses on the geometric and mechanical effects of header brick arrangements, future work may include an optimization framework to determine ideal arrangements and dimensions. For instance, parametric studies or AI-assisted methods such as genetic algorithms or machine learning-based surrogate models could be employed to enhance performance by minimizing stress concentration or optimizing load transfer. This type of approach could further advance engineering applications in structural wall systems. Since roof or floor diaphragm effects influence stability in real buildings, including these effects in future research is recommended.
4. Conclusions
In this study, the contribution of the arrangement and number of header bricks used in double-wythe brick walls on the lateral load performance was investigated numerically. The results were compared with the experimental data and found to be consistent. The study evaluates how header bricks enhance interlocking between the inner and outer wythes. The findings emphasize the importance of bonded header brick details in the design of URM walls under lateral load effects. According to the findings, the following conclusions were reached:
- The double-wythe wall without header bricks had the lowest V/W ratio due to the lack of interlocking between the wythes. In this wall, the inner and outer wythes moved separately, and the wall collapsed with low lateral capacity. In addition, the stiffness decreased, and the influence of local defects on the performance of the wall in the brick became more apparent.
- As the vertical rows of header bricks increased, enhanced out-of-plane behavior was attained, and higher V/W ratios were reached. This situation reveals that the capacity of the structure is directly related not only to the number of existing header bricks but also to their regular arrangement.
- The most resistant wall structure was achieved by interlocking the inner and outer wythes of the wall with four vertical rows of header bricks. The V/W ratio of this wall increased by a factor of up to 1.81 compared to the one without header bricks. A similar arching displacement pattern was observed at the inner and outer wythes.
- The O-pattern header brick arrangement in the front wall increased the V/W ratio by a factor of 1.61. In a similar arrangement, the use of three vertical rows and more header bricks increased the V/W ratio by a factor of 1.68. Accordingly, the O-pattern exhibited a 4.2% lower performance. The findings suggested that even though the header bricks were distributed over the entire wall, their contributions scaled directly with the number of bricks.
- On the front wall, the lateral load capacity of the A-pattern was found to be 14% higher than that of the V-pattern. The header bricks contributed to transferring the loads more uniformly to the wall foundation. The failure mechanisms of the two wall models were different.
- A close agreement was observed between the numerical results and the referenced experimental results.
- The use of header bricks not only increased the load capacity but also increased the stiffness and reduced the deformation. The header bricks provided a significant advantage for the walls in terms of strength and stability, especially under seismic activity.
Finally, the author suggests that in modern wall constructions, the header bricks and their arrangement need to be considered in terms of both safety and structural performance. Interlocking the header bricks close to the side walls increases out-of-plane behavior. If a certain number of header bricks were used, optimum performance could be achieved by distributing them across the entire wall, particularly near the foundation. The lack of mortar and roof load could affect the results, influencing both capacities and failure mechanisms. The proposed power-law relationship is an empirical fit that is valid only within the geometric and material parameters investigated in this study. The walls examined in this study were roofless, mortarless, and did not contain any shear studs or connecting elements. As a result, the practical applicability of the results obtained in terms of wall geometry, loading condition, and material properties should be evaluated. Future research could investigate the effects of mortar, roof loads, different boundary conditions, or irregular header brick patterns. This type of work will contribute to a better understanding of multi-wythe wall performance and guide the design.
Funding
This study received no financial support from any funding institution.
Institutional Review Board Statement
The author has nothing to report.
Informed Consent Statement
The author of the article gives their consent for publication.
Data Availability Statement
All data and materials are included in the article, tables, and graphs presented.
Conflicts of Interest
The author declares no conflicts of interest.
References
- Dazio, A. The Effect of the Boundary Conditions on the Out-of-Plane Behaviour of Unreinforced Masonry Walls. In Proceedings of the the 14th World Conference on Earthquake Engineering, Beijing, China, 12 October 2008. [Google Scholar]
- Kıpçak, F.; Erdil, B. Yığma Yapıların Düzlem Dışı Davranışlarına Yan Duvarın ve Yan Duvar Boşluğunun Etkisi. Niğde Ömer Halisdemir Üniversitesi Mühendislik Bilim. Derg. 2023, 12, 853–860. [Google Scholar] [CrossRef]
- Atailia, S.; Meftah, S.A.; Fouchal, F.; Laib, S. eddine Dynamic Homogenization Approach for In-Plane and out-of-Plane Linear Vibration Analysis of Masonry Wall Structures. Struct. Des. Tall Spec. Build. 2020, 29, e1802. [Google Scholar] [CrossRef]
- Anas, S.; Alam, M.; Umair, M. Behavior and Damage Assessment of Monolithic and Non-Monolithic Braced Masonry Walls Subjected to Blast Loadings Using a Detailed Micro-Modeling. Int. J. Mason. Res. Innov. 2022, 434, 02034. [Google Scholar]
- Shi, Y.; D’Ayala, D.; Prateek, J. Analysis of Out-of-Plane Damage Behaviour of Unreinforced Masonry Walls. In Proceedings of the 14th International Brick & Block Masonry Conference, Sydney, Australia, 13–20 February 2008; pp. 2–17. [Google Scholar]
- Budak, A.; Uysal, H.; Aydin, A.C. Kırsal Yapıların Deprem Karşısındaki Davranışı. Atatürk Üniversitesi Ziraat Fakültesi Derg. 2004, 35, 3–4. [Google Scholar]
- Gençer, F.; Hamamcıoğlu Turan, M.; Vardaroğlu, M.; Aktaş, E. Evaluation of Structural Strength of Two Hellenistic Towers in Alinda, Latmos and Caria. In Proceedings of the Uluslararası Katılımlı 6. Tarihi Yapıların Korunması ve Güçlendirilmesi Sempozyumu, Ortahisar, Türkiye, 2–4 November 2017. [Google Scholar]
- Kıpçak, F. Tilting Table Experiments to Determine the Out-of-Plane Behavior of Masonry Structures Which Side Wall Hollow Is Constructed from Brick. Master’s Thesis, Van Yüzüncü Yıl Üniversitesi Fen Bilimleri Enstitüsü, Van, Türkiye, 2018. [Google Scholar]
- Erdik, M.; Demircioğlu, M.; Beyen, K.; Şeşetyan, K.; Aydınoğlu, N.; Gul, M.; Siyahi, B.; Önem, G.; Tüzün, C.; Salkın, A.; et al. May 01, 2003 Bingöl (Turkey) Earthquake; Bogazici University: İstanbul, Türkiye, 2003. [Google Scholar]
- Bakır, S.; Canbay, E.; Erberik, A.; Gülerce, Z.; Aldemir, A.; Demirel, İ.O. 8 Mart 2010 Bașyurt-Karakoçan (Elazığ) Depremi Ön İnceleme Raporu; Middle East Technical University, Earthquake Engineering Research Center: Ankara, Türkiye, 2010. [Google Scholar]
- Paruta, V.A.; Zade, N.; Davis, R.; Sarkar, P. Experimental Investigation of Autoclaved Aerated Concrete Masonry. Mag. Civ. Eng. 2014, 47, 48–55. [Google Scholar] [CrossRef]
- Cancellara, D.; De Angelis, F.; Pasquino, V. Characterization of an Autoclaved Aerated Concrete Building with Respect to a Similar Unreinforced Masonry Structure. Adv. Mat. Res. 2012, 476–478, 847–858. [Google Scholar] [CrossRef]
- Kalali, A.; Kabir, M.Z. Experimental Response of Double-Wythe Masonry Panels Strengthened with Glass Fiber Reinforced Polymers Subjected to Diagonal Compression Tests. Eng. Struct. 2012, 39, 24–37. [Google Scholar] [CrossRef]
- Fallahi, M.; Sayyar Roudari, S.; Haghighifar, M.; Madandoost, R.; Sayyar Roudsari, S.; Fallahi in Structural, M. Modeling of Reinforced Concrete Frames with Infill Walls under Cyclic Loading Strengthening with CFRP. Am. J. Eng. Appl. Sci. 2018, 11, 1086–1099. [Google Scholar] [CrossRef]
- Turer, A.; Korkmaz, S.Z.; Korkmaz, H.H. Performance Improvement Studies of Masonry Houses Using Elastic Post-Tensioning Straps. Earthq. Eng. Struct. Dyn. 2007, 36, 683–705. [Google Scholar] [CrossRef]
- Turer, A.; Golalmis, M.; Korkmaz, H.H.; Korkmaz, S.Z. Tilting Table Tests on Strengthened Masonry Houses. In Proceedings of the Advances in Structural Engineering and Mechanics (ASEM13), Jeju, Korea, 8–12 September 2013. [Google Scholar]
- Mahmood, H.; Ingham, J.M. Diagonal Compression Testing of FRP-Retrofitted Unreinforced Clay Brick Masonry Wallettes. J. Compos. Constr. 2011, 15, 810–820. [Google Scholar] [CrossRef]
- Ghaderi, M.; Maleki, V.; Andalibi, K. Retrofitting of Unreinforced Masonry Walls under Blast Loading by FRP and Spray on Polyurea. Cumhur. Sci. J. 2015, 36, 462–477. [Google Scholar]
- Akansel, V.; Ameri, G.; Askan, A.; Caner, A.; Erdil, B.; Kale, Ö.; Okuyucu, D. The 23 October 2011 Mw7.0 van (Eastern Turkey) Earthquake: Interpretations of Recorded Strong Ground Motions and Post-Earthquake Conditions of Nearby Structures. Earthq. Spectra 2014, 30, 657–682. [Google Scholar] [CrossRef]
- Yön, B.; Onat, O.; Öncü, M.E.; Karaşin, A. Failures of masonry dwelling triggered by East Anatolian Fault earthquakes in Turkey. Soil Dyn. Earthq. Eng. 2020, 133, 106126. [Google Scholar] [CrossRef]
- Kalafat, D.; Zülfikar, C.; Vuran, E.; Kamer, Y. 8 Mart 2010 Başyurt–Karakoçan (Elazığ) Depremi Ön İnceleme Raporu; Boğaziçi University Kandilli Observatory and Earthquake Research Institute: Istanbul, Türkiye, 2010. [Google Scholar]
- Giuffré, A. A Mechanical Model for Statics and Dynamics of Historical Masonry Buildings. In Protection of the Architectural Heritage Against Earthquakes; Springer: Vienna, Austria, 1996; pp. 71–152. [Google Scholar] [CrossRef]
- Erdil, B.; Tapan, M.; Akkaya, İ.; Korkut, F. Effects of Structural Parameters on Seismic Behaviour of Historical Masonry Minaret. Period. Polytech. Civ. Eng. 2018, 62, 148–161. [Google Scholar] [CrossRef]
- Alforno, M.; Venuti, F.; Monaco, A.; Calderini, C. Numerical Investigation of the Influence of Constructive Aspects on the Structural Behaviour of Masonry Cross Vaults. Int. J. Archit. Herit. 2023, 17, 868–891. [Google Scholar] [CrossRef]
- Szabó, S.; Funari, M.F.; D’Altri, A.M.; de Miranda, S.; Lourenço, P.B. An Optimised Multi-Level Method for the Pushover Analysis of Historic Masonry Structures Accounting for the Actual Masonry Pattern. Comput. Struct. 2025, 310, 107656. [Google Scholar] [CrossRef]
- Açar, E. Determination of the Effect of the Location and Density of the Header Brick in Double-Wall Walls with the Help of Bending Table. Master’s Thesis, Van Yüzüncü Yıl University Institute of Science and Technology, Van, Türkiye, 2022. [Google Scholar]
- Erdil, B.; Kıpçak, F.; Tapan, M. Out-of-Plane Behavior of Dry-Stack Brick Masonry Walls. Struct. Des. Tall Spec. Build. 2024, 33, e2089. [Google Scholar] [CrossRef]
- Al-Zuhairi, A.H.; Ahmed, A.R. Height-to-Length Ratio Effect on The Response of Unreinforced Masonry Wall Subjected to Vertical Load Using Detailed-Micro Modeling Approach. Int. J. Sci. Res. 2018, 7, 1456–1462. [Google Scholar]
- Restrepo-Vélez, L.F.; Magenes, G.; Griffith, M.C. Dry Stone Masonry Walls in Bending-Part I: Static Tests. Int. J. Archit. Herit. 2014, 8, 1–28. [Google Scholar] [CrossRef]
- Ahani, E.; Mousavi, M.N.; Ahani, A.; Kheirollahi, M. The Effects of Amount and Location of Openings on Lateral Behavior of Masonry Infilled RC Frames. KSCE J. Civ. Eng. 2019, 23, 2175–2187. [Google Scholar] [CrossRef]
- Drougkas, A.; Roca, P.; Molins, C. Experimental Analysis and Detailed Micro-Modeling of Masonry Walls Subjected to in-Plane Shear. Eng. Fail. Anal. 2019, 95, 82–95. [Google Scholar] [CrossRef]
- Usta, P. Investigation of a Base-Isolator System’s Effects on the Seismic Behavior of a Historical Structure. Buildings 2021, 11, 217. [Google Scholar] [CrossRef]
- Ahmed, H.A.; Shahzada, K. Numerical Modeling of Confined Brick Masonry Structures with Parametric Analysis and Energy Absorption Calculation. Int. J. Prot. Struct. 2021, 12, 129–152. [Google Scholar] [CrossRef]
- Korkmaz, S. Kırsal Konutların Deprem Güvenliğinin Arttırılması. Ph.D. Thesis, Selçuk Üniversitesi Fen Bilimleri Enstitüsü, Konya, Türkiye, 2007. [Google Scholar]
- Hossain, A.; Totoev, Y.Z.; Masia, M.J. Experimental Investigation of Frictional Behavior of Mortarless Surface in Semi-Interlocking Masonry under Cyclic Displacement. J. Mater. Civ. Eng. 2020, 32, 04020259. [Google Scholar] [CrossRef]
- Shi, T.; Zhang, X.; Hao, H.; Chen, C. Experimental and Numerical Investigation on the Compressive Properties of Interlocking Blocks. Eng. Struct. 2021, 228, 111561. [Google Scholar] [CrossRef]
- Kıpçak, F.; Erdil, B. Effect of Adobe Wall Shapes and Openings on Out-of-Plane Behavior. Structures 2025, 77, 109090. [Google Scholar] [CrossRef]
- Maccarini, H.; Vasconcelos, G.; Rodrigues, H.; Ortega, J.; Lourenço, P.B. Out-of-Plane Behavior of Stone Masonry Walls: Experimental and Numerical Analysis. Constr. Build. Mater. 2018, 179, 430–452. [Google Scholar] [CrossRef]
- Al Shawa, O.; de Felice, G.; Mauro, A.; Sorrentino, L. Out-of-Plane Seismic Behaviour of Rocking Masonry Walls. Earthq. Eng. Struct. Dyn. 2012, 41, 949–968. [Google Scholar] [CrossRef]
- Candeias, P.X.; Campos Costa, A.; Mendes, N.; Costa, A.A.; Lourenço, P.B. Experimental Assessment of the Out-of-Plane Performance of Masonry Buildings Through Shaking Table Tests. Int. J. Archit. Herit. 2017, 11, 31–58. [Google Scholar] [CrossRef]
- Casapulla, C.; Argiento, L.U. The Comparative Role of Friction in Local Out-of-Plane Mechanisms of Masonry Buildings. Pushover Analysis and Experimental Investigation. Eng. Struct. 2016, 126, 158–173. [Google Scholar] [CrossRef]
- Deng, M.; Yang, S. Experimental and Numerical Evaluation of Confined Masonry Walls Retrofitted with Engineered Cementitious Composites. Eng. Struct. 2020, 207, 110249. [Google Scholar] [CrossRef]
- Garcia-Ramonda, L.; Pelá, L.; Roca, P.; Camata, G. In-Plane Shear Behaviour by Diagonal Compression Testing of Brick Masonry Walls Strengthened with Basalt and Steel Textile Reinforced Mortars. Constr. Build. Mater. 2020, 240, 117905. [Google Scholar] [CrossRef]
- Smoljanović, H.; Živaljić, N.; Nikolić, Ž.; Munjiza, A. Numerical Analysis of 3D Dry-Stone Masonry Structures by Combined Finite-Discrete Element Method. Int. J. Solids Struct. 2018, 136–137, 150–167. [Google Scholar] [CrossRef]
- Savalle, N.; Lourenço, P.B.; Milani, G. Joint Stiffness Influence on the First-Order Seismic Capacity of Dry-Joint Masonry Structures: Numerical DEM Investigations. Appl. Sci. 2022, 12, 2108. [Google Scholar] [CrossRef]
- Koudje, B.; Adjovi, E. Numerical Simulation of a Shear Wall Model in Interlocking Masonry with Dry Vertical and Horizontal Joints in Compressed Earth Blocks. Buildings 2025, 15, 627. [Google Scholar] [CrossRef]
- Oktiovan, Y.P.; Messali, F.; Pulatsu, B.; Lemos, J.V.; Rots, J.G. A Contact-Based Constitutive Model for the Numerical Analysis of Masonry Structures Using the Distinct Element Method. Comput. Struct. 2024, 303, 107499. [Google Scholar] [CrossRef]
- Hothot, Y.M.; Doran, B.; Dinç-şengönül, B.; Karslıoğlu, M.; Ulukaya, S.; Yüzer, N. Experimental and Numerical Investigation on Strengthening Techniques for Double-Wythe Stone Masonry Walls. Turk. J. Civ. Eng. 2025, 36, 1–34. [Google Scholar] [CrossRef]
- Pulatsu, B.; Gencer, F.; Erdogmus, E. Study of the Effect of Construction Techniques on the Seismic Capacity of Ancient Dry-Joint Masonry Towers through DEM. Eur. J. Environ. Civ. Eng. 2022, 26, 3913–3930. [Google Scholar] [CrossRef]
- Alejano, L.R.; Pérez-Rey, I.; Muñiz-Menéndez, M.; Ding, B. Dry Masonry Retaining Walls: Physical Models and Comparison with Analytical and Numerical Approaches. Rock Mech. Rock Eng. 2025, 1–25. [Google Scholar] [CrossRef]
- de Felice, G. Out-of-Plane Seismic Capacity of Masonry Depending on Wall Section Morphology. Int. J. Archit. Herit. 2011, 5, 466–482. [Google Scholar] [CrossRef]
- Çavuşlu, M. Assessing Seismic Crack Performance of Diyarbakır Çüngüş Masonry Stone Bridge Considering 2023 Kahramanmaraş, Hatay, Malatya, Gaziantep Earthquakes. Bitlis Eren Üniversitesi Fen Bilim. Derg. 2023, 12, 544–556. [Google Scholar] [CrossRef]
- Chácara, C.; Mendes, N.; Lourenço, P.B. Simulation of Shake Table Tests on Out-of-Plane Masonry Buildings. Part (IV): Macro and Micro FEM Based Approaches. Int. J. Archit. Herit. 2017, 11, 103–116. [Google Scholar] [CrossRef]
- Lourenço, P. Analysis of Masonry Structures with Interface Elements; Delft University of Technology: Delft, The Netherlands, 1994. [Google Scholar]
- Shing, P.B.; Schuller, M.; Hoskere, V.S. In-Plane Resistance of Reinforced Masonry Shear Walls. J. Struct. Eng. 1990, 116, 619–640. [Google Scholar] [CrossRef]
- Senthivel, R.; Lourenço, P.B. Finite Element Modelling of Deformation Characteristics of Historical Stone Masonry Shear Walls. Eng. Struct. 2009, 31, 1930–1943. [Google Scholar] [CrossRef]
- Lourenço, P.B.; Rots, J.G. Multisurface Interface Model for Analysis of Masonry Structures. J. Eng. Mech. 1997, 123, 660–668. [Google Scholar] [CrossRef]
- Laftah Abbas, A.; Saeed, M.H. Representation of The Masonry Walls Techniques by Using FEM. Aust. J. Basic Appl. Sci. 2017, 11, 39–48. [Google Scholar]
- Ahmad, S.; Khan, R.; Gupta, H. Seismic Performance of a Masonry Heritage Structure. Int. J. Eng. Adv. Technol. 2014, 3, 335–340. [Google Scholar]
- Abdulla, K.F.; Cunningham, L.S.; Gillie, M. Non-Linear FE Modelling of Plain and CFRP Strengthened Masonry Panels under out-of-Plane Loads. Mason. Int. 2018, 30, 61–70. [Google Scholar]
- Arya, S.K.; Hegemier, G.A. On Nonlinear Response Predictions of Concrete Masonry Assemblies. In Proceedings of the North American Masonry Conference, Boulder, CO, USA, 14–16 August 1978. [Google Scholar]
- Page, A.W. Finite Element Model for Masonry. J. Struct. Eng. 1978, 104, 1267–1285. [Google Scholar] [CrossRef]
- Roca, P.; Cervera, M.; Gariup, G.; Pela’, L. Structural Analysis of Masonry Historical Constructions. Classical and Advanced Approaches. Arch. Comput. Methods Eng. 2010, 17, 299–325. [Google Scholar] [CrossRef]
- Işık, E.; Antep, B.; Karaşin, İ.B. Structural Analysis of Ahlat Emir Bayındır Bridge. Bitlis Eren Univ. J. Sci. Technol. 2018, 8, 11–18. [Google Scholar] [CrossRef][Green Version]
- Mendes, N.; Lourenço, P.B.; Campos-Costa, A. Shaking Table Testing of an Existing Masonry Building: Assessment and Improvement of the Seismic Performance. Earthq. Eng. Struct. Dyn. 2014, 43, 247–266. [Google Scholar] [CrossRef]
- Malomo, D.; Pinho, R.; Penna, A. Simulating the Shake Table Response of Unreinforced Masonry Cavity Wall Structures Tested to Collapse or Near-Collapse Conditions. Earthq. Spectra 2020, 36, 554–578. [Google Scholar] [CrossRef]
- Paunović, S.; Šutanovac, A.; Blagojević, P. An Alternative Numerical Model for Fiber Reinforced Concrete Strength Evaluation. Facta Univ. Ser. Archit. Civ. Eng. 2022, 20, 213–230. [Google Scholar] [CrossRef]
- Kıpçak, F.; Erdil, B.; Tapan, M.; Karaşin, A. The Effect of Voids on Flexural Capacity of Reinforced Concrete Slabs. Period. Polytech. Civ. Eng. 2023, 67, 1048–1065. [Google Scholar] [CrossRef]
- Vacev, T.; Zorić, A.; Grdić, D.; Ristić, N.; Grdić, Z.; Milić, M. Experimental and Numerical Analysis of Impact Strength of Concrete Slabs. Period. Polytech. Civ. Eng. 2023, 67, 325–335. [Google Scholar] [CrossRef]
- Abdulla, K.F.; Cunningham, L.S.; Gillie, M. Simulating Masonry Wall Behaviour Using a Simplified Micro-Model Approach. Eng. Struct. 2017, 151, 349–365. [Google Scholar] [CrossRef]
- Zienkiewicz, O.; Taylor, R.; Zhu, J.Z. The Finite Element Method: Its Basis and Fundamentals, 7th ed.; Butterworth-Heinemann: Oxford, UK, 2013. [Google Scholar]
- Hashim, N.; Coombs, W.; Hattori, G.; Augarde, C. Comparison of Implicit and Explicit Methods for Non-Ordinary State-Based Peridynamics for Quasi-Static Problems. In Proceedings of the 28th International Workshop on Computational Mechanics of Materials (IWCMM28), Glasgow, UK, 10–12 September 2018. [Google Scholar]
- Simulia. ABAQUS 2016 User’s Guide; Dassault Systems Simulia Corporation: Johnston, RI, USA, 2016; Available online: http://130.149.89.49:2080/v2016/books/usb/default.htm?startat=pt01.html (accessed on 25 November 2025).
- Moradi, N.; Yazdani, M.; Janbozorgi, F.; Hashemi, S.J. In-Plane Seismic Performance of Historical Masonry Walls with Various Brick Bond Patterns Using Micro-Modeling Approach. Asian J. Civ. Eng. 2024, 25, 4863–4876. [Google Scholar] [CrossRef]
- TS EN 772-1; Methods of Test for Mortar for Masonry Units—Part 1: Determination of Compressive Strength. Turkish Standards Institution: Ankara, Turkey, 2012.
- Mohamad, A.B.A.E.; Chen, Z. Experimental and Numerical Analysis of the Compressive and Shear Behavior for a New Type of Self-Insulating Concrete Masonry System. Appl. Sci. 2016, 6, 245. [Google Scholar] [CrossRef]
- Abbas, A.L.; Saeed, M.H. Simulation Two Storey House of Masonry Wall under the Earthquake Load. Diyala J. Eng. Sci. 2019, 12, 1–12. [Google Scholar] [CrossRef]
- Abasi, A.; Hassanli, R.; Vincent, T.; Manalo, A. Influence of Prism Geometry on the Compressive Strength of Concrete Masonry. Constr. Build. Mater. 2020, 264, 120182. [Google Scholar] [CrossRef]
- Agüera, N.D.; Tornello, M.E.; Frau, C.D. Structural Response of Unreinforced Masonry Walls. J. Civ. Eng. Archit. 2016, 10, 219–231. [Google Scholar] [CrossRef][Green Version]
- D’Altri, A.M.; de Miranda, S.; Castellazzi, G.; Sarhosis, V. A 3D Detailed Micro-Model for the in-Plane and out-of-Plane Numerical Analysis of Masonry Panels. Comput. Struct. 2018, 206, 18–30. [Google Scholar] [CrossRef]
- Annecchiarico, M.; Portioli, F.; Landolfo, R. Micro and Macro-Finite Element Modeling of Brick Masonry Panels Subject to Lateral Loadings. Available online: https://www.researchgate.net/publication/289195463_Micro_and_macro-finite_element_modeling_of_brick_masonry_panels_subject_to_lateral_loadings (accessed on 5 November 2023).
- Savalle, N.; Vincens, É.; Hans, S. Experimental and Numerical Studies on Scaled-down Dry-Joint Retaining Walls: Pseudo-Static Approach to Quantify the Resistance of a Dry-Joint Brick Retaining Wall. Bull. Earthq. Eng. 2020, 18, 581–606. [Google Scholar] [CrossRef]
- Kıpçak, F.; Erdil, B. Experimental Evaluation of Multi-Layer Brick and Adobe Materials. Adıyaman Üniversitesi Mühendislik Bilim. Derg. 2025, 12, 266–280. [Google Scholar]
- Pulatsu, B.; Erdogmus, E.; Lourenço, P.B.; Lemos, J.V.; Tuncay, K. Simulation of the In-Plane Structural Behavior of Unreinforced Masonry Walls and Buildings Using DEM. Structures 2020, 27, 2274–2287. [Google Scholar] [CrossRef]
- Taforel, P.; Dubois, F.; Pagano, S. Evaluation of Numerical Uncertainties on the Modeling of Dry Masonry Structures Submitted to Out-of-Plane Loading, Using the NSCD Method in Comparison with Experimental Test. In Proceedings of the European Congress on Computational Methods in Applied Sciences and Engineering (ECCOMAS 2012), Vienna, Austria, 10 September 2012; Volume 19, p. 806832. [Google Scholar]
- Kaushik, H.B.; Rai, D.C.; Jain, S.K. Stress-Strain Characteristics of Clay Brick Masonry under Uniaxial Compression. J. Mater. Civ. Eng. 2007, 19, 728–739. [Google Scholar] [CrossRef]
- Gençer, F. Impact of Iron Clamps and Dowels on the Vulnerability of Ancient Masonry Walls. Sak. Univ. J. Sci. 2024, 28, 844–854. [Google Scholar] [CrossRef]
- Tomazevic, M. Earthquake-Resistant Design of Masonry Buildings; Imperial College Press: London, UK, 1999; Volume 1, ISBN 978-1-86094-066-8. [Google Scholar]
- El-Sayed, T.; Ghanem, G.M.; Salama, A. Seismic Retrofitting of Historic Multi-Wythe Stone Masonry Walls under out-of-Plane Loading. In Proceedings of the 26th Conference on Our World in Concrete & Structures, Singapore, 27–28 August 2001; pp. 209–216. [Google Scholar]
- Borri, A.; Corradi, M.; De Maria, A. The Failure of Masonry Walls by Disaggregation and the Masonry Quality Index. Heritage 2020, 3, 1162–1198. [Google Scholar] [CrossRef]
- D’Ayala, D.; Paganoni, L. Out-of-Plane Failure Mechanisms of Masonry Walls: A Comprehensive Review. In Proceedings of the 8th International Conference on Structural Analysis of Historical Constructions, Wroclaw, Poland, 15–17 October 2012; Volume 2, pp. 1113–1122. [Google Scholar]
Disclaimer/Publisher’s Note: The statements, opinions and data contained in all publications are solely those of the individual author(s) and contributor(s) and not of MDPI and/or the editor(s). MDPI and/or the editor(s) disclaim responsibility for any injury to people or property resulting from any ideas, methods, instructions or products referred to in the content. |
© 2025 by the author. Licensee MDPI, Basel, Switzerland. This article is an open access article distributed under the terms and conditions of the Creative Commons Attribution (CC BY) license (https://creativecommons.org/licenses/by/4.0/).