Article

Design Spectra for Evaluating the Dynamic Response of Buildings Under Thunderstorm Downbursts

by
Jing Song
1,
Pedro Martinez-Vazquez
1,* and
Konstantinos Skalomenos
1,2
1
Department of Civil Engineering, School of Engineering, University of Birmingham, Birmingham B15 2TT, UK
2
Department of Civil Engineering, School of Engineering, University of West Attica, 122 41 Athens, Greece
*
Author to whom correspondence should be addressed.
Buildings 2025, 15(23), 4305; https://doi.org/10.3390/buildings15234305
Submission received: 22 October 2025 / Revised: 18 November 2025 / Accepted: 23 November 2025 / Published: 27 November 2025
(This article belongs to the Section Building Structures)

Abstract

This paper presents a spectral method to determine the effect of thunderstorm downbursts on structures. The method integrates the dynamic response of single oscillators subject to input accelerations induced by wind, based on classical earthquake engineering theory and the proper characterisation of turbulence. The method validates previous works on synoptic wind, enabled to conduct a parametric analysis to scrutinise its dependence on outflow gust velocity, mechanical and dynamical properties of the structure, and variations in the damping ratio and terrain categories. The design spectra for thunderstorm downbursts were used to estimate the dynamic performance of a high-rise building and the results obtained showed consistency with separate numerical approaches. The proposed method offers an alternative for the rapid and effective evaluation of structural performance under thunderstorm downbursts and could expand to cover other wind environments.

1. Introduction

The destructive effect of thunderstorm (TS) downbursts on structures continues raising concerns due to its impact on the safety and integrity of infrastructure. The highest microburst wind, recorded in 1983 at Andrew Air Force Base, reached 150 mph [1], falling in the range EF3 (Enhanced Fujita scale) labelled as a cause of severe damage. Previous studies on TS events have enabled distinguishing such a regime from synoptic winds as being statistically non-stationary and highly unsteady. During TS, the peak velocity manifests between 30 m and 100 m above the ground [2,3] generating turbulence that covers the height of most civil engineering infrastructure. Therefore, the study of the wind actions on structures induced by the downburst outflows, however rare, becomes crucial for wind engineering design.
Typically, TS downbursts start to build at the dense air high-up region, to then undergo downward acceleration that fuels a strong downdraft that subsequently hits the ground [2]. A large vortex occurs at the edge of this downdraft due to the unstable shear layer between the downward airflow and quiescent environment. The induced high-pressure region in the impinging point pushes this airflow to spread out, which produces a radiating accelerated outflow near the ground, accompanied by a large vortex in front of the outflow. During this process, the unsteady separation of the large vortex interacts with the ground friction, causing further descending vorticity [4]. These mechanisms induce the instantaneous increase in wind velocities near the ground and a second peak during the storm, as shown in Figure 1.
Researchers that have studied the phenomenon illustrated in Figure 1 acknowledge the uncertainties and challenges associated with its complex mechanics [5,6,7,8,9,10]. However, the limited number of existing time recordings leaves no option but to model TS downbursts and their interaction with structures, based on approximations. Choi and Hidayat [8] have revisited the combined gust response factor with a time-dependent running mean filter technique to calculate the response of a single-degree-of-freedom (SDOF) system. Chen and Letchford [11] proposed a peak dynamic magnification factor that depends on the maximum dynamic response and natural frequency of the system. Separately, Holmes et al. [9] determined an ensemble of dynamic response factors with varying structural parameters for one typical TS record, which extended from the transient earthquake engineering theory, whereas Chay and Albermani [5] adopted dynamic response factors to investigate the performance of a SDOF system with a variety of mechanic and aerodynamic properties.
More recently, Chen [7] addressed the time-varying mean and root mean square displacement response using the linear acceleration step-by-step integration method under the developed transient wind time history built in the frequency domain. Solari [12] identified a TS spectra method built in the time–frequency domain derived from the traditional spectral method used for earthquakes and addressed the partially coherent wind loading acting on structures. Kareem et al. [13] suggested a generalised non-stationary wind loading chain mapped from Davenport’s chain, originally developed for synoptic winds [14]. This required the merging of evolutionary power spectral density (EPSD) and wavelet analysis to address the relationship of wind force system response in the time–frequency domain. Further work by Peng et al. [15] studied the time-varying coherence of non-stationary wind and its effect on the dynamic response on buildings. Their conclusions highlight differences with the time-invariant coherence implemented in previous studies by Chen and Letchford [6] and Solari [10]. This was followed by studies by Le and Caracoglia [16] who formulated a numerical model to investigate the dynamic response of a tall building under transverse winds. Based on previous research, Kwon and Kareem [17] put forward a new approach of the gust-front factor for the codification of design wind loading induced by TS downbursts. That method considers the typical vertical velocity profile and the non-stationary and transient aerodynamic characteristics of such wind events with four factors: kinematic effects, pulse dynamics, structural dynamics, and load modification factors [18].
With the aid of full-scale measurements, stochastic simulation techniques were developed, such as those reported in Chen and Letchford [6], Chen [7], and Solari et al. [19], based on the theoretical velocity profile [20,21,22,23,24,25,26]. Chen and Letchford [6] suggested a hybrid model that combines deterministic mean and a stochastic fluctuation, which yields a uniformly modulated EPSD function with assumed stationary Gaussian distribution [27]. Solari et al. [19] proposed a separate hybrid simulation technique using Monte Carlo techniques, merged with full-scale downburst records. The state of the art seems constrained by specific yet fragmented techniques for modelling outflow wind fields, which highlights the necessity for further research into understanding the potential impact that TS wind regimes could have on infrastructure.
On the other hand, the short duration and instantaneous properties of the downburst outflows lead to similarities with earthquake loads, which are often evaluated by the response spectra technique [28,29,30]. In this framework, the proposed thunderstorm downburst wind design spectra (TWDS) method in this paper merges the classical earthquake theory with a refined characterisation of wind loads [31,32]. Previous studies have developed wind design spectra (WDS) tailored to synoptic winds [33,34], and that theory is now extended to cover TS downbursts. In that sense, the present investigation revisits the verified wind design spectra subjected to stationary wind in Martinez-Vazquez's study [34] to embed the key characteristics of the TS downbursts, such as the nose-shaped wind profile, spectral density, and reduced turbulence functions. The merit of this extended method relates to its structured methodology and potential for industrial applications.
This proposed method revisits the verified wind design spectra subjected to stationary wind developed by Martinez-Vazquez [34] to tailor the method for TS downbursts. To this end, we consider the power spectral density (PSD) of the reduced turbulent fluctuations instead of the reduced turbulent fluctuating velocity, assuming that the time function of the turbulence intensity is constant in the applied decomposition algorithm of the wind velocity, which aligns with [35]. The spectral method reflects the interaction between the structural performance and aerodynamic properties of the downburst outflow, aiming at accurately estimate the building’s response under transient non-stationary winds.
The paper is organised as follows: Section 2 discusses the nature of TS downbursts. Section 3 presents the methodology for developing TWDS, examines its governing parameters, and explores its application to a high-rise building. Section 4 offers a detailed comparison between the results obtained through TWDS and those generated through step-by-step integration and a numerical simulation, while Section 5 summarises the key findings and identifies further research avenues.

2. Thunderstorm Downburst Wind Flow

Researchers have inferred the main characteristics of the downburst outflow based on full-scale measurements [36,37,38,39,40]. The velocity time history of such events can be considered as the sum of the slowly varying mean wind velocity related to the low-frequency component and a residual fluctuating turbulence, regarded as a non-stationary random process. The fluctuation caused by small-scale turbulence is modelled as a rapidly varying stationary signal with zero mean and unit standard deviation [10,36], which resembles processes that characterise high-frequency fluctuating components of stationary winds. Accordingly, the total instantaneous horizontal velocity and its residual component can be estimated with Equation (1) and Equation (2), respectively, which in turn can merge as in Equation (3).
U ( z , t ) = U ¯ ( z , t ) + u ( z , t )
u z , t = σ u ( z , t ) u ~ ( z , t )
U ( z , t ) = U ¯ ( z , t ) 1 + I u ( z , t ) u ~ ( z , t )
In these equations, U ¯ is the slowly varying mean wind velocity, z is the height above the ground, and u is the high-frequency residual fluctuating velocity [37,38,39,41]. In Equation (2), σ u is the slowly varying standard deviation, often expressed in terms of U ¯ and the turbulence intensity, I u , i.e., σ u = I u U ¯ , whereas u ~ is the reduced turbulent fluctuation. In this framework, the residual fluctuation ( u ) is assumed to be independent of the turbulence intensity, as inferred through the analysis of 129 recorded TS events by Roncallo and Solari [42].
To simplify these equations, a non-dimensional vertical shape function of horizontal wind α z = U ¯ m a x z / U ¯ m a x ( r ) , as well as a non-dimensional time function of horizontal wind γ t = U ¯ z , t / U ¯ m a x ( z ) is defined. In these expressions, U ¯ m a x is the maximum slowly varying mean wind velocity, z is the height above the ground, and r is the reference height. Therefore, the slowly varying mean velocity can be expressed as in Equation (4) [10].
U ¯ z , t = U ¯ m a x ( r ) α z γ t
Given the nose-shaped profile of TS outflow, the algorithm originally developed to reproduce the atmospheric boundary layer (ABL) becomes redundant. For this reason, analytical models describing the vertical profile of horizontal velocity tailored to TS outflow have been proposed [20,21,23,26]. In this investigation, we adopt the function for the vertical velocity profile of horizontal wind proposed by Wood et al. [26]. This model is given in Equation (5).
U ¯ z , t = U ¯ m a x ( r ) × ( z r ) 1 6 1 erf 0.7 z δ 1 erf 0.7 r δ × γ t
In this equation, δ is the height where the velocity is equal to half its maximum value, i.e., U ¯ m a x δ = 0.5 U ¯ p e a k , U ¯ p e a k is the peak value of U ¯ m a x along z , and erf is the error function. The method uses a value of δ equal to 6 z U ¯ p e a k , where z U ¯ p e a k is the height for the peak value of the slowly varying mean velocity along z .
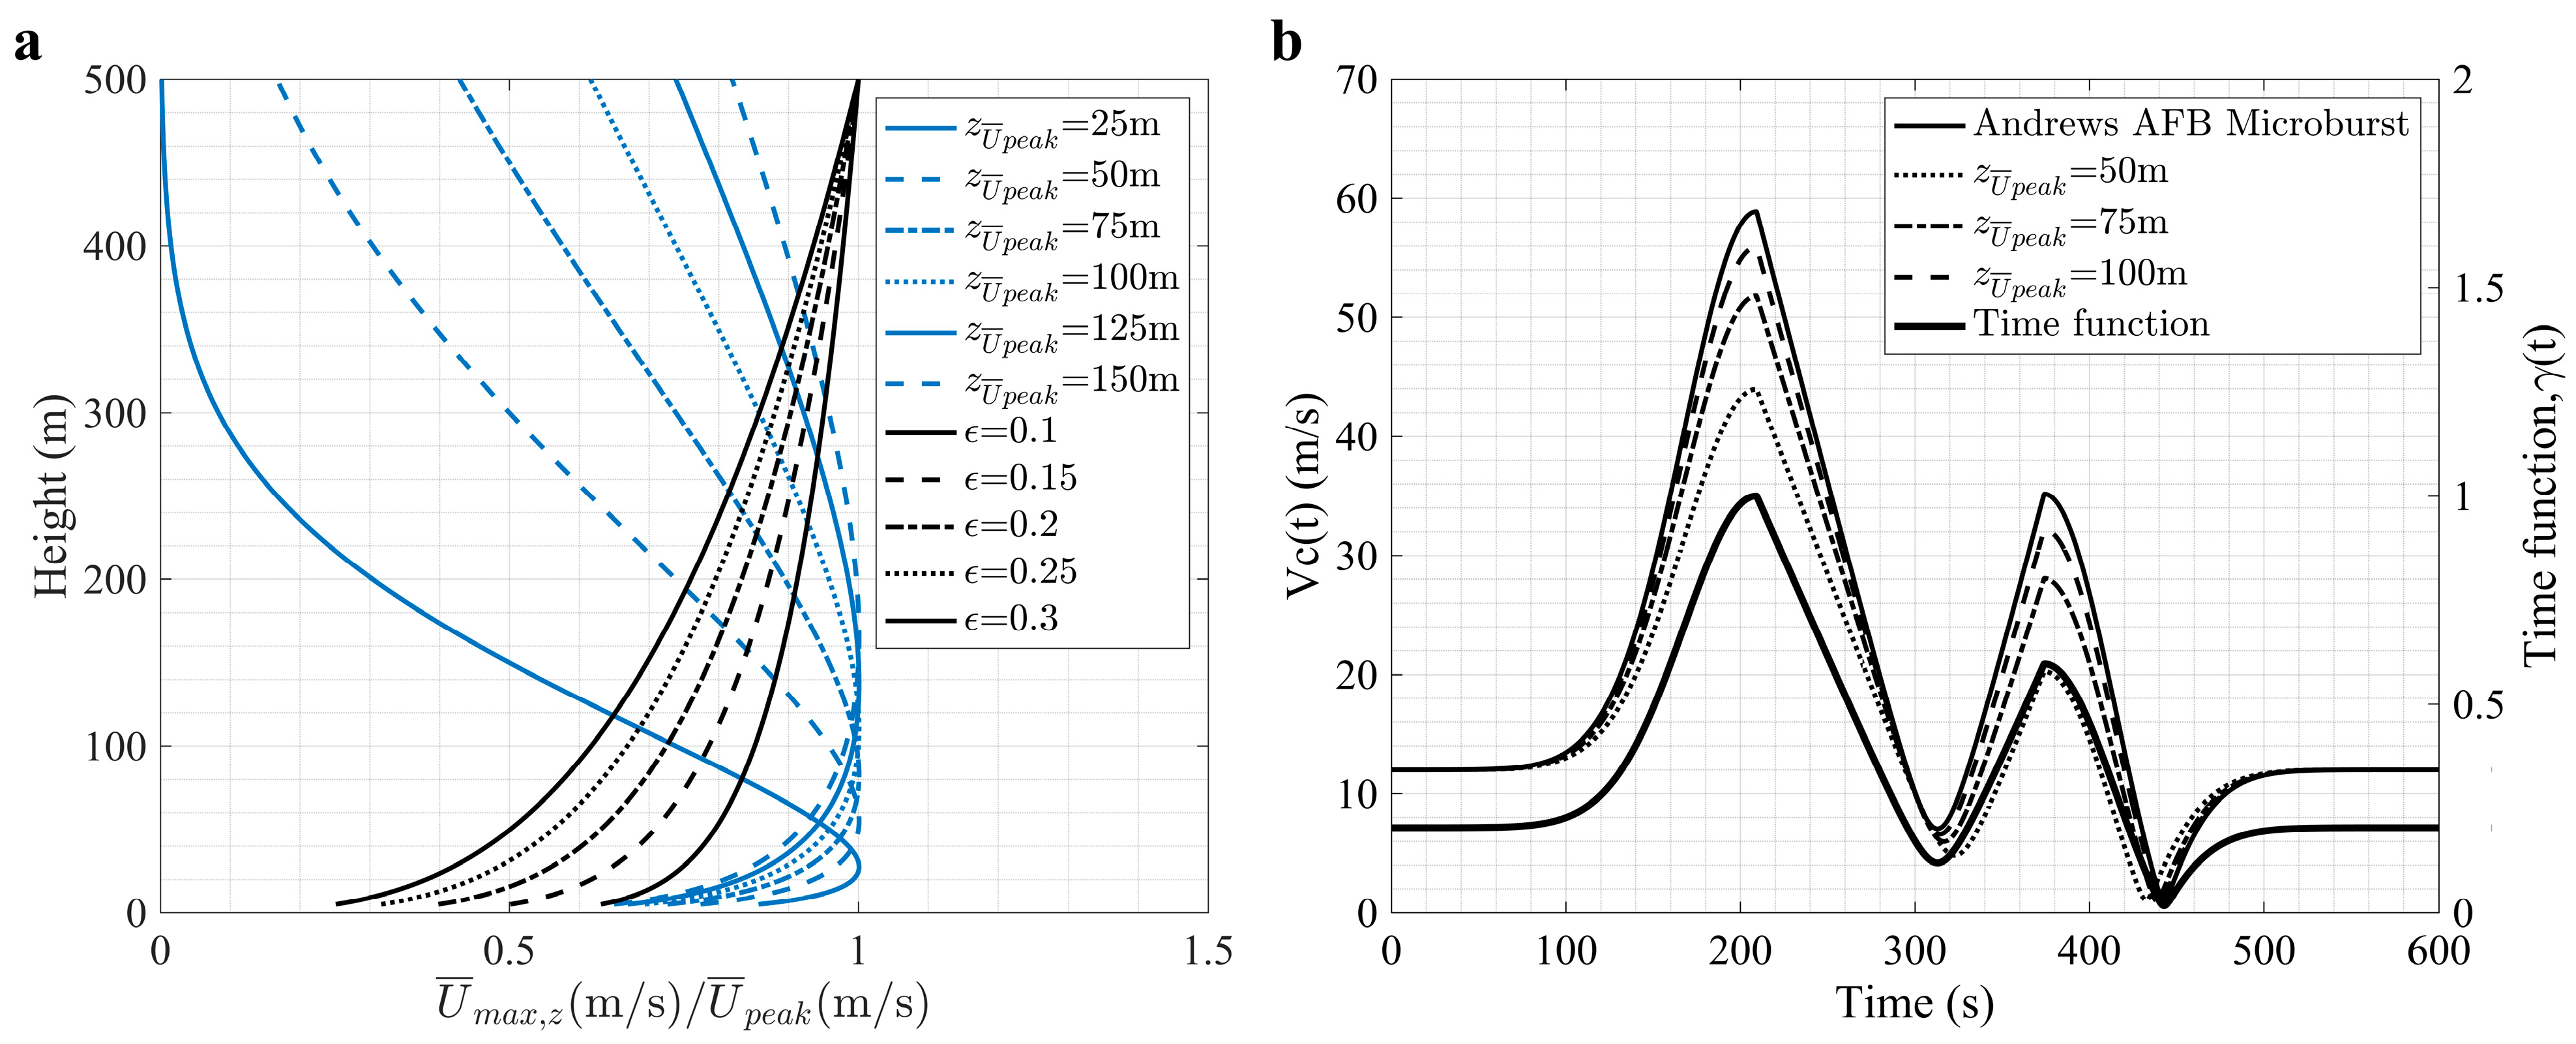
Figure 2a compares the horizontal wind velocity profile estimated with Equation (5) against the one calculated for synoptic wind, using the power-law model while normalising values in the abscissa with respect to peak velocity, i.e., U ¯ m a x / U ¯ p e a k . In this figure, ϵ represents the exponents of power-law equation, which in any case illustrates that the horizontal wind velocity is near the ground, where the induced downburst outflow exceeds that of synoptic wind.
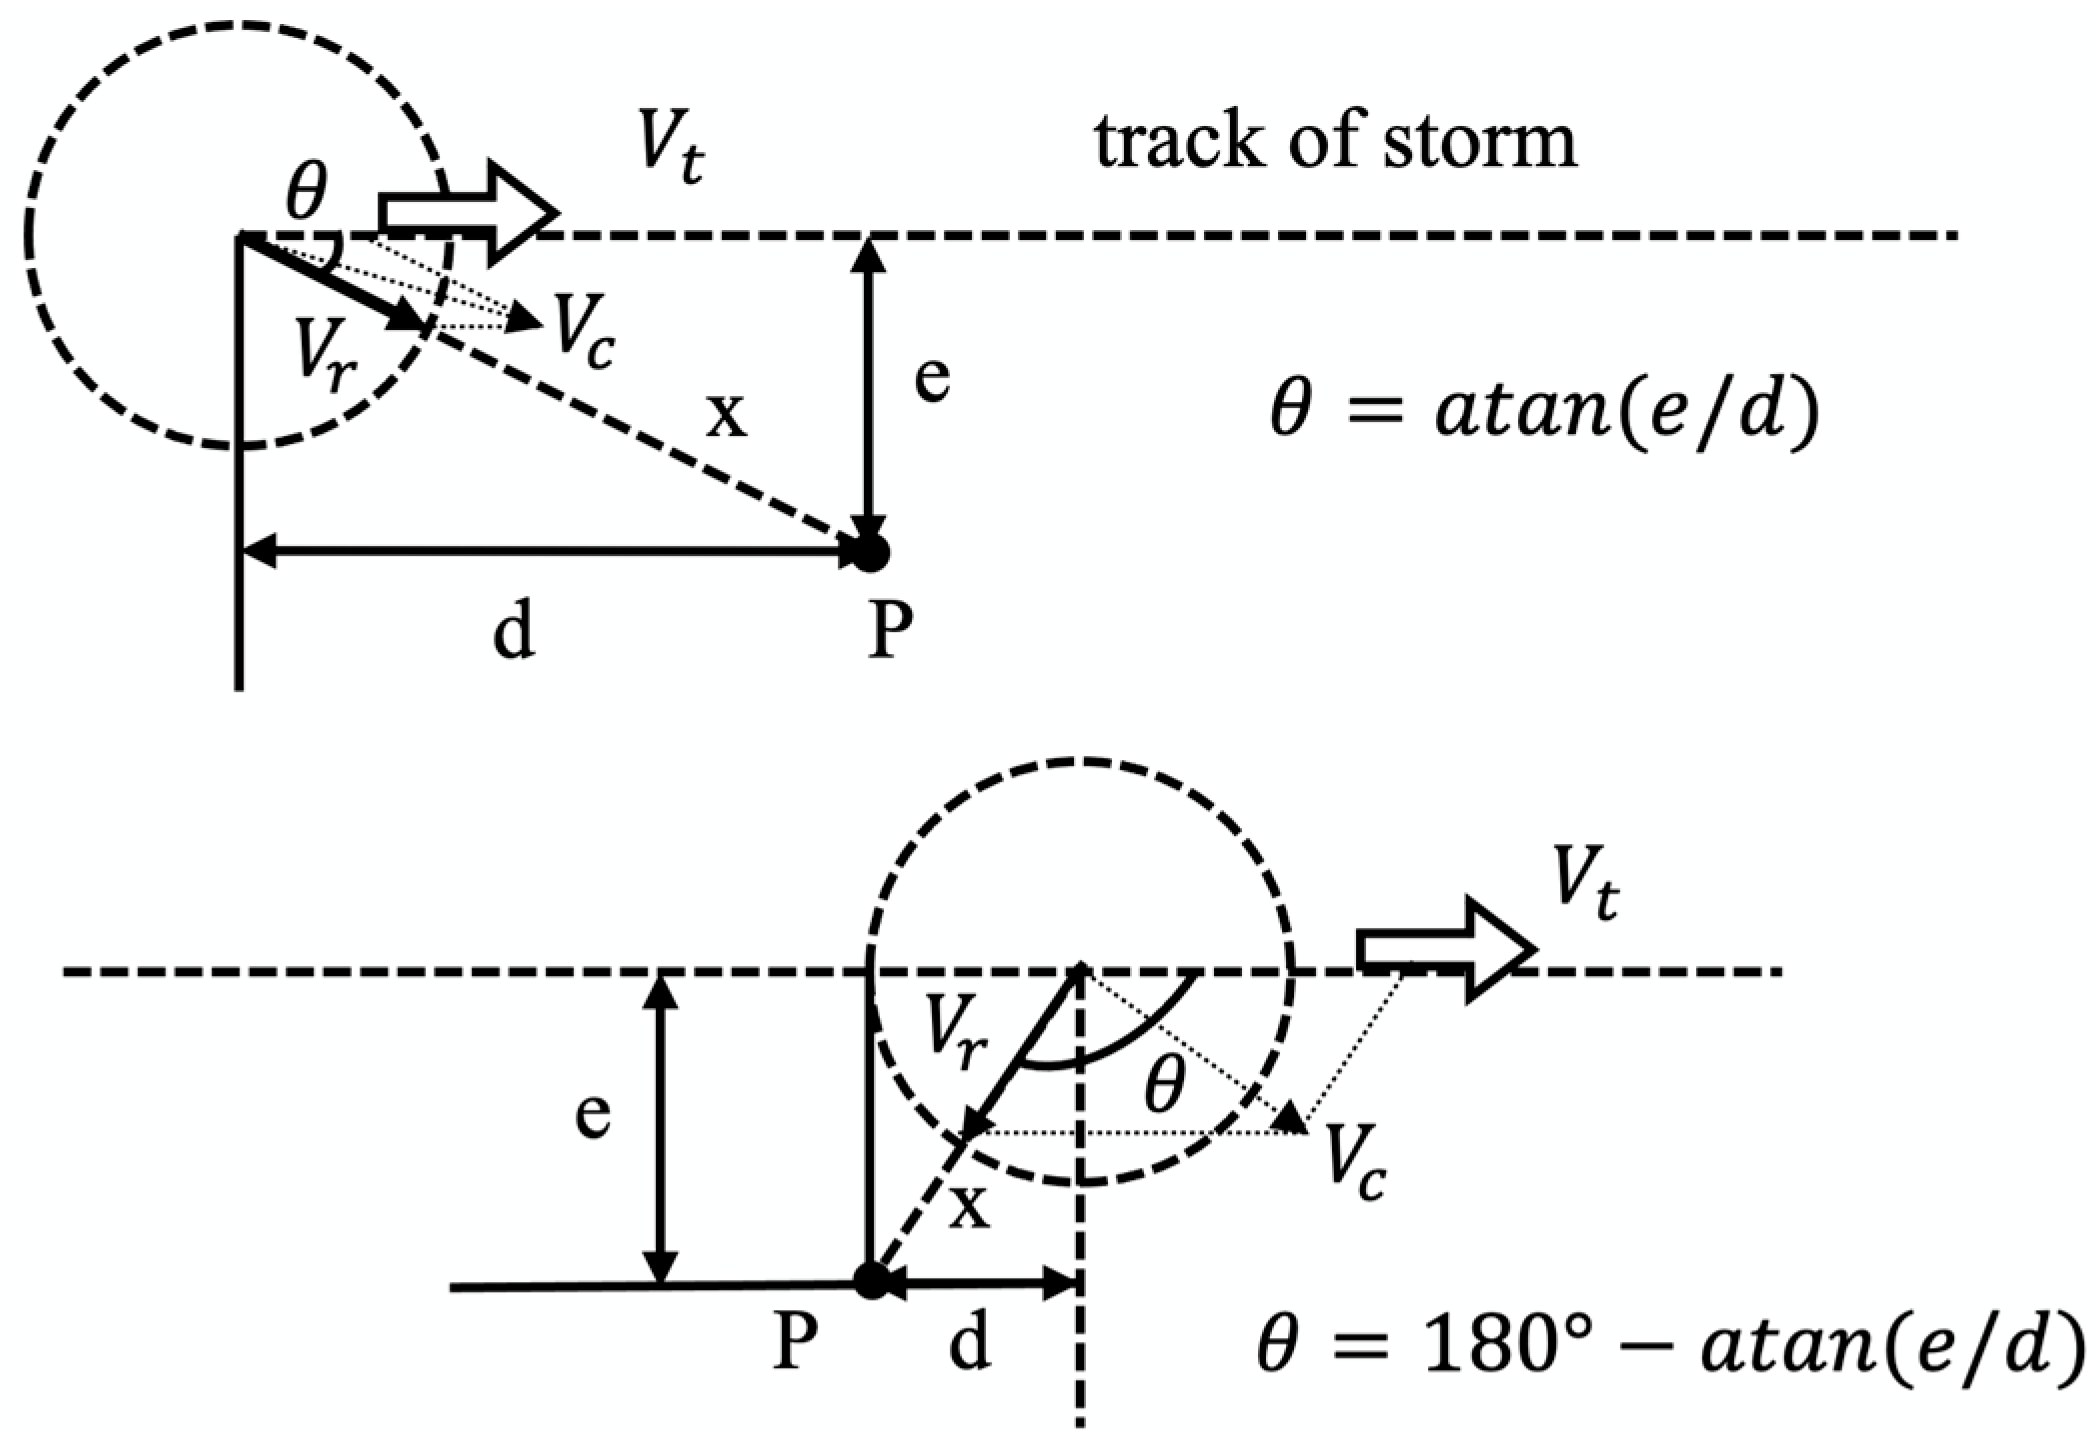
Regarding the wind field within the TS downburst, we adopted the radial velocity profile suggested by Holmes and Oliver [22], which is given in Equation (6). The model assumes that the velocity V c at the observation point P that has an offset distance, e , can then be expressed as Equation (7a)—where the angle between the translation velocity V t and the radial velocity V r components is defined as θ (see Equation (7b) and the graphic description shown in Figure 3).
V r x = U ¯ r , m a x × x r m a x x r m a x V r x = U ¯ r , m a x × e x p x r m a x R 2 x > r m a x
V c 2 = V r 2 + V t 2 2 V r V t cos 180 ° θ = V r 2 + V t 2 + 2 V r V t cos θ
θ = atan e d 0 ° < θ < 90 ° 180 ° atan e d 90 ° < θ < 180 °
In these equations, R is the radial length scale defined as the distance from the ‘low pressure ring’ ( r m a x ) to the ‘high-pressure ring’ [35] (R denotes the distance from the peak velocity to the dissipation point of the vortices within the downburst outflow, representing the spatial extent of the velocity time series during the decay phase); x is the radial distance from the storm centre, defined as x = d 2 + e 2 1 / 2 ; r m a x is the radius at which the maximum horizontal wind velocity occurs. It follows that the non-dimensional time function of horizontal wind γ t can also be expressed as V c t m a x V c t .
Figure 2b shows the simulated time history of the slowly varying mean wind velocity and the time function with the parameterisation listed in Table 1. In the table, f s is the sampling frequency of the simulation (carried forward to the simulation of wind discussed in Section 4.1). According to this model, the peak velocity shown in Figure 2b is induced by the progression associated with U ¯ m a x , r , at the assumed reference height of 183 m, since z U ¯ p e a k increases (see Table 1). It must be noted that the time function is built based on a typical recorded time history of a downburst event (Andrews AFB microburst). More representative time history records of the downburst outflow can be attempted based on the improved analytical model detailed by Xhelaj et al. [43].
The compact representation of the instantaneous horizontal velocity provided by Equation (4) can be mapped to the slowly varying turbulence intensity, as expressed in Equation (8) [10].
I u z , t = I ¯ u ( r ) β ( z ) μ ( t )
In this equation, I ¯ u ( r ) is the mean value of I u over the measurement time period at reference height r above the ground, β z = I ¯ u z / I ¯ u ( r ) is the non-dimensional vertical shape profile of I ¯ u , and μ t = I u ( z , t ) / I ¯ u ( z ) is the non-dimensional horizontal shape profile of I u changing with respect to time, t .
The effect of terrain roughness on turbulence intensities has been extensively researched in the past based on full-scale measurements [18,38,39,41,44,45,46,47,48,49]. These studies partially support the idea that the turbulence intensity is not affected by the terrain roughness during the time evolution of the TS downburst due to its transient properties. Ample discussions addressing this consideration for different terrain categories can be found at [18,39].
Since the vertical variation of I u under non-stationary wind events needs further investigation, the turbulence intensity for boundary layer wind proposed in ASCE7 [50] is adopted in this research. In that approach, β ( z ) = c × ( r / z ) 1 / 6 , where z represents the height above the ground. Note that r is often taken as 10 m and c (the turbulence intensity factor) is assumed as 0.3, 0.2, and 0.15 for exposures B, C, and D—as defined in ASCE [51].
Extensive work on the power spectral density function (PSD) for horizontal wind fluctuations of stationary wind has been reported by Simiu and Scanlan [32]. That work extended to non-stationary wind by Chen and Letchford [36], Choi and Hidayat [8], Holmes et al. [37], Lombardo et al. [38], Solari et al. [39], and Roncallo and Solari [42], to mention a few. The analysis of the wind turbulence of the recorded TS downburst by Holmes et al. [37] demonstrated that the high-frequency spectral density of downburst outflow is similar to that for synoptic winds. The most common non-dimensional expression of the PSD function of rapidly varying turbulent fluctuation u ~ (parallel to the slowly varying mean wind direction) is the von Kármán spectra [52], shown in Equation (9a), which has been adopted by the ASCE [51]. Considering the variation in the PSD function with height, an extended form was proposed by Solari and Piccardo [53]—see Equation (9b)—which has been validated based on the mean value of the PSD of the rapidly varying turbulent fluctuation of all the TS recorded by the ‘Wind and Ports’ project.
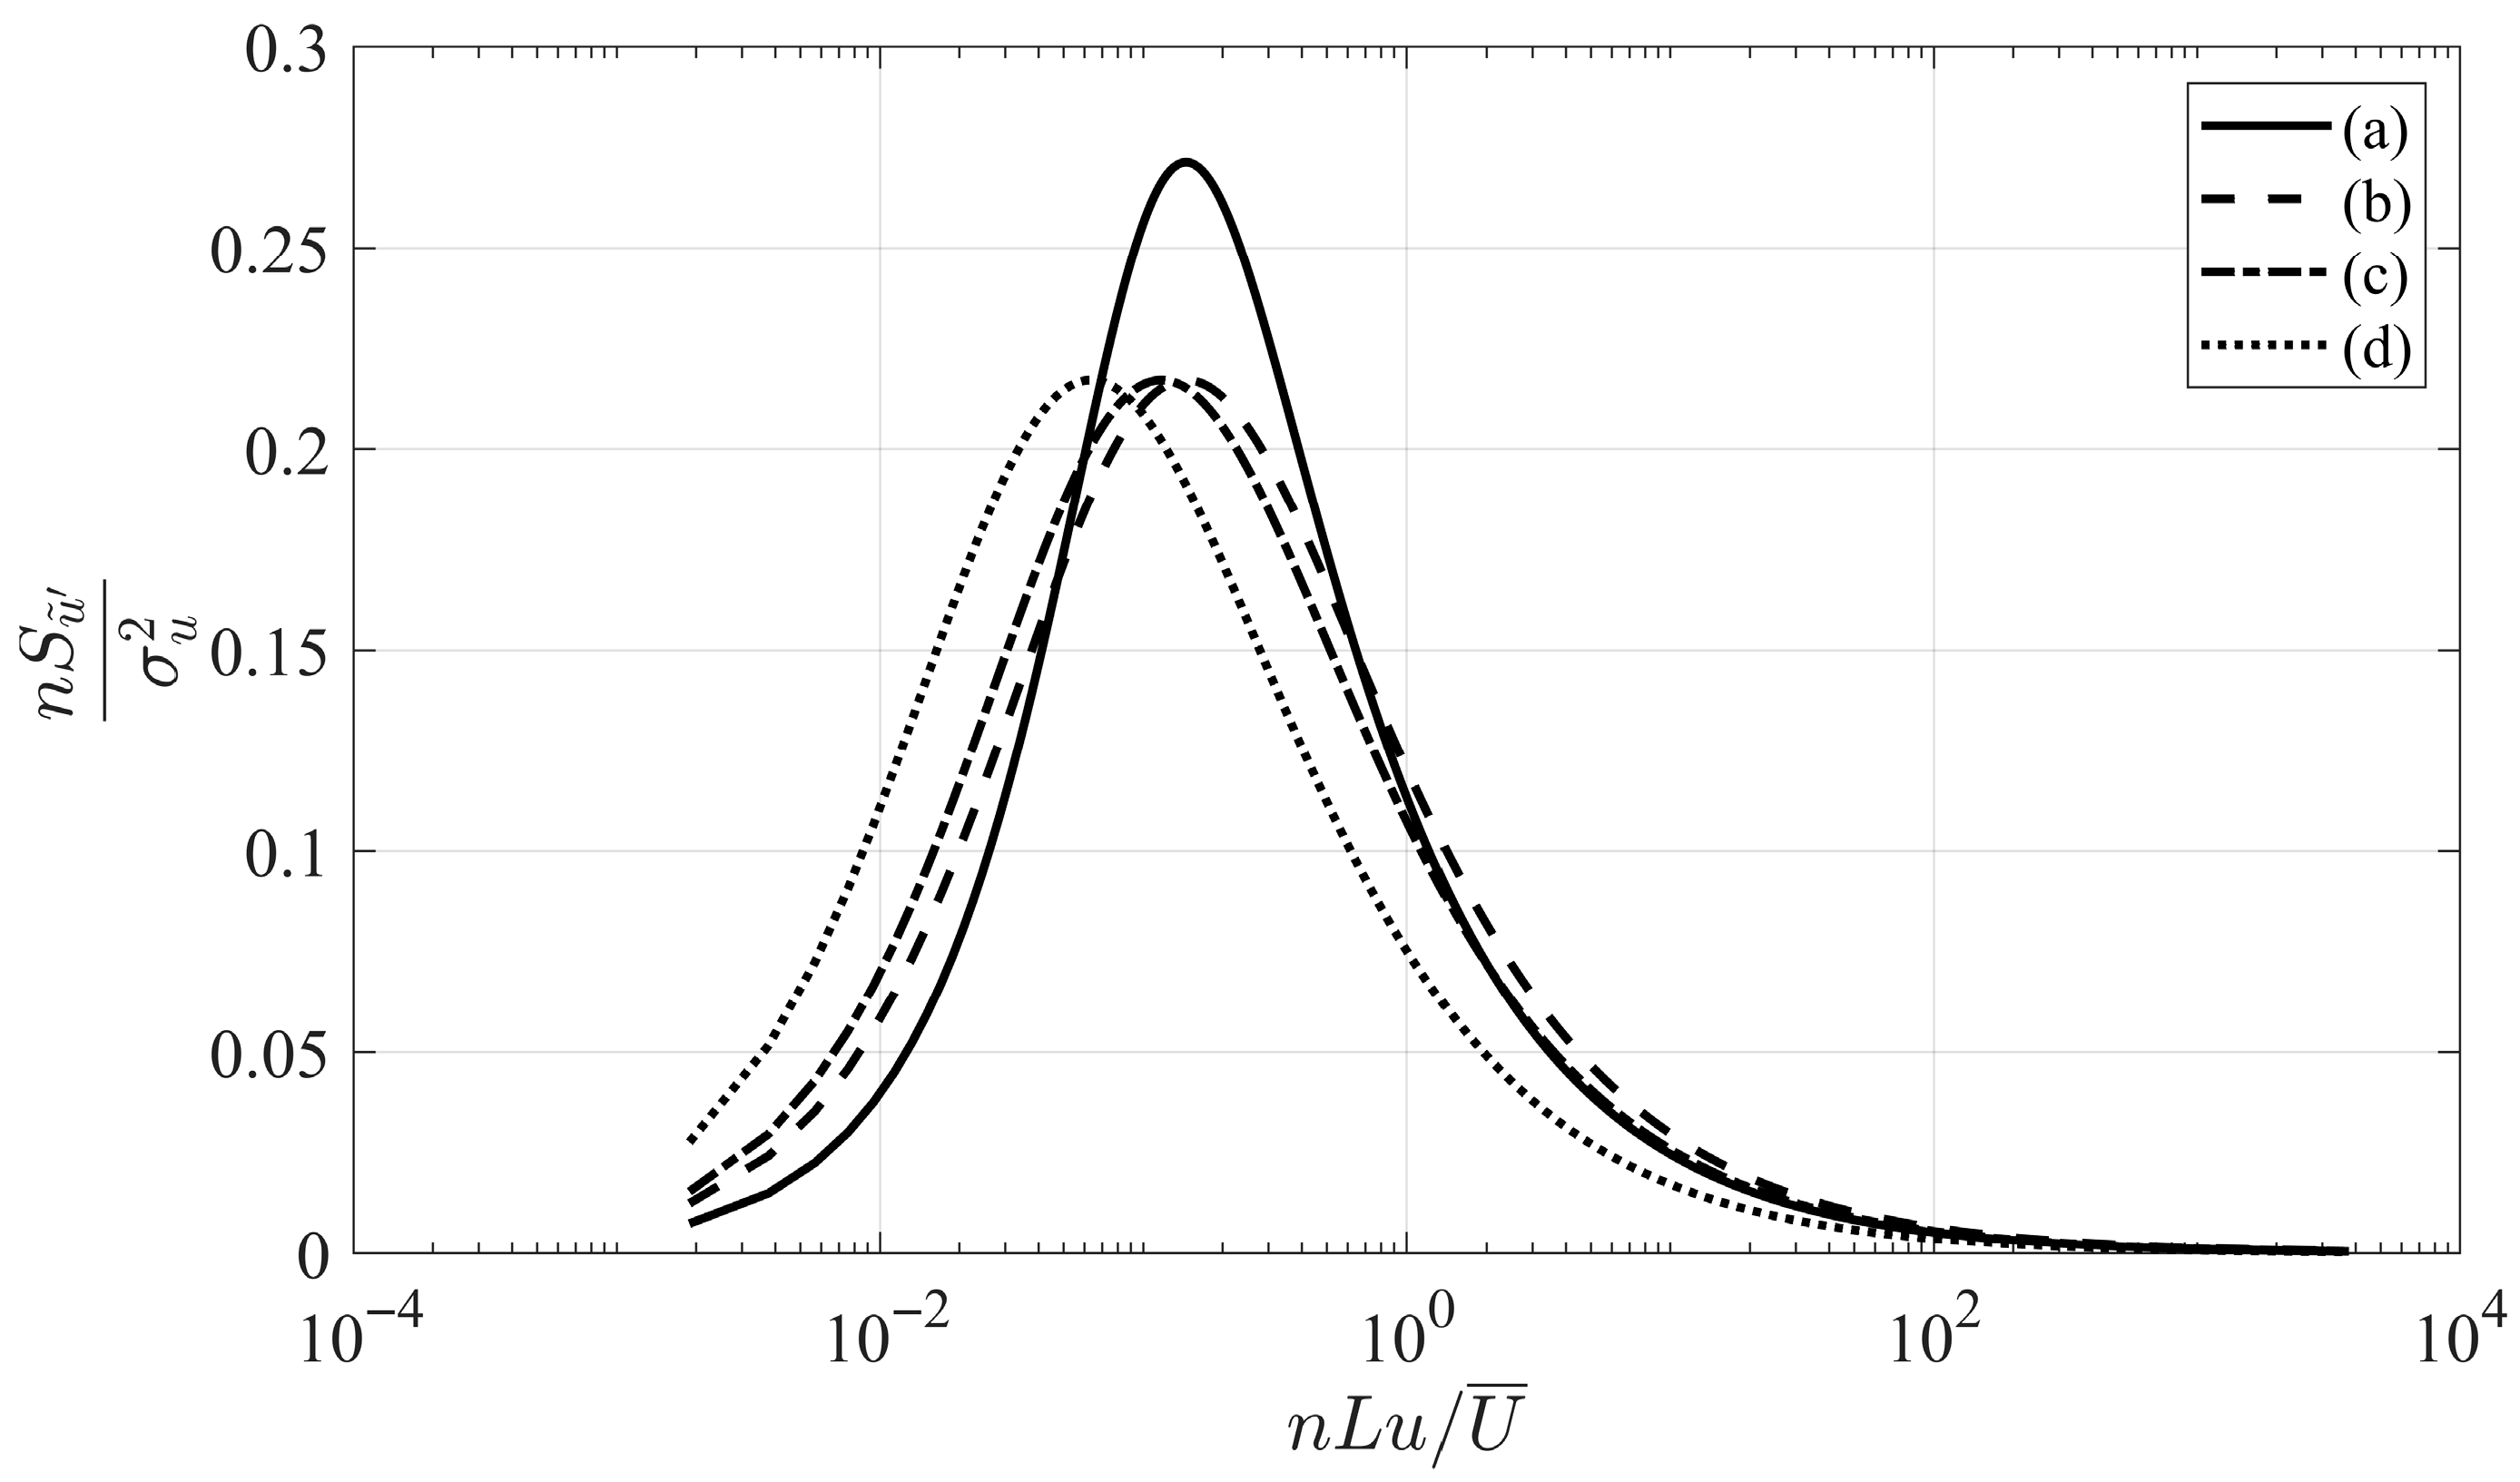
Further evidence underpins the assumed form of PSD of u ~ , based on 93 TS downburst records, which are given in Equation (9c). It is worth highlighting that Equation (9d), proposed by Kaimal et al. [54], provides an additional alternative to establish the PSD. The difference amongst these is that Equation (9a) depends on integral length scale while Equation (9b–d) add dependence on the height above the ground. Zhang et al. [40] and Roncallo and Solari [42] have shown that the PSD of the reduced turbulent fluctuations estimated with Equation (9a) has higher peaks compared with PSD calculated with Equation (9b–d), which show lower peaks and larger span ranges of the scaled frequency n z / U ¯ m a x ( z ) with different values of t (varying running mean time intervals), as shown in Figure 4.
n S u ~ ( n ) σ u 2 = 4 ( n L u U ¯ ) 1 + 70.8 ( n L u U ¯ ) 2 5 / 6
n S u ~ ( z , n ) σ u 2 ( z ) = f / f m 1 + 1.5 f / f m 5 / 3
n S u ~ ( z , n ) σ u 2 ( z ) = 18 f 1 + 27 f 5 / 3
n S ( z , n ) u * 2 = 200 f ( 1 + 50 f ) 5 / 3
In Equation (9), n is the frequency of gust wind; L u is the turbulence integral length scale, defined as L u = U ¯ 0 ρ ( τ ) d τ , where ρ ( τ ) is the autocorrelation function that changes with the time delay ( τ ) ; f = n z / U ¯ m a x ( z ) , f m = 0.1456 z / L u when n S u ~ is the maximum; u * is the friction velocity. In this investigation, we use L u ( z ) = l ( z / r ) α , where l and α are the integral length scale factor and exposure constant: 98 m and 1/3 for exposure B, 152 m and 1/5 for exposure C, and 198 m and 1/8 for exposure D, as established in ASCE [51].
The comparison of PSD models in Figure 4 considers a height of 50 m above the ground for the peak velocity, reference height and reference velocity of 10 m and 50 m/s, respectively, and that the recording station is located at 100 m above the ground. In this investigation, Equation (9b) was adopted for the simulation of TWDS.

3. Thunderstorm Downburst Wind Design Spectra

3.1. Overview of Method

The TWDS methodology customises the stationary wind design spectra [34] and the Davenport wind loading chain [55] to the TS downburst non-synoptic regime. The approach starts by deriving the spectra of the input acceleration from the PSD to capture the turbulent features of downburst outflows. Inputting this acceleration to the adequate transfer function allows for the estimation of the response acceleration of a collection of SDOF systems, as represented in Figure 5. Intermediate steps of the proposed method require the generalisation of forces exerted by wind, structural mass, and stiffness, which enables the encoding of the aerodynamic characteristics of multi-degree-of-freedom (MDOF) systems to their equivalent SDOF.
The following sections provide a detailed discussion of the steps shown in Figure 5.

3.2. Wind Design Spectra for Single-Degree-of-Freedom Systems

Step 1: Wind load
For a point-like SDOF system, the total horizontal force on a structure can be calculated with Equation (10a), and the slowly varying mean component f ¯ and residual fluctuating component f with Equation (10b) and Equation (10c), respectively. In these equations, c D represents the drag coefficient, ρ is the air density, and A is the structural surface exposed to wind. The second-order term of the fluctuating turbulence, u 2 , is replaced by σ u u to simplify the calculation process.
f ( t ) = f ¯ ( t ) + f ( t ) = c D × 0.5 ρ A U 2 ( t )
f ¯ t = c D × 0.5 ρ A U ¯ 2 ( t )
f ( t ) = c D ρ A U ¯ 2 ( t ) 1 + 0.5 I u ( t ) I u ( t ) u ~ ( t )
Step 2: Response acceleration of a SDOF system
The physical relationship between force and acceleration, established by Newton’s Second Law on a point-like structure, enables the spectra of the input acceleration induced by the wind on a SDOF system, to be determined as in Equations (11) and (12).
S F ( n ) = q 2 S u ~ ( n )
S A ( n ) = q m 2 S u ~ ( n )
In these equations, S F is the force spectrum, S A is the spectrum of input acceleration, S u ~ ( n ) is the power spectra density function for the reduced horizontal fluctuating velocity component u ~ , n is the gust frequency, and m is the mass of the structure excited by wind. Moreover, q is a force factor, expressed as q = c D ρ A U ¯ m a x 2 1 + 0.5 I ¯ u I ¯ u , where c D is the drag coefficient, ρ is the air density, and A is the air exposed to wind.
The cross-correlation of the high-frequency velocity fluctuations is determined with the aerodynamic admittance function χ n proposed by Vickery [56]—here given in Equation (13).
χ ( n ) = 1 1 + 2 n A U ¯ m a x ( t ) 4 / 3
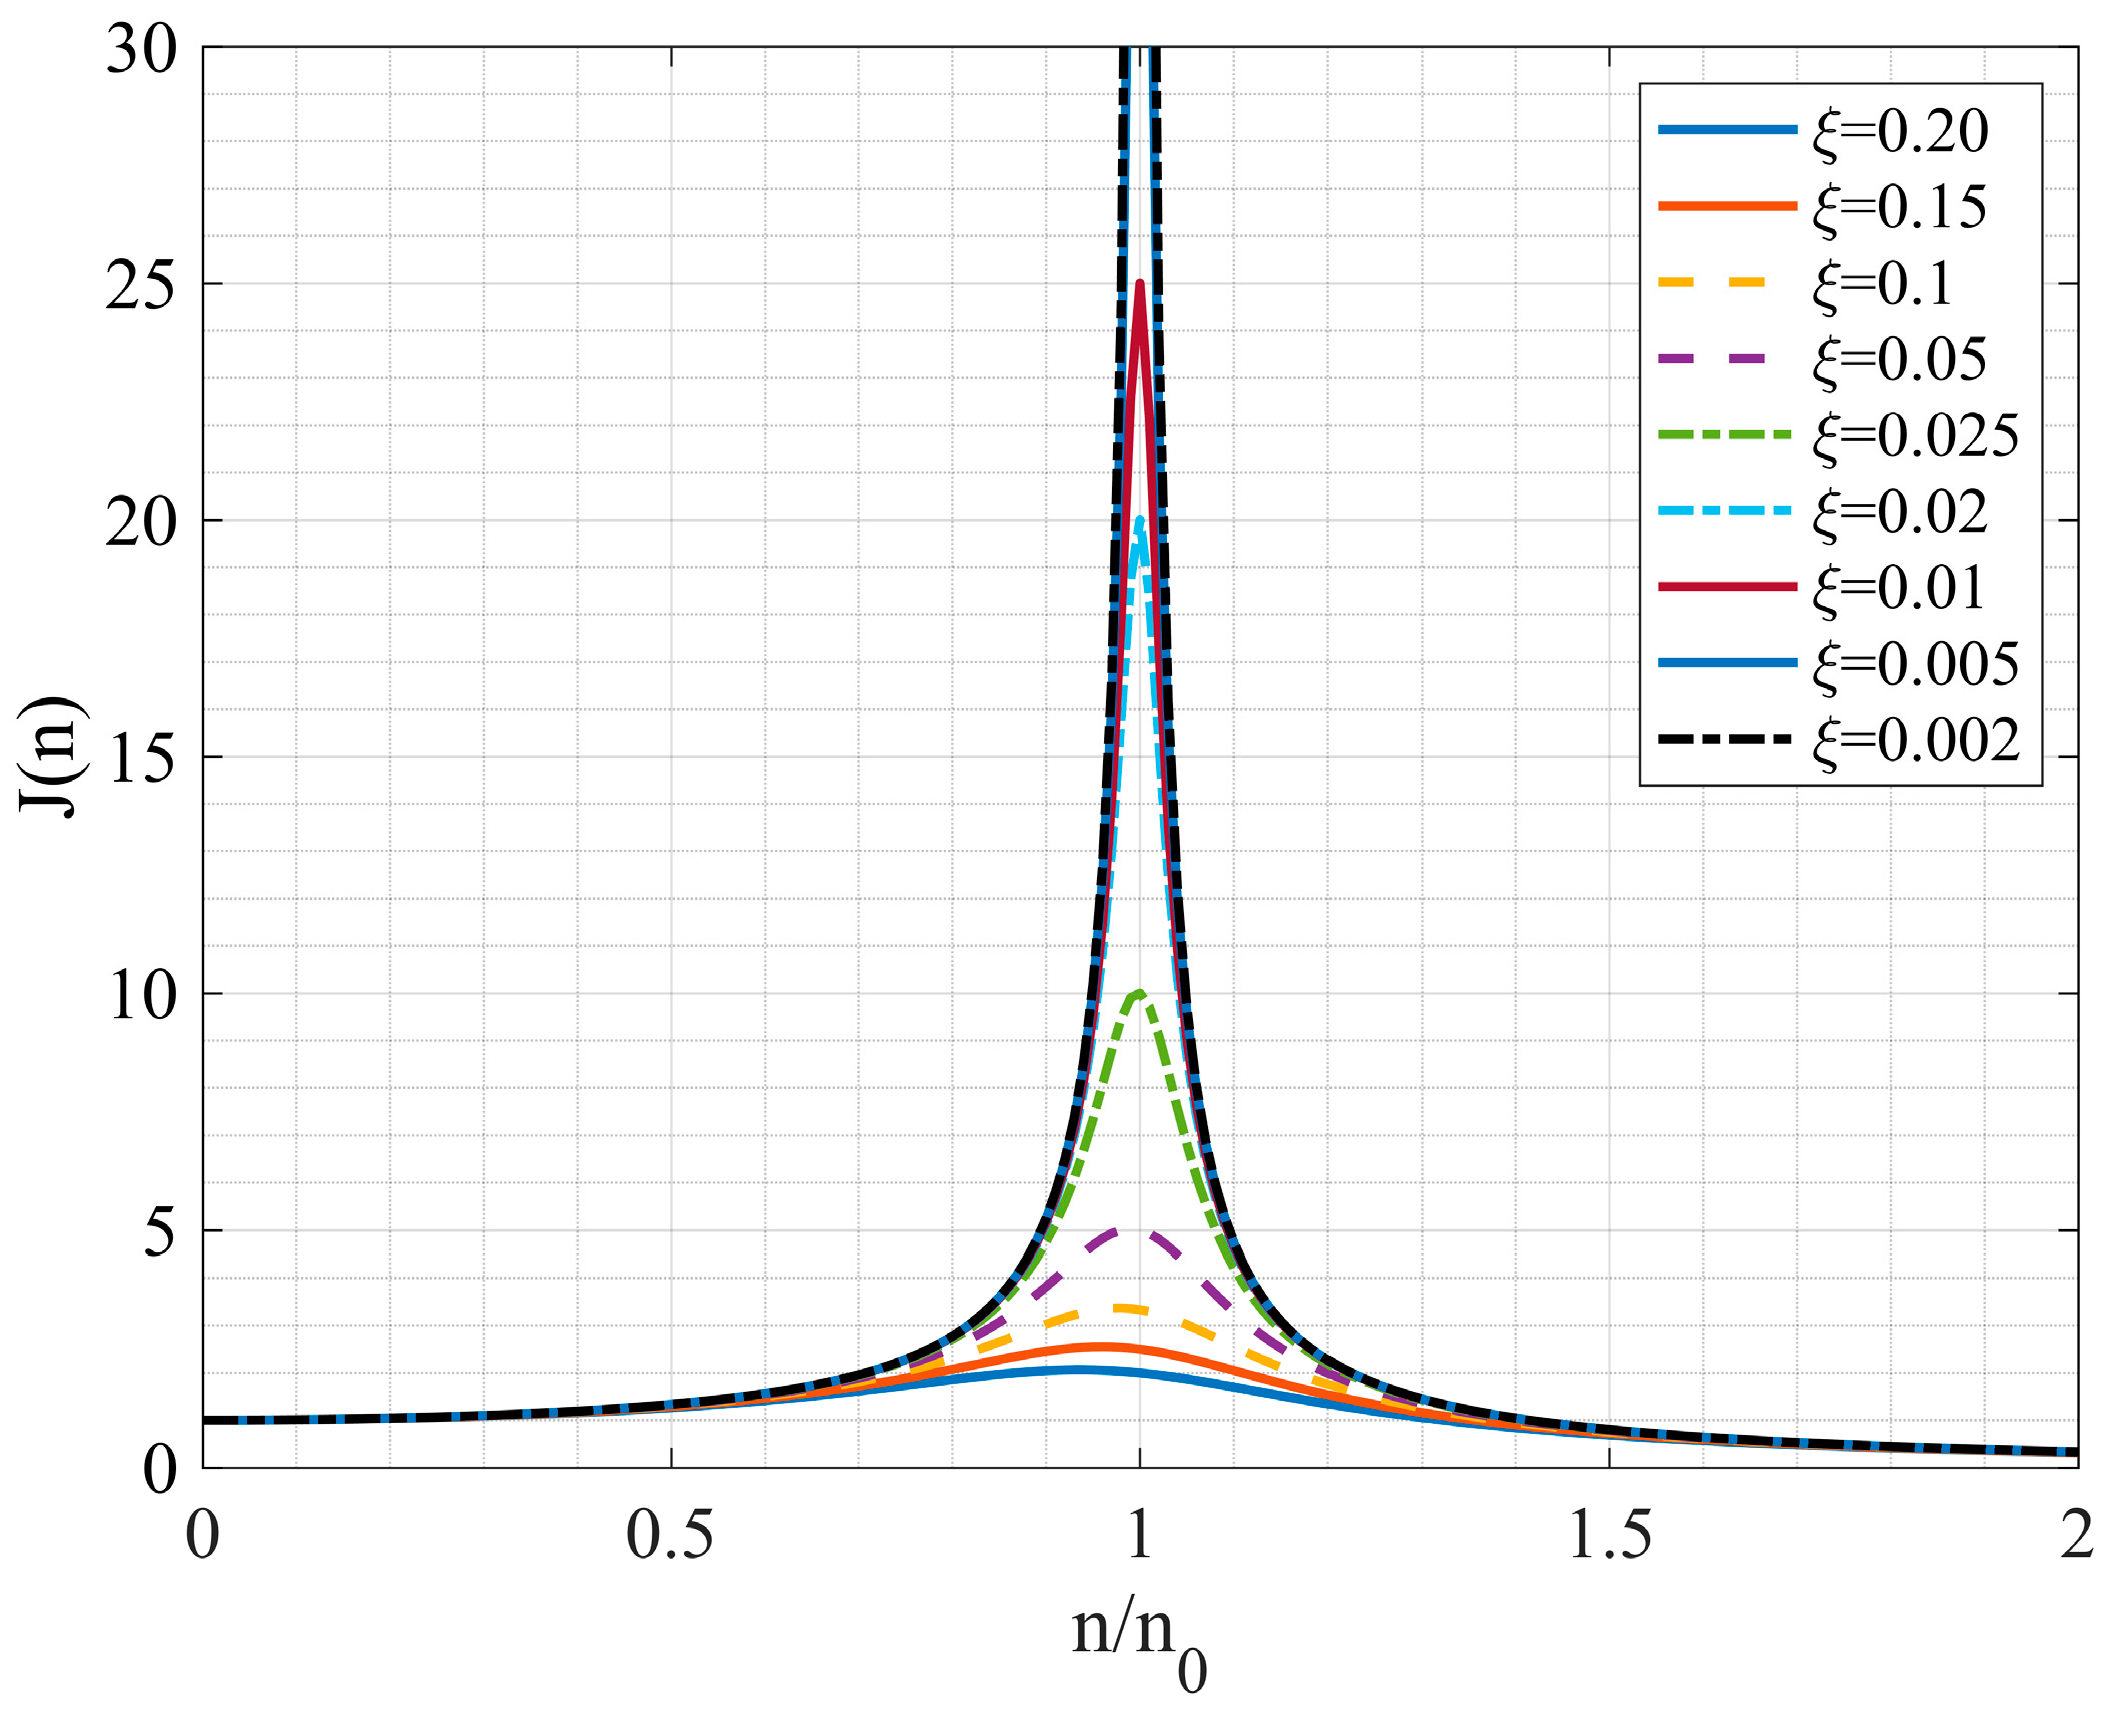
The variance of the output response acceleration for the SDOF oscillator is calculated with Equation (14), where J n is the transfer function, as derived in Martinez-Vazquez [33].
σ a 2 = 0 J n 2 χ n 2 S A n d n
J n = 1 1 ( n / n 0 ) 2 2 + 4 ξ 2 ( n / n 0 ) 2
In Equation (15), n is the frequency of the gust wind, n 0 is the natural frequency of the system, and ξ is the damping ratio, expressed as ξ = c 2 m k = c 4 m π n 0 , where c is the damping coefficient and k is the structural stiffness (see Figure 6). Finally, Equation (16) provides the TWDS of the output acceleration for the SDOF system.
S a = σ a 2

3.3. Wind Design Spectra for Multi-Degree-of-Freedom Systems

Step 1: Wind force
For vertical MDOF systems, the lateral forces induced by wind are partially correlated; hence, once we know the wind velocity profile, we can express the force exerted at specific points with Equation (17). In this arrangement, the slowly varying mean component f ¯ and residual fluctuating component f with varying heights are given by Equation (17b) and Equation (17c), respectively.
f z , t = f ¯ z , t + f z , t = c D z × 0.5 ρ A ( z ) U 2 ( z , t )
f ¯ z , t = c D ( z ) × 0.5 ρ A ( z ) U ¯ 2 ( z , t )
f z , t = c D ( z ) ρ A ( z ) U ¯ 2 ( z , t ) 1 + 0.5 I u ( z , t ) I u ( z , t ) u ~ ( z , t )
Few studies have mentioned the need to consider the variability of the direction of the wind flow, caused by the vortices coupled with the translation of the impinging point [57,58]. The Quasi-Steady theory already takes this into consideration, as the magnitude of pressure coefficients for small-scale turbulence effects are derived from the three wind velocity components [57,59,60].
Step 2: Response acceleration of a MDOF system
When the variation in turbulence with height is considered, the corresponding spectrum of force and input acceleration can be expressed as in Equations (18) and (19).
S F ( z , n ) = q 2 ( z ) S u ~ ( z , n )
S A ( z , n ) = q ( z ) m 2 S u ~ ( z , n )
Step 3: Cross-spectra of acceleration of a MDOF system
The spectral relationship established above for SDOF systems can be extended to determine the input acceleration of MDOF systems. This requires finding a series of SDOF systems equivalent to the MDOF system while correctly characterising the wind regime. It is common practice to determine the cross-correlation of gusts in TS downbursts through the coherence function taking place at 0.6 × H (vertical dimension of structures). However, recognising that turbulence may vary beyond such a reference point, we adopt the coherence function proposed by Davenport [61], reproduced in Equation (20), which accounts for both horizontal and vertical separations between measurement points distributed across the building envelope.
χ z , n = e x p n 1 / 2 [ U ¯ m a x z i + U ¯ m a x ( z j ) ] ( C y Δ y ) 2 + ( C z Δ z ) 2
In Equation (20), Δ y and Δ z are the horizontal and vertical distances between two points, i ,   j , located at coordinates y i , z i and y j , z j , respectively. C y and C z are non-dimensional decay constants along with the horizontal and vertical directions (assumed equal to 10). U ¯ m a x ( z i ) and U ¯ m a x ( z j ) represent the maximum value of the slowly varying mean wind velocity at height z i and z j , respectively.
The cross-power spectra of the input acceleration can be obtained by combining the spectra of the input acceleration given in Equation (12) with the cross-spectra of the horizontal turbulence component given in Equation (20) (see Equation (21)), where q ( z ) = c D z ρ A z U ¯ m a x 2 ( z ) 1 + 0.5 I ¯ u z I ¯ u ( z ) .
S A i j z i , z j , n = 1 m 2 q ( z i ) q ( z j ) S u ~ ( z i , n ) S u ~ ( z j , n ) 1 A 2 χ ( z i , z j , n )
The integration of Equation (21) across the area exposed to wind determines the generalised input acceleration S c u z i , z j , n , as expressed in Equation (22), where ϕ ( z ) represents the fundamental modal shape at height z above the ground. The input acceleration ( S c u ) is carried forward for the analysis of MDOF systems.
S c u z i , z j , n = A ϕ ( z i ) ϕ ( z j ) S A i j ( z i , z j , n ) d y i d y j d z i d z j
Step 4: Thunderstorm downburst wind design spectra
Equation (22) provides the acceleration inputted to a system; therefore, the variance of the overall spectral response can be obtained by passing the signal through the transfer function (Equation (15)), as specified in Equation (23a). The integration of this equation is carried out in two parts to separate the background and resonant response components, as in Equation (23b,c). It follows that the design spectra of the output acceleration can be integrated with the square root of the summation of squares, taking the background and the resonant response components, as in Equation (24).
σ a 2 = 0 J n 2 S c u z i , z j , n d n
σ a , b 2 = 0 S c u z i , z j , n d n
σ a , r 2 = S c u n 0 0 J n 2 d n π n 0 S c u ( z i , z j , n 0 ) 4 ξ
S a = σ a 2 = σ a , b 2 + σ a , r 2
Table 2 summarises the steps to calculate TWDS and establishes a comparison against the simpler case of point-like systems.

3.4. Scrutinising the Controlling Parameters of Wind Design Spectra for Downburst Outflows

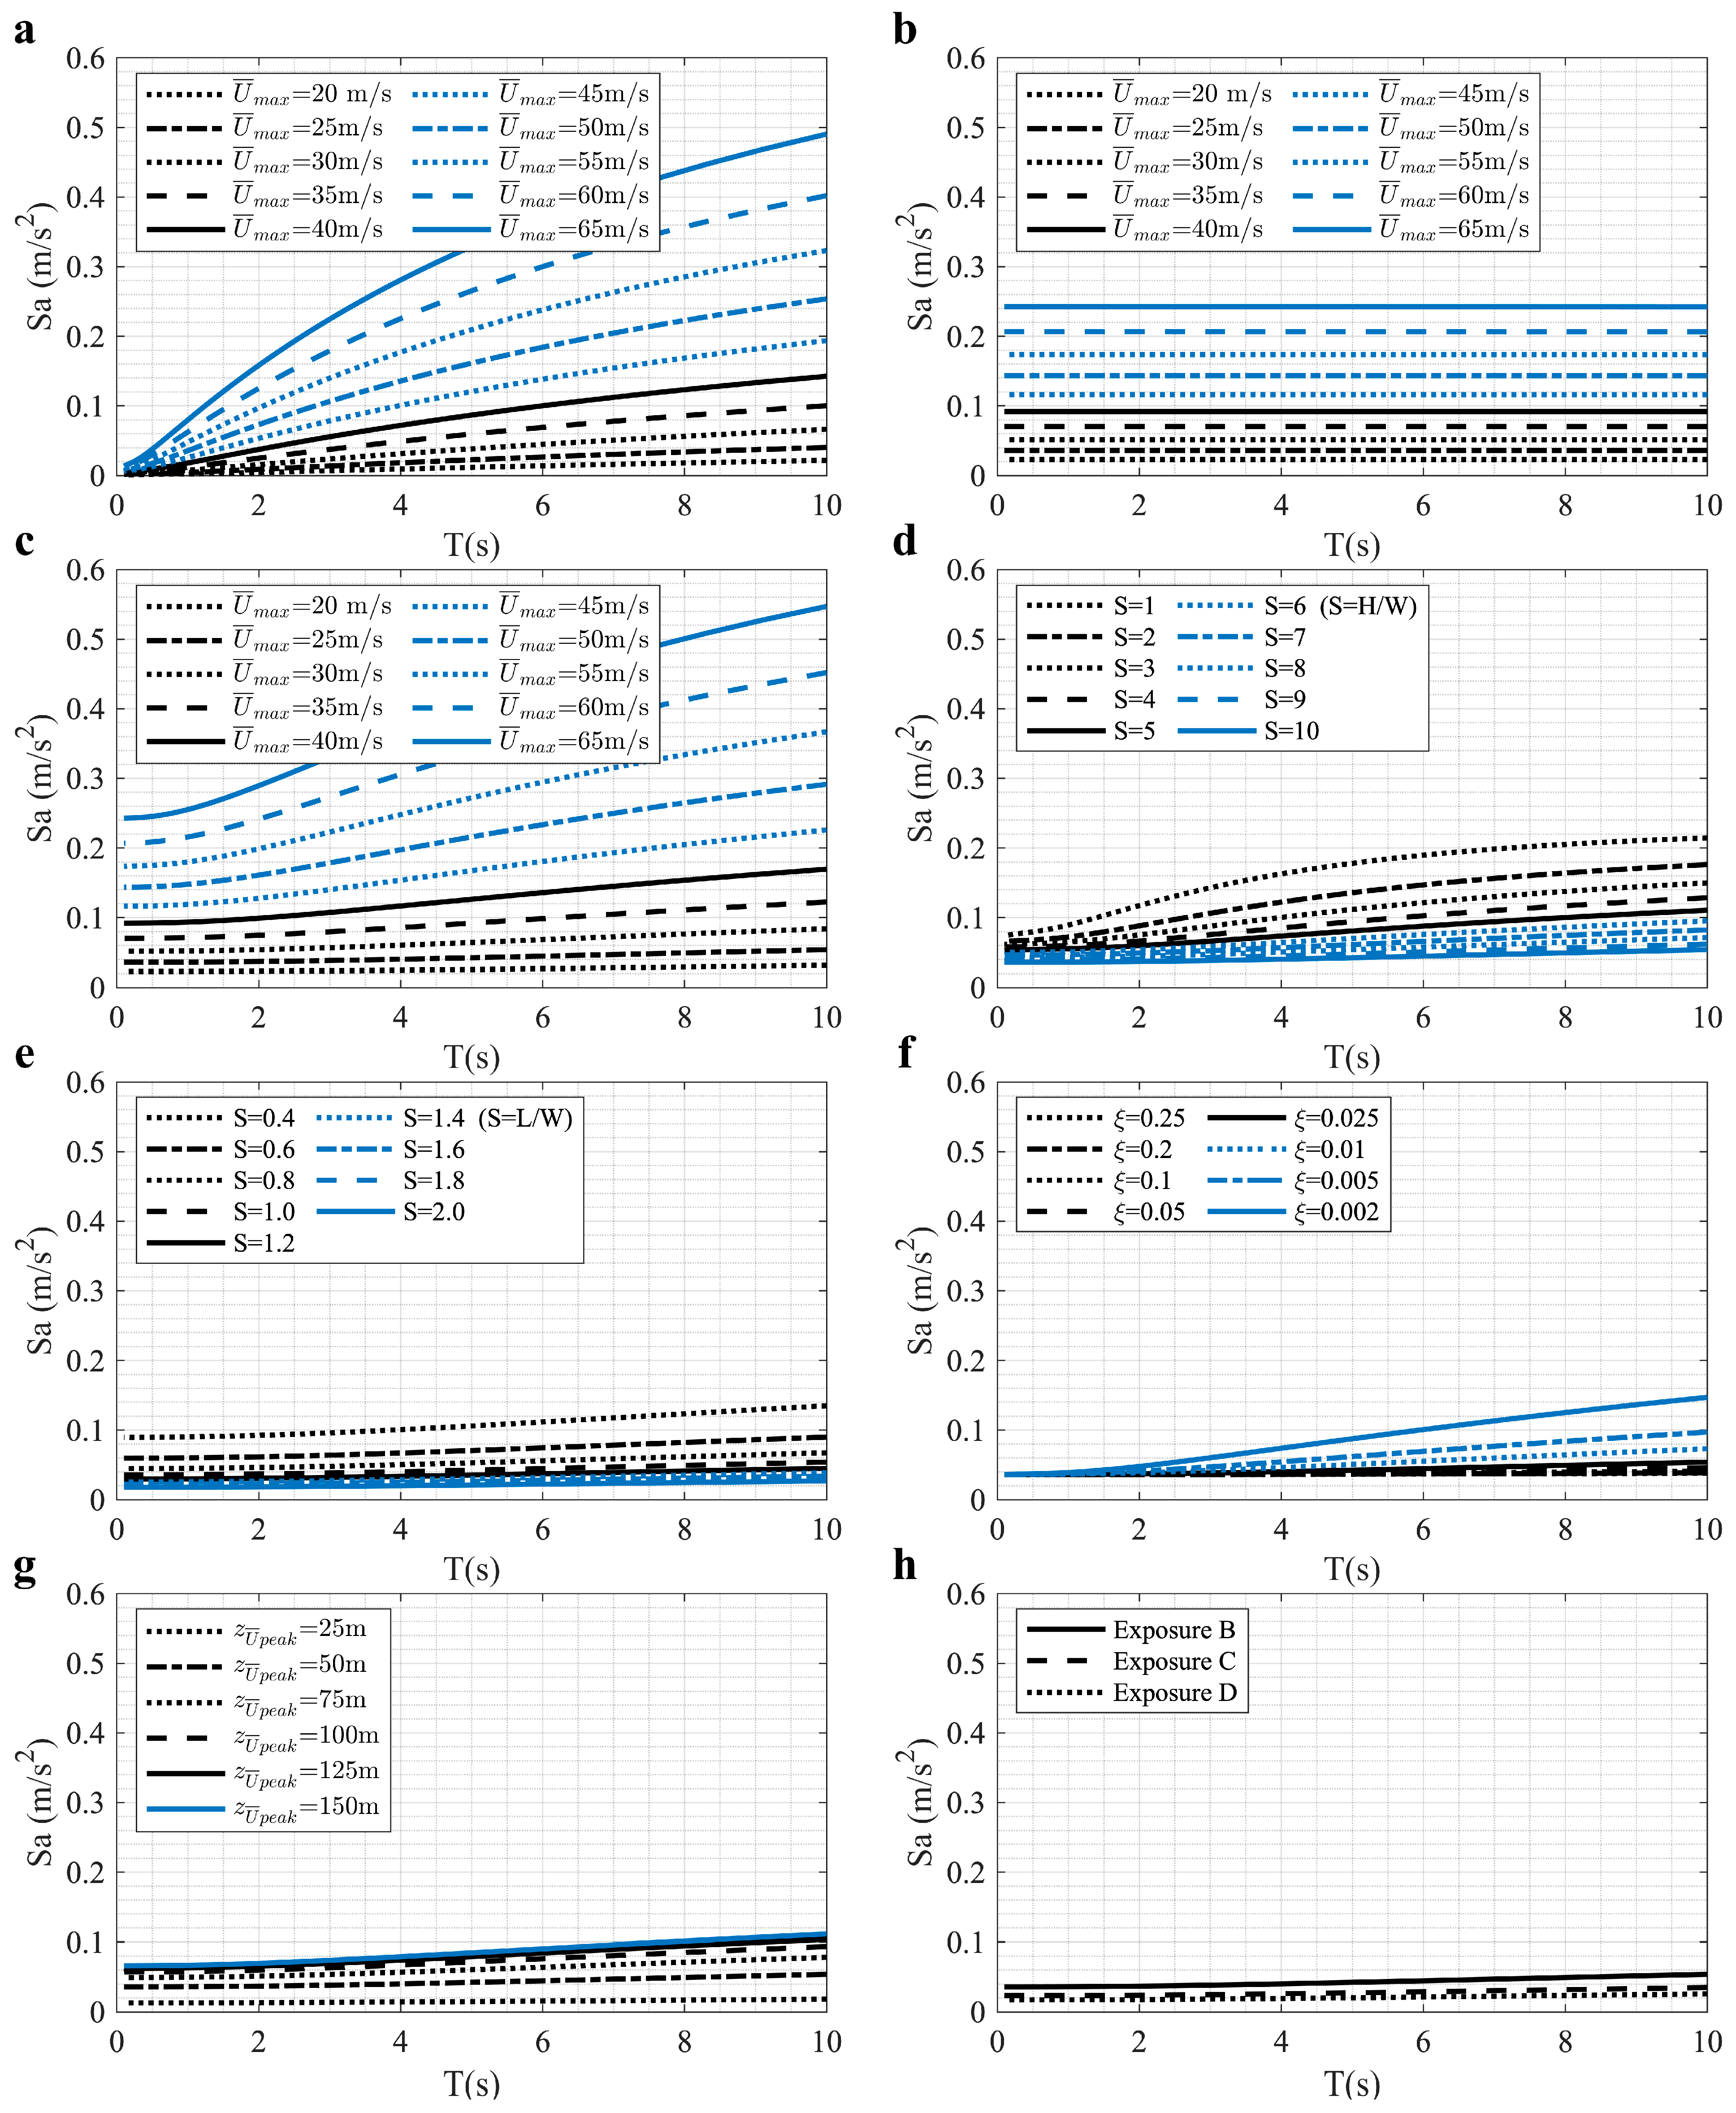
Figure 7 presents the wind design spectra for a selected case study and the observed changes with the aspect ratio, damping ratio, location of peak velocity, and terrain exposure. The benchmark sets the building dimensions to a width of 20 m, aspect ratio (height to width) equal to 10, a chord-to-width ratio of 1, U ¯ m a x , 10 = 25 m/s, a peak velocity height of 50 m, 2.5% fraction of critical damping ratio, and terrain exposure B. Figure 7c shows the design spectra for various reference wind speeds ( U ¯ m a x , 10 ); note that the range of the natural frequency (0.1 Hz to 10 Hz) and period (0.1 s to 10 s) used to construct the spectra is a reflection of real structures.
As discussed in previous sections, the background and resonant wind components separate during the integration of Equation (23a); therefore, we can show partial components of the design spectra in Figure 7a,b. The resonant component (Figure 7a) increases with the natural period (T), and this effect clearly influences the pseudo acceleration response shown in Figure 7c. In contrast, the spectra of the background components shown in Figure 7b do not vary much with the natural frequency, since it represents the quasi-static response caused by the gust turbulent fluctuations at low frequency. This finding seems consistent with Kareem and Tamura [62] who pointed out that the output acceleration response of structures with a similar range of period mainly occurs at the resonant frequency.
The rest of the plots, namely Figure 7d–h, show the sensitivity of the design spectra to aspect ratio, damping ratio, location of peak velocity, and terrain exposure. Figure 7d refers to the height to width ratio S = H / W , while Figure 7e shows changes with the chord-to-width relationship S = L / W . There, the increase in S tends to mitigate the response acceleration, in other words, more flexible buildings (e.g., tall) exhibit lower acceleration in response to wind loading, as the coherence function attenuates the cross-spectral acceleration. Conversely, low-rise buildings display higher response accelerations due to their shorter natural periods, resulting in higher vibration frequencies. Moreover, the default height of 50 m for the peak velocity of the slowly varying mean wind velocity may also contribute to this phenomenon. Likewise, Figure 7f shows that the increase in damping ratio uniformises the response acceleration across the selected period range. The location of the peak slowly varying mean velocity z U ¯ p e a k can be observed in Figure 7g. There is a slight increase as U ¯ p e a k moves up; for example, when its location mounts from 50 m to 100 m, the design spectra rise from 0.054 m/s2 to 0.094 m/s2 when the natural frequency is set to 0.1 Hz. Finally, Figure 7h shows a slight impact of surface roughness on the spectral response acceleration. In any case, changes would be due to turbulence intensities and integral length scale.
Based on the above, we can say that the reference velocity of the downburst outflow and the dimensions of the structures are the parameters that most influence the TWDS.

3.5. Applications on Structures

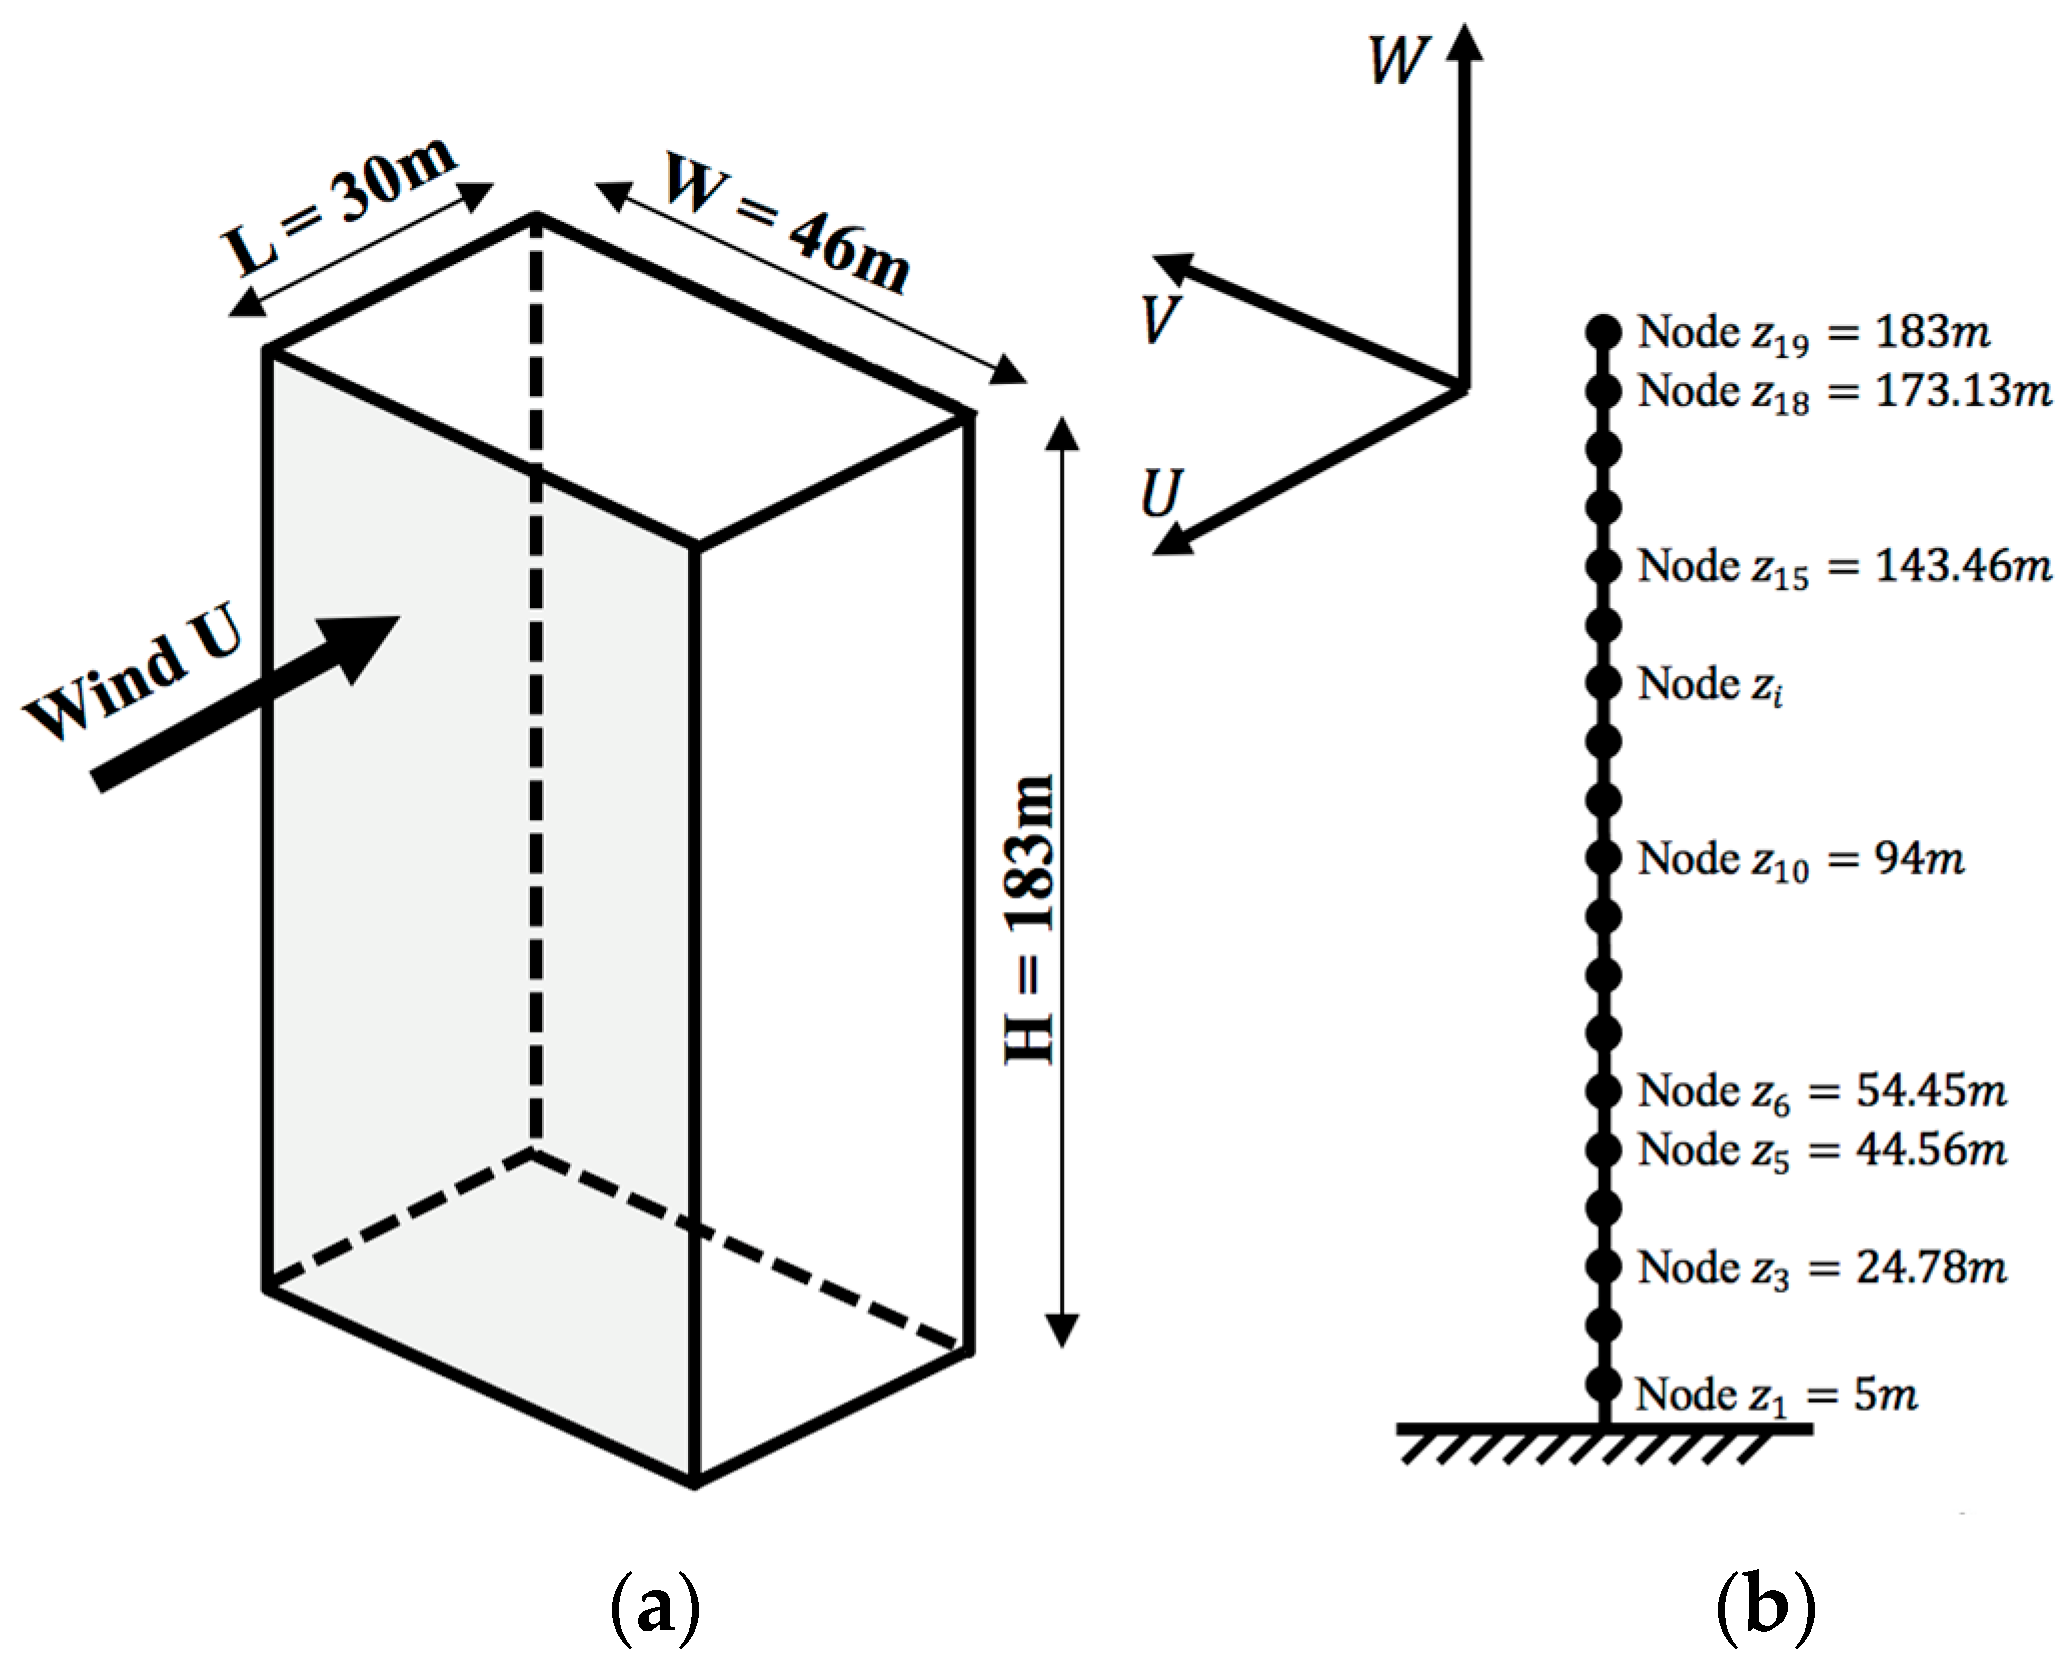
The Commonwealth Advisory Aeronautical Research Council (CAARC) benchmark building was experimentally tested across five different laboratories and has been regarded as representative of a tall building for the standardisation of wind tunnel testing practices [63]. This building has a width (W) and chord (L) of 46 m and 30 m, respectively, and a height (H) of 183 m—see Figure 8. The natural frequency of the building is 0.2 H z along the x and y directions; the fraction of the critical damping ratio equals 0.01 and the mass per unit volume of the building is assumed to be 160 kg∙m−3.
This building was initially modelled as a vertical mast formed by 19 members and 20 joints including the base support (see Figure 8b). For the quantification of the force induced by wind, the width of the building was divided into five bays enclosed in six nodes, i.e., y j = j 1   × 9.2 m, j = 1, 2, …, 6, and the chord divided into three bays confined by four nodes, i.e., x j = l 1   × 10 m, l = 1, 2, …, 4. The cross-correlation function given in Equation (20) was then used across the vertical and transverse directions of the windward surface of the building to estimate the acting load. The turbulence intensity at the top of the building was set to 10.57% with an assumed linear variation with the height, so that the turbulence intensity at a height of 0.5 × H equals 13.34%. The drag coefficients in the x and y directions were taken as 1.21 and 1.03, respectively.
The mapping of the MDOF system into its equivalent SDOF requires the generalisation of mass, stiffness, and force with which we could estimate the static displacement and the root mean square of the dynamic response with Equations (26) and (27), taking the first modal stiffness as k 1 = 4 π 2 n 1 2 m 1 .
f ¯ 1 ( z i ) = c D × 0.5 ρ W ( L ) U ¯ m a x 2 ( z i ) 1 i z i z i + 1 α 2 ( z ) ϕ 1 ( z ) d z
d 1 s ( z ) = f ¯ 1 ( z ) k 1
σ 1 d ( z ) = ϕ 1 ( z ) L 1 S a m 1 ( 2 π n 1 ) 2
In these equations, ϕ 1 z = ( z H ) ψ is the first modal amplitude that depends on the constant ψ that defines the curvature of the mode, whose recommended values fluctuate within 1–1.5. In this investigation, we use the lower bound ψ = 1 to approximate the rigid model that was tested in laboratories [64]. Further variables n 1 , m 1 , and L 1 represent the first natural frequencies, first modal mass, m 1 = 0 H m l ( z ) ϕ 1 2 ( z ) d z (where m l is the structural mass per unit height), and first modal excited masses, L 1 = 0 H m l ( z ) ϕ 1 ( z ) d z ), respectively. In Equation (27), i represents the i -th number of the recorded velocity time history and α z = U ¯ m a x z / U ¯ m a x ( z i ) is the non-dimensional vertical shape profile of horizontal wind. Finally, the peak displacement response was obtained by combining Equations (26) and (27), i.e., d 1 T ( z ) = d 1 s ( z ) + σ 1 d ( z ) .
For the analysis, a maximum value of 36.5 m/s was adopted corresponding to the 50-year return period of the slowly varying mean wind velocity measured at a 13 m reference height [39,65]. Table 3 shows the results obtained with the spectral method. Therefore, two sets of dynamic analyses are presented per approximation, one considering the cross-correlation in full, as in Equation (20), and the other considering the vertical correlation only. The latter was conducted to extend the comparison of the results with two other approaches discussed in the following sections, namely Newmark’s and a separate numerical model. According to these results, the dynamic displacement in the x direction is 0.328 m at the top of the building when considering bi-directional correlation and 0.352 m when using the vertical correlation only, which establish a difference of about 7%. This pattern is also observed in the results obtained for the y -direction.

4. Comparison with Other Numerical Methods

4.1. Primary Validation of the Algorithm Referring to WDS for Synoptic Wind

This section focuses on the implementation of the methodology suggested by Martinez-Vazquez [33,34]. Past this stage, we adapt the algorithm to comply with the TS downburst wind regime. The parameterisation of the case study is detailed in Section 3.5, where the velocity profile for synoptic wind is estimated using Equation (28).
U ¯ ( z ) = U ¯ H × ( z / H ) ϵ
The static and dynamic displacements were computed using conventional generalised methods, as defined by Equations (26) and (27), with f 1 replacing f ¯ 1 , consistent with the approach outlined in Martinez-Vazquez [33,34]. The static generalised force is given by f 1 = 0 H f l ( z ) ϕ 1 2 ( z ) d z , where f l ( z ) is derived from the static wind profile via Bernoulli’s equation.
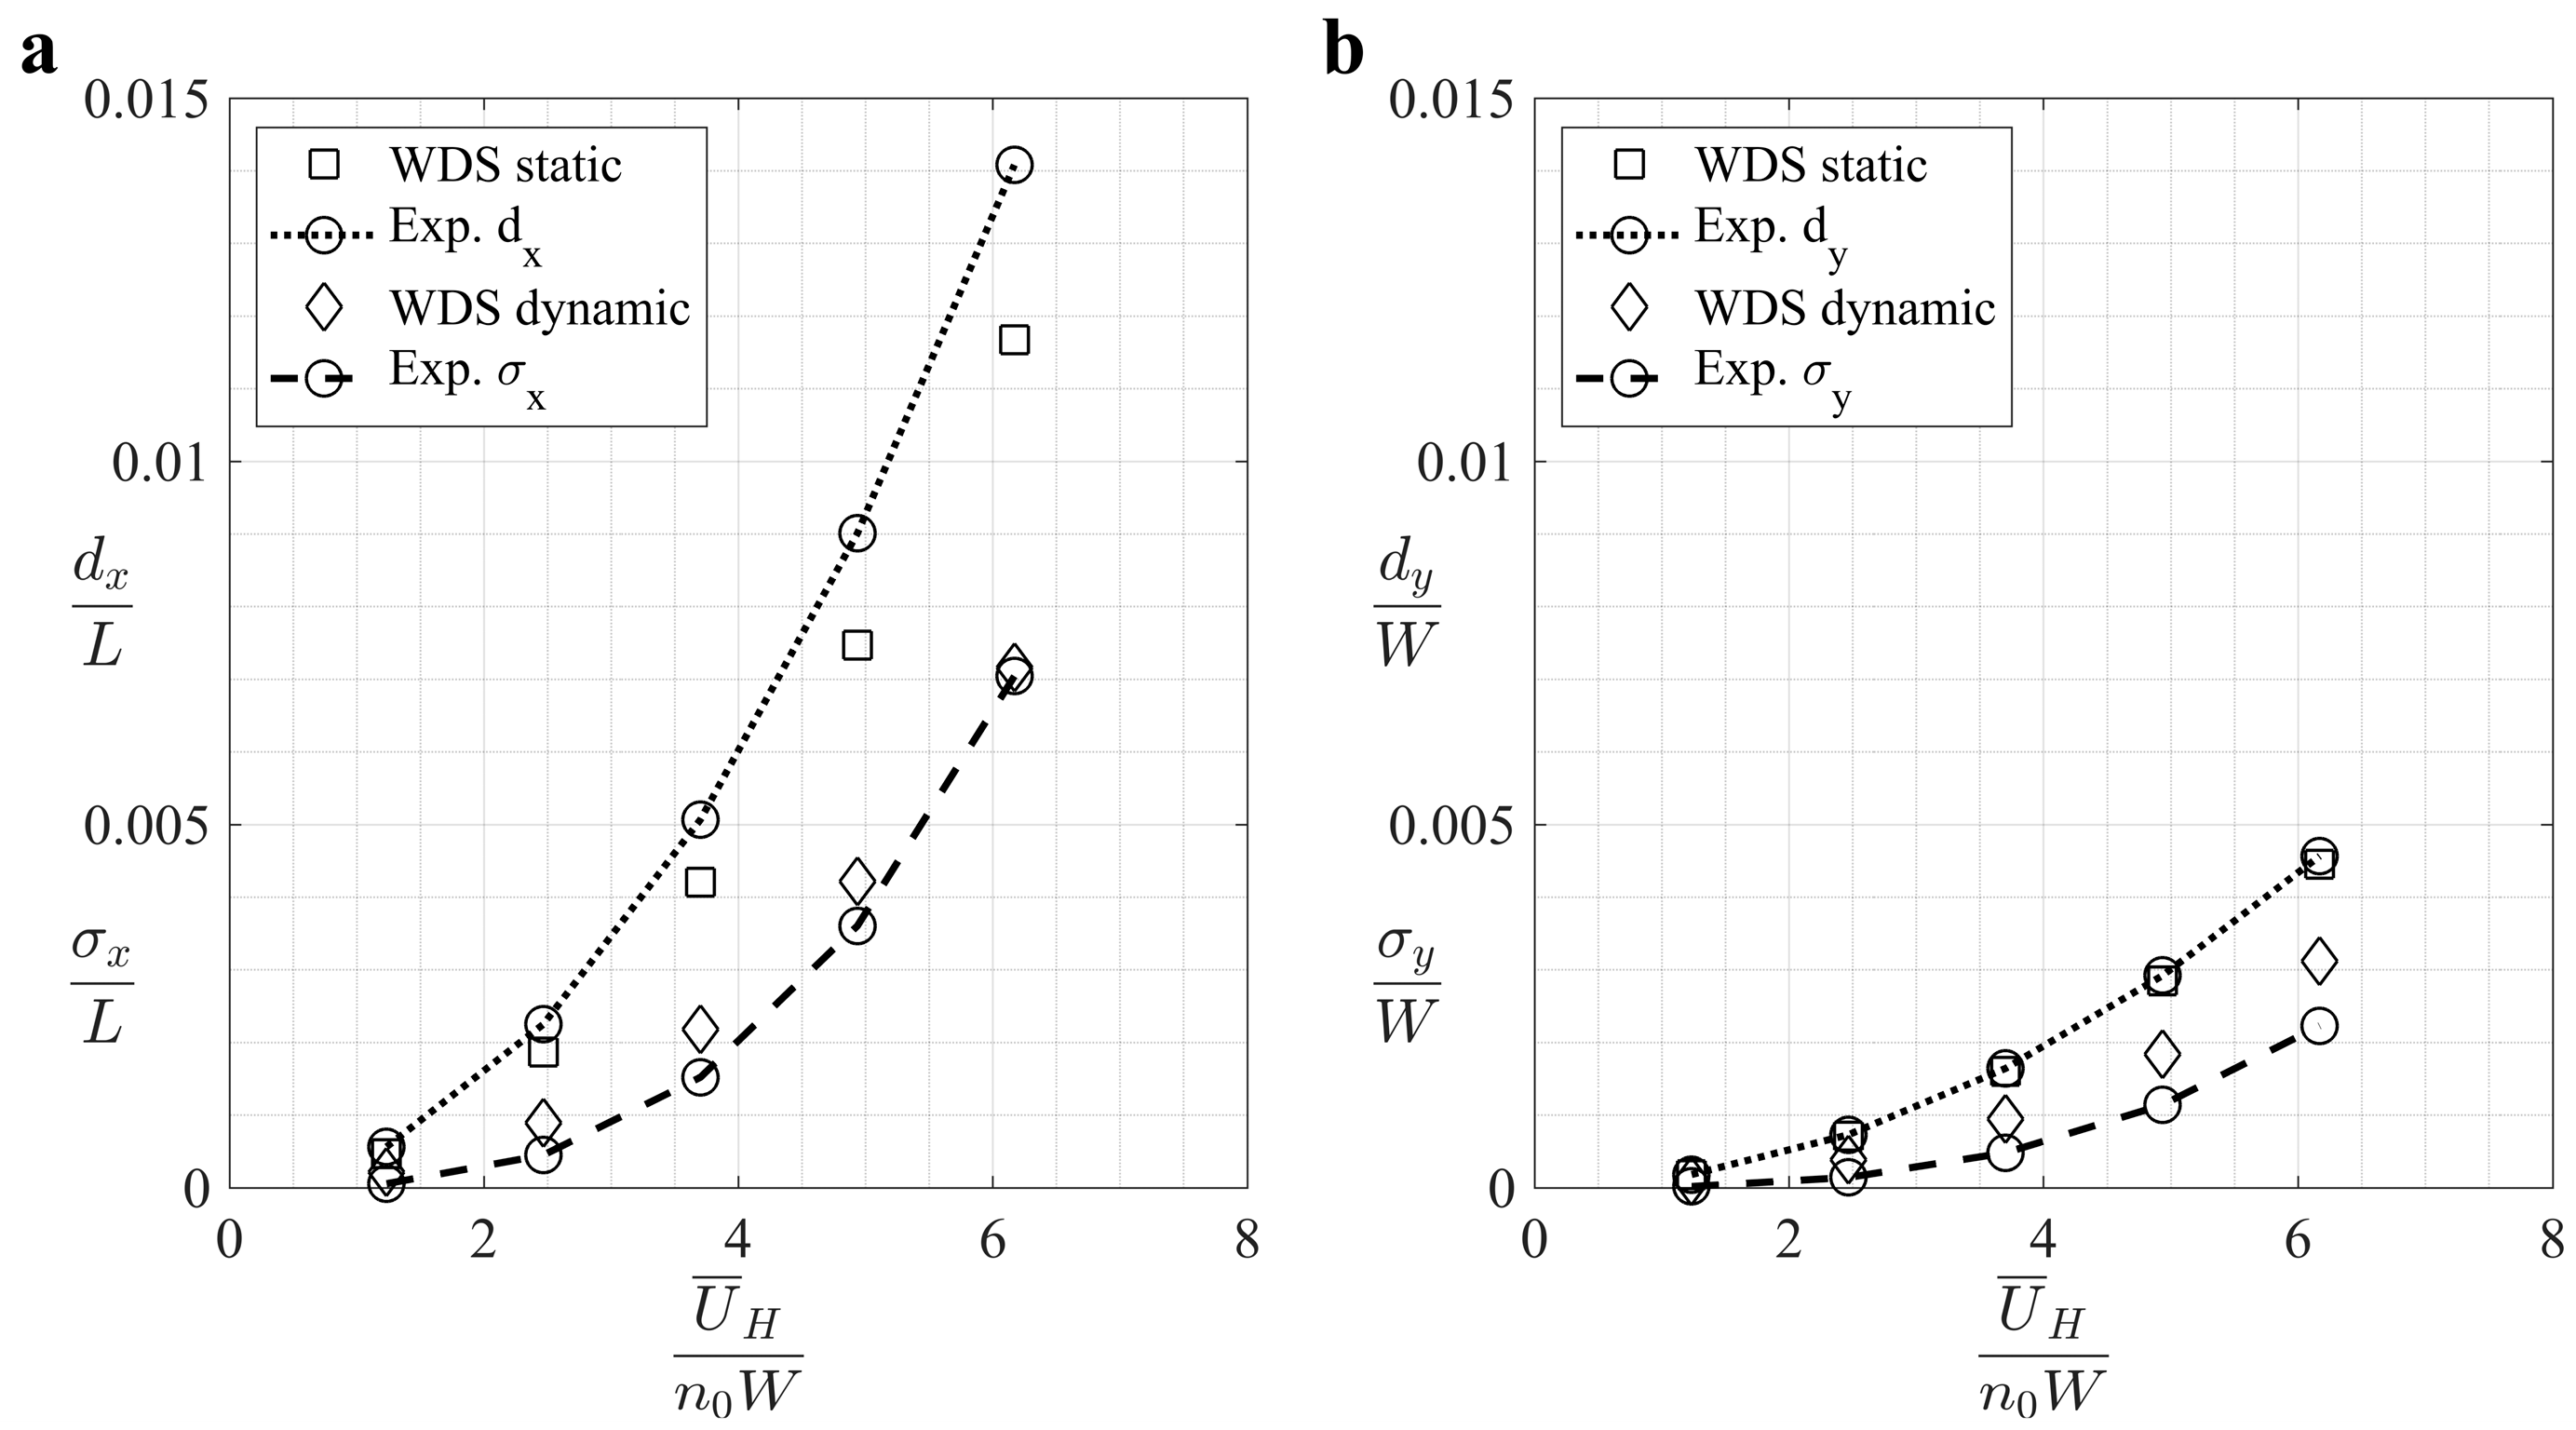
The static and dynamic displacements estimated at the top of the building are summarised in Table 4. Figure 9 compares the non-dimensional displacements obtained using the design spectral method with those reported by Melbourne [63], with Equation (29) [63] employed for the comparison. In the x -direction, the static displacements predicted by the spectral method are slightly lower than the experimental values (fit curve), while good agreement is observed in the y -direction. The maximum discrepancy reaches 0.073 m at U ¯ 10 = 25 m/s in the x -direction and 0.005 m in the y -direction under the same reference velocity. For dynamic displacements, the spectral method yields slightly higher values than the experimental results in both directions. The largest divergence is 0.021 m in the x -direction at U ¯ 10 = 15 m/s and 0.041 m in the y -direction at U ¯ 10 = 25 m/s, respectively.
d x L = 3.7 × 10 4 ( U ¯ H n 0 W ) 2 ; σ x L = 3 × 10 5 ( U ¯ H n 0 W ) 3 ; d y W = 1.2 × 10 4 ( U ¯ H n 0 W ) 2 ; σ y W = 9.5 × 10 6 ( U ¯ H n 0 W ) 3
The present results show good agreement with those reported by Martinez-Vazquez [34], confirming the correct implementation of the numerical algorithm. The following section presents the analysis based on the newly developed design spectra, specifically formulated for TS downbursts.

4.2. Simulation of Downburst Outflow Data Series

The simulation of the TS outflow described in this section fed both the theoretical and numerical models referred to above. The hybrid procedure proposed by Deodatis [66] and later applied by Chen and Letchford [6] was followed, which requires the generation of random fluctuating velocity in four key steps [67]:
(1) Definition of the EPSD matrix, as proposed by Chen and Letchford [6].
(2) Cholesky decomposition of the cross-spectral density matrix.
(3) Input decomposed values to a stationary Gaussian stochastic process [66].
(4) Integration of response components via a fast Fourier transform.
In line with the spectral method, 19 recording stations were defined above the ground identified in Figure 8b. The cut-off circular frequency was assumed to be 4 rad/s and the number of circular frequency steps, N, was set at 2048. It was considered reasonable to establish a sampling frequency for the simulated fluctuation of 2.56 Hz.
Figure 10a shows the estimated PSD function of the longitudinal fluctuating velocity with unit standard deviation at selected stations along the height of the building, whereas Figure 10b shows the corresponding coherence function between pairs of joints along the vertical axis. The PSD shows that higher-up nodes have more turbulence in the lower frequency range, while lower nodes accept less energy but are more evenly distributed while reaching the high frequency range that characterises small eddies. Figure 10b simply validates that the closer the two points, the higher the gust coherence in the high frequency region and that all curves shall converge to 1 as we move towards the zero frequency.
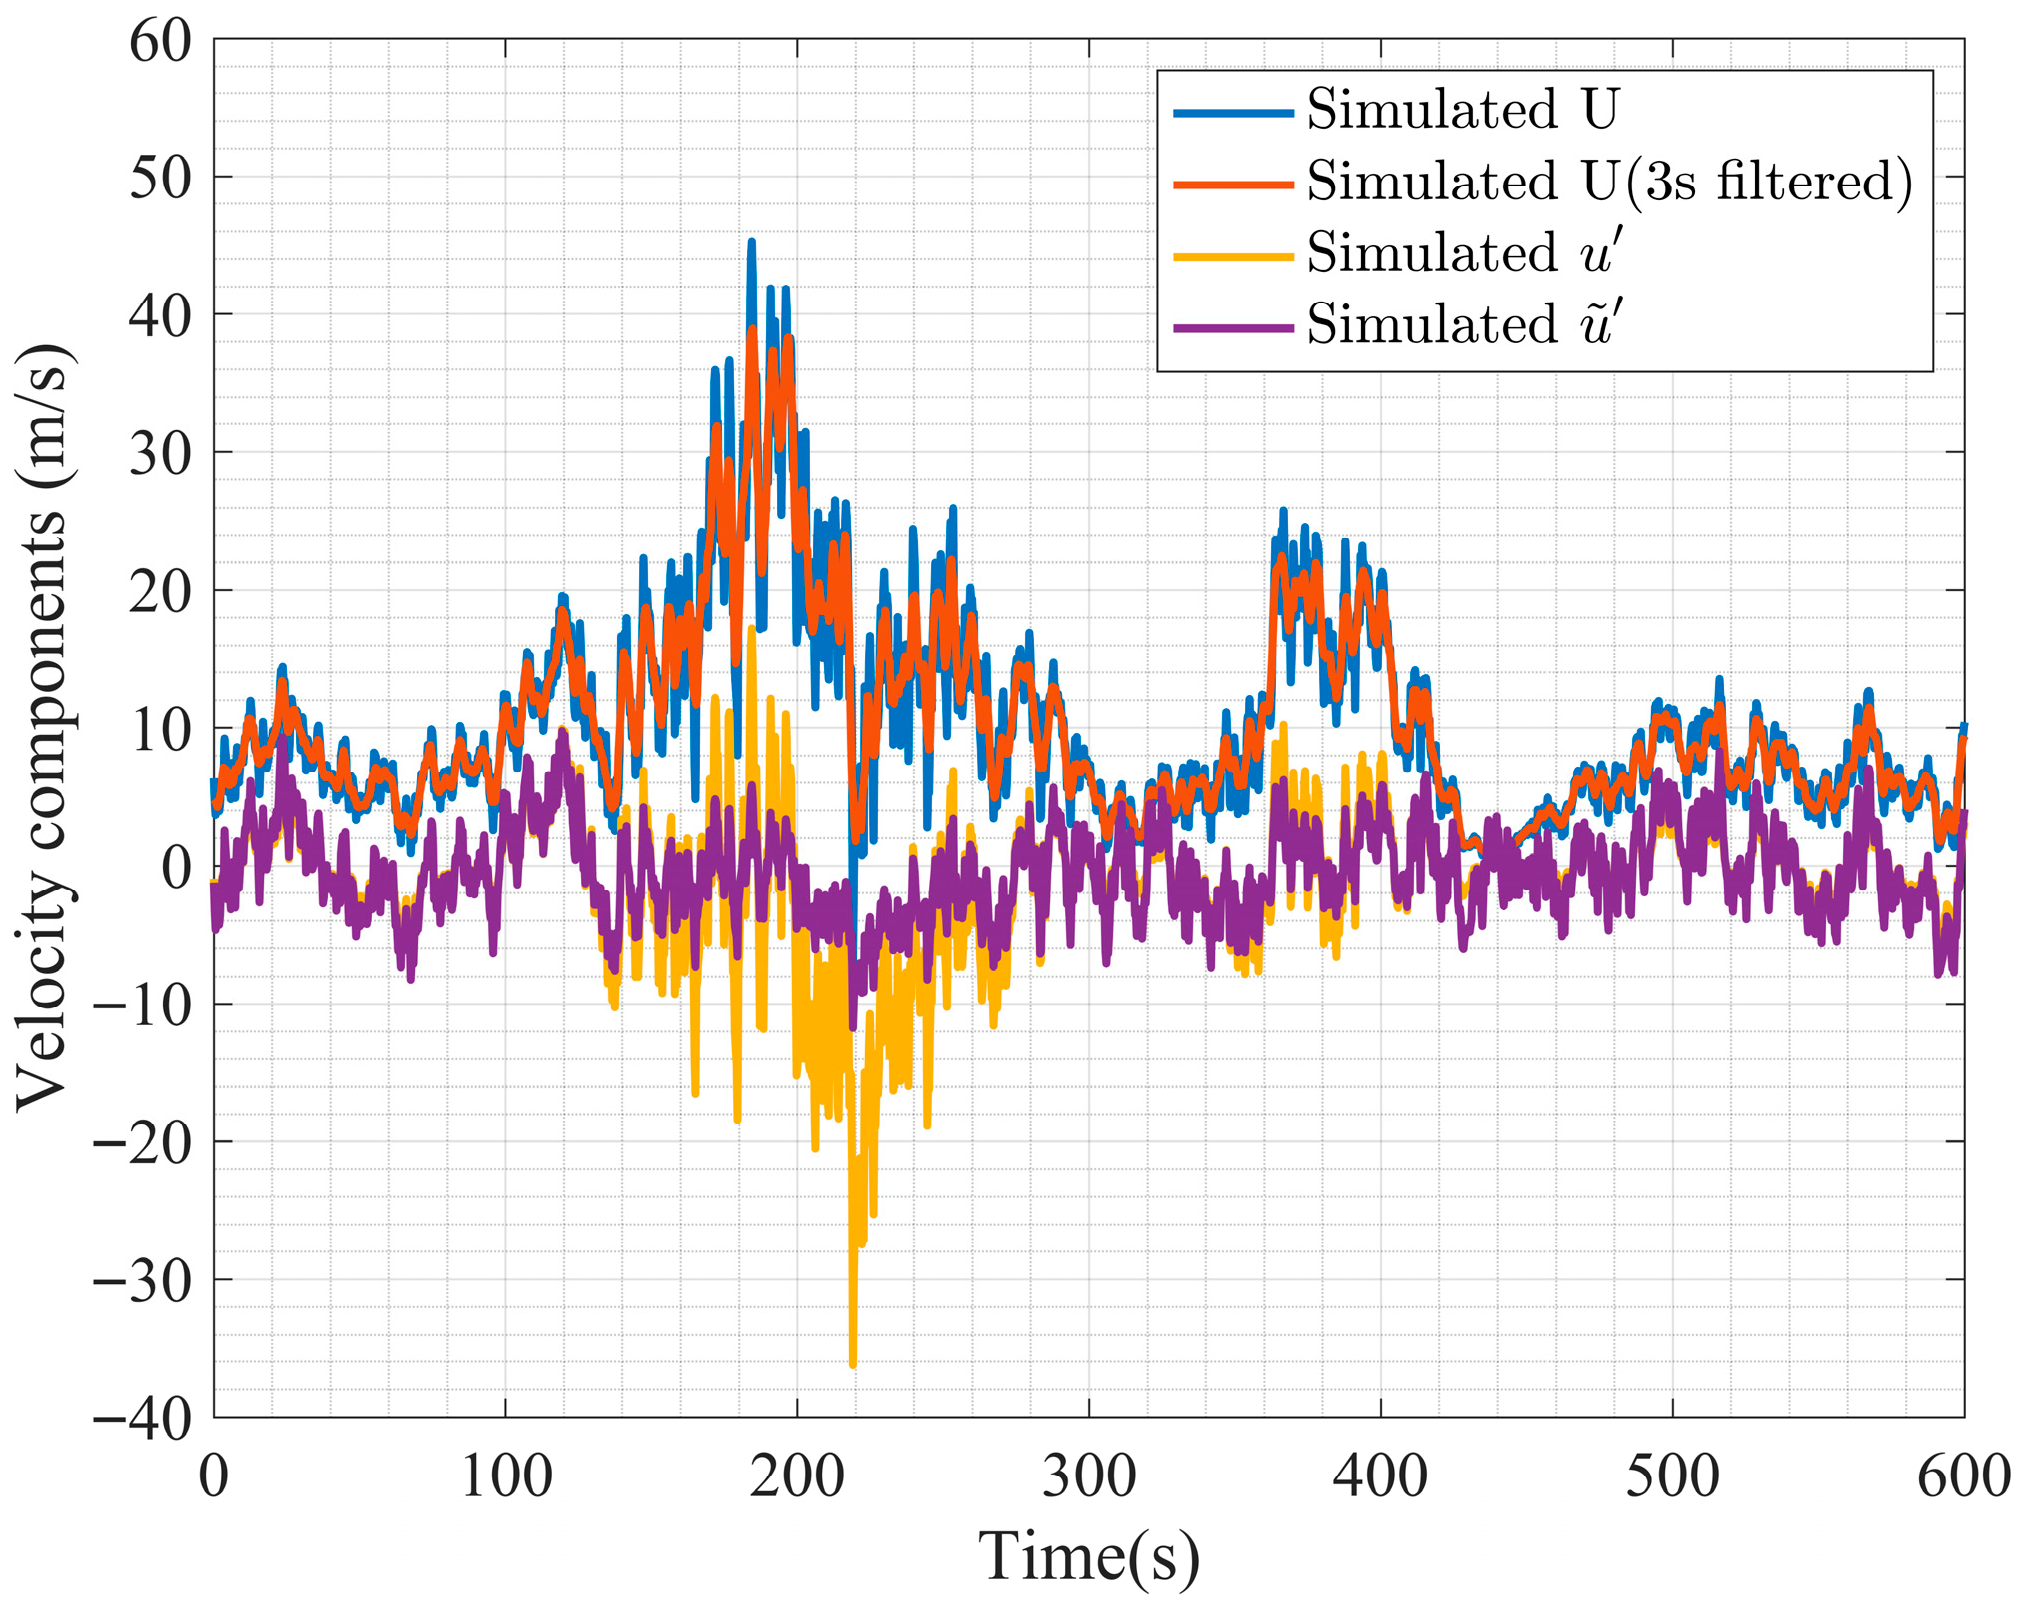
Figure 11 shows the simulated reduced horizontal fluctuating velocity component ( u ~ ) in addition to the fluctuating velocity ( u ) and total wind ( U ). To obtain the fluctuating velocity time history, u (i.e., u ( z , t ) = a ( z , t ) κ ( z , t ) , a z , t = I ¯ u ( z ) U ¯ ( z , t ) ), we used the experimentally determined amplitude modulation factor ( I ¯ u ( z ) ). In this definition, κ ( z , t ) represents a stationary Gaussian stochastic process and a ( z , t ) is the amplitude modulation function. The overall velocity (illustrated in the blue) was thus determined with Equation (4) to Equation (7), whereas the 3 s peak velocity was included for further comparison.
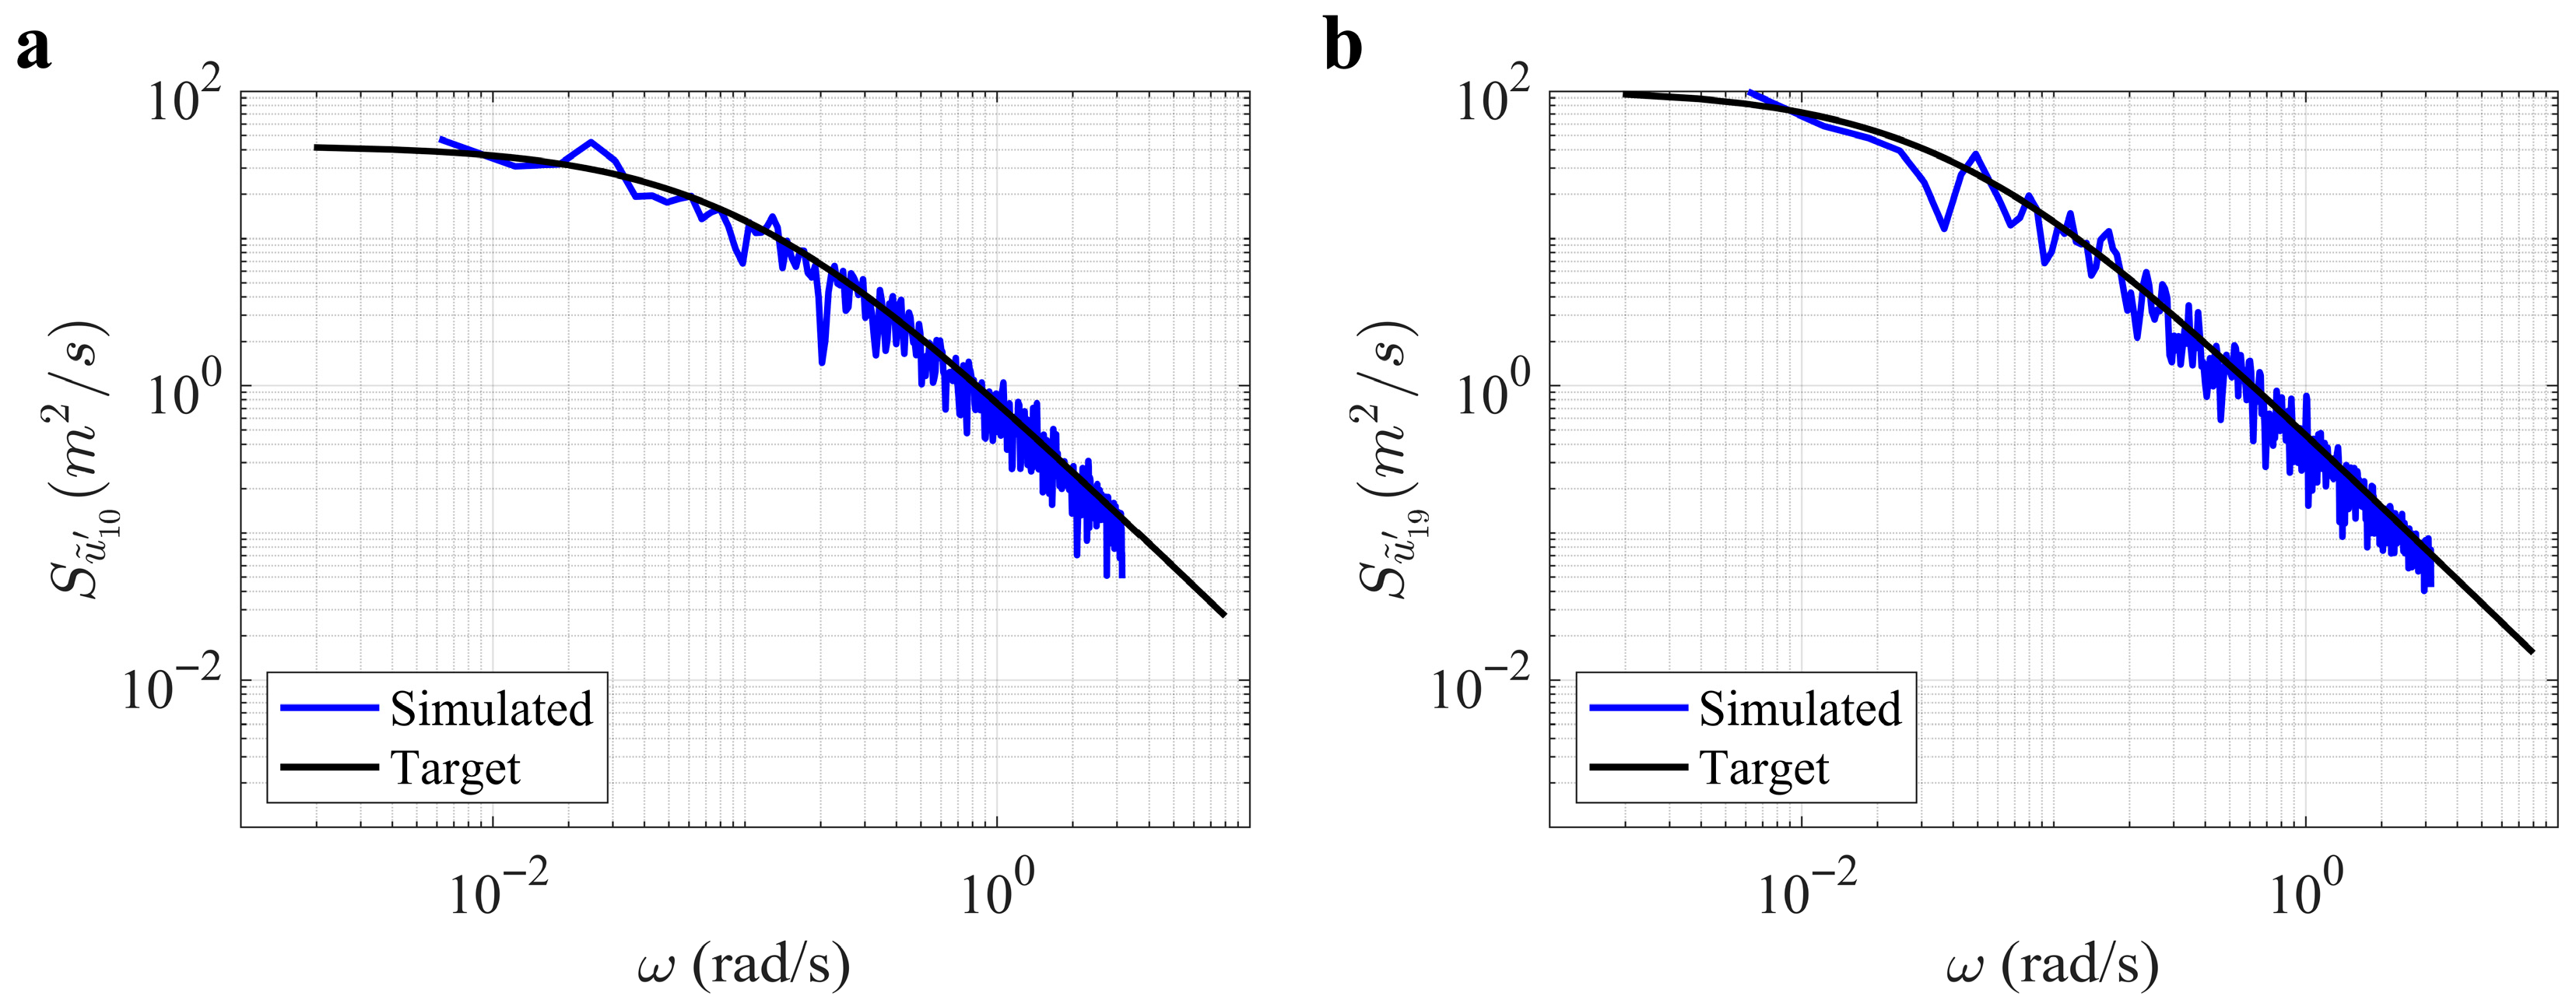
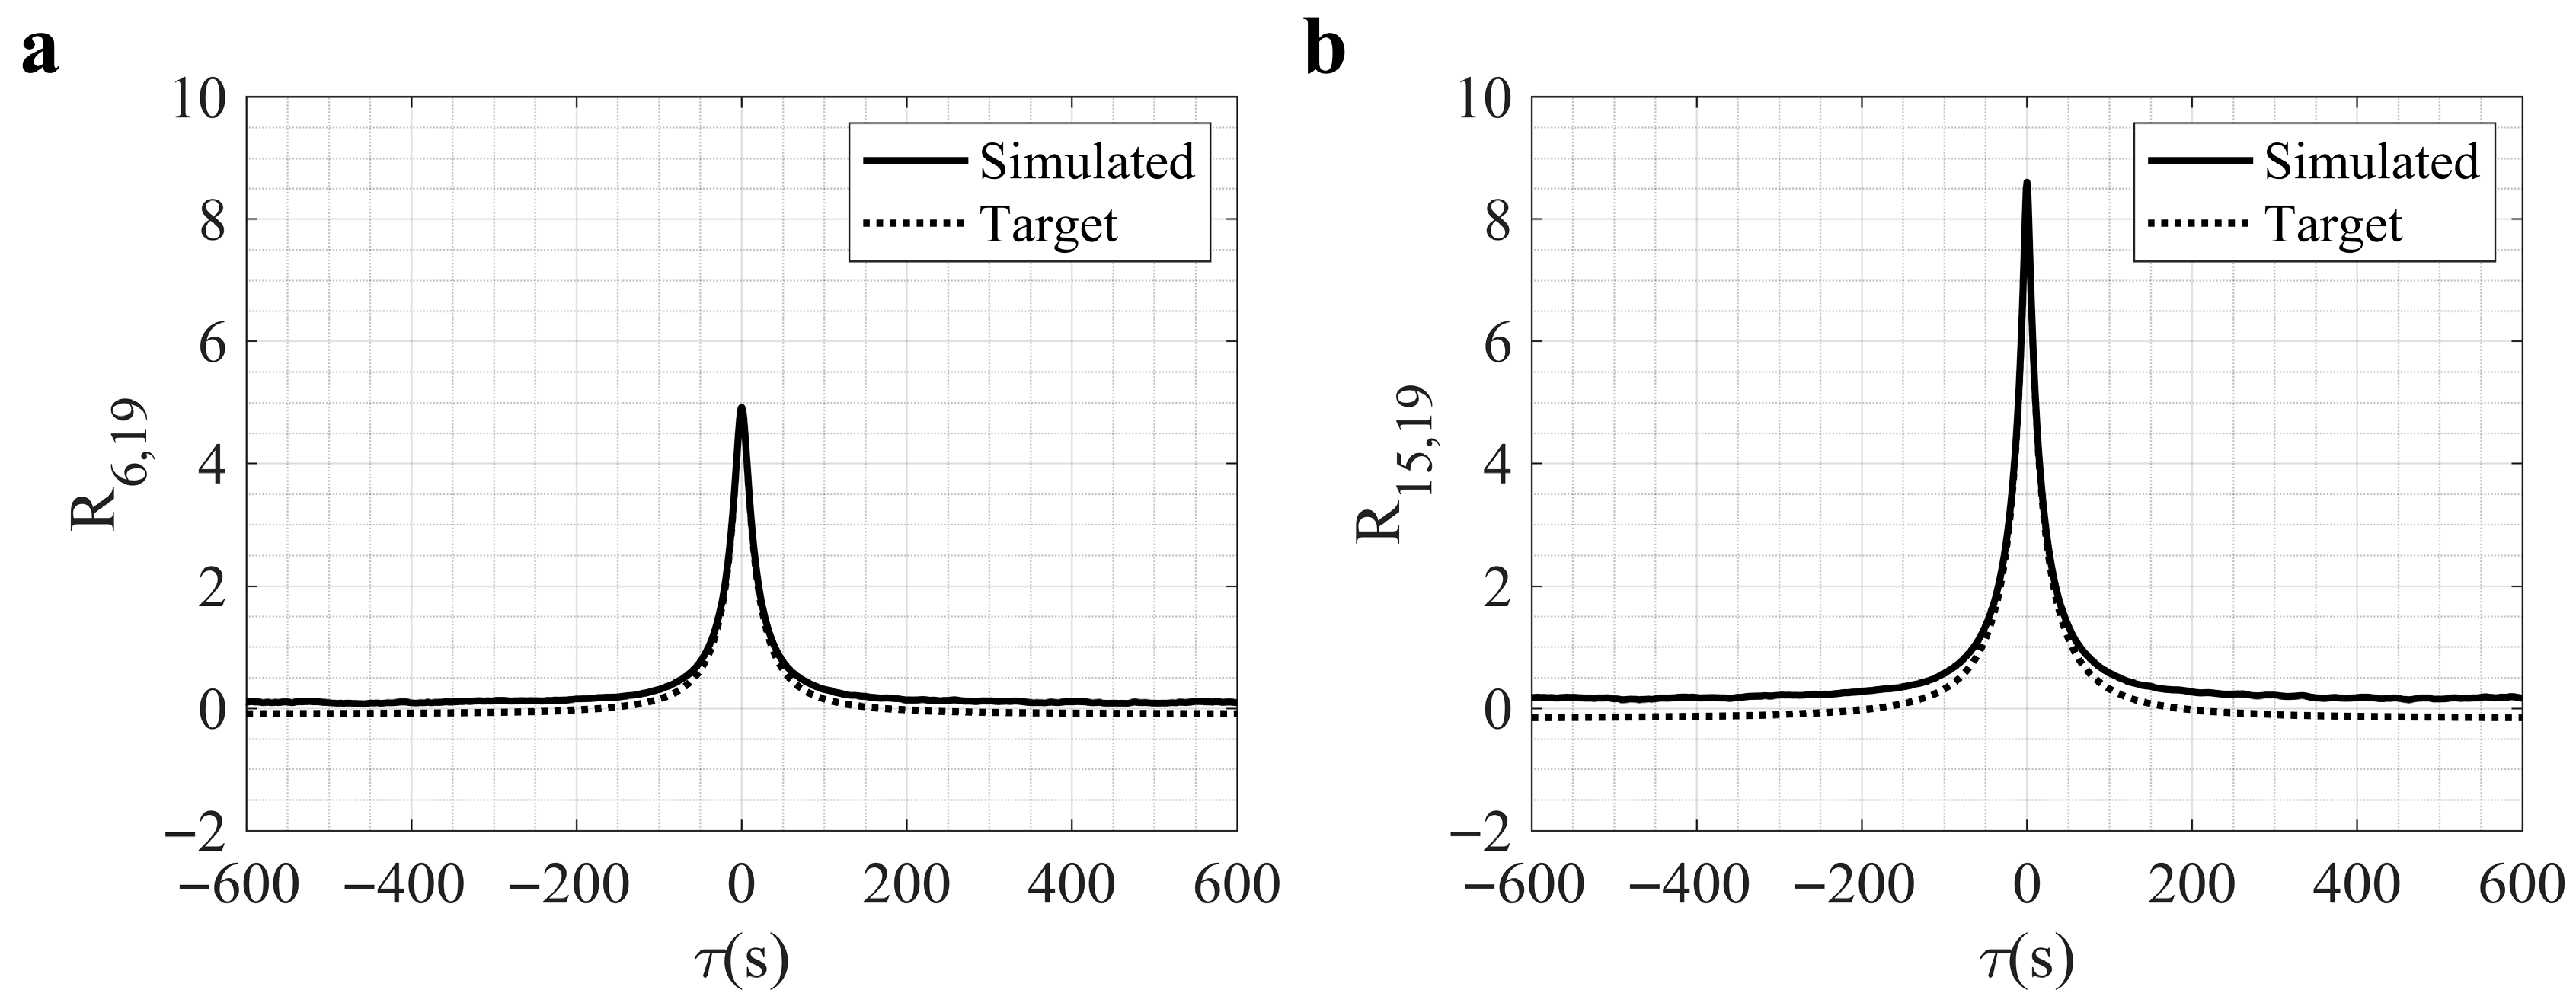
Figure 12 compares the target PSD, S i , i ( ω ) , of the sample function κ ( z i , t ) , with the PSD inferred from its simulation. The PSD of κ ( z i , t ) is expressed as φ ( z , ω ) = 18 z U ¯ m a x ( z ) 1 + 27 ω z 2 π U ¯ m a x ( z ) 5 / 3 with + φ ( z , ω ) d ω = 1 . Finally, Figure 13 shows the target and simulated cross-correlation function R i , j of κ ( z i , t ) and κ ( z j , t ) , which demonstrate consistency between the synthetic and real data.

4.3. Newmark Integration

The simulated outflow wind field time series was applied to calculate the peak displacements at the 19 recording stations using the algorithm proposed by Newmark and reported in Chopra [68]. The acting force field that fuels the building’s dynamic response was determined with Equation (30), which is analogous to Equation (25) where each time step is related to the i-th point in a data series.
f ¯ 1 ( z i , t ) = c D × 0.5 ρ W ( L ) U ¯ 2 ( z i , t ) 1 i z i z i + 1 α 2 ( z ) ϕ 1 ( z ) d z
The results in Table 3 show larger roof displacements compared to those derived from the TWDS, with the ratios between them being approximately 1.24 in the x -direction and 1.18 in the y -direction, as shown in Table 3.

4.4. Numerical Simulation

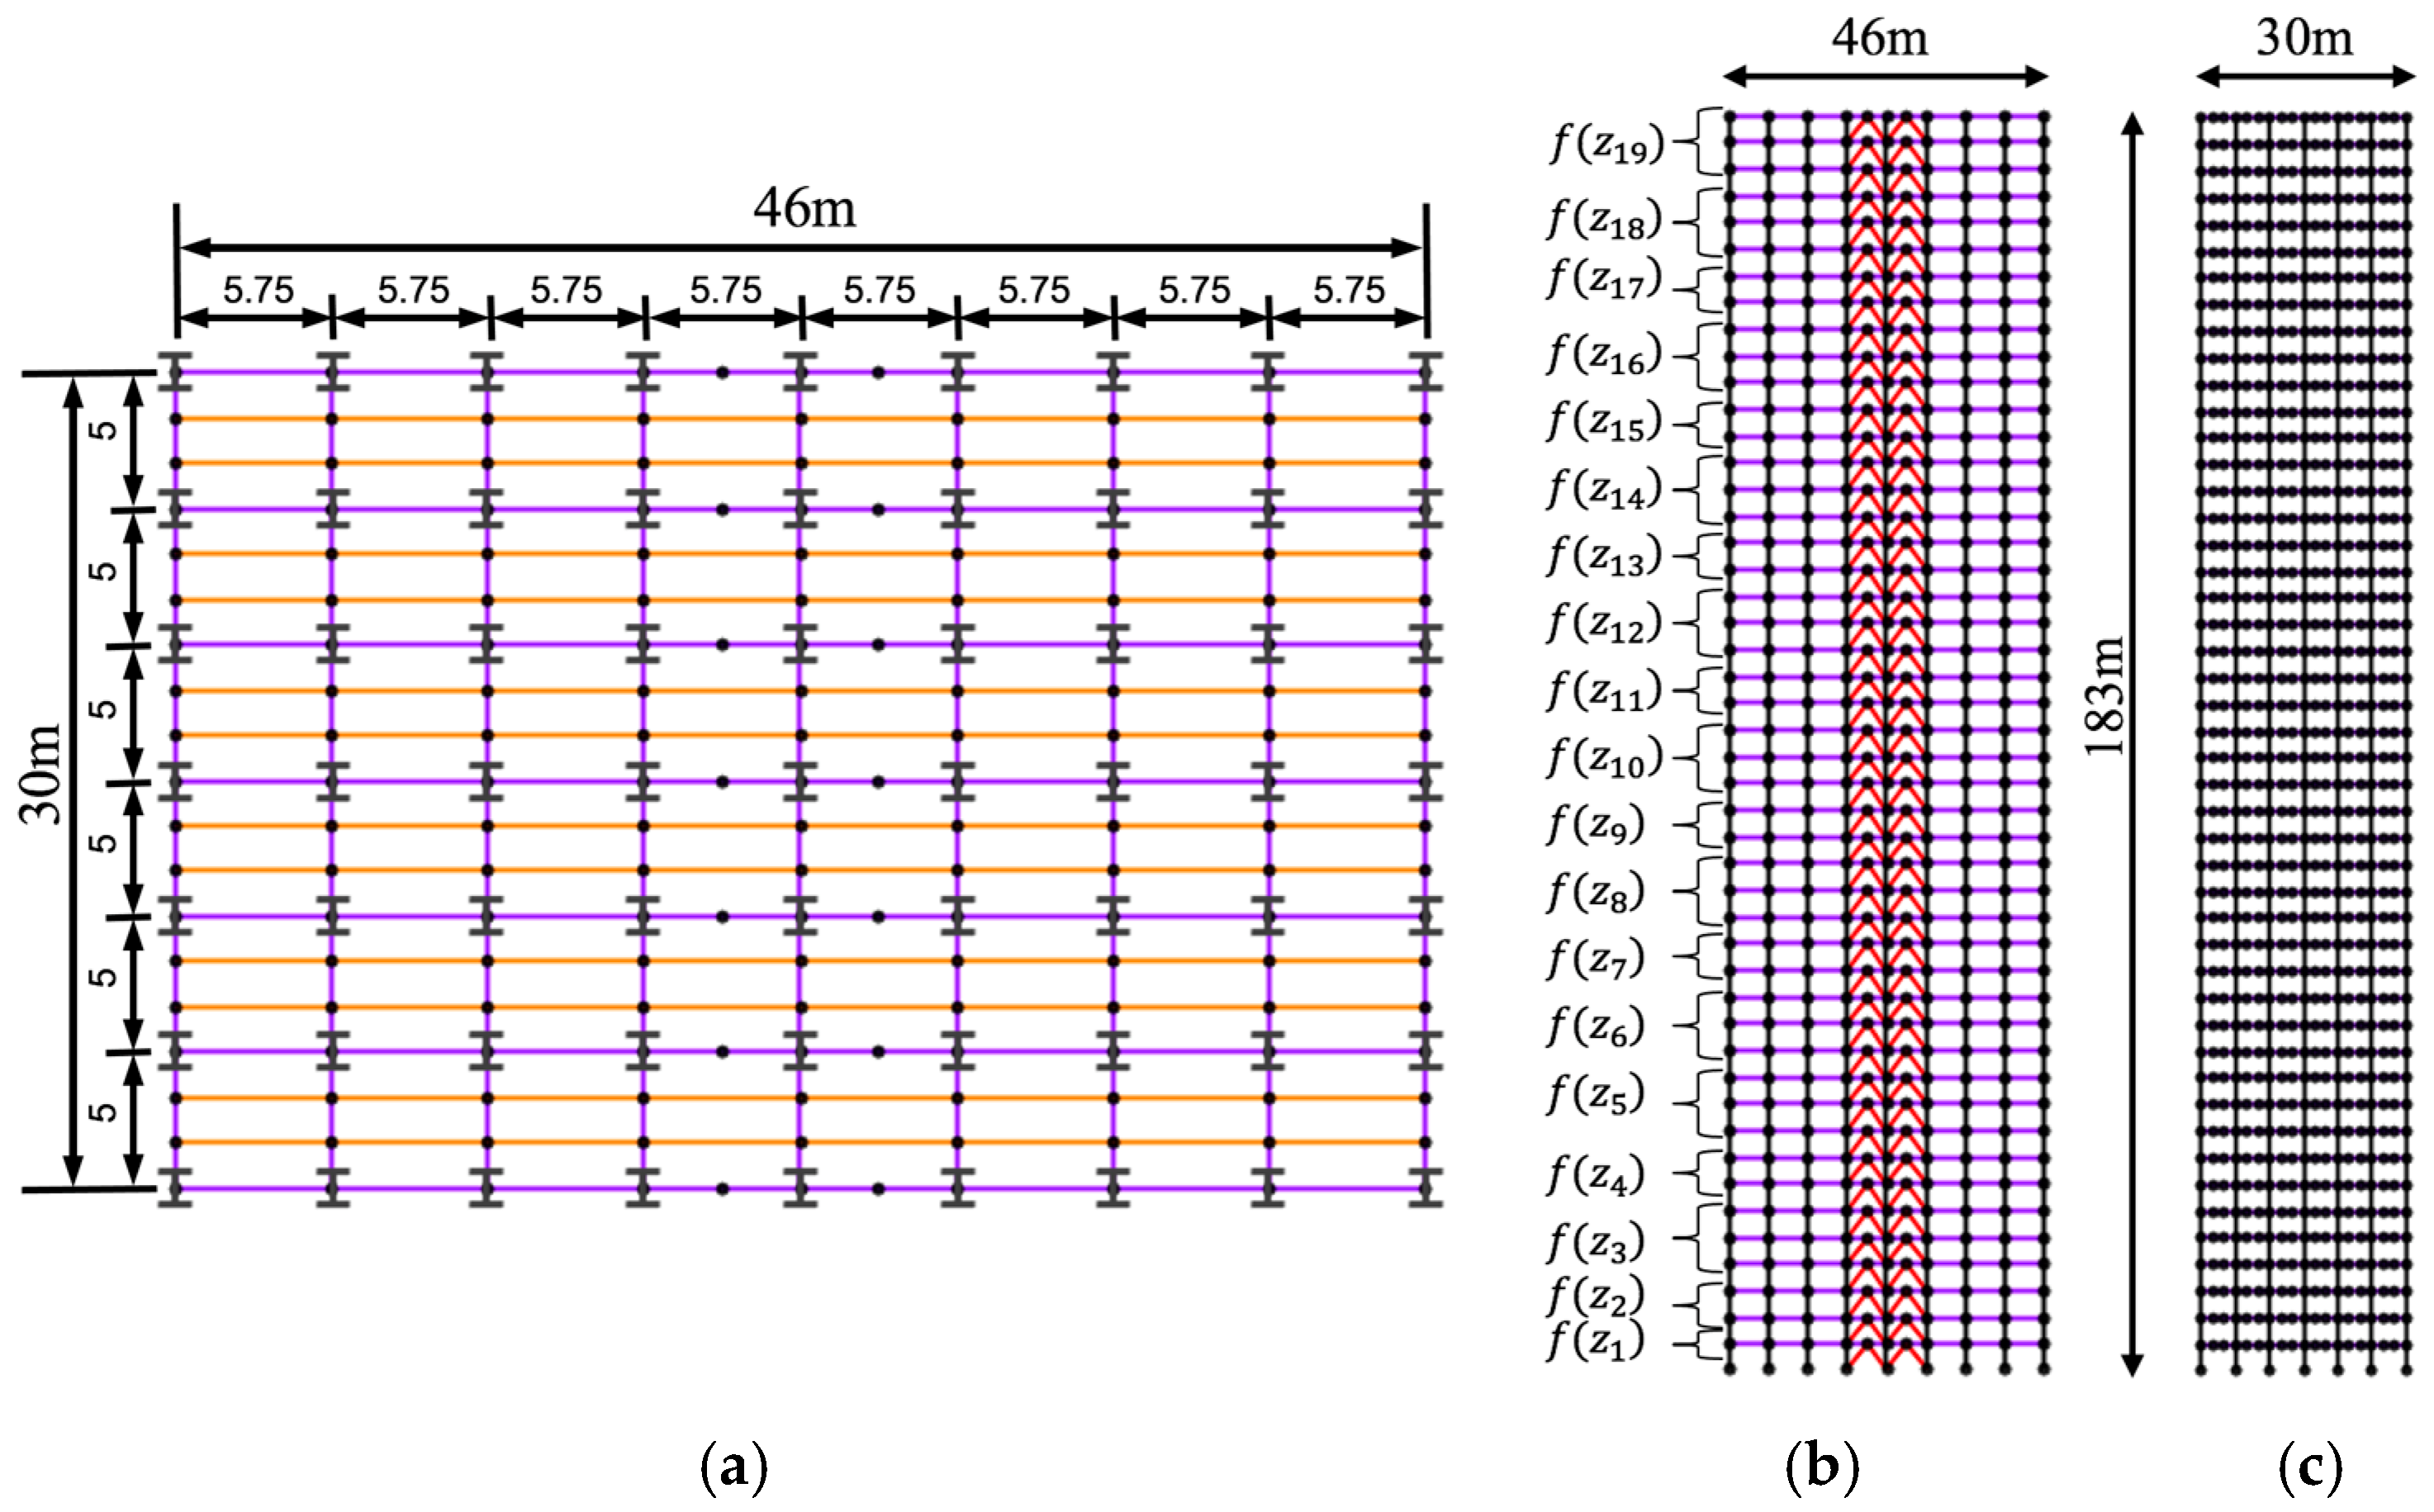
The CAARC benchmark building was also modelled as a high-rise steel structure in SAP2000 21V 2013 [64]. The width (W) was divided into eight bays, each measuring 5.75 m, and the chord (L) was divided into six segments, each 5 m long (see Figure 14a). The height of the ground floor was set to 3.6 m and of 3.9 m for each of the 46 storeys (see Figure 14b,c), while the steel sections shown in Table 5 were used to form the frame structure.
The gravity force applied at each floor was 8439 kN, except for the first floor, which carried 7790 kN. The simulated transient force ( f ( z ) = c d 0.5 ρ U z , t 2 W ( L ) H s t o r e y was determined assuming c d = 1.2 in the x -direction, c d = 1.03 in the y -direction (as per Melbourne [63])), ρ = 1.225 kg/m3, and a roughness length of 0.5. Lateral and vertical forces were all concentrated on the corresponding joints.
To match the natural frequency of the vibration of the benchmark, we added inverted V-shaped braces in the intermediate two frames on each floor. The results of the natural frequency analysis are provided in Table 6.
As shown in Table 3, the lateral deformations in the x and y directions recorded at the roof equal 0.413 m and 0.214 m, respectively. These values are 17.7% and 3.9% (x and y directions, respectively) higher than those estimated with the spectral method (single correlation). It is worth noting that the values obtained through Newmark integration and the numerical simulation exhibit a high degree of similarity. It is hypothesised that differences arise from the parameterisation required for working out each method. For example, the simulation of time series directly uses the fluctuating velocity component ( u ), whereas the spectral method simplifies with the reduced fluctuating velocity ( u ~ ) later renormalised through the force factor q.
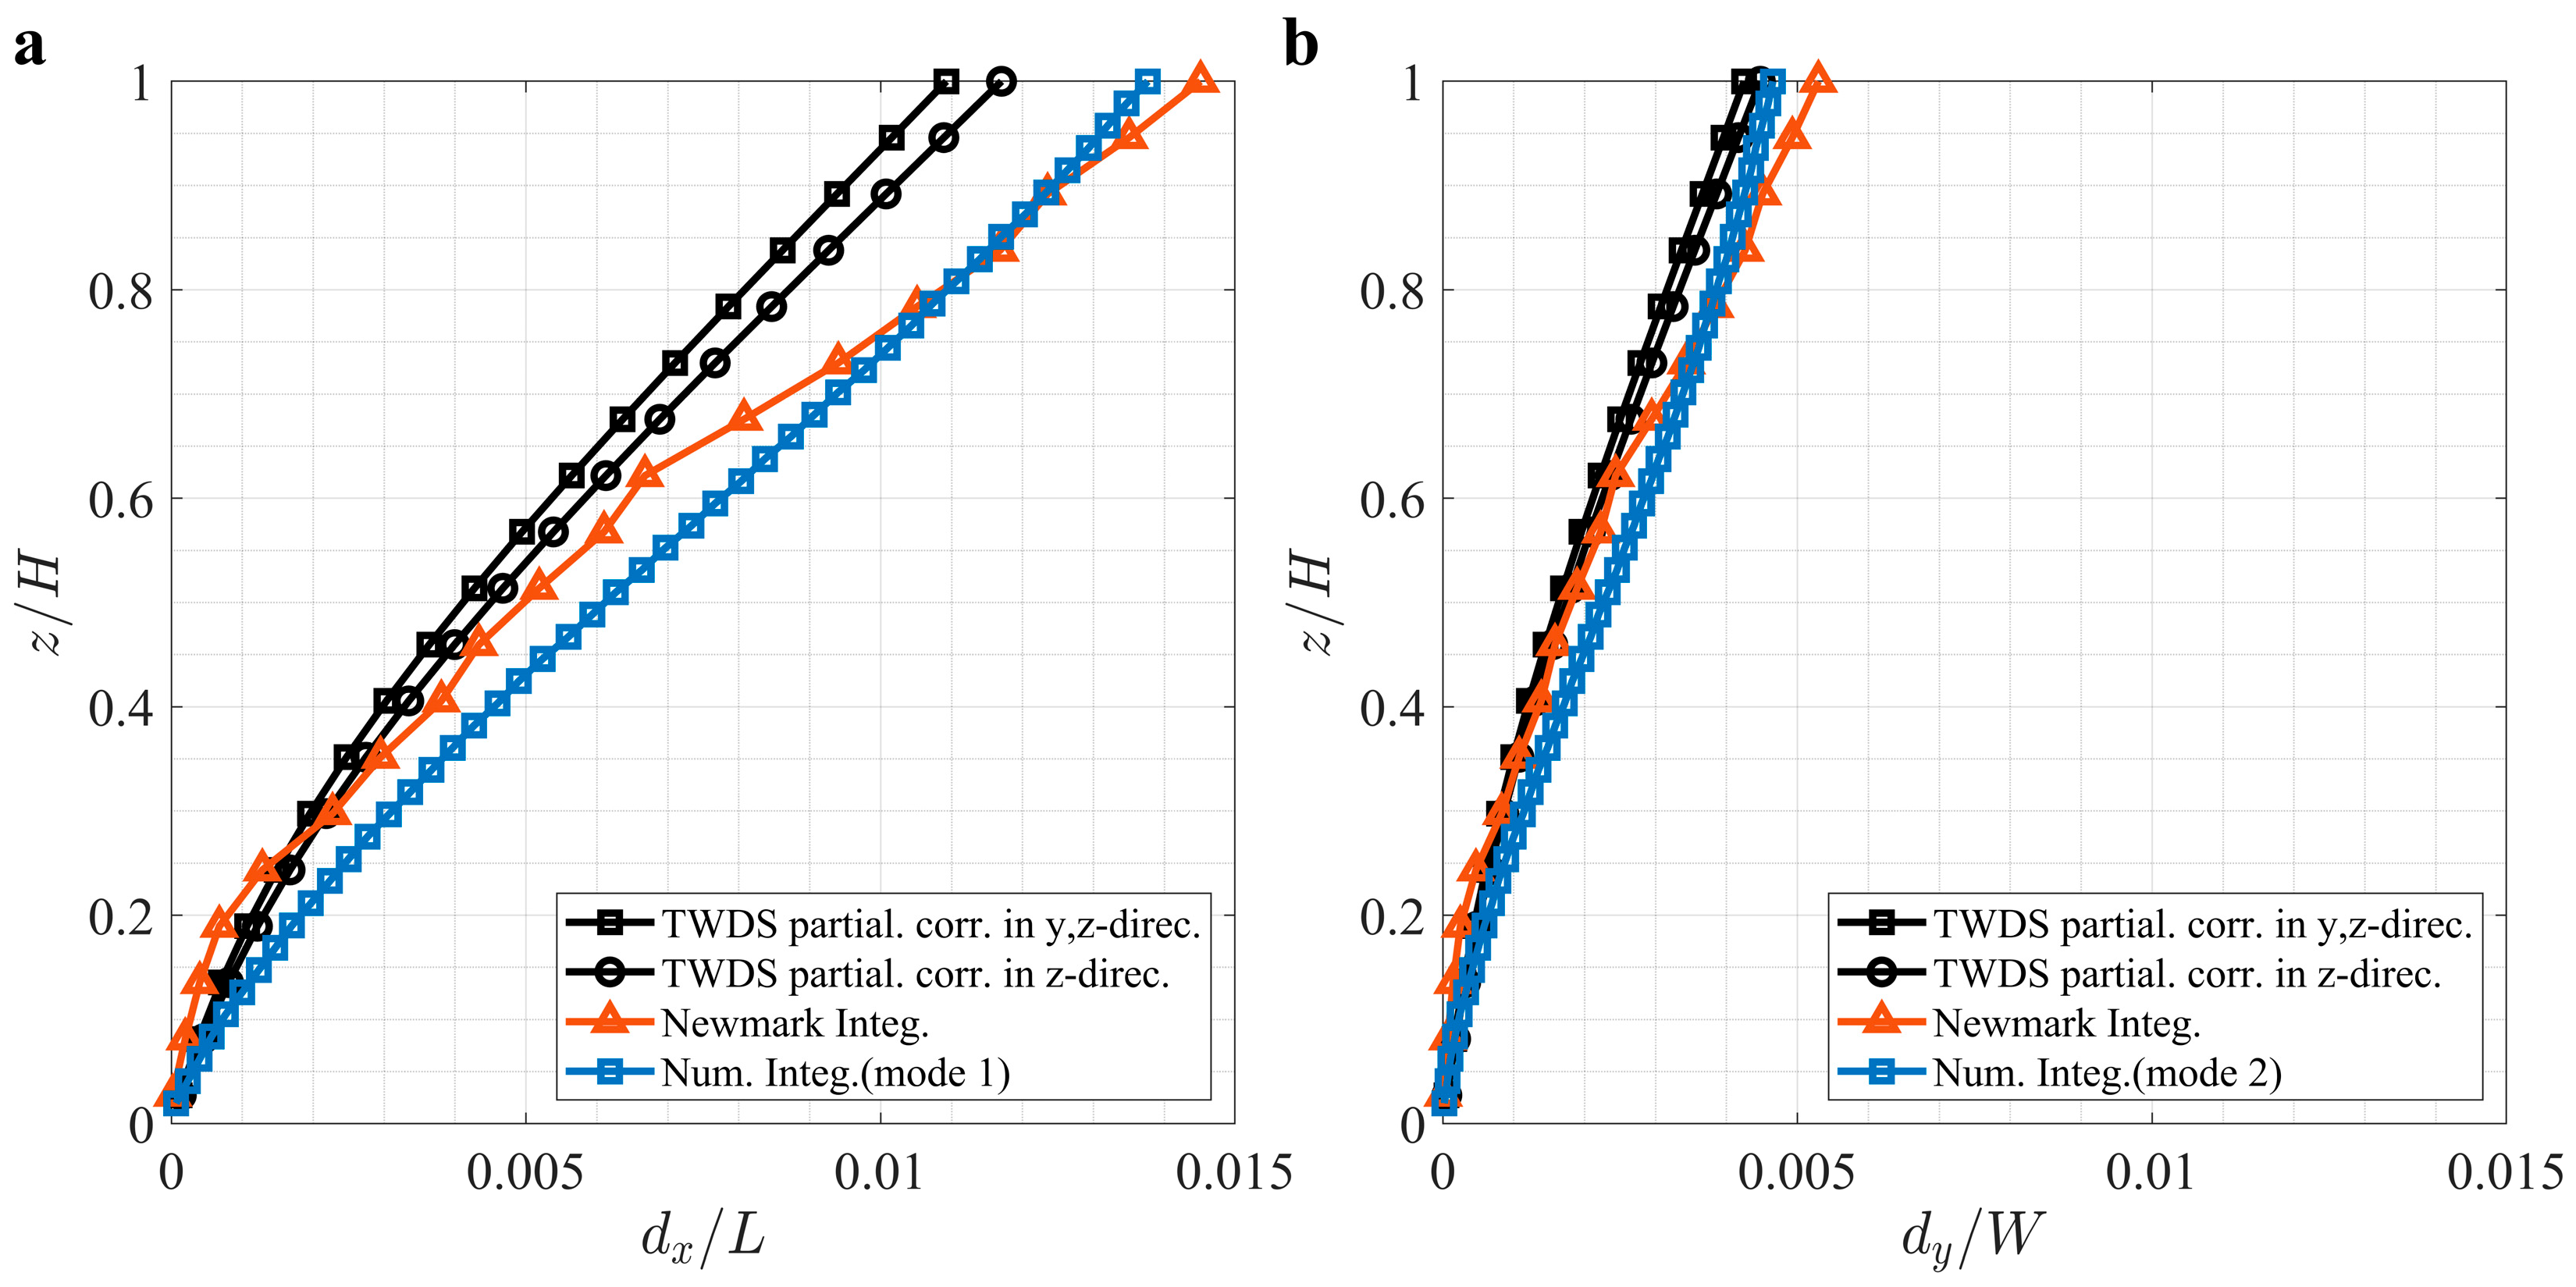
Further comparison of the dynamic response along the total height of the structure is shown in Figure 15. In this figure, where d x and d y represent the lateral displacement in the x and y directions, respectively, we see how close the response is considering the total and partial correlation when using TWDS, while a consistent difference was obtained with numerical methods. It is also worth noting that, when considering the first eight modes to determine the total dynamic response, only a slight disparity in lateral deformations can be observed, with respect to the values presented in Table 3, which relate to the fundamental mode only. With eight modes, the lateral displacements in the x and y directions become 0.404 m and 0.213 m, respectively; hence, the lateral displacements caused by the TS outflow wind load can be effectively approximated by considering only the first mode in the x -direction and the second mode in the y -direction. Although the modal participating mass ratio for these first two modes may reach up to only 70%, the slight difference in the response when incorporating the remaining modes, which collectively contribute up to 90% in the modal participating mass ratio, can reasonably be disregarded.

5. Sensitivity Discussion and Practice Advancement

5.1. Sensitivity Discussion

This analysis is based on the Modal Spectral Method, in which a design response spectrum is used to determine modal forces and displacements. The spectrum is constructed by considering a SDOF oscillator whose dynamic characteristics are systematically varied to cover the target frequency range. These are derived through a generalised representation of the wind-induced forces acting on the MDOF system. Once the spectrum is established, modal analysis can be performed, accounting for the contributions of higher-order modes. Notably, the results obtained via the spectral method are in good agreement with those from two independent numerical simulation approaches, as demonstrated in Figure 15.

5.2. Practice Advancement

The development of design spectra for wind engineering necessitates a shift in current engineering practice. Unlike in seismic design, where such tools are well established in codes, wind engineering currently lacks standardised design spectra in its practice. Integrating these spectra into design codes aligns with ongoing efforts to advance performance-based wind-resistant design, underscoring the novelty and significance of the proposed approach. Furthermore, the methodology for deriving design spectra presented in this paper is adaptable to other wind regimes through the appropriate parameterization of wind fields, offering broad applicability across diverse climatic conditions.

6. Conclusions

This paper presents an extension of the established wind design spectra [33,34] to cover thunderstorm downbursts. The established framework follows classical spectral methods but incorporates the spatial correlation of wind gusts that distinguishes the force fields from those specified for earthquakes. The framework is effective for synoptic and non-synoptic wind regimes; therefore, it could be further extended to model wind in other climates. The robust links between the extreme wind actions and structural response required harmonising the relevant coherence and transfer functions, which in effect enables separating the background and resonant wind dynamic effects.
The main findings of this research are illustrated in the following points.
  • The investigation for the input parameters of the design spectra illustrates that the design spectra of the output accelerations significantly rise with the increasing velocities of the downburst outflow, particularly in the low-frequency spectral range. To an extent, this is an expected outcome given the energy imparted by low frequency gusts.
  • Design spectral ordinates (pseudo-acceleration) decrease with the aspect ratio. This implies that low-rise buildings would undergo higher response acceleration than taller buildings.
  • The variations in the damping ratio, although of lower impact, become more evident at the lower frequency range. Furthermore, the changeable heights for the maximum slowly varying mean velocity of the downburst outflow also reflected a slight effect on the design spectra, and the maximum design spectrum is only 0.111 m/s2 when the height of this maximum value is 150 m.
  • The comparison between the results of the TWDS in time–frequency domain and the equivalent theoretical integration in the time domain as well as the numerical simulation for the benchmark tall building demonstrate the applicability of the spectral method.
  • The peak displacement amplitudes obtained from the simplified and refined modelling under the simulated outflow wind field showed differences with those from the TWDS method ranging between 3.9% and 23.9%, which is the side of the building with the larger exposed area where displacements exhibited larger differences. This seems to be related to the cross-correlation decay, not accurately estimated through simplified modelling based on rigid bars.
Further validation of the spectral method is required, for example, through cross comparison with other existing methods. The exploration of the pressure coefficients on the tall buildings to transient wind loading will also improve the accuracy of this method. The results obtained so far suggest that the identified method is quick yet reliable to determine the dynamic response of the structures subject to wind.

Author Contributions

Conceptualisation, J.S., P.M.-V. and K.S.; methodology, J.S., P.M.-V. and K.S.; software, J.S.; validation, J.S., P.M.-V. and K.S.; formal analysis, J.S. and K.S.; investigation, J.S., P.M.-V. and K.S.; resources, J.S., P.M.-V. and K.S.; data curation, J.S.; writing—original draft preparation, J.S.; writing—review and editing, J.S., P.M.-V. and K.S.; visualisation, J.S.; supervision, P.M.-V. and K.S.; project administration, P.M.-V.; funding acquisition, P.M.-V. All authors have read and agreed to the published version of the manuscript.

Funding

This research received no external funding.

Data Availability Statement

The raw data supporting the conclusions of this article will be made available by the authors on request. The data are not publicly available due to their large size.

Acknowledgments

The authors thankfully acknowledge the computer resources provided by the School of Engineering at Birmingham University.

Conflicts of Interest

The authors declare no conflicts of interest.

Abbreviations

The following abbreviations and nomenclature are used in this manuscript:
Abbreviations
TSThunderstormWDSWind design spectra
SDOFSingle-degree-of-freedomABLAtmospheric boundary layer
MDOFMulti-degree-of-freedomPSDPower spectral density
EPSDEvolutionary power spectral densityCAARCCommonwealth Advisory Aeronautical Research Council
TWDSThunderstorm downburst wind design spectra
Nomenclature
U Wind velocity c D Drag coefficient
U ¯ Slowly varying mean wind velocity ρ Air density
u Residual fluctuating velocity to high-frequency components A Structural surface exposed to wind
u ~ Reduced turbulent fluctuation
Rapidly varying fluctuating velocity
k Structural stiffness
σ u Slowly varying standard deviation β (z)Non-dimensional vertical shape profile of mean value of the turbulence intensity over the measurement time period
U ¯ m a x Maximum slowly varying mean wind velocity μ t Non-dimensional horizontal shape profile of turbulence intensity changing with respect to time
U ¯ m a x , r Maximum slowly varying mean wind velocity at reference height c Turbulence intensity factor;
Damping coefficient
z Height above the ground t Varying running mean time intervals
r Reference height n Frequency of gust wind
I u Turbulence intensity L u Turbulence integral length scale
I ¯ u Mean value of the turbulence intensity over the measurement time period ρ ( τ ) Autocorrelation function that changes with the time delay
t Time τ Time delay
α Non-dimensional vertical shape function of horizontal wind u * Friction velocity
r m a x Radius at the maximum horizontal wind velocity l Integral length scale factor
x Radial distance from the storm centre α Exposure constant
R Radial length scale defined as the distance from the ‘low pressure ring’ to the ‘high-pressure ring’ S u ~ Power spectra density function for the reduced horizontal fluctuating velocity component
γ Non-dimensional time function of horizontal wind S F Force spectra
δ The height where the velocity is equal to half its maximum value S A Input acceleration spectra
U ¯ p e a k Peak value of maximum slowly varying mean wind velocity along the height above the ground S a TWDS of the output acceleration
erferror function S A i j Cross-power spectra of the input acceleration
z U ¯ p e a k Height for the peak value of maximum slowly varying mean wind velocity S c u Power spectral density of the generalised input acceleration
ϵ Exponents of power-law S a Design spectra of the output acceleration
V c Resultant velocity m Mass of the structure excited by the wind force
V t Translation velocity q Force factor
V r Radial velocity χ ( n ) Aerodynamic admittance
P Observation point J n Transfer function
P i n i t i a l Initial observation point n 0 Natural frequency of structures
e Offset distance in the transverse direction T Natural period of structures
d Offset distance in the longitudinal direction Δ y Horizontal distance between two points
θ Angle between the translation velocity and the radial velocity Δ z Vertical distance between two points
ξ Damping ratio C y Non-dimensional decay constant along with the horizontal direction
HVertical dimension of structures C z Non-dimensional decay constant along with the vertical direction
W Lateral dimension of structures ϕ ( z ) Fundamental modal shape at the height above the ground
L Longitudinal dimension of structures σ a Overall spectral response
ϕ 1 First modal amplitude σ a , b Background response components
ψ Flexibility of the real structure σ a , r Resonant response components
m 1 First modal mass ω Angular frequency
k 1 First modal stiffness d s Static displacement response of structures
L 1 First modal excited masses σ d Dynamic displacement response
f Total horizontal force on structures d T Peak displacement response
f ¯ Slowly varying mean component κ ( z , t ) Stationary Gaussian stochastic process
f Residual fluctuating component a ( z , t ) Amplitude modulation function

References

  1. McDonald, J.R.; Mehta, K.C. A Recommendation for an Enhanced Fujita Scale (EF-Scale); Wind Science and Engineering Center, Texas Tech University: Lubbock, TX, USA, 2006. [Google Scholar]
  2. Fujita, T.T. The downburst: Microburst and macroburst. University of Chicago. SMRP Res. 1985, 210, 112. [Google Scholar]
  3. Fujita, T.T. Downbursts: Meteorological features and wind field characteristics. J. Wind Eng. Ind. Aerodyn. 1990, 36, 75–86. [Google Scholar] [CrossRef]
  4. Kim, J.; Hangan, H. Numerical simulations of impinging jets with application to downbursts. J. Wind Eng. Ind. Aerodyn. 2007, 95, 279–298. [Google Scholar] [CrossRef]
  5. Chay, M.; Albermani, F. Dynamic response of a SDOF system subjected to simulated downburst wind. In Proceedings of the 10th International Conference on Wind Engineering, Prague, Czech Republic, 11–15 July 2005; Volume 2, pp. 1123–1130. [Google Scholar]
  6. Chen, L.; Letchford, C. A deterministic–stochastic hybrid model of downbursts and its impact on a cantilevered structure. Eng. Struct. 2004, 26, 619–629. [Google Scholar] [CrossRef]
  7. Chen, X. Analysis of alongwind tall building response to transient nonstationary winds. J. Struct. Eng. 2008, 134, 782–791. [Google Scholar] [CrossRef]
  8. Choi, E.C.; Hidayat, F.A. Dynamic response of structures to thunderstorm winds. Prog. Struct. Eng. Mater. 2002, 4, 408–416. [Google Scholar] [CrossRef]
  9. Holmes, J.; Forristall, G.; McConochie, J. Dynamic response of structures to thunderstorm winds. In Proceedings of the 10th Americas Conference on Wind Engineering (10ACWE), San Juan, Puerto Rico, 22–26 June 2005; pp. 1–6. [Google Scholar]
  10. Solari, G. Thunderstorm response spectrum technique: Theory and applications. Eng. Struct. 2016, 108, 28–46. [Google Scholar] [CrossRef]
  11. Chen, L.; Letchford, C. Parametric study on the along-wind response of the CAARC building to downbursts in the time domain. J. Wind Eng. Ind. Aerodyn. 2004, 92, 703–724. [Google Scholar] [CrossRef]
  12. Solari, G.; De Gaetano, P.; Repetto, M.P. Thunderstorm response spectrum: Fundamentals and case study. J. Wind Eng. Ind. Aerodyn. 2015, 143, 62–77. [Google Scholar] [CrossRef]
  13. Kareem, A.; Hu, L.; Guo, Y.; Kwon, D.-K. Generalized wind loading chain: Time-frequency modeling framework for nonstationary wind effects on structures. J. Struct. Eng. 2019, 145, 04019092. [Google Scholar] [CrossRef]
  14. Dyrbye, C.; Hansen, S.O. Wind Loads on Structures, 2nd ed.; Wiley: Hoboken, NJ, USA, 1997. [Google Scholar]
  15. Peng, L.; Huang, G.; Chen, X.; Yang, Q. Evolutionary spectra-based time-varying coherence function and application in structural response analysis to downburst winds. J. Struct. Eng. 2018, 144, 04018078. [Google Scholar] [CrossRef]
  16. Le, T.-H.; Caracoglia, L. Computer-based model for the transient dynamics of a tall building during digitally simulated Andrews AFB thunderstorm. Comput. Struct. 2017, 193, 44–72. [Google Scholar] [CrossRef]
  17. Kwon, D.K.; Kareem, A. Towards codification of thunderstorm/downburst using gust front factor: Model-based and data-driven perspectives. Eng. Struct. 2019, 199, 109608. [Google Scholar] [CrossRef]
  18. Kwon, D.-K.; Kareem, A. Gust-front factor: New framework for wind load effects on structures. J. Struct. Eng. 2009, 135, 717–732. [Google Scholar] [CrossRef]
  19. Solari, G.; Rainisio, D.; De Gaetano, P. Hybrid simulation of thunderstorm outflows and wind-excited response of structures. Meccanica 2017, 52, 3197–3220. [Google Scholar] [CrossRef]
  20. Abd-Elaal, E.-S.; Mills, J.E.; Ma, X. An analytical model for simulating steady state flows of downburst. J. Wind Eng. Ind. Aerodyn. 2013, 115, 53–64. [Google Scholar] [CrossRef]
  21. Abd-Elaal, E.-S.; Mills, J.E.; Ma, X. Empirical models for predicting unsteady-state downburst wind speeds. J. Wind Eng. Ind. Aerodyn. 2014, 129, 49–63. [Google Scholar] [CrossRef]
  22. Holmes, J.D.; Oliver, S. An empirical model of a downburst. Eng. Struct. 2000, 22, 1167–1172. [Google Scholar] [CrossRef]
  23. Li, C.; Li, Q.; Xiao, Y.; Ou, J. A revised empirical model and CFD simulations for 3D axisymmetric steady-state flows of downbursts and impinging jets. J. Wind Eng. Ind. Aerodyn. 2012, 102, 48–60. [Google Scholar] [CrossRef]
  24. Oseguera, R.M.; Bowles, R.L. A simple, analytic 3-dimensional downburst model based on boundary layer stagnation flow. In NASA Technical Memorandum; Langley Research Center: Hampton, VA, USA, 1988; p. 100632. Available online: https://ntrs.nasa.gov/citations/19880010328 (accessed on 21 October 2025).
  25. Vicroy, D.D. Assessment of microburst models for downdraft estimation. J. Aircr. 1992, 29, 1043–1048. [Google Scholar] [CrossRef]
  26. Wood, G.S.; Kwok, K.C.; Motteram, N.A.; Fletcher, D.F. Physical and numerical modelling of thunderstorm downbursts. J. Wind Eng. Ind. Aerodyn. 2001, 89, 535–552. [Google Scholar] [CrossRef]
  27. Shinozuka, M.; Deodatis, G. Simulation of stochastic processes by spectral representation. Appl. Mech. Rev. 1991, 44, 191–204. [Google Scholar] [CrossRef]
  28. Skalomenos, K.A.; Hatzigeorgiou, G.D.; Beskos, D.E. Application of the hybrid force/displacement (HFD) seismic design method to composite steel/concrete plane frames. J. Constr. Steel Res. 2015, 115, 179–190. [Google Scholar] [CrossRef]
  29. Serras, D.N.; Skalomenos, K.A.; Hatzigeorgiou, G.D. A displacement/damage controlled seismic design method for MRFs with concrete-filled steel tubular columns and composite beams. Soil Dyn. Earthq. Eng. 2021, 143, 106608. [Google Scholar] [CrossRef]
  30. Housner, G.W.; Martel, R.; Alford, J. Spectrum analysis of strong-motion earthquakes. Bull. Seismol. Soc. Am. 1953, 43, 97–119. [Google Scholar] [CrossRef]
  31. Solari, G. Wind response spectrum. J. Eng. Mech. 1989, 115, 2057–2073. [Google Scholar] [CrossRef]
  32. Simiu, E.; Scanlan, R.H. Wind Effects on Structures: Fundamentals and Applications to Design, 3rd ed.; Wiley: Hoboken, NJ, USA, 1996. [Google Scholar]
  33. Martinez-Vazquez, P. Wind-induced vibrations of structures using design spectra. Int. J. Adv. Struct. Eng. 2016, 8, 379–389. [Google Scholar] [CrossRef]
  34. Martinez-Vazquez, P. Wind design spectra for generalization. Wind Struct. 2020, 30, 155. [Google Scholar] [CrossRef]
  35. Fujita, T.T. The Downburst, Report of Projects NIMROD and JAWS; University of Chicago: Chicago, IL, USA, 1985. [Google Scholar]
  36. Chen, L.; Letchford, C. Numerical simulation of extreme winds from thunderstorm downbursts. J. Wind Eng. Ind. Aerodyn. 2007, 95, 977–990. [Google Scholar] [CrossRef]
  37. Holmes, J.; Hangan, H.; Schroeder, J.; Letchford, C.; Orwig, K. A forensic study of the Lubbock-Reese downdraft of 2002. Wind Struct. 2008, 11, 137–152. [Google Scholar] [CrossRef]
  38. Lombardo, F.T.; Smith, D.A.; Schroeder, J.L.; Mehta, K.C. Thunderstorm characteristics of importance to wind engineering. J. Wind Eng. Ind. Aerodyn. 2014, 125, 121–132. [Google Scholar] [CrossRef]
  39. Solari, G.; Burlando, M.; De Gaetano, P.; Repetto, M.P. Characteristics of thunderstorms relevant to the wind loading of structures. Wind Struct. 2015, 20, 763. [Google Scholar] [CrossRef]
  40. Zhang, S.; Solari, G.; De Gaetano, P.; Burlando, M.; Repetto, M.P. A refined analysis of thunderstorm outflow characteristics relevant to the wind loading of structures. Probabilistic Eng. Mech. 2018, 54, 9–24. [Google Scholar] [CrossRef]
  41. Hjelmfelt, M.R. Structure and life cycle of microburst outflows observed in Colorado. J. Appl. Meteorol. 1988, 27, 900–927. [Google Scholar] [CrossRef]
  42. Roncallo, L.; Solari, G. An evolutionary power spectral density model of thunderstorm outflows consistent with real-scale time-history records. J. Wind Eng. Ind. Aerodyn. 2020, 203, 104204. [Google Scholar] [CrossRef]
  43. Xhelaj, A.; Burlando, M.; Solari, G. A general-purpose analytical model for reconstructing the thunderstorm outflows of travelling downbursts immersed in ABL flows. J. Wind Eng. Ind. Aerodyn. 2020, 207, 104373. [Google Scholar] [CrossRef]
  44. Aboshosha, H.; Bitsuamlak, G.; El Damatty, A. Turbulence characterization of downbursts using LES. J. Wind Eng. Ind. Aerodyn. 2015, 136, 44–61. [Google Scholar] [CrossRef]
  45. Burlando, M.; Romanić, D.; Solari, G.; Hangan, H.; Zhang, S. Field data analysis and weather scenario of a downburst event in Livorno, Italy, on 1 October 2012. Mon. Weather Rev. 2017, 145, 3507–3527. [Google Scholar] [CrossRef]
  46. Choi, E.C. Field measurement and experimental study of wind speed profile during thunderstorms. J. Wind Eng. Ind. Aerodyn. 2004, 92, 275–290. [Google Scholar] [CrossRef]
  47. Durañona, V.; Sterling, M.; Baker, C.J. An analysis of extreme non-synoptic winds. J. Wind Eng. Ind. Aerodyn. 2007, 95, 1007–1027. [Google Scholar] [CrossRef]
  48. Orwig, K.D.; Schroeder, J.L. Near-surface wind characteristics of extreme thunderstorm outflows. J. Wind Eng. Ind. Aerodyn. 2007, 95, 565–584. [Google Scholar] [CrossRef]
  49. Romanic, D.; Chowdhury, J.; Chowdhury, J.; Hangan, H. Investigation of the Transient Nature of Thunderstorm Winds from Europe, the United States, and Australia Using a New Method for Detection of Changepoints in Wind Speed Records. Mon. Weather Rev. 2020, 148, 3747–3771. [Google Scholar] [CrossRef]
  50. ASCE7. Minimum Design Loads for Buildings and Other Structures (ASCE/SEI 7-10); American Society of Civil Engineers: Reston, VA, USA, 2013. [Google Scholar]
  51. ASCE. Wind Tunnel Testing for Buildings and Other Structures; American Society of Civil Engineers: Reston, VA, USA, 2012. [Google Scholar]
  52. von Kármán, T. Progress in the statistical theory of turbulence. Proc. Natl. Acad. Sci. USA 1948, 34, 530. [Google Scholar] [CrossRef]
  53. Solari, G.; Piccardo, G. Probabilistic 3-D turbulence modeling for gust buffeting of structures. Probabilistic Eng. Mech. 2001, 16, 73–86. [Google Scholar] [CrossRef]
  54. Kaimal, J.C.; Wyngaard, J.; Izumi, Y.; Coté, O. Spectral characteristics of surface-layer turbulence. Q. J. R. Meteorol. Soc. 1972, 98, 563–589. [Google Scholar] [CrossRef]
  55. Davenport, A.G. Gust loading factors. J. Struct. Div. 1967, 93, 11–34. [Google Scholar] [CrossRef]
  56. Vickery, B. Load fluctuations in turbulent flow. J. Eng. Mech. Div. 1968, 94, 31–46. [Google Scholar] [CrossRef]
  57. Jesson, M.; Lombardo, F.T.; Sterling, M.; Baker, C. The physical simulation of a transient, downburst-like event–How complex does it need to be? J. Wind Eng. Ind. Aerodyn. 2019, 189, 135–150. [Google Scholar] [CrossRef]
  58. Lombardo, F.T.; Mason, M.S.; de Alba, A.Z. Investigation of a downburst loading event on a full-scale low-rise building. J. Wind Eng. Ind. Aerodyn. 2018, 182, 272–285. [Google Scholar] [CrossRef]
  59. Letchford, C.; Iverson, R.; McDonald, J. The application of the quasi-steady theory to full scale measurements on the Texas Tech Building. J. Wind Eng. Ind. Aerodyn. 1993, 48, 111–132. [Google Scholar] [CrossRef]
  60. Mooneghi, M.A.; Irwin, P.; Chowdhury, A.G. Partial turbulence simulation method for predicting peak wind loads on small structures and building appurtenances. J. Wind Eng. Ind. Aerodyn. 2016, 157, 47–62. [Google Scholar] [CrossRef]
  61. Davenport, A. The prediction of the response of structures to gusty wind. Saf. Struct. Under Dyn. Load. 1977, 1, 257–284. [Google Scholar]
  62. Kareem, A.; Tamura, Y. Advanced Structural Wind Engineering; Springer: Berlin/Heidelberg, Germany, 2013. [Google Scholar]
  63. Melbourne, W. Comparison of measurements on the CAARC standard tall building model in simulated model wind flows. J. Wind Eng. Ind. Aerodyn. 1980, 6, 73–88. [Google Scholar] [CrossRef]
  64. Ondrej. CSi Knowledge Base—SAP2000 21V. 2013. Available online: https://wiki.csiamerica.com/display/sap2000/Home (accessed on 1 January 2013).
  65. Solari, G.; De Gaetano, P.; Repetto, M.P. Wind loading and response of structures in mixed climates. In Proceedings of the Eight Asia Pacific Conference on Wind Engineering, Chennai, India, 10–14 December 2013. [Google Scholar]
  66. Deodatis, G. Simulation of ergodic multivariate stochastic processes. J. Eng. Mech. 1996, 122, 778–787. [Google Scholar] [CrossRef]
  67. Priestley, M.B. Evolutionary spectra and non-stationary processes. J. R. Stat. Soc. Ser. B (Methodol.) 1965, 27, 204–229. [Google Scholar] [CrossRef]
  68. Chopra, A.K. Dynamics of Structures: Theory and Applications to Earthquake Engineering, 4th ed.; Prentice Hall: Upper Saddle River, NJ, USA, 2011; Pearson Education [distributor]: London, UK, 2011. (In English) [Google Scholar]
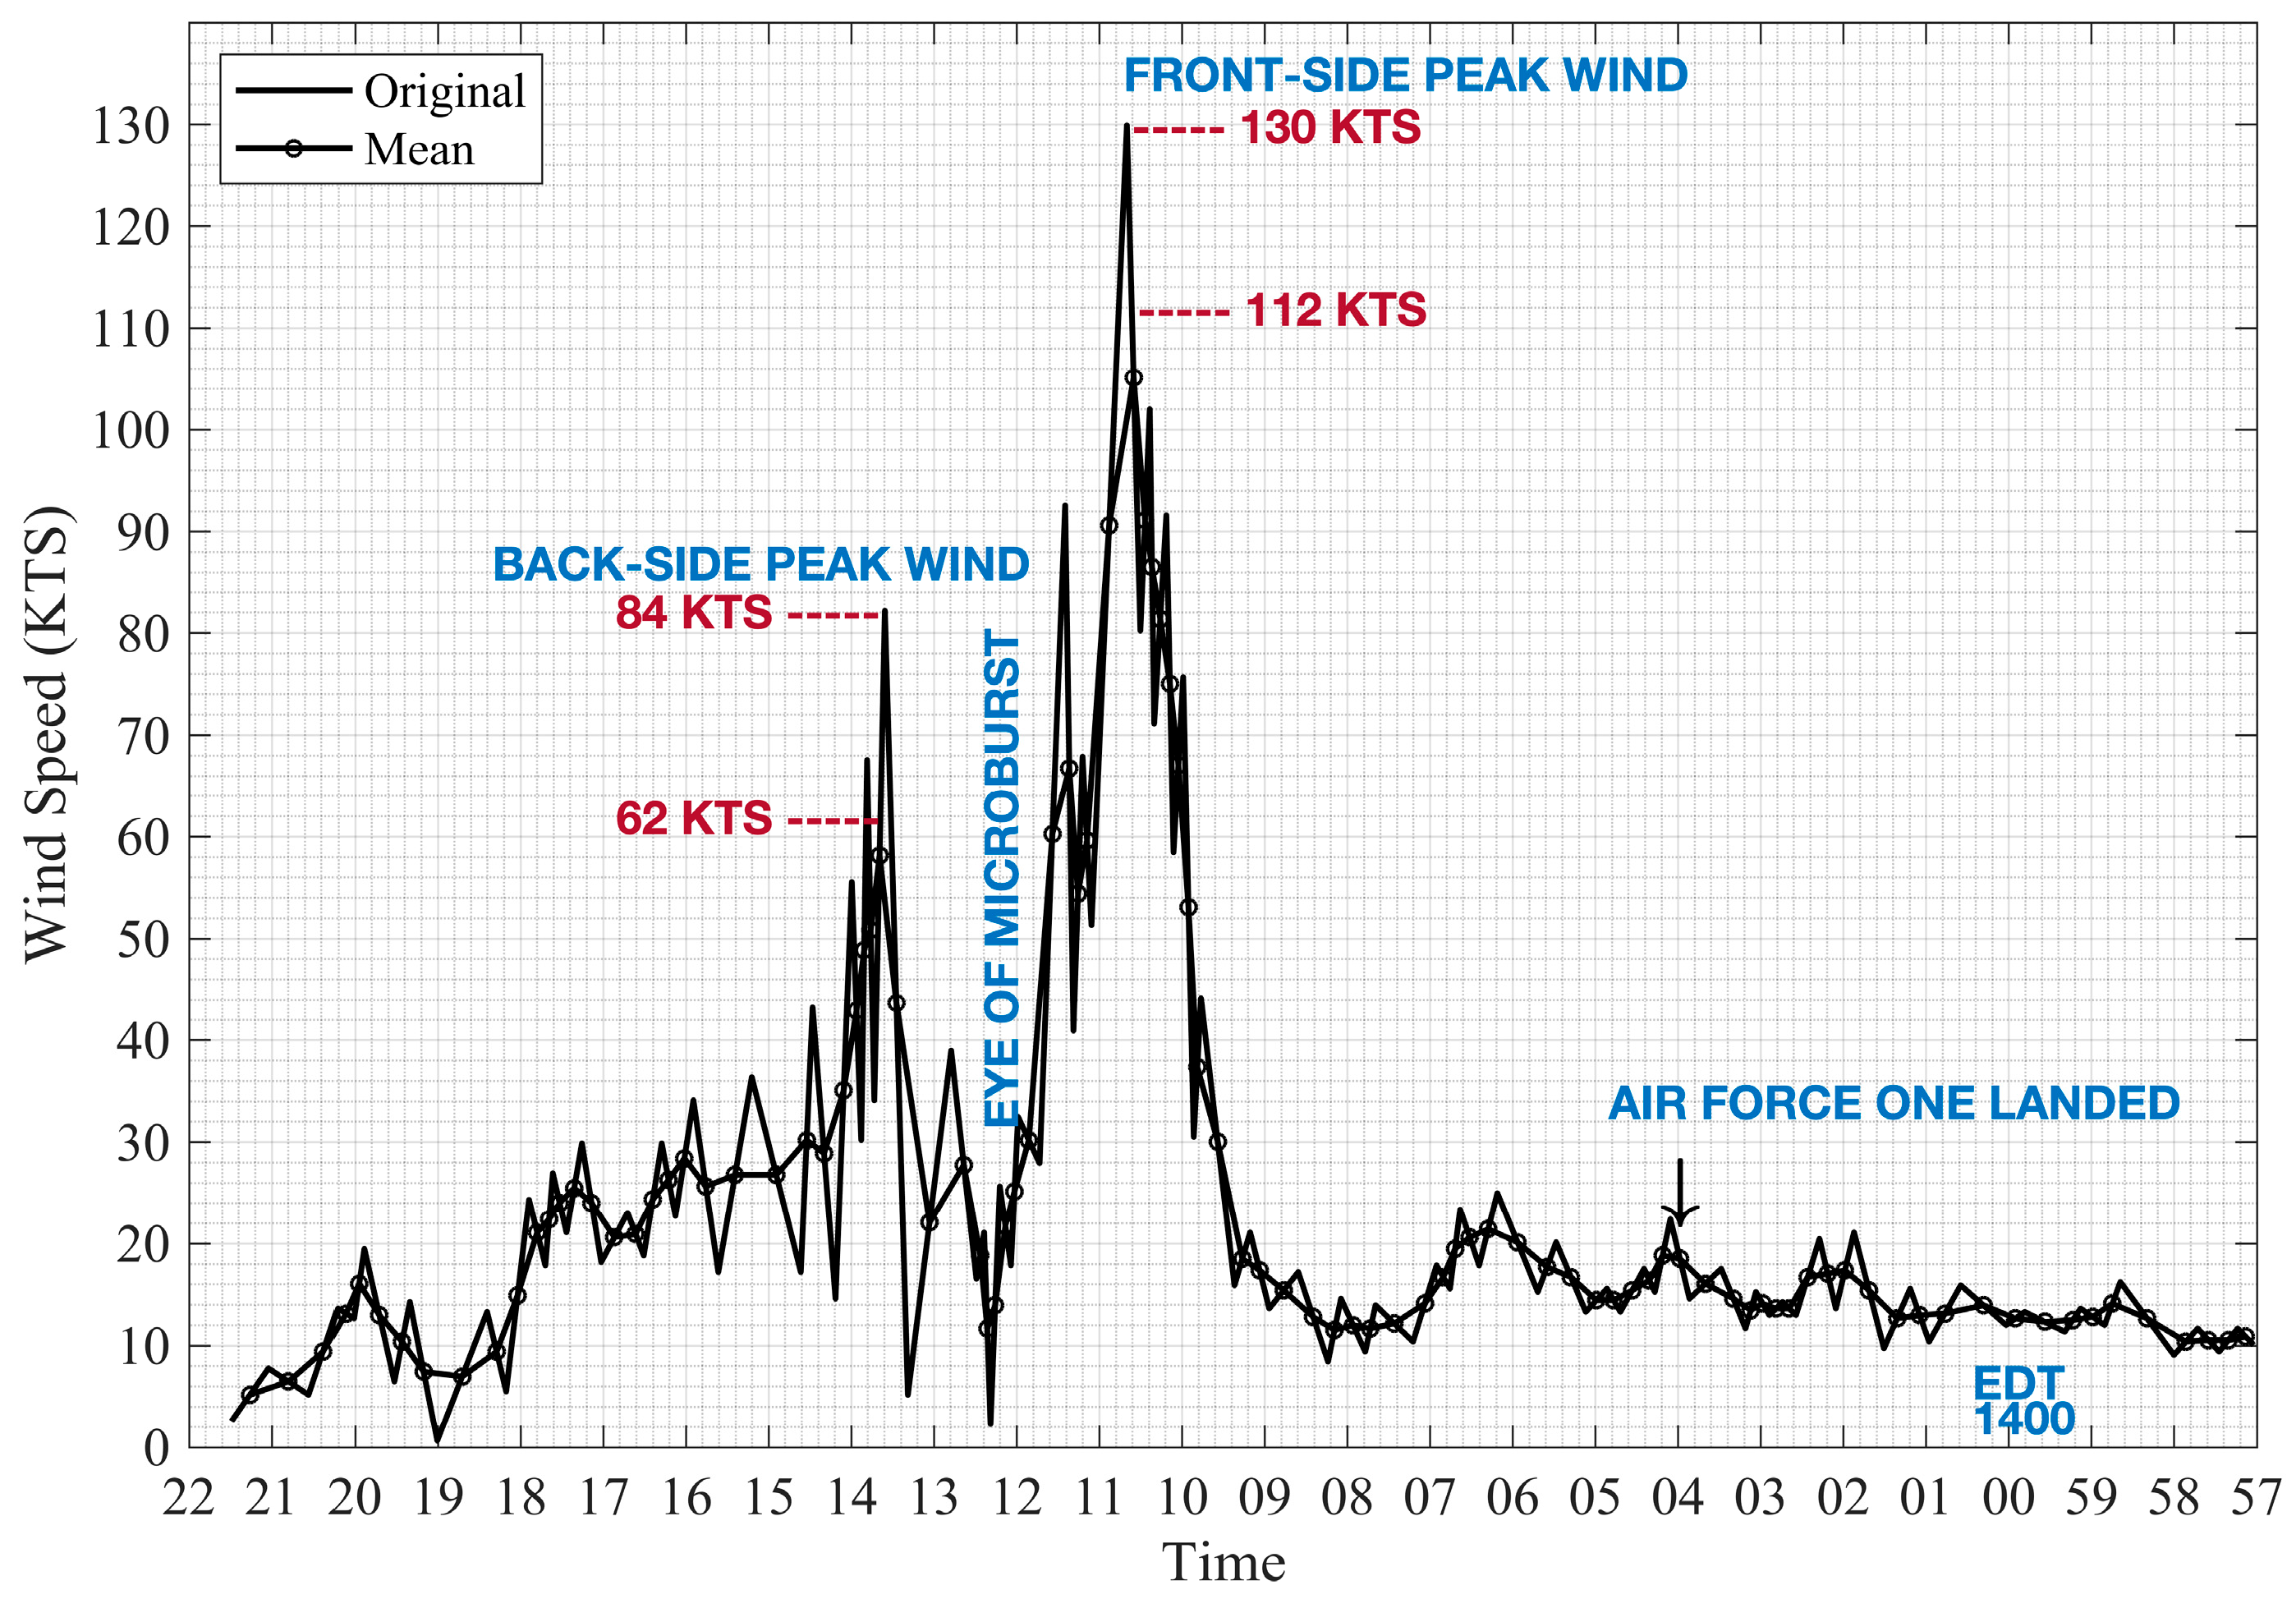
Figure 1. Time history of the Andrew Air Force Base microburst at 4.9 m height on 1 August 1983 [2].
Buildings 15 04305 g001
Figure 2. Comparison of velocity profiles: (a) vertical profiles of horizontal winds for TS downburst and synoptic wind; (b) simulated velocity time history and time function.
Buildings 15 04305 g002
Figure 3. The layout of the storm location relative to the observed position [22].
Buildings 15 04305 g003
Figure 4. Comparison of different PSD functions.
Buildings 15 04305 g004
Figure 5. Methodology diagram of TWDS.
Buildings 15 04305 g005
Figure 6. Transfer function.
Buildings 15 04305 g006
Figure 7. Design spectra of output acceleration with variable parameters based on basic properties (default values: U ¯ m a x , 10 = 25 m/s, W = 20 m, H / W = 10, L / W = 1, ξ = 0.025, z U ¯ p e a k = 50 m and terrain exposure B): (a) resonant component; (b) background component; (c) U ¯ m a x , 10 ; (d) H / W ; (e) L / W ; (f) ξ ; (g) z U ¯ p e a k ; (h) terrain exposure.
Buildings 15 04305 g007
Figure 8. The CAARC benchmark building: (a) the dimensions; (b) the simplified modelling.
Buildings 15 04305 g008
Figure 9. Comparison of the displacement at the top of the CAARC building model: (a) in the x -direction; (b) in the y -direction.
Buildings 15 04305 g009
Figure 10. (a) PSD function at different levels; (b) coherence function between any two vertical points.
Buildings 15 04305 g010
Figure 11. Simulated velocity time series of horizontal wind at top of building.
Buildings 15 04305 g011
Figure 12. Comparison of the PSD function between the simulated time history and the target at (a) joint 10 and (b) joint 19.
Buildings 15 04305 g012
Figure 13. Comparison of the cross-correlation function between the simulated time history and the target at two heights (a) joint 6 and (b) joint15 with respect to the heigh of reference (joint 19).
Buildings 15 04305 g013
Figure 14. The CAARC benchmark building: (a) building plan; (b) elevation section in x -direction; (c) elevation section in y -direction.
Buildings 15 04305 g014
Figure 15. Lateral displacements with varying heights: (a) in x -direction; (b) in y -direction.
Buildings 15 04305 g015
Table 1. Parameters for time function.
ParametersValue
r m a x (m)1000
z U ¯ p e a k (m)4.9, 50, 75, 100
U ¯ m a x , r (m/s)47, 32.06, 39.89, 44.01
R (m)700
e (m)150
V t (m/s)12
P i n i t i a l (m)3500
f s (Hz)2.56
Table 2. Key steps to calculate design spectra for TS downburst (TWDS).
Point-Like SDOF System Vertical MDOF System
S F ( n ) = q 2 S u ~ ( n ) (11) S F ( z , n ) = q 2 ( z ) S u ~ ( z , n ) (18)
S A ( n ) = q m 2 S u ~ ( n ) (12) S A ( z , n ) = q ( z ) m 2 S u ~ ( z , n ) (19)
q = c D ρ A U ¯ m a x 2 1 + 0.5 I ¯ u I ¯ u q ( z ) = c D z ρ A z U ¯ m a x 2 z 1 + 0.5 I ¯ u z I ¯ u ( z )
χ ( n ) = 1 1 + 2 n A U ¯ m a x ( t ) 4 / 3 (13) χ z , n = e x p n 1 / 2 [ U ¯ m a x z i + U ¯ m a x ( z j ) ] ( C y Δ y ) 2 + ( C z Δ z ) 2 (20)
S A i j z i , z j , n = 1 m 2 q ( z i ) q ( z j ) S u ~ ( z i , n ) S u ~ ( z j , n ) 1 A 2 χ ( z i , z j , n ) (21)
S c u z i , z j , n = A ϕ ( z i ) ϕ ( z j ) S A i j ( z i , z j , n ) d y i d y j d z i d z j (22)
σ a , b 2 = 0 S c u z i , z j , n d n (23b)
σ a 2 = 0 J n 2 χ n 2 S A n d n (14) σ a , r 2 = S c u z i , z j , n 0 0 J n 2 d n π n 0 S c u ( z i , z j , n 0 ) 4 ξ (23c)
σ a 2 = 0 J n 2 S c u z i , z j , n d n (23a)
S a = σ a 2 (16) S a = σ a 2 = σ a , b 2 + σ a , r 2 (24)
Table 3. The static and dynamic lateral displacements at the roof level.
Design Spectra for TS DownburstTheoretical Integration NewmarkNumerical Analysis
U ¯ h (m/s)DirectionStatic
= f 1 / k 1
vertical and horizontal cross-correlationvertical correlation onlyvertical correlation onlyvertical correlation only
DynamicTotalDynamicTotalTotalTotal
32.06x0.2000.1280.3280.1510.3510.4350.413 (Mode 1)
y 0.1120.0840.1960.0940.2060.244 (Mode 2)
Table 4. Static and dynamic displacements (m) at the top of the building.
Wind Direction U ¯ 10 (m/s) U ¯ H (m/s) U ¯ H n 0 W Static ResponseDynamic Response
WDSExp.WDSExp.
x 511.281.2340.0140.0170.0070.002
1022.562.4680.0570.0690.0270.014
1533.853.7010.1280.1550.0670.046
2045.134.9350.2280.2750.1290.110
2556.416.1690.3560.4290.2180.215
y 511.281.2340.0080.0080.0040.001
1022.562.4680.0330.0330.0180.007
1533.853.7010.0730.0750.0430.022
2045.134.9350.1300.1340.0840.052
2556.416.1690.2040.2090.1430.102
Table 5. Design and modal properties.
StoreyColumnsPrimary BeamsSecondary BeamsBrace in x-Direction
1–20HE1000MHE800AHE650AHE320A
21–40HE900BHE800AHE650AHE320A
41–47HE800BHE800AHE650AHE320A
Material gradesS355S275S275S235
Table 6. Natural period, frequency, and modal mass participate factor for first eight modes.
Mode12345678
Period4.984.953.761.461.431.220.740.73
Frequency0.200.200.270.680.700.821.351.37
Modal participating mass ratio (Sum UX)0.700.700.700.700.880.880.880.92
Modal participating mass ratio (Sum UY)0.000.710.710.860.860.860.910.91
Disclaimer/Publisher’s Note: The statements, opinions and data contained in all publications are solely those of the individual author(s) and contributor(s) and not of MDPI and/or the editor(s). MDPI and/or the editor(s) disclaim responsibility for any injury to people or property resulting from any ideas, methods, instructions or products referred to in the content.