1. Introduction
The compressive strength is the foundational parameter used in design, quality control, and performance evaluation of cementitious materials. However, as many researchers have observed, the measured strength depends not only on the material composition but also heavily on the geometry of the specimen used in testing. In particular, the difference between cylindrical specimens and cubic specimens (or prisms or other shapes) has led to the use of a shape coefficient. Specifically, the shape coefficient (often denoted
K) is an empirical factor used to translate compressive strength results of cementitious materials between specimens of different geometries, most commonly between standard cubes (e.g., 150 × 150 × 150 mm) and standard cylinders (e.g., 300 mm high × 150 mm diameter), and is defined as shown in Equation (1):
where
fcyl is the strength measured in cylindrical specimens (generally compressive strength), and
fcube is the strength measured in cubic specimens. Briefly, this coefficient is able to convert the cube test to equivalent cylinder strengths. Such coefficients are crucial for correlating strength data from different codes, laboratories, and field studies, where different shapes are used.
In practice, a widely cited engineering approximation for concrete specimens assumes that cube strengths exceed cylinder strengths by about 20–25%, corresponding to a conversion factor of roughly 0.80–0.83 [
1]. This “rule of thumb” has been embedded in codes and standards where cube-based European data must be compared to cylinder-based American practice. However, a growing body of evidence demonstrates that such a universal constant is an oversimplification, as the cube–cylinder relation varies with concrete strength, aggregate type, curing, loading rate, fiber content, and the presence of recycled materials [
2,
3].
Experimental programs have systematically investigated these effects. For instance, Dehestani et al. [
4] demonstrated that self-consolidating concrete shows measurable variation in cube/cylinder ratios depending on mix design and specimen size, concluding that a fixed factor is not reliable for high-precision applications. Similarly, Li et al. [
5] found that shape and size effects are magnified under dynamic loading, which is particularly relevant in impact or blast applications. Their study confirmed that the conversion coefficient
K cannot be assumed constant across strain rates, further complicating the interpretation of high-rate testing results.
In fact, the physical mechanisms underpinning these variations are well documented. Cubes, with their lower slenderness ratio, benefit from higher lateral restraint near the loading platens, producing elevated apparent strengths. Cylinders, on the other hand, experience more uniform stress distributions but are more sensitive to capping conditions and eccentric loading [
1,
6]. Larger specimens statistically incorporate more critical flaws, in line with classical size-effect theories, leading to lower nominal strength as specimen dimensions increase [
2]. These explanations are consistent across studies of normal-strength concrete, high-strength concrete (HSC), and ultra-high-performance concrete (UHPC) [
7].
Beyond concrete, however, many engineered pavement base materials make use of cement, such as in cement-treated base materials. These materials are mixtures of natural soil or previously crushed stone (with varying gradation, plasticity, and fines content), duly stabilized by Portland cement (or similar binders). They are widely used in pavement base courses, sub-bases, or stabilization layers, especially in road infrastructure. Some of this type of material is the soil-cement, gravel-cement, or in situ stabilization techniques like the full-depth reclamation (FDR) [
8,
9,
10,
11,
12,
13,
14], which form part of the base material of semi-rigid pavements [
15,
16]. Compared to concrete, they are cheaper and often more sustainable, but their mechanical behavior (strength, stiffness, durability) can differ significantly. Yet, while concrete literature has extensively examined shape and size effects for concrete [
17], there is very little work on the shape coefficient in soil-cement or cement-treated base materials.
It can be said that Felt and Abrams [
18] provided one of the first analyses of variable strength and other parameters of soil-cement mixtures depending on the shape and size of the samples, apart from other mechanical properties, but without providing a factor as a conclusion. Tariq and Maki [
19] investigated the mechanical behavior of cement-treated sand under compression with cylindrical specimens of varying height-to-diameter ratio (H/D) and under tension with notched beam specimens. They concluded that the maximum compressive stress was independent of the specimen size but did not relate the two strengths. Xie et al. [
20] conducted research about the fatigue characteristics of cement-treated aggregate base materials under different test conditions (unconfined compressive, indirect tensile, flexural tensile strengths, and fatigue tests). Although they observed the importance of the shape of the specimens and included the shape and scale as parameters in developed models, a correct relationship for converting different types of specimens was not provided. More recently, Lv et al. [
21] studied the relationship between the unconfined compressive strength (UCS) and the flexural strength at different curing ages of cement-treated aggregate base materials, but the semi-prismatic parts resulting from the flexural test were not employed for calculating the UCS in cubic specimens.
To the best of our knowledge, no studies have focused on the shape coefficient for soil-cement. Only a few studies address compressive strength with various sample shapes in cement-treated materials, such as soil-cement blocks with waste tire steel fibers [
22] or cement-stabilized rammed earth [
23]. However, in those studies, the difference between cube vs. cylinder shapes has rarely been compared (or has been compared only in a limited way). Thus, a research question arises: how does the cube vs. cylinder shape coefficient behave in soil-cement and cement-treated base materials? To bridge this gap, this paper analyzes the uniaxial compressive strength values of cylindrical and cubic specimens of soil-cement from different materials at different test ages and, hence, with variable compressive strength.
The research is organized as follows. In the next section, a deeper literature review about the shape coefficient in cementitious materials and, more specifically, in cement-treated pavement base materials is presented. Then, the materials deployed in the research and the applied methodology are described. Subsequently, the obtained results are shown and discussed. Finally, conclusions are deduced from the presented results.
4. Results and Discussion
Table 5 presents the UCS values from cylindrical samples of Material A at 7 and 90 days from each of the 10 mixings. Additionally, the dry density of each sample is also exposed.
As could be anticipated, the compressive strength at 90 days is higher than that at 7 days. Additionally, it can be observed that the dry densities of the samples from the same mixing are almost similar. Moreover, the range of values within the same age is wide, underlining the heterogeneity of this type of material, always reported by other researchers [
8,
9,
10,
11,
13].
Table 6 exposes the UCS values of cubic samples obtained from the semi-prismatic parts at 7 and 90 days, including the density of the prismatic sample.
Once again, the density of the prismatic sample of each mixing is very similar to the corresponding densities of cylindrical samples. This fact highlights the importance of producing mixtures for cylindrical and cubic samples, because their values can be compared adequately. At the same time, as observed in cylindrical samples, the range value at each age is wide, reinforcing the heterogeneity of the material.
As it has been explained in
Section 3.4, UCS values from AxxCYL7 can be compared with AxxCUB7. Similarly, values from AxxCYL7 are contrasted against values from AxxCUB90.
If we compare values at 7 days from Material A,
Figure 7 is obtained. Two regression lines can be developed, with the intercept (green line) and without the intercept (red line). The red line obtains a lower determination coefficient (
R2) because it is forced to pass through the origin (0; 0). However, since the shape coefficient is defined as in Equation (1), the intercept must be omitted, and
K is identified with the coefficient of variable
x, the UCS value in cubic samples. As shown, the determination coefficient is high, near 0.80, and the shape coefficient indicates that the UCS in cylindrical samples is 1.11 times higher than in cubic samples. In fact, all the data points at 7 days indicate that higher values are obtained in cylindrical samples. The gray line shows the equality line, i.e.,
y =
x. This is contrary to the usual values obtained in a concrete sample. However, as commented, the dimensions of the cylindrical samples are different in height, from 30 cm in concrete (with a diameter of 15 cm) to 18 cm in soil-cement, which obviously influences the result [
18,
42]. The explanation lies in the particular geometry used in soil-cement testing: cylindrical specimens are only 180 mm in height, compared to the standard 300 mm height used for concrete, resulting in a lower slenderness ratio. This geometry increases the confinement at the loading platens and leads to higher apparent strength. In cubic specimens, the stress distribution is more uniform and less affected by platen restraint, which explains the slightly lower strength values obtained [
4,
5]. This behavior is consistent with the mechanics of squat cylinders: when the height-to-diameter ratio is close to 1.2, lateral deformation at the ends is strongly restrained by the loading platens, generating localized triaxial compression (“end restraint”) that artificially elevates the apparent UCS. In contrast, the stress field in 150 mm cubes is more uniform and less affected by platen confinement, which explains the lower measured strengths. Similar confinement-induced increases in strength for short cylinders are widely recognized in ASTM D1633 [
60] for soil-cement and in studies on concrete [
61,
62,
63].
In
Figure 11b, the purple lines show the 95% confidence intervals for the linear regression without an intercept. Except for two points that are near these lines, the rest are in the 95% confidence interval for the predicted values using the proposed shape coefficient.
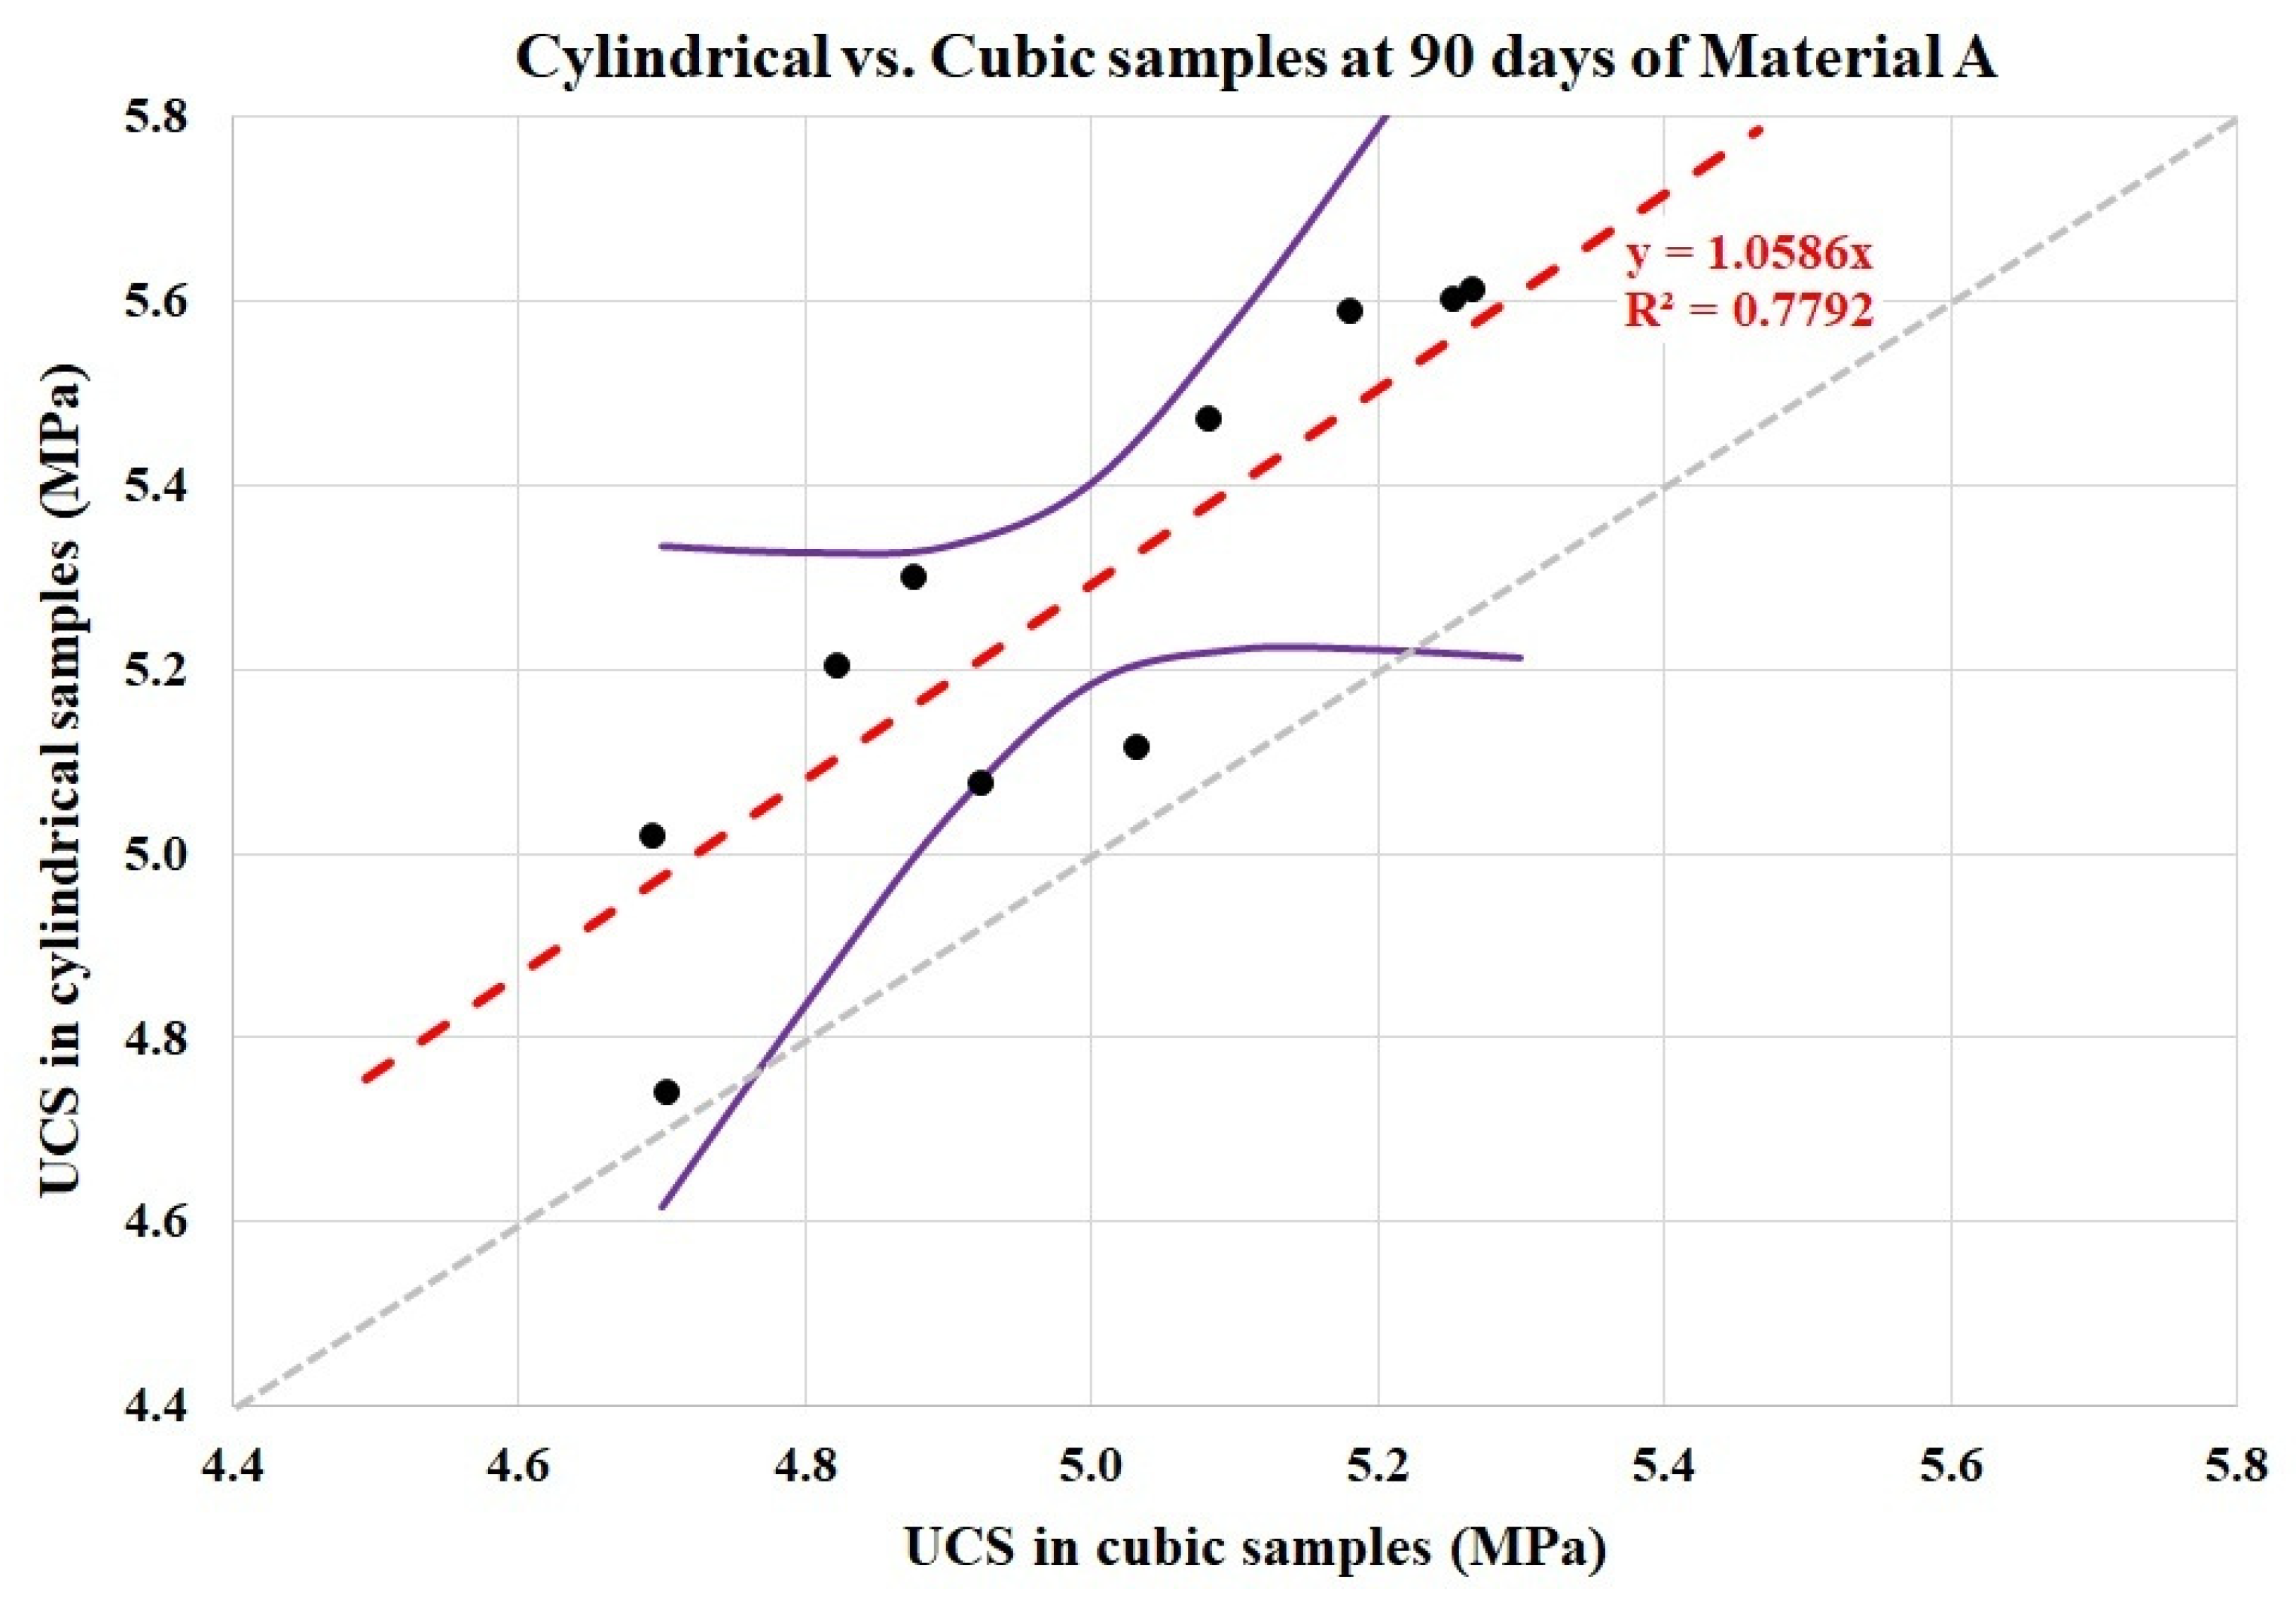
If the same analysis of
Figure 11 is repeated for UCS values at 90 days,
Figure 12 is developed. As seen, the accuracy of the regression correlating both values is high (
R2 = 0.78), similar to that one for 7 days. Once again, all the values from cylindrical values are higher than those from cubic samples. According to the data at 90 days, the shape coefficient should have a value between 1.05 and 1.06, lower than the one developed with data at 7 days. This fact, a lower value, nearer to 1, implies that for higher strength values, the shape coefficient tends to be equal to one, as indicated by some authors with concrete samples [
7,
24]. In addition, all the data points except for one are inside the 95% CI region.
If the twenty data points are gathered,
Figure 13 is created. As observed, the accuracy of the shape coefficient is improved considerably, reaching an
R2 value of almost 0.99, implying a very high accuracy. The deduced
K achieves a value of 1.068, indicating that strengths in cylindrical samples are almost 7% higher than in cubic specimens. All the data points are between the 95% CI lines.
Results from Material B are presented in
Table 7,
Table 8 and
Table 9.
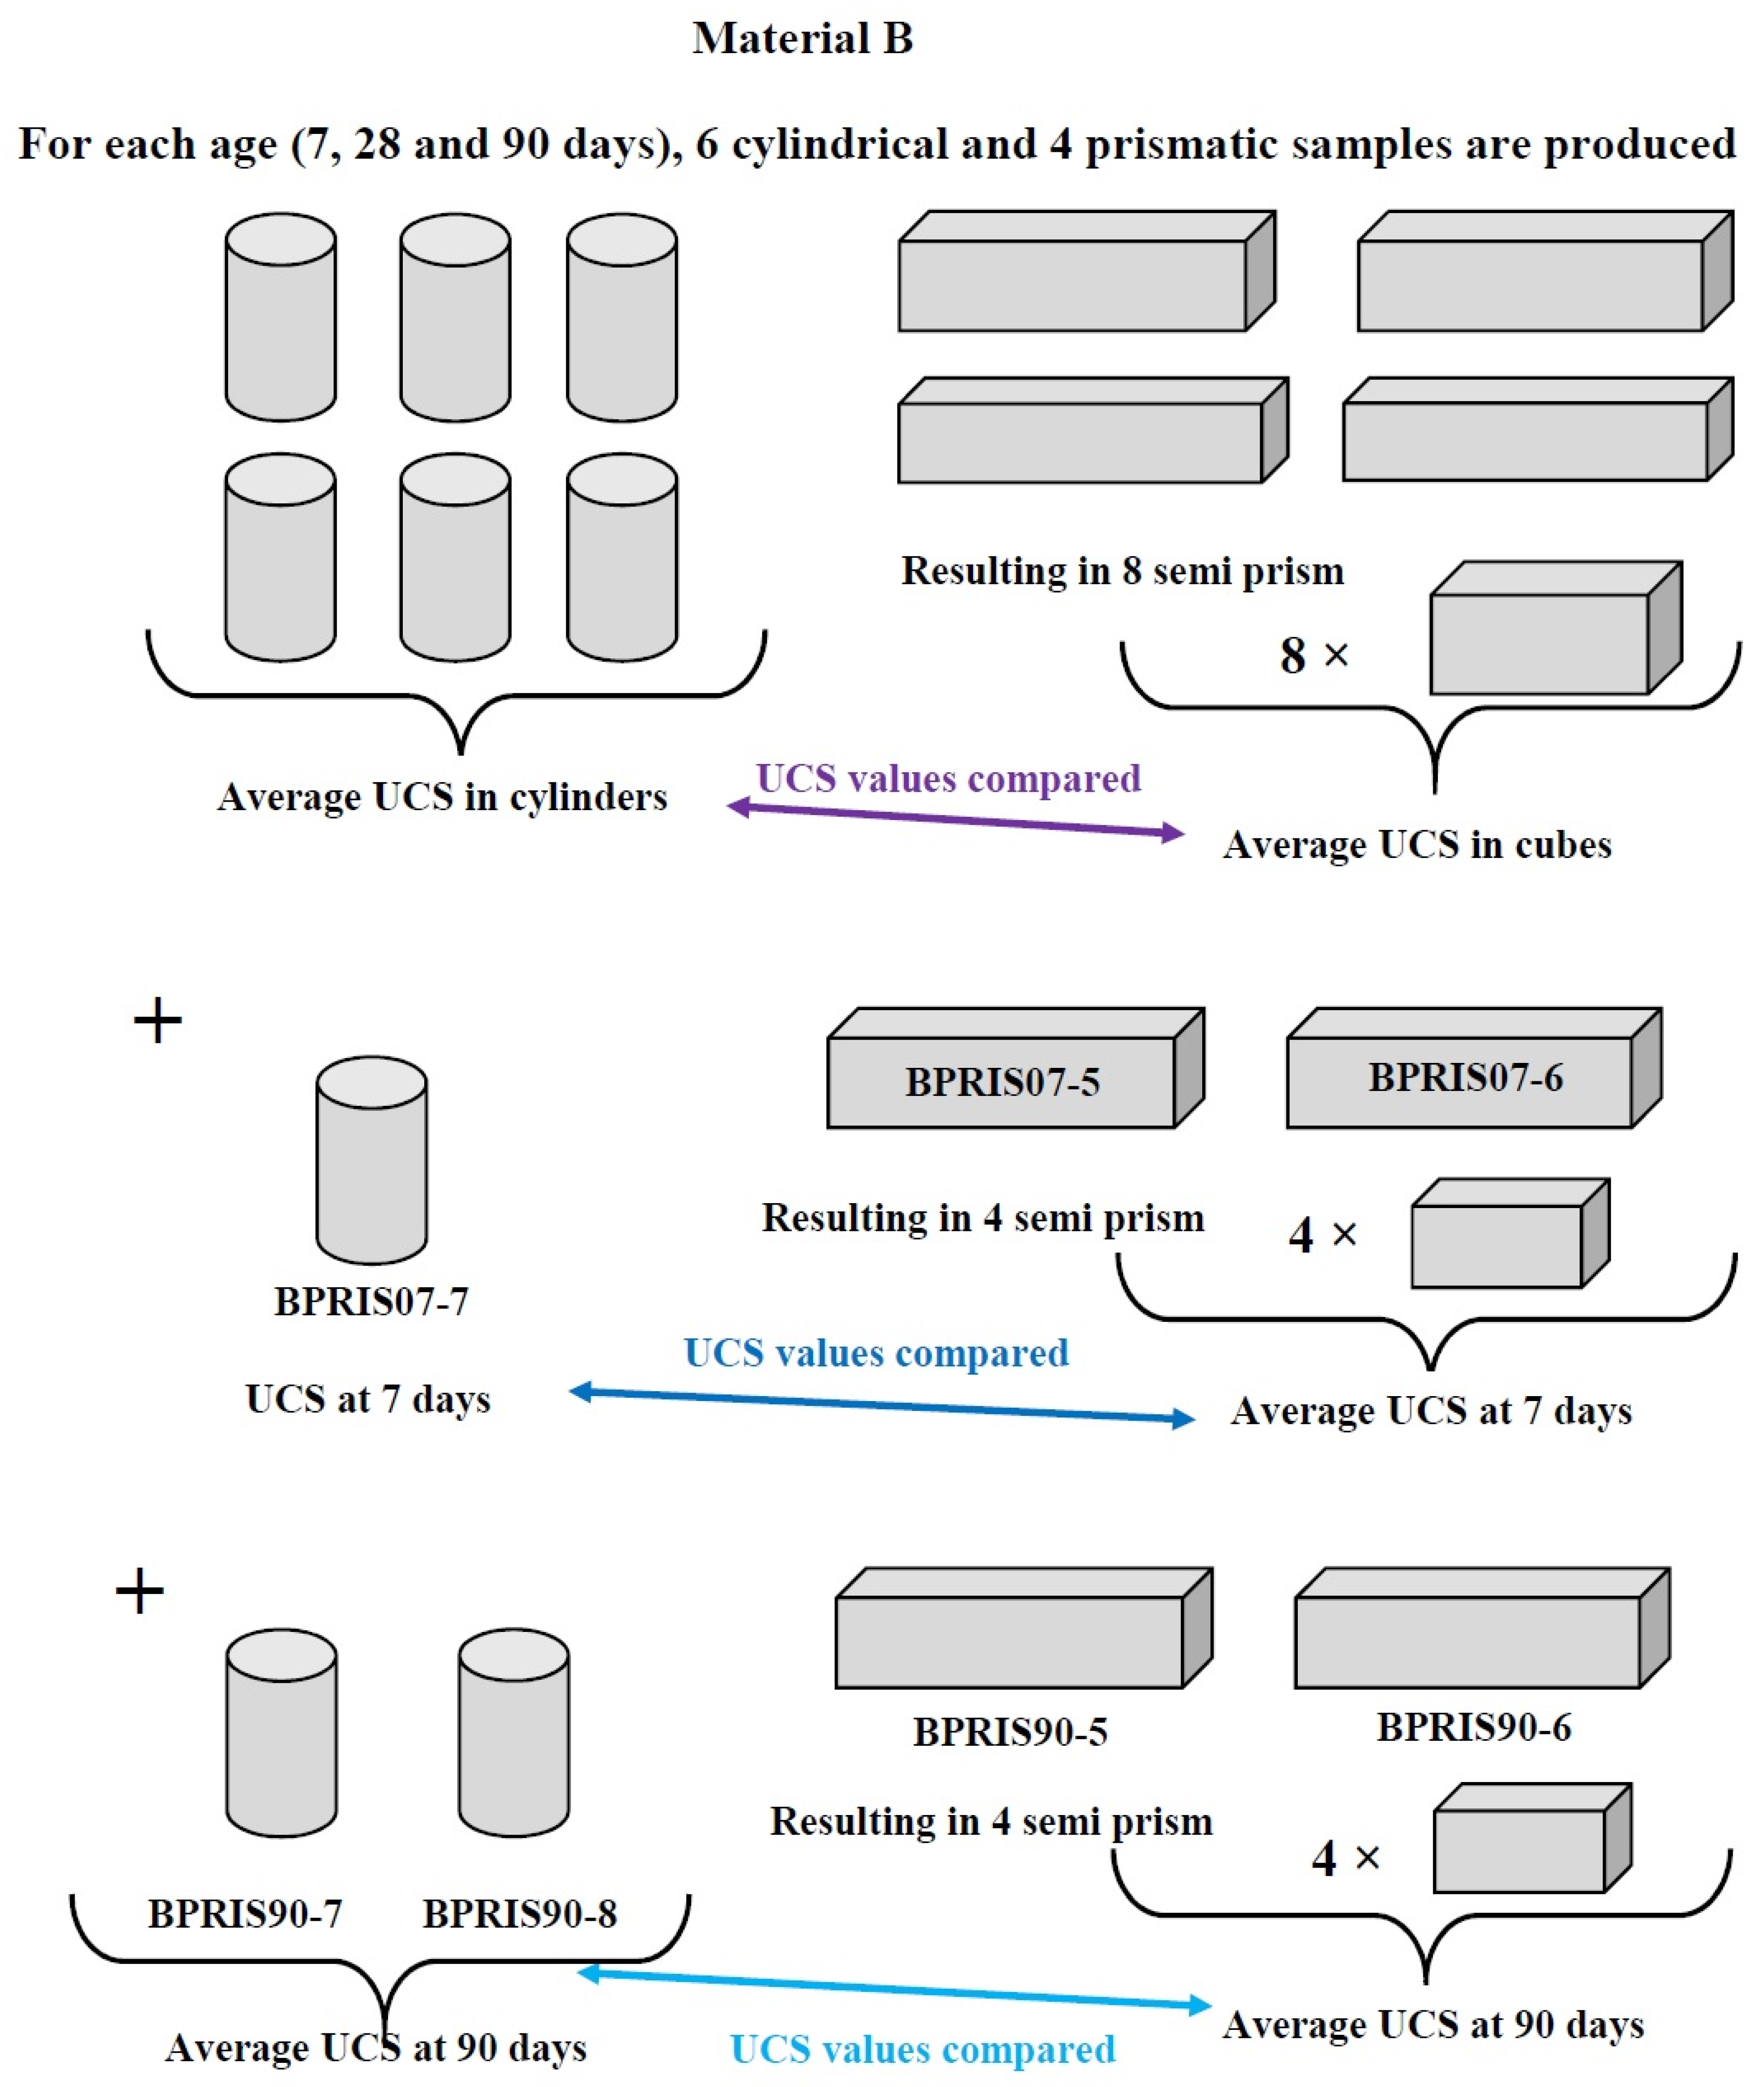
Table 7 provides the values of the six cylindrical specimens at each age (7, 28, and 90 days), with the corresponding dry densities and the average values at each age. Similarly,
Table 8 exposes the values of the UCS of the eight semi-prismatic parts tested as a cube under the UCS test at each stage, with the average value. Finally,
Table 9 presents the results from the specimens manufactured from the same mixing, as commented on in
Figure 10.
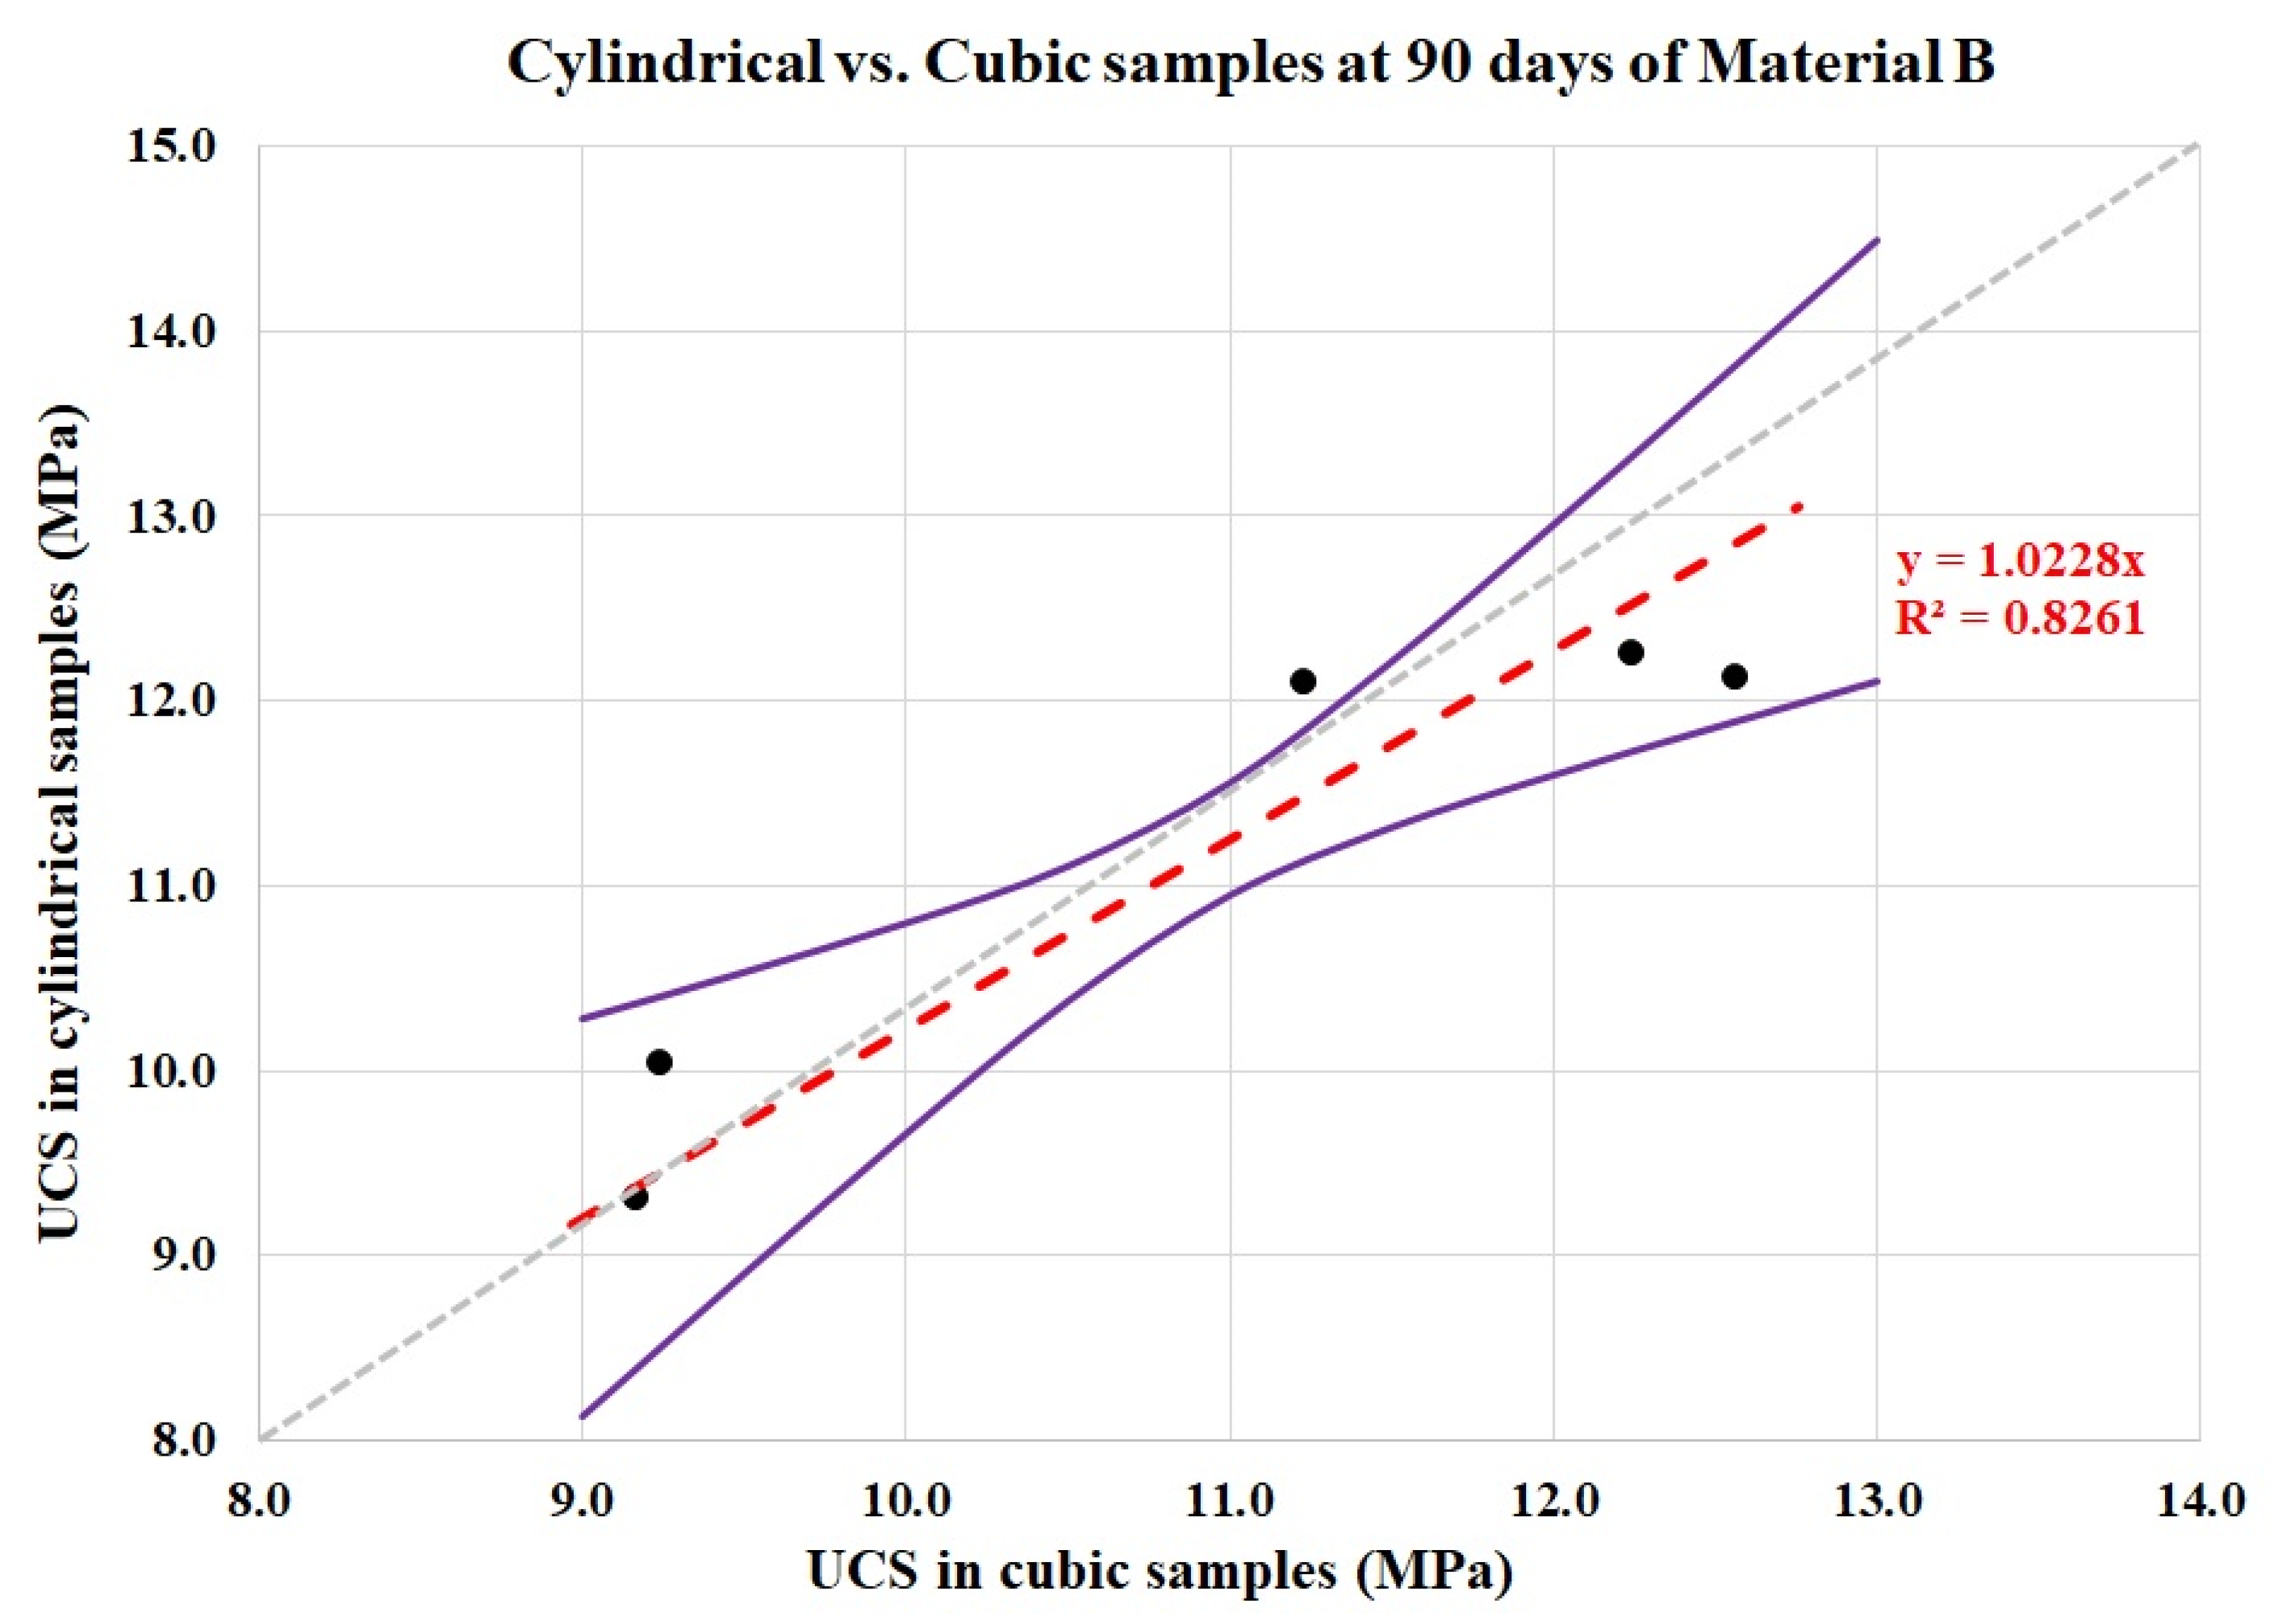
Analyzing the data cloud created with values from Material B (
Figure 14), it can be seen that a high correlation coefficient is also obtained (
R2 = 0.82). The obtained partial shape coefficient,
K = 1.023, is smaller than those obtained from Material A. At this point, it must be noted that the UCS values of the specimens of Material B are in the range between 9 and 13 MPa, which is considerably higher than the range for Material A, even considering the values at 90 days, with UCS around 5 MPa. This fact, a shape coefficient with a trend towards 1, was also observed with concrete specimens with high compressive strength. Researchers [
64,
65] indicated that the shape coefficient decreases as the concrete strength is increased. In other words, high-strength concrete is not so affected by the shape of the specimen. After analyzing cylinders and cubes of variable sizes and ratios with 11 mixes with UCS values ranging from 20 to 100 MPa, Mansur and Islam [
66] verified that the ratio of cube to cylinder compressive strengths decreases when increasing the concrete strengths. This fact is also noted in standards, such as the CEB-FIP Model Code [
67] or the EHE-08 code for Spain [
38], previously commented on in
Section 2.2, which established a value of 1 for
K for
fcube over 80 MPa. Furthermore, Graybeal and Davis [
24] investigated the ratio between cylindrical and cubic specimens for ultra-high-performance fiber-reinforced concrete, with strengths between 80 and 200 MPa, and concluded that cylinders and cubes were interchangeable at this range.
As seen, a similar trend is observable with high-strength soil-cement samples. As the UCS has increased, the shape coefficient has diminished, from a value of 1.11 with UCS around 2.5 MPa, to a value of 1.06 for UCS around 5 MPa, to a value of 1.023 for UCS around 10 MPa. In fact, there is a data point, the one referring to the strength at 28 days, where the value of the cubic samples (12.243 MPa) is practically the same as for cylindrical samples (12.257 MPa) and another one, the one relating the additional cylindrical sample (BCYL07-7) with the cubes from BCUB07-5 and BCUB07-6, where the cubes achieved a greater strength than the corresponding cylindrical specimen. This reflects the idea of trending towards equivalence, which is proposed for other cementitious materials, like concrete [
24,
66,
68,
69]. The gradual convergence of cube and cylinder strengths at higher UCS levels also reflects a reduction in lateral dilation and in the influence of end-restraint, meaning that as the material becomes stronger and less deformable, geometric effects diminish and
K approaches one [
62].
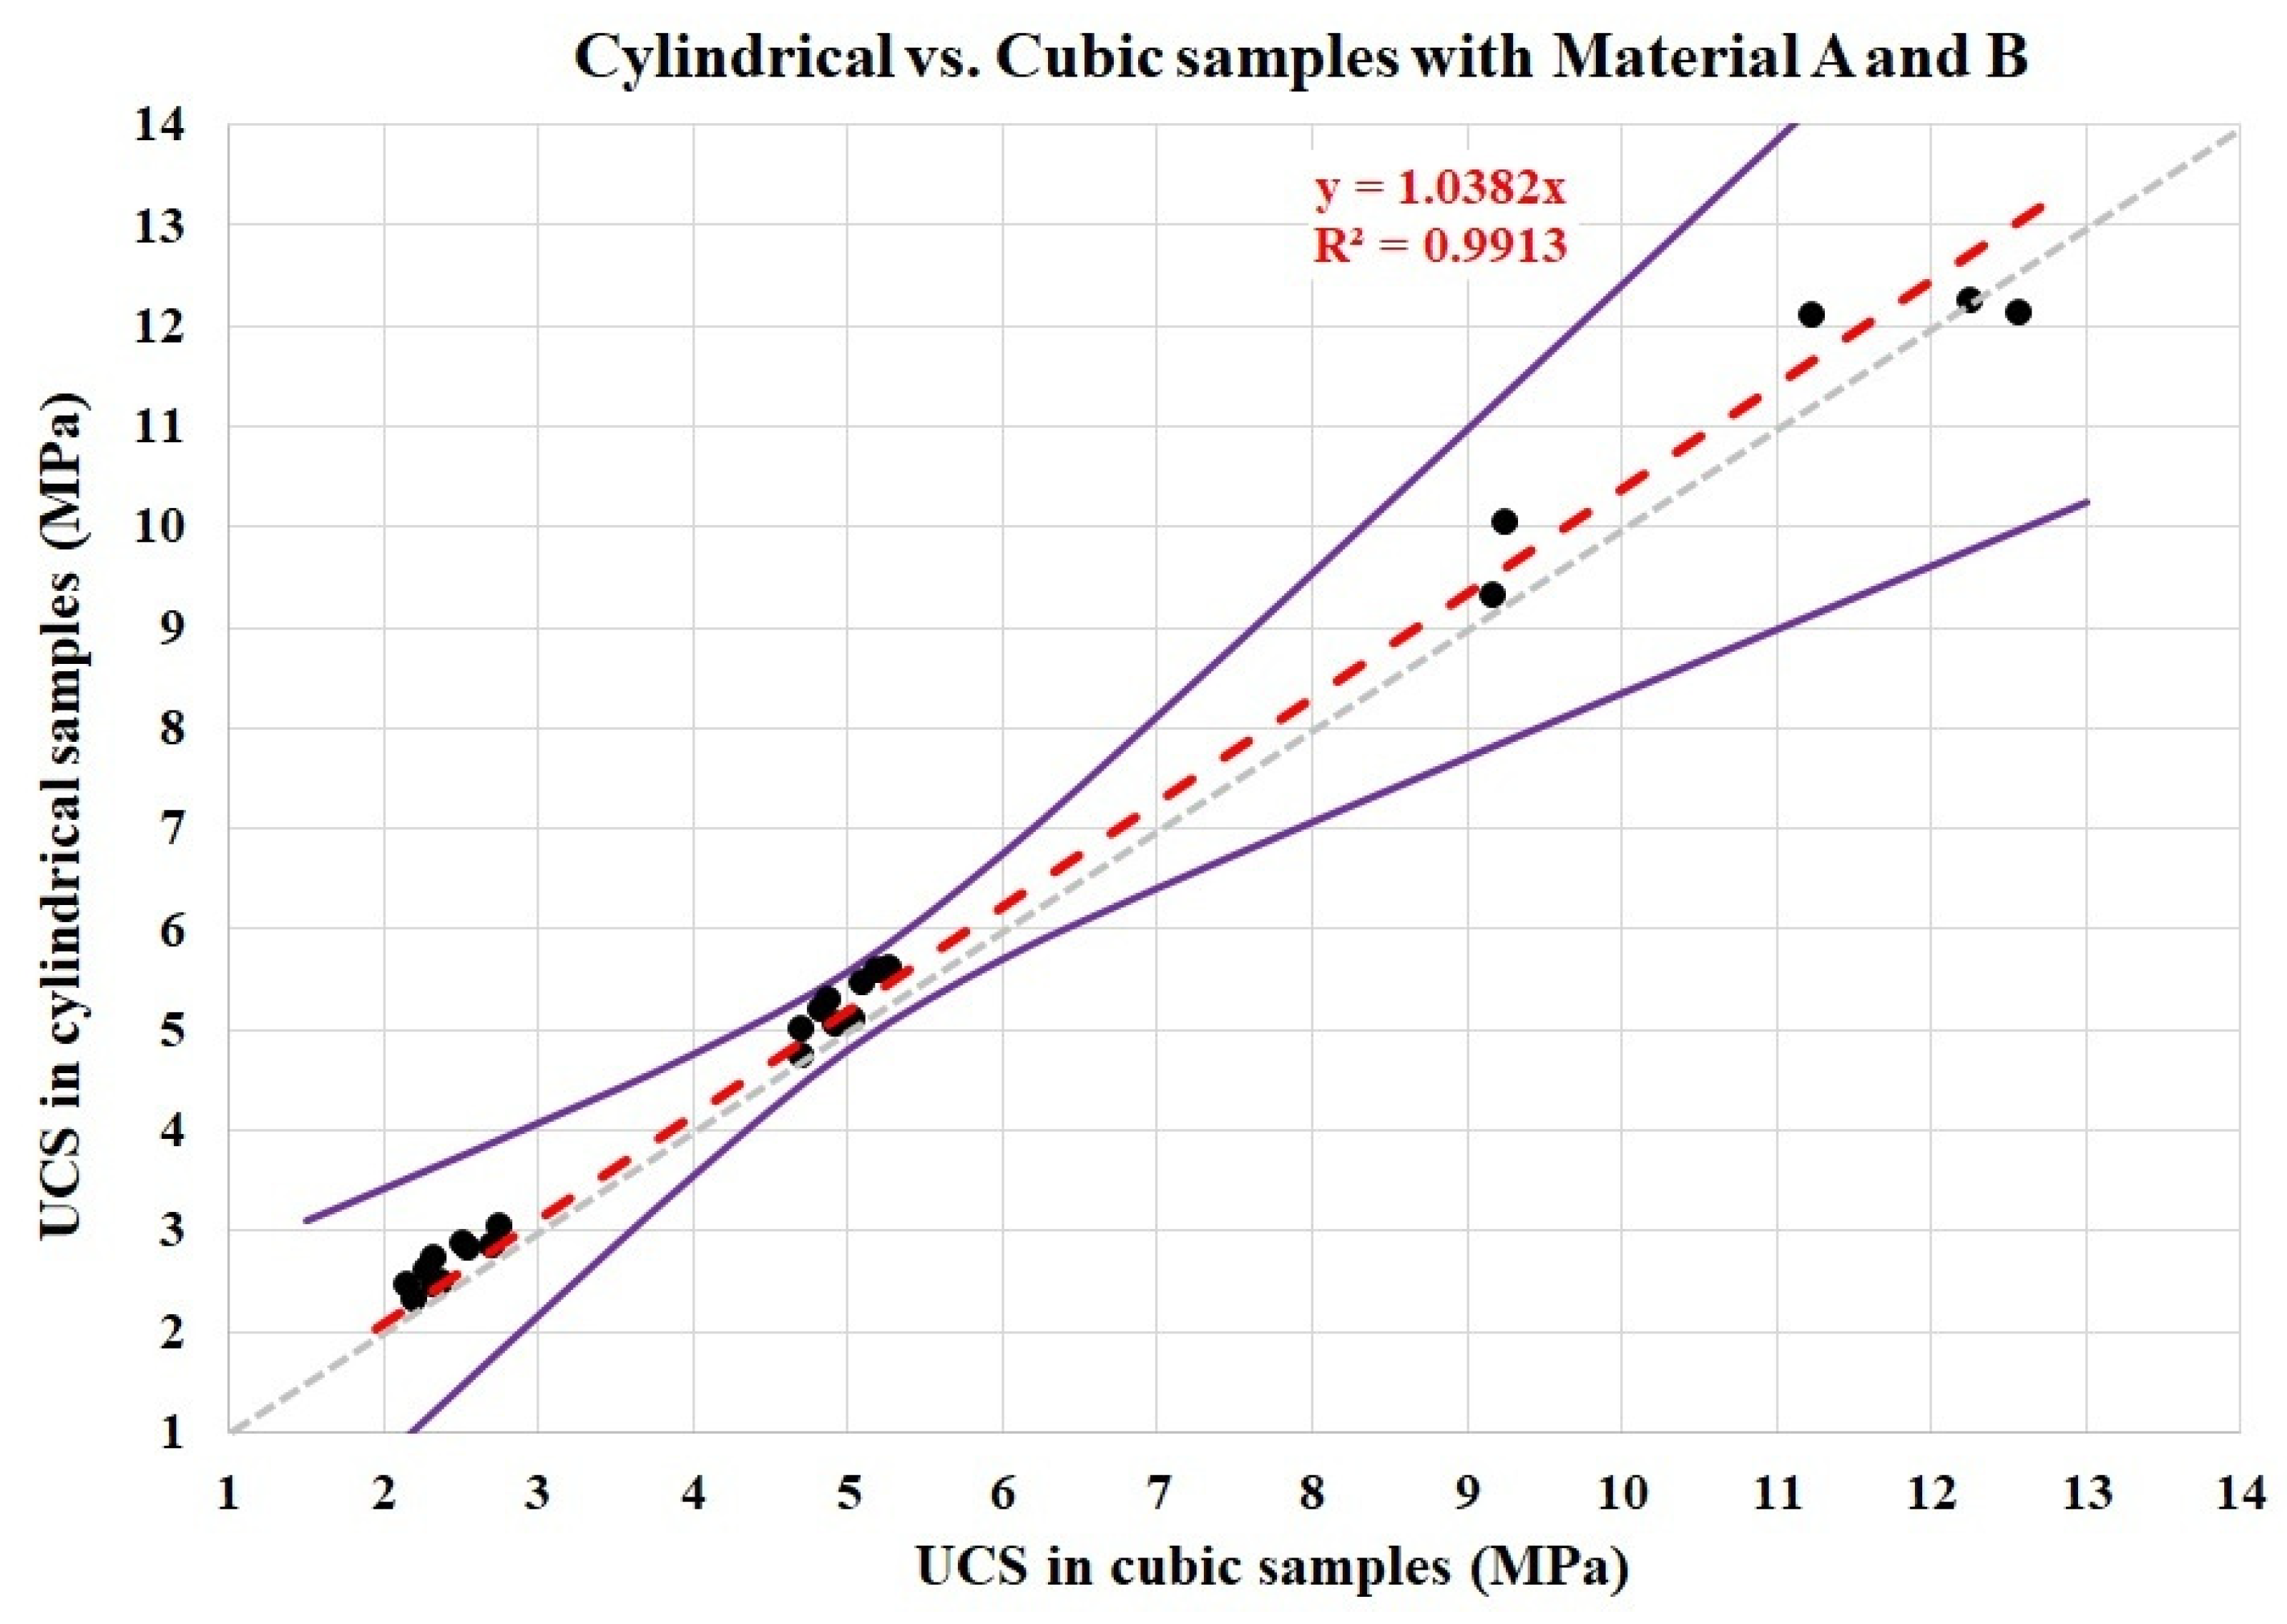
The final stage of the investigation comprises putting all the data points together to calculate a general shape coefficient, which is presented in
Figure 15.
The first point to comment on is the resulting value for the shape coefficient. A value of approximately 1.04 is obtained. These average values are fully consistent with the mechanical expectation for squat cylinders, which systematically test stronger than cubes due to confinement effects, as noted in ASTM D1633 [
60] for soil-cement and in the literature about mechanics on concrete [
61,
62,
70] and on soil-cement [
63,
71].
In addition, it could be said that the proposed value of 1.04 comes as an average from 10 points, which were compared using a value of 1.11, 10 points with a value of 1.06, and 5 points that established a value of 1.023. Taking into consideration, it could be deduced that a different shape coefficient was needed according to the range of the UCS, as proposed in other standards [
38,
67]. Nevertheless, the point to be underlined is that the resulting shape coefficient, 1.04, obtains a higher accuracy than those obtained by the specimens individually in the same range of strength, with all the data points within the 95% CI range. For specimens of Material A tested at 7 days, the determination coefficient of the relationship between them was only 0.77; for samples of Material A tested at 90 days, the
R2 value was 0.78; and, finally, the accuracy of the regression for data from Material B was a bit higher, 0.86. However, when gathering all the data together, a very high accuracy is achieved, a determination coefficient of 0.9913. Consequently, instead of proposing various shape coefficients depending on the compressive strength value, as for concrete specimens, it was preferred to propose a unique value, 1.04, for converting UCS values of cubic samples (of 15 cm) to UCS values of cylindrical samples of 18 cm high and 15 cm diameter (Equation (2)). This research has the advantage of comparing different materials and compressive strengths, making it possible to observe the global trend of the soil-cement mixtures instead of being focused on a narrower range for compressive strengths, which would have limited the generalization of the proposed shape coefficient. Our aim was to propose a first shape coefficient for soil-cement for any strength range, which could be applied directly to obtain a magnitude order of the conversion. Finally, although the variability in the UCS range is favorable for the investigation, it must be noted that further analysis is needed to verify the trends observed in this study.
where
fcyl,sc and
fcube,sc are the unconfined compressive strength of soil-cement in cylindrical specimens of 180 mm high and 150 mm diameter, and in cubic specimens of 150 mm, respectively.
5. Conclusions
This study has addressed a long-standing gap in the characterization of cement-treated pavement base materials by examining the influence of specimen geometry on compressive strength testing results, specifically focusing on the development of a shape coefficient for soil-cement. Although shape coefficients are well established in the field of concrete and are embedded in design standards worldwide, equivalent knowledge for soil-cement or cement-treated base materials remains scarce, despite their extensive use in pavement engineering.
To tackle this issue, an experimental program was designed using two different soil-cement mixtures with distinct material characteristics, cement types, and aggregate sources. This was performed deliberately to ensure that the findings would not be restricted to a single material source or mix design. Cylindrical specimens (150 mm diameter × 180 mm height) and cubic specimens (150 mm edge) were tested at various curing ages (7, 28, and 90 days), resulting in a broad range of compressive strength values, from approximately 2.5 MPa to over 12 MPa. The methodology ensured the comparability of results by using specimens manufactured from the same mixing whenever possible and by applying standardized procedures for compaction, curing, and testing. This allowed the observed differences in unconfined compressive strength (UCS) to be attributed mainly to specimen geometry rather than to variability in material production.
The results revealed a systematic trend: cylindrical specimens consistently exhibited higher UCS values than cubic specimens for all mixtures and curing ages. This finding contrasts with typical observations in concrete, where cubic specimens often show higher strengths. The difference can be explained by the geometry used in soil-cement testing. Cylindrical specimens of 180 mm height present a lower slenderness ratio compared to the standard 300 mm height cylinders used in concrete, which leads to greater confinement effects at the platens and higher apparent compressive strength. In cubic specimens, the stress field is more uniform and less influenced by platen restraint, resulting in lower strength values.
A further key observation is that the magnitude of this shape effect decreases with increasing strength. For the lowest UCS range (approximately 2.5 MPa), the shape coefficient (K) was determined to be around 1.11, indicating that cylindrical specimens produced strengths about 11% higher than cubic specimens. At intermediate strength levels (around 5 MPa), the coefficient decreased to 1.06, and at the highest strength levels (around 10 MPa), it was close to unity (1.023). This behavior is consistent with trends observed in concrete, where shape effects become less relevant at higher strengths due to reduced lateral deformation and increased material homogeneity.
When all data points from both mixtures and all ages were combined, a single shape coefficient of K = 1.04 was obtained, resulting in an equation of the form UCScyl = 1.04·UCScub, with a very high coefficient of determination (R2 = 0.9913). This high accuracy suggests that a single value can adequately represent the shape effect for a wide range of soil-cement mixtures and strength levels. From a practical standpoint, this is a significant advantage: using a single coefficient simplifies design, testing, and specification procedures, avoiding the need for strength-dependent correction factors as used in some concrete standards. The proposed coefficient is particularly relevant because cubic specimens present clear operational advantages: they are lighter, easier to handle, and do not require capping prior to testing, thus reducing environmental impacts and simplifying laboratory procedures.
Nevertheless, this research should be considered an initial step towards fully establishing shape conversion rules for soil-cement. The study was conducted with two mixtures representing typical pavement base materials in Spain, and although these mixtures exhibited different properties and strengths, further work is needed to validate the coefficient for a broader range of materials, including those with different cement contents, gradations, moisture conditions, and curing environments. Additionally, other geometries, such as smaller or larger cubes or alternative cylinder dimensions, could be investigated to extend the applicability of the proposed coefficient.

