Article

Study on the Bearing Capacity of Extra-Large-Diameter Piles in Complex and Thick Lacustrine Deposits

1
School of Land and Resources Engineering, Kunming University of Science and Technology, Kunming 650093, China
2
Key Laboratory of Geohazard Forecast and Geoecological Restoration in Plateau Mountainous Area, Ministry of Natural Resources of the People’s Republic of China, Kunming 650093, China
3
Yunnan Key Laboratory of Geohazard Forecast and Geoecological Restoration in Plateau Mountainous Area, Kunming 650093, China
4
Yunnan Jiantou First Survey and Design Co., Ltd., Kunming 650093, China
*
Author to whom correspondence should be addressed.
Buildings 2025, 15(23), 4294; https://doi.org/10.3390/buildings15234294
Submission received: 23 September 2025 / Revised: 12 November 2025 / Accepted: 15 November 2025 / Published: 27 November 2025
(This article belongs to the Section Building Structures)

Abstract

To reveal the influence mechanism of complex and thick lacustrine sedimentary strata on the bearing performance of large-diameter and ultra-long piles, experimental and numerical simulation studies were carried out in view of the special engineering properties of peat soil in the strata. Three test piles with a diameter of 1 m and lengths of 98 m, 93 m, and 92 m, respectively, were taken as the research objects. The bearing characteristic parameters were obtained through static load tests, and the influence laws of parameters such as the thickness of the weak layer, pile length and pile diameter in the peat soil layer were analyzed in combination with numerical simulation. The results show that in the geological conditions of thick lacustrine sedimentary strata, the Q-s curve of the ultra-long pile is steeply descending, and the ultimate bearing capacity is 28,800 kN, showing the characteristics of end-bearing friction piles. The side friction resistance of the pile shows a typical “triangle” distribution in the upper part and reaches the ultimate value in the middle and lower parts, presenting a multi-hump “R” shape distribution. When the thickness of the weak layer increases from 10 m to 30 m, the settlement increases sharply, and when it reaches 40 m, the settlement almost remains unchanged. The change of pile length has a relatively small impact on the bearing capacity and can be ignored in terms of settlement change. When the pile diameter increases from 0.5 m to 1.0 m, the settlement decreases sharply, and when the pile diameter exceeds 1.5 m, the settlement fluctuates very little. The research confirms that the change of pile diameter has the greatest impact on the ultra-long pile, followed by the thickness of the weak layer, and the pile length has the least impact. The research results can provide theoretical basis and technical support for the design and construction of large-diameter and ultra-long piles in similar complex lacustrine sedimentary strata.

1. Introduction

With the rapid advancement of urbanization and infrastructure construction, the number of large and complex projects such as high-rise buildings and extra-large bridges is increasing. These projects have strict requirements for the bearing capacity and stability of pile foundations to meet the demands of special engineering and complex geological conditions [1,2,3,4,5,6,7,8]. Large-diameter and ultra-long piles, which can effectively penetrate weak soil layers and transfer the load of the superstructure to deep stable soil or rock layers, have become one of the key technologies to solve such engineering problems. However, due to the high difficulty in design and construction, accurately assessing their bearing performance is particularly crucial. Among them, the “vertical compressive static load test of pile foundation” is the most direct and reliable method for evaluating the bearing capacity of pile foundations, playing an irreplaceable role in ensuring the scientific design of pile foundations, the qualification of construction quality, and the long-term safe operation of structures [9,10,11,12,13].
Research on the bearing capacity of ultra-long, large-diameter piles has been limited both domestically and internationally due to high costs and lengthy testing cycles. Li Tiantian et al. [14] employed a large-diameter, ultra-long cast-in-place pile with a diameter of 1 m and a pile tip burial depth of 94 m to validate bearing capacity values and pile construction feasibility through field testing. Liu Xiujun et al. [15] combined static load tests to reveal certain characteristics of the bearing mechanism for large-diameter, extra-long cast-in-place piles in reclaimed land areas. Wang Zemin et al. [16] conducted a detailed analysis of the test plan and data from a large-diameter, extra-long rock-embedded pile static load test project in Nanjing. They also employed numerical simulation to investigate the variation of axial force within the pile body with depth under different load levels.
Xiao Li et al. [17] analyzed and summarized the strain distribution, Poisson’s ratio variation, axial force transfer, lateral resistance performance, and compression deformation patterns of large-diameter ultra-long piles based on the Ningbo LNG project. They concluded that ultra-long rock-embedded piles exhibit a bearing characteristic of “lateral resistance dominance with delayed end resistance,” quantitatively revealing the nonlinear relationship between pile-side friction resistance and relative pile–soil displacement. Duan Chang et al. [18] established a relationship between the uniaxial compressive strength of intact coral reef limestone and the ultimate lateral friction resistance and end resistance of piles. Based on field static load tests and core drilling tests of post-grouted rock-embedded cast-in-place piles, they proposed a calculation method for the bearing capacity design of such piles in coral reef limestone formations. Jin Ruibao et al. [19] investigated the effects of grouting methods and volumes on the vertical bearing capacity of large-diameter, extra-long piles in clayey soils based on static load tests. Results indicated that post-grouting significantly enhanced the ultimate bearing capacity of model piles while reducing pile-head settlement. He et al. [20] established a numerical model for extra-long piles based on Green–Lagrange strain theory, validated through field tests. They systematically investigated bearing characteristics under uniaxial and combined loads, revealing a complex sequence of failure modes. Tan et al. [21] proposed a novel machine learning (ML) approach coupling the extreme gradient boosting (XGBoost) algorithm with the state-of-the-art student-based optimization method (SPBO) to predict pile resistance. Results demonstrated that the proposed SPBO-XGBoost model outperformed all other models in prediction accuracy and reliability. Hu et al. [22] conducted in situ static load tests on three ultra-high-rise, large-diameter, extra-long rock-anchor bored cast-in-place piles (LSRBP). They analyzed the effects of composite excavation and combined grouting on pile response, along with the optimization benefits of combined grouting. Results indicated that composite excavation enhances construction efficiency but compromises borehole quality and reduces LSRBP bearing capacity, while combined grouting compensates for this deficiency. Elsawwaf A et al. [23] proposed a hybrid method combining three-dimensional finite element (FE) modeling with evolutionary polynomial regression (EPR) based on a multi-objective genetic algorithm (MOGA) to predict the lateral bearing capacity of short straight piles and stepped conical piles in non-cohesive soils. Gao et al. [24] evaluated the effects of different additives (sodium carbonate, carboxymethyl cellulose, polyacrylamide, and barite powder) on modified mud properties and microstructure, determining optimal additive ratios. SEM tests revealed these additives produced denser mud cake structures, enhancing wall protection and filtration/loss reduction effects. Based on Randolph’s research on pile resistance in homogeneous soils, Xiao et al. [25] proposed a novel, scientifically accurate three-stage analytical method for predicting pile settlement. Xu et al. [26] discovered through centrifuge model tests and finite element simulations that the unit external friction force propagates downward along the pile shaft and varies linearly with depth, while the unit internal friction force activates within a five-diameter (5D) zone above the pile tip and exhibits an exponential distribution with depth. They subsequently proposed a correction method to determine the unit internal sliding friction coefficient for open-ended single pile foundations, enabling precise assessment of their axial ultimate bearing capacity. Yuan et al. [27] conducted a series of centrifugal vibration table tests on large-diameter monopiles at scour locations, revealing that scour exerts a more pronounced influence on the higher-order modal frequencies of OWT systems. He Wentao et al. [28] investigated the seismic response of OWTs supported by single piles using advanced soil models. Results indicate that contributions from higher vibration modes become increasingly significant for large wind turbines, with soil–structure interaction playing a crucial role in dynamic response. Mozaffari N et al. [29] proposed a novel design model for large-diameter single piles, capable of accurately predicting pile behavior under lateral loads. Atroush A M et al. [30] rigorously evaluated machine learning (ML) and deep learning (DL) techniques. They found that while ML methods outperform traditional approaches in predicting pile lateral behavior, their “black-box” nature and reliance on data-driven insights yield results reflecting statistical robustness rather than clear geotechnical insights. Wan H Z et al. [31] investigated the effect of combined end-side grouting on the bearing capacity of large-diameter rock-bearing bored piles in highly weathered rock formations. Results demonstrated that combined grouting significantly enhanced the lateral and end resistance of bored piles, substantially increased bearing capacity, and effectively controlled settlement.
Numerous scholars have conducted extensive research on special engineering geological conditions, such as loess regions, karst areas, and water-saturated sand layers. Xue Zhennian et al. [32] investigated the influence of slenderness ratio on the lateral friction resistance of bored cast-in-place piles in loess regions through model tests and laboratory loading experiments. To address the impact of pile cap settlement in thick collapsible loess areas, Kui Jiangang et al. [33] analyzed the load–settlement relationship for piles of varying lengths under identical loading conditions through field load tests. Liu Sisi et al. [34] proposed a bearing capacity calculation method based on the minimum potential energy principle for ultra-long piles penetrating karst formations with complex strata such as karst gullies and caves. Hu Changming et al. [35] analyzed the bearing characteristics of ultra-long foundation piles in water-rich sand layers using field tests and numerical simulations. Zhang Zhiguo [36] examined the load transfer patterns and bearing deformation characteristics of extra-long piles in deep volcanic ash deposits. Kang Zhenxing [37] conducted dual-load box self-balancing tests to investigate the bearing capacity of extra-long, large-diameter piles in deep sandy soils, obtaining characteristic values for single-pile bearing capacity and the distribution of lateral resistance with depth. Jiang Zhaowei [38] simulated settlement changes and stress distributions in pile foundations and surrounding soil layers to investigate settlement issues of extra-long pile foundations under varying soil conditions. Liang Huayan et al. [39] analyzed the bearing mechanism of large-diameter extra-long piles in deep soft soils based on PLAXIS 3D numerical simulations and field test results from the Fuzhou Metro Garden project. Boelter et al. [40] identified multiple factors influencing the physical and mechanical properties of peat soils. Chen Yuntao et al. [41] employed static loading and pile stress testing methods to determine pile tip bearing capacity and lateral friction resistance. Fu Lijun et al. [42] analyzed the vertical bearing characteristics of two pile foundation types based on a foundation project in Qingdao’s coastal area.
Among these, research on the bearing capacity of ultra-long piles within complex, thick lacustrine deposits remains scarce, particularly concerning the distinctive peat soils found therein. Gui Yue et al. [43,44,45,46] conducted shear strength tests on peat soils from the Dianchi and Erhai regions, revealing that as axial stress increases, the internal density of the soil exhibits a synchronous upward trend. Creep tests reveal an S-shaped e-lgt curve for this soil type, exhibiting subconsolidation characteristics. Furthermore, permeability consolidation tests indicate that the permeability coefficient is influenced by consolidation stress, loading duration, and the vector of consolidation. Using peat soils from Wisconsin, USA as a case study, Edil et al. [47] conducted triaxial and consolidation tests. They compared relevant data between American and other countries’ peat soils while discussing how fiber composition and content influence the mechanical properties of these American peat soils. Peat soils, unique to the Kunming region, are abundantly present around Dianchi Lake. As a soft foundation soil with higher moisture content than other foundation soils, peat poses significant challenges for pile foundation selection. Consequently, to mitigate risks, most high-rise buildings in this area adopt pile foundation systems [48,49,50]. Consequently, investigating the bearing capacity of large-diameter, extra-long piles in lacustrine peat soils holds significant practical engineering value.
Therefore, this study investigates the load transfer mechanism and bearing deformation characteristics of extra-long piles in complex, thick lacustrine sediment layers by conducting internal force tests on pile foundations through single-pile static load tests at Juhou Lake in Kunming. A numerical model of the pile foundation static load test is established using finite element software. The model’s validity is verified by comparing simulation results with actual test data. By analyzing parameters such as weak layer thickness, pile length, and pile diameter, the study investigates the influence of peat-like soil layers on the bearing capacity of extra-long piles, providing guidance for controlling settlement in Kunming’s soft soil foundations.

2. Experimental Overview

2.1. Background

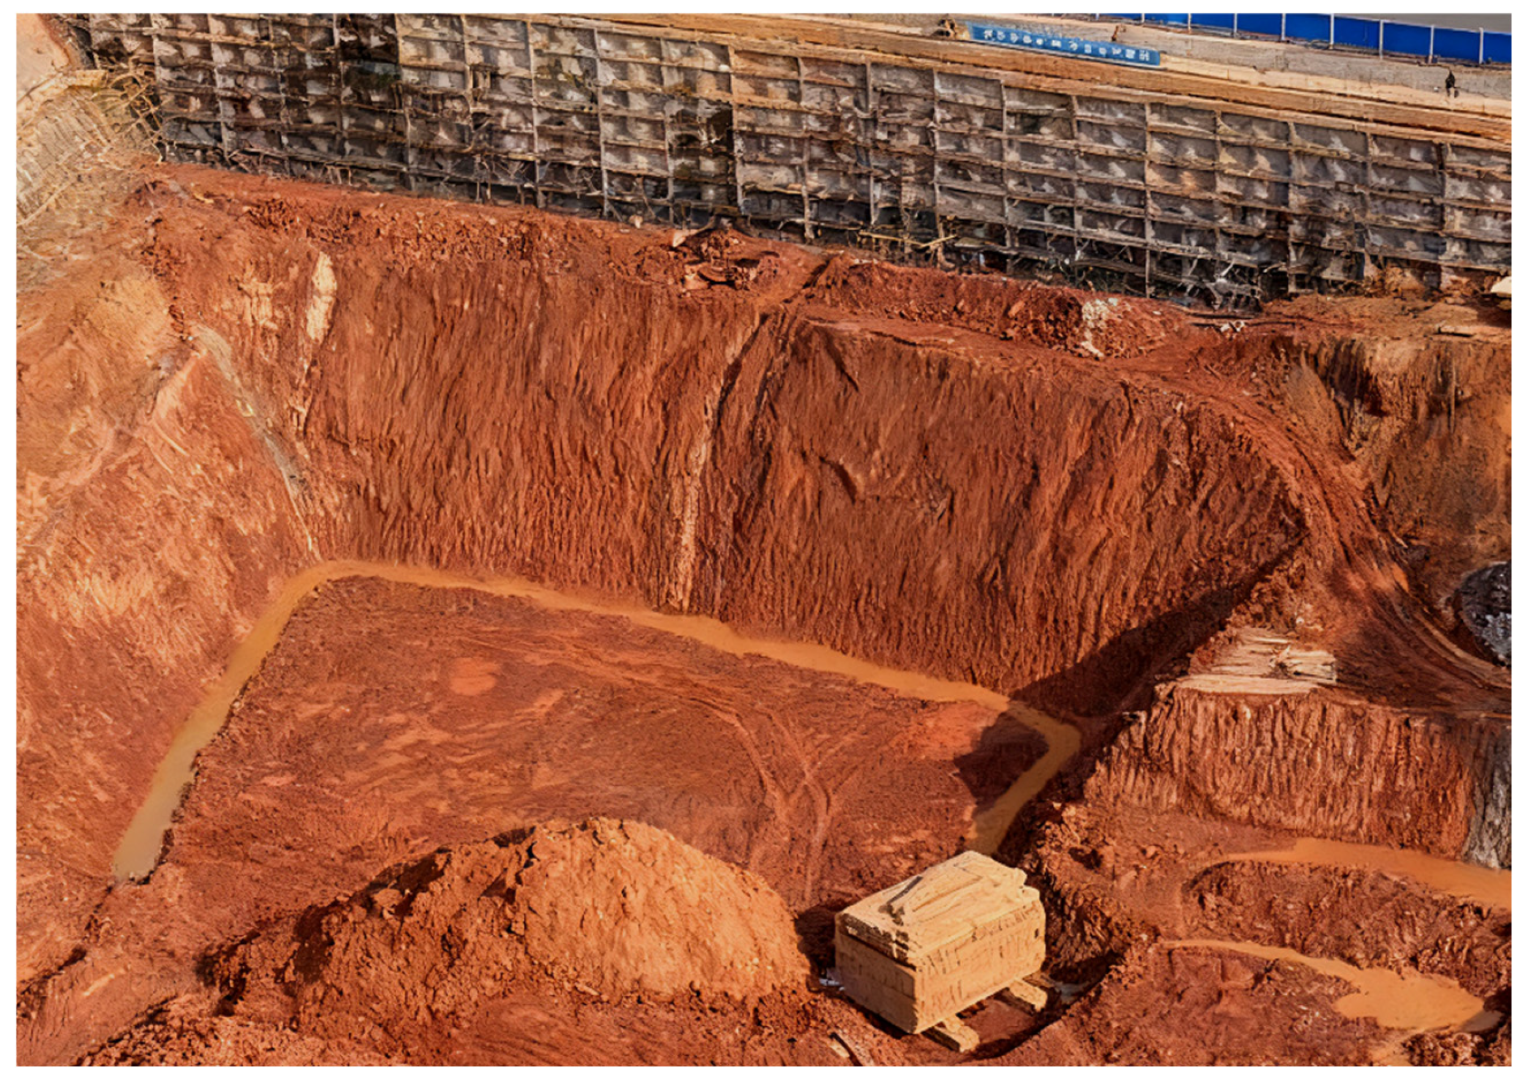
The test project is located in the Kunming area, where the strata primarily consist of multiple alternating layers of clay, silt, sandy silt, and peat-like soil. The geological structure is complex, featuring multiple interbedded layers of weak peat. The overall formation exhibits typical characteristics of exceptionally thick lacustrine deposits.

2.2. Test Overview

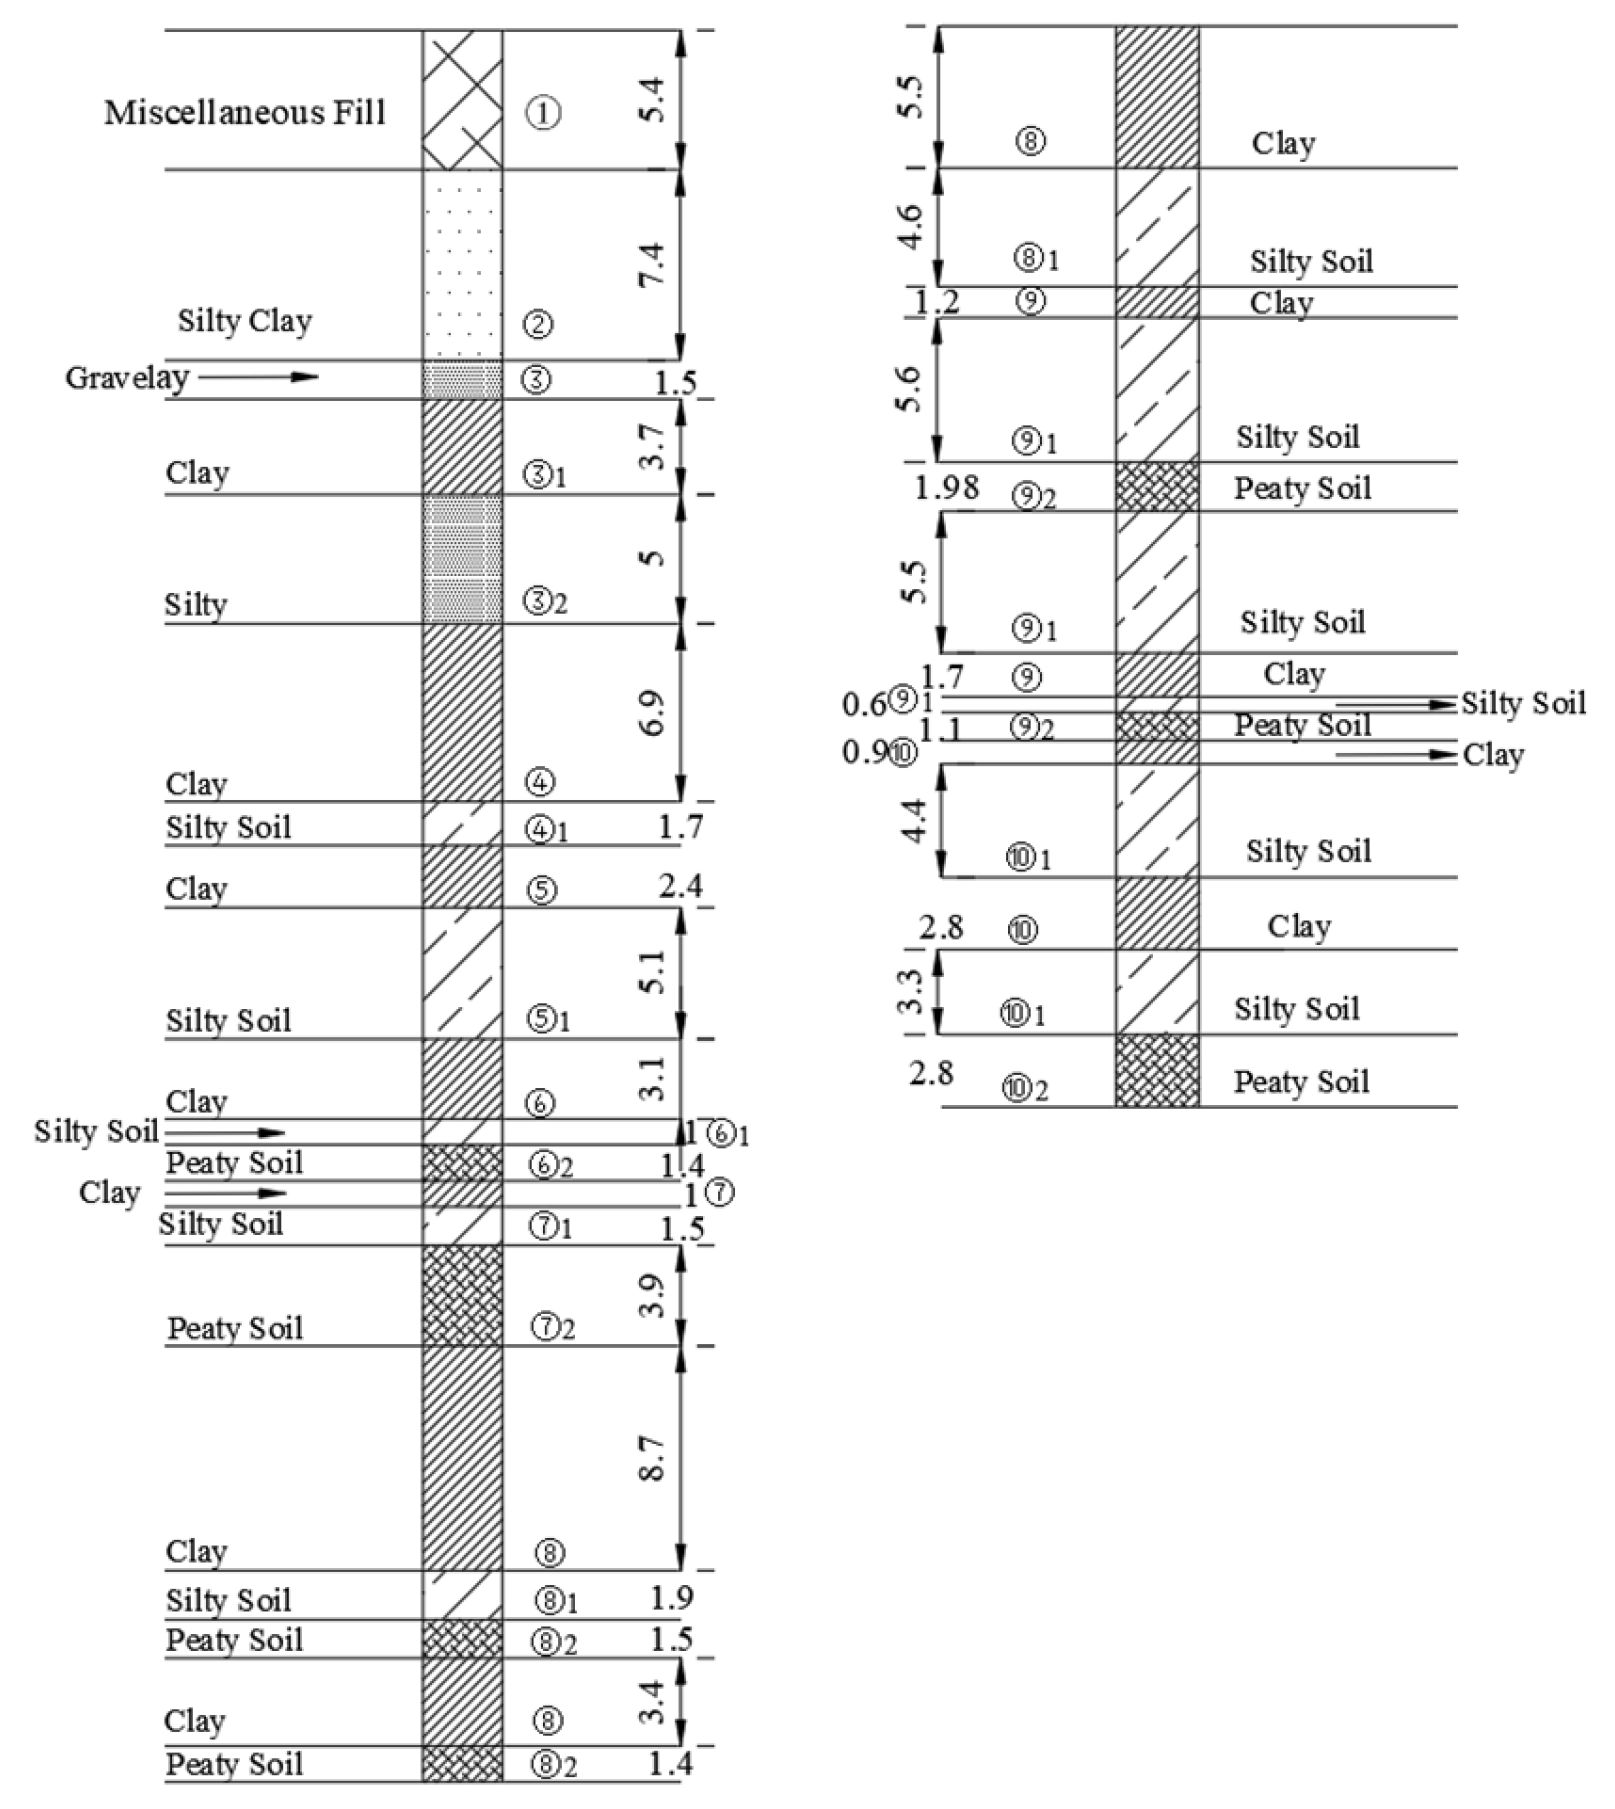
The test employed a slow-load maintenance method, selecting three representative test piles from office towers T1, T5, and T6. All piles had a diameter of 1000 mm, with lengths of 98 m, 93 m, and 92 m, respectively, all classified as large-diameter ultra-long piles. The specific soil stratum profile is shown in Figure 1.
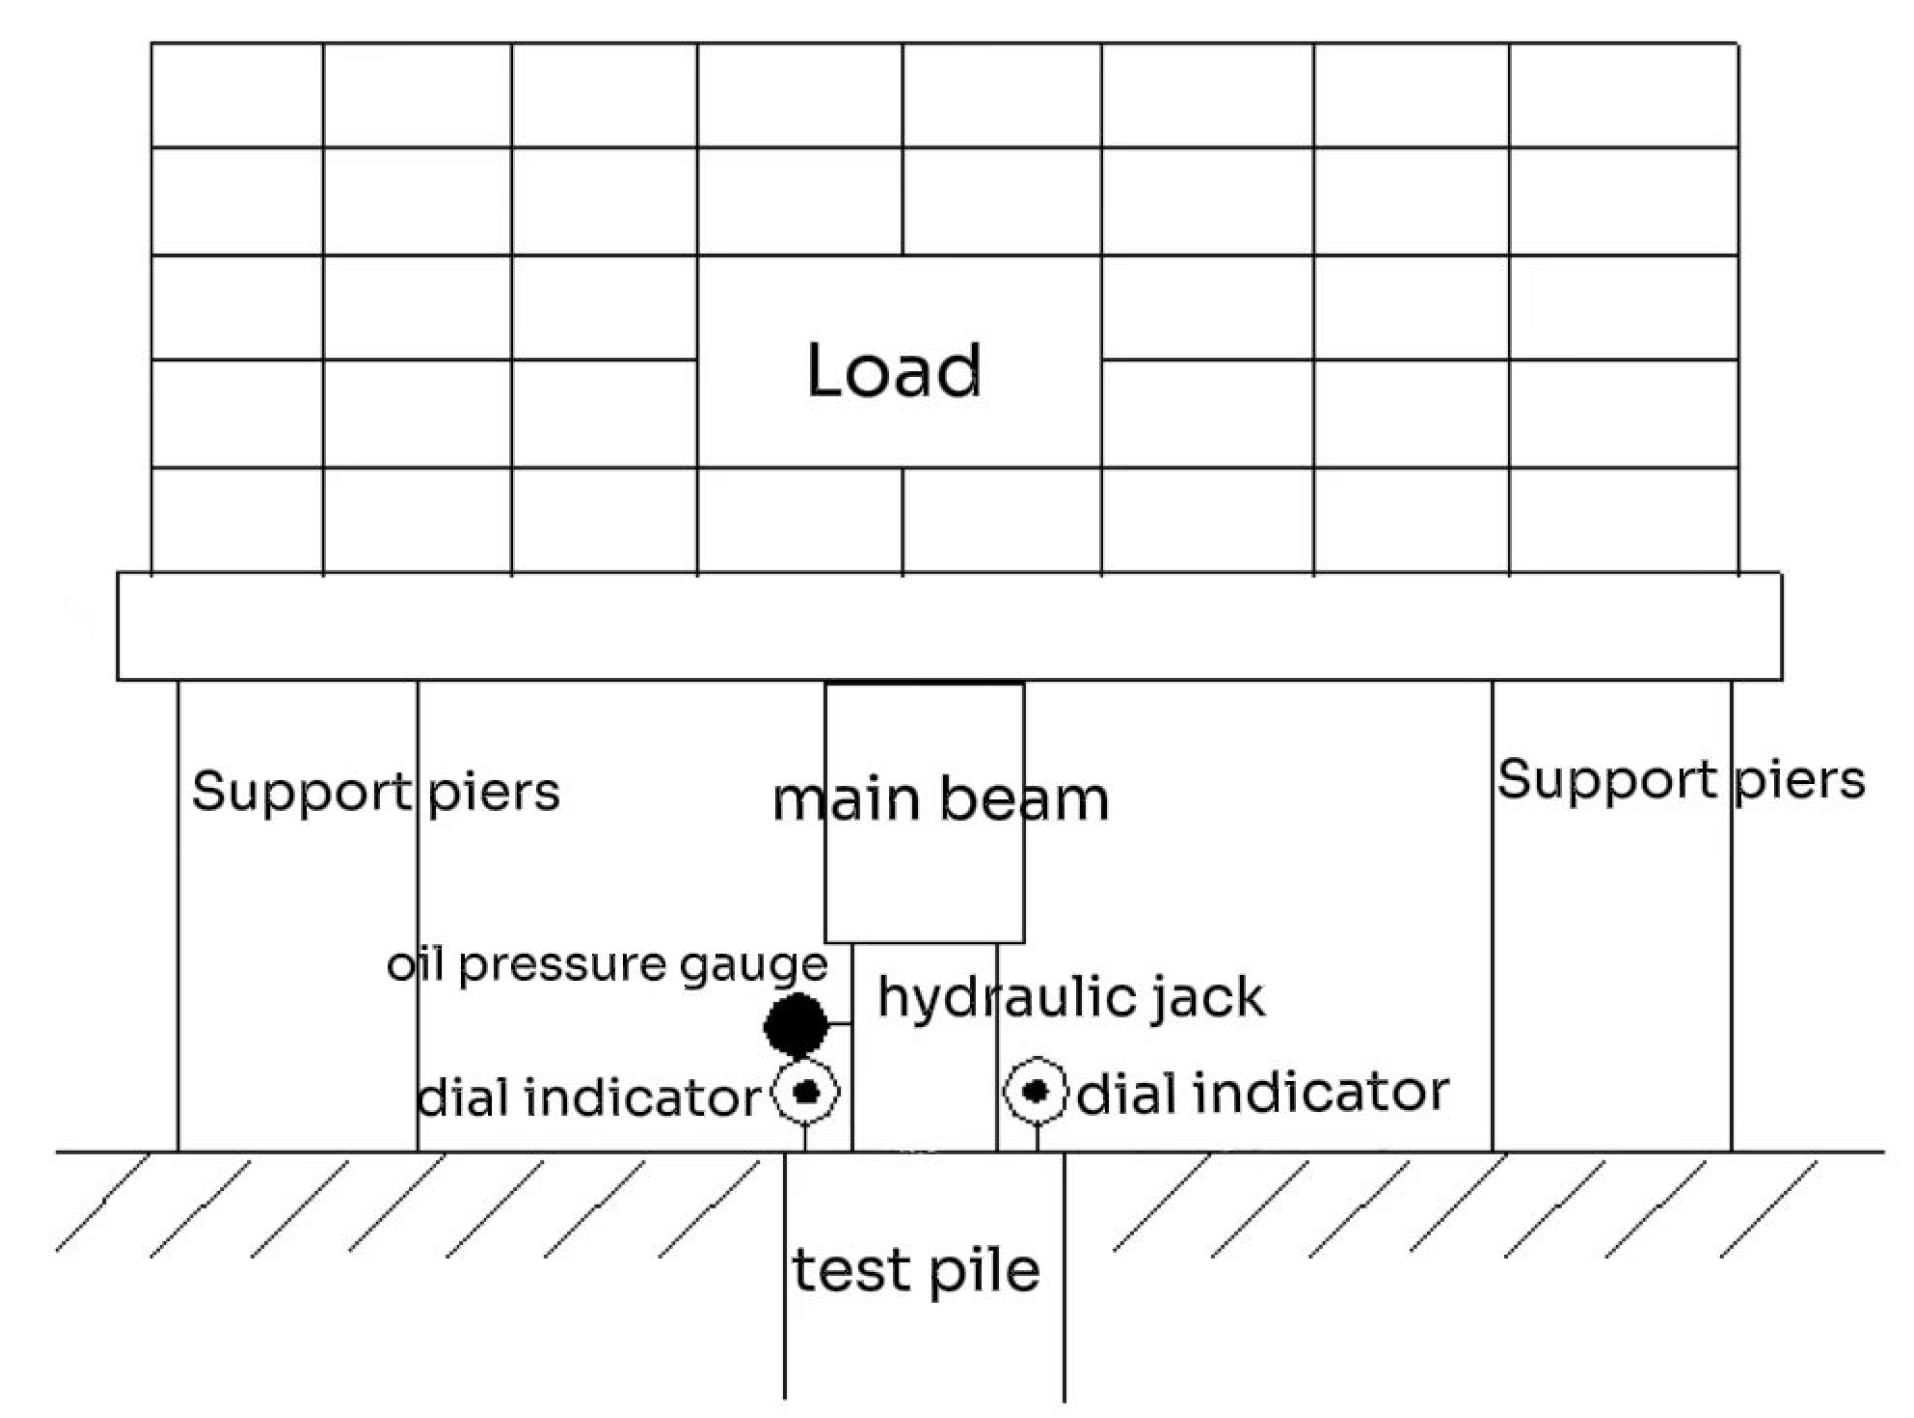
The characteristic value of single-pile vertical compressive bearing capacity was set at 28,800 kN, while the ultimate bearing capacity was defined as 32,000 kN. The test employed a counterweight platform reaction device to provide reaction forces. In accordance with design specifications, the maximum loading capacity during testing must align with the design ultimate bearing capacity, i.e., 32,000 kN. A schematic diagram of the reaction device is shown in Figure 2.
The test loading method employed the “slow load maintenance method”. Test piles were loaded in nine stages, with each stage applying 1/10th of the estimated ultimate bearing capacity (3200 kN). The initial loading value was 6400 kN, and the maximum loading capacity reached 32,000 kN. The static load field test is shown in Figure 3.

2.3. Test Pile Construction Process and Quality Control

2.3.1. Test Pile Construction Process

(1) Site Hardening: To ensure drilling operations meet verticality requirements and mitigate adverse weather impacts during the rainy season, the construction site underwent hardening treatment, providing a stable foundation for subsequent work.
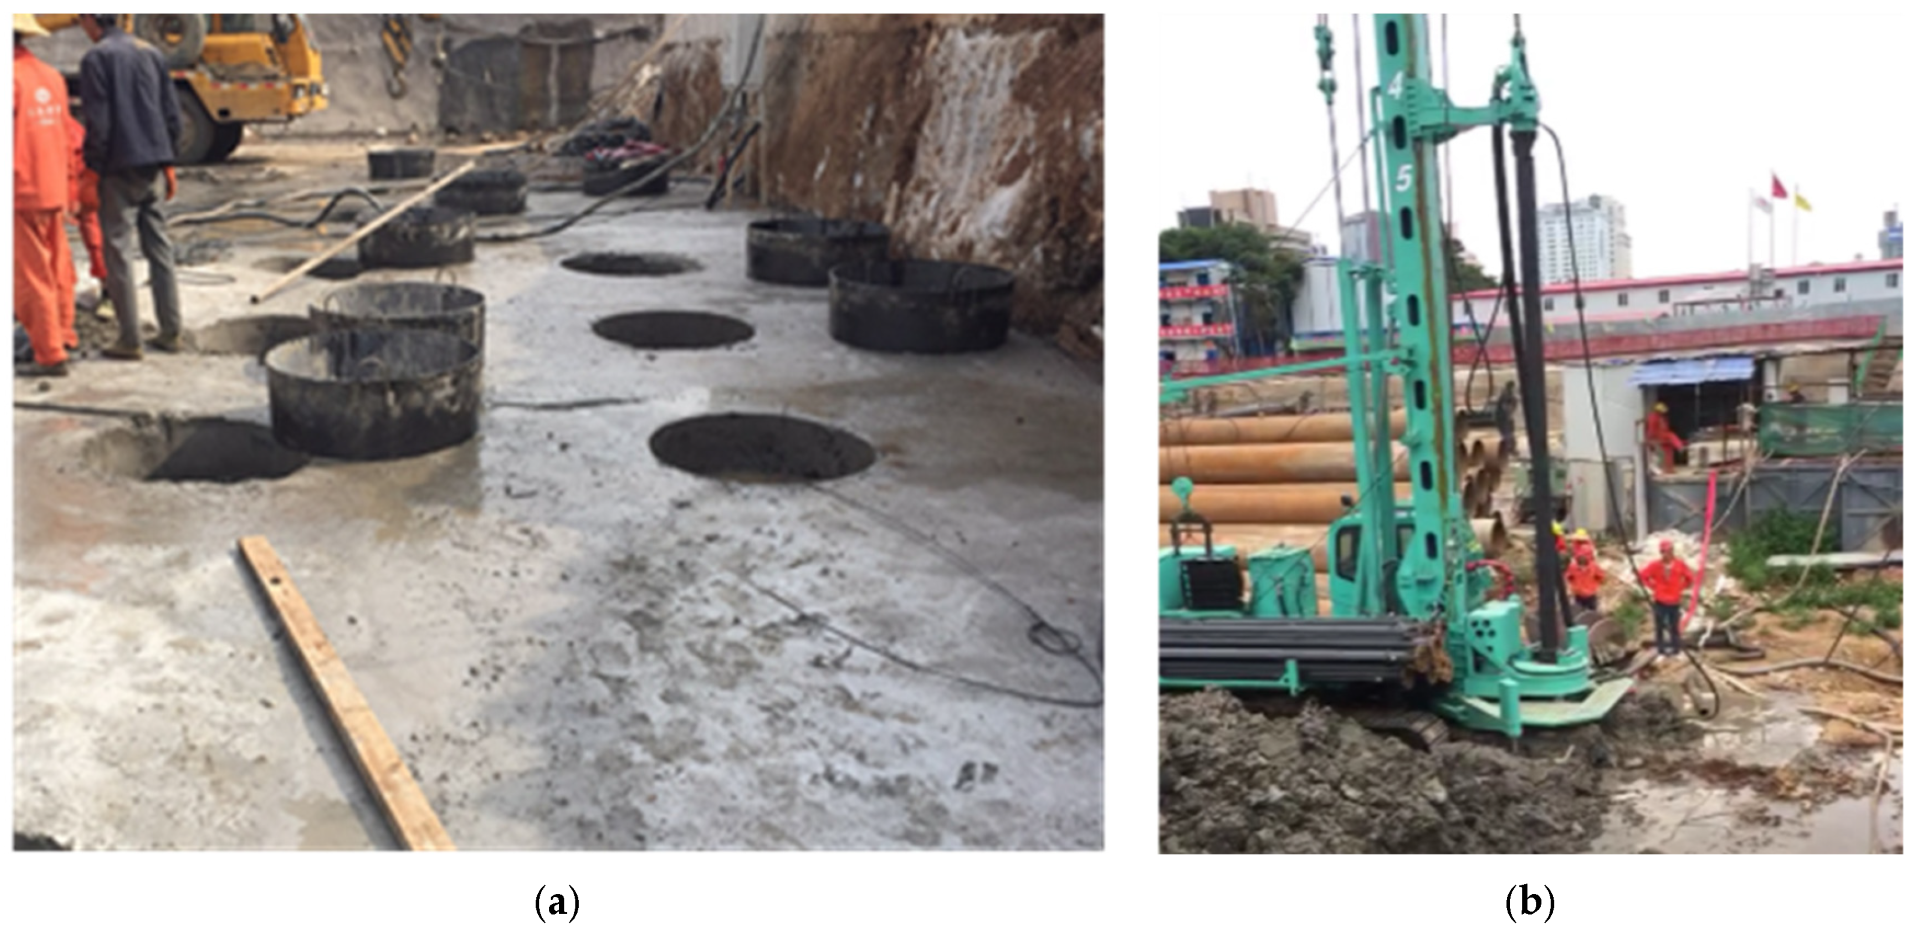
(2) Pile Body Precision Positioning Process: During site hardening, a “non-repeat staking device” was simultaneously installed. Subsequently, the steel casing was positioned and installed using ICE equipment. After casing installation, re-measurement and verification were conducted. Once the position was confirmed accurate, the drilling rig was positioned and centered (see Figure 4a for details).
(3) Verticality Control for Hollow Pile Sections: With hollow pile sections ranging from 18 to 20 m in length, to ensure verticality compliance and minimize displacement deviation at the designed pile cap, the ICE vibratory hammer was fixed to the frame of the three-axis mixing pile machine. A 20 m steel casing was lowered for auxiliary control, leveraging the site hardening to maintain a level pile foundation working surface.
(4) Borehole Formation Method Selection: Rotary drilling rigs were used for pile foundation formation in the basement and auxiliary tower areas. Due to the presence of hard plastic silty clay beneath the main tower, conventional rotary drilling rigs faced significant challenges. Therefore, a combined formation method using both rotary drilling rigs and conventional rotary drilling rigs was adopted (see Figure 4b for details).
(5) Control Measures for Preventing Omissions and Errors in Pile Driving: Given the large number of piles, significant variations in specifications, and extended construction period, omissions or errors in pile driving are prone to occur during construction. Therefore, a daily verification mechanism is implemented. Each crew’s management personnel will conduct item-by-item verification of the number of piles completed that day to ensure no omissions or sequence errors in pile construction.
(6) Pile Verticality Assurance Measures: As this project involves extra-long piles where verticality directly impacts quality, ultrasonic detectors will be used to conduct specialized verticality inspections on each pile after boring. Should any pile fail to meet design verticality standards, the borehole will be immediately backfilled with C15 concrete. Secondary boring operations will resume only after a specified interval.
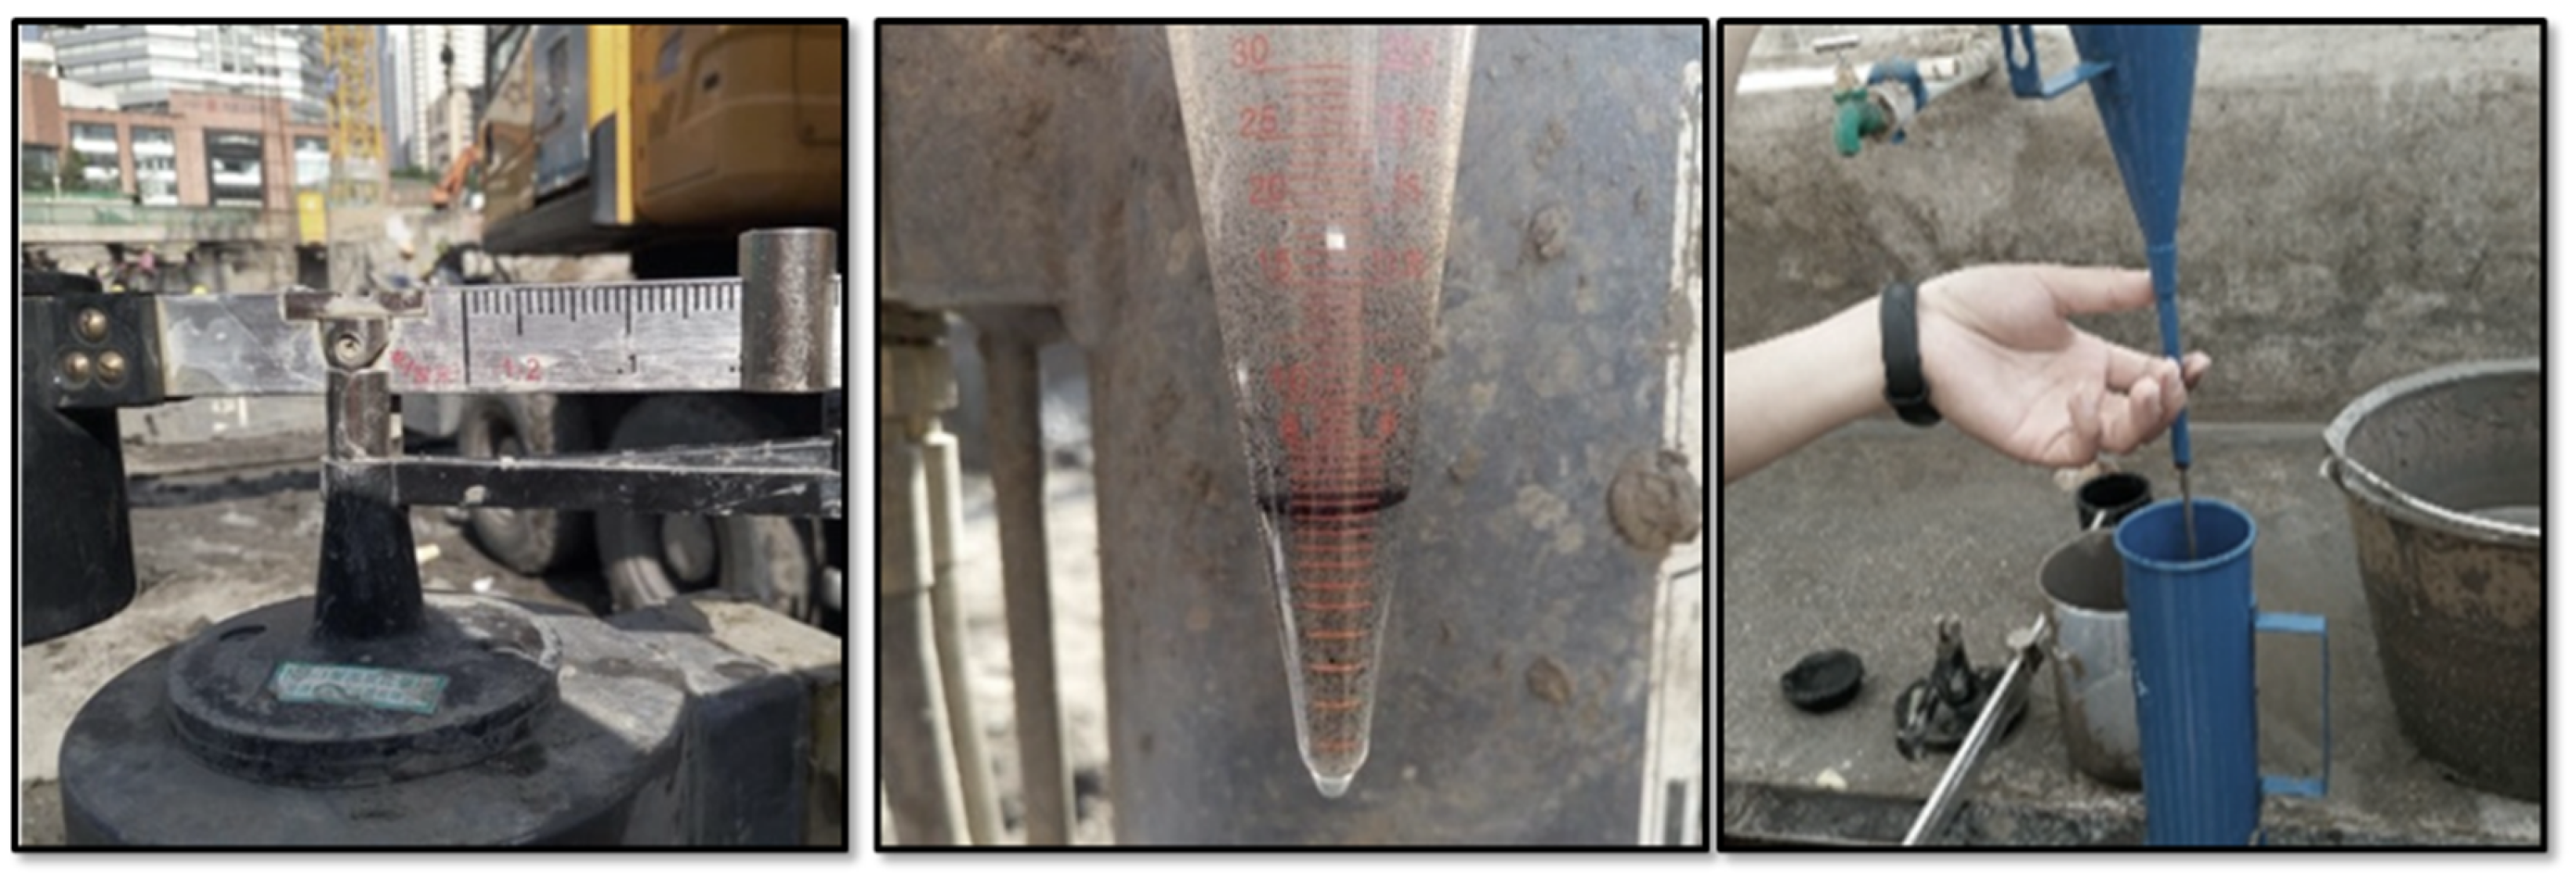
(7) Targeted Mud Mixing: The construction site contains multiple thick silt layers, which impose stringent requirements on borehole quality and sediment control, thereby demanding strict mud performance standards. Consequently, specialized mud mixing tests must be conducted prior to formal drilling to determine suitable mud parameters that meet construction needs (see Figure 5 for details).
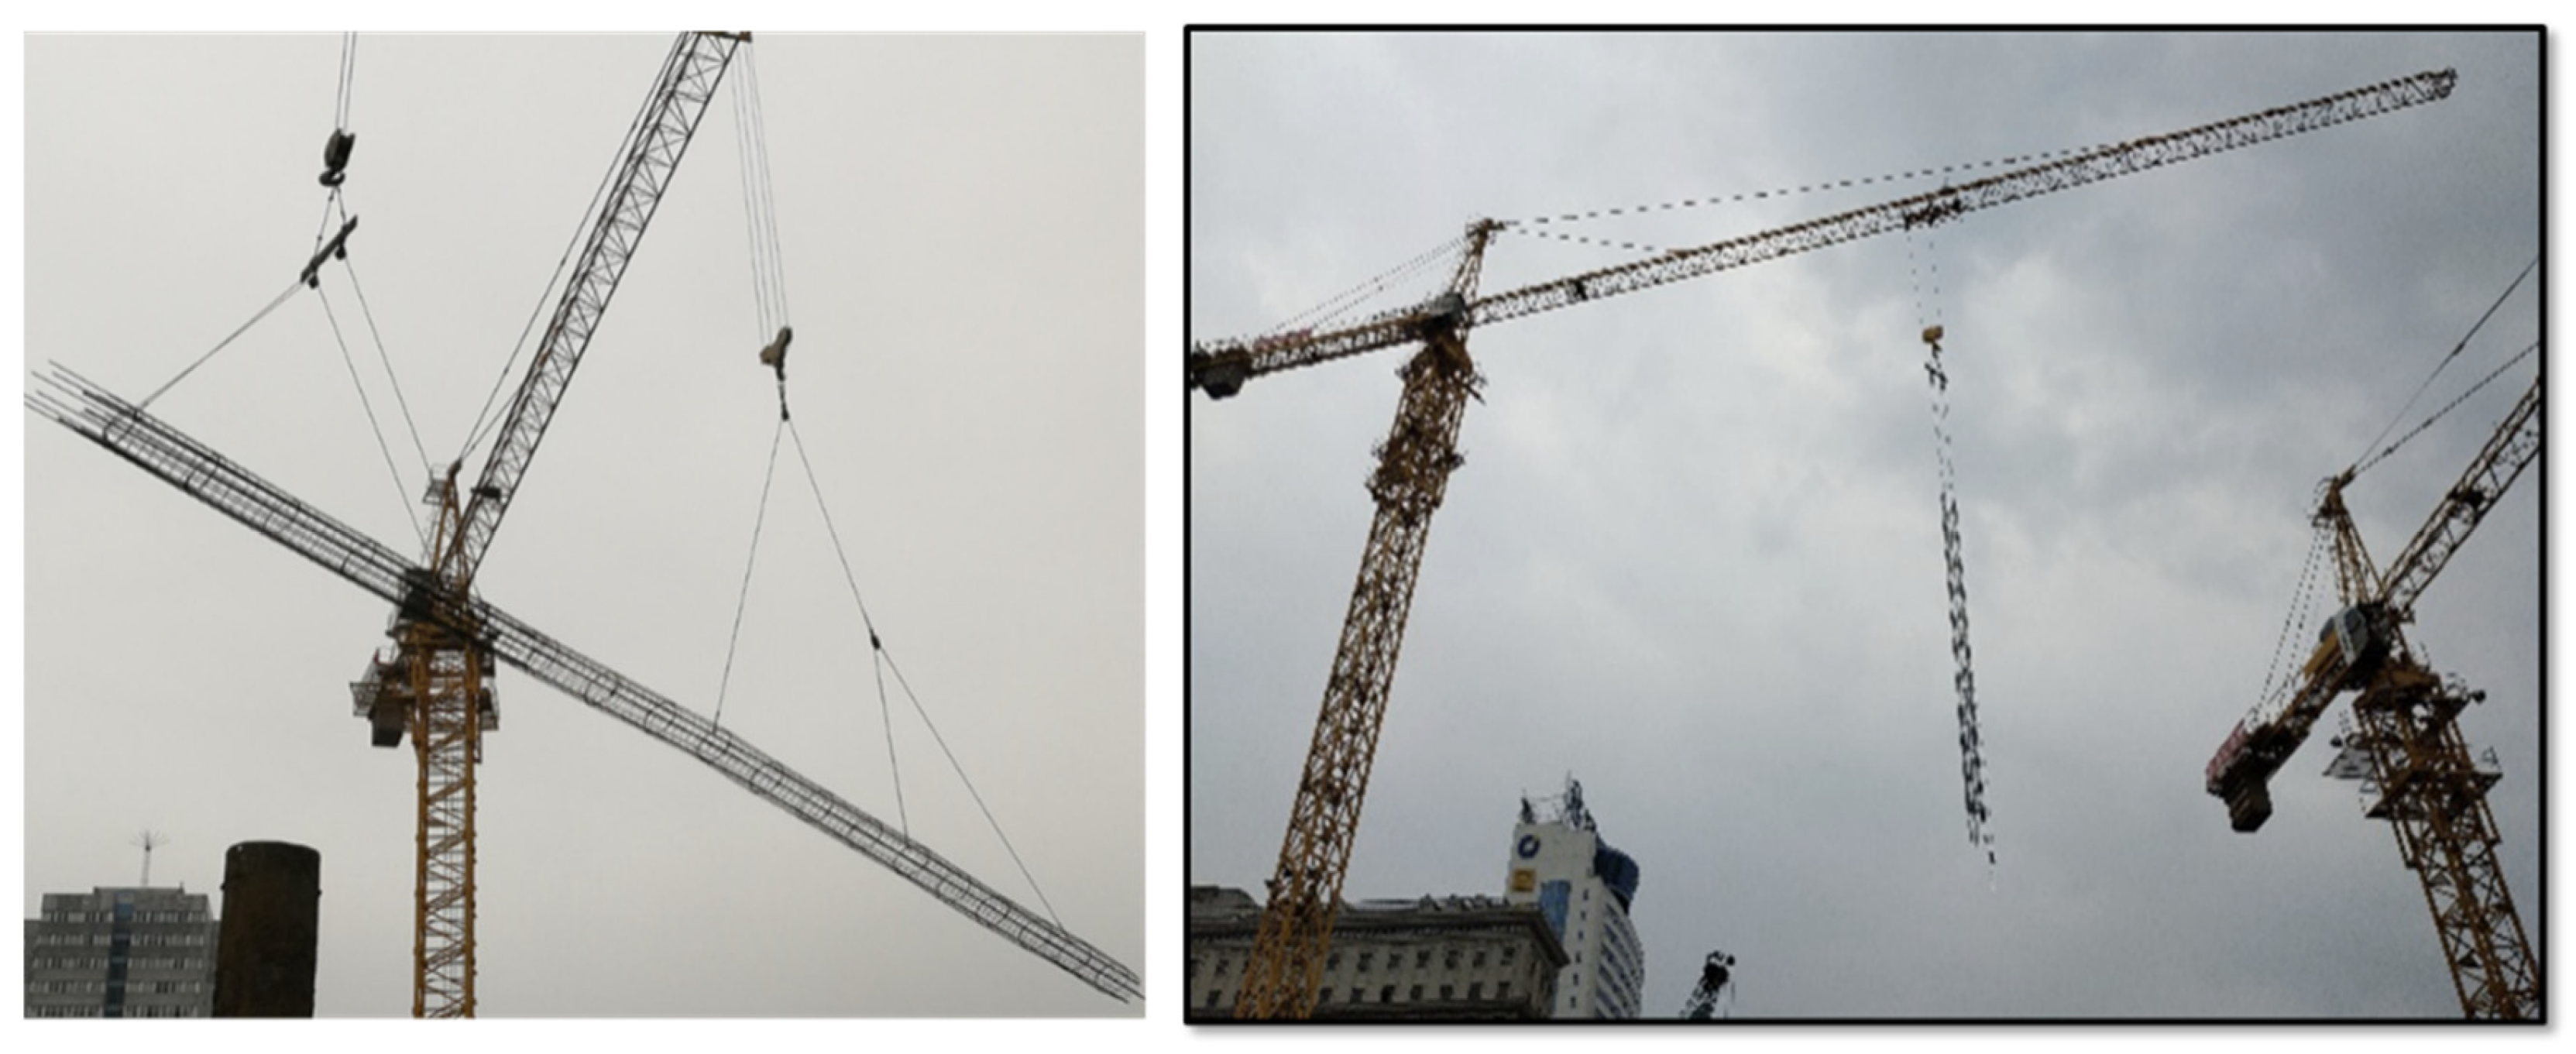
(8) Reinforcement Cage Hoisting and Alignment: Due to the extra-long pile length, the hoisting operation and alignment quality of the reinforcement cage are critical. To ensure quality and shorten construction time, a two-section hoisting and alignment technique was adopted (Figure 6).
(9) Pile-Bottom Sediment Control Measures: The piles in this project are extra-long and must traverse multiple layers of silty sand, making sediment removal at the pile base particularly challenging. To address this, a dual-process approach combining a mud desander with air-lift reverse circulation hole cleaning technology was employed. This synergistic method precisely controls the thickness of sediment at the pile base to meet design requirements.
(10) Concrete Pouring Quality Assurance: Given the large diameter and extreme length of the piles, the concrete pouring volume is substantial with significant pouring depth, necessitating underwater pouring techniques. To ensure pouring quality, all equipment used is brand-new, and the pouring conduits are reinforced. This effectively prevents accidents such as conduit bursts or collapses during pouring, ensuring the smooth progression of concrete pouring operations.
(11) Pile-Base Grouting Quality Control: The main and auxiliary tower piles are designed with high bearing capacities. Relying solely on lateral friction resistance cannot meet design standards, necessitating pile-base grouting to enhance overall bearing capacity. To guarantee grouting effectiveness, threaded connections were used for grouting pipes, with PTFE tape wrapped around threaded sections to prevent cement slurry leakage. Additionally, grouting pipes were extended 50 cm beyond the rebar cage to ensure effective penetration into the soil layer. Check valves employed a triple-protection design featuring wooden plugs, metal check valves, and rubber check valves.
(12) Grouting Process Parameter Settings: Low-pressure, low-flow grouting equipment was selected, employing a two-stage grouting method. The initial grout volume constituted 60% of the total, with a 2–3 h interval between stages. Grouting flow was strictly maintained below 50 L/min throughout the process.

2.3.2. Quality Control Measures

(1)
Casing Fabrication and Installation
① Steel casings shall be fabricated from Q345 grade steel (to enhance reusability), with individual lengths of 10 m. Joints shall undergo butt welding followed by reinforcement with a 200 mm-wide steel plate of matching thickness welded around the exterior of the joint. ② Secure the ICE vibratory hammer to the triaxial mixing pile rig frame. Coordinate with the crane operator and ICE dedicated operator to clamp the top of the steel casing with ICE clamps and lift it off the ground. ③ After positioning the steel casing directly above the pile location and completing alignment, activate the ICE vibratory hammer. Slowly vibrate the steel casing downward to the design elevation. During vibration, two monitors positioned at 90° angles set up a theodolite aimed at the steel casing to continuously monitor its verticality. Immediate correction is made upon detecting any deviation.
(2)
Drilling for Boreholes
① For the upper open pile section, a rotary drilling rig creates the borehole to the bottom of the casing. Ultrasonic equipment is then used for the first verticality inspection of the casing. The steel casing overlay section is constructed using dry drilling. ② For the lower effective pile length section, initial boring is performed using a rotary drilling rig. After penetrating the ⑥ 1 layer of silty clay, switch to a positive circulation drilling rig to continue boring to the bottom. The mud mixture used for boring must be configured based on test boring data, including mixture ratios and air pressure adjustment parameters.
(3)
Mud Preparation
Prepare sodium carboxymethyl cellulose (CMC) mud using clean water, bentonite, and soda ash, controlling performance parameters as follows: density 1.06–1.10 g/cm3, viscosity 23–28 s, with soda ash dosage at 5% of bentonite quantity. During drilling, maintain mud density at 1.10–1.25 g/cm3 and viscosity at 23–28 s to ensure borehole stability and secondary hole cleaning. Simultaneously control pH at 8–9 to maintain alkalinity and enhance clay dispersion.
(4)
Mud Circulation System Setup
To achieve civilized construction practices, prevent secondary pollution, accelerate construction progress, and reduce costs, a dedicated mud circulation system is installed based on project characteristics and technical requirements. This ensures stable mud supply throughout the borehole formation process.
(5)
Reinforcement Cage Fabrication and Hoisting
① To prevent stirrups from scraping the borehole wall during cage hoisting, centering supports are installed on the cage exterior (serving both centering and wall protection functions). These centering brackets are fabricated from Φ25 main rebars spaced at 3 m intervals (twice the spacing of the reinforcement hoops). ② Grouting pipes are installed for all main tower piles. To prevent bending, deformation, or damage to the reinforcement cage and grouting pipes during hoisting, sectional reinforcement cages are lifted using a dual-crane hoisting method. Lifting points are strategically positioned based on the cage’s length and center of gravity. ③ To enhance construction efficiency, reduce on-site cage jointing time, and minimize interference from overlapping equipment operations, one large tower crane is positioned at the main tower center. This crane handles cage transportation while also undertaking construction material transport tasks.
(6)
Reverse Circulation Hole Cleaning
Due to equipment limitations and engineering geological conditions, placing the reinforcement cage is time-consuming. Therefore, after hoisting the cage, a pneumatic lifting device is used for secondary hole cleaning and debris removal at the bottom to ensure the thickness of bottom sediment meets design and specification requirements.
(7)
Concrete Pouring
Concrete preparation must be completed 2 h in advance. Pouring operations commence immediately after successful hole cleaning inspection to prevent sediment thickening due to prolonged delays. The initial pour volume is controlled to ensure the bottom of the chute is buried ≥2.5 m in concrete, set at 2 m3. The final pour elevation is 5% of the pile length above the designed pile cap (with the main tower pile final pour elevation set at 3.9 m above the designed pile cap). The final concrete placement elevation must be precisely controlled using specialized measuring tools to prevent material waste from excessive elevation or non-compliance with design requirements due to insufficient elevation.

2.3.3. Influence of Construction Factors on Pile-Side Friction Resistance

(1)
Casing Fabrication and Installation: Ensuring Initial Pile–Soil Interface Contact Quality
Steel casings are fabricated from Q345 steel with double-welded reinforcement (to prevent deformation). During vibratory driving, real-time verticality control using a theodolite prevents casing displacement that could cause borehole wall collapse or soil disturbance. If casing inclination or joint leakage occurs, it leads to loosening of the borehole wall soil, directly reducing the effective contact area between pile and soil and resulting in friction loss.
(2)
Drilling and Mud Control: Stabilizing Interface Soil Strength
The upper section employs dry drilling with a hollow pile, while the lower section combines rotary drilling with positive circulation drilling to minimize soil disturbance. Improper drilling techniques can compromise borehole wall integrity and reduce soil strength, decreasing friction resistance by over 20%. CMC drilling fluid (density 1.06–1.25 g/cm3, viscosity 23–28 s) prevents borehole collapse through wall protection. Its alkaline environment (pH = 8–9) enhances clay dispersion, forming a dense mud cake on borehole walls—preventing soil loss while strengthening bond strength between the pile and soil. Experiments demonstrate that this parameter mud can increase friction resistance by 10–15% compared to conventional mud.
(3)
Verticality of Reinforcement Cage Hoisting Relative to Pile Body: Ensuring Uniform Friction Force Transmission
A Φ25 centering bracket is installed on the outer side of the reinforcement cage (spaced 3 m apart) to prevent stirrups from scraping the borehole wall during hoisting, which could cause soil loss and local friction failure. Dual-crane lifting with precision lifting point design prevents cage deformation, ensuring pile verticality—a 1% pile inclination causes uneven lateral friction distribution along the pile length. Localized stress concentration leads to premature friction failure, reducing overall bearing capacity by 8–12%. Ultrasonic full-pile verticality inspection eliminates “skewed pile” issues: For every 0.5% deviation in verticality of extra-long piles, average friction loss reaches approximately 5% (based on relevant research in the “Technical Specifications for Building Pile Foundations” JGJ94 [2]). This demonstrates the critical impact of verticality control on friction resistance.
(4)
Borehole Cleaning and Concrete Pouring: Preventing the Formation of “Ineffective Interfaces”
Air-lift reverse circulation secondary cleaning removes loose soil debris from the borehole bottom and walls. If sediment thickness exceeds 50 mm, it forms a “buffer layer” at the pile base, creating gaps in the bond interface between the pile and soil. This prevents effective transmission of lateral friction resistance. Standards require sediment thickness ≤ 100 mm for normal friction force transmission. This project directly ensures friction force transfer efficiency by controlling sediment within design limits through hole cleaning. Thickened concrete casing + initial filling volume ≥ 2 m3 (with casing buried ≥ 2.5 m) prevents concrete segregation or water ingress into the borehole caused by casing rupture: Segregated concrete reduces the pile surface roughness, diminishing friction with the soil; Water ingress into the borehole wall softens the surrounding soil (especially silty sand layers), reducing the soil’s shear strength and consequently decreasing friction resistance by 10–25%.
(5)
Pile-Base Grouting: Indirectly Optimizing Friction Resistance Performance Environment
The main tower piles enhance pile-bottom bearing capacity through grouting at the pile base (using threaded connections + PTFE tape for leak prevention and triple check valves for pressure control). Simultaneously, the grouting pressure causes the pile body to float slightly upward, promoting tighter contact between the soil around the pile and the pile body itself. This effectively “compacts” the pile–soil interface, indirectly increasing friction resistance by approximately 5% to 8%. If grouting pipe leakage causes insufficient pressure, this “compaction effect” cannot be achieved, resulting in a corresponding loss of friction resistance.
The aforementioned construction measures directly or indirectly control the key factors influencing pile-side friction resistance across four dimensions: interface integrity (casing, hole cleaning), soil strength (mud, hole formation), transmission uniformity (verticality, reinforcement cage), and additional optimization (grouting). Engineering practice demonstrates that inadequate control in any single aspect—such as casing inclination, drilling fluid instability, or pile deviation—can significantly reduce friction resistance (typically by 10–30%) and even result in substandard pile bearing capacity. By implementing the targeted measures outlined above, the efficiency of lateral friction can be enhanced to over 90% of the design value. This fully demonstrates that these construction factors exert a decisive and significant influence on lateral friction.

2.4. Test Program and What to Measure

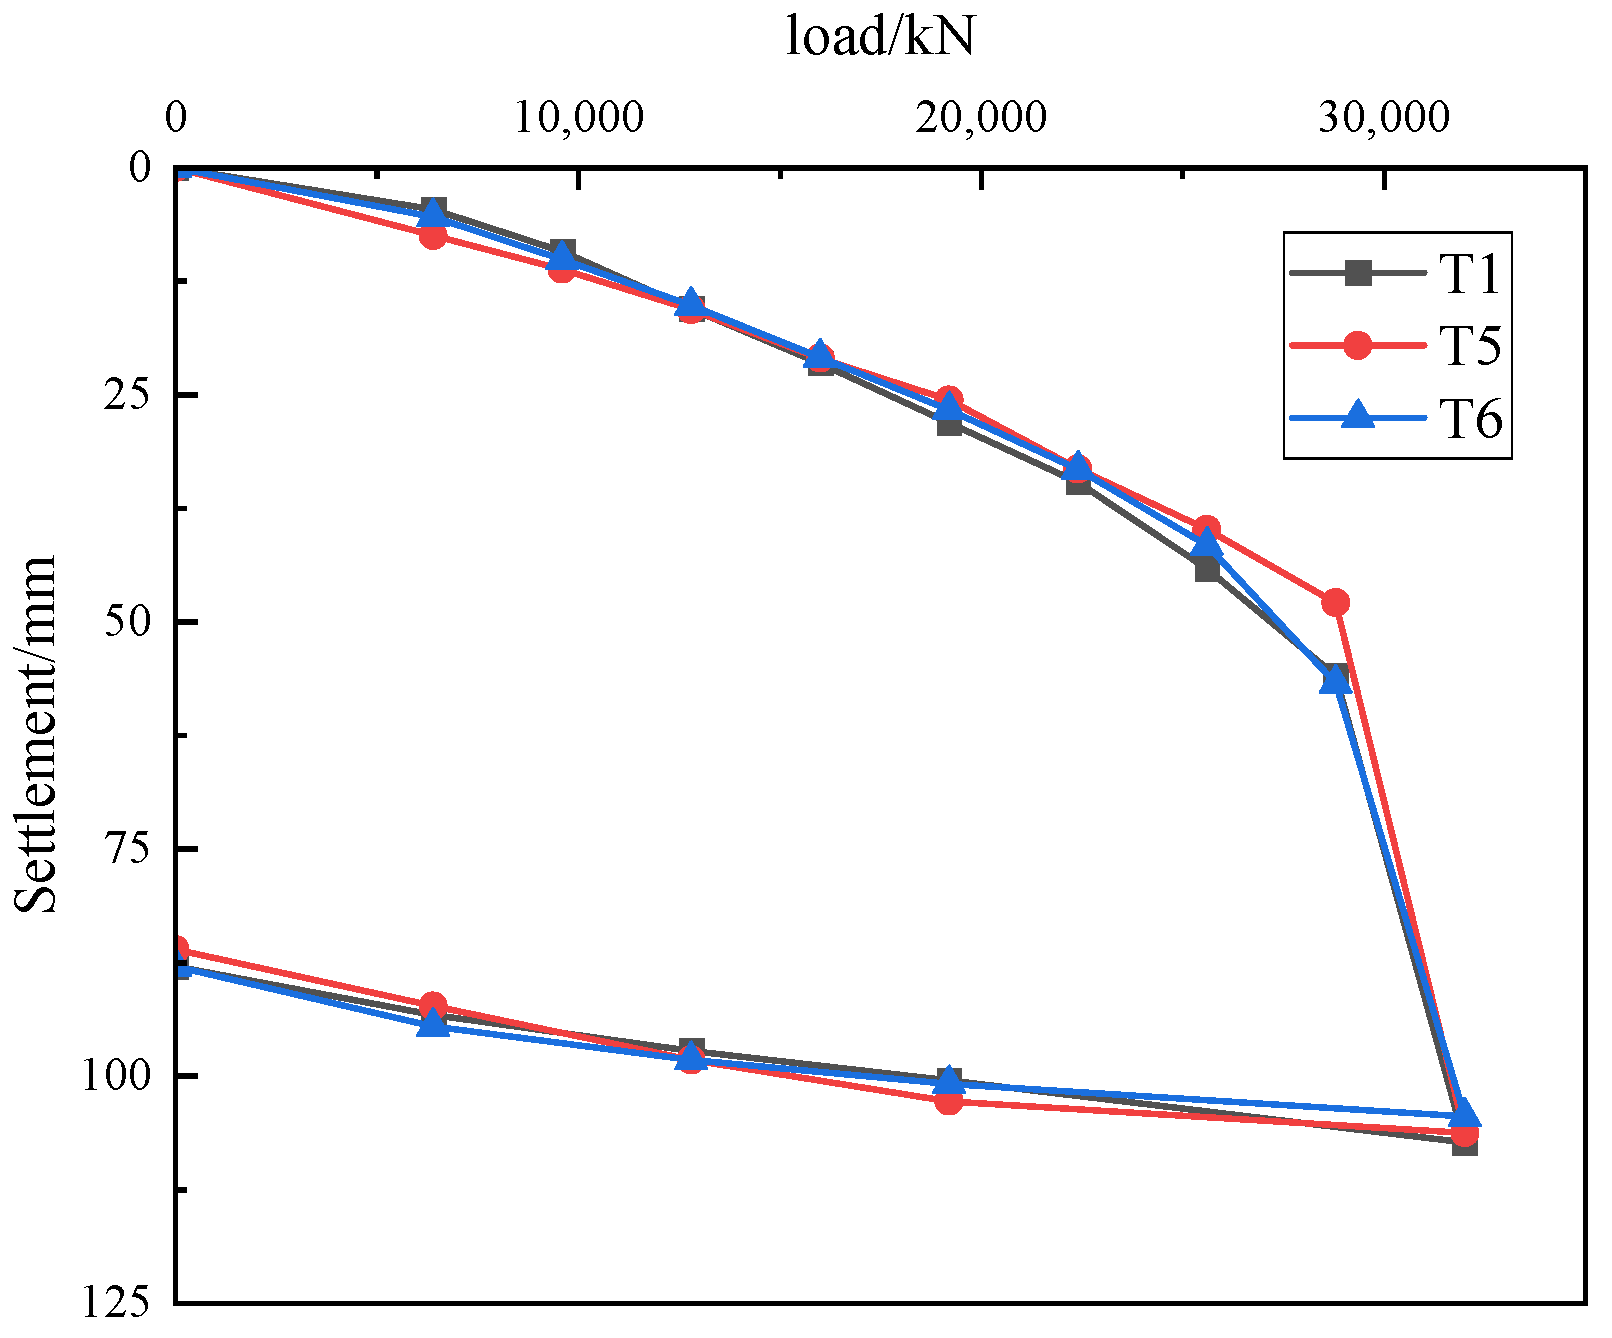
Static load testing on individual piles is a common method for investigating the compressive bearing capacity of pile foundations, providing a relatively realistic simulation of actual engineering conditions. Figure 7 shows the load–settlement curves from static load tests on three sets of test piles. As shown in Figure 3, the Q-s curves for all three test piles exhibit a steep decline pattern with distinct failure characteristics. As the load increment increases, the vertical displacement at the pile cap gradually increases. Furthermore, the greater the load increment, the larger the relative settlement at the pile cap under that load level. Under maximum loading conditions, the vertical displacements at the pile caps for piles T1, T5, and T6 exhibited vertical displacements of 107.33 mm, 106.22 mm, and 104.40 mm, respectively, showing minimal variation. When axial load exceeded 28,800 kN, settlement increased sharply, resulting in pile failure. Therefore, the ultimate compressive bearing capacity of the T1, T5, and T6 test piles is determined to be 28,800 kN.

2.5. Experimental Observations and Result Analysis

2.5.1. Shaft Friction Resistance

During the testing process, the Q-s curves of all three test piles exhibited a steep decline pattern with distinct failure characteristics. When the axial load exceeded 28,800 kN, settlement increased sharply and pile failure occurred. Therefore, the ultimate compressive bearing capacity of test piles T1, T5, and T6 was determined to be 28,800 kN.
When vertical loads are applied to the pile body, the load is gradually transmitted through the pile side and pile tip to the surrounding soil. The pile body undergoes compressive deformation and settlement, resulting in relative displacement between the pile and the soil. This displacement causes the soil to exert an upward-directed resistance on the pile body, known as the pile side friction resistance. Thus, the lateral friction resistance and end resistance jointly counteract the settlement of the pile body caused by the load. The pile-side friction distribution curve is calculated based on the variation of axial force along the pile length under various load conditions. Axial force refers to the force generated along the longitudinal axis of the pile when subjected to external loads. CTY-202 vibrating-wire strain gauges are installed within the pile body. Based on these strain gauges, axial force sensors embedded at interfaces of different soil layers within the pile body provide segmented axial force measurements along depth. This enables the determination of deformation at each pile cross-section under various load levels. This enables calculation of axial force at each pile location, thereby determining the average lateral friction resistance values at various cross-sections for the three test piles under different load levels.
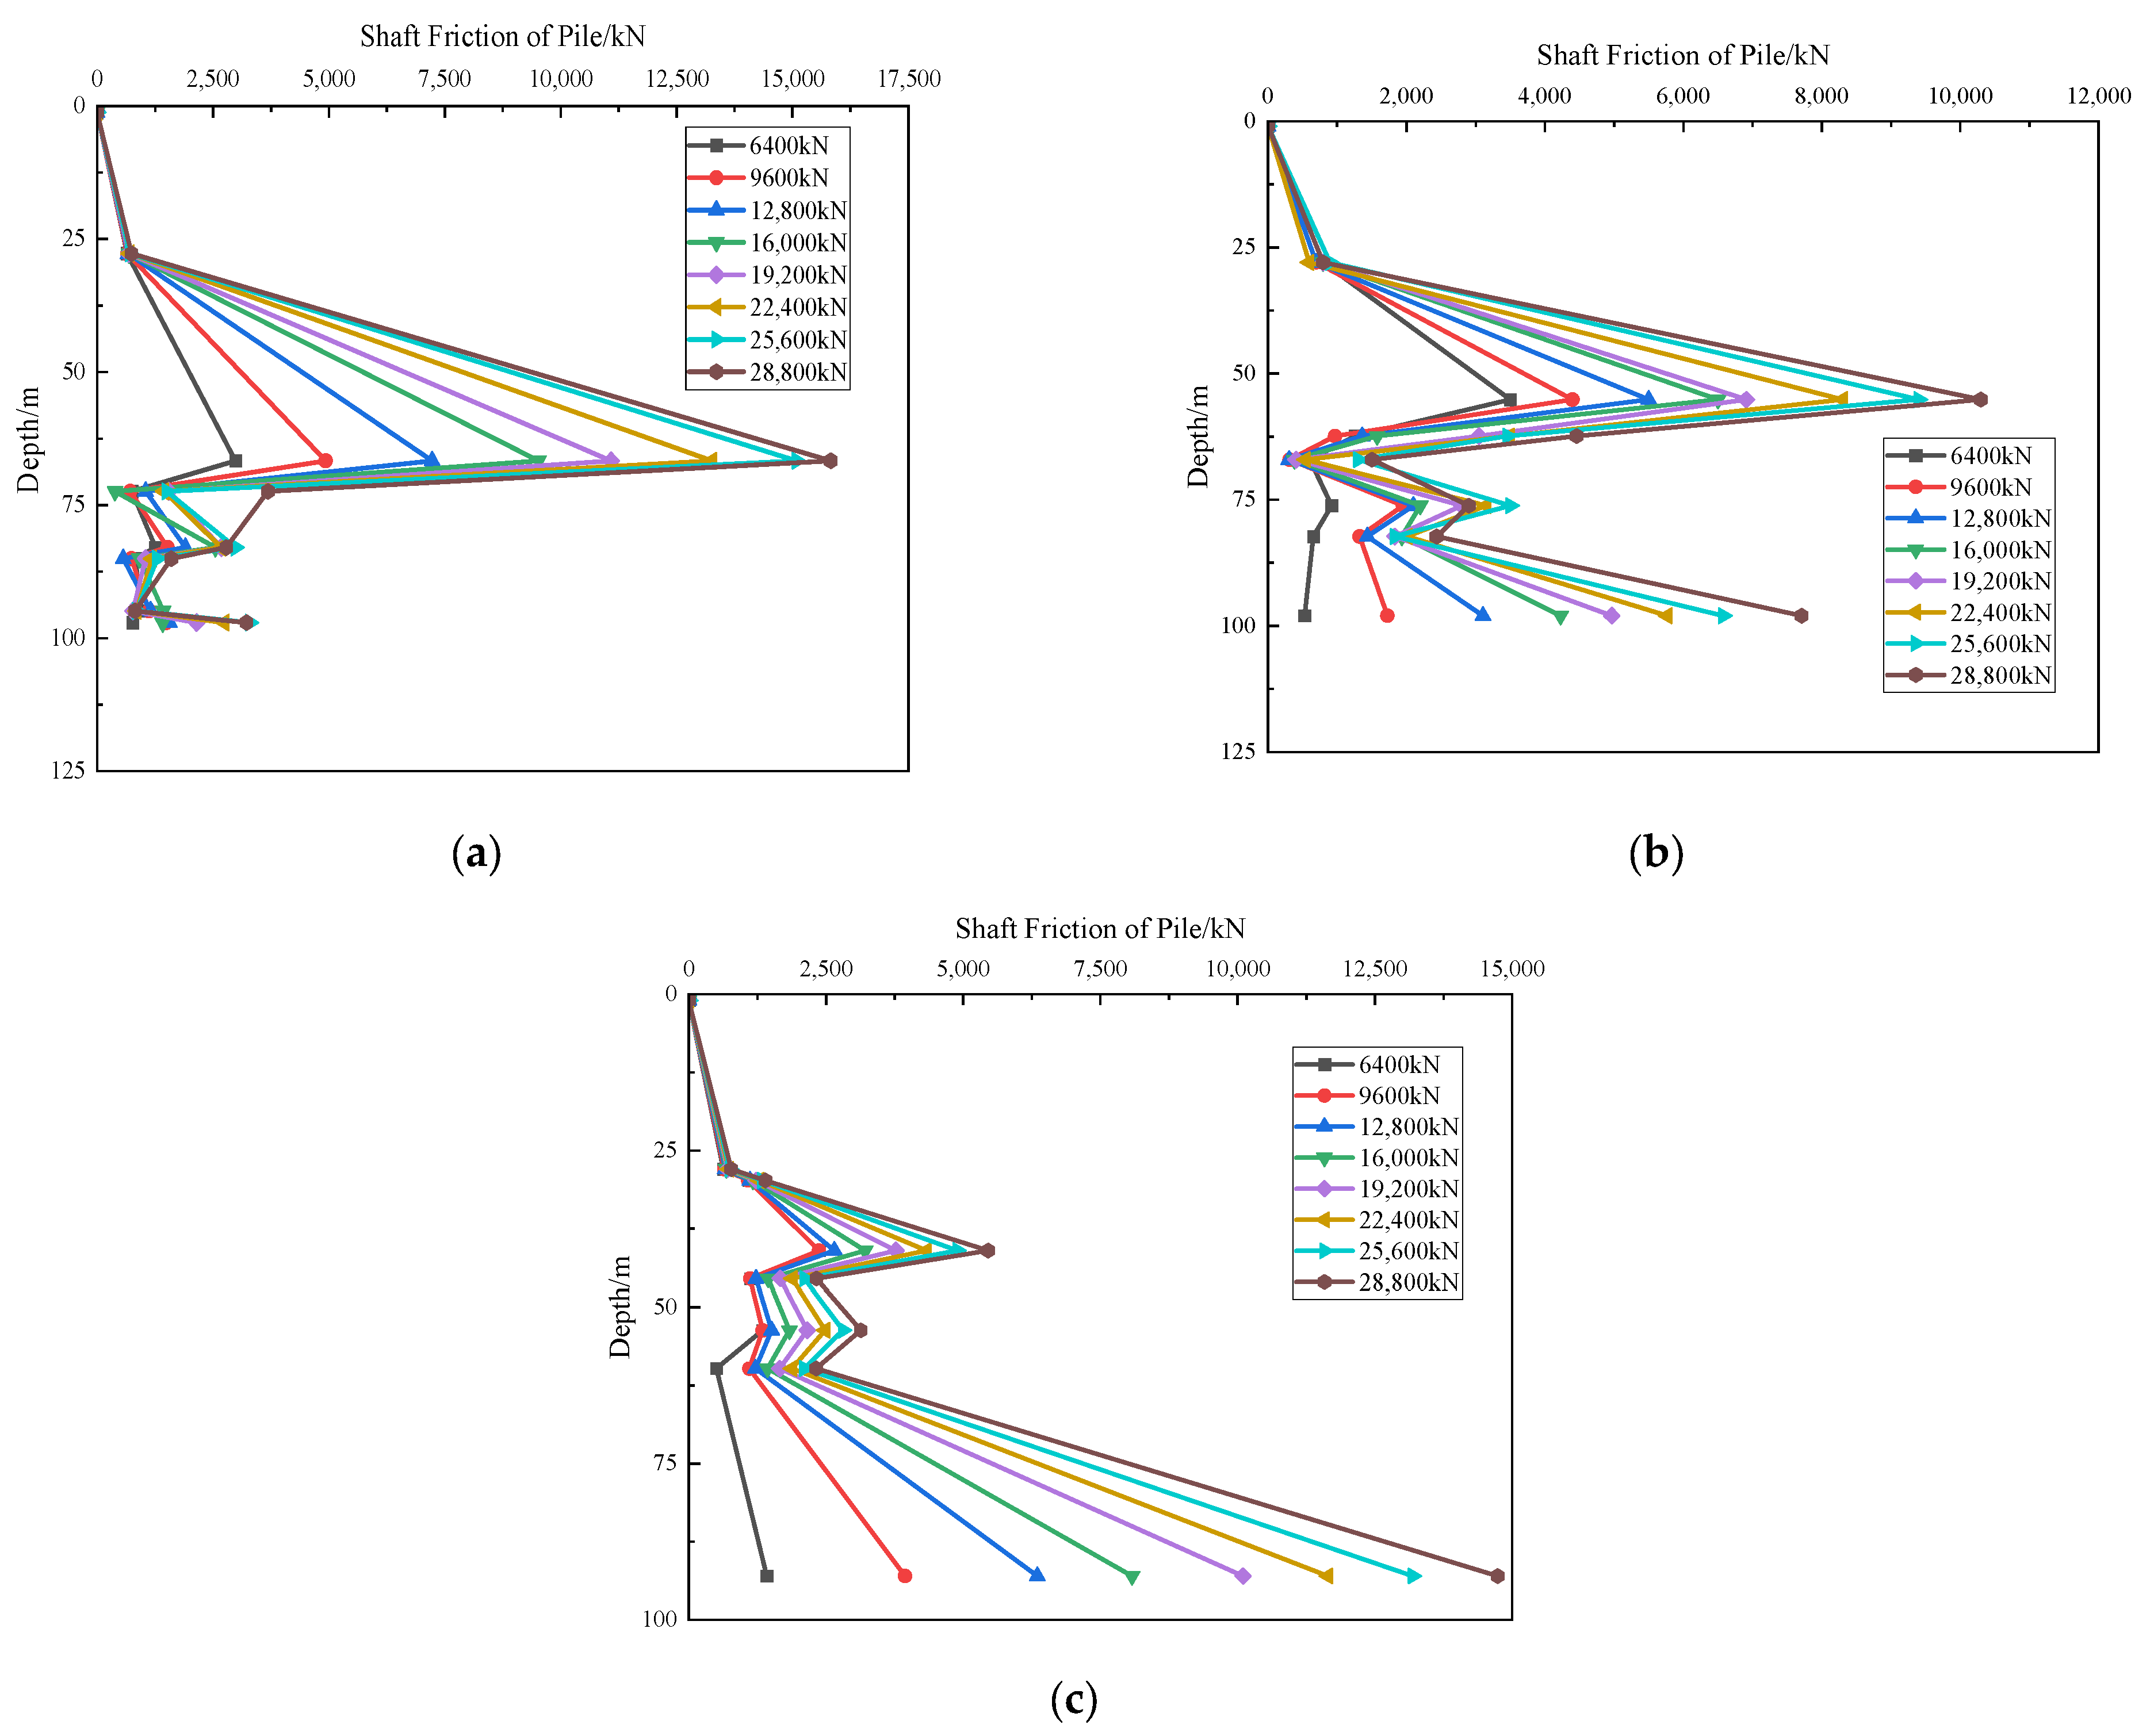
The resulting lateral friction resistance curves as a function of depth are plotted in Figure 8 below.
As observed in Figure 8b,c, the variation of shaft friction resistance at different depths within the same soil layer exhibits distinct patterns. In the upper section (0–28 m), the shaft friction resistance demonstrates a typical triangular distribution. In the middle section (28–60 m), the shaft friction resistance reaches its ultimate value, showing an R-shaped distribution with a multi-humped pattern. Two peak values appear in the middle and lower sections of the pile. This phenomenon occurs because the mobilization of shaft friction resistance is determined by the relative displacement between the pile and soil. Due to significant compression in the upper pile section, the relative displacement between pile and soil is substantial, resulting in the first peak occurring in the middle section. As the compressive deformation decreases in the middle–lower pile sections, increased loading causes greater deformation of the soil at the pile base, which again increases the relative pile–soil displacement and generates the secondary peak.
By analyzing the slope of the axial force curve under a specific loading level, it can be observed that a steeper curve segment corresponds to smaller shaft friction resistance, while a flatter segment indicates greater shaft friction resistance. Thus, the axial force curve provides an intuitive visualization of the distribution of shaft friction resistance across soil layers. Specifically, the shaft friction resistance is influenced by both the magnitude of the load applied at the pile top and the depth. At a given depth, the shaft friction resistance increases with the pile-top load, exhibiting a larger increment under smaller loads and a smaller increment under larger loads. Under a constant loading level, the shaft friction resistance initially increases with depth until reaching a peak value, after which it slightly decreases.
As the loading approaches the ultimate load, the shaft friction resistance in the upper section of the pile exhibits a decreasing trend with increasing load, predominantly occurring within the superficial soil layers. This indicates degradation of the upper shaft friction resistance after reaching the ultimate state, attributed to shear failure in the superficial soil due to excessive stress. Although the upper shaft friction resistance demonstrates degradation, the increasing rate of the lower shaft friction resistance significantly exceeds the degradation rate of the upper section.
According to soil mechanics theory, shear stress is mobilized through deformation and is correlated with normal stress—greater normal stress results in higher shear stress. Consequently, the mobilization of shaft friction resistance is influenced by both the relative displacement between the pile and soil and the horizontal effective stress of the soil. When the surrounding soil is divided into upper, middle, and lower sections along the pile shaft, excessive relative displacement in the upper section leads to degradation of shaft friction resistance, coupled with low horizontal effective stress. In contrast, the lower section experiences limited relative displacement, preventing full mobilization of the shaft friction resistance. Only the middle section exhibits both sufficient displacement and adequate horizontal effective stress, allowing optimal mobilization of shaft friction resistance in ultra-long piles. Thus, the variation of shaft friction resistance in large-diameter friction piles follows a parabolic pattern—greater in the middle and smaller at both ends. Furthermore, excessive relative displacement in the upper soil section induces shear failure, resulting in the degradation of shaft friction resistance, as illustrated in Figure 8a.
Overall, the lateral friction resistance along the pile exhibits a multi-peak distribution pattern characterized by an initial increase, followed by a decrease, then another increase, and finally another decrease. This phenomenon is primarily attributed to the interlayer variability in the properties of the foundation soil strata. The study area predominantly exhibits complex interlayered distribution, resulting in loose upper soil structures that provide limited lateral friction resistance. As depth increases, the physical and mechanical properties of the foundation soil gradually improve, enabling the effective development of pile-side friction resistance. Furthermore, the contribution of lateral friction varies asynchronously across different soil layers: under light loads, upper layers initially bear and transmit the load, causing lateral friction in this zone to peak. However, by the time the load reaches the lower pile section, the residual load has relatively diminished, leading to a gradual decrease in lateral friction. As load increases, lateral friction resistance in all soil layers is fully mobilized. However, due to variations in soil properties, the lateral friction resistance borne by each layer differs. With further load increase, lateral friction resistance in the lower soil layers is gradually activated, causing the distribution curve to transition from a “hump-shaped” profile to a flatter form. If the load level continues to rise, the lower portion of the pile-side friction distribution curve gradually extends, indicating the progressive contribution of friction near the pile tip. Simultaneously, the pile-side friction in the upper portion of the pile body approaches its ultimate limit state, accompanied by varying degrees of softening phenomena.

2.5.2. Pile Tip Resistance

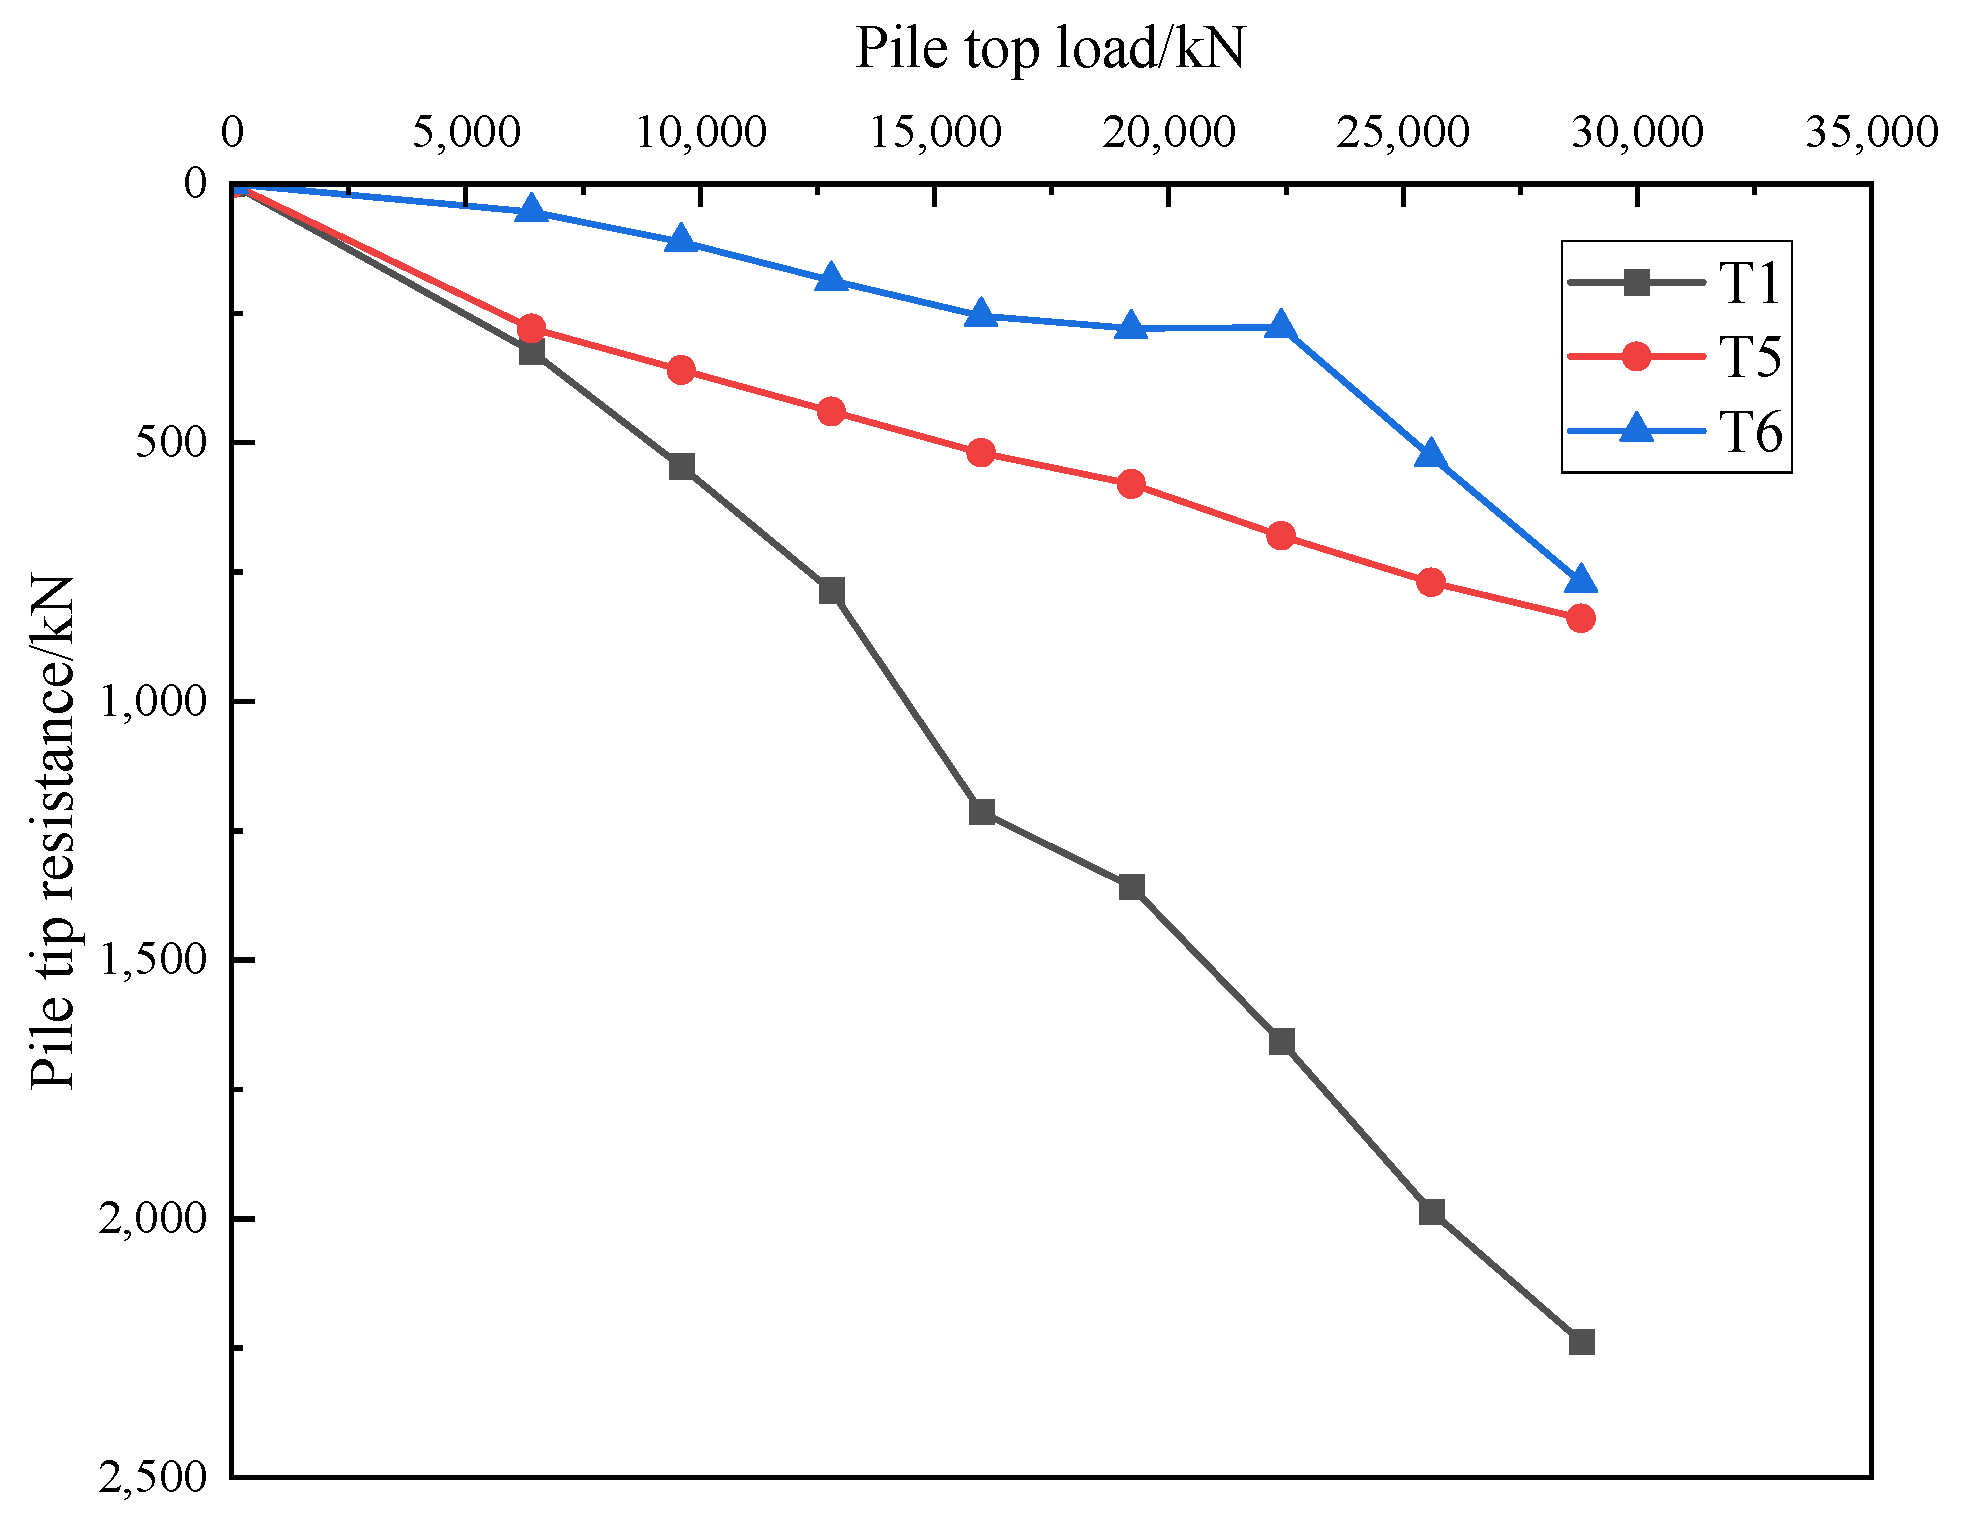
As shown in Figure 9, the base resistance progressively mobilizes with increasing pile-top loading levels, demonstrating an approximately linear increase. Compared with the shaft friction resistance curves in Figure 8, it is evident that the mobilization of shaft friction resistance and base resistance is an asynchronous process. From the shaft friction resistance distribution curves in Figure 9, it can be observed that the base resistance accounts for only 2.68% to 7.77% of the total load throughout the loading process, with the remaining load borne by the shaft friction resistance. This indicates that the pile is a typical end-bearing friction pile. Under ultimate bearing conditions, the vertical load at the pile top is primarily resisted by the shaft friction resistance. According to current design codes for ultra-long bored piles, it is generally assumed that the base resistance is fully mobilized under ultimate loading conditions. However, experimental results reveal that the base resistance does not reach its ultimate value under these conditions and exhibits a continuing trend of increasing mobilization.

2.5.3. Comparative Study of Load-Carrying Mechanisms

Field performance data for various pile types in China were collected from literature sources for further comparative analysis [51,52]; see Table 1.
As shown in Table 1, under identical conditions, the bearing capacity decreases and settlement increases in the following order: enlarged-base piles → wedge piles → end-bearing friction piles → pure friction piles. Large-diameter piles exhibit a significantly higher proportion of lateral resistance.
For T1, SJ-1, and pure friction piles, lateral resistance accounted for ≥92.2% while end resistance was ≤7.8%. These designs rely primarily on lateral friction between the pile body and soil layers, making them suitable for soft soil conditions. Bearing capacity is enhanced through “long pile length + large lateral area” configurations: T1 pile length 98 m, ultimate load 28,800 kN; SJ-1 piles (43 m long, ultimate load 22,800 kN) validate that “longer piles yield more significant lateral resistance contributions”.
SD2 enlarged-base piles (end resistance 88.4%) and end-bearing friction piles (end resistance 66.66%) rely primarily on end bearing force, suitable for scenarios where pile tips can penetrate hard rock/dense soil layers. Despite its 7 m length, the SD2 achieves an ultimate load of 9600 kN through its enlarged base structure, highlighting that “end resistance efficiency far exceeds lateral resistance.”
Wedge piles (lateral resistance 77.7% + end resistance 22.3%) and bored cast-in-place piles (end resistance 52% + lateral resistance 47.5%) exhibit synergistic effects between lateral and end resistance, making them suitable for conventional engineering scenarios in moderately dense strata (neither pure soft soil nor hard rock).
In summary, the bearing characteristics of ultra-long piles in complex, thick lacustrine deposits revealed in this study align with fundamental commonalities across pile types while exhibiting unique distribution patterns due to the depth effect of ultra-long piles, interactions within complex lacustrine strata, and specialized construction techniques. These findings not only fill a gap in existing pile type comparison studies regarding the “ultra-long + complex stratum” scenario but also provide data support for the differentiated optimization of bearing capacity design methods across pile types.

2.5.4. Single Pile Bearing Capacity Prediction

Cast-in-place piles are widely used in foundation engineering, and accurately predicting their vertical compressive bearing capacity is a core research topic for ensuring project safety and economic efficiency. However, in situ load tests face significant challenges due to the complex interaction of geological conditions, construction disturbances, and other factors, making precise control of test conditions difficult. Furthermore, most tests cannot reach the failure state of the test pile due to loading limitations, making it challenging to accurately determine the ultimate vertical compressive bearing capacity of a single pile. This issue significantly constrains the reliability of engineering design. To address this, this paper proposes a collaborative “field test—mathematical model” bearing capacity prediction method: using field measurement data as a foundation, it incorporates widely validated mathematical models to assist in calculating ultimate bearing capacity. By cross-validating results from both technical approaches, it effectively compensates for the limitations of relying solely on either field tests or model predictions. This approach provides a more scientific quantitative basis for pile foundation design in practical engineering, offering significant guidance for enhancing structural safety and optimizing construction costs. From existing mature models, this paper selects four well-validated and highly applicable models, specifically as follows:
(1)
Hyperbolic Model
τ ( z ) = s ( z ) a f + b f s ( z )
(2)
Double-break model
τ ( z ) = k 1 s     s < s i k 1 s i + k 2 s > s i
(3)
Linear model
τ ( z ) = G ( z ) r 0 ln ( r m r 0 ) S S
(4)
Triple-Line Model
τ ( z ) = k s 1 s k s 1 + k s 2 ( s s 1 ) k s 2 + k s 3 ( s s 2 )
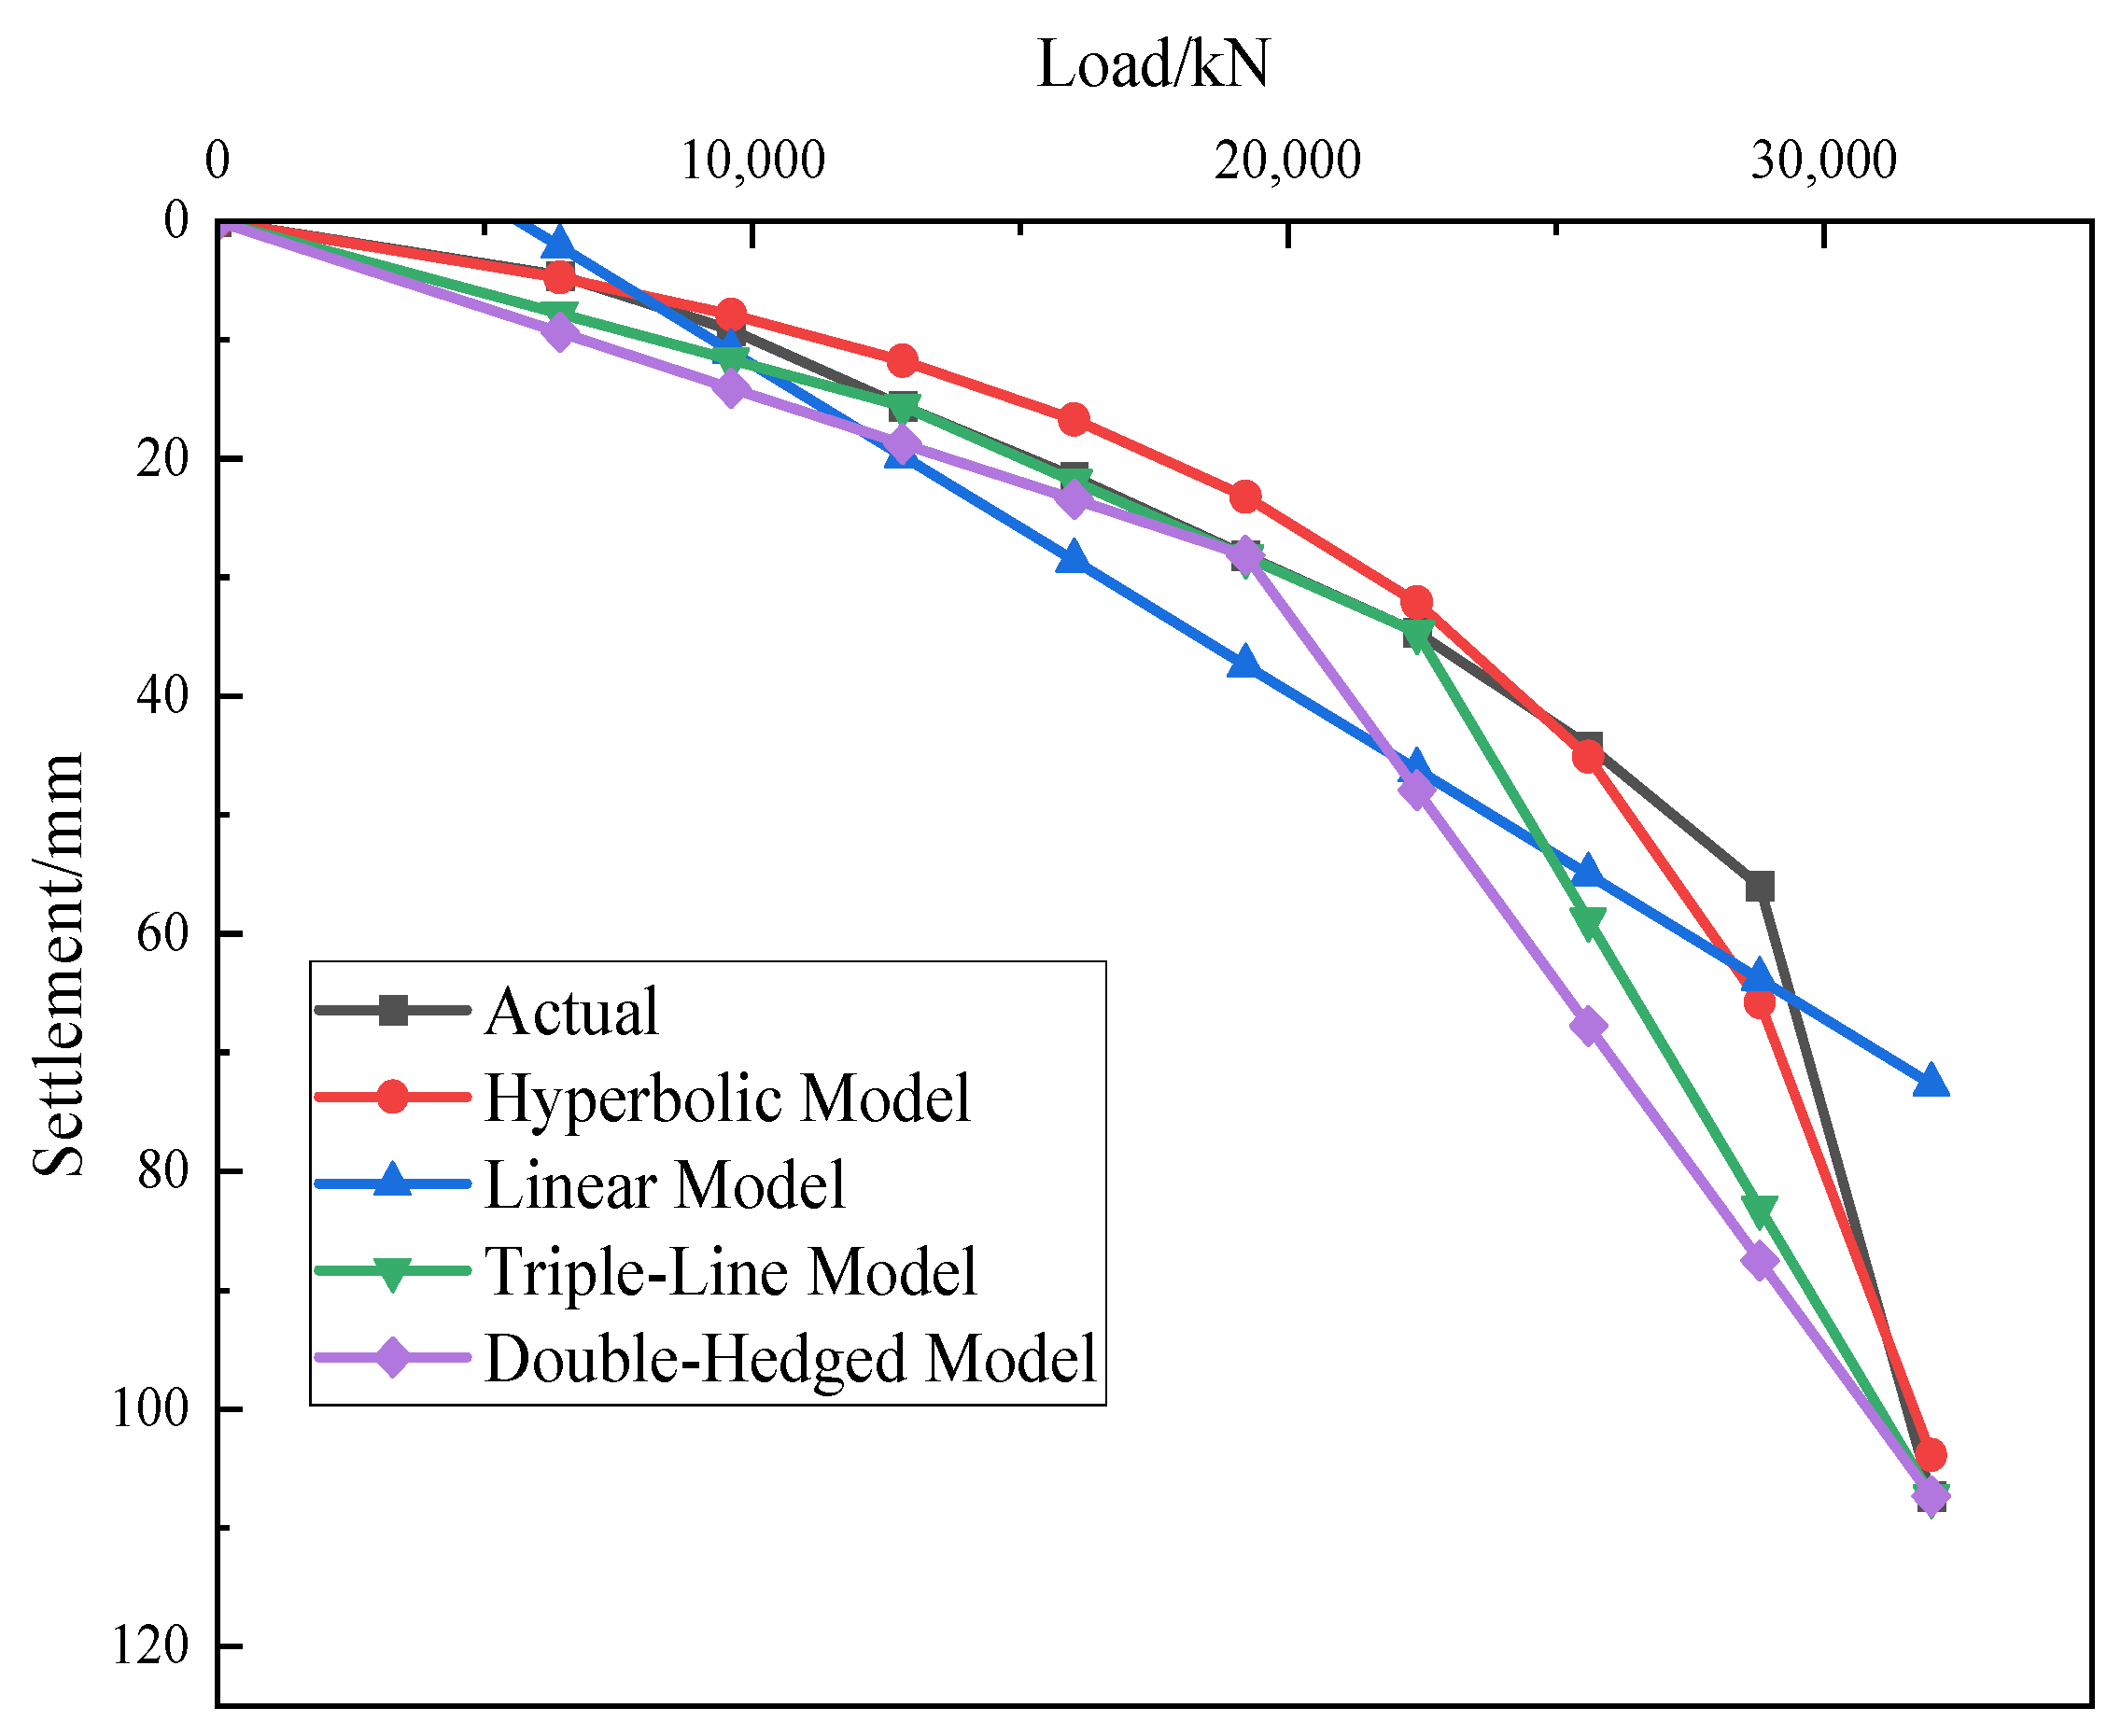
This study compares the on-site static load test results with the four mathematical models to evaluate their predictive capabilities. The accuracy and feasibility of the prediction models are validated through fitting results. Test pile T1 was selected for fitting, and the obtained fitting results were verified against the loading values corresponding to the maximum settlement during the test. The results are shown in Figure 10 and Table 2.
As shown in Figure 10 and Table 2, the hyperbolic model provides a closer fit to the measured load values. Therefore, selecting the hyperbolic model enables more accurate prediction of the ultimate compressive bearing capacity of individual cast-in-place piles.

3. Numerical Simulation

3.1. Finite Element Simulation

3.1.1. Steel Model

Using the parameters of test pile T1 for calculation and combining with field static load tests, the Mohr–Coulomb constitutive model was adopted for the soil, while the pile was simulated using beam elements. To avoid interference from model boundary conditions on the calculation results, the model dimensions were determined as follows: both the length and width on the horizontal plane were set to 20 times the pile diameter, and the vertical distance from the pile tip to the bottom boundary of the model was no less than 10 times the pile diameter. The final model dimensions were 20 m × 20 m × 108 m. To simplify the computation, the soil layers were merged and simplified. The finite element pile–soil model is shown in Figure 11.

3.1.2. Calculation Parameters

This paper calibrates simulation parameters based on indoor test data and field measurement results. For soil parameters, triaxial compression tests and consolidation tests conducted on soil samples collected from the test site were referenced. For pile material parameters, mechanical property test results from actual pile materials were utilized. We iteratively adjusted parameters until simulation results matched preliminary test data (e.g., load–settlement curves for typical piles) within an acceptable error range (less than 5%). Simulation parameters are presented in Table 3.
When simulating pile–soil interaction, interface elements are employed to represent this process, with the mechanical properties of the interface material adhering to Coulomb’s friction law. To account for friction variations at the contact interfaces between the pile body and different soil layers, three parameters are defined: ultimate shear force, shear stiffness modulus, and normal stiffness modulus. The ultimate shear force value is determined based on the ultimate lateral resistance; the shear stiffness modulus serves as the elastic parameter for tangential sliding of the interface element, typically set at 15–20 times the elastic modulus of the adjacent soil layer; the normal stiffness modulus corresponds to the elastic properties of the interface element in the normal direction during engagement and disengagement states, generally set at 10 times the shear stiffness modulus of the soil. In this simulation, the ultimate shear force is set to 16,000 kN, the shear stiffness modulus is taken as 15 times the soil layer’s elastic modulus (800,000 kN), and the normal stiffness modulus is set to 10 times the soil shear stiffness modulus (8,000,000 kN). The model disregards loading apparatus settings and ignores energy dissipation during reaction transmission and other interference factors. Vertical forces are converted into surface loads and uniformly applied to the pile cap. For compression piles, the uniformly distributed load on the pile cap is set to 32,000 kPa. Load application is divided into 10 steps to simulate the graded loading process in static load tests.

3.1.3. Model Validation

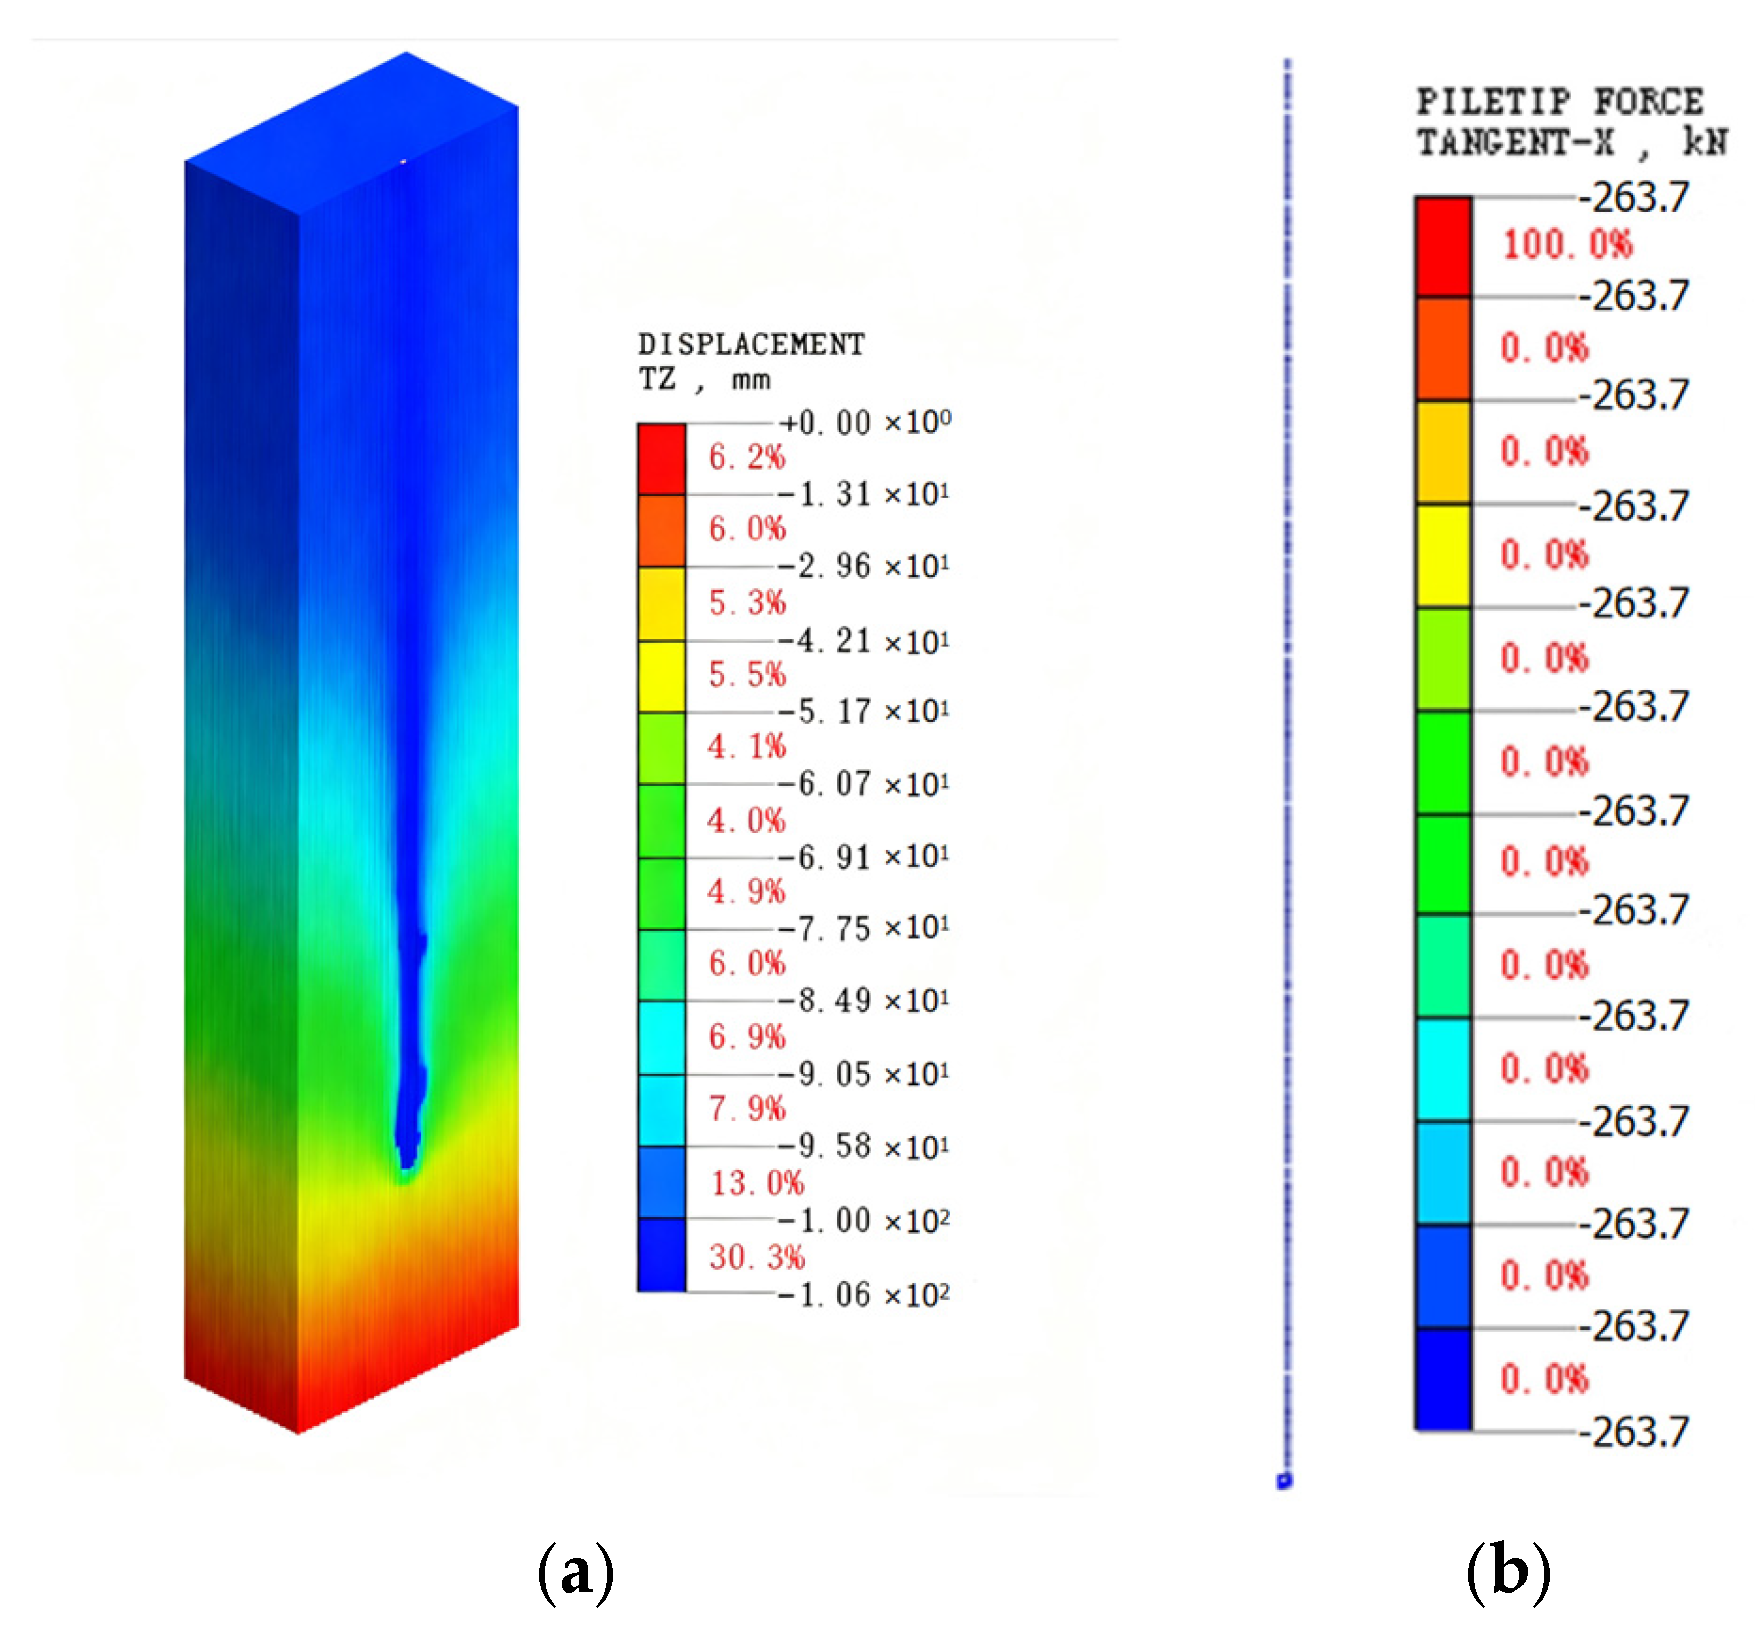
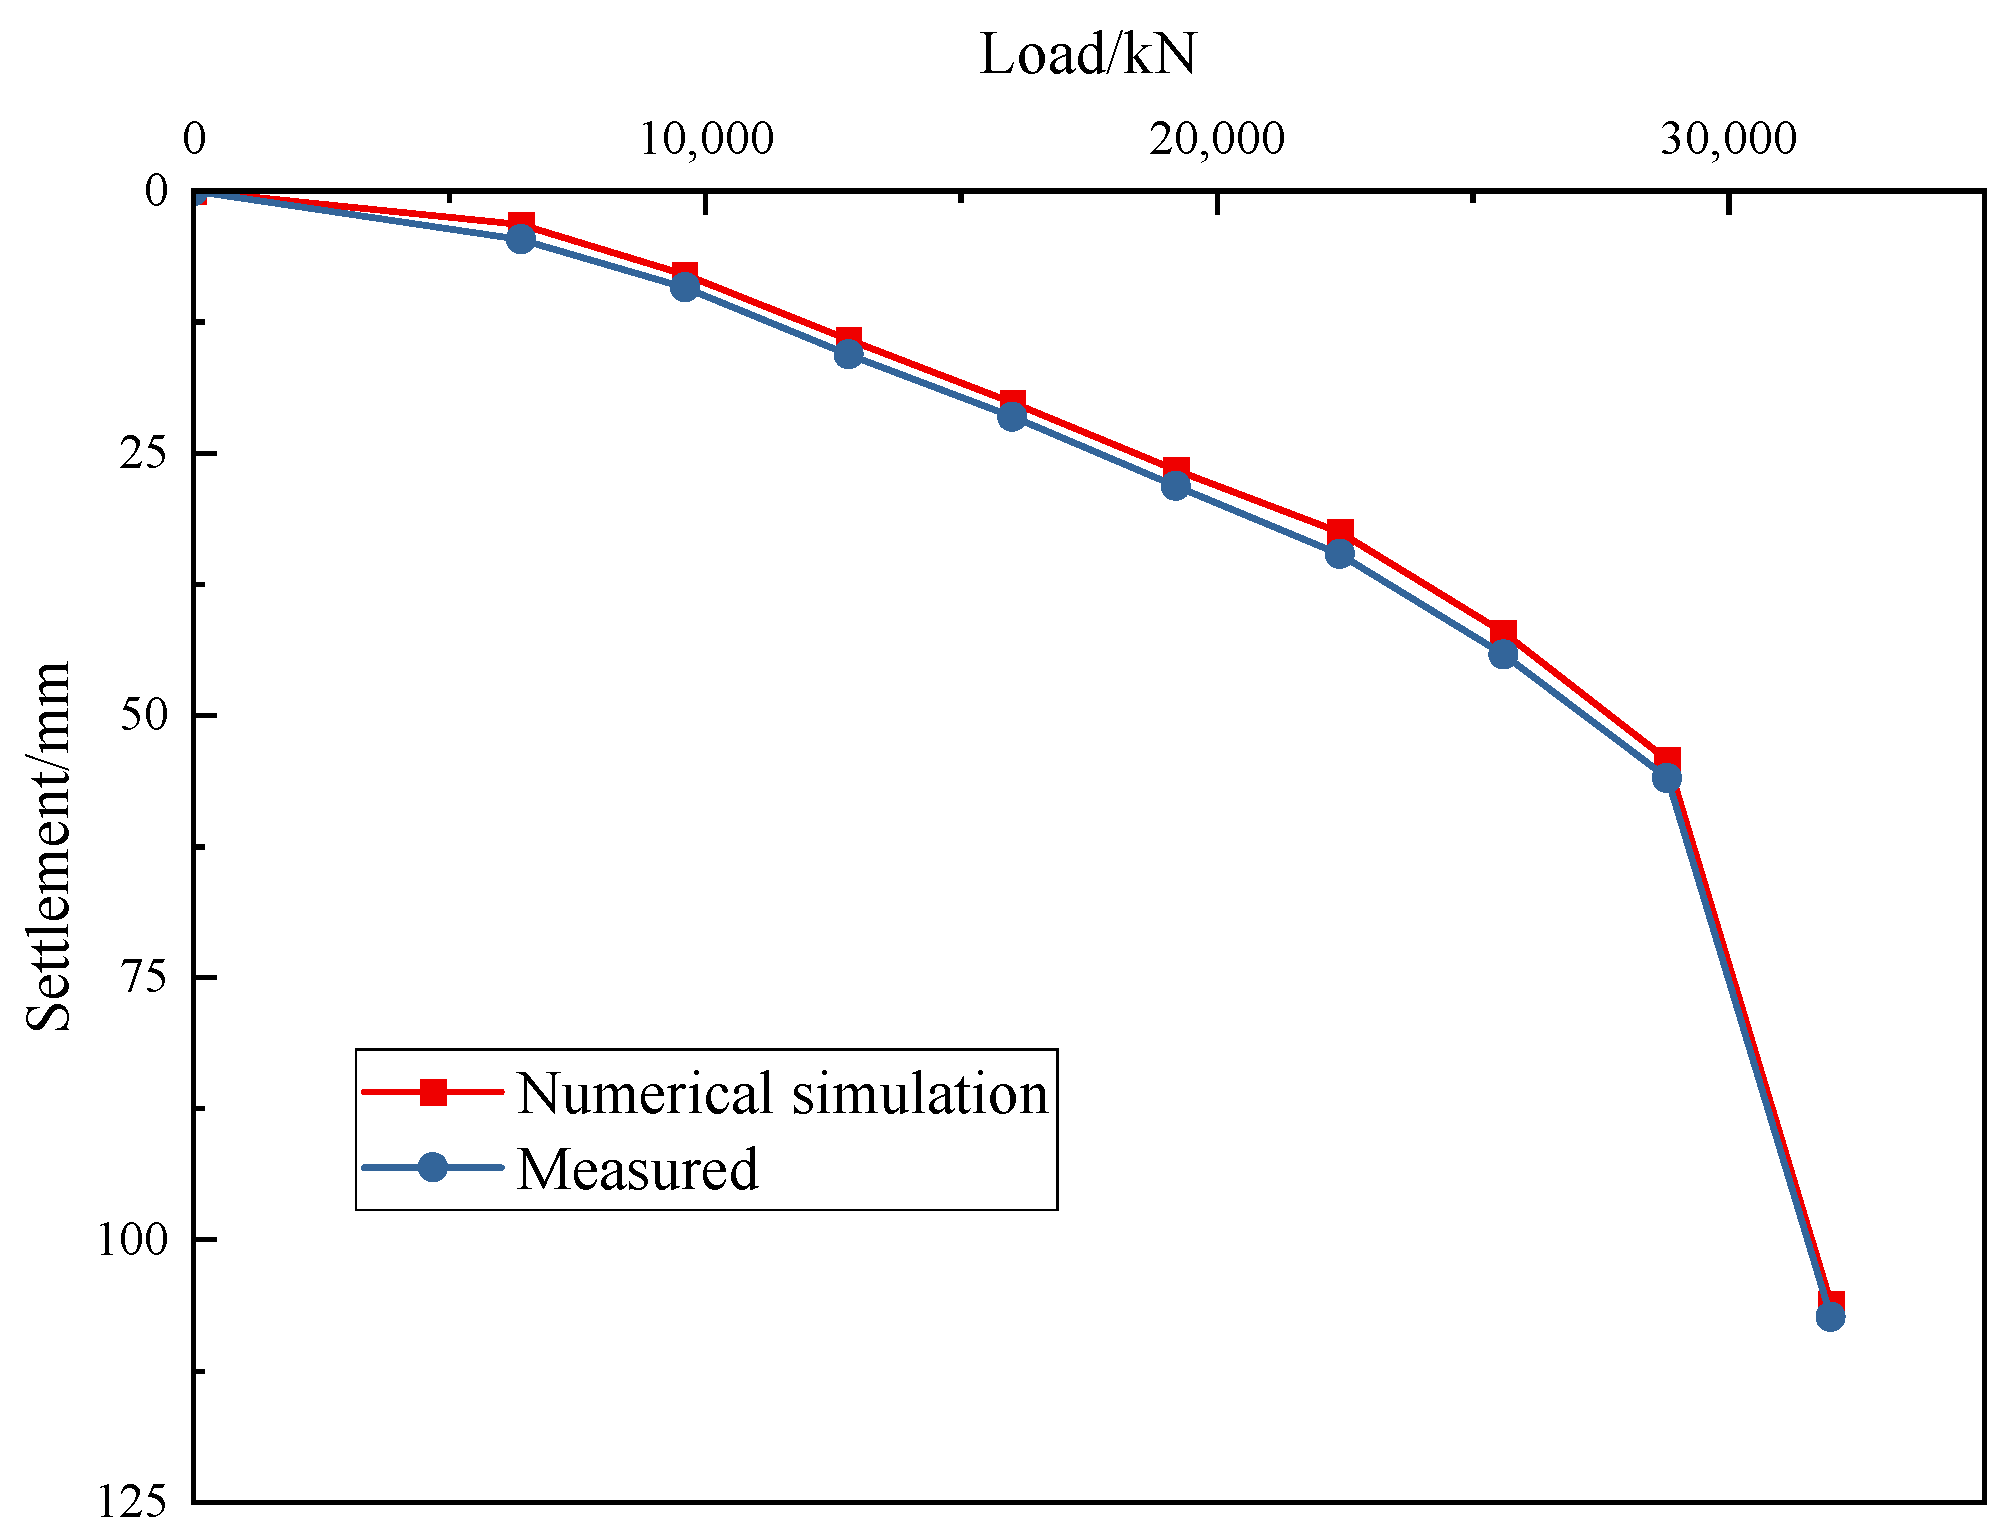
The maximum load applied in the model was consistent with the termination load of the static load test (32,000 kN). The finite element simulation resulted in a settlement of 106.06 mm (as shown in Figure 12), while the measured settlement was 107.33 mm, with a difference of only 1.27 mm—well within an acceptable margin of error. The measured and simulated load–settlement curves of the pile-top vertical displacement under various loading levels are illustrated in Figure 13. In summary, the established three-dimensional finite element model is reasonable and can be reliably employed for further in-depth analysis. The measured pile tip resistance was 2437 kN, while the finite element analysis yielded 2637 kN—an increase of 200 kN over the measured value, representing an error of 8.2%. The lateral resistance of the pile body is relatively complex, and the finite element observation results showed poor agreement with experimental observations. Therefore, this paper only compares settlement and tip resistance.

3.2. Discrete Element Simulation

The currently prevalent macro-scale finite element analysis method can determine the bearing capacity and deformation characteristics of piles. However, due to the complexity of the pile-bottom environment and variations in soil displacement, macro-scale simulations cannot accurately reflect the micro-scale movement patterns of soil particles. In contrast, the discrete element method, which treats soil particles as discrete units, can reasonably describe the displacement and deformation patterns of pile–soil interaction.

3.2.1. Particle Flow Model Construction

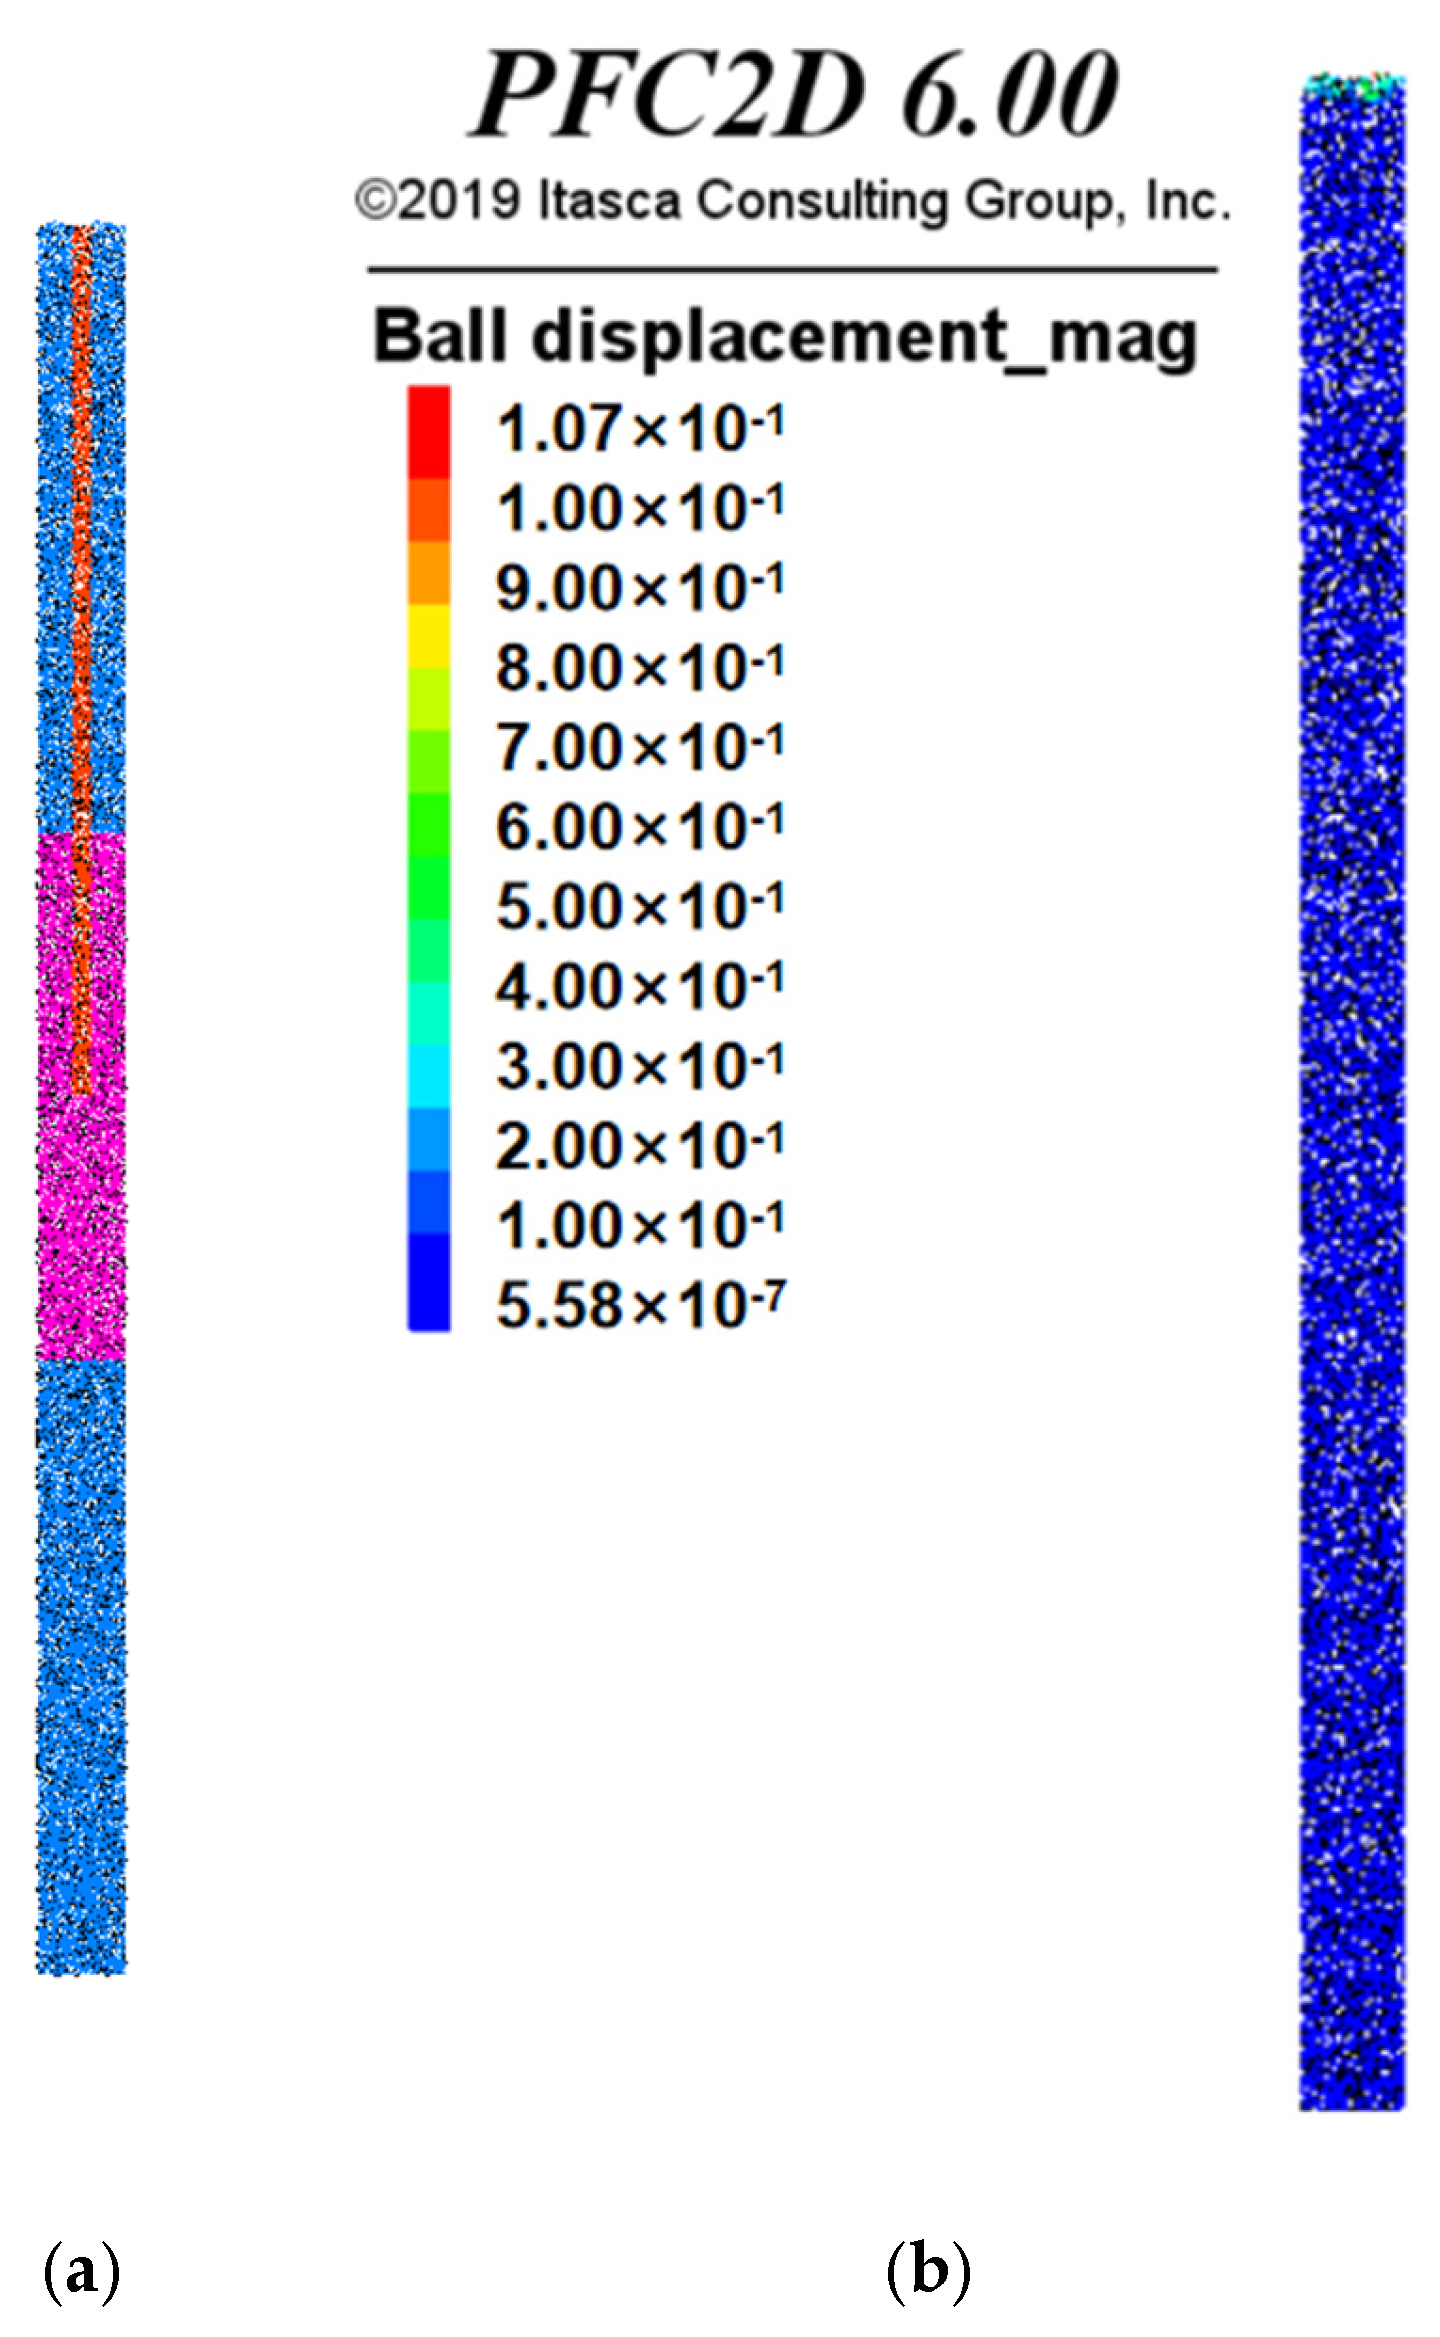
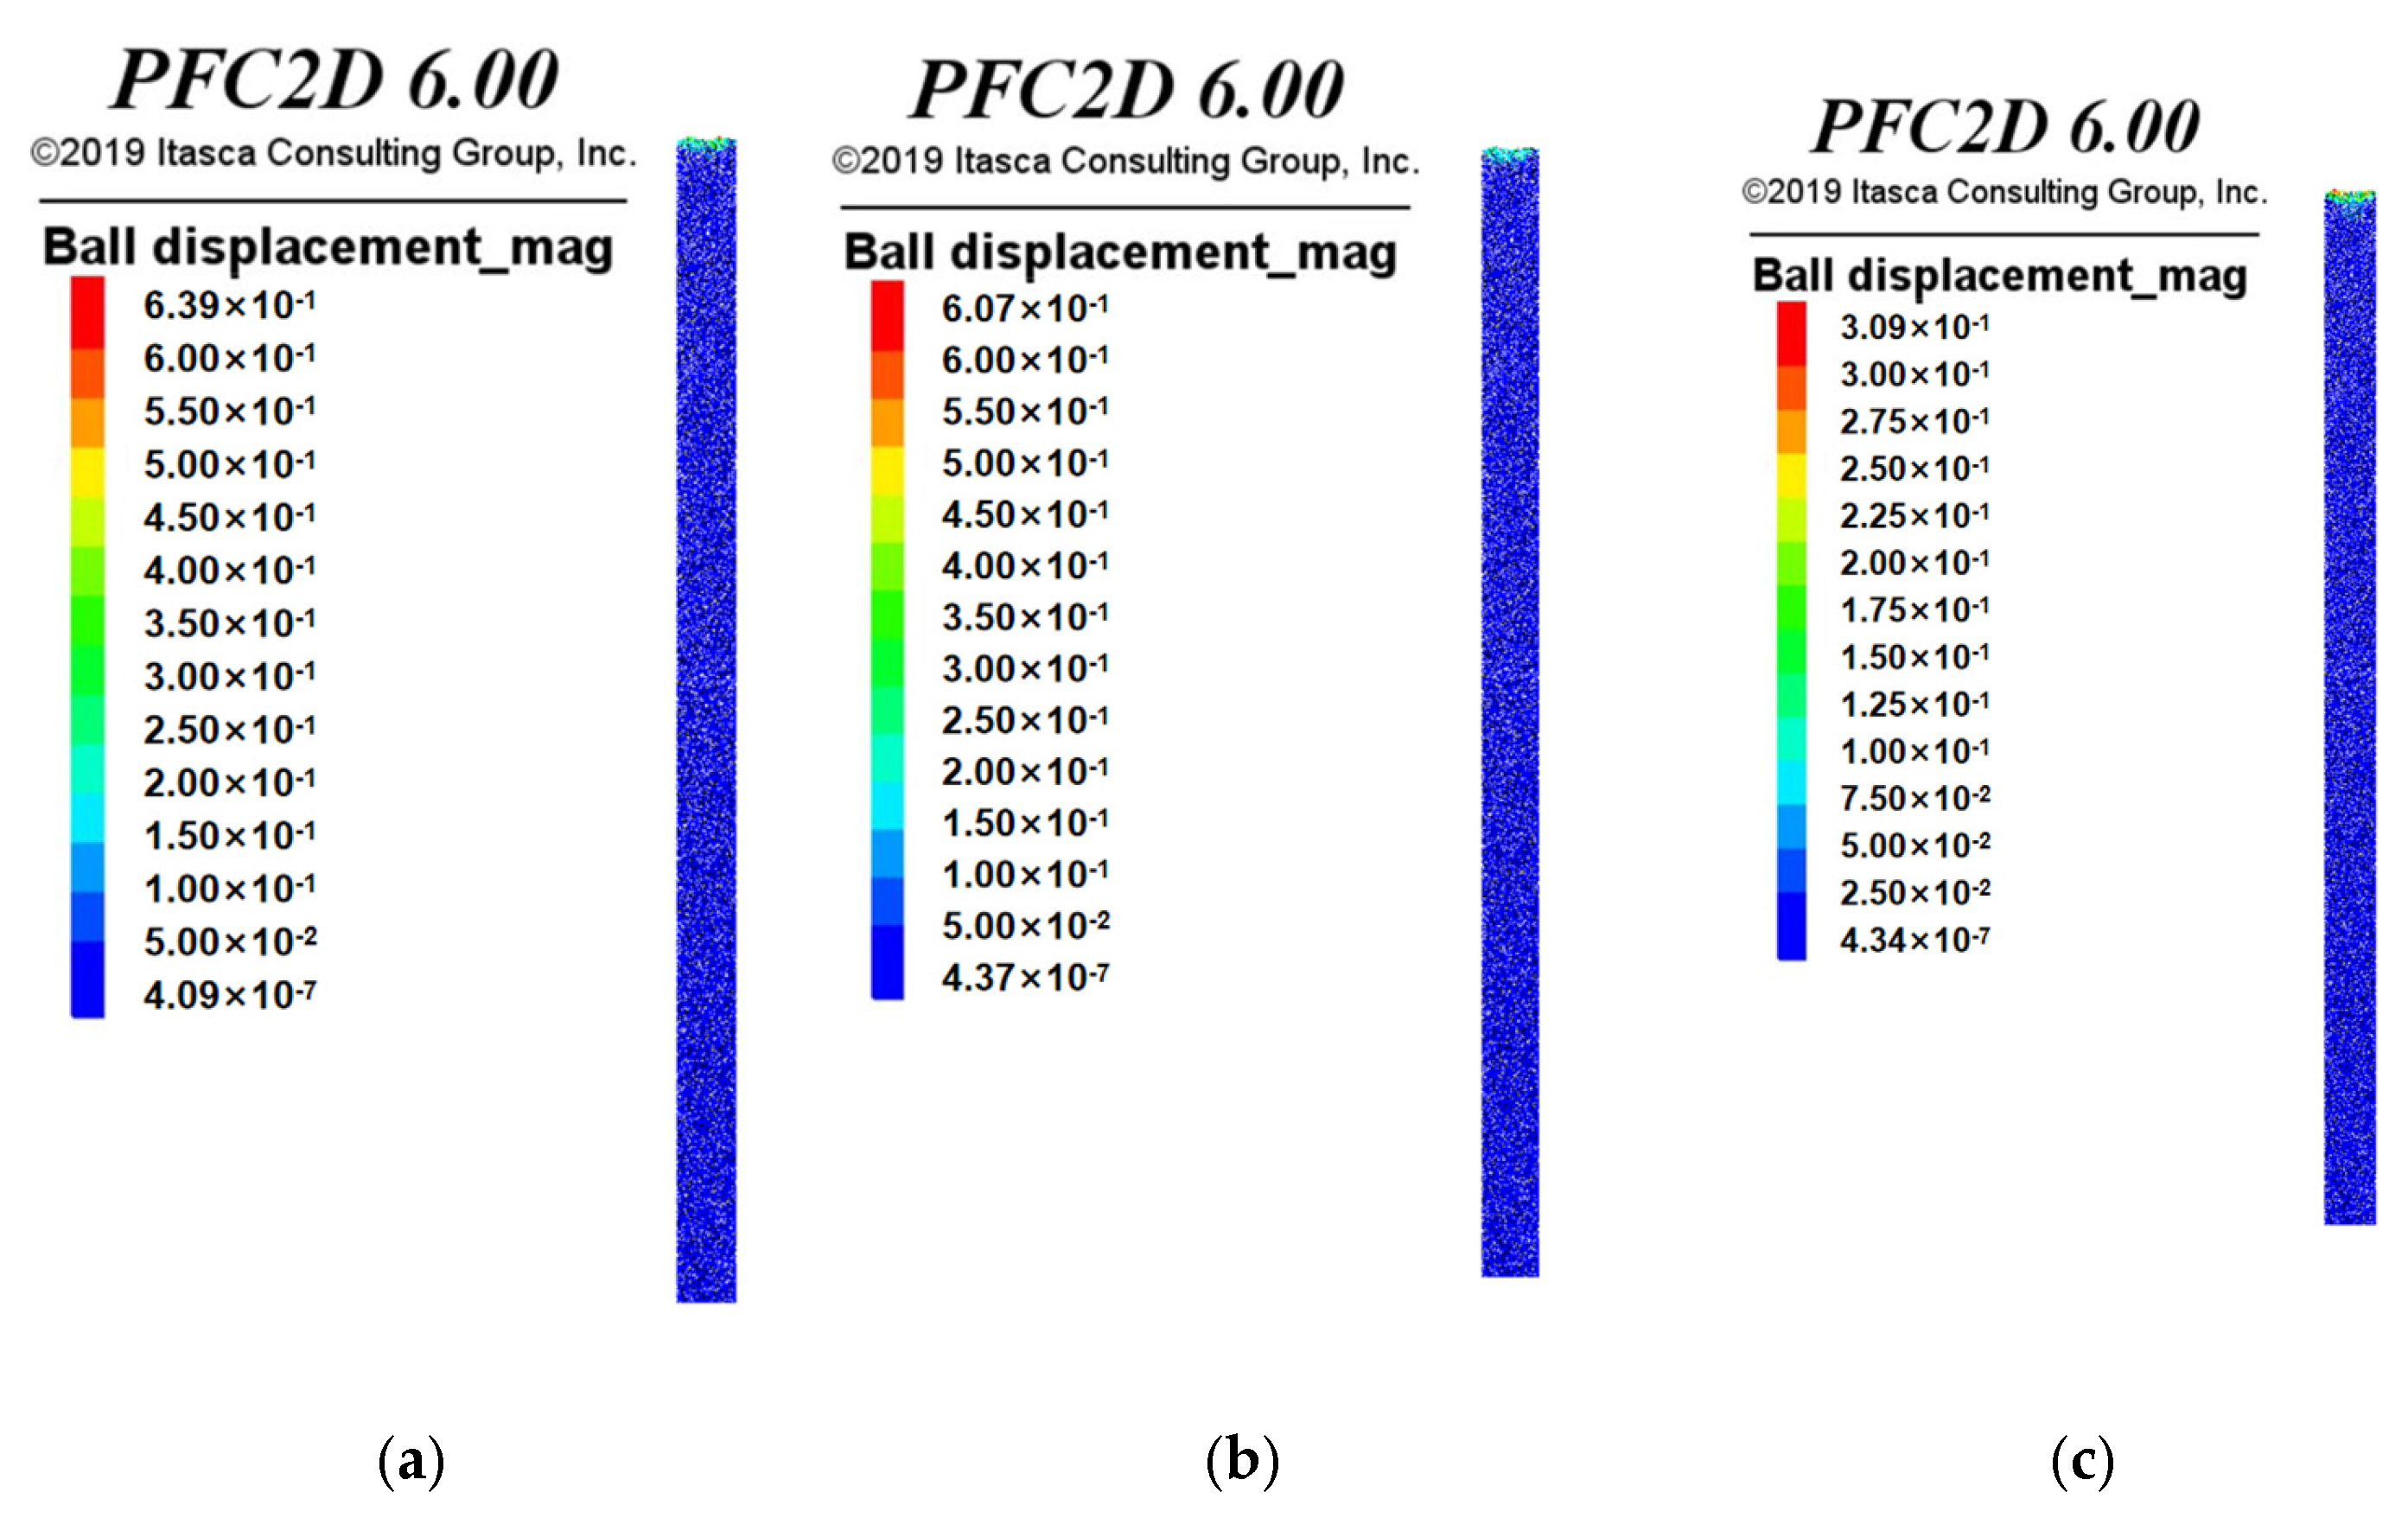
Using discrete element software, particle flow code was developed. After trial calculations, matching particle and wall parameters were selected to construct a computational model suitable for numerical simulation. The contact model employed linear contact, with ball elements simulating soil particles, wall elements simulating soil boundaries, and ball elements simulating pile foundations. Graded soil particles were used for the soil sample, as shown in Figure 14a. The simulated displacement of soil around the pile, as shown in Figure 14b, is 107.01 mm, while the measured settlement is 107.33 mm. The error is negligible. Therefore, the established model is suitable for analysis.

3.2.2. Micro-Parameter Calibration

The relationship between granular flow micromechanical parameters and soil macromechanical parameters was established through matching calculations or numerical simulation tests. Combined with laboratory geotechnical tests, a trial-and-error approach was employed to calibrate the microparameters of discrete particles. This yielded the normal stiffness and shear stiffness of soil particles, the normal stiffness and shear stiffness of piles and model box walls, as well as the friction coefficients of particles and walls. Peat soils are formed by particles, while piles are formed by walls. Results are shown in Table 3. The specific calibration process is referenced in the literature. Basic parameters of the granular flow model are presented in Table 4.

3.2.3. Application of Pile Loads

Currently, due to computational limitations, only single-pile stress analysis is conducted. Lateral pressure from surrounding soil is simulated using wall elements. Vertical loads and lateral pressures are applied through servo control, with the servo control program written in FISH language. After generating the friction pile model, confining pressure is first applied to bring the pile to its initial state upon construction completion. Next, a rigid wall element with a diameter of 0.5 m is controlled to simulate loading plate application onto the pile body. This replicates the graded loading process of a load test, synchronizing the target pressure with the graded loading stages of the load test. When the target pressure is reached, the wall stops moving, thereby halting the loading process. Due to computational limitations, only single-pile stress analysis is currently performed. Lateral pressure from surrounding soil is simulated through wall element loading. Vertical loads and lateral pressures are applied via servo control. The servo control program is written using the FISH language. After generating the friction pile model, confining pressure is first applied to bring the pile to its initial state upon construction completion. Then, a rigid wall element with a diameter of 0.5 m is controlled to simulate the loading plate applying load to the pile body. This simulates the graded loading process of the load test, achieving synchronization between the target pressure and the graded load of the load test. When the target pressure is reached, the wall stops moving, thereby ceasing loading.

3.3. Comparison of Applicability Between Two Numerical Methods

The finite element method (FEM) and discrete element method (DEM) each possess distinct advantages in studying pile foundation bearing capacity. FEM, based on continuum mechanics theory, excels at analyzing overall bearing characteristics and stress distribution with high computational efficiency, yet struggles to capture micromechanical interactions between particles surrounding the pile. DEM realistically describes particle rearrangement and interface slip processes, making it suitable for revealing friction mobilization and localized failure mechanisms, but it involves substantial computational demands and exhibits pronounced scale effects. Overall, FEM is suitable for macroscopic analysis, while DEM is better suited for studying microscopic mechanisms. Combining both methods enables multiscale characterization of the bearing behavior of extra-long, large-diameter friction piles.

4. Parametric Analysis

4.1. Influence Analysis of Parameters Based on Finite Element Simulation

4.1.1. Influence of Peat Soil Thickness

To investigate the impact of peat soil interlayer thickness in lacustrine deposit strata on ultra-long large-diameter friction piles, the original model was modified with the following parameters: soil thickness set to 108 m, pile length 98 m, pile radius 0.5 m, and only three soil layers retained. All other parameters remained unchanged. Specific working conditions are listed in Table 5.
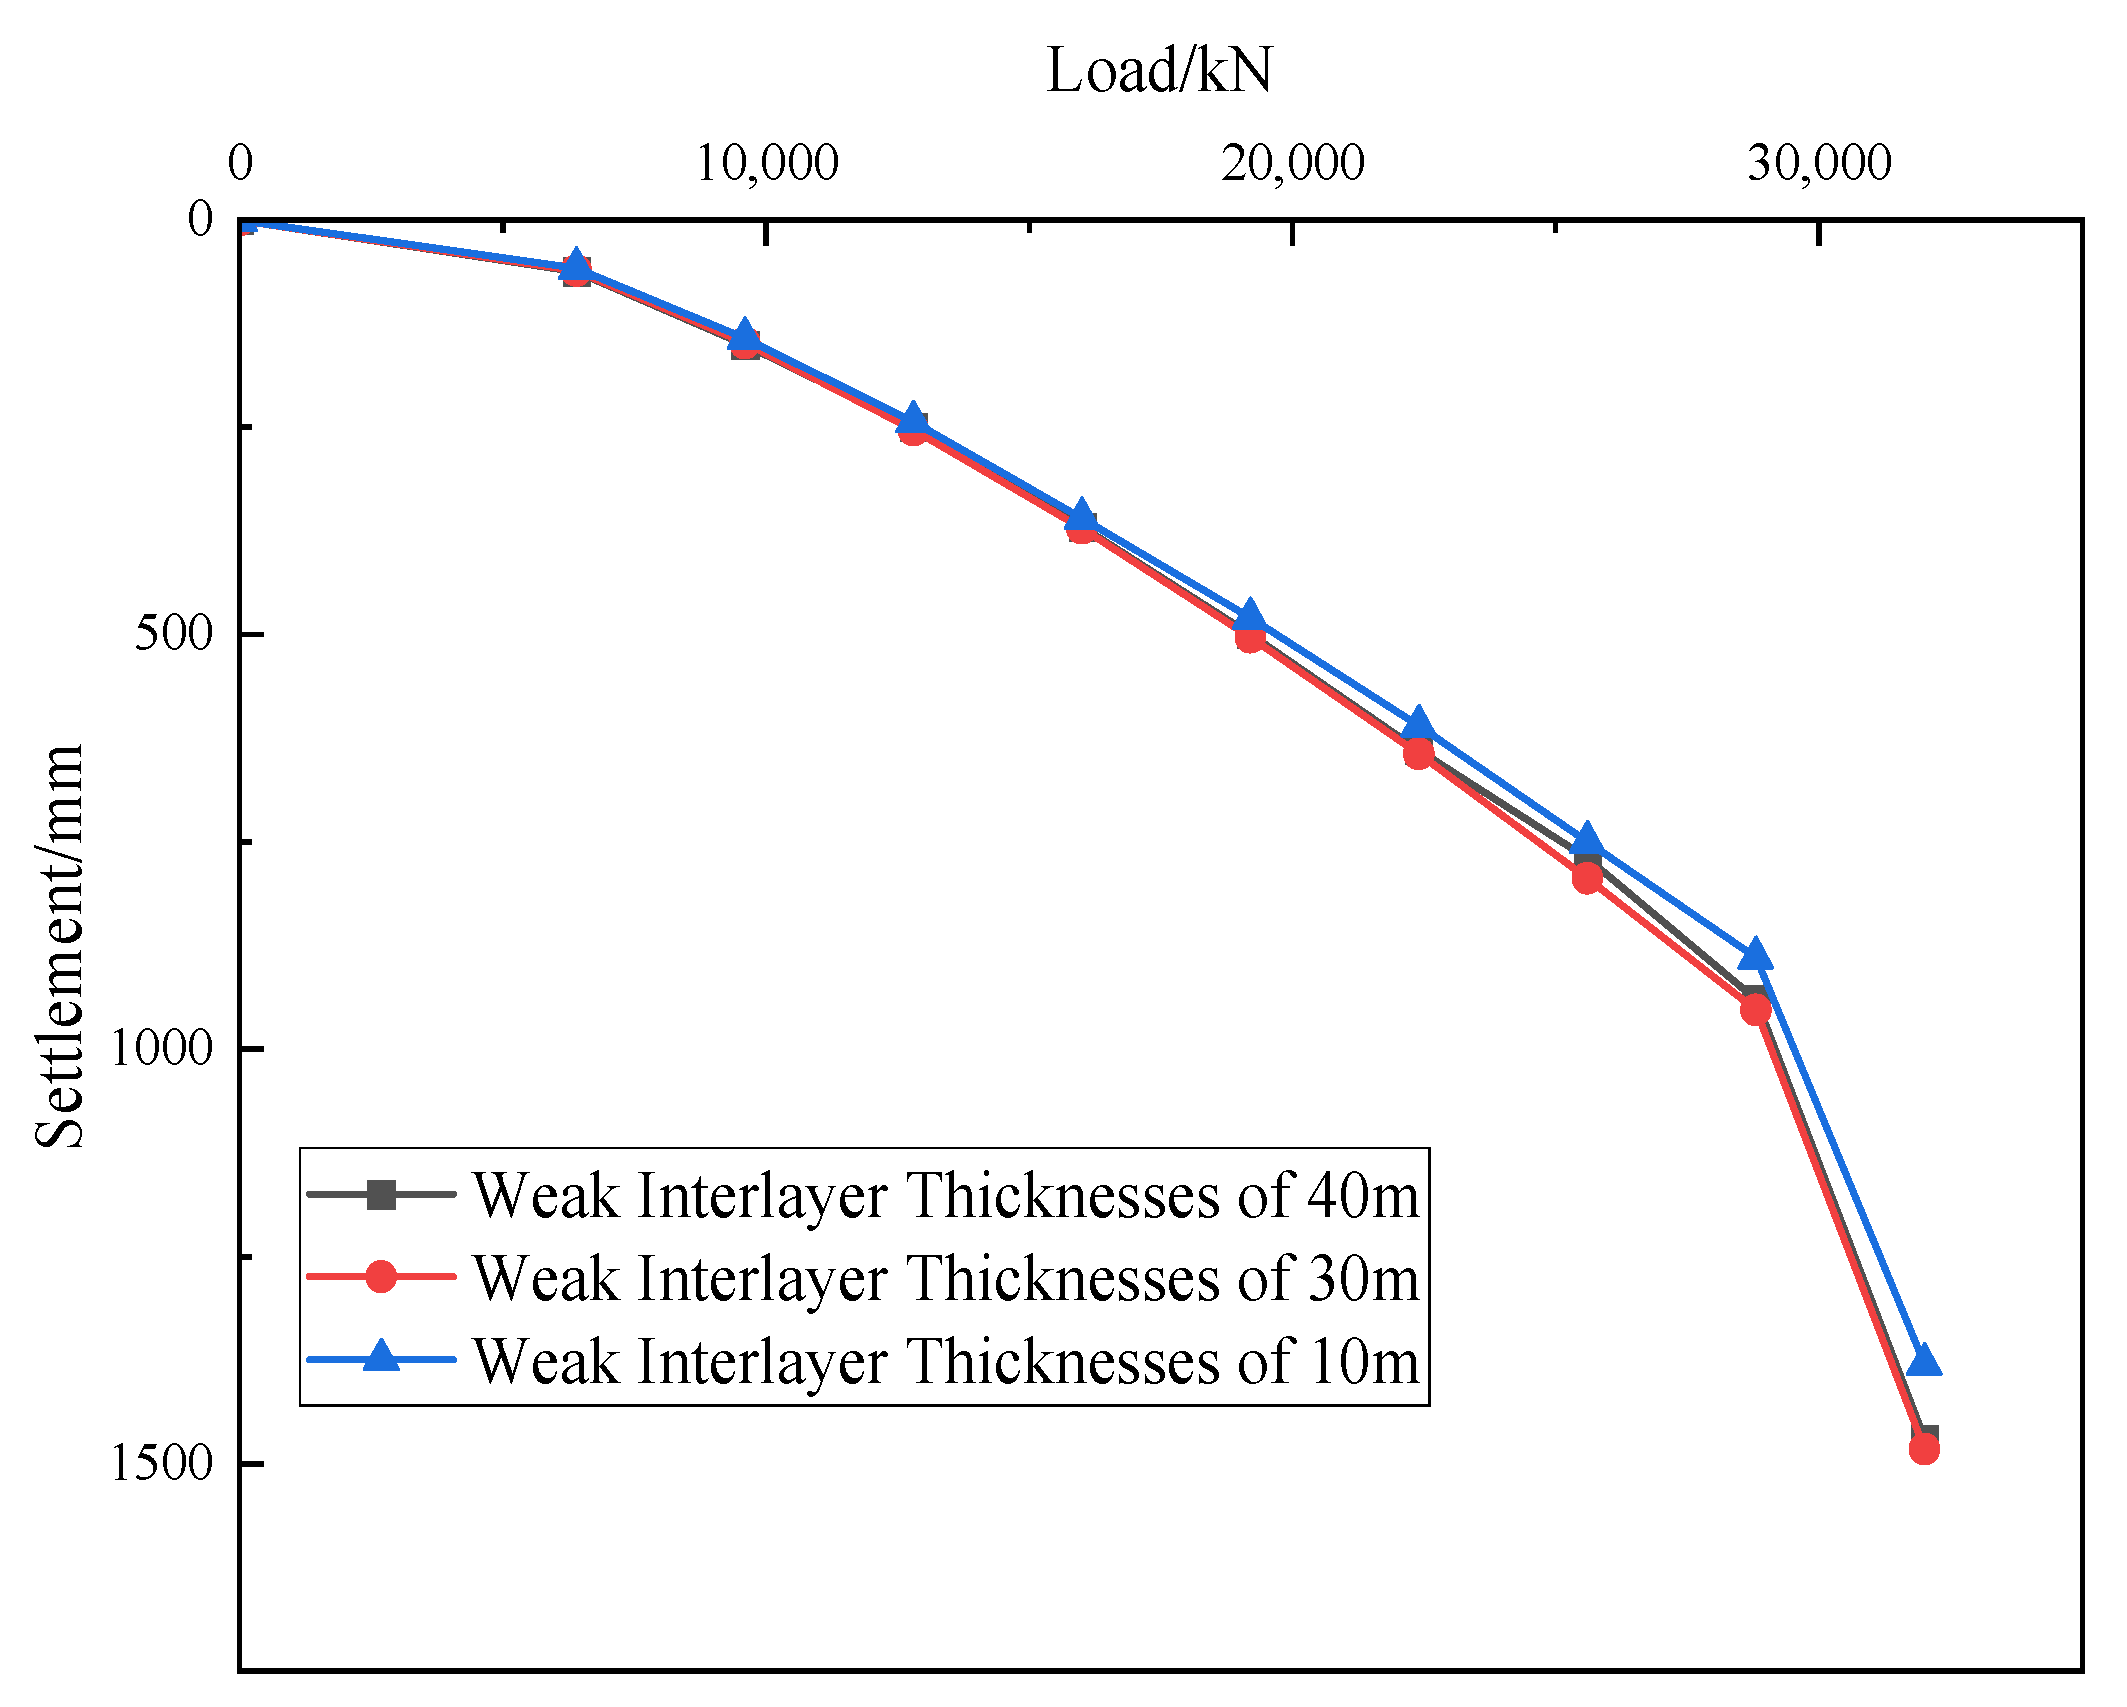
As shown in Table 6, under a load of 32,000 kN, the settlements are 1470 mm, 1483 mm, and 1380 mm for weak layer thicknesses of 40 m, 30 m, and 10 m, respectively. When the weak layer thickness increases from 10 m to 30 m, the settlement increases by 103 mm; however, when the thickness further increases from 30 m to 40 m, the settlement decreases by 13 mm. This suggests that as the weak layer thickness increases, the pile settlement increases significantly initially, but when the thickness exceeds a critical value, the bearing capacity remains nearly constant.
The load–settlement (Q-s) curves for different weak interlayer thicknesses (Figure 15) exhibit nearly identical morphology. Under the same load level, a smaller weak interlayer thickness results in reduced settlement.
As shown in Figure 16, the influence of weak layer thickness on the pile-end bearing capacity is illustrated as follows:
At 40 m, pile-end resistance is 386.5 kN (1.34% of the pile-top load);
At 30 m, it is 394.9 kN (1.37%);
At 10 m, it is 333 kN (1.16%).
The pile-end resistance initially increases and then decreases as the weak layer thickness increases, confirming the existence of a critical thickness that results in an extreme value of the pile-end resistance.

4.1.2. Influence of Pile Length in Peaty Soils

To investigate the effect of pile length variation on the vertical bearing behavior of ultra-long large-diameter friction piles, the soil layers were simplified to a single homogeneous Layer ⑨ 2 peat soil (Poisson’s ratio 0.25; all other parameters remained unchanged). Under a load of 28,800 kN, pile lengths were set to 88 m, 98 m, and 108 m to study their influence on vertical bearing performance. Specific data are listed in Table 7.
As shown in Table 7, under a load of 28,800 kN, the settlements are 163.6 mm, 153.0 mm, and 134.77 mm for pile lengths (L) of 108 m, 98 m, and 88 m, respectively. When the pile length increases from 88 m to 98 m, the settlement increases by 18.24 mm; when the length further increases from 98 m to 108 m, the settlement increases by 10.6 mm. This indicates that due to the inherent length advantage of ultra-long piles, variations in pile length have a relatively minor impact on the bearing capacity. Blindly increasing the pile length does not yield positive effects on enhancing the bearing capacity.
The load–settlement (Q-s) curves for different pile lengths (Figure 17) exhibit linear distributions, indicating that none reached the ultimate load. At lower load levels, the curves essentially coincide with negligible differences in settlement. As the load increases, longer piles demonstrate flatter curves and higher ultimate bearing capacity. For pile lengths of 98 m and 108 m, the curves nearly overlap when the load is below 15,000 kN. Beyond this threshold, settlement differences gradually emerge but remain significantly smaller than the variation in pile length. This phenomenon suggests the existence of a critical pile length, beyond which increasing the length has negligible effects on reducing settlement.
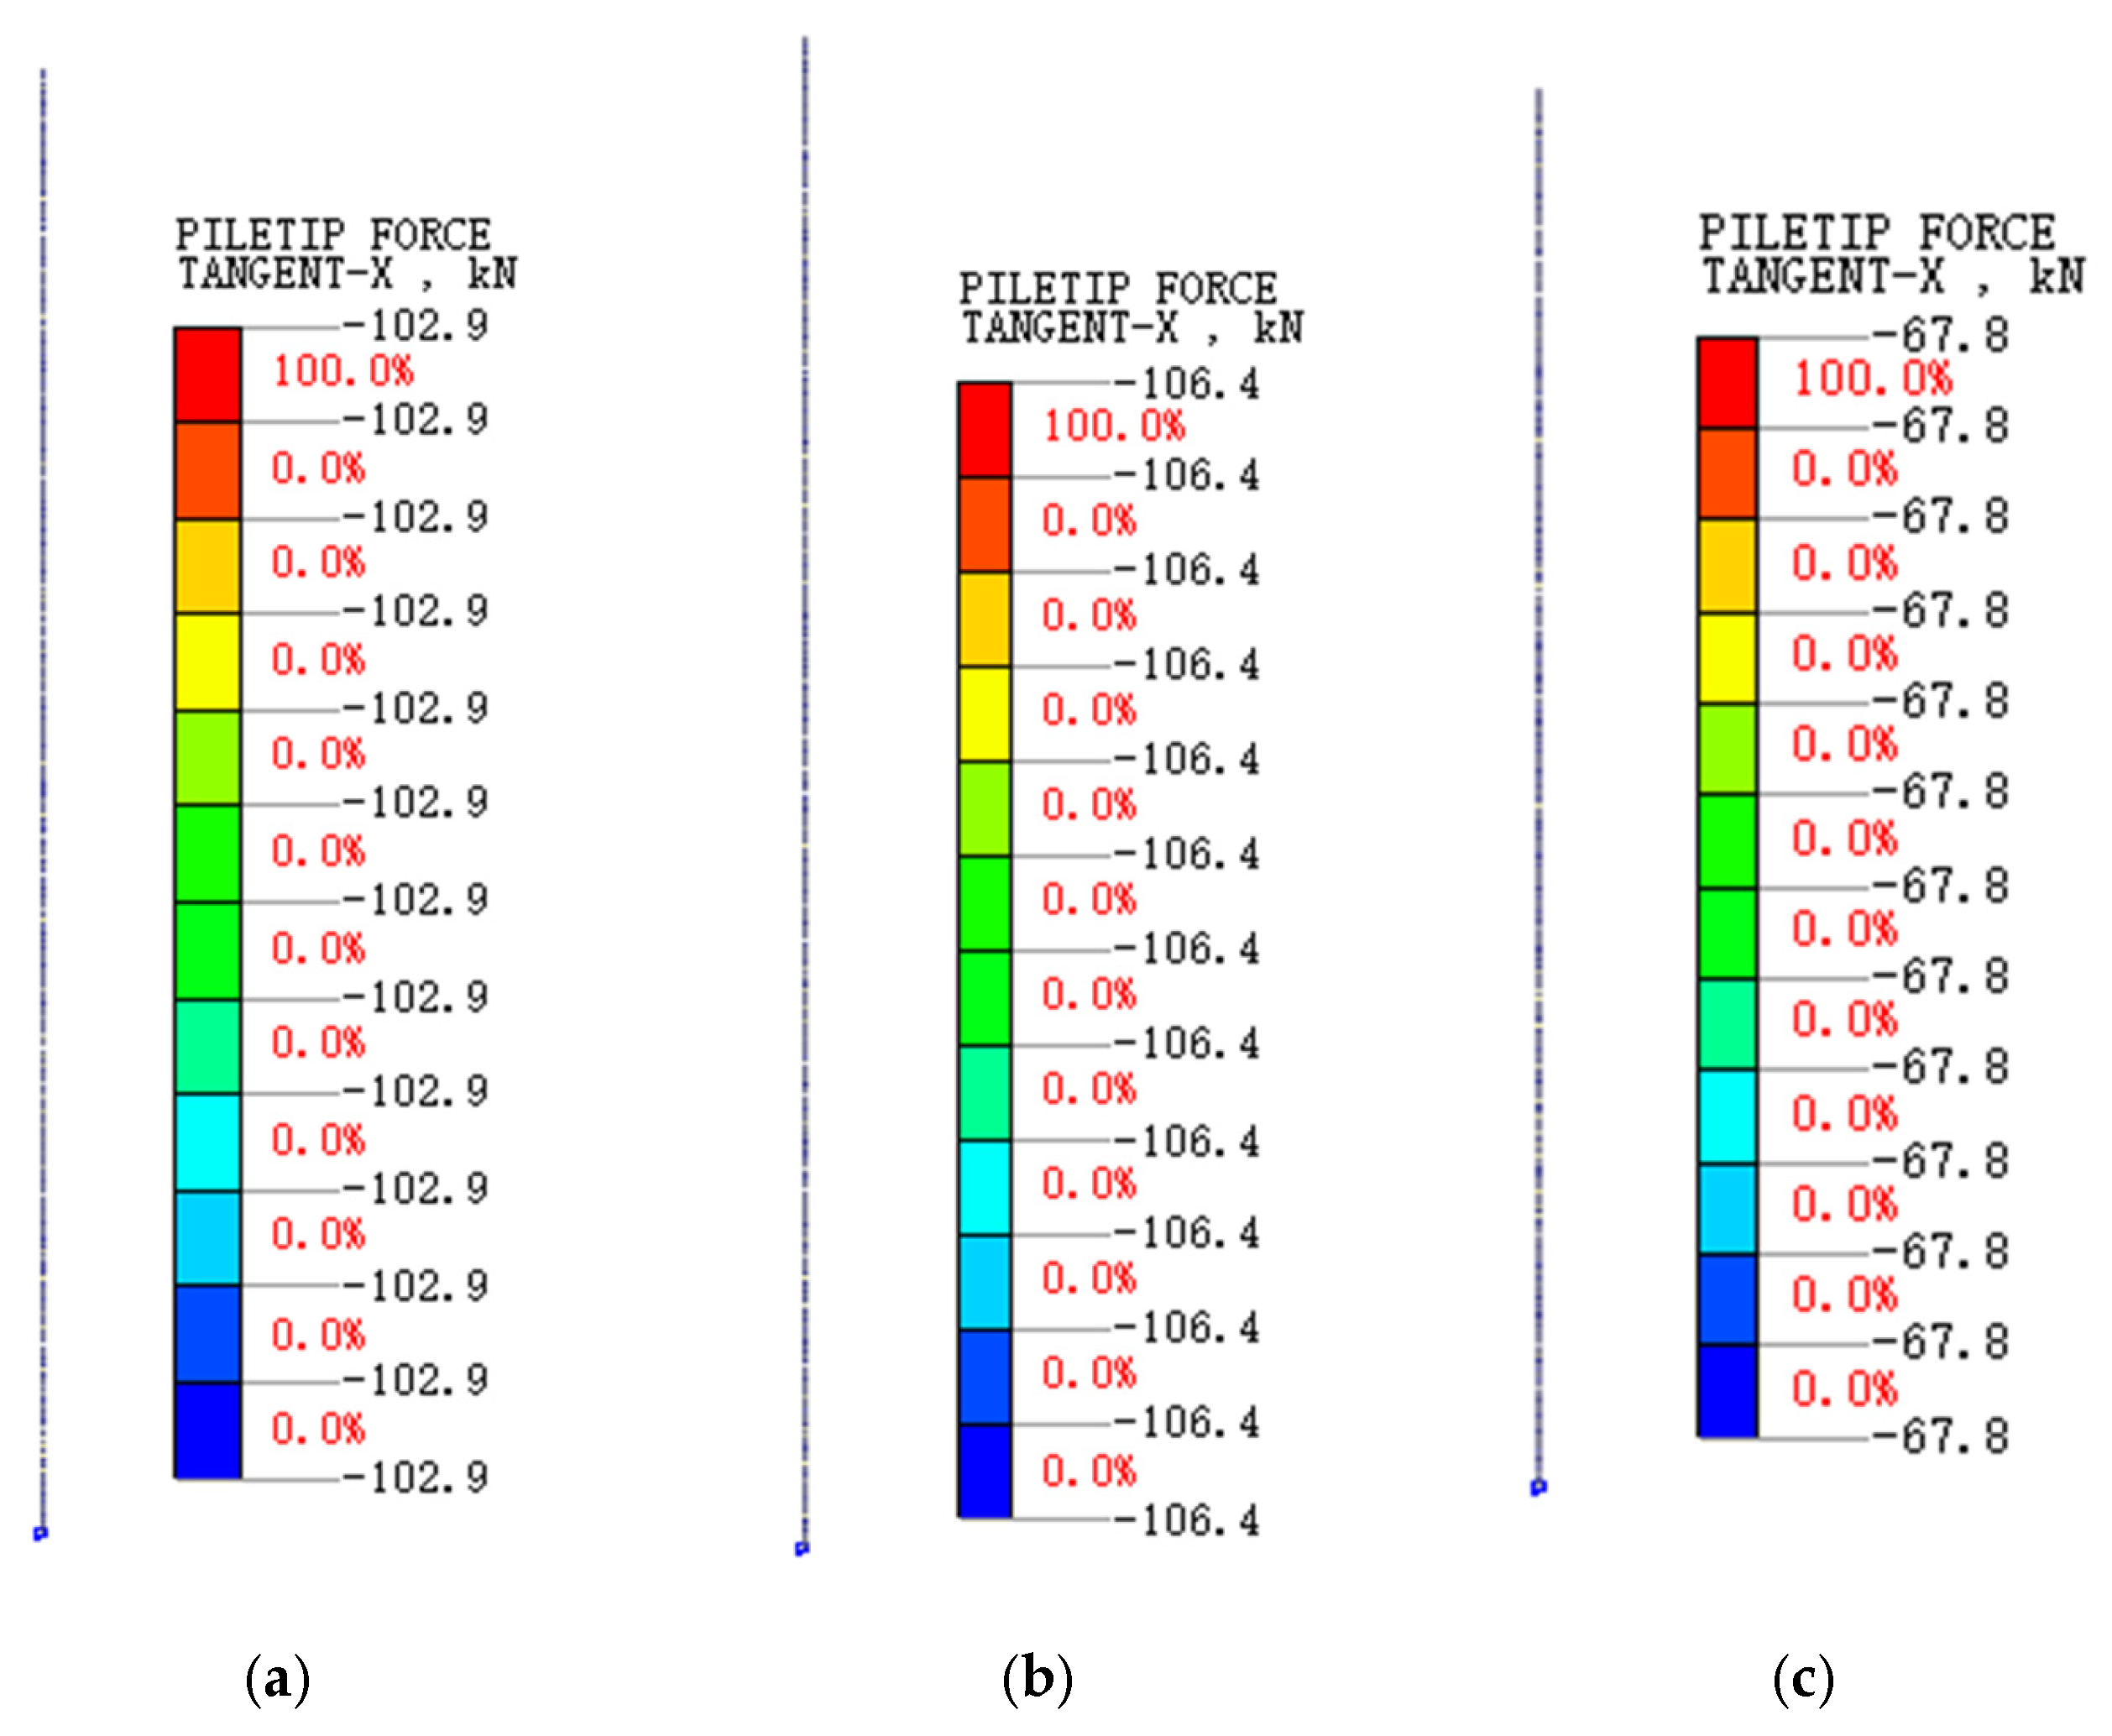
As shown in Figure 18, the influence of pile length on pile-end bearing capacity is as follows:
At L = 108 m, pile-end resistance is 102.9 kN (0.36% of the pile-top load);
At L = 98 m, it is 106.4 kN (0.37%);
At L = 88 m, it is 67.8 kN (0.24%).
The pile-end resistance initially increases and then decreases with increasing pile length, confirming the existence of a critical pile length.

4.1.3. Influence of Pile Diameter in Peat Soil

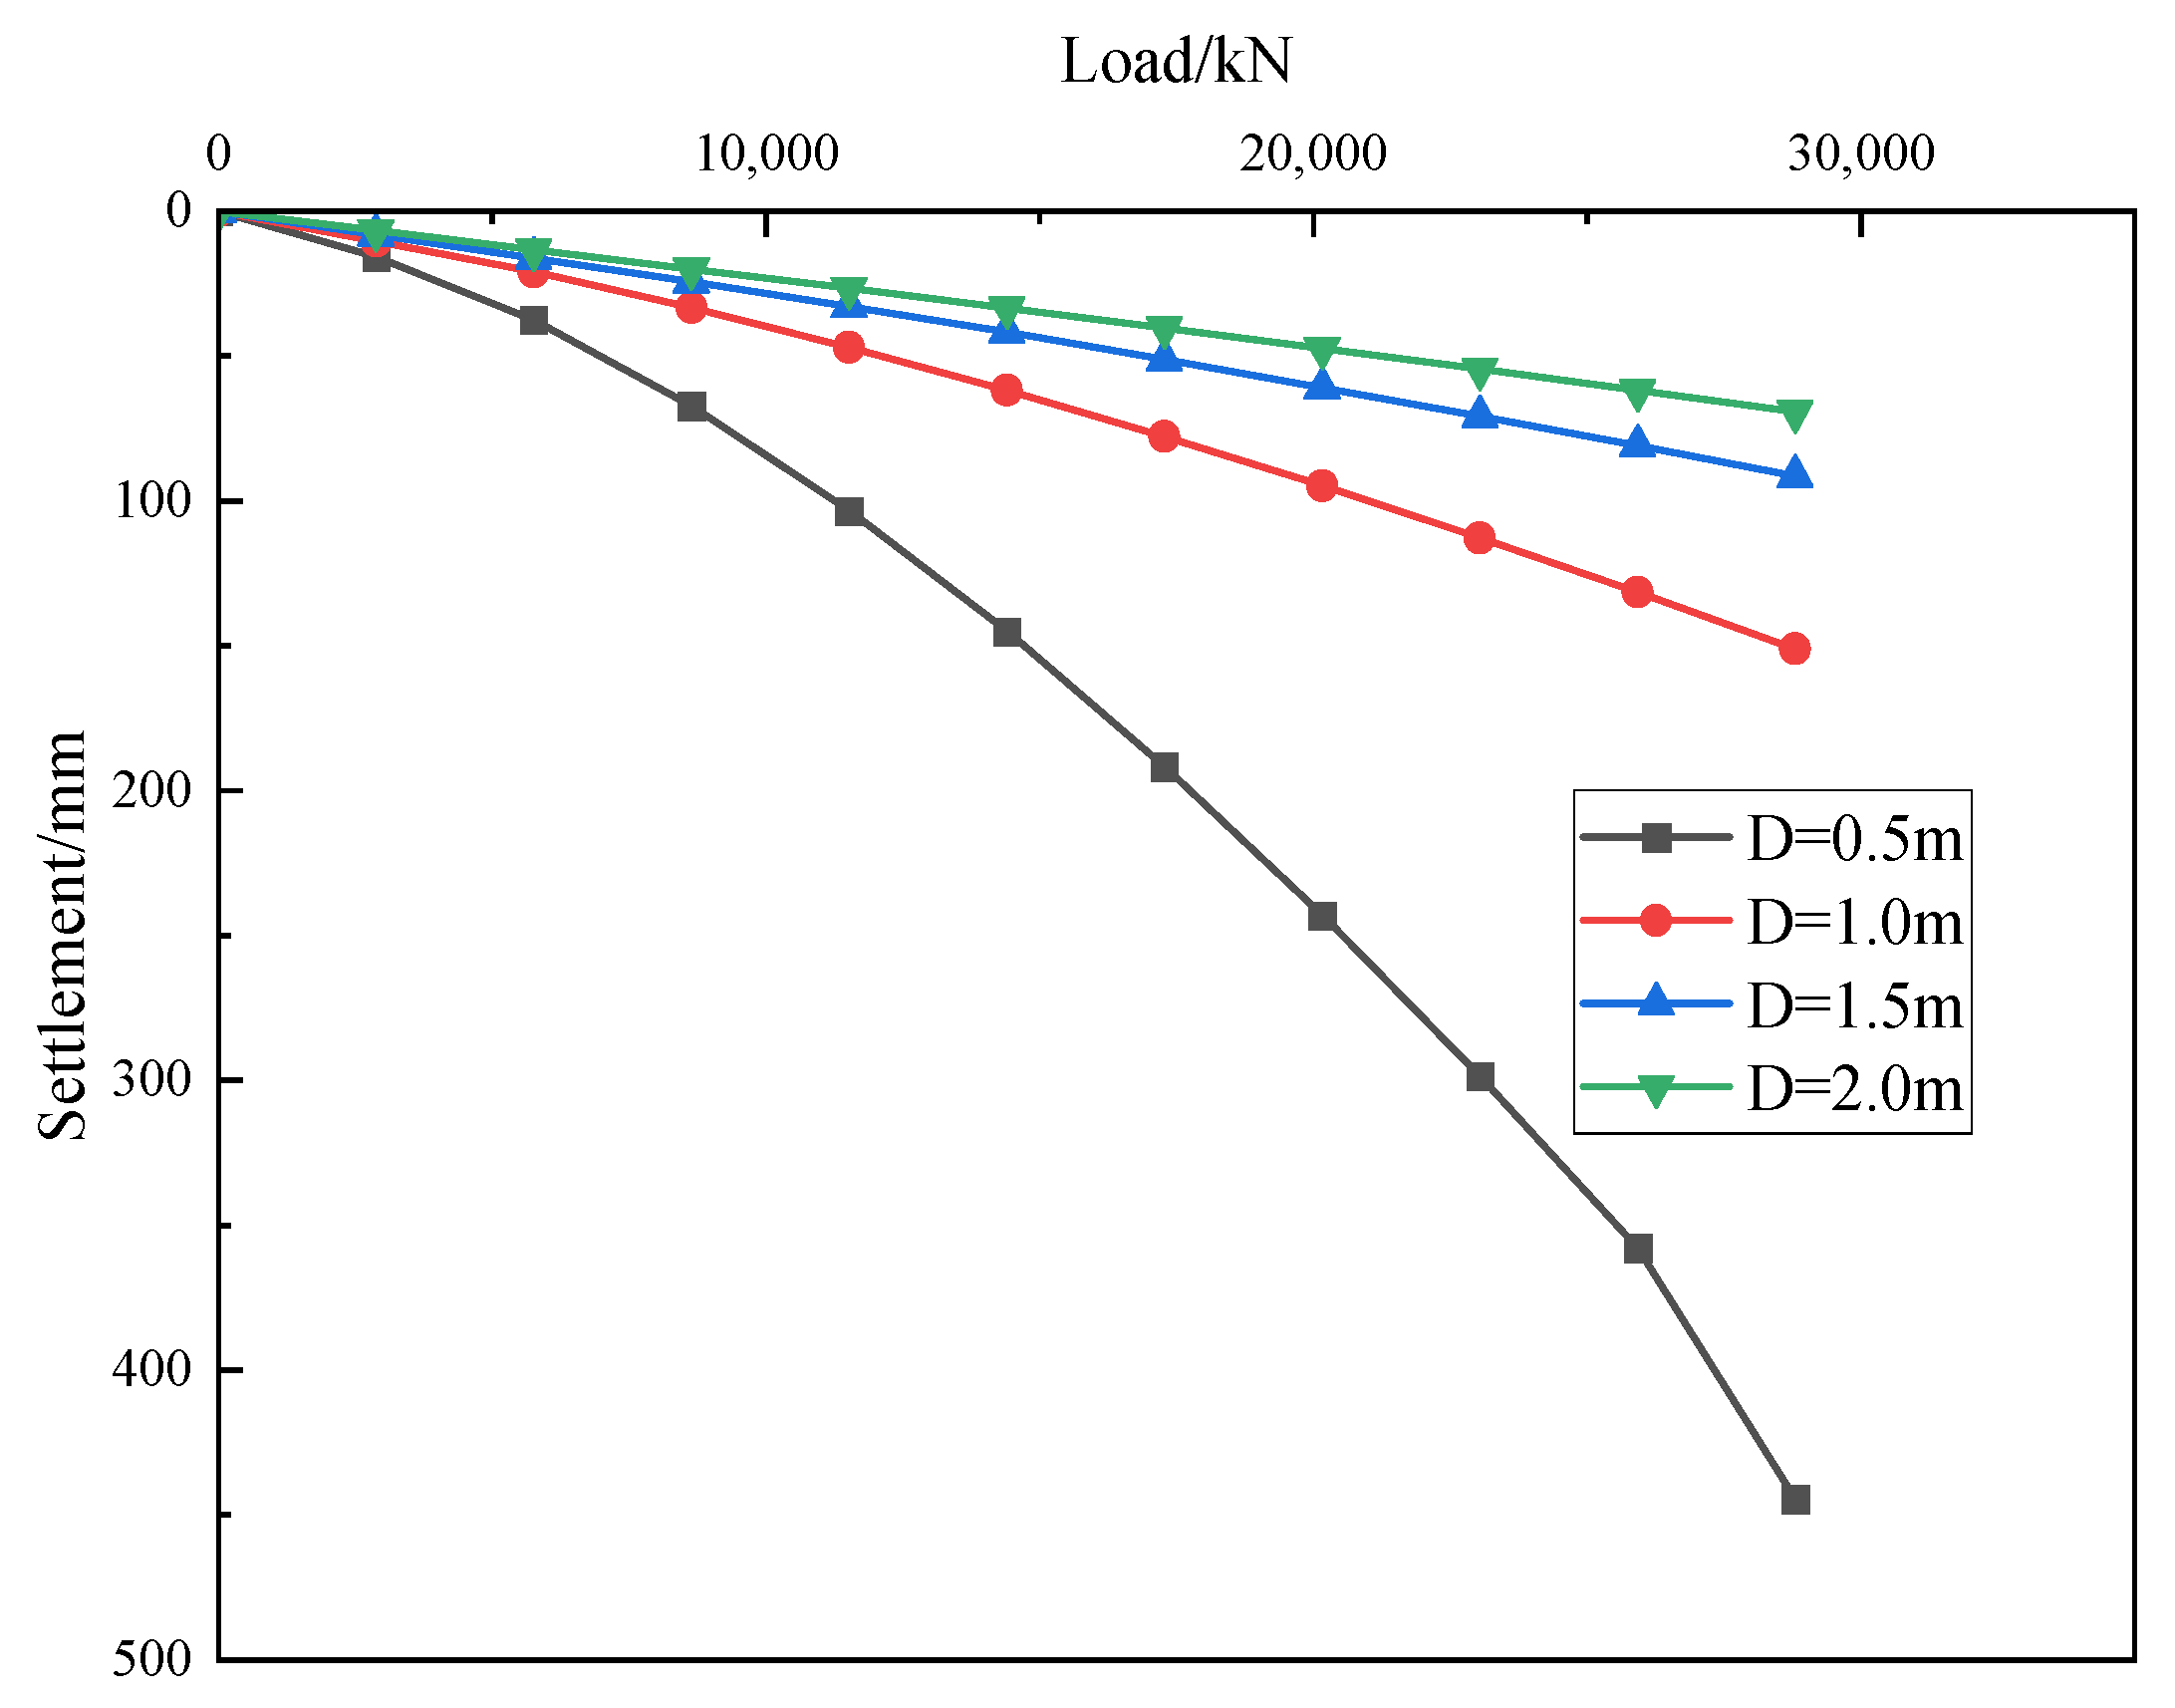
To investigate the effect of pile diameter variation on the vertical bearing behavior of ultra-long large-diameter friction piles, under an ultimate load of 28,800 kN, pile diameters were set to 0.5 m, 1.0 m, 1.5 m, and 2.0 m to study their influence on bearing performance. Specific data are listed in Table 8.
As shown in Table 8, under a load of 28,800 kN, the settlements are 444.5 mm, 151.1 mm, 91.4 mm, and 69.2 mm for pile diameters (D) of 0.5 m, 1.0 m, 1.5 m, and 2.0 m, respectively. When the pile diameter increases from 0.5 m to 1.0 m, the settlement decreases by 293.4 mm; from 1.0 m to 1.5 m, it decreases by 59.7 mm; and from 1.5 m to 2.0 m, it decreases by 22.2 mm. This indicates that variations in pile diameter significantly influence the bearing capacity of ultra-long piles. The settlement decreases dramatically when the diameter increases from 0.5 m to 1.0 m, but stabilizes beyond 1.5 m, suggesting the existence of a critical pile diameter beyond which further increases have minimal effects on bearing capacity.
The load–settlement (Q-s) curves for different pile diameters (Figure 19) show that under the same load, the pile-top displacement decreases as the pile diameter increases, and the reduction is more significant at higher loads. The increase in pile diameter makes the curves more linear and enhances the ultimate bearing capacity, because the larger pile diameter increases the base area and side area, thereby improving the shaft friction resistance.
The influence of pile diameter on the pile-end bearing capacity is shown in Figure 20:
For D = 0.5 m, the pile-end resistance is 59.98 kN, accounting for 0.21% of the pile-top load;
For D = 1.0 m, it is 106.4 kN, accounting for 0.37%;
For D = 1.5 m, it is 141.1 kN, accounting for 0.49%;
For D = 2.0 m, it is 193.3 kN, accounting for 0.67%.
The pile-end bearing capacity increases with the increase in pile diameter.

4.1.4. Summary

This study simulated a total of ten scenarios, analyzing three conditions for soft layer thickness and pile length, and four conditions for pile diameter. The summary table is shown in Table 9.
Table 9 indicates that the final settlement value increases with the thickness of the weak layer and with the pile length but decreases with the pile diameter. This clearly demonstrates the influence of these factors on the bearing capacity of extra-long, large-diameter piles. Pile tip resistance first increases and then decreases as the thickness of the weak layer and the pile length increase, indicating the existence of critical weak layer thickness and critical pile length. Conditions B2 and C3 share identical simulation parameters. Simulation results show identical pile tip resistance, with only a 2.1 mm difference in ultimate settlement.

4.2. Influence Analysis of Parameters Based on Discrete Element Simulation

4.2.1. Influence of Peat Soil Thickness

To investigate the influence of peat interlayers in lacustrine sedimentary strata on ultra-long large-diameter friction piles, the original model was modified as follows: soil layer thickness set to 196 m, pile length to 98 m, and pile radius to 0.5 m. For computational convenience, only three soil layers were retained while other parameters remained unchanged. Specific working conditions are detailed in Table 10. Figure 21 presents the load–settlement curve contour plot.
As shown in Figure 21, the curve profiles exhibit consistent trends with increasing thickness of the weak soil layer. However, under identical loading conditions, it is evident from the graph that thicker weak layers result in correspondingly greater settlement values.

4.2.2. Influence of Pile Length in Peaty Soils

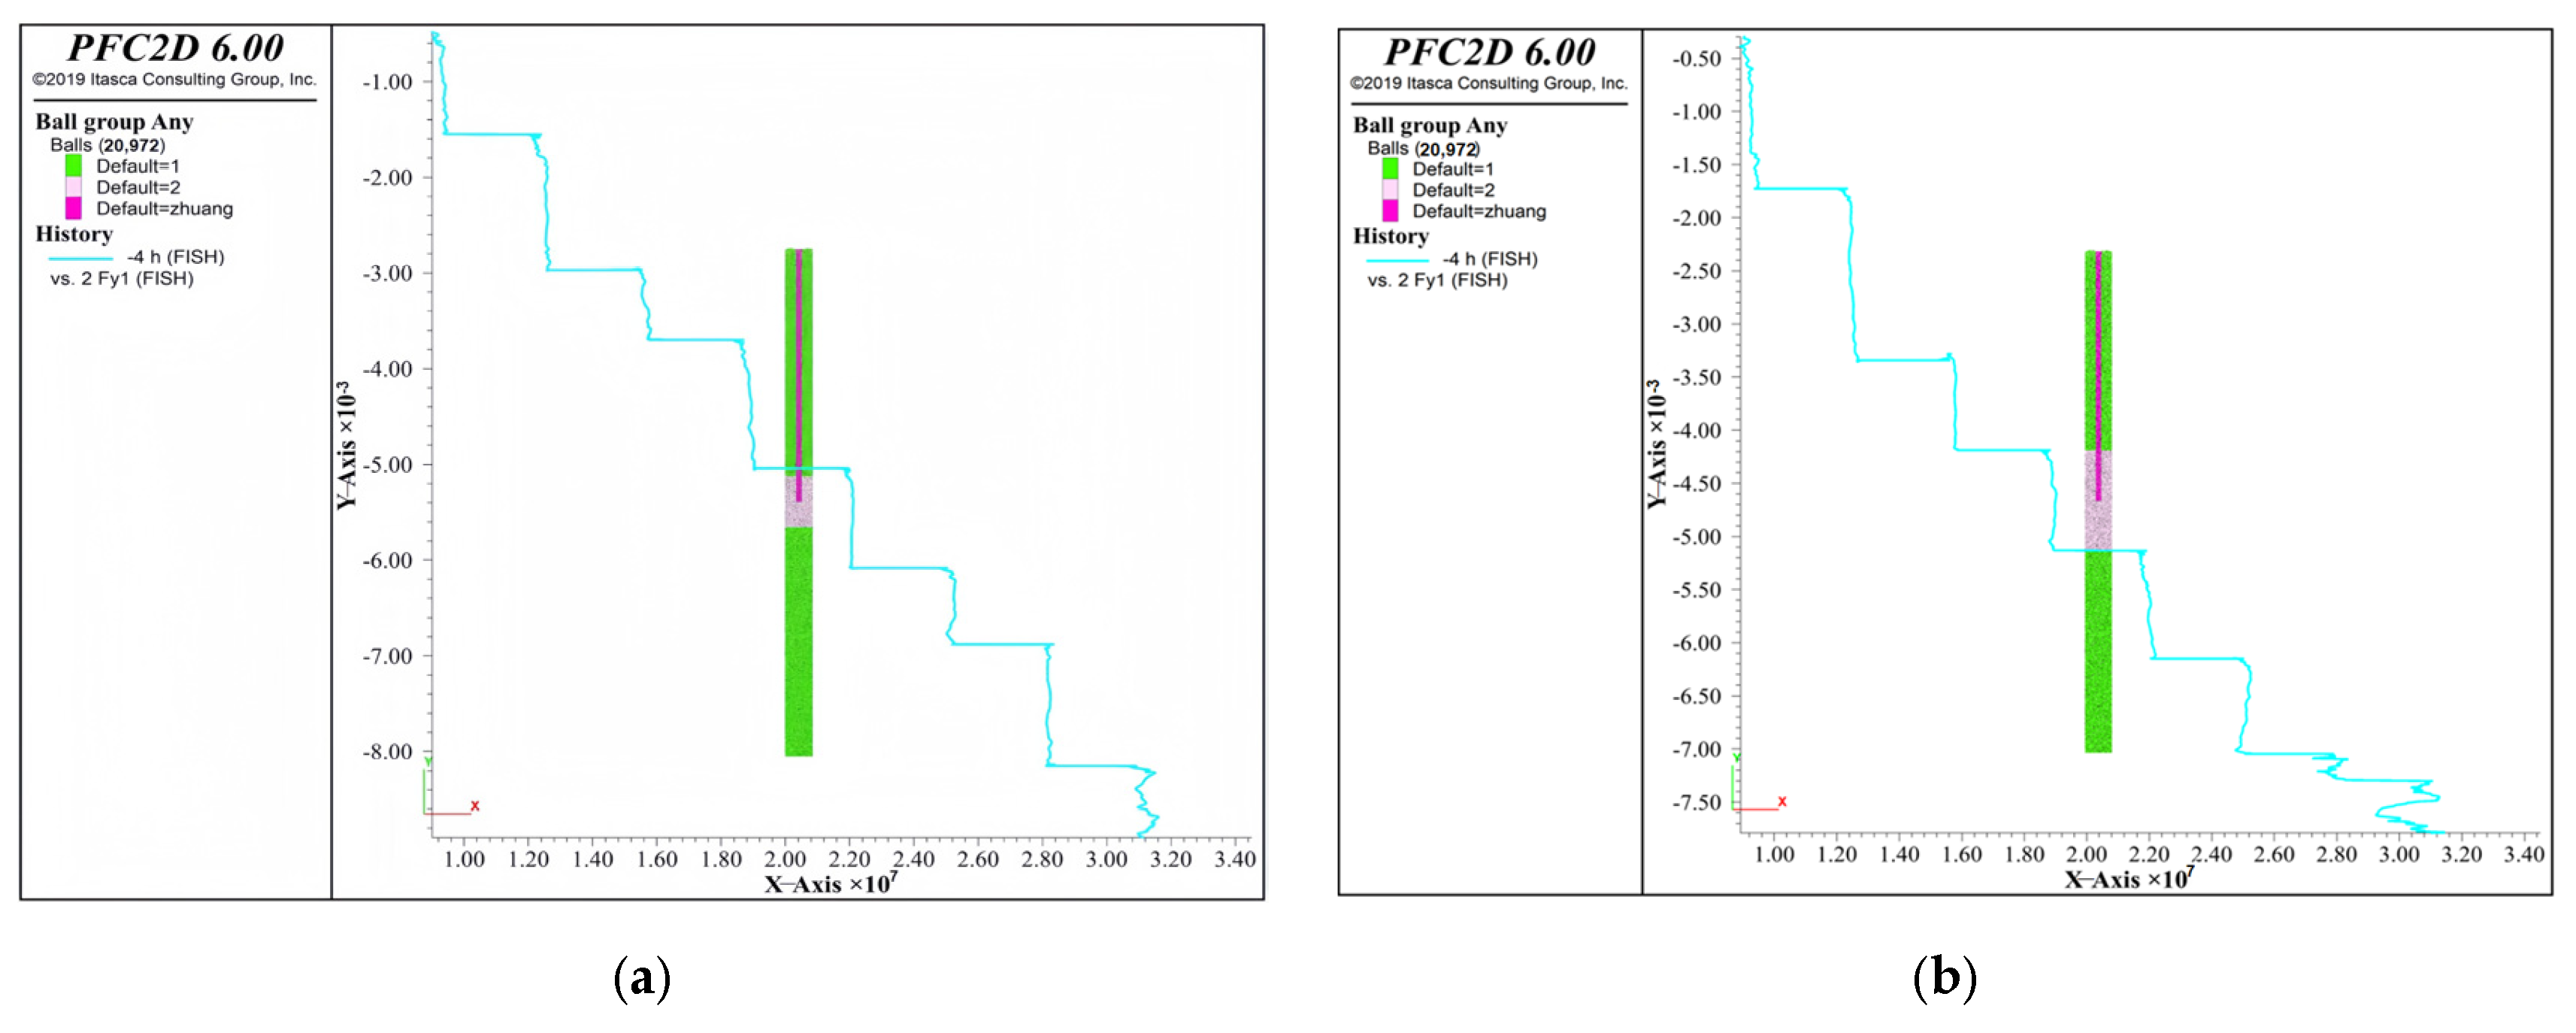
Establish discrete element models for friction piles with pile lengths of 88 m, 108 m, and 118 m in peat soil layers to investigate the effect of pile length on the vertical bearing characteristics of friction piles, while keeping other pile design parameters constant. Figure 22 shows the vertical displacement of the soil around the pile.
As shown in Figure 22, the displacement of friction piles increases with pile length, reaching 0.64 m, 0.61 m, and 0.31 m, respectively, consistent with the results obtained from finite element simulations. Specifically, pile settlement increases with pile length. As pile length increases, the displacement of soil particles within the pile body also increases. However, once the pile reaches a critical length, further increases in pile length have a negligible effect on improving the bearing capacity of the pile foundation.

4.2.3. Influence of Pile Diameter in Peat Soil

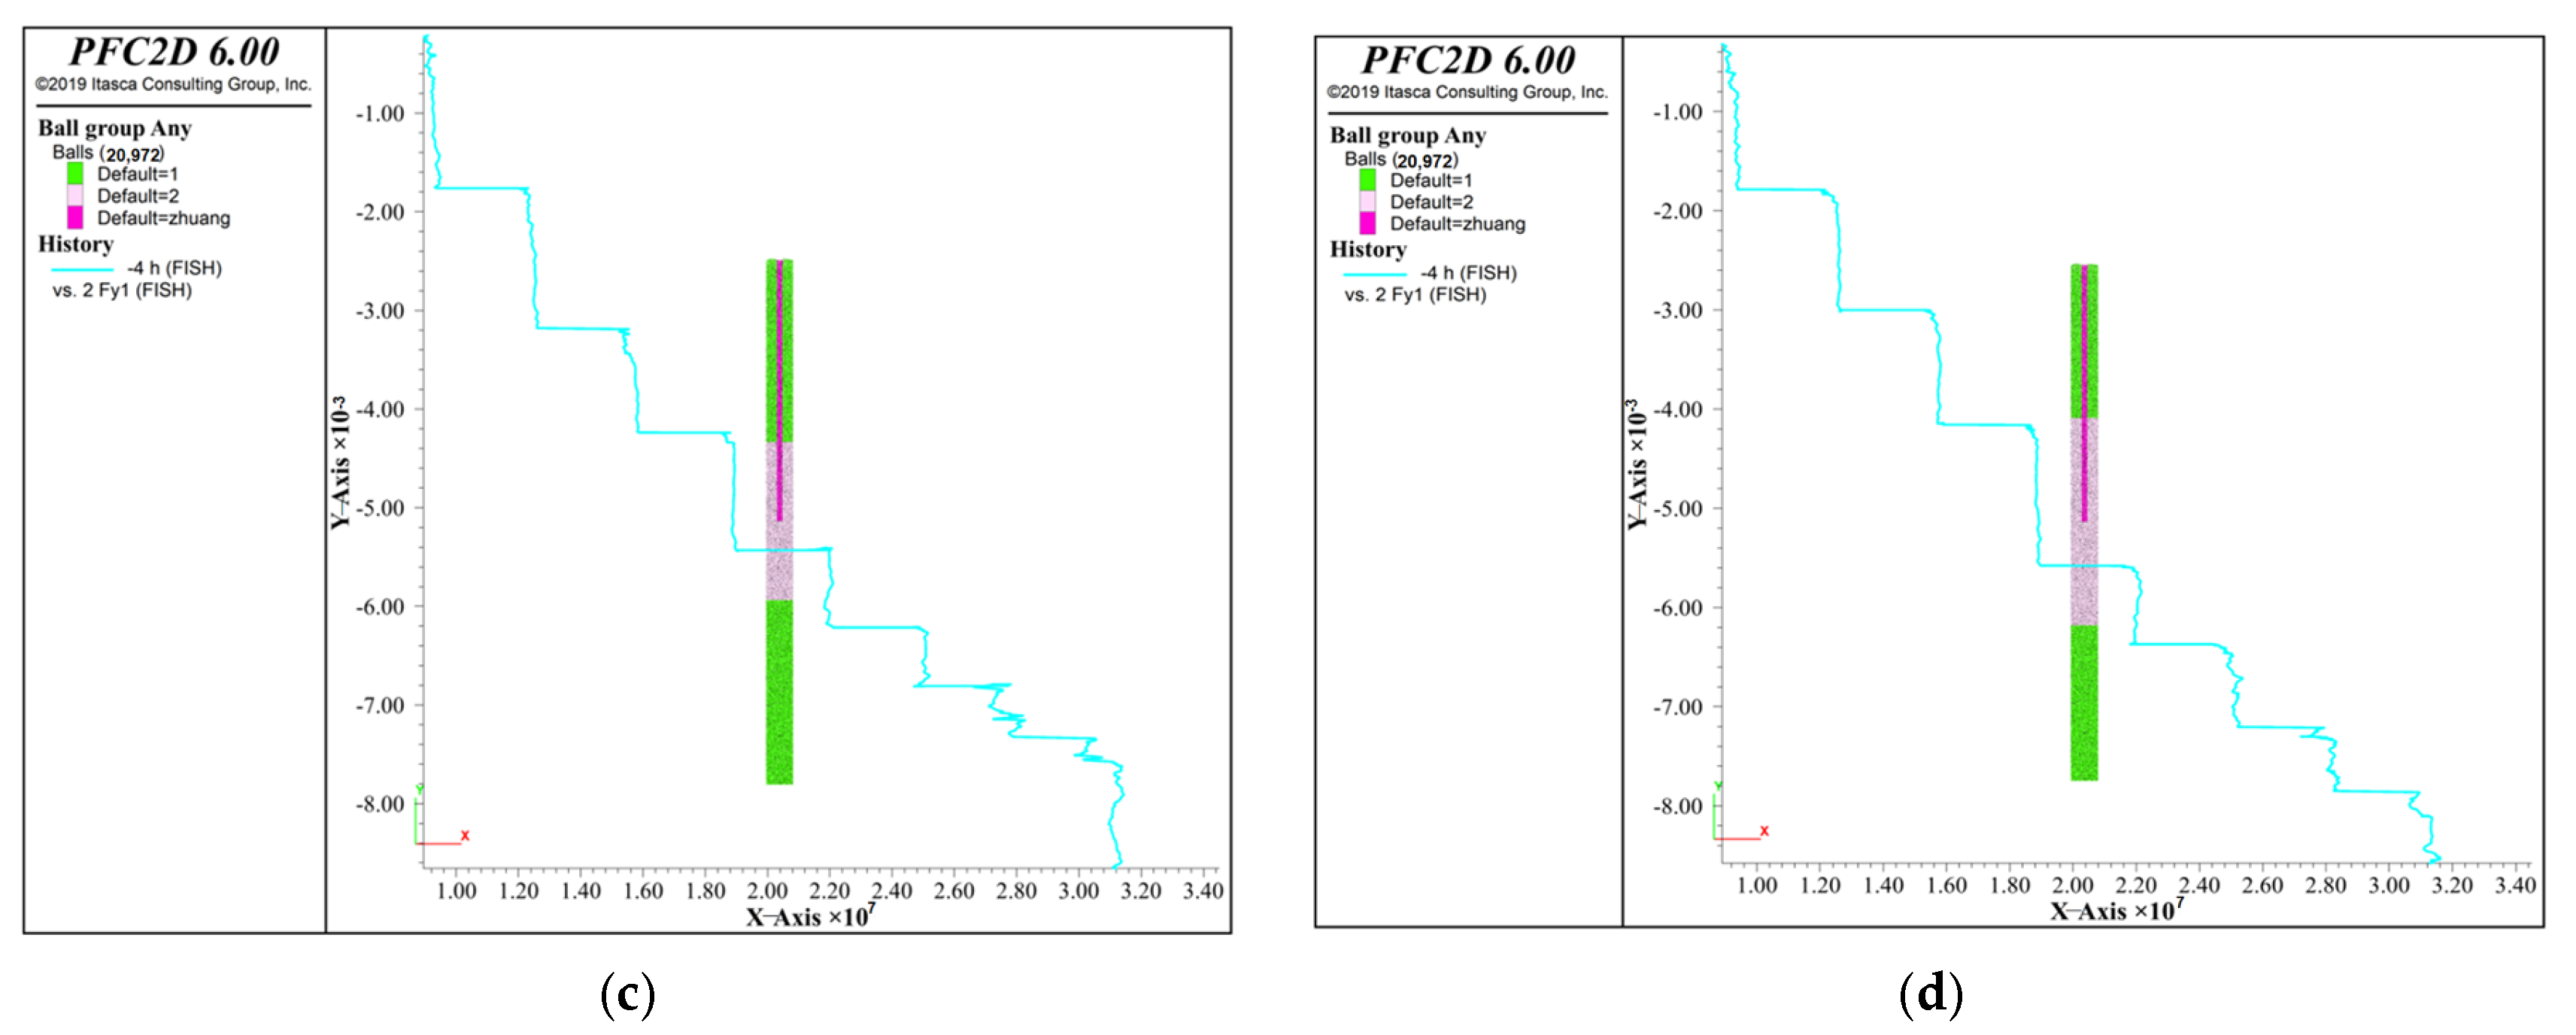
Establish discrete element models for four friction piles with diameters of 1 m, 1.5 m, and 2 m in peat soil layers to investigate the influence of pile diameter on the vertical bearing characteristics of friction piles, while keeping other pile design parameters constant. Figure 23 shows the vertical displacement of the soil around the pile.
As shown in Figure 23, As the pile diameter increases, the displacement of soil particles in the friction pile decreases to 0.32 m, 0.28 m, and 0.197 m, respectively, consistent with the results obtained from finite element simulations.

4.2.4. Summary

A total of ten working conditions were simulated. Three working conditions were analyzed for pile length and pile diameter, while four working conditions were analyzed for soft layer thickness. The summary is presented in Table 11.
According to the results obtained from the discrete element model simulation, the conclusions reached are consistent with those from the finite element simulation.

5. Discussion

This study combines finite element modeling (FEM) with discrete element modeling (DEM) to analyze the bearing characteristics of ultra-long, large-diameter piles in complex geological formations. Key findings reveal that finite element simulations demonstrate increased pile bearing capacity with larger pile diameters and greater pile lengths. while discrete element modeling further reveals that soil particle displacement around the pile exhibits a “superficial dispersion and deep aggregation” pattern as pile diameter and length increase. The results from both simulation methods corroborate each other, quantifying the influence of pile diameter from a macromechanical perspective while elucidating the underlying mechanisms at the microscopic particle level. This provides multidimensional support for related engineering design and theoretical research.
Regarding the complementarity of simulation methods: Finite element simulation, leveraging its efficiency in modeling continuous media, precisely captures the macro-mechanical response between pile foundations and soil. As pile diameter increases, both pile stiffness and bearing area grow synchronously, leading to more uniform stress distribution within the pile and surrounding soil while mitigating stress concentration—consistent with predictions from soil mechanics’ continuous medium theory. Discrete element simulation, however, overcomes the limitations of the continuous medium assumption by clearly revealing the microscopic movement patterns of soil particles: at small pile diameters (<800 mm), the compaction effect of pile penetration on surrounding particles is concentrated near the surface, leading to high particle dispersion and disordered displacement; when the pile diameter increases to 1000 mm, the squeezing stress propagates deeper, forming an ordered stress system among particles with a significantly reduced displacement range. This microscopic mechanism also provides a rational explanation for the macroscopic phenomenon of the “critical bearing capacity threshold” observed in finite element simulations. The combination of these two methods achieves dual verification through “macroscopic mechanical quantification + microscopic mechanism analysis,” avoiding the potential limitations of a single simulation approach.
The limitations of this study must be objectively stated: the simulation process did not account for the nonlinear rheological properties of the soil or damage effects during pile construction, and the particle model in the discrete element simulation simplified the complex composition of actual soil. Furthermore, the simulation was limited to a single soil type (peaty soil) and did not address composite soils or special geological conditions. Future research should incorporate soil rheological constitutive models, optimize discrete element particle parameters, and extend simulations to diverse geological scenarios. Integrating field prototype experiments to validate results will further enhance the accuracy of this simulation method in pile foundation engineering.
In summary, this study employs a synergistic analysis of finite element and discrete element simulations to clarify the influence patterns of pile length, pile diameter, and soft layer thickness on macro- and micro-scale mechanical responses of pile foundations. The findings not only provide multidimensional data support for optimizing pile diameter design but also establish a reference paradigm for applying the “finite element-discrete element coupled simulation method” in similar engineering problems. This holds significant theoretical value and practical significance for enhancing the scientific rigor and safety of pile foundation engineering design.
6. Conclusions

This paper analyzes the bearing characteristics of extra-long, large-diameter piles based on in situ static load tests. By integrating numerical simulations, it investigates the influence of parameters such as weak layer thickness, pile length, and pile diameter on the bearing capacity of extra-long piles in peat soils. The following conclusions are drawn:
  • The results of the static load test indicate that the Q-s curve of the extra-long piles exhibits a steep decline at the ultimate load, with a distinct failure characteristic point, and the ultimate bearing capacity is uniformly 28,800 kN. The lateral friction force at the pile side shows a typical “triangular” distribution in the upper section, reaching its maximum value in the middle section, where it exhibits an “R”-shaped distribution with multiple hump-like peaks. Notably, the T1 test pile demonstrated softening of lateral friction resistance.
  • The three-dimensional numerical model of pile foundations established based on static load tests demonstrated a discrepancy of only 1.27 mm between simulated and measured values, validating the model’s validity. Test results indicate that all ultra-long test piles exhibit end-bearing friction characteristics.
  • The thickness of the weak layer significantly affects the bearing capacity of extra-long piles: the thinner the layer, the greater the bearing capacity. As thickness increases, settlement rises sharply; beyond a critical thickness, bearing capacity no longer decreases. Pile tip resistance first increases then decreases with thickness, with a critical thickness at which pile tip resistance reaches its maximum value.
  • Pile length variation has a negligible impact on the bearing capacity of extra-long piles: As pile length increases, settlement decreases progressively, with the curve exhibiting a linear gradient. Once pile length reaches a certain threshold, the load–settlement curve changes minimally. This indicates that within this range, further increasing pile length cannot reduce settlement. Blindly extending pile length offers no significant benefit for enhancing bearing capacity. Pile tip resistance initially increases with length before decreasing.
  • Increasing pile diameter significantly enhances the bearing capacity of extra-long piles: larger diameters increase both the pile base area and lateral surface area, thereby boosting lateral friction resistance. As pile diameter increases, settlement at the pile top gradually flattens and decreases. A critical pile diameter exists beyond which further increases have negligible impact on bearing capacity. Pile tip bearing capacity increases with pile diameter.

Author Contributions

Software, H.L.; Data curation, K.L.; Writing—original draft, H.L.; Writing—review & editing, A.C.; Project administration, K.L. All authors have read and agreed to the published version of the manuscript.

Funding

This research was funded by China Power Engineering Consulting Group Central South Survey and Design Institute Co., Ltd., Grant No. 2025530103002732 and no funding for page charges.

Data Availability Statement

The original contributions presented in the study are included in the article, further inquiries can be directed to the corresponding author.

Conflicts of Interest

Author Kewen Liu was employed by the company Yunnan Jiantou First Survey and Design Co., Ltd., Kunming, Yunnan 650000, China. The remaining authors declare that the research was conducted in the absence of any commercial or financial relationships that could be construed as a potential conflict of interest.

References

  1. Jiang, J.P.; Shi, D.D.; Liu, W.B. Pile Engineering; Shanghai Jiao Tong University Press: Shanghai, China, 2016. [Google Scholar]
  2. JGJ 94-2008; Technical Code for Building Pile Foundations. China Architecture & Building Press: Beijing, China, 2008.
  3. Sun, J. Research on Key Geotechnical Engineering Problems and Settlement Control of Super High-Rise Buildings in Soft Soil Areas. Shanghai Land Resour. 2024, 45, 53–57+68. [Google Scholar]
  4. Wu, J.B.; Wang, A.D.; Huang, Y.T.; Wei, J.B. Experimental Study on Optimal Design of Super-Long Bored Piles for Super High-Rise Buildings in Soft Soil Stratum. J. Build. Struct. 2023, 44, 367–374. [Google Scholar]
  5. Fang, Y.F.; Wang, Y.; Sun, H.W. Design and Data Analysis of Static Load Test for Super-Long Bored Piles of Guo Rui Xi’an International Finance Center. Build. Struct. 2016, 46, 99–104. [Google Scholar]
  6. Sun, M.; Geng, G.Q.; Cao, J.J. Rationality Analysis of Static Load Test Results of Super-Long Bored Piles in Nanjing Soft Soil Area. Jiangsu Constr. 2025, 1, 90–94. [Google Scholar]
  7. Zhao, S.F.; Huang, G.L.; Ma, S.Q.; Cui, R.F.; Xiong, B.T. Experimental Study on Bearing Characteristics of Super-Long Bored Piles in Hexi Area of Nanjing. J. Liaoning Tech. Univ. (Nat. Sci. Ed.) 2018, 37, 352–359. [Google Scholar]
  8. Zhao, C.F.; Li, J.; Qiu, Z.X.; Zhao, C.; Zou, Y.W. Experimental Study on Load Transfer Behavior of Large-Diameter Super-Long Bored Piles in Guangdong Area. Chin. J. Rock Mech. Eng. 2015, 34, 849–855. [Google Scholar]
  9. Cao, W.Z.; Yang, Z.Y.; Cai, Q.L.; Gao, L. Analysis of Influence of Surcharge Load on Pile Side During Static Load Test of Super-Long Pile in Soft Soil Foundation. J. Archit. Civ. Eng. 2021, 38, 1–10. [Google Scholar]
  10. Wang, W.D.; Wu, J.B.; Nie, S.B. Field Test Study on Large-Diameter Rock-Socketed Piles of Wuhan Greenland Center. Chin. J. Geotech. Eng. 2015, 37, 1945–1954. [Google Scholar]
  11. Wang, J.Y.; Tang, H.; Xu, J. Experimental Study on Bearing Behavior of Super-Long Bored Piles in Wuhan Riverside Area. Eng. J. Wuhan Univ. 2024, 57, 178–186. [Google Scholar]
  12. Wang, X.F.; Li, A.X.; Hou, J.; Li, Y.X.; Wang, Z.M. Static Load Test Analysis of Large-Diameter Super-Long Bored Piles. Shanxi Archit. 2025, 51, 58–62. [Google Scholar]
  13. Li, W. Discussion on Selection of Calculation Parameters for Bearing Capacity of Rock-Socketed Piles in Soft Rock Area. Jiangsu Constr. 2017, 3, 86–88. [Google Scholar]
  14. Li, T.T.; Han, Y.T.; Liu, Y.C.; Yuan, Z.Y. Study on Test and Bearing Mechanism of Super-Long Piles in Tianjin Soft Soil Area. Build. Sci. 2022, 38, 90–96. [Google Scholar]
  15. Liu, X.J.; Zhang, J.L. Study on Bearing Mechanism of Large-Diameter Super-Long Bored Piles in Reclamation Area. Constr. Technol. 2016, 45, 107–110. [Google Scholar]
  16. Wang, Z.M.; Zhou, J.; Song, J.; Yang, L.; Zhao, X.H.; Xu, S. Numerical Simulation Study on Ultimate Compressive Bearing Capacity of Large-Diameter Super-Long Rock-Socketed Piles. Civ. Eng. Green Build. 2025, 1, 131–134. [Google Scholar]
  17. Xiao, L.; Du, F.L.; Zhao, M.R.; Gao, W.S.; Wang, T.; Jiang, H.L. Field Test Study on Bearing Capacity and Deformation Characteristics of Large-Diameter Ultra-Long Rock-Embedded Piles. Chin. J. Geotech. Eng. 2025, 1–9. [Google Scholar]
  18. Duan, C.; Wang, Z.H.; Dai, G.L.; Guo, Z.L.; Hu, T. Experimental Study on Basic Properties of Coral Reef Limestone and Vertical Bearing Characteristics of Post-Grouted Rock-Embedded Piles. J. Rock Mech. Eng. 2025, 44, 721–736. [Google Scholar] [CrossRef]
  19. Jin, R.; Guo, F.; Xu, N.; Li, J.; Ma, Q.; Chen, J.; Cai, Y.; Guo, P. Laboratory Model Test Study on Bearing Characteristics of Super-Long and Large-Diameter Post-Grouting Piles in Clay Stratum. Buildings 2025, 15, 3038. [Google Scholar] [CrossRef]
  20. He, L.L.; Liu, X.; Xie, Y.S.; Liang, Y.; Liu, M.W. Study on complex failure modes of super-long piles in deep-water and soft-clay seabed under multiple combined loads. Ocean. Eng. 2025, 43, 174–185. [Google Scholar] [CrossRef]
  21. Nguyen, T.; Ly, D.K.; Huynh, T.Q.; Nguyen, T.T. Soft computing for determining base resistance of super-long piles in soft soil: A coupled SPBO-XGBoost approach. Comput. Geotech. 2023, 162, 105707. [Google Scholar] [CrossRef]
  22. Hu, T.; Dai, G.; Wan, Z.; Gong, W.; Fang, B. Field study of the effects of composite excavation and combined grouting on the response of large-diameter and superlong rock-socketed bored piles. Acta Geotech. 2023, 19, 1853–1871. [Google Scholar] [CrossRef]
  23. Elsawwaf, A.; El Naggar, H.; Choksi, F.A.; Amin, H. Predicting the lateral capacity of short step-tapered and straight piles in cohesionless soils using an FE-AI hybrid technique. Ocean Eng. 2025, 338, 121941. [Google Scholar] [CrossRef]
  24. Gao, Q.; Hu, Q.; Zhang, J.; Ren, Z.; Liu, C.; Liu, J.; Wang, S.; Cheng, G.; Zhang, R.; Ren, C. Experimental study on wall-protecting mud modification of super-long bored piles in the alluvial plain region of the Yellow River. Constr. Build. Mater. 2023, 368, 130395. [Google Scholar] [CrossRef]
  25. Xiao, K.; Guo, S.; Wen, J.; Han, J.; Yang, X. Three-Stage Analysis Method for Calculating the Settlement of Large-Diameter Extralong Piles. Int. J. Geomech. 2023, 23, 04023001. [Google Scholar] [CrossRef]
  26. Xu, Z.; Liang, C.; Jiang, Y.; Liu, R. A correction method for unit internal skin friction of super-large diameter open-ended monopiles in clay. Ocean. Eng. 2025, 337, 121891. [Google Scholar] [CrossRef]
  27. Yuan, Z.; Liang, F.; Zhang, H. Centrifuge model tests on scoured offshore wind turbines with large-diameter semi-rigid monopiles. Soil Dyn. Earthq. Eng. 2025, 194, 109348. [Google Scholar] [CrossRef]
  28. He, W.; Takahashi, A. Dynamic response analysis of monopile-supported offshore wind turbine on sandy ground under seismic and environmental loads. Soil Dyn. Earthq. Eng. 2025, 189, 109105. [Google Scholar] [CrossRef]
  29. Mozaffari, N.; Mesgarnejad, A.; Jhita, P.; McDonald, G. Extended Winkler Model for design of offshore wind turbine large diameter monopiles. Ocean. Eng. 2024, 313, 119619. [Google Scholar] [CrossRef]
  30. Atroush, A.M.; Aboelela, A.; Hemdan, D.E.E. Beyond p-y method: A review of artificial intelligence approaches for predicting lateral capacity of drilled shafts in clayey soils. J. Rock Mech. Geotech. Eng. 2024, 16, 3812–3840. [Google Scholar] [CrossRef]
  31. Wan, Z.H.; Duan, C.; Hu, T.; Zhou, F.; Dai, G.L. Field Study on Bearing Capacity of Large-Diameter Rock-Socketed Bored Piles with Combined Grouting in Highly Weathered Rock Layers. Rock Mech. Rock Eng. 2024, 57, 8701–8722. [Google Scholar] [CrossRef]
  32. Xue, Z.N.; Tian, Y.Q.; Dong, Y.Q.; Zhou, Z.J. Study on Value of Side Friction Resistance of Bored Piles in Loess Area Considering Influence of Slenderness Ratio. J. Highw. Transp. Res. Dev. 2022, 39, 67–74+85. [Google Scholar]
  33. Kui, J.G.; Wu, Z.X.; Shang, X.C. Study on Pile Foundation Characteristics of Super-Long Bored Piles in Lanzhou Large-Thickness Collapsible Loess Area. Jiangxi Build. Mater. 2025, 6, 272–274. [Google Scholar]
  34. Liu, S.S.; Jiang, X.L.; Li, Z.Y. Numerical Calculation Method for Bearing Capacity of Super-Long Piles in Karst Foundation. Adv. Sci. Technol. Water Resour. 2013, 33, 27–32. [Google Scholar]
  35. Hu, C.M.; Fan, X.Y.; Li, H.; Wang, X.D.; Li, H.R. Study on Bearing Behavior and Mechanical Mechanism of Super-Long Piles in Water-Rich Sand Layer. J. Wuhan Univ. Technol. (Transp. Sci. Eng. Ed.) 2025, 49, 1124–1130. [Google Scholar]
  36. Zhang, Z.G. Test on Bearing Characteristics of Super-Long Piles for High-Speed Railway Bridges in Deep Volcanic Ash Accumulation Area. Railw. Eng. 2025, 65, 71–76. [Google Scholar]
  37. Kang, Z.X. Static Load Test Study on Bearing Characteristics of Super-Long Large-Diameter Piles in Deep Sand Layer. Shanxi Archit. 2024, 50, 55–59+63. [Google Scholar]
  38. Jiang, Z.W. Numerical Simulation Analysis of Super-Long Pile Foundation Settlement Under Complex Geological Conditions. Chongqing Archit. 2024, 23, 57–60. [Google Scholar]
  39. Liang, H.Y.; Ye, H.B.; Wang, Z.; Xu, Y. Numerical Simulation Study on Bearing Mechanism of Large-Diameter Super-Long Piles in Deep Soft Soil. Shanxi Archit. 2024, 50, 55–59. [Google Scholar]
  40. Boelter, D.H. Important physical properties of peat materials. In Proceedings of the Third International Peat Congress, Quebec, QC, Canada, 18–23 August 1968; pp. 150–156. [Google Scholar]
  41. Chen, Y.T.; Cai, R.G. Study on Load Transfer Characteristics of Engineering Piles in Kunming Ancient Dian Lake Lacustrine and Alluvial Layers. Miner. Resour. Geol. 2021, 35, 537–548. [Google Scholar]
  42. Fu, L.J.; Bai, X.Y.; Zhang, Y.M.; Xu, F.L.; Hu, J. Comparative Study on Bearing Performance of PHC Pipe Piles and Cast-in-Place Piles in Coastal Complex Stratum. J. Shandong Agric. Univ. (Nat. Sci. Ed.) 2025, 56, 495–504. [Google Scholar]
  43. Gui, Y.; Yu, Z.H.; Liu, H.M.; Cao, J.; Wang, Z.C. Secondary consolidation characteristics and mechanism analysis of plateau lacustrine peat soil. Chin. J. Geotech. Eng. 2015, 37, 1390–1398. [Google Scholar]
  44. Gui, Y.; Fu, J.; Hou, Y.J.; Cao, J.; Zhou, Y.D. Direct shear strength characteristics and mechanism of highly decomposed peat soil. J. Hohai Univ. (Nat. Sci.) 2016, 44, 418–426. [Google Scholar]
  45. Gui, Y.; Yu, Z.H.; Liu, H.M.; Cao, J.; Wang, Z.C. Experimental Study on the Variation Patterns of Consolidation Coefficients in Highland Lacustrine Peat Soils. Chin. J. Rock Mech. Eng. 2016, 35, 3259–3267. [Google Scholar]
  46. Gui, Y.; Fu, J.; Wu, C.K.; Cao, J.; Gao, Y.F. Permeability characteristics and mechanism analysis of plateau lacustrine peat soil. Rock Soil Mech. 2016, 37, 3197–3207. [Google Scholar]
  47. Edil, T.B.; Wang, X. Shear strength and K0 of peats and organic soils. In Geotechnics of High Water Content Materials; ASTM International: West Conshohocken, PA, USA, 2000. [Google Scholar]
  48. Yang, L. Field Test Study on Load Transfer Behavior of Large-Diameter Super-Long Bored Piles. Urban Mass Transit 2017, 20, 117–122. [Google Scholar]
  49. Dong, W.Q.; He, J.; Ming, C. Design and Bearing Characteristics Study of Large-Diameter Super-Long Bored Piles for Kunming Jingcheng Mansion. Build. Struct. 2020, 50, 106–113. [Google Scholar]
  50. Jiang, J.P.; Gao, G.Y.; Gu, B.H. Comparative Experimental Study on Enlarged-Base Piles, Wedge-Shaped Piles, and Constant-Diameter Piles. Chin. J. Geotech. Eng. 2003. [Google Scholar]
  51. Yang, G.L.; Chen, S.H.; Lin, Y.L. Comparative Experimental Study on Large-Diameter Enlarged-Base Piles and Constant-Cross-Section Piles. J. Railw. Sci. Eng. 2009, 6, 34–37+42. [Google Scholar]
  52. Liu, W.; Liu, Y. Comparative Study of Drilled Piles and Prestressed Pipe Piles at a Power Plant in Guangdong. J. Build. Sci. 2012, 28, 206–209. [Google Scholar]
Figure 1. Stratigraphic Profile.
Buildings 15 04294 g001
Figure 2. Diagram of Reaction Device.
Buildings 15 04294 g002
Figure 3. Static load test stacking diagram.
Buildings 15 04294 g003
Figure 4. Site Construction Drawings. (a) Hardened ground and pre-installed steel casings. (b) Borehole Formation Process.
Buildings 15 04294 g004
Figure 5. Drilling Fluid Mixing Test.
Buildings 15 04294 g005
Figure 6. Hoisting and aligning steel reinforcement cages.
Buildings 15 04294 g006
Figure 7. Q-s Curves for Test Piles.
Buildings 15 04294 g007
Figure 8. The curve showing the variation of the shaft friction of three test piles with the soil burial depth. (a) T1 pile. (b) T5 pile. (c) T6 pile.
Buildings 15 04294 g008
Figure 9. Distribution Curves of Base Resistance under Different Loading Levels.
Buildings 15 04294 g009
Figure 10. Comparison Chart of Four T1 Test Pile Models with Actual Measurement Curves.
Buildings 15 04294 g010
Figure 11. Finite Element Pile–Soil Mode.
Buildings 15 04294 g011
Figure 12. Numerical simulation stress contour plots. (a) Pile-soil displacement profile contour plot; (b) Simulated pile tip resistance contour plot.
Buildings 15 04294 g012
Figure 13. Actual vs. Simulated Load–Settlement Curve Diagram.
Buildings 15 04294 g013
Figure 14. Discrete Element Model Graphics. (a) Pile–Soil Model; (b) Pile-Surrounding Displacement Contour Map.
Buildings 15 04294 g014
Figure 15. Load–Settlement Curve Diagram for Different Weak Interlayer Thicknesses.
Buildings 15 04294 g015
Figure 16. Contour Map of Pile Tip Bearing Capacity at Load Termination for Different Weak Layer Thicknesses. (a) Condition 1. (b) Condition 2. (c) Condition 3.
Buildings 15 04294 g016
Figure 17. Load–Settlement Curve Diagram for Different Pile Lengths.
Buildings 15 04294 g017
Figure 18. Contour Map of Pile Tip Bearing Capacity at Termination of Loading for Different Pile Lengths. (a) L = 108 m. (b) L = 98 m. (c) L = 88 m.
Buildings 15 04294 g018
Figure 19. Load–Settlement Curve Diagram for Different Pile Diameters.
Buildings 15 04294 g019
Figure 20. Contour Map of Pile Tip Bearing Capacity at Termination of Loading for Different Pile Diameters. (a) D = 0.5 m. (b) D = 1.0 m. (c) D = 1.5 m. (d) D = 2.0 m.
Buildings 15 04294 g020
Figure 21. Stratigraphic Thickness Load Settlement Curve Cloud Map for Different Weak Layers. (a) Condition 1. (b) Condition 2. (c) Condition 3. (d) Condition 4.
Buildings 15 04294 g021aBuildings 15 04294 g021b
Figure 22. Displacement Contour Map of Soil Around Piles at Different Pile Lengths During Termination of Loading. (a) L = 118 m. (b) L = 108 m. (c) L = 88 m.
Buildings 15 04294 g022
Figure 23. Displacement Contour Maps of Soil Around Piles at Different Diameters During Termination of Loading. (a) D = 2.0 m. (b) D = 1.5 m. (c) D = 1.0 m.
Buildings 15 04294 g023
Table 1. End Resistance and Lateral Resistance for Different Pile Types.
Pile TypePile Length/mPile Diameter/mmUltimate Load/kNCumulative Settlement Value/mmTerminal Resistance Ratio/%Lateral Resistance Ratio/%
SJ-143100022,80021.843.296.8
T198100028,800107.337.892.2
SD2Bottom-expanded pile7280096002.2088.411.6
Wedge pile8.2600265018.8322.377.7
End-bearing friction pile7.1800157550.1666.6633.4
Pure friction pile6.3800720-0100
Large-diameter enlarged-diameter piles16100083002.53--
Constant-cross-section pile231000700050.05--
Drilled Piles35100010,000-5247.5
PHC pile356003600---
Table 2. Comparison Table of Four T1 Test Pile Models with Actual Load–Settlement Data.
Load/(kN)Actual Settlement/mmHyperbolic Model Settlement/mmLinear Model Settlement/mmTriple-Line Model Settlement/mmDouble-Hedged Model Settlement/mm
000−7.3100
64009.313.474.957.687.79
960012.785.7711.0911.5211.69
12,80015.588.6317.2215.3515.58
16,00018.5112.2823.3519.1919.33
19,20023.0317.1129.4823.0323.07
22,40026.8223.7935.6138.4726.82
25,60030.5733.6541.7453.9146.14
28,80036.6249.6347.8769.3565.47
32,00084.7980.0654.0184.7984.79
Table 3. Finite Element Simulation Parameter.
Material Typeγ (kN/m−3)E/MpaνC/(kpa)φ/(°)Constitutive Model
Clay19.06.190.387.68.4Mohr–Coulomb
Peaty soil15.35.430.2560.99.1Mohr–Coulomb
C4024.533.50.2--Elastic Model
Table 4. Microscopic Parameter Calibration Values for Discrete Element Models.
ModelParticle DensityE/paKn/ksfcvRn
Particle–Particle28302 × 10920.80.60.20.15
Particle–Wall-2 × 10922.50.6--
Table 5. Parameters for Different Working Conditions.
Soil LayerThickness/m
Working Condition
Condition 1Condition 2Condition 3
⑩ Clay202020
⑨ 2Peaty soil403010
⑩ Clay485878
Table 6. Simulated Single Pile Static Load Test Data for Different Weak Layer Thicknesses.
Weak Interlayer Thicknesses of 40 mWeak Interlayer Thicknesses of 30 mWeak Interlayer Thicknesses of 10 m
Load/kNSettlement/mmLoad/kNSettlement/mmLoad/kNSettlement/mm
000000
640062640061640058
960015096001489600142
12,80025012,80025312,800243
16,00037016,00037216,000360
19,20050019,20050319,200480
22,40064022,40064422,400610
25,60077025,60079425,600750
28,80094028,80095328,800890
32,000147032,000148332,0001380
Table 7. Simulated Single Pile Static Load Test Data for Different Pile Lengths.
L = 108 mL = 30 mL = 10 m
Load/kNSettlement/mmLoad/kNSettlement/mmLoad/kNSettlement/mm
000000
288010.9288010.728809.3
576022.1576021.9576018.7
864035.1864034.6864029.3
11,52049.911,52048.611,52041.5
14,40066.114,40063.714,40054.9
17,28083.517,28079.817,28069.2
20,160102.120,16096.920,16084.4
23,040121.723,040114.823,040100.5
25,920142.225,920133.625,920117.3
28,800163.628,80015328,800134.77
Table 8. Simulated Single Pile Static Load Test Data for Different Pile Diameters.
D = 0.5 mD = 1.0 mD = 1.5 mD = 2.0 m
Load/kNSettlement/mmLoad/kNSettlement/mmLoad/kNSettlement/mmLoad/kNSettlement/mm
00000000
288015.6288010.328808.128806.6
576037.6576020.9576016.2576013.3
864067.2864033.2864024.3864020
11,520103.311,52046.911,52032.811,52026.6
14,40014514,40061.714,40041.814,40033.3
17,280191.717,28077.717,28051.217,28040.2
20,160243.120,16094.720,16060.920,16047.3
23,040298.523,040112.723,04070.823,04054.5
25,920357.825,920131.525,9208125,92061.8
28,800444.528,800151.128,80091.428,80069.2
Table 9. All operating conditions for finite element analysis testing.
Operating Condition NumberPile Length/mPile Diameter/mThickness of Rock and Soil Mass/mThickness of the Weak Layer/mSettlement/mmPile Tip Resistance/kN
A1980.5108401470386.51
A2980.5108301483394.96
A3980.5108101380330.00
B11081.0118118163.6102.93
B2981.0108108153.0106.42
B3881.09898134.7767.80
C1982.010810869.2193.34
C2981.510810891.4141.11
C3981.0108108151.1106.42
C4980.5108108444.559.78
Table 10. Parameters for Different Working Conditions.
Soil LayerThickness/m
Working Condition
Condition 1Condition 2Condition 3Condition 4
⑩ Clay88.278.468.658.8
⑨ 2Peaty soil19.639.258.878.4
⑩ Clay88.278.468.658.8
Table 11. All operating conditions for finite element analysis testing.
Operating Condition NumberPile Length/mPile Diameter/mThickness of Rock and Soil Mass/mThickness of the Weak Layer/m
A1981.019619.6
A2981.019639.2
A3981.019658.8
A4981.019678.4
B11181.0196196
B21081.0196196
B3881.0196196
C1982.0196196
C2981.5196196
C3981.0196196
Disclaimer/Publisher’s Note: The statements, opinions and data contained in all publications are solely those of the individual author(s) and contributor(s) and not of MDPI and/or the editor(s). MDPI and/or the editor(s) disclaim responsibility for any injury to people or property resulting from any ideas, methods, instructions or products referred to in the content.