Article

Finite Element Analysis and Parametric Study on the Push-Out Performance of Shear Connectors in Long-Span Composite Bridges

1
PowerChina Road & Bridge Group Co., Ltd., Beijing 100048, China
2
School of Urban Planning and Municipal Engineering, Xi’an Polytechnic University, Xi’an 710600, China
*
Author to whom correspondence should be addressed.
Buildings 2025, 15(23), 4244; https://doi.org/10.3390/buildings15234244
Submission received: 16 October 2025 / Revised: 14 November 2025 / Accepted: 20 November 2025 / Published: 24 November 2025

Abstract

This study adopts the east approach bridge of the Section II extra-long-span bridge on the Urumqi Ring Expressway (West Line) as an engineering prototype. A three-dimensional nonlinear finite element push-out model of headed stud connectors was developed in ABAQUS/Explicit and validated against existing test data. On this basis, parametric analyses were carried out to investigate the effects of material and geometric parameters on the shear performance of the studs. The results indicate that the load–slip response can be divided into four stages: elastic, plastic-damage development, plateau, and softening. Compared with C50 concrete, UHPC markedly increases the initial stiffness of the connectors and raises the peak shear resistance by approximately 30–40%. For the smallest stud diameter, the ductility decreases by up to about 10% and the post-peak degradation becomes more rapid, i.e., ductility deterioration is more pronounced; this unfavorable effect is particularly significant when small stud diameter is combined with shallow embedment depth. Increasing the stud diameter enhances both stiffness and peak shear resistance, whereas increasing the embedment depth delays post-peak degradation, improves residual capacity and energy dissipation, and promotes a transition in failure mode from concrete-governed failure to ductile bending–shear failure of the stud. Based on these parametric results, a larger stud height-to-diameter ratio is recommended for UHPC composite structures to achieve coordinated optimization of connection stiffness, load-carrying capacity, and ductility performance.

1. Introduction

In steel–concrete composite beams, shear connectors are essential to ensure the composite action between the steel girder and concrete slab. They reliably transfer interface shear forces and restrain relative slip, enabling the section to act integrally and thereby significantly increasing stiffness and load-carrying capacity, reducing deflection, and improving dynamic and fatigue performance [1,2,3]. The dimensions, spacing, embedment depth, material properties, and interface characteristics of the connectors govern the load–slip relationship and shear stiffness, which in turn affect composite action and control the load-transfer path and failure evolution. Accordingly, the rational configuration of studs can ensure effective steel–concrete interaction, suppress slip and internal force redistribution caused by concrete shrinkage/creep, and thus improve the stability of load-carrying performance [4,5,6].
With the advancement of accelerated bridge construction (ABC), UHPC—owing to its high strength, low permeability, and fiber-reinforced toughness—enables thin full-depth deck panels and compact field-cast joints (pockets/shear keys) while maintaining global stiffness and durability. This allows narrower joints, reduced anchorage/lap lengths, and more efficient interface force transfer, thereby simplifying steel–concrete connection details and improving long-term service performance [7,8]. Under accelerated curing conditions (e.g., 90 °C steam curing for 48 h), UHPC exhibits rapid early-age strength development, with compressive strength reaching approximately 180 MPa [9,10]. Combined with its excellent workability, UHPC is suitable for both precast fabrication and rapid field casting/closure, substantially shortening construction time and traffic disruption. Compared with conventional concrete, UHPC demonstrates significantly lower permeability and superior resistance to chloride penetration, freeze–thaw damage, and chemical attack, allowing reduced section thickness, smaller shear-pocket volumes, and improved durability and fatigue performance [11]. Push-out and fatigue tests further show that studs embedded in UHPC achieve higher initial stiffness and ultimate shear resistance [12]. These advantages make UHPC increasingly attractive for short- and long-term performance of composite structures [13,14,15]. Moreover, finite element studies explicitly modeling stud–UHPC contact and concrete damage evolution have successfully reproduced push-out curves and failure modes of short studs under varying slenderness ratios and restraint conditions, providing numerical support for refining strength formulas and shear-stiffness predictions [16,17].
A substantial number of experimental studies have investigated the static shear performance of studs embedded in UHPC and reported several valuable findings regarding push-out behavior and parameter effects. Fang et al. [1] conducted 18 push-out tests on stud groups embedded in thin (≤100 mm) full-depth UHPC panels and systematically examined the influence of casting method (precast vs. monolithic), stud diameter, slab thickness, shear-pocket geometry, and grouping layout. Their results showed that stud diameter and slab thickness are the most influential parameters for strength and stiffness; casting method has negligible effect under static loading; and appropriate pocket geometry can improve shear transfer. They also reported notable stud-group effects that reduce strength, stiffness, and ductility, and proposed improved formulas for ultimate strength and load–slip modeling. Consistently, the push-out studies by Yang et al. [18] and Zhao et al. [19] demonstrated that UHPC overlay or composite action shifts the failure mechanism from cone-pullout/splitting in normal concrete to combined bending–shear, interface arching, and localized crushing, while significantly increasing initial stiffness and ultimate resistance.
For shear-pocket connections, Fang et al. [20] compared the static shear performance of various precast UHPC pocket details and revealed the direct influence of pocket geometry on load transfer and failure modes. Fang et al. [21] further investigated rubber-sleeved studs embedded in UHPC pockets, showing that the sleeves promote stress redistribution and improve ductility, though a balance must be sought between strength and construction complexity. At the interface level, Geng et al. [22] demonstrated using precast UHPC–cast-in-place concrete composite specimens that surface roughening and construction methods significantly influence shear–bending interaction, thereby affecting global structural behavior and crack development.
Regarding fatigue and durability, Gyawali et al. [23] conducted comparative static–fatigue push-out tests on studs in UHPC composite girders, quantifying stiffness degradation, strength reduction, and residual performance under cyclic loading. Zhang et al. [24] examined the static and fatigue behavior of rubber-sleeved studs in field-cast UHPC joints, confirming their feasibility and applicability boundaries. For the special case of short studs, Wei et al. [25] and Fang S. [26] revealed the coupled influence of stud slenderness and UHPC matrix strength on load capacity, stiffness, and ductility, suggesting that existing design equations require targeted modification for UHPC applications.
In summary, existing studies indicate that the performance of studs in steel–UHPC composite systems is primarily affected by diameter, slab thickness, pocket geometry, and group effects. However, compared with typical slenderness conditions, research on short studs with h/d < 4 remains limited, particularly concerning the balance between strength enhancement and ductility reduction. Therefore, this study uses an actual engineering project as background and develops a three-dimensional finite element push-out model in ABAQUS 2023 (Dassault Systèmes)., validated against experimental results. Material and geometric parameter effects are systematically evaluated, with particular attention to the performance of studs with slenderness ratios slightly below the Eurocode 4 [27] recommendation (h/d > 4). The objective is to assess whether studs in UHPC can simultaneously achieve increased strength/stiffness and adequate ductility, thereby providing guidance for ABC applications involving UHPC webs and low-slenderness studs.

2. Project Overview

This study focuses on the east approach bridge of Section II of the West Line of the Urumqi Ring Expressway, located in the Toutunhe River valley and serving as a key control project within the regional expressway network (see Figure 1 and Figure 2). The site is characterized by low-mountain–valley terrain and a semi-arid climate with large diurnal temperature variations, which imposes higher demands on the volumetric stability and long-term durability of structural materials [28]. To accelerate construction while ensuring service performance, the project adopts an assembled composite deck system comprising precast concrete panels and ultra-high-performance concrete (UHPC) cast within shear pockets. This configuration enhances steel–concrete composite action through an efficient interface load-transfer mechanism and provides realistic material parameters for the finite element modeling in this study. The bridge has an overall length of approximately 859 m and consists of five continuous units with a standard span arrangement of 4 × (3 × 60 m) + 3 × 45 m and an overall deck width of about 19 m. The superstructure consists of steel I-girders, precast deck panels, shear studs, and UHPC-filled shear pockets. The steel girders have a height of approximately 2.75–3.00 m with a spacing of about 3.3 m, and solid-web or truss-type diaphragms are installed within the spans to enhance transverse integrity and lateral buckling resistance. The precast panels are about 0.25 m thick with an exterior cantilever length of 1.25 m; shear pockets are reserved at the girder locations, corresponding to pre-welded studs on the top flange. After UHPC casting, a primary interface load-transfer path of “steel flange–shear studs–UHPC–precast slab” is formed, satisfying the stiffness and durability requirements under Class I highway loads [29], temperature gradients, and shrinkage-induced deformations.
In terms of structural design, the steel–concrete composite girder is divided into main girders and cross-beams. To facilitate fabrication while satisfying design requirements and ensuring quality, and with due consideration of material supply and equipment ca-pacity, a unitized fabrication strategy is adopted: the main girder is produced in five plate units—the bottom flange plate, top flange plate, web, transverse stiffeners, and web-stiffener plates—whereas the cross-beam is produced in four plate units—the top chord, bottom chord, diagonals, and connection plates. Components of the same unit type are manufactured on dedicated jigs in an assembly line process to achieve standardized procedures, standardized products, and stable quality. The unit subdivision is shown in Figure 3. On the construction side, the project employs factory prefabrication combined with rapid on-site assembly. Preliminary works include qualification of the stud-welding procedure, UHPC mix design and workability tests, and interface pull-out and splitting tests. The main girders and deck panels are fabricated in the plant with shear pockets re-served; full-assembly and trial-fit checks verify pocket alignment and geometric tolerances. During erection, after hoisting and placing the precast panels, the interface is cleaned and roughened; UHPC is then placed in the shear pockets and transverse joints with second-ary consolidation, followed by early-age moist and temperature-controlled curing until the design strength is reached. Throughout the process, key controls include stud verticality and weld-collar formation, pocket and joint dimensional tolerances, beam–slab elevations and joint-width control, arrangement of UHPC flow paths and venting channels, and strategies for mitigating early-age shrinkage. These measures ensure assembly accuracy and interface load transfer, and they provide a basis for defining the configuration param-eters and boundary conditions of the push-out test models.
From a construction perspective, the project adopts a factory-prefabrication and rapid on-site assembly strategy. Preliminary work included welding qualification tests for studs, UHPC mix proportion and workability tests, as well as interface pull-out and splitting tests. The main girders and deck slabs were fabricated in the factory with pre-reserved shear pockets, followed by trial assembly to verify pocket alignment and geometric precision. During on-site installation, after hoisting and positioning the precast slabs, interface cleaning and roughening were carried out before casting UHPC into the pockets and joints, followed by secondary vibration and early-stage moisture and temperature control curing until the design strength was achieved. Critical aspects of quality control included stud verticality and weld formation, pocket and joint dimensional tolerances, girder–slab elevation and gap control, UHPC filling and venting paths, as well as early shrinkage mitigation strategies. These ensured assembly precision and interface load transfer, and also provided engineering input for the construction of the push-out test models.
Introducing UHPC into the deck can significantly improve interface shear capacity, crack resistance and durability, global stiffness, and fatigue performance, while reducing overall self-weight. However, the high strength and relative brittleness of UHPC, together with the toughening effect of steel fibers, markedly alter the failure mechanisms of shear connectors under push-out loading: conventional cone-shaped pull-out or splitting in ordinary concrete evolves into a multi-mechanism mode in which stud bending–shear interaction, interface arching action, and local crushing coexist, thereby influencing shear stiffness, ultimate capacity, and ductility. On this basis, this paper takes the composite structure of the East Approach Bridge as the prototype, develops FE push-out models, and conducts a systematic parametric study, aiming to provide reliable, engineering-scale references for the design of shear connectors in systems incorporating UHPC.

3. Numerical Model Development

3.1. Finite Element Model

In the study of shear connectors in composite beams, the push-out specimen is a commonly used experimental configuration for simulating and evaluating the performance of connectors under realistic conditions. This specimen, specially designed and fabricated, enables the investigation of the shear capacity, deformation characteristics, failure modes, and interaction mechanisms between the connector and concrete, thereby providing essential insights into its mechanical behavior.
In this chapter, a finite element push-out model was developed in ABAQUS, following the modeling approach described in Ref. [30], and reproducing the experimental conditions reported in Ref. [1], including loading method, boundary constraints, and material parameters. The reliability of the model in simulating the mechanical behavior of push-out specimens was validated through comparison with test results.
For engineering applicability, the actual dimensions were simplified as follows: the precast concrete slab has a height of 450 mm and a width of 400 mm, with both vertical and horizontal reinforcement spaced at 100 mm. The I-girder used in the specimen has dimensions of 300 mm (flange width B) × 450 mm (depth H) × 10 mm (web thickness tw) × 15 mm (flange thickness tf), fabricated from Q345 steel. A schematic representation is shown in Figure 4a. Material parameters were obtained from material test reports and are listed in Table 1, while the stud dimensions are given in Table 2.
To improve computational efficiency, a half-model of the push-out specimen was adopted by exploiting geometric and boundary symmetry. The finite element model includes the steel girder, concrete slab, reinforcement, and headed studs, with full consideration of geometric symmetry and material nonlinearity to ensure accuracy and reliability, as illustrated in Figure 4b. The simulations were performed using the ABAQUS/Explicit module, and the analysis procedure included geometric modeling, material definition, and boundary condition assignment. As indicated by Liu [31], the residual stresses induced by stud welding have a negligible influence on stud tensile strength and can be safely ignored; therefore, residual stresses were not included in the present numerical analysis.

3.2. Material Constitutive Models

3.2.1. Constitutive Model for Concrete

The material properties of both UHPC and NC were modeled using the Concrete Damage Plasticity (CDP) model in ABAQUS.
Compressive Constitutive Relationship of UHPC
The material properties of both UHPC and normal concrete (NC) were modeled using the Concrete Damaged Plasticity (CDP) model available in ABAQUS. Based on the parameter recommendations provided in Ref. [32], the specific values of each variable used in the CDP model for this study are listed in Table 3.
To characterize the compressive constitutive relationship of UHPC, the widely adopted model proposed by Yang and Fang [33] is employed (see Equation (1)), as illustrated in Figure 5a. This model has a two-stage form, using the strain ratio ξ = ε / ε 0 (ε is the strain and ε0 is the strain corresponding to the peak stress) and the stiffness ratio α E = E C / E sec (E is the initial elastic modulus, Esec is the secant modulus corresponding to the ultimate compressive strength). The parameters obtained from material tests are as follows: Poisson’s ratio v = 0.209, compressive strength fc = 149.8 MPa, and elastic modulus Ec = 50,900 MPa.
σ c = f c ( α E ξ ξ 2 ) 1 + ( α E 2 ) ξ , ε ε 0 f c ξ 2 ( ξ 1 ) 2 + ξ , ε > ε 0
Tensile Constitutive Relationship of UHPC
The tensile constitutive model proposed by Shi et al. [34] (see Equation (3)) is adopted in this study. As illustrated in Figure 5b, the model consists of three components, where f t is the tensile strength, f res is the residual tensile strength, ε e is the elastic limit strain, E t is the tensile elastic modulus, ε t is the tensile strain, and ε res is the strain corresponding to the residual tensile strength. According to Shi et al. [34], the fitting parameters for the exponential softening stage are taken as c 1 = 0.929   and c 2 = 4.092 , which can satisfactorily capture the descending branch of the tensile stress–strain response.
For the tensile softening behavior, the bilinear constitutive model proposed in Ref. [35] is employed, and the corresponding relationship is given in Equation (2). Based on the referenced material tests, the tensile strength is taken as f c t = 7.83   MPa . To ensure reproducibility and mesh-objectivity, the equivalent fracture energy is set to G F , t 0.066 l e N / mm (where l e is the characteristic crack-band length), and the residual tensile strength is taken as σ res 0.146   MPa . Here, σ s denotes the tensile stress at the first breakpoint w = w s ; w s is the crack opening displacement at the transition point; and w 0 represents the crack opening displacement corresponding to zero cohesive stress.
σ ( w ) = f c t ( f c t σ s ) w w s , 0 w w s σ s w 0 w w 0 w s , w s w w 0 0 , w 0 < w
σ c t = f c t ε c t e ε c t or E c t ε c t , 0 < ε c t ε c t e f c t + f c t r f c t ε c t r ε c t e ( ε c t ε c t e ) , ε c t e < ε c t ε c t r f c t r 1 + ε c t ε c t r ε c t , max c 1 3 e c 2 ε c t ε c t r ε c t , max , ε c t r < ε c t ε c t , max
Compressive and Tensile Constitutive Relationships of Normal Concrete
The model specified in the Code for Design of Concrete Structures [36] (GB50010—2010) (see Equations (4) and (6)) is adopted, consisting of two stages, as shown in Figure 5c,d. In this model: ρ c = f c E c ε c , n = E c ε c E c ε c f c , x = ε ε c . where α c is the reference value for the descending branch of the uniaxial compressive stress–strain curve of concrete; f c is the uniaxial compressive strength of concrete; ε c is the peak strain corresponding to the uniaxial compressive strength; and d c is the damage evolution parameter under uniaxial compression.
σ = ( 1 d c ) E c ε
d c = 1 ρ c n n 1 + x n , x 1 1 ρ c α c ( x 1 ) 2 + x , x > 1
σ = ( 1 d t ) E c ε
d t = 1 ρ t ( 1.2 0.2 x 5 ) , x 1 1 ρ c α t ( x 1 ) 1.7 + x , x > 1
3.2.2. Constitutive Behavior of Steel
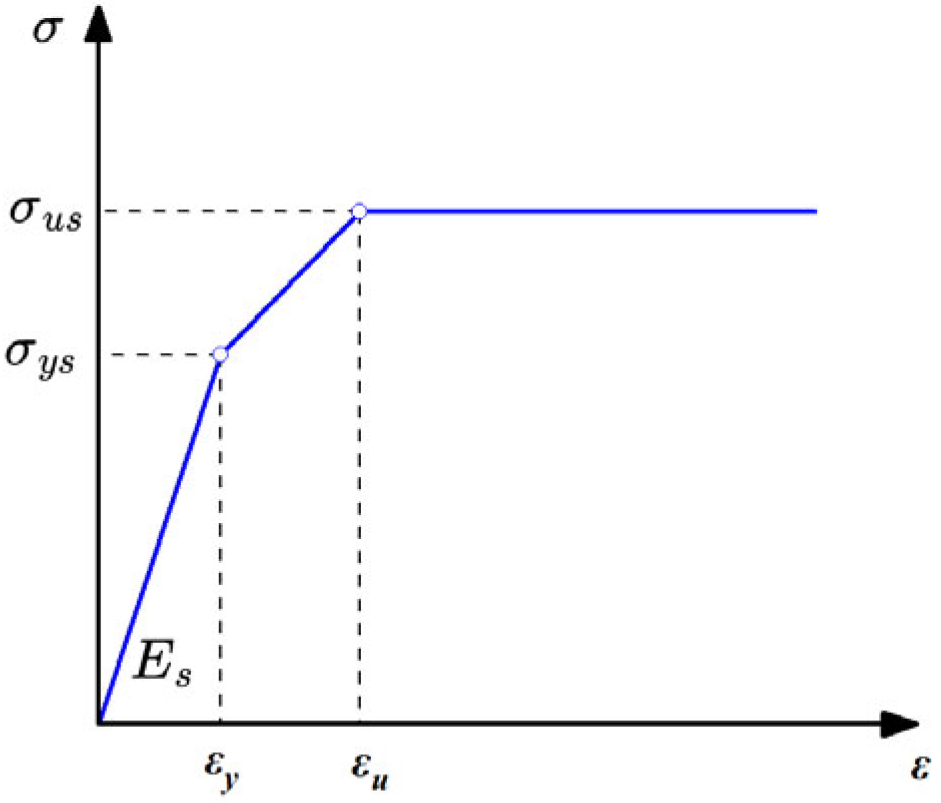
The stress–strain relationship of studs is usually modeled using a trilinear model. This constitutive relationship not only simulates the yielding stage of studs but also captures the strain-hardening stage after yielding, thereby enabling a more accurate representation of stud behavior. The stress–strain relationship of studs is calculated according to Equation (7):
σ = E s ε i , ε i ε y f s y + 0.01 E s ( ε i ε y ) , ε y ε i ε u f u , ε i ε u
where E s is the elastic modulus of the stud, and fsy is the yield strength of the stud. According to the stud material certificate: fsy = 374.9 MPa; fu is the tensile strength of the stud, with fu = 457.8 MPa. The stress–strain curve of the shear stud is shown in Figure 6.

3.3. Contact and Constraints

In this study, the steel beam, bolt connectors, and reinforced concrete deck were modeled using C3D8R eight-node three-dimensional solid elements with reduced integration, while the reinforcement within the deck was simulated using T3D2 three-dimensional two-node truss elements.
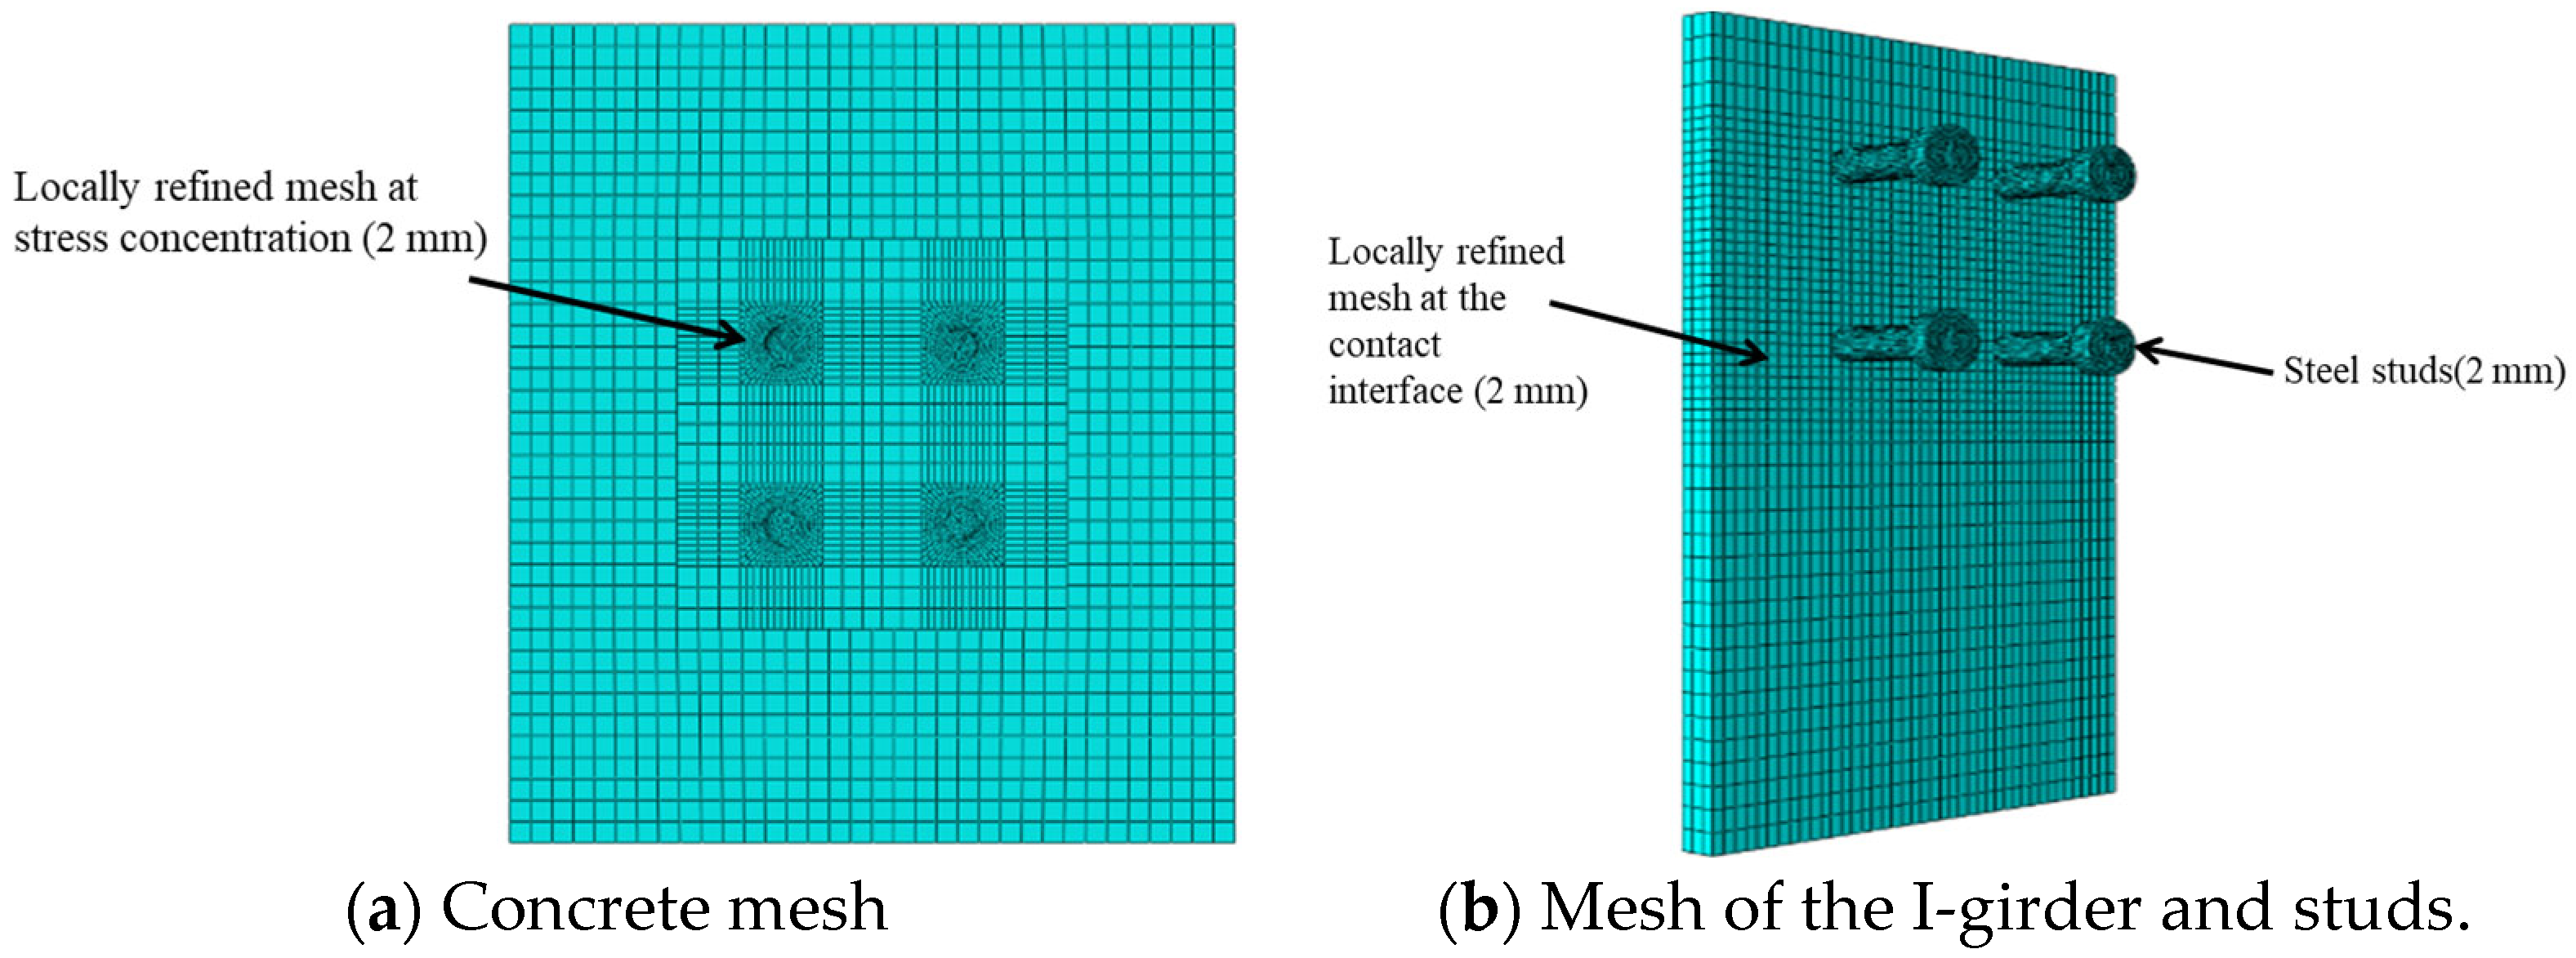
To ensure computational accuracy and reduce the risk of non-convergence, nodes at contact interfaces were constrained with forced matching, thereby improving convergence, convergence rate, and calculation precision. A refined mesh (2 mm) was applied in stress concentration regions such as the bolts, adjacent concrete, and steel flanges, whereas a coarser mesh (5 mm) was used in the remaining areas. This mesh arrangement not only guarantees accuracy in critical regions but also maintains overall computational efficiency. The complete finite element model contained approximately 750,000 elements, and the mesh division is illustrated in Figure 7.
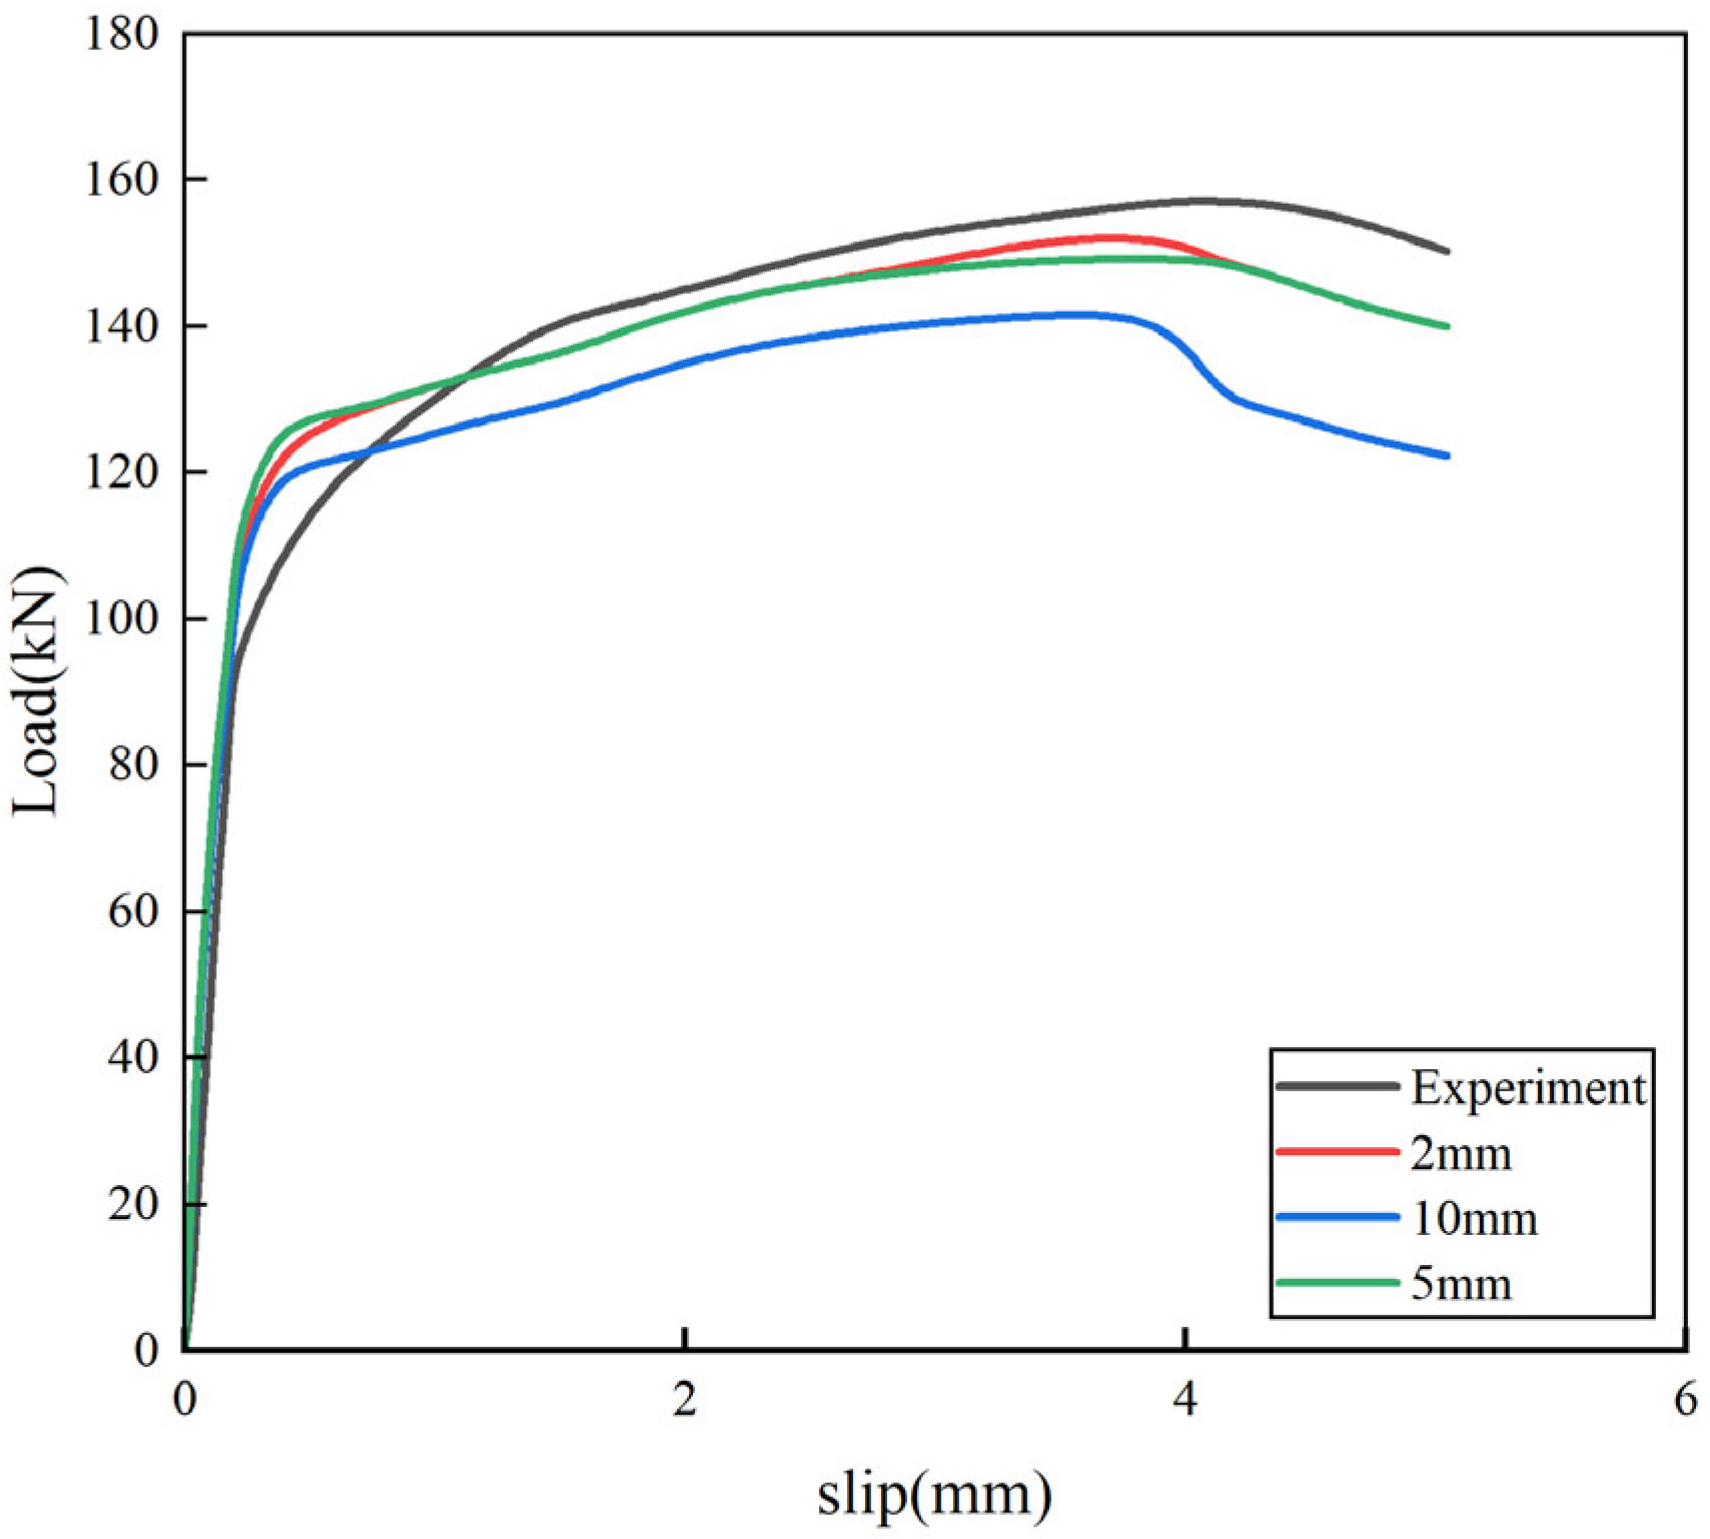
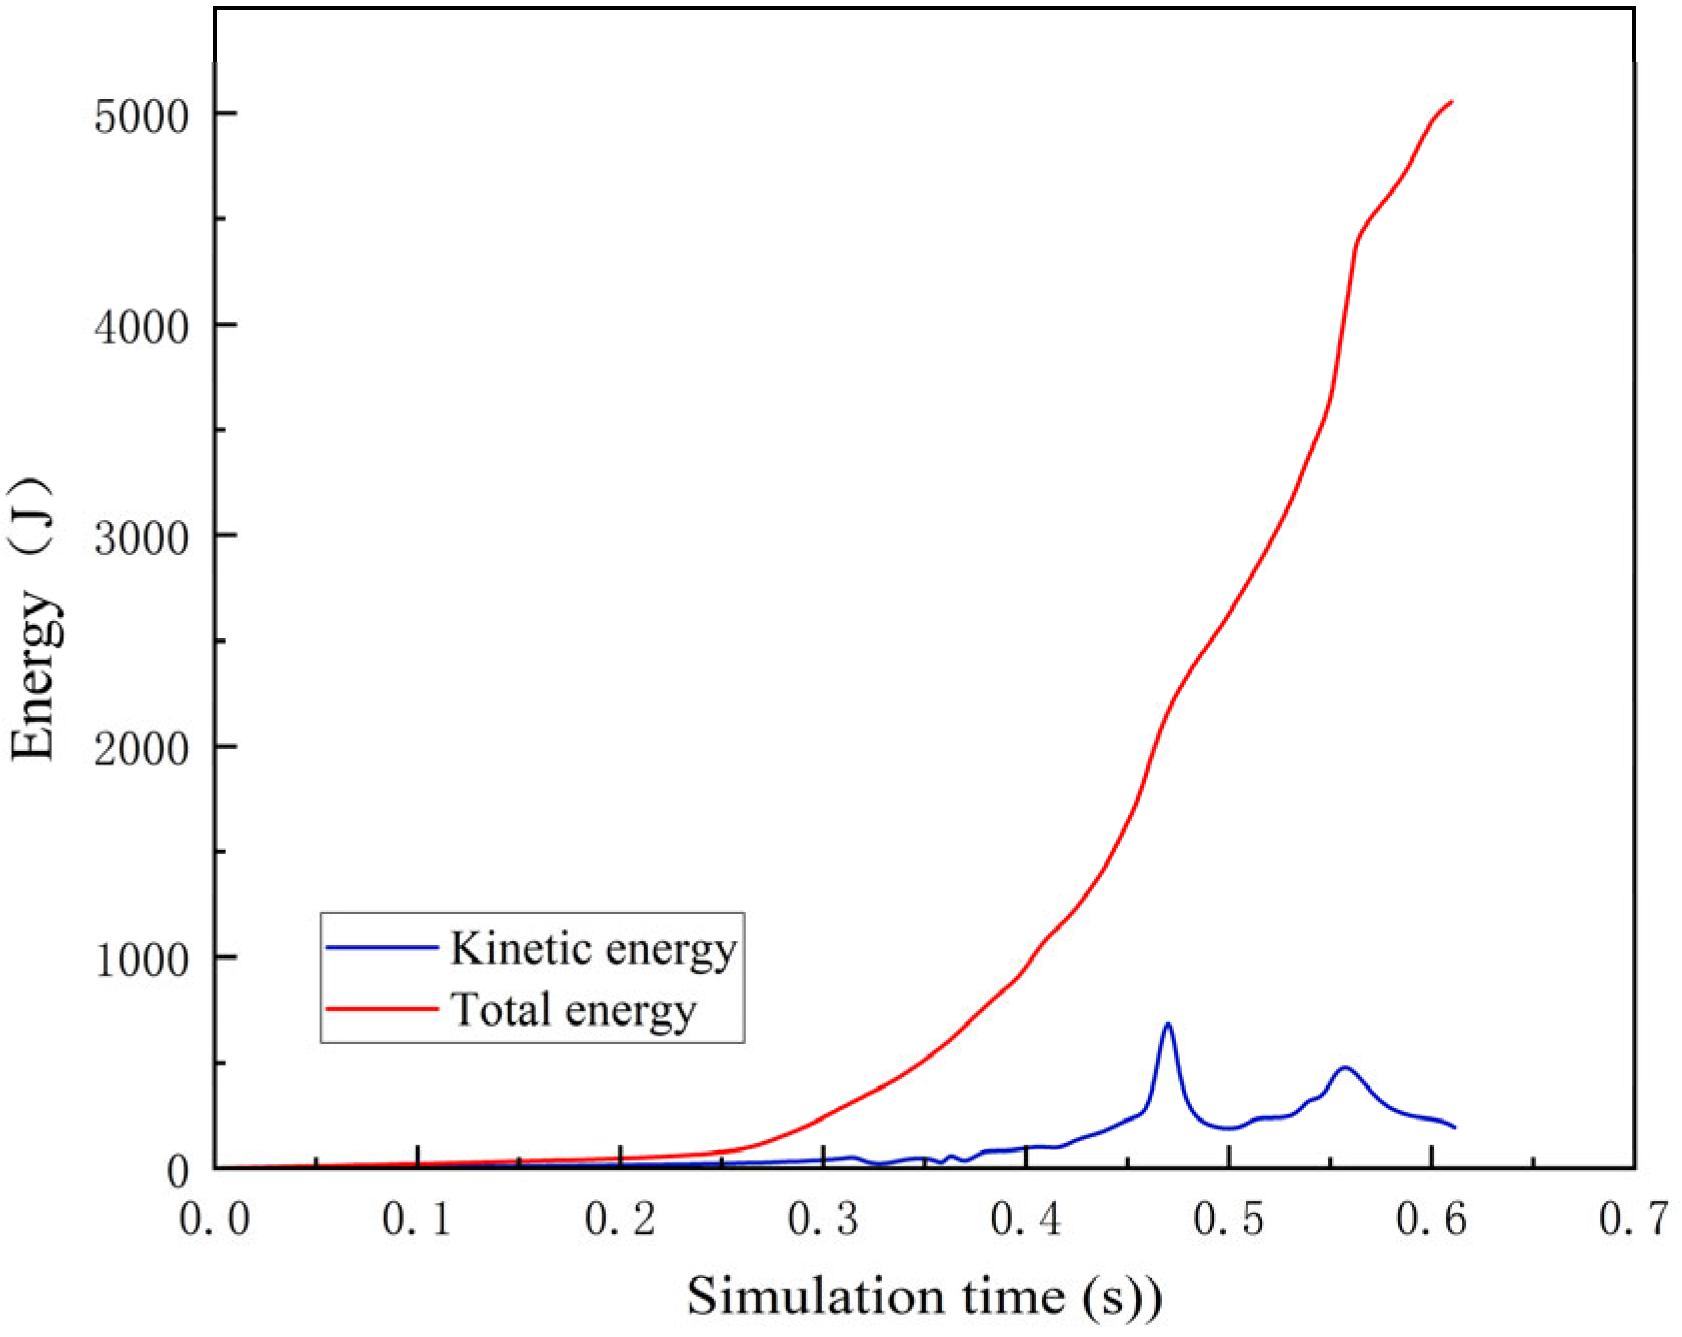
The numerical results obtained using element sizes of 2.5 mm, 5 mm, and 10 mm were compared with the experimental data (Figure 8). Relative to the test results, the 10 mm mesh significantly underestimates the peak load and exhibits a much steeper post-peak softening response, indicating a pronounced mesh-induced brittleness effect. In contrast, the finer meshes of 2.5 mm and 5 mm yield nearly identical responses in terms of pre-peak stiffness, peak load, and post-peak behavior, and both show good agreement with the experimental curve. Considering both accuracy and computational efficiency, a mesh size of 5 mm was adopted as the baseline for subsequent analyses. The loading rate was maintained below 0.05 mm/s throughout the simulations to ensure that the ratio of artificial strain energy to total energy remained below 5%. A representative energy balance is shown in Figure 9. As illustrated, the kinetic energy increases much more slowly than the total energy, indicating that no significant dynamic effects were introduced and that the quasi-static analysis results are reliable.
The contact interactions in the push-out test model were defined using surface-to-surface contact, with the stiffer surface designated as the master surface. The contact behavior includes both normal and tangential interactions: hard contact was adopted in the normal direction to prevent penetration between contact surfaces, while the tangential behavior was modeled using the penalty formulation, in which a penalty parameter is introduced to simulate the shear transfer. A friction coefficient of 0.35 was applied to both the steel–concrete and steel–steel interfaces [37]. The contact pairs include the steel flange–concrete interface, stud–concrete interface, and stud–steel interface. A Tie constraint was used between the studs and the steel beam to more realistically represent the actual bonding condition and thereby improve the accuracy and reliability of the numerical results.
The interaction between concrete and steel reinforcement was modeled using embedded constraints, where the displacement of truss-element reinforcement nodes is interpolated from the surrounding concrete solid elements. This approach neglects the relative slip between the reinforcement and the concrete, simplifying the computation.
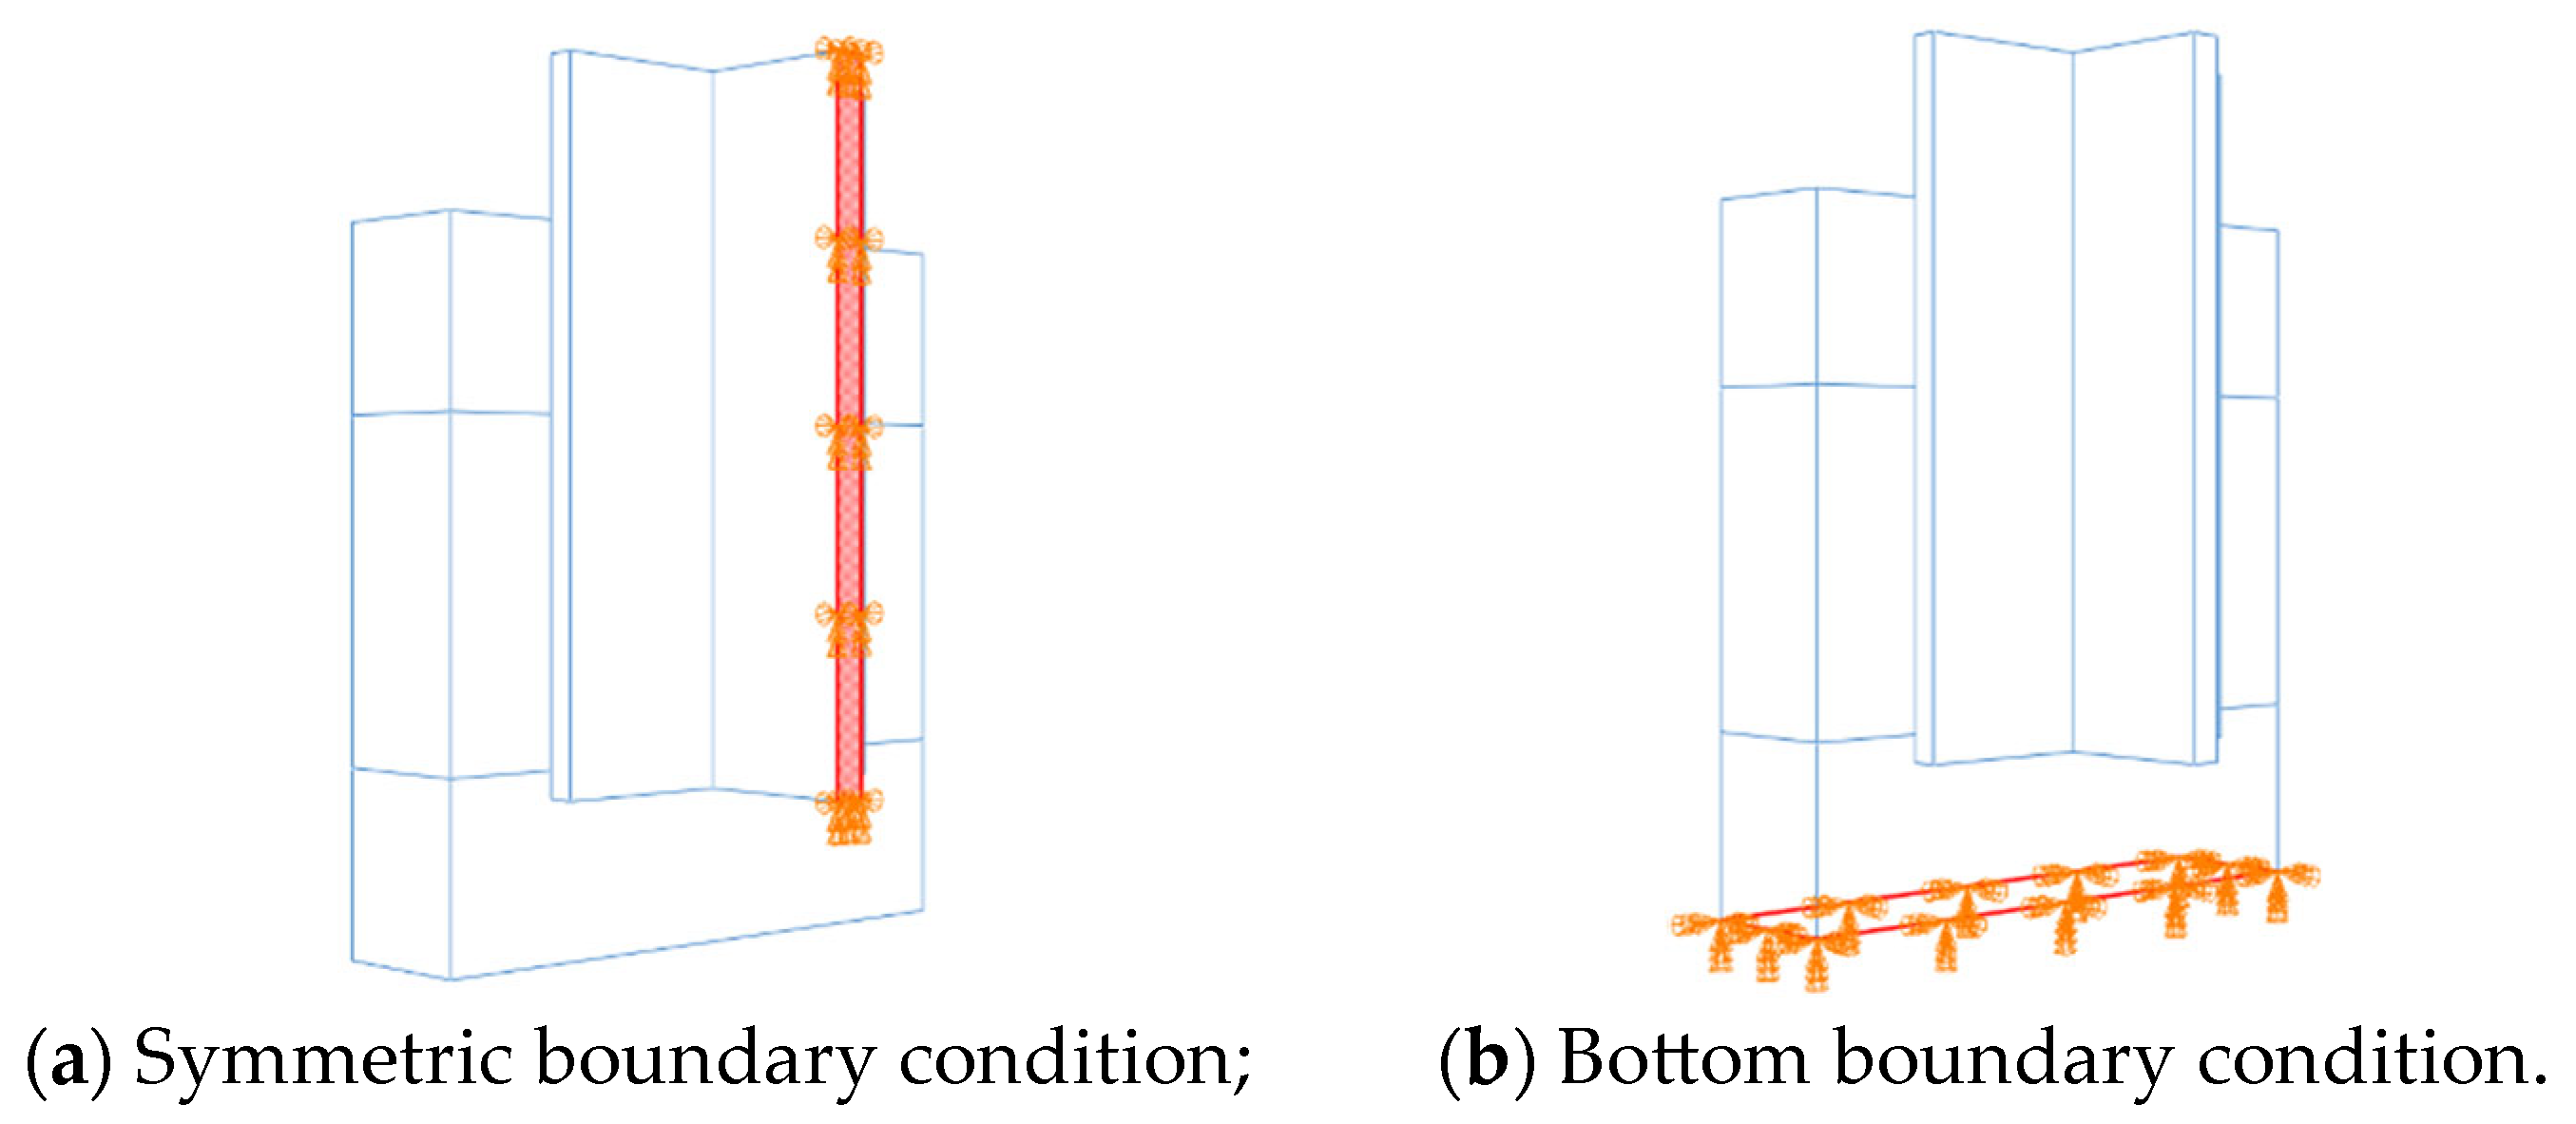
The boundary conditions of the model are shown in Figure 10. Taking advantage of structural symmetry [38], only one-half of the specimen was modeled, and the corresponding symmetry boundary conditions were applied on the symmetry planes. On the XY symmetry plane (red region in Figure 10a), the out-of-plane displacement in the Z-direction (U3) was constrained for both the steel beam and the concrete. On the YZ symmetry plane of the steel beam, the displacement in the X-direction (U1) was constrained (see Figure 10b). To facilitate extraction of the support reaction, the bottom surface of the concrete was fully fixed, with all translational degrees of freedom constrained (U1 = U2 = U3 = 0), replicating the actual loading conditions. The specimen was loaded using displacement control, in which the top surface of the steel beam was coupled to a reference point, and a prescribed displacement was applied at that point. The maximum loading displacement was determined based on the design shear capacity of the studs in the actual bridge project.

4. Model Validation and Result Analysis

4.1. Model Validation

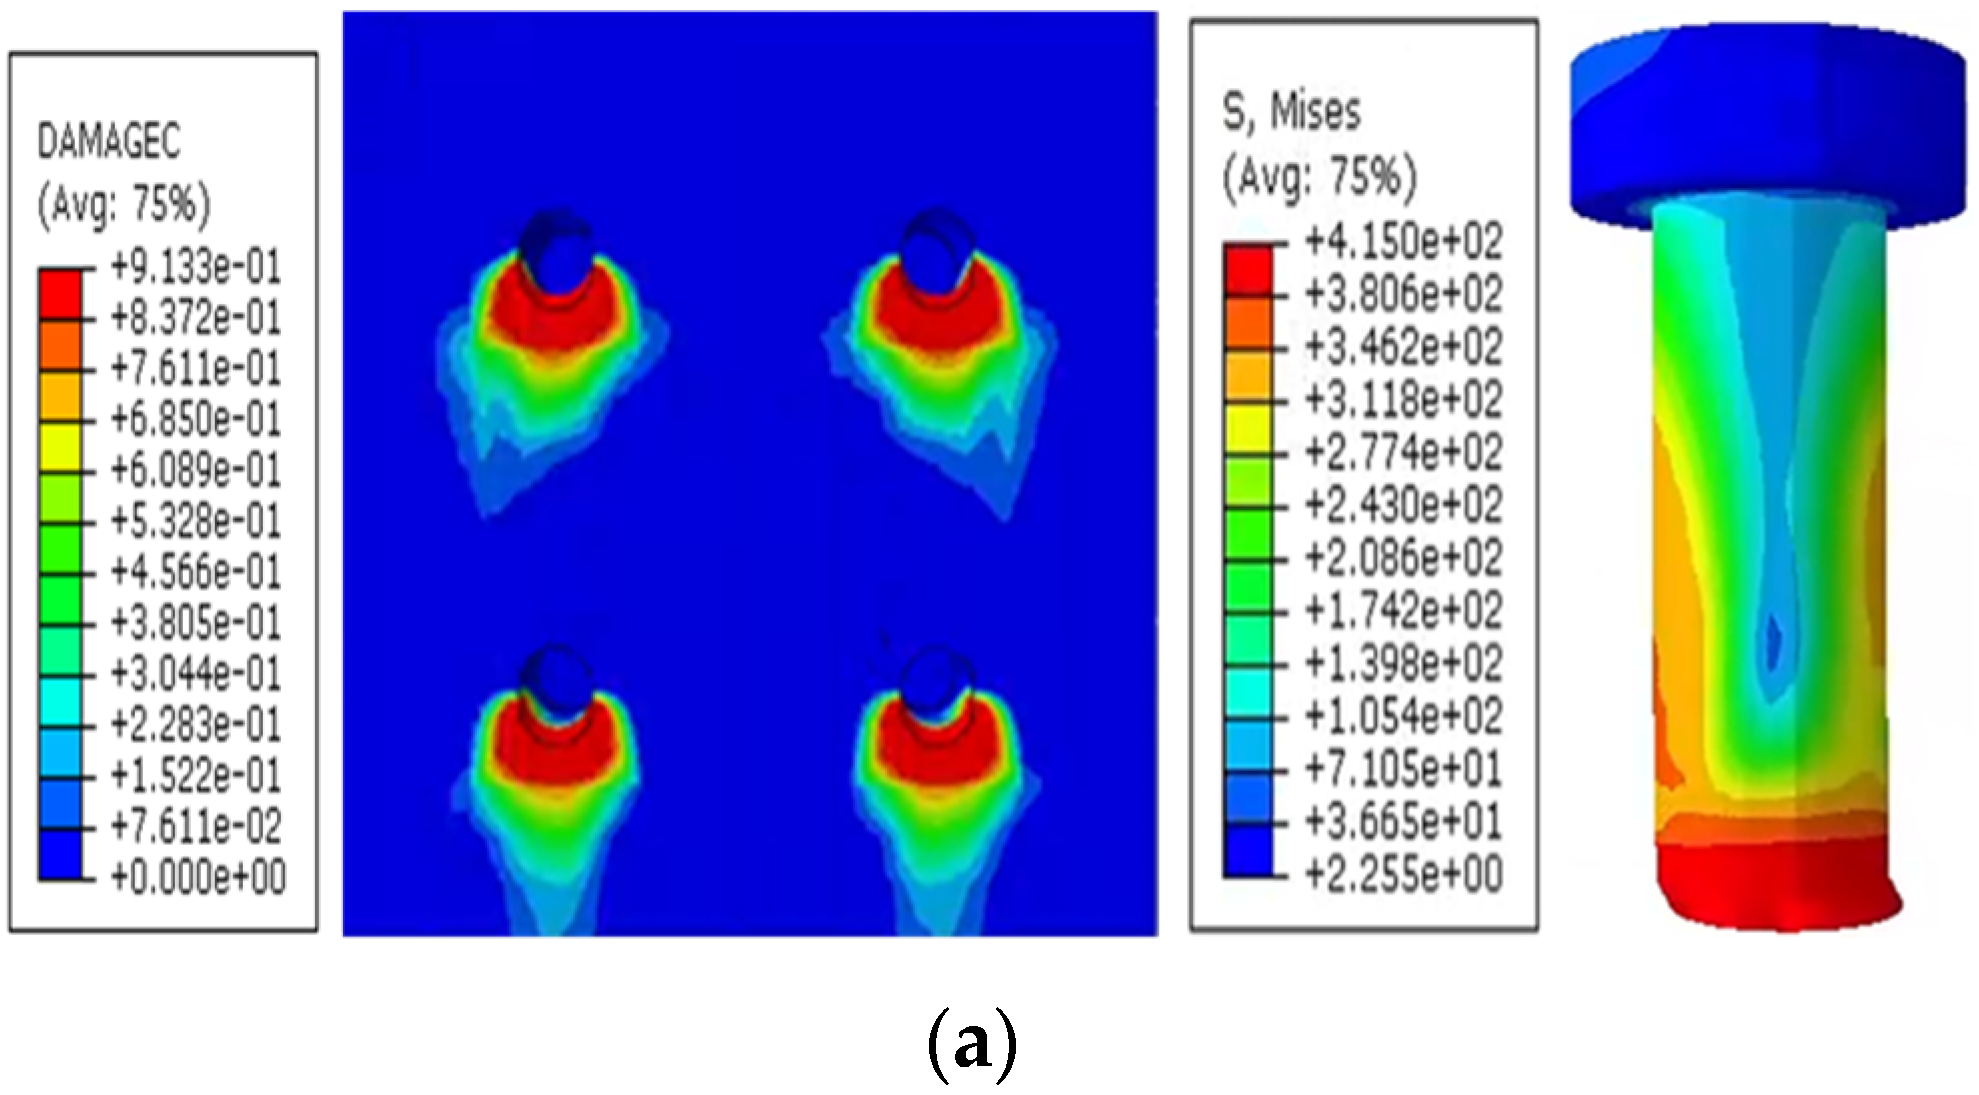
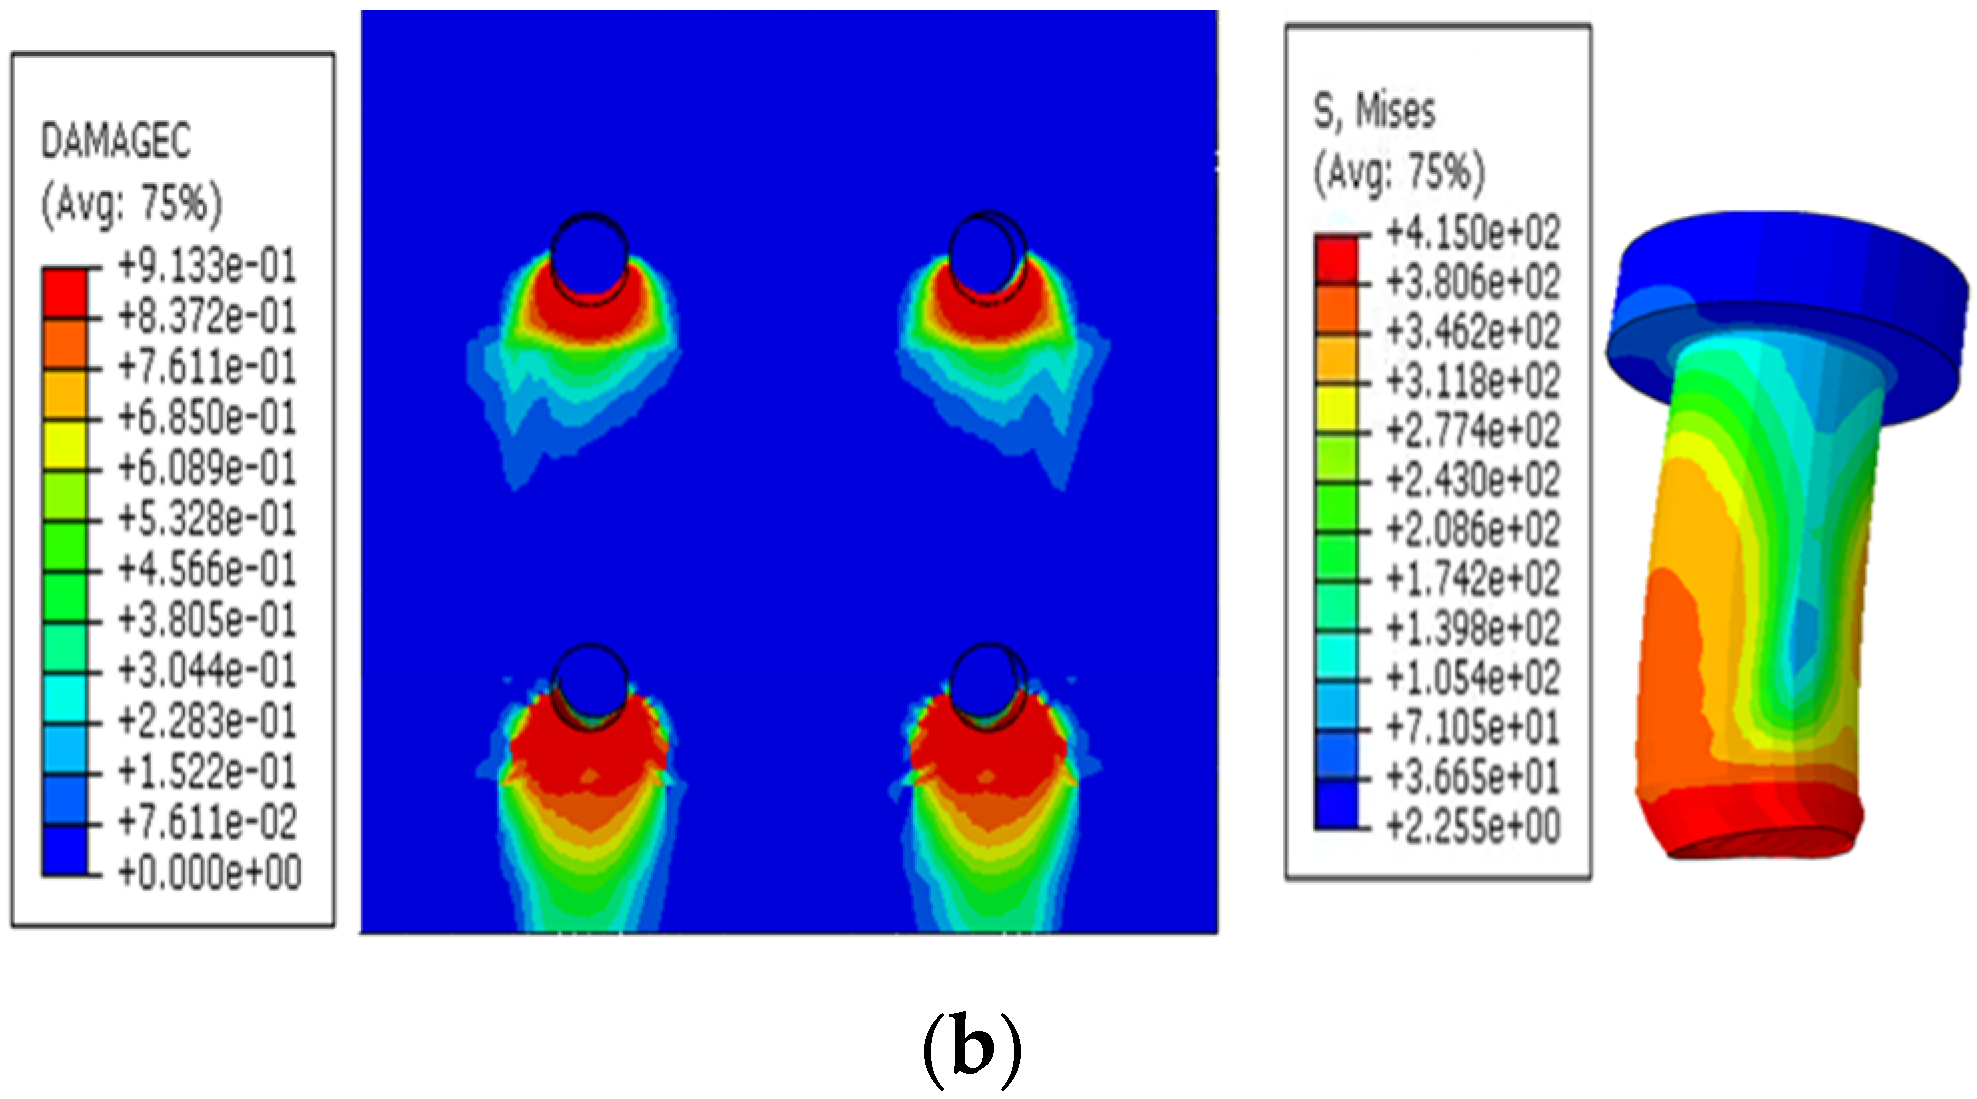
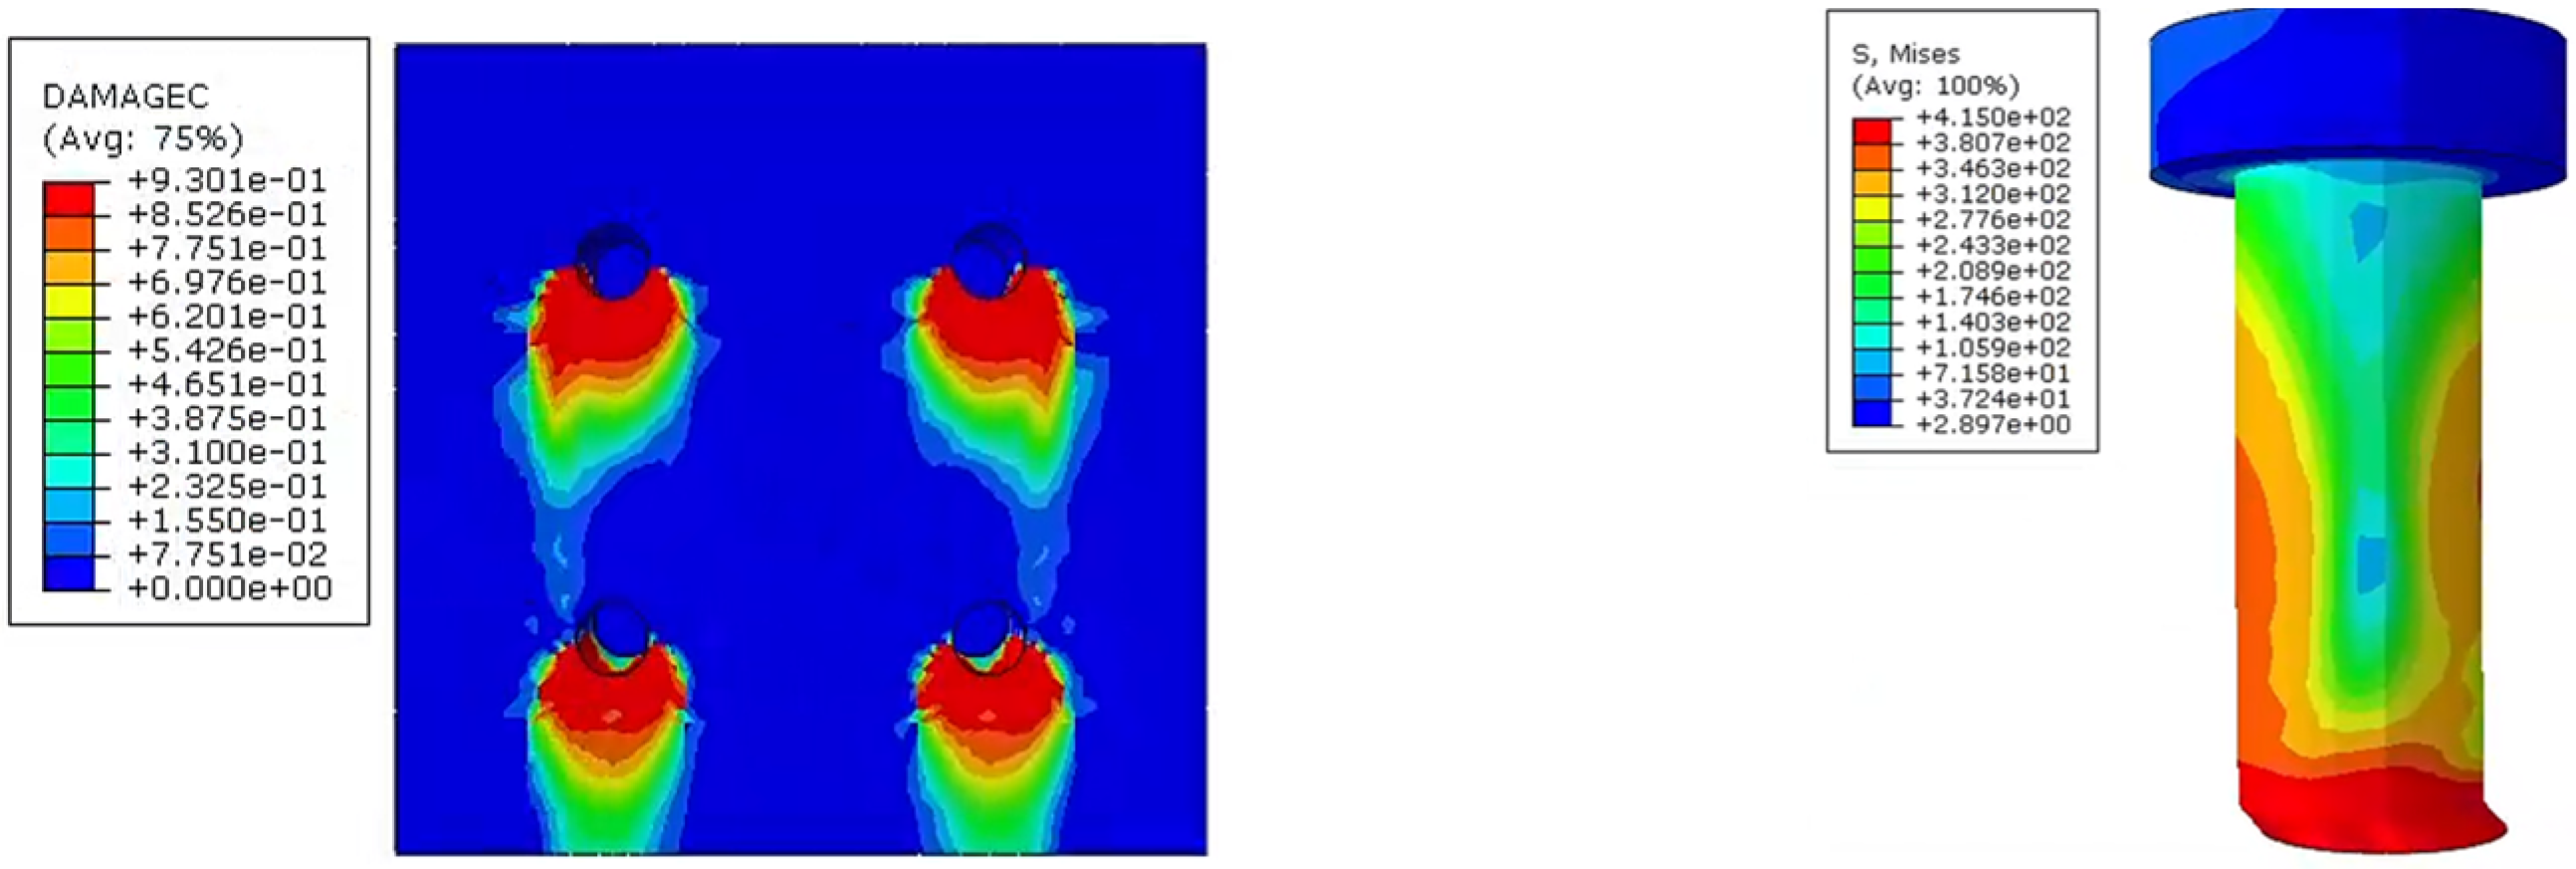
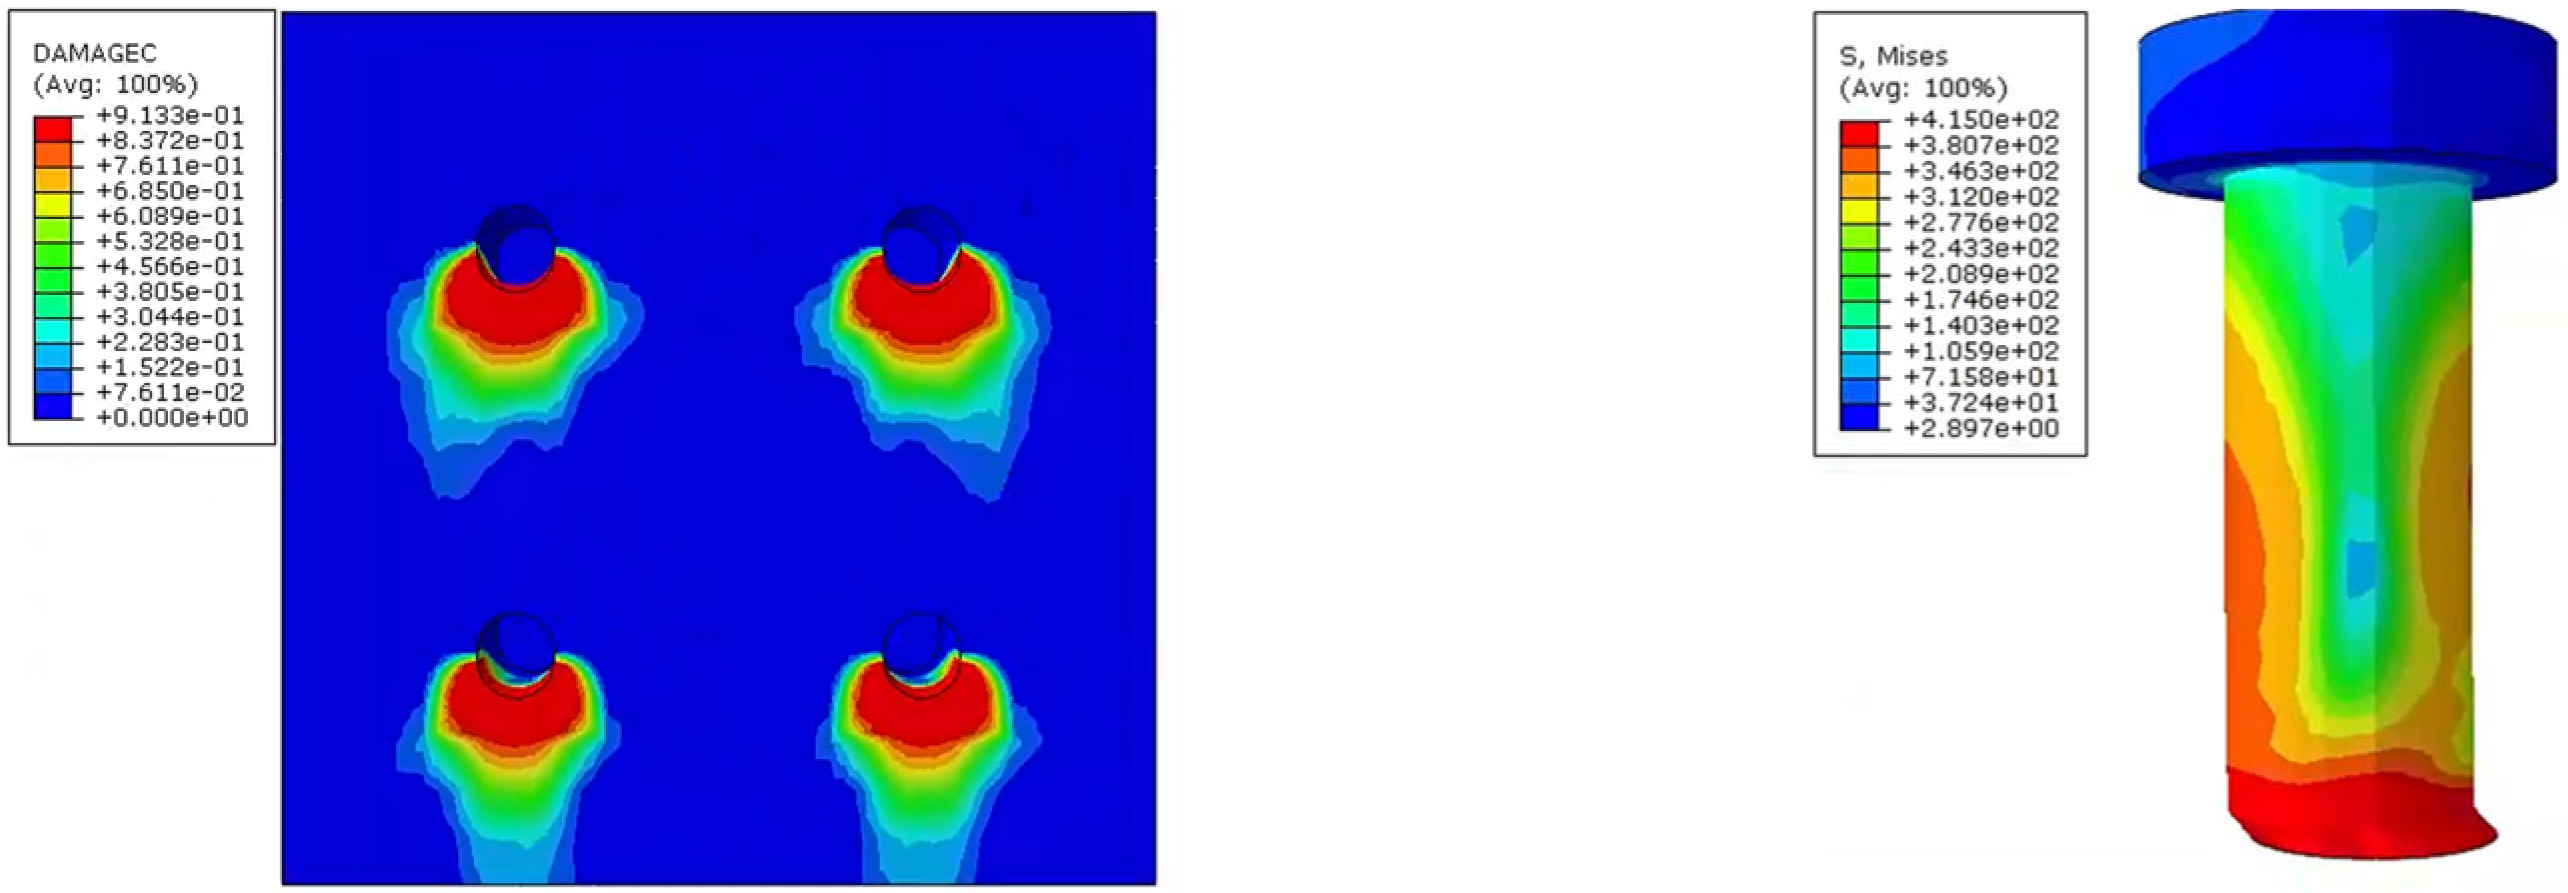
Figure 11a,b show the final damage patterns of the shear connectors obtained from the finite element simulations corresponding to Fang et al.’s [1] push-out test configurations P-22-75 and P-22-50, respectively. In both cases, the von Mises stress within the screw shank at the steel–concrete interface exceeds the tensile strength of the stud, and the high-stress zone traverses the entire screw section, indicating that the steel in this region first yields and then reaches its strength limit, leading to plastic shear failure of the connector. Meanwhile, a pronounced triaxial compression damage zone develops in the UHPC in the vicinity of the loading direction of the screw, while the UHPC slab as a whole does not exhibit through-cracks; only limited damage occurs in the locally compressed region at the root of the shear pocket. This damage distribution is highly consistent with the failure phenomena observed in the P-22-75 and P-22-50 push-out tests reported by Fang et al. [1].
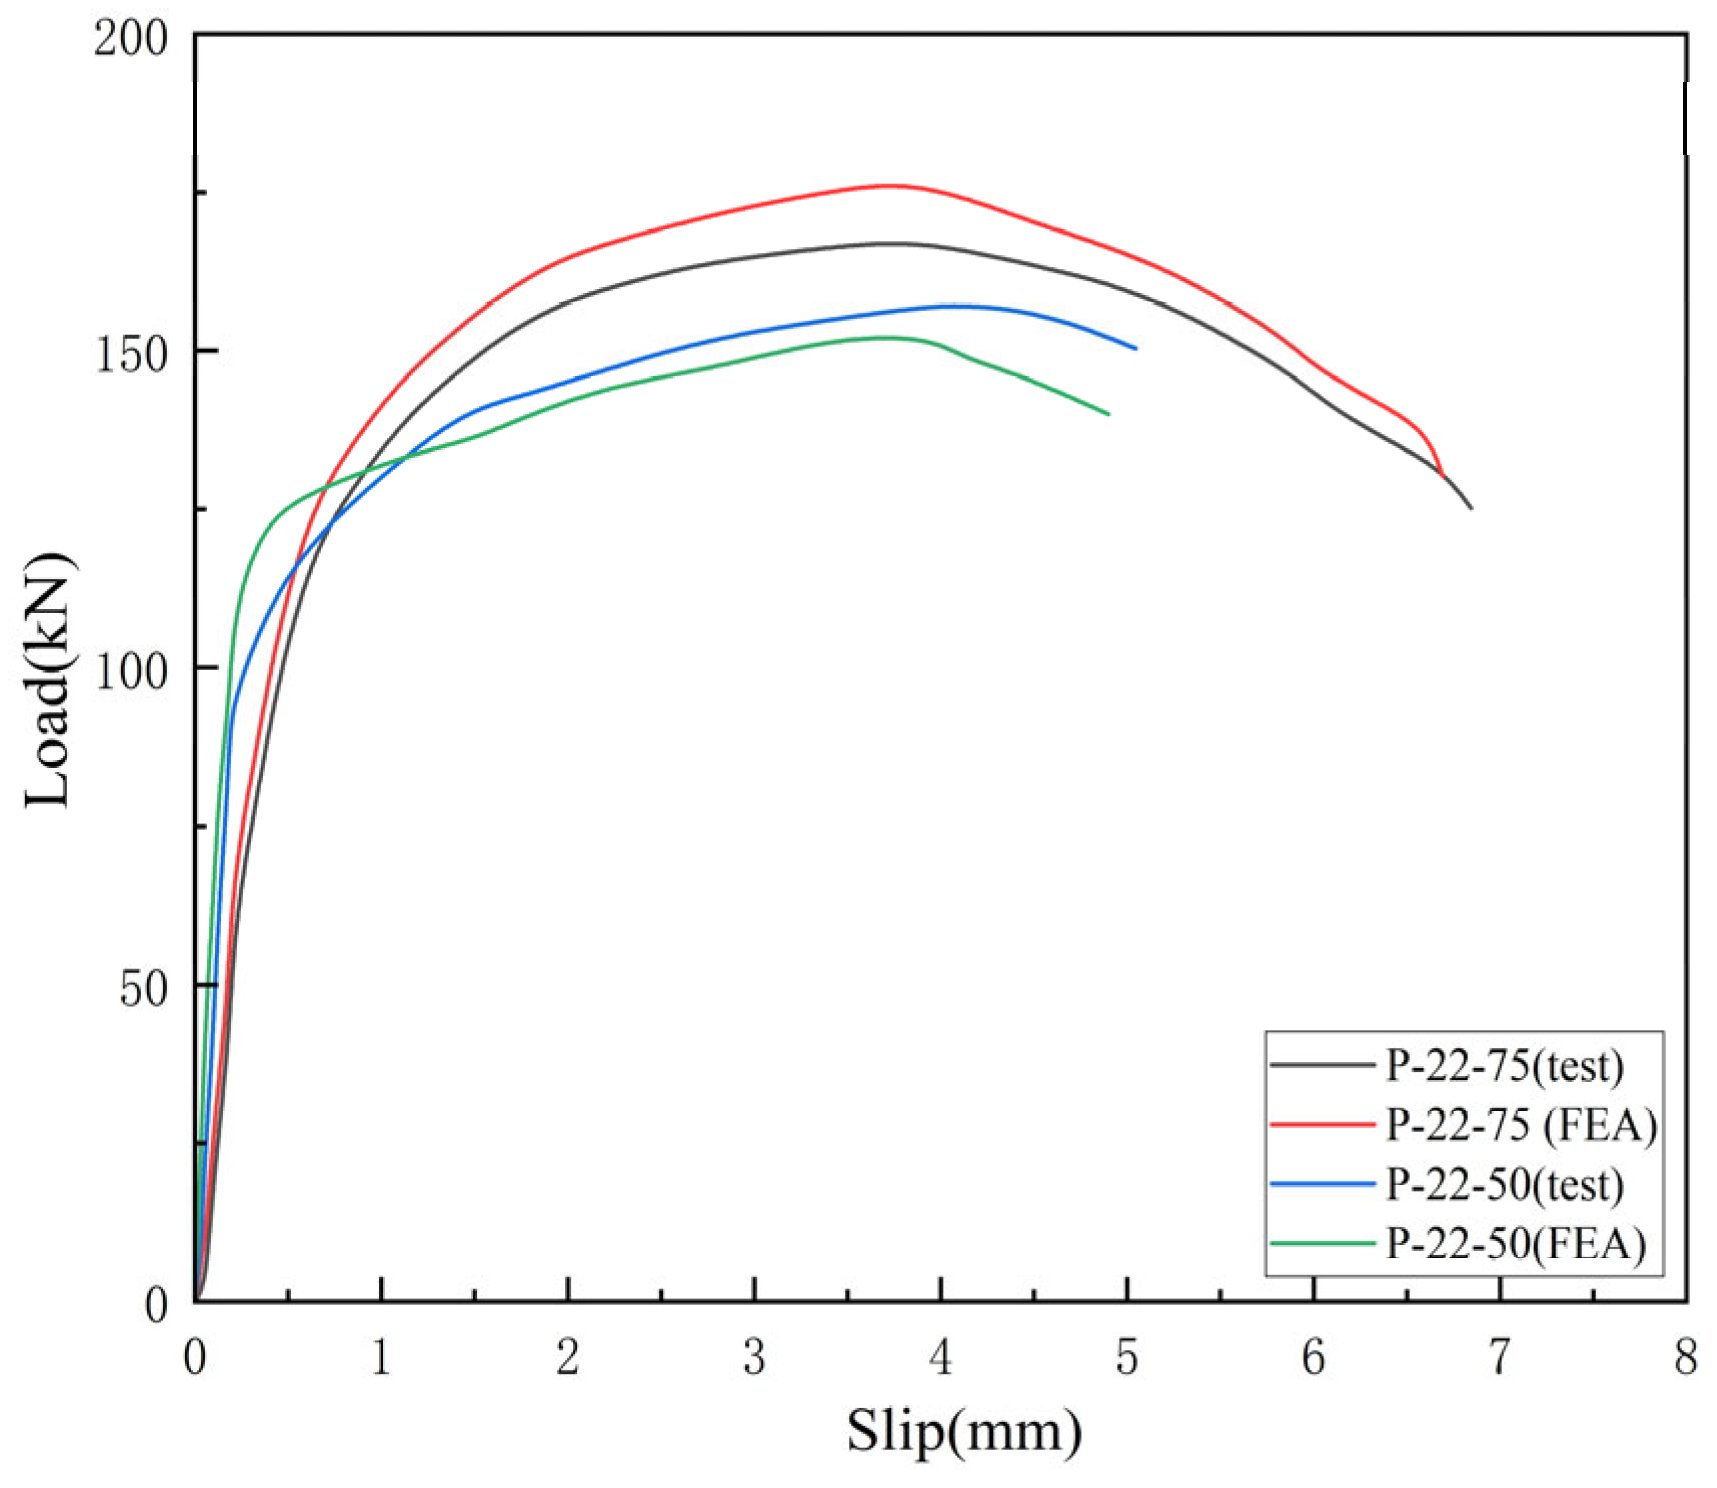
Figure 12 and Table 4 present the comparison between the finite element results for these two configurations and the push-out test data of Fang et al. [1]. It can be clearly seen that the numerically predicted load–slip curves agree very well with the test curves, with the errors at key characteristic points all within 8%. This indicates that the finite element modeling approach adopted in this study has high accuracy in simulating the mechanical behavior of UHPC shear-connector push-out specimens.
Overall, the finite element simulations reproduce the failure modes, stress distribution characteristics, and failure mechanisms of the connectors in good agreement with the push-out test results, demonstrating that the developed finite element model can reasonably capture the crack and damage distribution in the UHPC slab and the actual load-carrying and failure process of the shear connectors, and thus possesses satisfactory accuracy and reliability.

4.2. Failure Modes and Mechanisms

Among the nine push-out specimens, seven experienced shear fracture of the short studs. The fracture locations were predominantly concentrated near the weld roots, indicating shear failure occurring around the welded region. Inside the UHPC slab, only wedge-shaped localized crushing zones were observed near the stud roots and weld-bearing areas, while the remaining regions remained essentially intact with minimal overall damage.
Overall, the failure patterns can be categorized into two types: concrete-controlled failure and stud bending–shear-controlled failure. Only the C50 small-diameter specimen (d13, h/d = 3.5) and the UHPC specimen with a low slenderness ratio (d13, h/d = 2.5) exhibited concrete-controlled failure (see Figure 13), characterized by localized crushing, splitting, or even cone-shaped pullout of the concrete, with only minor plastic deformation in the studs. All other specimens predominantly exhibited stud bending–shear-controlled failure (see Figure 14): significant bending occurred near the weld toes or along the stud shank, forming a plastic hinge and eventually leading to fracture at the stud root, while the concrete exhibited only localized crushing without extensive splitting.
The concrete damage contours show that UHPC exhibited no cracks except for slight crushing and spalling near the stud root, and the short studs displayed only minor deformation at their bases; the embedded portions of the studs remained nearly vertical. This indicates that UHPC provides excellent confinement and anchorage to short studs.
Compared with normal-strength concrete, the higher compressive and tensile strengths of UHPC effectively suppress radial splitting cracks around the stud perimeter, concentrating stresses within the local bearing zone and the stud cross-section. The dense matrix and strong fiber-bridging effect of UHPC provide additional tensile resistance and restraint during microcrack initiation, delaying crack propagation and preventing cone pullout. As a result, the shear-transfer mechanism gradually shifts from “concrete splitting + stud pullout” to “stud bending–shear resistance + localized crushing.”
Under this mechanism, a greater portion of the shear force is transferred through stud bending–shear deformation and local bearing beneath the stud head, while UHPC primarily provides high-stiffness lateral confinement and robust embedment conditions. The bending moment and shear stress levels near the stud root are thus increased, promoting the formation of a distinct plastic hinge near the weld toe and eventual shear fracture. Meanwhile, the UHPC slab exhibits only minor localized crushing and spalling, without extensive cracking or delamination.
From a macroscopic perspective, the high stiffness, high tensile strength, and strong fiber-bridging capacity of UHPC significantly diminish the dominance of “concrete-controlled” failure mechanisms commonly observed in conventional concrete connectors. Instead, short-stud shear connectors embedded in UHPC tend to fail in the “stud bending–shear-controlled” mode. This indicates that UHPC not only enhances the lateral confinement stiffness on the concrete side of the shear-transfer path but also strengthens the holding and bearing support around the stud, making the stud material properties the primary factor governing load capacity and ductility. These findings provide a mechanical basis for stud-design optimization when UHPC is used.

4.3. Load–Slip Curves

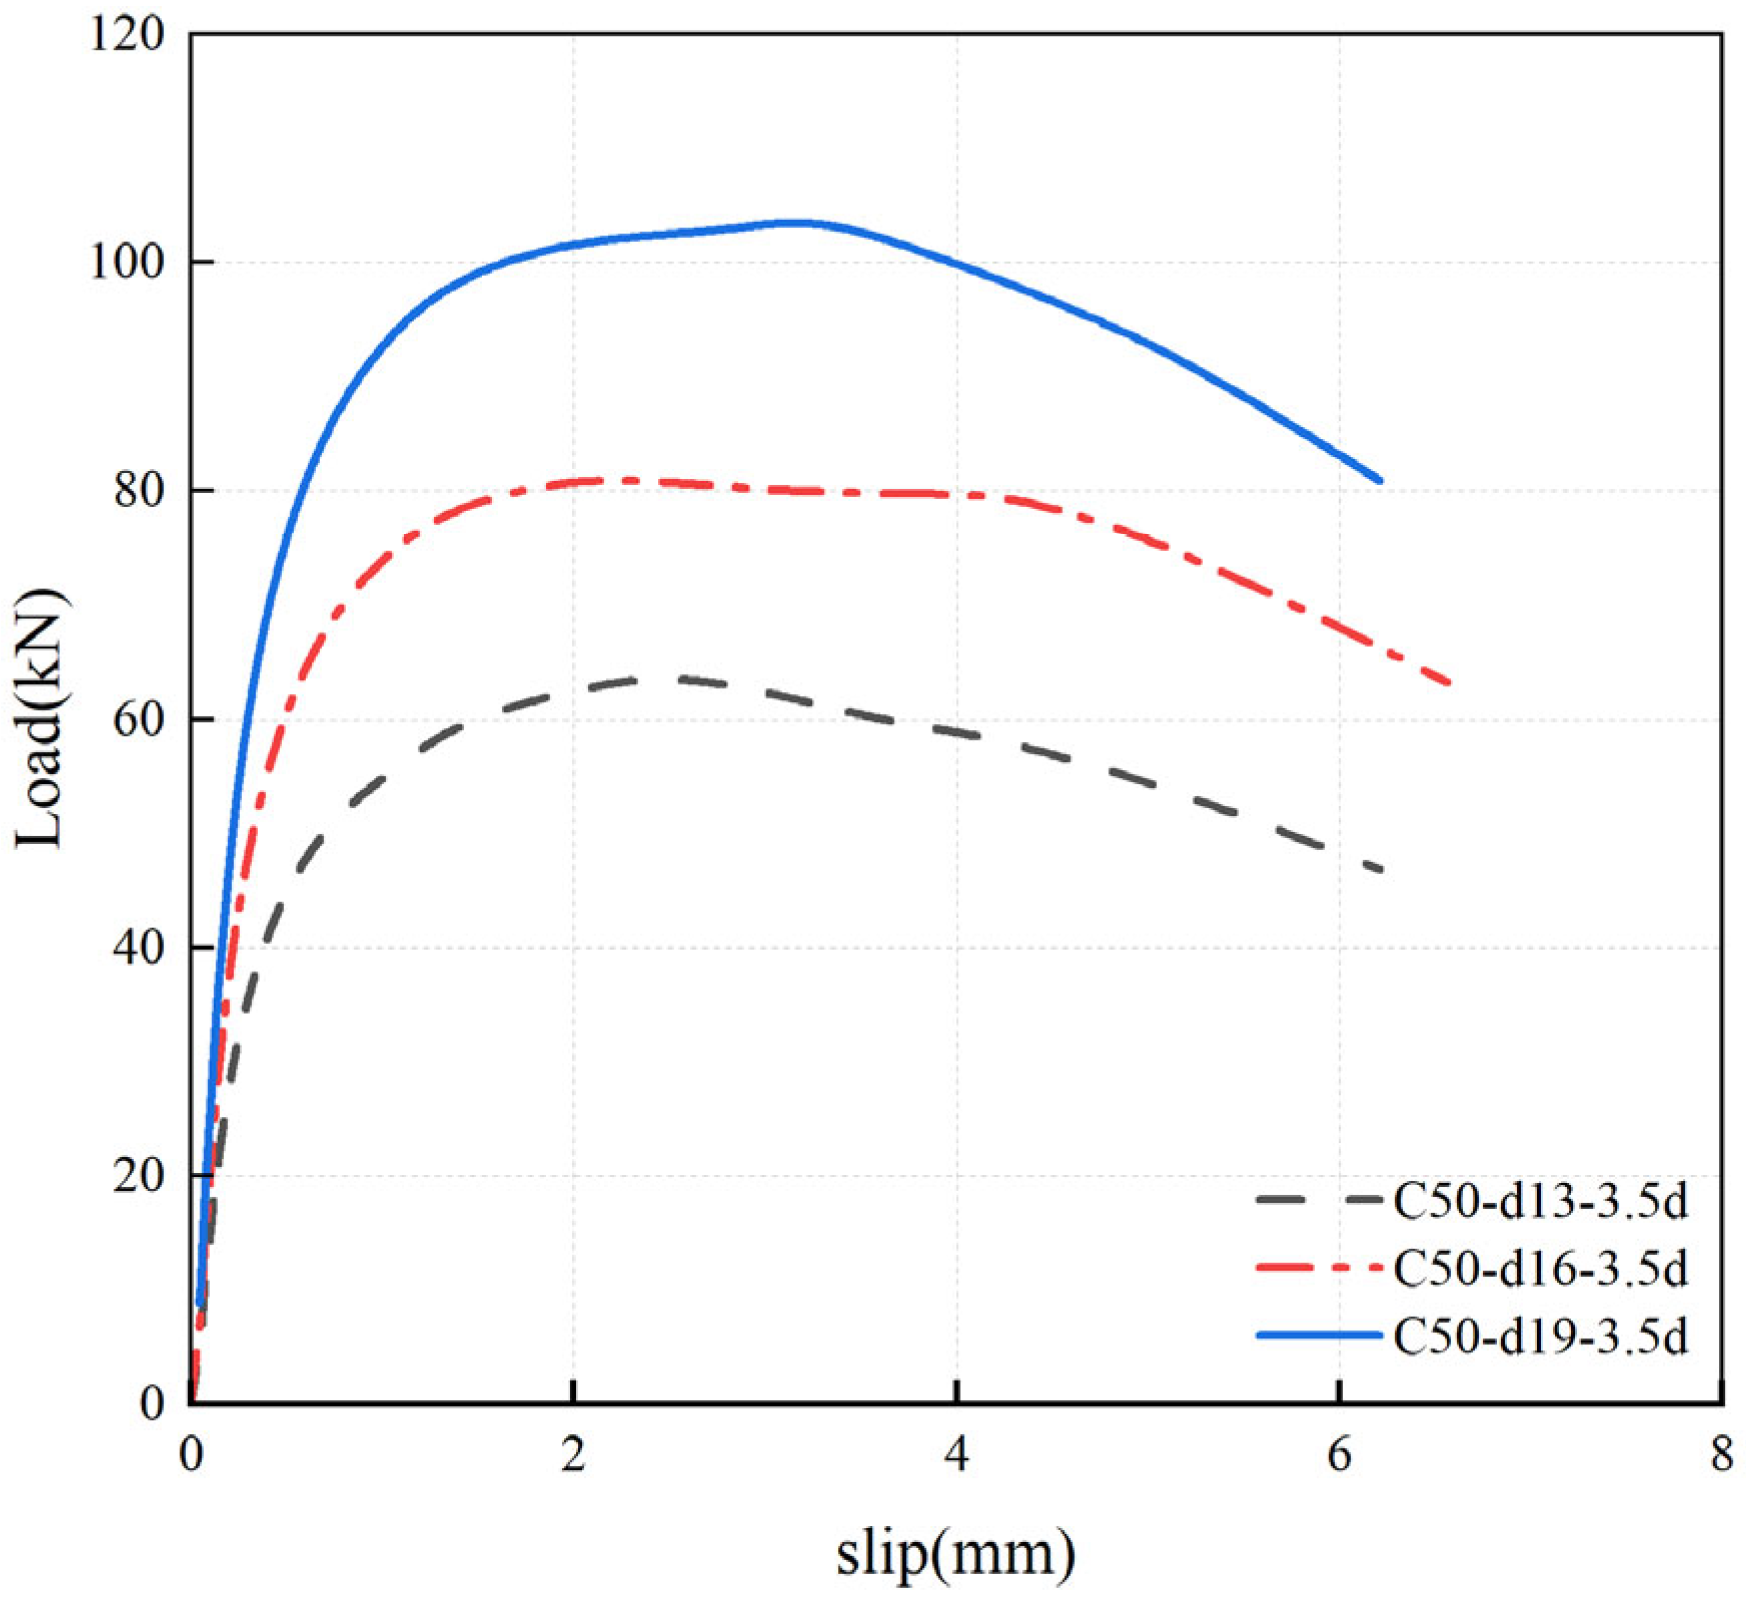
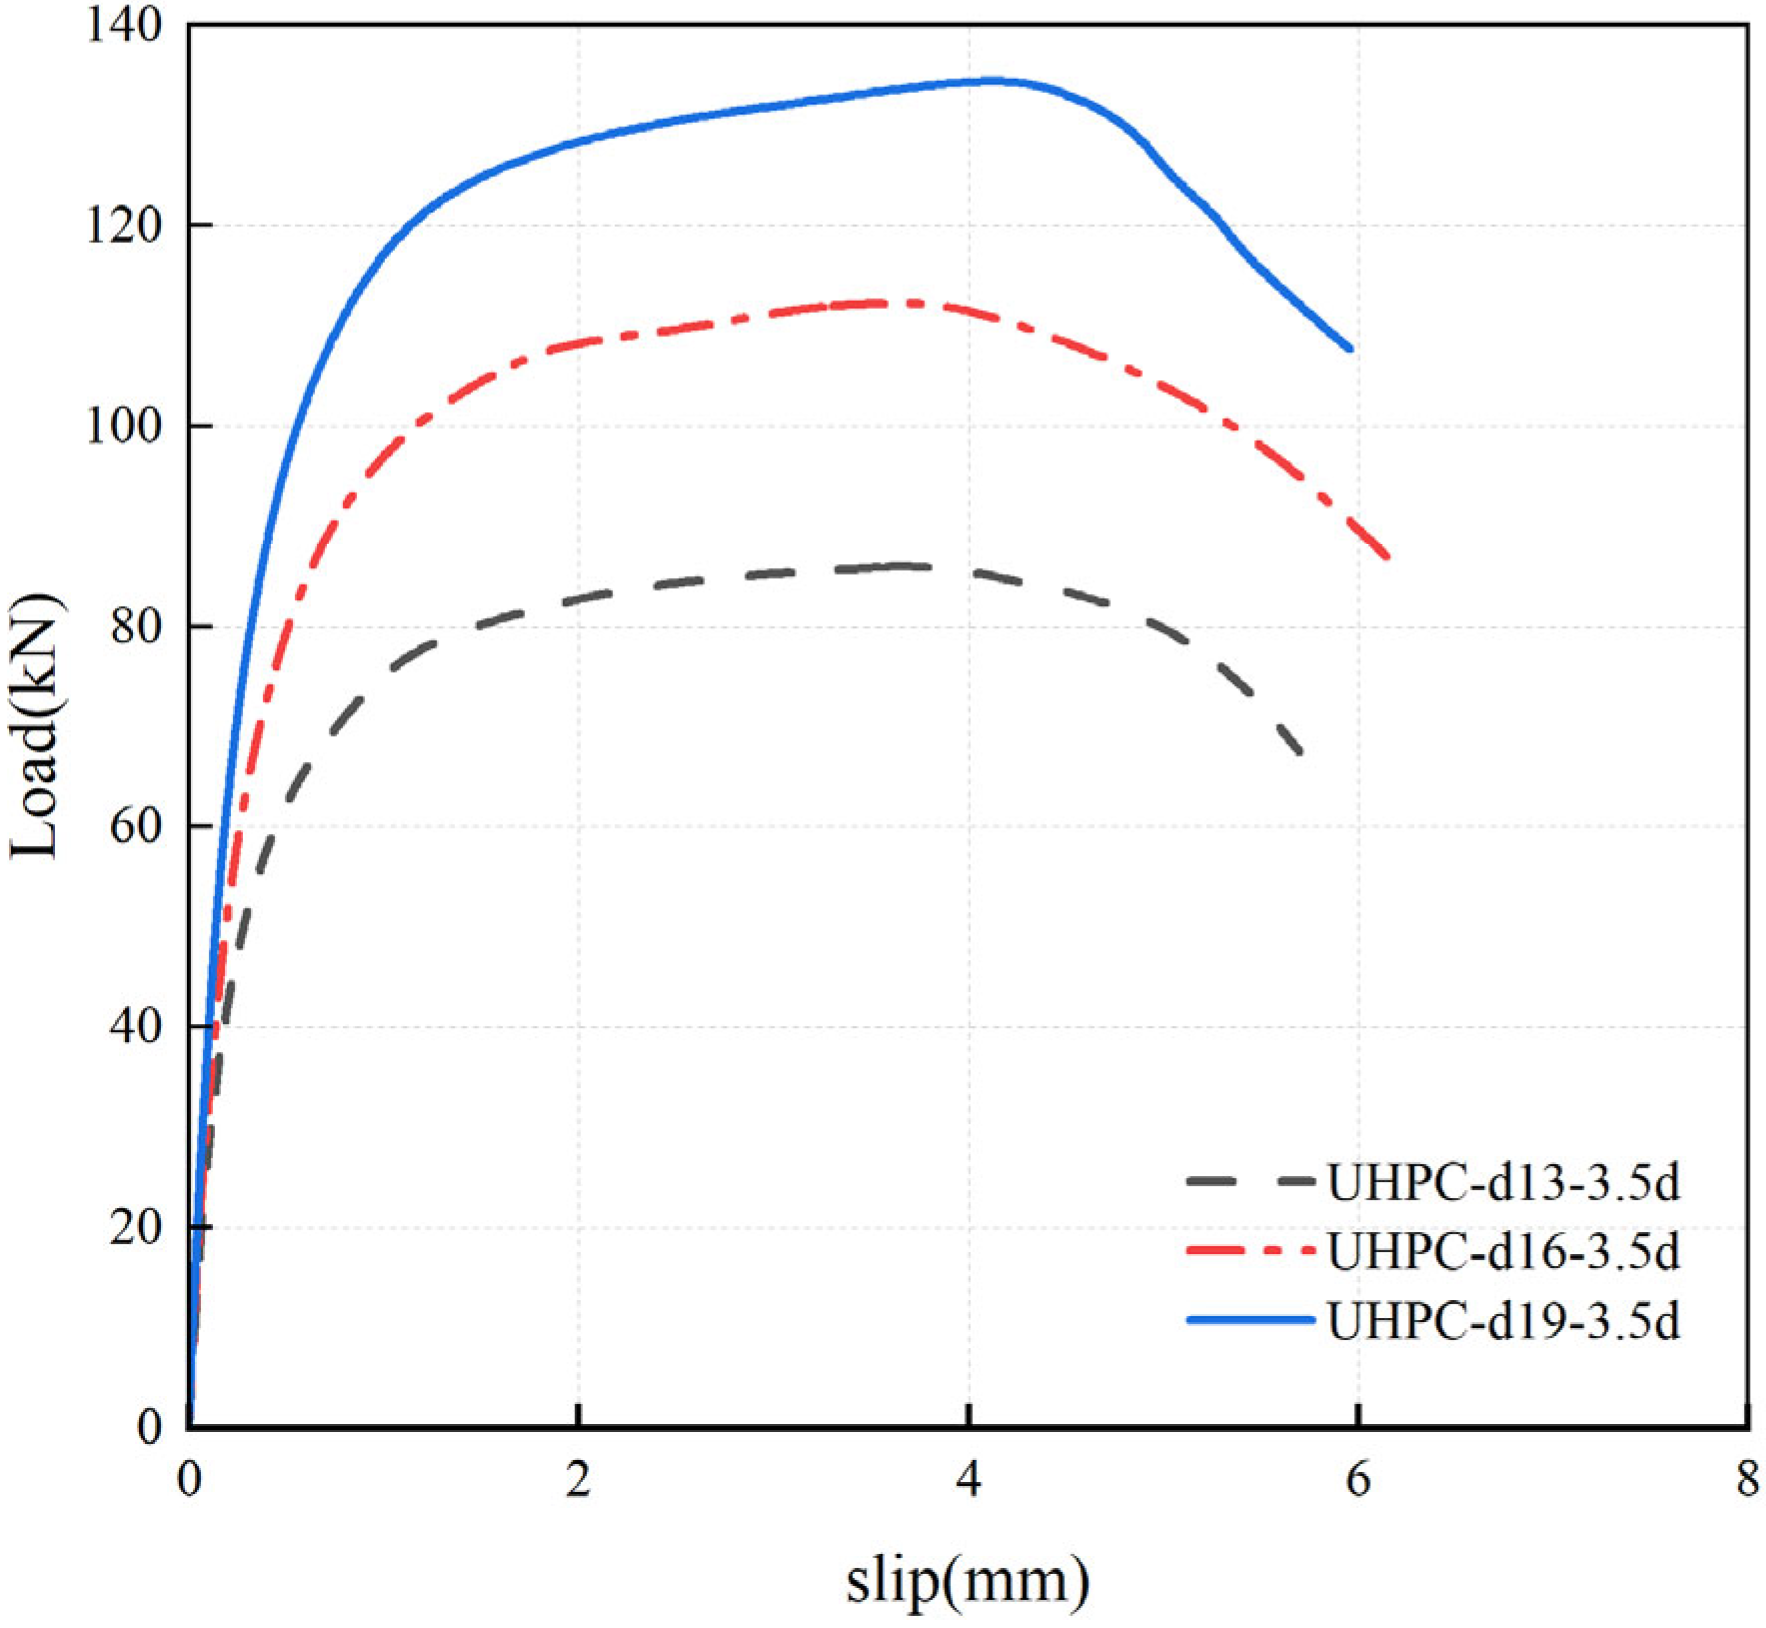
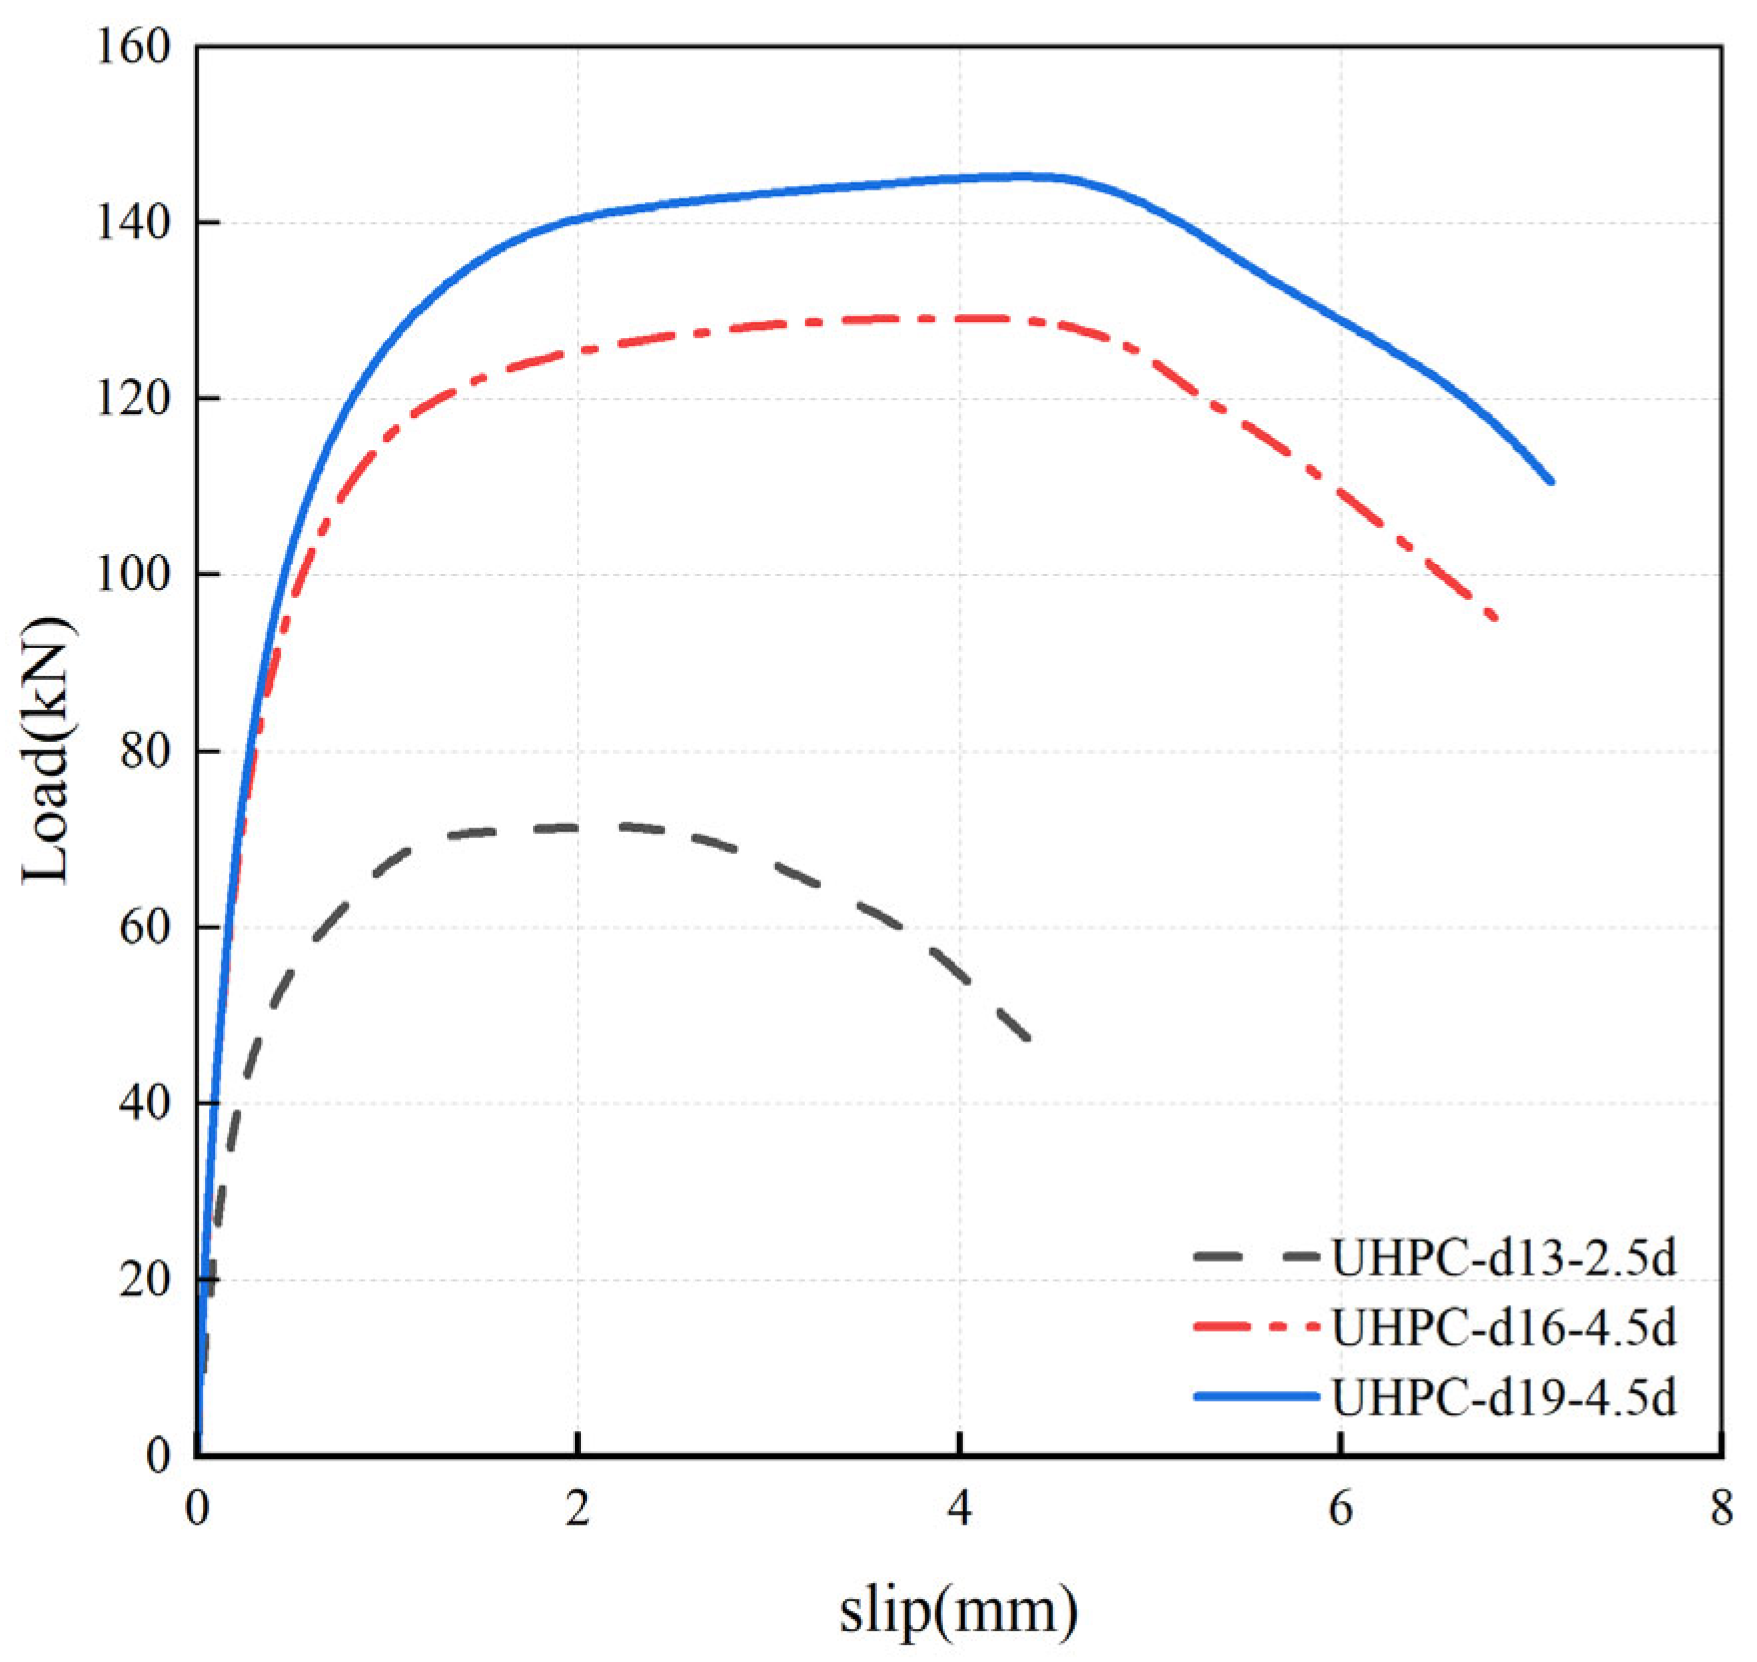
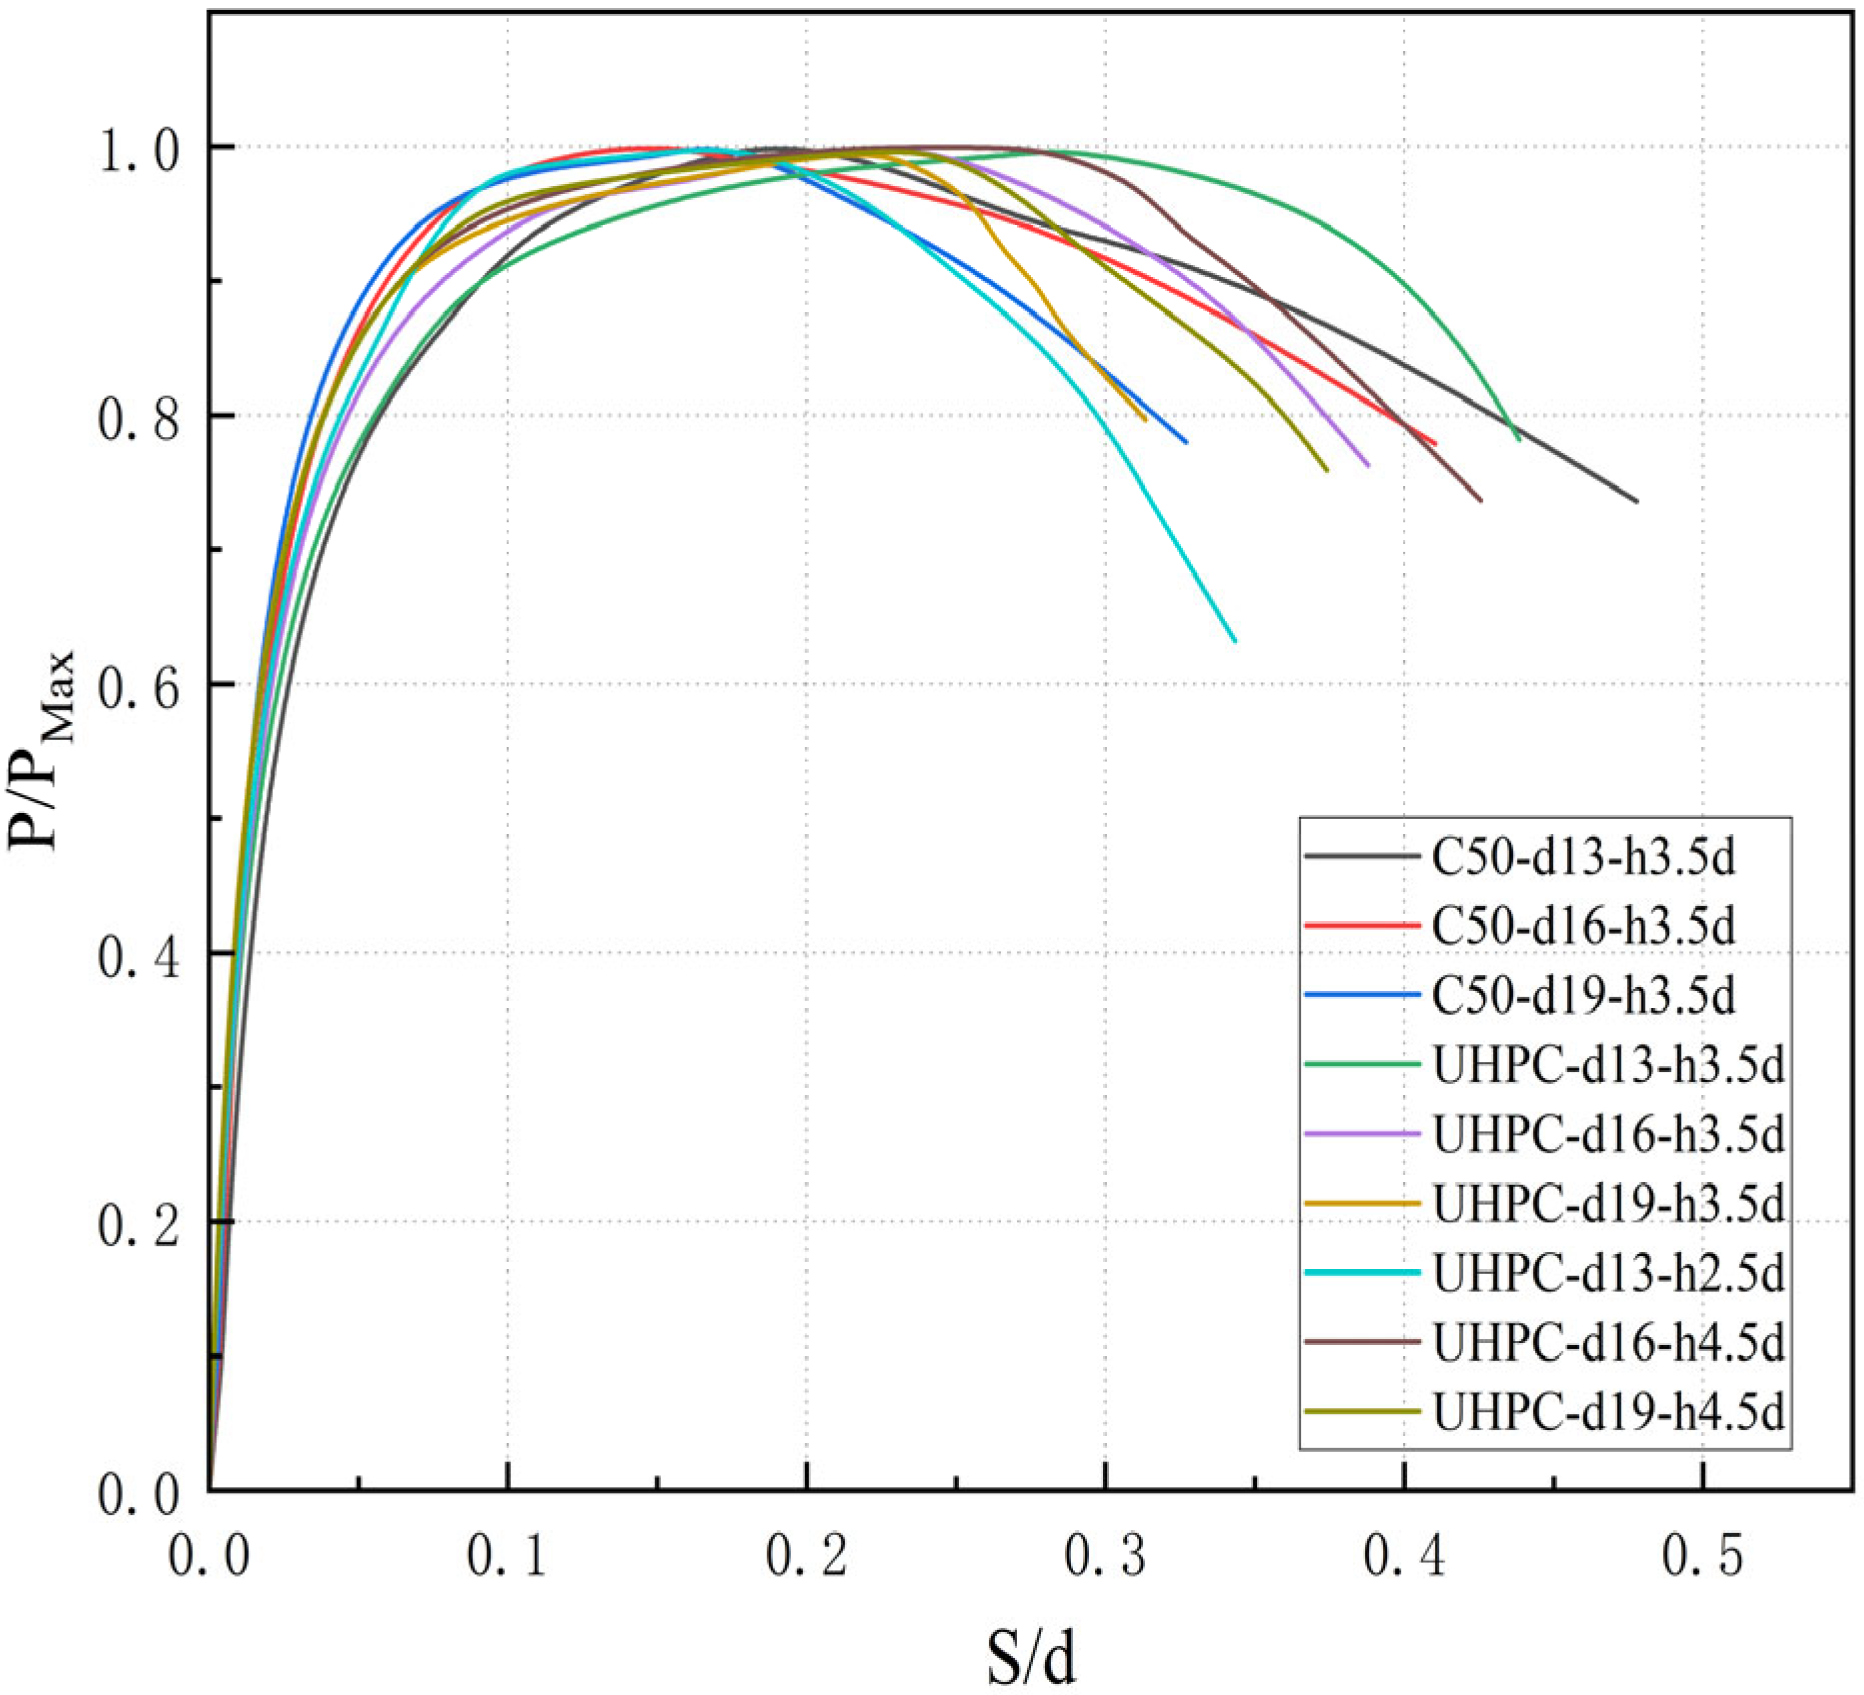
The load–slip curve not only provides a clear representation of the entire loading process and failure characteristics of shear connectors, but also enables quantitative evaluation of their stiffness, ultimate shear resistance, and ductility. It serves as a fundamental basis for assessing connection performance, verifying design safety and ductility requirements, and guiding the design and optimization of steel–concrete composite connections. Specifically, the initial stiffness is reflected by the slope of the curve at small slip levels, indicating the effectiveness of force transfer and the early-stage composite action between steel and concrete. The ultimate shear resistance corresponds to the peak of the load–slip curve and is a key parameter in shear connector design. The ductility is reflected in the post-peak softening slope and the ultimate slip capacity, representing the deformation capability after yielding and ensuring that brittle failure is avoided and sufficient deformation reserve is maintained under ultimate conditions. Therefore, the load–slip curve comprehensively captures the influence of material and geometric parameters on connector behavior and provides direct guidance for optimizing composite connection details. The load–slip curves for all cases are shown in Figure 15, Figure 16 and Figure 17, where P (shear load) is plotted on the vertical axis and S / d (slip normalized by stud diameter d ) on the horizontal axis. The dimensionless load–slip curves are presented in Figure 18. Table 5 provides a comparison of the finite element simulation results for different push-out specimens.
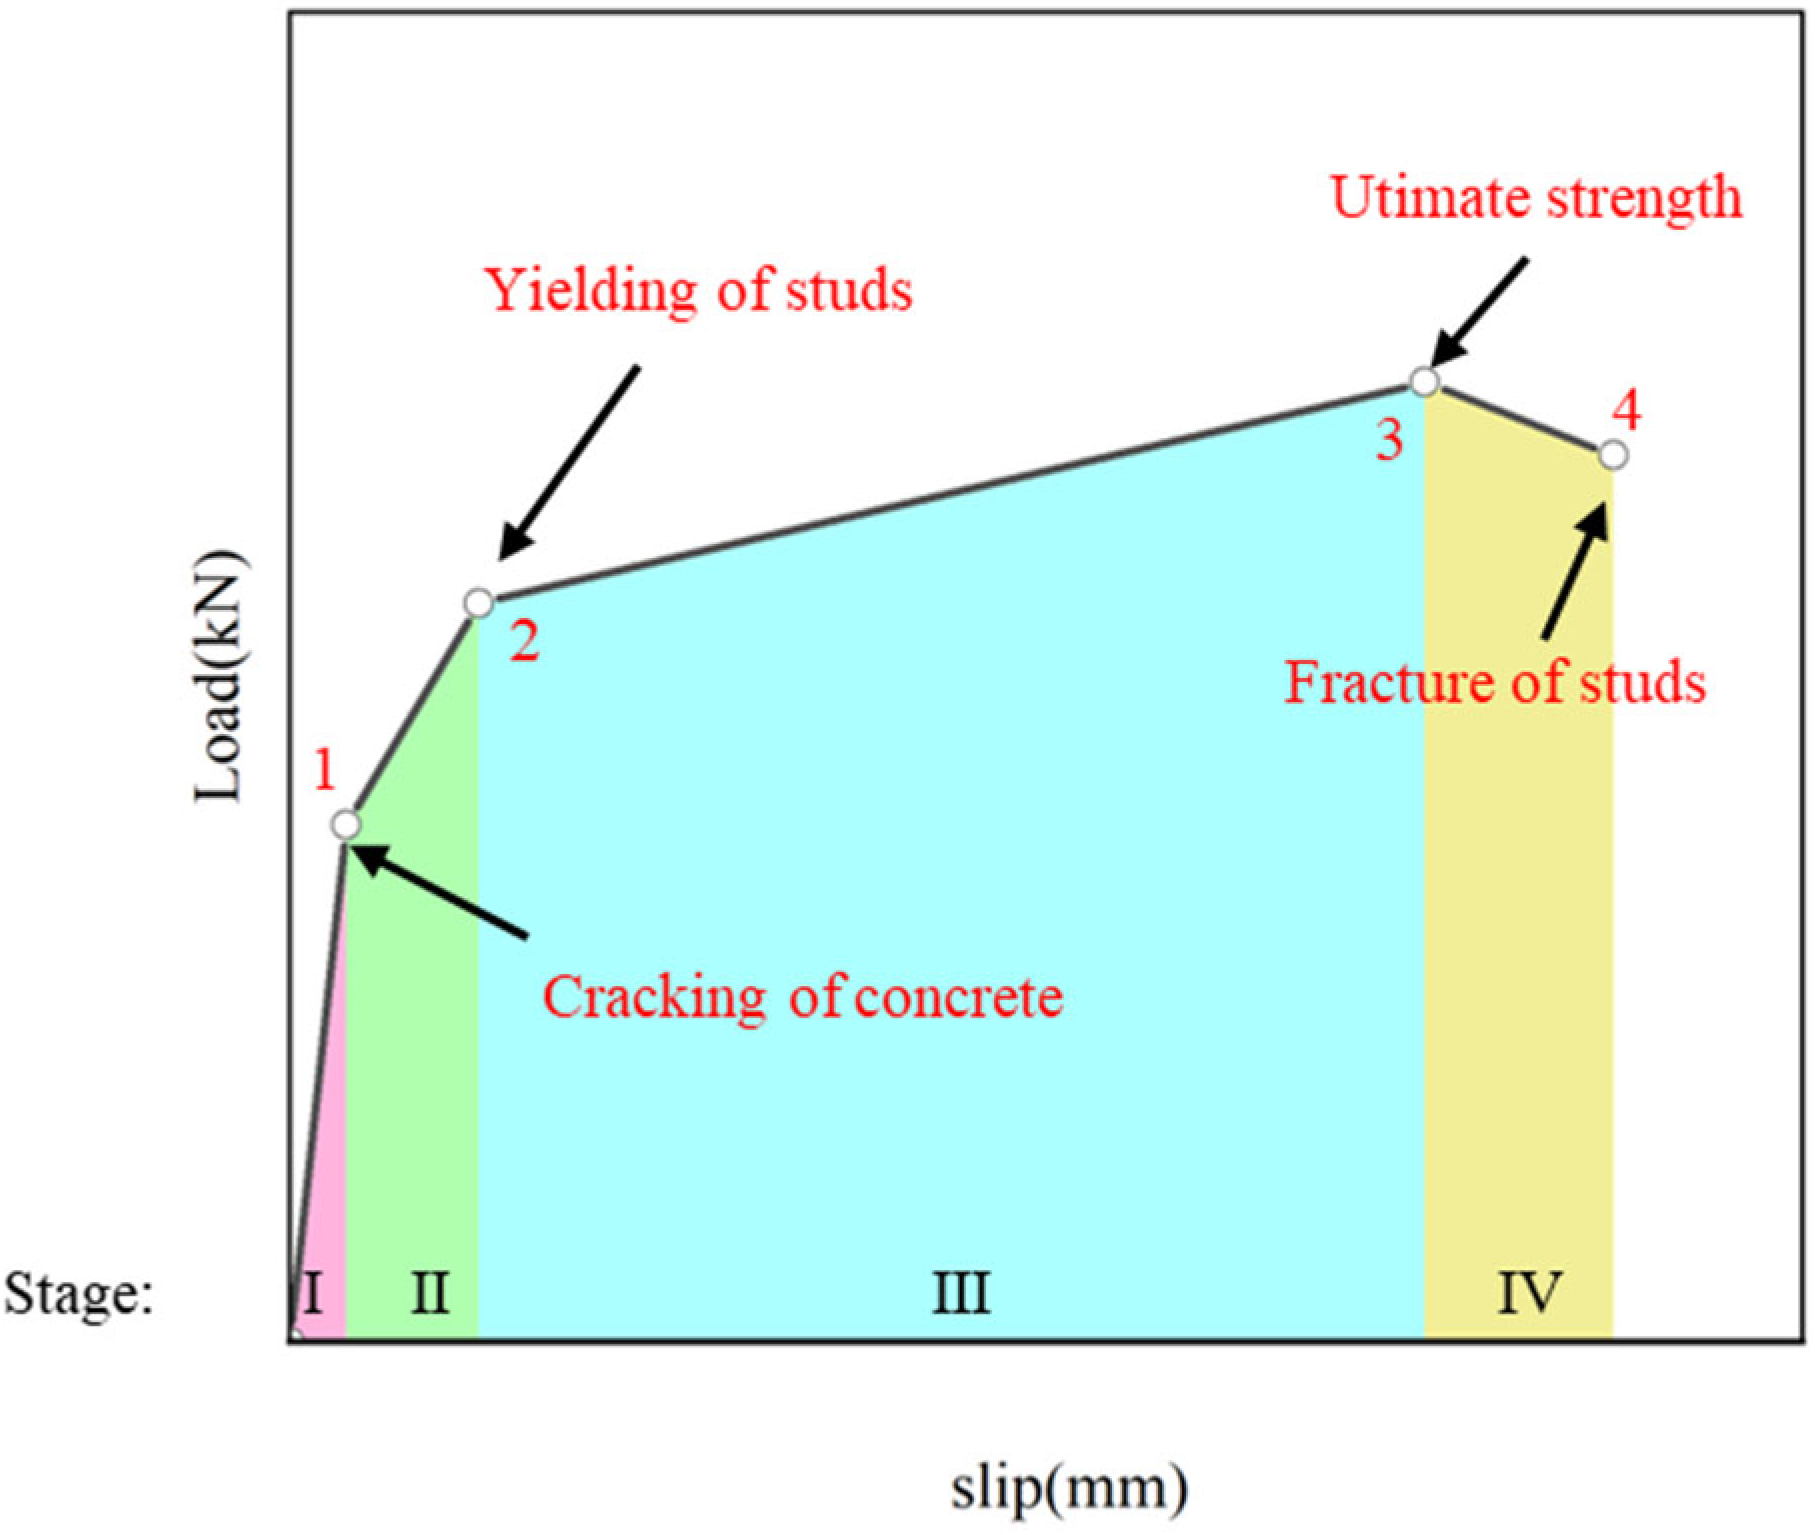
The evolution of the load–slip curves for all specimens is generally consistent, and their trends agree well with the test results reported in Ref. [1]. A typical load–slip response is shown in Figure 19. The entire loading process can be divided into four stages: elastic stage I, plastic damage stage II, plateau or peak stage III, and softening stage IV. In stage I at the beginning of load-ing, the curve rises approximately linearly and the load is roughly proportional to the slip; as the load increases, the response enters stage II, where the curve gradually de-viates from linearity, the load growth rate slows down, and the slip continues to in-crease; in stage III, the load-carrying capacity continues to increase and reaches its peak; thereafter, stage IV occurs, in which the bearing capacity decreases with increas-ing slip, and final fracture takes place in the vicinity of the weld root.
For the C50 concrete specimens, the push-out performance is strongly influenced by stud diameter. Under the same slenderness ratio, a larger diameter results in a higher initial stiffness, producing a steeper slope in the early stage and indicating better slip resistance. In terms of deformation development, the small-diameter specimen (d13) enters the plateau stage at a relatively small slip, whereas the large-diameter specimen (d19) continues to increase in load over a broader slip range and exhibits the best ductility. The peak loads of the three specimens are approximately 63.6 kN, 81.1 kN, and 101.8 kN, respectively, showing a clear increase with increasing diameter.
Under UHPC conditions, the load-bearing performance of all three stud diameters is superior to that of their C50 counterparts. Specifically, UHPC specimens exhibit steeper curves in the small-slip region, indicating significantly higher initial stiffness and enhanced slip resistance. As slip increases, UHPC specimens are also able to maintain load growth over a wider deformation range. Their peak loads—approximately 82.3 kN, 112.6 kN, and 135.1 kN—represent an overall improvement of about 30–40% compared with the corresponding C50 specimens. These results demonstrate that upgrading the concrete from C50 to UHPC significantly enhances the stiffness, deformation development, and ultimate capacity of the studs.
In UHPC specimens, the effect of stud slenderness ratio becomes particularly pronounced. For example, in the case of d13, the peak load at h/d = 2.5 is only about 71.6 kN, which is notably lower than the 82.3 kN observed at h/d = 3.5. Its load–slip curve also enters the plateau stage at a very small slip, indicating limited ductility; furthermore, at d = 13, the h/d = 3.5 specimen exhibits a failure slip smaller than the 6 mm ductility requirement specified in design codes, suggesting insufficient deformation capacity. In contrast, when the slenderness ratio is increased to h/d = 4.5, the peak loads of the d16 and d19 specimens reach 129.9 kN and 146.5 kN, respectively—both higher than the 112.6 kN and 135.1 kN recorded at h/d = 3.5. These specimens also display higher initial stiffness and sustain elevated load levels over a larger slip range, indicating significantly improved ductility and residual strength. Overall, overly low slenderness ratios (e.g., h/d = 2.5) restrict the shear capacity and ductility of studs in UHPC, whereas increasing h/d to 4.5 helps substantially enhance peak resistance, delay the onset of the plateau stage, and improve post-peak performance.
According to Eurocode 4, shear connectors should predominantly exhibit ductile failure modes. Based on the results of this study, except for studs embedded in C50 concrete and UHPC specimens with a low slenderness ratio (d13, h/d = 2.5), which show concrete-controlled failure, the majority of specimens exhibit stud bending–shear–dominated ductile failure. Thus, most specimens satisfy the ductile failure requirement stipulated by EC4.

4.4. Shear Capacity Calculation

Existing design codes in China and abroad provide formulas for calculating the shear capacity of headed studs. However, these provisions are primarily intended for studs embedded in normal-strength concrete and generally assume a stud slenderness ratio greater than 4. Their applicability to short studs in UHPC therefore requires further verification.
In the Chinese code “Steel Structure Design Standard” [39], the design shear capacity of stud connectors is given by the following equation:
P u = min 0.43 A s E c f c , 0.7 A s f u
where P u is the ultimate shear capacity of a single stud;
  • A s is the cross-sectional area of the stud shank;
  • E c is the elastic modulus of the concrete;
  • f c is the design axial tensile strength of the concrete; and
  • f u is the tensile strength of the stud material.
In the AASHTO [40] specifications, the shear capacity of stud connectors is calculated using the following equation:
P n = min 0.5 A s E c f c , A s f u
The recommended formula for calculating the ultimate shear resistance of headed studs in Eurocode 4 is given as follows:
P u = min 0.8 f u A s γ V , 0.29 α d 2 f c k E c γ V
α = 0.2 ( h / d + 1 ) 1.0
The shear capacities of stud connectors calculated using different theoretical methods were compared with the test results, as summarized in Table 6. The mean ratios of the calculated values to the experimental results for Equations (10)–(12) are 0.58, 0.84, and 0.45, respectively, with corresponding standard deviations of 0.11, 0.17, and 0.09. Among these methods, the Eurocode provides the most conservative predictions, followed by the Steel Structure Design Standard (China) and AASHTO. The shear capacities predicted by the AASHTO specifications for UHPC short studs are the closest to the numerical results.
The shear resistance of a headed stud is governed by two main components: shear resistance of the stud shank and local bearing capacity of the concrete around the stud root. The relative contributions of these two components vary with the type and strength of the concrete. Equations (9)–(11) were primarily developed based on normal-strength concrete. When the concrete strength is high, the predicted shear resistance is controlled by the term A s f u , which fails to account for the contribution of the concrete bearing capacity. As a result, these formulas significantly underestimate the shear capacity of studs embedded in UHPC. Therefore, for UHPC short studs, the shear capacity calculation may reasonably follow the AASHTO provisions.

4.5. Comparison with Previous Studies and Discussion of Novelty

Compared with existing studies, the present work extends both the scale of specimens and the applicability to practical engineering scenarios. The study in Ref. [41] investigated only four push-out specimens with small headed studs embedded in normal-strength concrete, focusing on the influence of stud diameter and length on shear capacity and ductility, and assessing existing capacity and stiffness formulas. However, its test conditions were limited to conventional concrete, providing limited reference for small studs used in thin UHPC slabs.
Ref. [42] examined the interface shear performance of seven steel–high-performance concrete specimens (ECC, UHPC, and normal concrete) and reported that ECC and UHPC specimens predominantly exhibited stud-shear failure. Nevertheless, the work mainly emphasized capacity evaluation and did not systematically address whether small-diameter and low-slenderness studs could satisfy ductility requirements in high-strength UHPC. For example, when using UHPC (fc ≈ 160 MPa) and a d13 stud with h/d = 2.7, the failure slip was less than 4.3 mm—significantly below the 6 mm ductility limit specified for ductile connectors in EC4.
In contrast, the present study conducts nine UHPC push-out tests in conjunction with numerical analysis within the context of steel–UHPC composite beam applications. The results systematically reveal the effects of stud diameter and slenderness ratio on load capacity, stiffness, and failure modes, demonstrating that excessively low slenderness ratios markedly reduce ductility. Based on the findings, a design recommendation of h/d ≥ 4.5 is proposed for small studs in UHPC to simultaneously ensure adequate strength and ductility, thereby addressing the limitations of previous studies that lacked ductility-oriented design guidance.

5. Conclusions

By comparing the numerical push-out simulations of C50 and UHPC specimens with different stud diameters and slenderness ratios, it is confirmed that the FE model agrees well with the experimental results. All load–slip curves consistently exhibit a four-stage response—elastic, plastic-damage, plateau/peak, and softening—indicating that the proposed model provides a reliable basis for the design and analysis of steel–UHPC composite structures.
Regarding geometric and material influences, for a constant slenderness ratio, increasing the stud diameter significantly enhances the initial stiffness and peak load while delaying the onset of the softening stage. Increasing the slenderness ratio further improves stiffness and strength and alleviates post-peak degradation, whereas an excessively low slenderness ratio causes the curve to enter the plateau stage prematurely, resulting in insufficient ductility. Compared with C50, UHPC specimens exhibit higher initial stiffness and peak resistance and stronger interface confinement, but they show steeper post-peak softening and more rapid reduction in residual strength. The reduction in ductility is particularly pronounced for small-diameter studs or low slenderness ratios.
The failure mode is predominantly governed by stud bending–shear, with the weld root acting as the critical weak region. Under low slenderness ratios or unfavorable parameter combinations, the response becomes more brittle and may even transition toward concrete-controlled or pull-out failure. Given that UHPC improves strength and stiffness but tends to reduce ductility and post-peak energy reserve, it is recommended to increase the stud slenderness ratio appropriately for a given diameter. This promotes a transition from concrete-controlled failure to the desirable ductile stud bending–shear failure, thereby enhancing residual strength and energy dissipation capacity and satisfying the ductility and redundancy requirements of EC4. Based on the comprehensive analysis, the slenderness ratio of small-diameter studs in UHPC composite structures should preferably be no less than 4.5.

Author Contributions

Conceptualization, T.Y.; Data Curation, Z.Z.; Formal Analysis, Z.H.; Writing—Original Draft Preparation, Z.H.; Writing—Review and Editing, Y.Q.; Software, S.W.; Project Administration, Y.Q. All authors have read and agreed to the published version of the manuscript.

Funding

This research received no external funding.

Data Availability Statement

The data presented in this study are available on request from the corresponding author.

Acknowledgments

The authors would like to thank PowerChina Road & Bridge Group Co., Ltd. for providing the engineering background, project data, and technical support for this study. The authors also appreciate the constructive comments from the editors and anonymous reviewers, which helped to improve the quality of this paper.

Conflicts of Interest

Authors Zheng Hou, Youlai Qu, Zhi Zhao, and Sirui Wang were employed by the company PowerChina Road & Bridge Group Co., Ltd. The remaining authors declare that the research was conducted in the absence of any commercial or financial relationships that could be construed as a potential conflict of interest.

References

  1. Fang, Z.; Fang, H.; Huang, J.; Jiang, H.; Chen, G. Static behavior of grouped stud shear connectors in steel–precast UHPC composite structures containing thin full-depth slabs. Eng. Struct. 2022, 252, 113484. [Google Scholar] [CrossRef]
  2. Ding, J.; Zhu, J.; Kang, J.; Wang, X. Experimental study on grouped stud shear connectors in precast steel- UHPC composite bridge. Eng. Struct. 2021, 242, 112479. [Google Scholar] [CrossRef]
  3. Ding, J.; Zhu, J.; Shi, T. Performance of grouped stud connectors in precast steel-UHPC composite bridges under combined shear and tension loads. Eng. Struct. 2023, 277, 115470. [Google Scholar] [CrossRef]
  4. Wang, Y.; Khan, M.; Uy, B.; Katwal, U.; Tao, Z.; Thai, H.-T.; Ngo, T. Long-term performance of steel-concrete composite wall panels under axial compression. Structures 2024, 64, 106606. [Google Scholar] [CrossRef]
  5. Wang, Y.; Khan, M.; Uy, B.; Lim, L.; Thai, H.-T.; Ngo, T. Behaviour, design and performance of steel-concrete composite walls in fire. J. Constr. Steel Res. 2025, 227, 109408. [Google Scholar] [CrossRef]
  6. Wang, Y.; Uy, B.; Li, D.; Thai, H.-T.; Mo, J.; Khan, M. Behaviour and design of coupled steel-concrete composite wall-frame structures. J. Constr. Steel Res. 2023, 208, 107984. [Google Scholar] [CrossRef]
  7. Gao, X.; Yin, C.; Guo, J.; Chen, G.; Huang, H. Experimental and theoretical study on the shear behaviors of an innovative precast UHPC composite beams reinforced with inverted T-shaped steel. J. Build. Eng. 2024, 96, 110504. [Google Scholar] [CrossRef]
  8. Li, B.; Fang, S.; Wen, J.; Fang, Z.; Ma, Y.; Zhao, G. Flexural and interfacial shear performance of prefabricated steel–UHPC composite beams with high-strength friction-grip bolted shear connectors: Numerical analyses and theoretical investigations. Structures 2025, 80, 109794. [Google Scholar] [CrossRef]
  9. Hamada, H.; Alattar, A.; Tayeh, B.; Yahaya, F.; Almeshal, I. Influence of different curing methods on the compressive strength of ultra-high-performance concrete: A comprehensive review. Case Stud. Constr. Mater. 2022, 17, e01390. [Google Scholar] [CrossRef]
  10. Jung, M.; Park, J.; Hong, S.-G.; Moon, J. Electrically cured ultra-high performance concrete (UHPC) embedded with carbon nanotubes for field casting and crack sensing. Mater. Des. 2020, 196, 109127. [Google Scholar] [CrossRef]
  11. Wang, H.; Wang, N.; Liu, X.-G.; Yue, Q.-R.; Yan, J.-L.; Zhang, Y. Effects of UHPC shear key on strengthening shear performances of wet joint in prefabricated composite beams. Eng. Struct. 2024, 299, 117130. [Google Scholar] [CrossRef]
  12. Wang, J.; Xu, Q.; Yao, Y.; Qi, J.; Xiu, H. Static behavior of grouped large headed stud-UHPC shear connectors in composite structures. Compos. Struct. 2018, 206, 202–214. [Google Scholar] [CrossRef]
  13. Luo, J.; Wu, G.; Zhao, G.; Ma, Y.; Fang, Z.; Fang, S. Experimental and numerical analysis on shear performance of single embedded nut bolted shear connectors in prefabricated steel-UHPC composite structures under cyclic loading. Structures 2025, 73, 108446. [Google Scholar] [CrossRef]
  14. Zhu, J.; Liu, Z.; Yu, X. Study on the shear performance of a novel riveted shear connector for steel-UHPC composite beams. Eng. Struct. 2025, 342, 120924. [Google Scholar] [CrossRef]
  15. Zong, Z.; An, G.; Gao, Z.; Xie, Q.; Guo, L.; Feng, X. Experimental and numerical investigations on shear behavior of bolt-sleeved connectors embedded in UHPC slabs with glazed hollow beads. J. Build. Eng. 2025, 114, 114396. [Google Scholar] [CrossRef]
  16. Yang, X.; He, J.; Hu, D.; Xiao, B.; Wang, N. Numerical Simulation Study on the Shear Performance of Stud–PBL Connectors in Corrugated Steel–UHPC Composite Decks. J. Railw. Sci. Eng. 2024, 21, 697–708. [Google Scholar] [CrossRef]
  17. Chang, X. Mechanical Performance of Steel–UHPC Composite Beam Bridges. Master’s Thesis, Anhui Jianzhu University, Hefei, China, 2022. [Google Scholar]
  18. Yang, H.; Zheng, Y.; Mo, S.; Lin, P. Push-out tests on studs with UHPC cover embedded in UHPC-NSC composite slab. Constr. Build. Mater. 2022, 331, 127210. [Google Scholar] [CrossRef]
  19. Zhao, Q.; Huang, G.; Xu, C.; Peng, Y. Push-Out Behavior of Short Headed Stud Connectors in Steel-Ultra High Performance Concrete Composite Deck. KSCE J. Civ. Eng. 2021, 25, 2640–2650. [Google Scholar] [CrossRef]
  20. Fang, Z.; Jiang, H.; Xiao, J.; Dong, X.; Shao, T. Shear performance of UHPC-filled pocket connection between precast UHPC girders and full-depth precast concrete slabs. Structures 2021, 29, 328–338. [Google Scholar] [CrossRef]
  21. Fang, Z.; Wu, J.; Xu, X.; Ma, Y.; Fang, S.; Zhao, G.; Jiang, H. Grouped rubber-sleeved studs–UHPC pocket connections in prefabricated steel–UHPC composite beams: Shear performance under monotonic and cyclic loadings. Eng. Struct. 2024, 305, 117781. [Google Scholar] [CrossRef]
  22. Geng, J.; Cheng, W.; Liu, G. Enhancing interface shear performance and bending resistance of UHPC permanent formwork for composite short beams by different interface treatment. J. Build. Eng. 2024, 85, 108736. [Google Scholar] [CrossRef]
  23. Gyawali, M.; Sennah, K.; Ahmed, M.; Hamoda, A. Experimental study of static and fatigue push-out test on headed stud shear connectors in UHPC composite steel beams. Structures 2024, 70, 107923. [Google Scholar] [CrossRef]
  24. Zhang, Z.; Xu, X. Static and Fatigue Behavior of Rubber-Sleeved Stud Shear Connectors as Part of Field-Cast Ultra-High Performance Concrete Connections. Materials 2020, 13, 2269. [Google Scholar] [CrossRef] [PubMed]
  25. Wei, C.; Zhang, Q.; Zhou, Y.; Cheng, Z.; Li, M.; Cui, C. Static and fatigue behaviors of short stud connectors embedded in ultra-high performance concrete. Eng. Struct. 2022, 273, 114888. [Google Scholar] [CrossRef]
  26. Fang, S.; Zhang, S.; Cao, Z.; Zhao, G.; Fang, Z.; Ma, Y.; Jiang, H. Effects of stud aspect ratio and cover thickness on push-out performance of thin full-depth precast UHPC slabs with grouped short studs: Experimental evaluation and design considerations. J. Build. Eng. 2023, 67, 105910. [Google Scholar] [CrossRef]
  27. EN 1994-1-1:2004; Eurocode 4: Design of Composite Steel and Concrete Structures—Part 1-1: General Rules and Rules for Buildings. European Committee for Standardization: Brussels, Belgium, 2004.
  28. Zhang, Z.; Zhang, F.; Wu, C. Experimental Study on the Performance of Sustainable Epoxy Resin-Modified Concrete. Sustainability 2025, 17, 6186. [Google Scholar] [CrossRef]
  29. JTG D60-2015; General Code for Design of Highway Bridges and Ulverts, Ministry of Transport of the People’s Republic of, China. China Communications Press: Beijing, China, 2015.
  30. Nguyen, H.T.; Kim, S.E. Finite element modeling of push-out tests for large stud shear connectors. J. Constr. Steel Res. 2009, 65, 1909–1920. [Google Scholar] [CrossRef]
  31. Liu, Y. Measurement and Influence Analysis of Welding Residual Stress of Shear Studs in Steel Plate–Concrete Composite Structures. Master’s Thesis, Shanghai Jiao Tong University, Shanghai, China, 2019. [Google Scholar]
  32. Jung, D.S.; Park, S.H.; Kim, T.H. Demountable Bolted Shear Connector for Easy Deconstruction and Reconstruction. Appl. Sci. 2022, 12, 1508. [Google Scholar] [CrossRef]
  33. Fang, Z.; Hu, L.; Jiang, H.; Fang, S.; Zhao, G.; Ma, Y. Shear performance of high-strength friction-grip bolted shear connector in prefabricated steel–UHPC composite beams: Finite element modelling and parametric study. Case Stud. Constr. Mater. 2023, 18, e01860. [Google Scholar] [CrossRef]
  34. Shi, Z.; Su, Q.; Kavoura, F.; Veljkovic, M. Uniaxial tensile response and tensile constitutive model of ultra-high performance concrete containing coarse aggregate (CA-UHPC). Cem. Concr. Compos. 2023, 136, 104878. [Google Scholar] [CrossRef]
  35. Yoo, D.-Y.; Lee, J.-H.; Yoon, Y.-S. Effect of fiber content on mechanical and fracture properties of ultra high performance fiber reinforced cementitious composites. Compos. Struct. 2013, 106, 742–753. [Google Scholar] [CrossRef]
  36. GB50010—2010; Code for Design of Concrete Structures. China Architecture & Building Press: Beijing, China, 2010.
  37. Zhang, F. Shear Performance of a Novel Bolted Shear Connector for Prefabricated Steel–UHPC Composite Beams. Ph.D. Thesis, Guangzhou University, Guangzhou, China, 2023. [Google Scholar]
  38. Pavlović, M.; Marković, Z.; Veljković, M.; Buđevac, D. Bolted shear connectors vs. headed studs behaviour in push-out tests. J. Constr. Steel Res. 2013, 88, 134–149. [Google Scholar] [CrossRef]
  39. GB 50017-2017; Steel Structure Design Standard. Ministry of Housing and Urban-Rural Development of PRC: Beijing, China, 2017.
  40. American Association of State Highway and Transportation Officials. AASHTO LRFD Bridge Design Specifications, 8th ed.; with 2019 Interim Revisions; American Association of State Highway and Transportation Officials: Washington, DC, USA, 2017. [Google Scholar]
  41. Yang, S.; Shi, Z.; Wu, K. Shear performance of small shear studs in steel–concrete composite bridge decks. Railw. Stand. Des. 2025, 69, 96–103. [Google Scholar]
  42. Qiao, H.; Tang, L.; Zhang, Y. Experimental study on the shear performance of interface studs in steel plate–HPC composite bridge deck. Concrete 2025, 209–214. [Google Scholar]
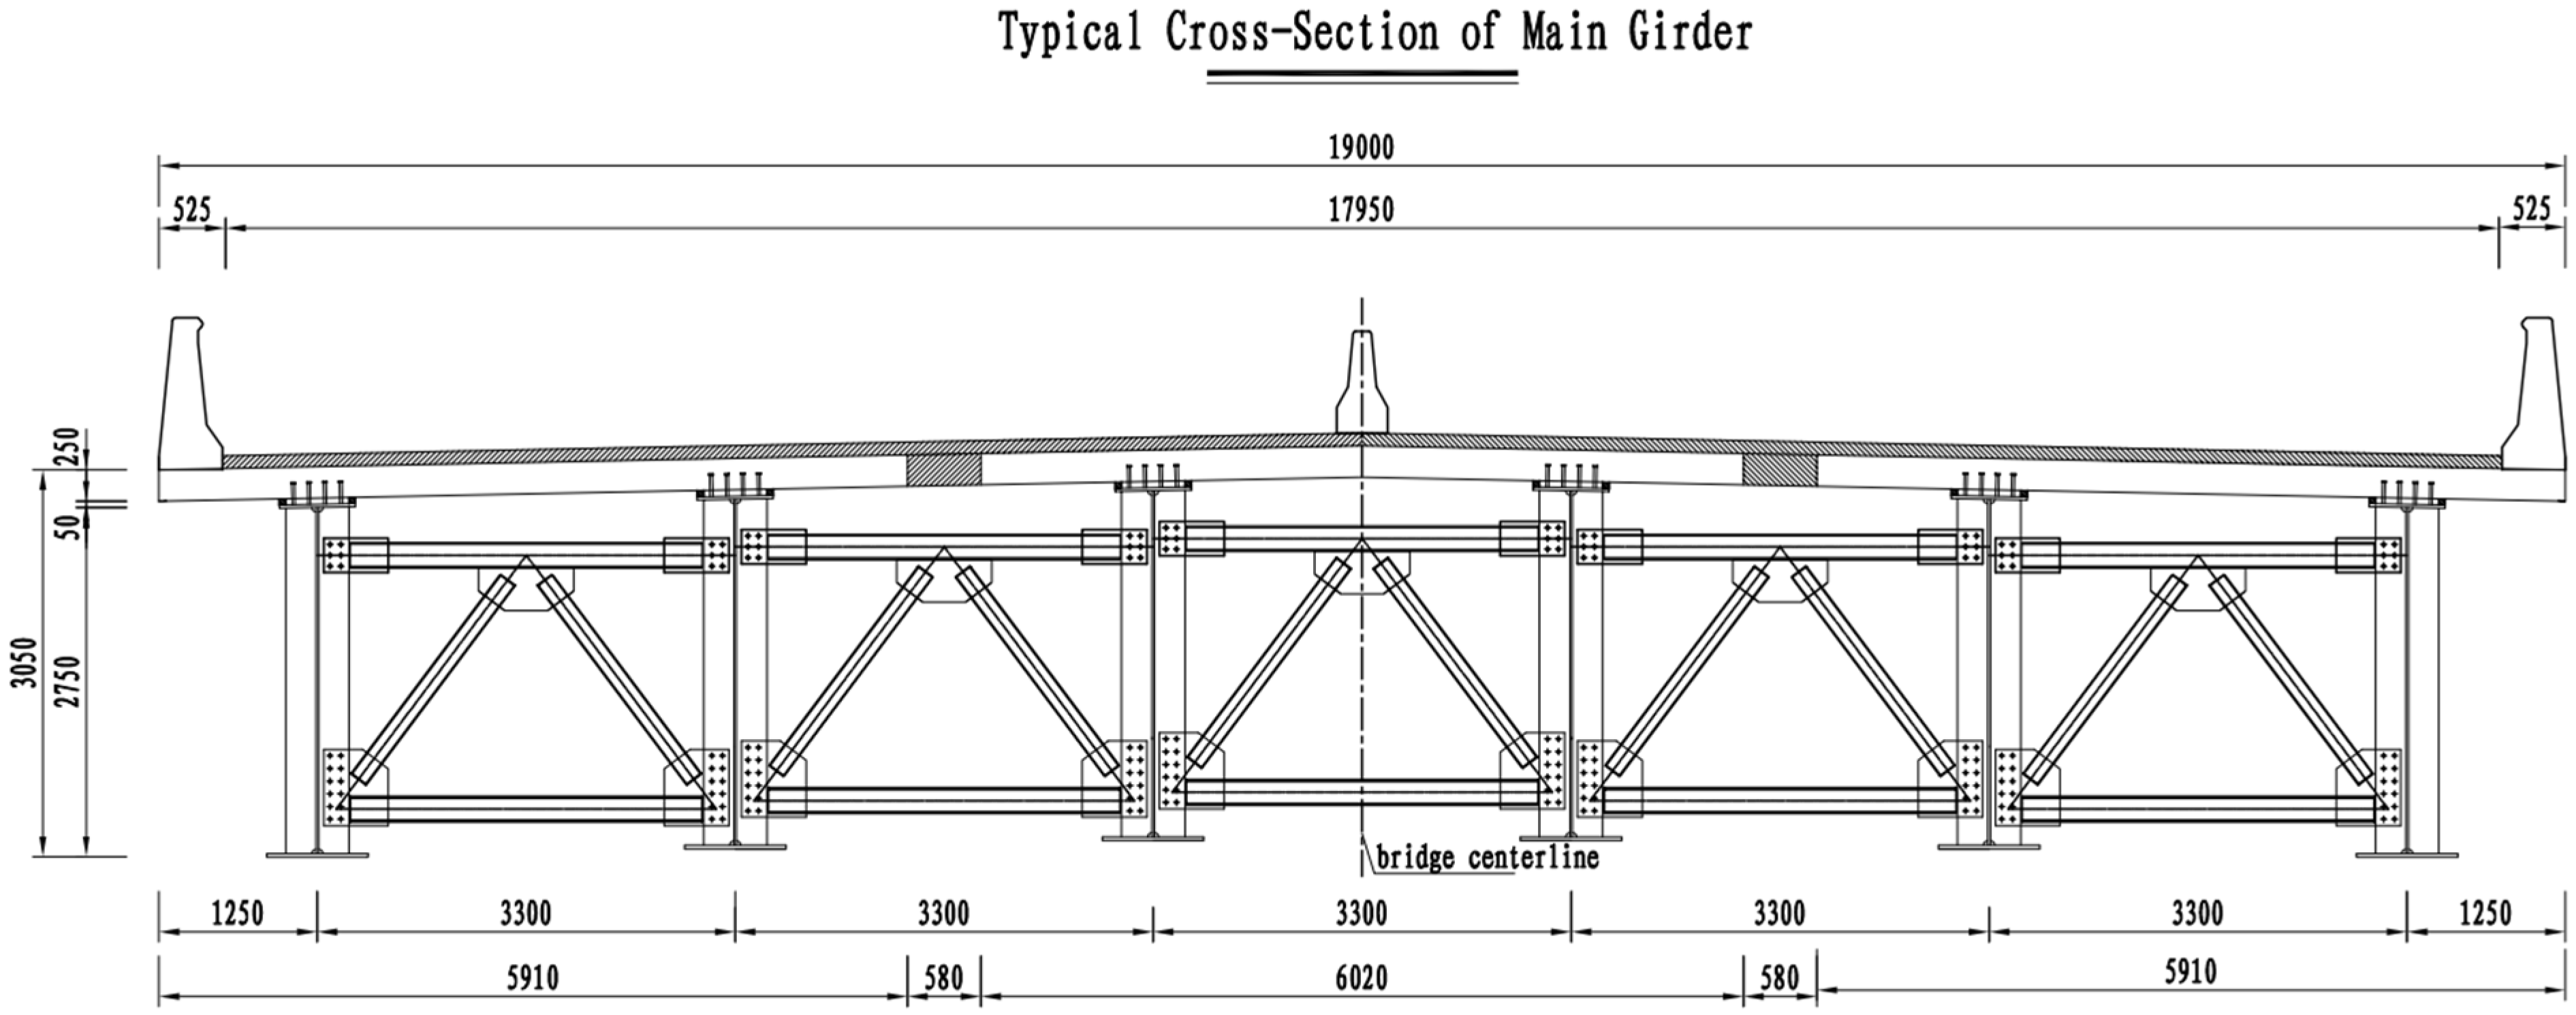
Figure 1. Standard cross-section of a steel–concrete composite beam.
Buildings 15 04244 g001
Figure 2. Detailed configuration of the deck panel connection.
Buildings 15 04244 g002
Figure 3. Schematic of unit subdivision for the main girder and cross-beam.
Buildings 15 04244 g003
Figure 4. Push out the specimen model.
Buildings 15 04244 g004
Figure 5. Stress–strain relationships of concrete.
Buildings 15 04244 g005
Figure 6. Stress–strain relationships of steel.
Buildings 15 04244 g006
Figure 7. Mesh division of finite element model.
Buildings 15 04244 g007
Figure 8. The FEM load–slip curves from different mesh sizes.
Buildings 15 04244 g008
Figure 9. Energy evolution of the finite element model over computation time.
Buildings 15 04244 g009
Figure 10. Boundary conditions.
Buildings 15 04244 g010
Figure 11. Damage pattern of the finite element model for the push-out specimen. (a) P-22-75 numerical simulation; (b) P-22-50 numerical simulation.
Buildings 15 04244 g011aBuildings 15 04244 g011b
Figure 12. Load–slip curve between push-out test and finite element simulation. ( Test curves P-22-75 and P-22-50 are from the push-out tests reported by Fang et al. [1]).
Buildings 15 04244 g012
Figure 13. Local crushing and plastic deformation of shear connector.
Buildings 15 04244 g013
Figure 14. Stud fractured at base without concrete splitting.
Buildings 15 04244 g014
Figure 15. Load–slip curves of C50 specimens with h/d = 3.5 and varying stud diameters.
Buildings 15 04244 g015
Figure 16. Load–slip curves of UHPC specimens with h/d = 3.5 and varying stud diameter.
Buildings 15 04244 g016
Figure 17. Load–slip curves of UHPC specimens with different stud slenderness ratios (h/d).
Buildings 15 04244 g017
Figure 18. Comparison of normalized load–slip curves for all specimens.
Buildings 15 04244 g018
Figure 19. Typical response in terms of slip under applied load.
Buildings 15 04244 g019
Table 1. Material parameters.
UnitMaterialsModulus of Elasticity (MPa)Poisson’s RatioYield Strength (MPa)Ultimate Strength (MPa)
stud connectorML15AL2.0 × 1050.3404.00532.00
I beamQ3452.0 × 1050.3348.86530.92
RebarHRB4002.0 × 1050.3412.00542.00
Concrete slabC553.59 × 1040.261.7
UHPC slabUHPC4.5 × 1040.2149.1
Table 2. Parameters of the finite element model of the introduced specimen.
SpecIDConcreted (mm)s (mm)h/dh (mm)
C50-d13-h3.5dC50131003.045.5
C50-d16-h3.5dC50161003.056
C50-d19-h3.5dC50191003.066.5
UHPC-d13-h3.5dUHPC131003.045.5
UHPC-d16-h3.5dUHPC161003.056
UHPC-d19-h3.5dUHPC191003.066.5
UHPC-d13-h2.5dUHPC131002.532.5
UHPC-d16-h4.5dUHPC161003.7572
UHPC-d19-h4.5dUHPC191003.7585.5
Table 3. ABAQUS finite element software CDP model parameter values.
Expansion AngleEccentricityIntensity RatioKCoefficient of ViscosityExpansion Angle
360.11.160.590.000136
Table 4. Comparison of numerical and experimental results.
SpecIDPmax (kN) δ P max δ max K0 (kN/mm)Pmax Error (%) δ P max Error (%) δ max Error (%)K0 Error (%)
P-22-75 (Ref. [1])167.304.226.80188.44 5.12.132.357.78
P-22-75 (FEA)175.824.316.64203.10
P-22-50 (Ref. [1])157.223.625.04239.96 3.033.312.581.25
P-22-50 (FEA)152.463.744.91243.05
Note: P m a x is the peak load of the specimen; K 0 is the initial slip stiffness; δ P max displacement corresponding to the peak load. δ max Maximum slip during loading.
Table 5. Comparison of finite element simulation results for different push-out specimens.
SpecIDPmax (kN) δ P max δ max K0 (kN/mm)
C50-d13-h3.5d63.602.446.3187.02
C50-d16-h3.5d81.112.666.52128.06
C50-d19-h3.5d101.823.216.23134.49
UHPC-d13-h3.5d82.323.665.70156.67
UHPC-d16-h3.5d112.603.766.05229.15
UHPC-d19-h3.5d135.104.045.96294.09
UHPC-d13-h2.5d71.602.204.46167.62
UHPC-d16-h4.5d129.904.216.81284.22
UHPC-d19-h4.5d146.504.417.10319.00
Table 6. Comparison between shear capacities obtained from different calculation methods and test results.
SpecIDFE ResultknCalculated Value (kN)Calculated/FE Ratio
Equation (10)Equation (11)Equation (12)Equation (10)Equation (11)Equation (12)
C50-d13-h3.5d63.6038.5655.0829.3829.3829.3829.38
C50-d16-h3.5d81.1058.4183.4444.5044.5044.5044.50
C50-d19-h3.5d101.8082.36117.6662.7562.7562.7562.75
UHPC-d13-h3.5d86.4238.5655.0829.38 29.3829.3829.38
UHPC-d16-h3.5d112.5058.4183.4444.5044.5044.5044.50
UHPC-d19-h3.5d135.1082.36117.6662.7562.7562.7562.75
UHPC-d13-h2.5d71.6038.5655.0829.3829.3829.3829.38
UHPC-d16-h4.5d129.9058.4183.4444.5044.5044.5044.50
UHPC-d19-h4.5d146.5082.36117.6662.7562.7562.7562.75
Mean0.580.840.45
Standard deviation0.110.170.09
Disclaimer/Publisher’s Note: The statements, opinions and data contained in all publications are solely those of the individual author(s) and contributor(s) and not of MDPI and/or the editor(s). MDPI and/or the editor(s) disclaim responsibility for any injury to people or property resulting from any ideas, methods, instructions or products referred to in the content.