Article

Performance Study of Nano-Enhanced PCM in Building-Integrated Semi-Transparent Photovoltaic Modules

by
Nashmi H. Alrasheedi
1,
Alagar Karthick
2,*,
P. Manoj Kumar
3 and
Vijayakumar Rajendran
4
1
Department of Mechanical Engineering, College of Engineering, Imam Mohammad Ibn Saud Islamic University (IMSIU), Riyadh 11432, Saudi Arabia
2
Department of Electrical and Electronics Engineering, Saveetha School of Engineering, Saveetha Institute of Medical and Technical Sciences, SIMATS, Chennai 602105, Tamilnadu, India
3
Department of Mechanical Engineering, Audisankara College of Engineering & Technology, Gudur 524101, Andhra Pradesh, India
4
Centre for Smart Energy Systems, Chennai Institute of Technology, Chennai 600069, Tamilnadu, India
*
Author to whom correspondence should be addressed.
Buildings 2025, 15(23), 4236; https://doi.org/10.3390/buildings15234236
Submission received: 11 October 2025 / Revised: 13 November 2025 / Accepted: 20 November 2025 / Published: 24 November 2025

Abstract

Buildings account for nearly 40% of global energy consumption, mainly due to the demands of artificial lighting and heating, ventilation, and air-conditioning (HVAC) systems. The integration of semi-transparent photovoltaic (STPV) modules into building envelopes presents a sustainable strategy to lower energy use while simultaneously replacing conventional roofs and façades. However, the performance of STPV systems is strongly influenced by incident solar radiation and building orientation, and elevated surface temperatures can further diminish their efficiency. In this study, the performance of an STPV module was assessed by placing it on a horizontal surface and varying its orientation relative to a 90° reference. To mitigate thermal effects and improve efficiency, a thermal management system incorporating a calcium chloride hexahydrate-based phase change material (PCM) was employed. The PCM was enhanced with nanomaterials—graphene oxide (GO) and aluminum oxide (Al2O3)—at weight fractions of 0%, 0.25%, 0.5%, and 1%. The thermophysical properties of the nano-enhanced PCM were analyzed using differential scanning calorimetry (DSC), thermogravimetric analysis (TGA), and thermal conductivity measurements. Under incident solar radiation of 941 W/m2, the electrical efficiencies of the PV, PV–PCM1, and PV–PCM2 modules were measured at 13.75%, 16.84%, and 15.28%, respectively, demonstrating the potential of nano-enhanced PCM to improve STPV performance.

1. Introduction

The rising global demand for fossil fuels—the primary inputs for power generation—must be met to sustain this essential commodity. However, this also set off a chain reaction that altered Earth’s bioclimate, leading to rising temperatures, ozone depletion, and melting polar ice [1,2]. Renewable energy sources such as solar, wind, and hydro are becoming more popular as Earth’s crustal fossil fuels are rapidly depleted by human activity [3]. The low operating and maintenance costs of solar photovoltaics have made them popular worldwide [4]. The PV system is cost-effective, and its performance is affected by rising surface temperatures of the PV module.
Integration of the photovoltaic module into the building is an emerging technology that replaces conventional roofs and façades. The performance of the semi-transparent photovoltaic (STPV) system varies with geographical location, building orientation, and incident solar radiation [5]. The thermal management of a photovoltaic system can be divided into two types: active and passive methods. During operation, external power sources are required to cool the PV system. The passive method does not require any external sources. Phase change material (PCM) as a cooling medium is the appropriate choice for the passive approach. Solar photovoltaic (PV) systems that use PCM technology have been the subject of much study in recent years [6]. The idea of using PCM with a PV panel to store thermal energy first came up in 1978. Despite the recommendation, research on PCM’s potential for PV cooling did not begin until the 1990s [7]. The stability of the PV panel’s temperature is also essential for the proper functioning of the solar cells [8]. Solar photovoltaic (PV) systems have been the focus of much investigation into organic PCM due to concerns about their safety and lack of side effects [9]. Mixing eutectics with inorganic or organic elements, by varying the mass concentration of the individual components, allows you to determine their melting points [10]. Optional materials for latent heat storage generally include inorganic PCM, the most common of which are salts, hydrated salts, molten salts, and mixed salts. The needs of the expanding field of phase change energy storage technology are often beyond the capabilities of a single-component hydrated salt [11,12].
PCM has been investigated for a hot, humid climatic condition location. At its lowest point in April, the PV temperature drops to about 13 °C. The efficiency of PV–PCM cooling was 5.9% higher year-round [13]. The use of a metallic tube and a finned PCM enhanced convective heat transfer, thereby improving temperature regulation. The result was a 3% increase in PV efficiency, and a maximum temperature decrease of 15 °C. Using pure PCM and NPCM (CuO) [14]. The outdoor experiment is performed using passive cooling and PCM-cooling with and without microfins. In the reference system, PCM lowers the mean temperature to 9.6 °C, but in the NPCM system, it drops it to 11.2 °C. The temperature dropped to 10.7 °C with PCM and 12.5 °C with NPCM, thanks to the fins [15]. The PV panels in the Vehari and Dublin climates that had interior finned PCM. There have been uses for PCM1 and PCM2, which are eutectic salts of capric and palmitic acid. In Dublin, PCM1 reduced the PV temperature to 43 °C, while PCM2 brought it down to 39 °C. Compared to PCM1 and PCM2, the PV temperature in Vehari dropped from 63 °C to 46 °C and 42 °C, respectively. With a maximum PV temperature drop of 21 °C, both PCMs saved 13% more energy in Vehari than in Dublin [16]. The nano-enhanced PCM is prepared by dispersing graphene Nano powders in paraffin with volume fractions of 0, 1, 5, 10, and 20 wt%. Installed beneath the nano-enhanced PCM shell, the cooling channel allows water to flow through it and lowers the temperature of the solar panels. They found that a concentration of 10 wt% resulted in the photovoltaic/thermal system’s maximum electrical efficiency of around 22% [17]. The investigation of graphene nanoplatelets in PCM affects the efficiency of concentrated PV/T modules. The PCM is an OM35 organic chemical combination, and the performance of concentrated PV/T cells with and without PCM is examined. Consequently, at a nano/PCM volume fraction of 0.5%, the concentrated PV/T cells achieved the greatest increases in electrical production of about 7% and electrical efficiency of about 6% [18]. The nano/PCM is incorporated into water and is a mixture of 82% coconut oil and 18% sunflower oil. Adding boehmite Nano powders to PCM at a volume fraction of 0.009 wt% PCM resulted in a solar panel power output that was 48.23% higher than that of reference solar panels [19]. The concentrator solar panel system, developed, manufactured, and evaluated, incorporates a nano-enhanced PCM and a multi-cavity heat sink. According to the research, the PV system’s thermal efficiency improved by 65%, its electrical efficiency by 10%, and its power production efficiency by about 235 W [20]. The impact of several nanoparticles and PCMs on PV/T behavior is examined by including Cu, MWCNT, GNP, and Di nanoparticles, along with Calcium chloride hexahydrate, Paraffin wax RT25, and Paraffin wax RT-35. It is found that paraffin wax-RT35 provided better thermal control of the solar panel and that calcium chloride hexahydrate PCM offered better productivity at lower temperatures [21]. The investigation of PCM in a PV module was carried out at various inclination angles (−45°, 0°, 45°, 90°), concentration ratios (5, 20), and PCM (CaCl2·6H2O) layer thicknesses (5, 20 cm) [22].
In Greece, Spyros et al. investigated PV panel cooling using RT27 as the PCM. Using PCM in cooling PV panels increases power generation by around 9.4% over their 25-year lifespan, according to the authors. Furthermore, it has the potential to extend the lifespan of a PV panel by 5 years [23]. Using a solar simulator, investigated the impact of paraffin as a PCM on photovoltaic panels in a controlled indoor environment with no wind, 1000 W/m2 of solar radiation, and 7 °C of atmospheric temperature. The system achieved a 1.63% increase in mean electrical efficiency and a maximum temperature reduction of 36.5 °C in 5 h [24]. The improved PV panel performance by applying RT48 PCM to the panels’ back surfaces. In addition to a 3% improvement in electrical efficiency, the authors noted a 2.5 °C drop in panel temperature [25]. Using RT27 as the PCM under Greece’s climate conditions, use a PCM-OM37P installed on the panels’ reverse side to maintain panel temperatures close to the environmental temperature at the Renewable Power and Energy Efficiency Centre, University of Tabuk. The authors discovered a 3% increase in power output [26].
In their 2023 study, Abir et al. cooled the PV panel using the ANSYS 2023 Fluent simulation program. On the reverse side of the PV panel, there is a layer of RT42-PCM with thicknesses ranging from 0.02 m to 0.07 m. The system also includes an aluminum heat island with fins. At an average thickness of 0.06 m, the authors found that the PV cells’ temperature decreased by 32 K compared to the typical module. There was a 72.2% increase in the maximum electric power output [27]. In their 2023 study, Ramadan et al. investigated PV cell thermal management utilizing MATLAB software (MATALAB 2024A) and a combination of heat pipes and PCM (RT25, RT35, and RT42) as heat sinks and heat transfer media, respectively. Results showed a maximum thermal efficiency of 48.9% and an electrical efficiency 5.3% higher than that of conventionally cooled PV cells in the RT25-based system [28]. By using a sheet of aluminum and PCM as heat sinks with a 12 V 20 W solar cell, observed a temperature reduction of up to 24.8%. The result was an improvement in electricity efficiency [28]. To cool photovoltaic panels, used semi-cylindrical, triangular, and rectangular fins. The solar radiation intensities tested were 510 W/m2, 680 W/m2, and 850 W/m2. The authors found that the reference PV panel’s temperature was reduced by 24% at the lowest radiation intensities and by 19.4% at the highest, respectively, when compared with the RT42 with triangle fins. Additionally, the cooling process of the PV panel increased efficiency [29].
According to the literature, studies have explored PV–PCM integration; most have focused on opaque crystalline silicon modules and conventional organic PCMs, with limited attention to semi-transparent PV systems and inorganic, nano-enhanced PCMs suitable for building integration. Furthermore, existing work rarely examines how nanoparticle additives affect thermal and electrical performance under real outdoor conditions and across varying orientations. This study bridges that gap by experimentally evaluating nano-doped CaCl2·6H2O-based PCMs integrated with semi-transparent PV modules, establishing a direct correlation between improved thermophysical properties and enhanced electrical efficiency for building-integrated applications.
The experimental evaluation under different module orientations (east, west, and south) and irradiance conditions establishes new correlations between thermophysical enhancement and PV performance metrics. These results reveal how nanomaterial doping extends the effective cooling duration, reduces peak cell temperature, and increases electrical efficiency by 2–3%. The incremental knowledge gain lies in providing experimentally validated evidence that nano-engineered inorganic PCMs can be effectively coupled with STPV modules for passive thermal management in building-integrated photovoltaic systems, bridging the gap between material-level improvements and system-level energy performance.

2. Materials and Methods

2.1. Objectives

The study aims to examine the electrical and thermal efficacy of semi-transparent photovoltaic (STPV) modules both with and without phase change material. STPV and STPV–PCM modules were evaluated for several applications, including flat roofs (0°) and façades (90°). The experiment is conducted across various façade orientations—south, east, and west—by integrating STPV modules into the flat roof and façades. North orientation is disregarded because the experimental location is in the Northern Hemisphere.
The enhancements in electrical and thermal performance of STPV modules are attributed to the integration of PCM with nanoparticles. Appropriate instrumentation is supplied for the system to measure the electrical and thermal characteristics, as detailed in Table 1. The approach of this investigation is illustrated in Figure 1.

2.2. Materials

2.2.1. Preparation of the PCM

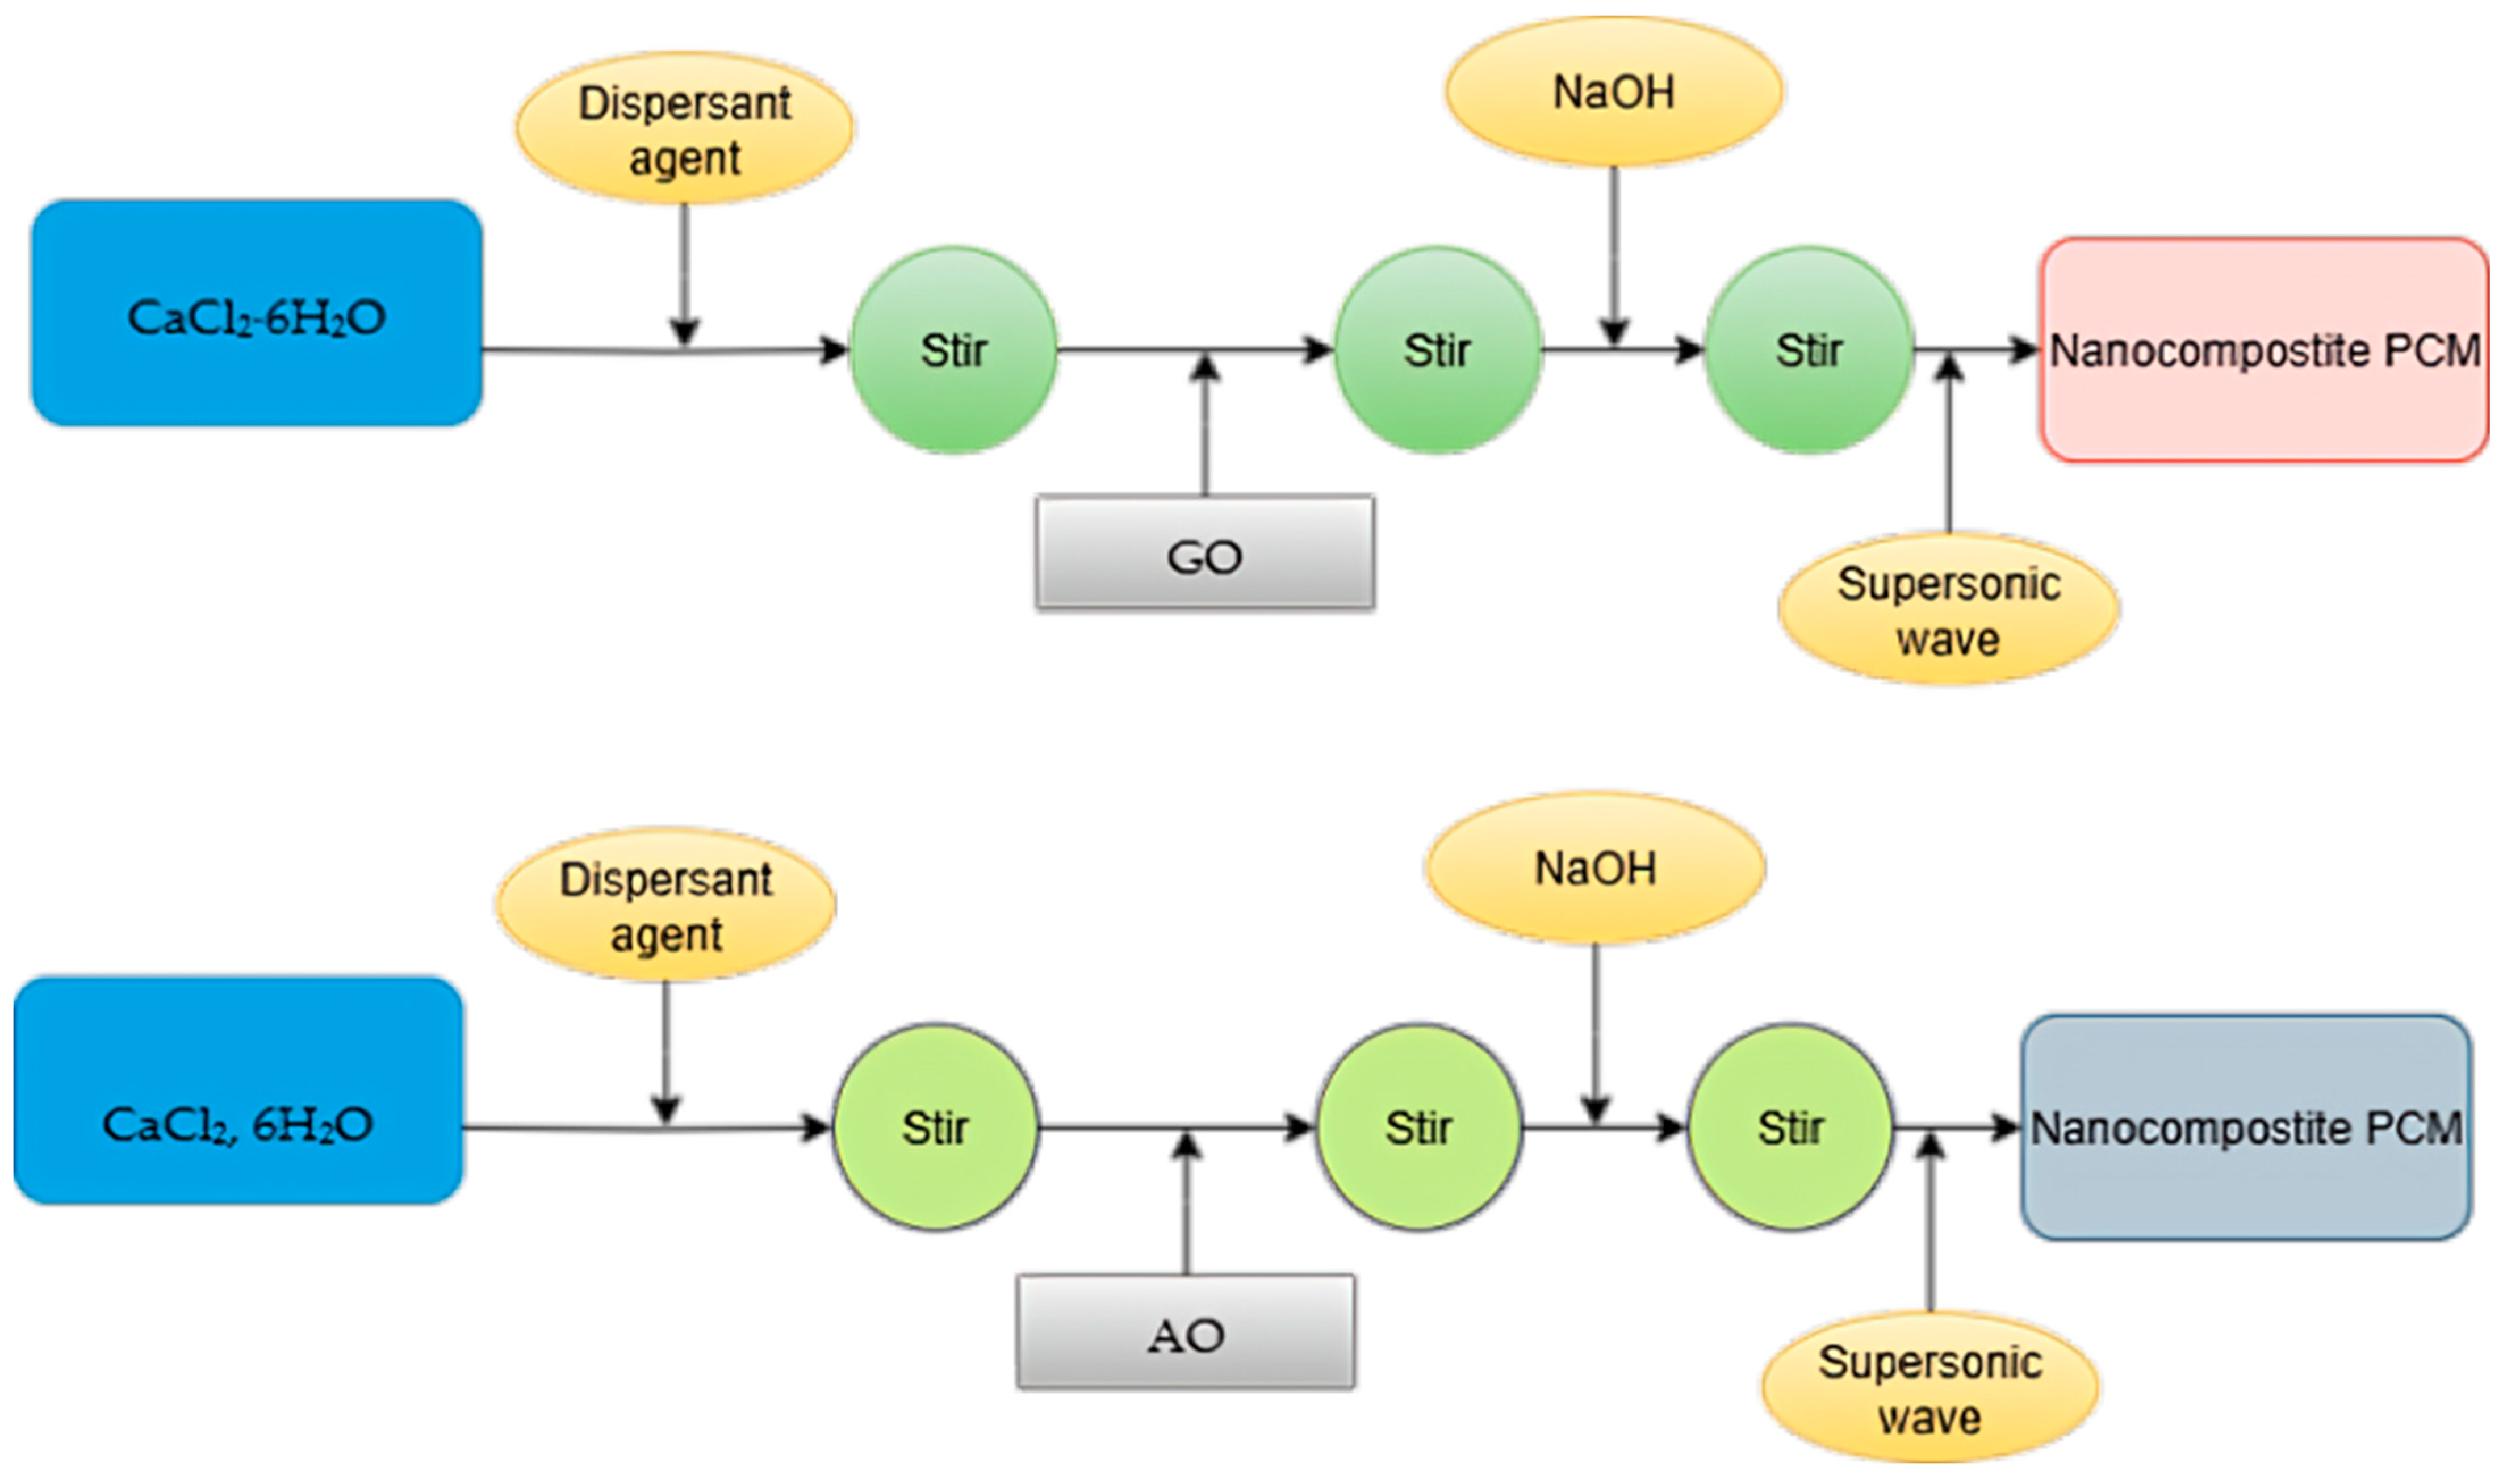
Calcium chloride hexahydrate (CaCl2·6H2O) was used as the base PCM, and it was modified with aluminum oxide (Al2O3) and graphene oxide (GO) nanoparticles to enhance its thermal conductivity and stability. The required quantity of nanoparticles was dispersed in distilled water using ultrasonication for 30 min to ensure uniform suspension and prevent agglomeration. The nanoparticle suspension was then slowly dissolved by adding CaCl2·6H2O while stirring continuously with a magnetic stirring rod. To achieve a uniform dispersion of the nanoparticles throughout the PCM matrix, the mixture was further mixed and sonicated. Sealing the composite PCM into containers prevented it from absorbing moisture and kept it stable until testing. Figure 2 displays the Nanocomposite Preparation Process.

2.2.2. Fabrication of STPV Module

Building the STPV module involves sandwiching a solar cell and a PCM layer between two sheets of glass. Adding phase change materials could decrease the surface temperature of the PV cell, increasing the system’s total energy production. Table 1 details the STPV system’s specifications. The generalizability and good heat transport properties of calcium chloride hexahydrate led to its selection as the study’s basic material. The melting point (29–30 °C), non-flammability, low cost, and high latent heat of calcium chloride hexahydrate made it an effective candidate for PV temperature management. Incorporating graphene oxide (GO) with aluminum oxide (Al2O3) nanoparticles into phase change materials (PCMs) further improved their thermal performance. The function of GO and Al2O3 in enhancing performance. GO’s large surface area and high thermal conductivity make it an excellent medium for dispersion stabilization and heat transfer enhancement. Nanoparticles of aluminum oxide improve effective thermal conductivity and create new thermal routes. As a whole, it improves thermal performance by decreasing thermal resistance and speeding up heat absorption and release.
With these nanoparticles added, PCMs’ thermal conductivity is much enhanced. The formation of two-dimensional conductive networks inside the PCM matrix and the high intrinsic conductivity of GO provide for more efficient and rapid heat transmission. In a similar vein, the effective thermal performance of the PCM is improved by adding aluminum oxide, a ceramic material that is stable and has a very high thermal conductivity (30 W/m·K). Evidence suggests that GO and Al2O3, when combined at concentrations between 0.25 and 1 wt%, can increase thermal conductivity by 15–60%. The exact amount by which this improvement is achieved depends on variables including particle size, synergistic effects, and the quality of the dispersion. While there is an increase in thermal conductivity, there is a risk of decreased latent heat capacity, higher viscosity, and nanoparticle aggregation at higher concentrations. Thus, in order to strike a balance between thermal increase and the PCM’s long-term durability, it is crucial to optimize the nanoparticle concentration. Because it delays solidification and lowers thermal cycle efficiency, CaCl2·6H2O has a tendency to supercool below its natural freezing point, around 29 °C. In order to reduce the level of supercooling to below 2 °C, a nucleating agent consisting of 1 weight percent SrCl2·6H2O was introduced. To further reduce phase segregation during the repeated melt-freeze cycles, the hydrated salt was well mixed before encapsulation. In order to keep the components from separating, the PV–PCM system operated within a constant temperature range of 25 to 45 °C.
An inner high-density polyethylene (HDPE) liner and an outside aluminum-laminated polymer film encased the PCM due to CaCl2·6H2O’s corrosive nature towards metals. The aluminum–polymer laminate acts as a water-and vapour-proof barrier, while the high-density polyethylene (HDPE) provides superior mechanical stability and resistance to chlorides. This setup separates the PCM into the electrical and metallic parts of the PV module, prevents oxygen from entering, and prevents leakage.
To verify durability, encapsulated PCM samples underwent accelerated thermal cycling between 20 °C and 60 °C for 100 h. Post-test inspection revealed no visible leakage, swelling, or corrosion. Contact compatibility tests were also conducted by placing encapsulated PCM against aluminum and copper plates for 30 days at 45 °C, during which no measurable mass loss or discoloration was observed.
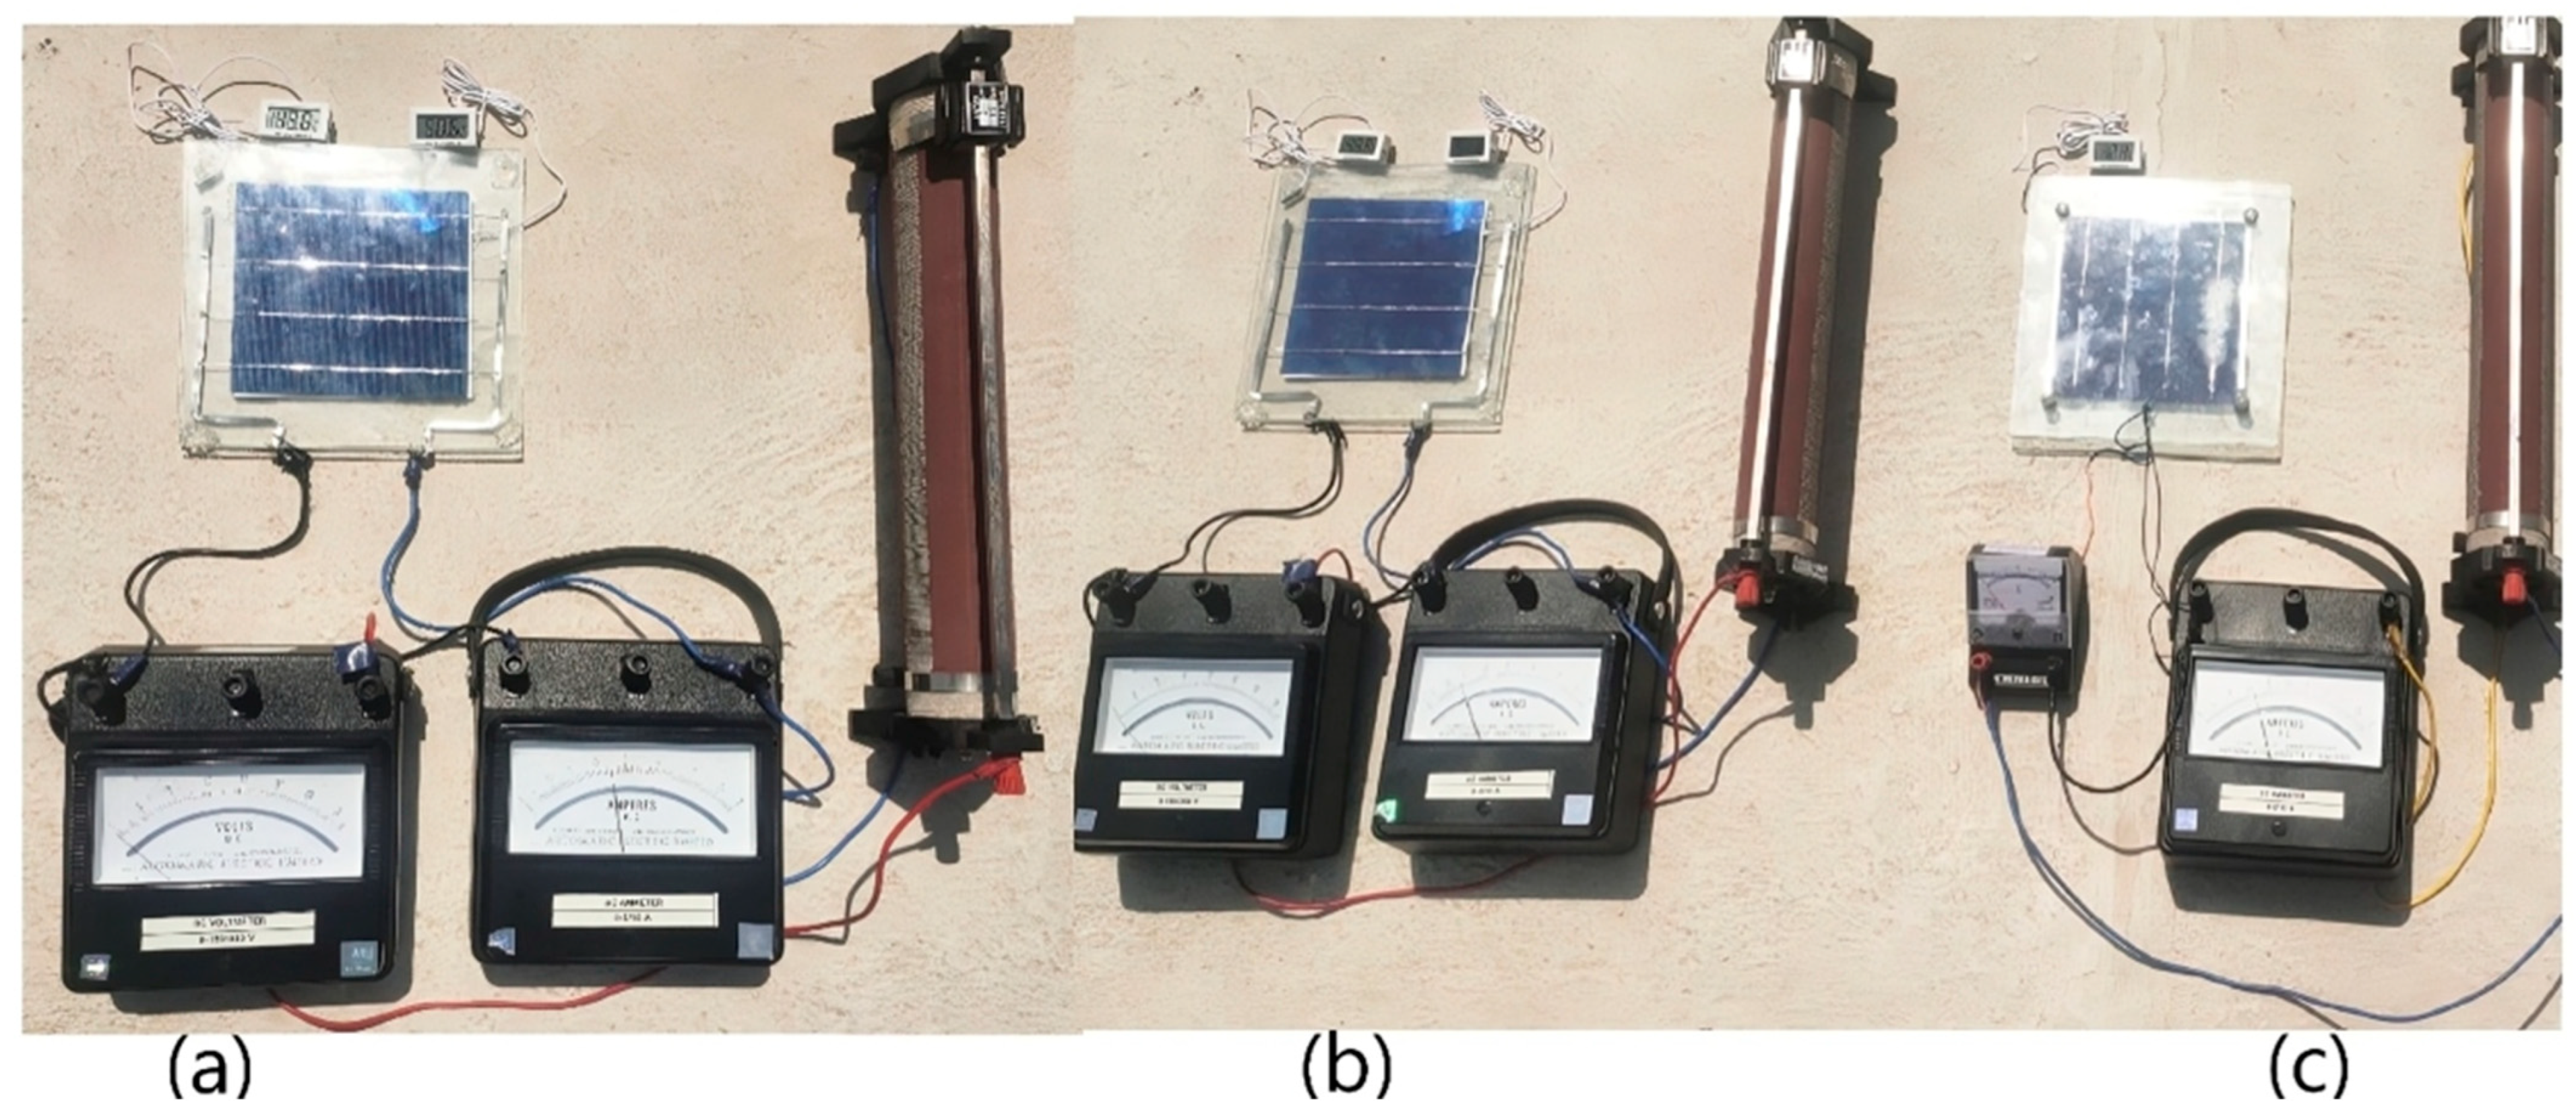
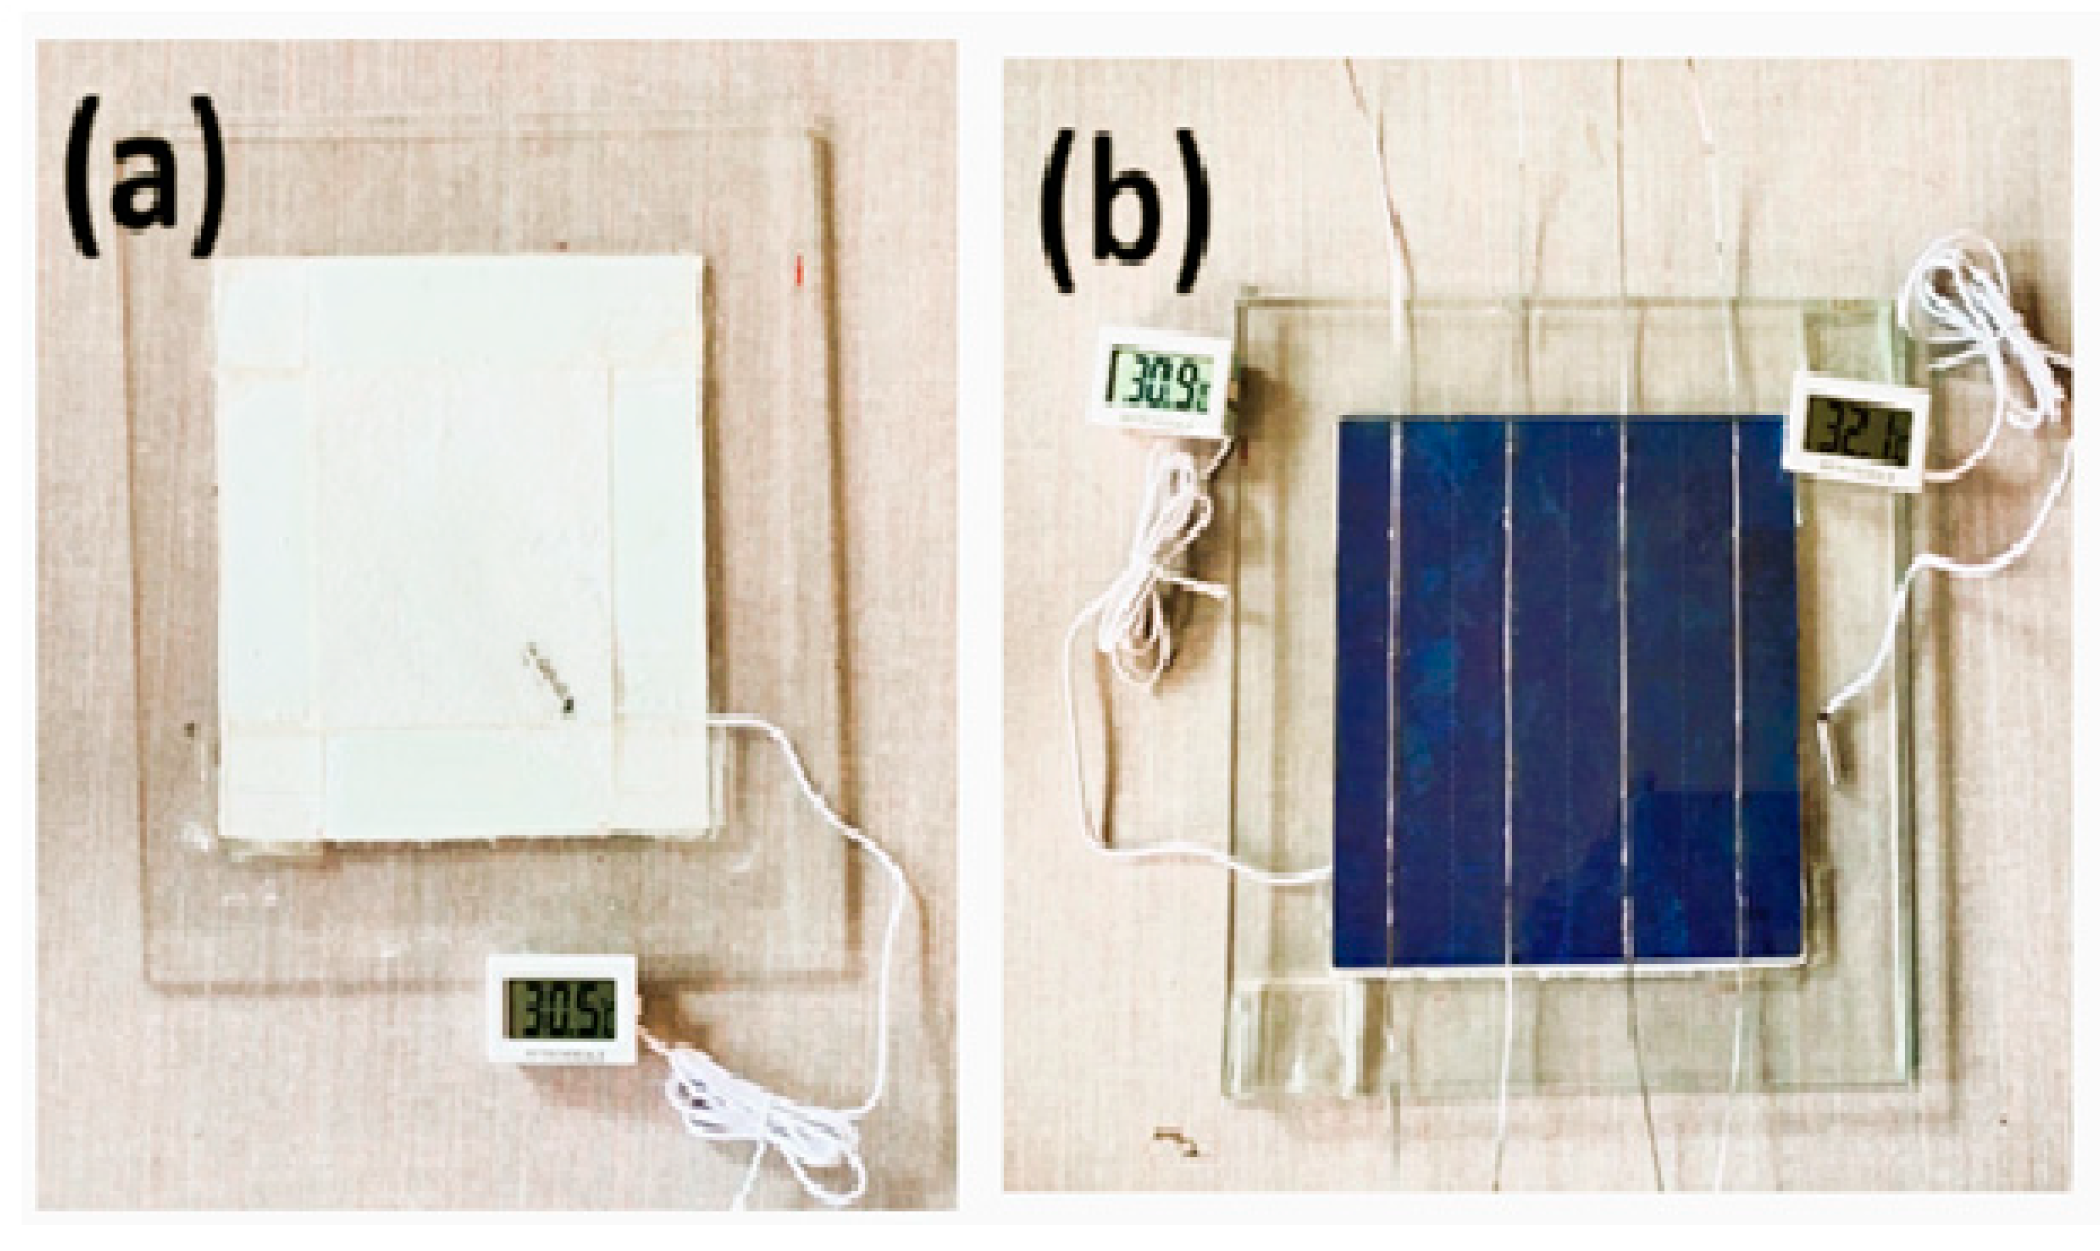
The photovoltaic cell has a thickness of 200 µm and dimensions of 156 mm by 156 mm. Figure 3 illustrates three systems. (a) STPV system (b) STPV with PCM1 and nanoparticles, and (c) STPV system with PCM2 and nanoparticles. The PCM is incorporated between the PV cell and the rear glass of the STPV module and ensures effective contact with the backside of the STPV system. Figure 4 illustrates the front and rear side perspectives of the STPV system module with PCM. The three STPV and PCM modules are installed at the geographical coordinates of 10.9974° N, 76.9589° E.
The tilt angle is the inclination from the horizontal plane (0° for flat-mounted modules and 90° for façade-mounted modules). In contrast, the azimuth angle represents the horizontal deviation from true north (90° east, 180° south, and 270° west). The flat modules were installed horizontally on the roof with minimal shading, and the façade modules were mounted vertically on east-, west-, and south-facing surfaces. Mounting clearances of approximately 30 mm for flat and 50 mm for façade configurations were maintained to ensure adequate rear ventilation. Wind exposure was naturally higher for façade modules, enhancing convective cooling, and all measurements were taken under unshaded conditions.
The experimentation is conducted during the month of March 2025. This period is optimal for evaluating the cooling and energy-enhancement characteristics of the selected PCMs, given elevated ambient temperatures and solar irradiation. The geographical coordinates are 11.0168° N and 76.9558° E. When evaluating STPVPCM1 and STPV/PCM2 systems, it is essential to assess the thermal and electrical energy outputs. STPVPCM1 is a system that utilizes Graphene oxide (GO) and is designated as PVGO. STPVPCM2 is a technology that utilizes Aluminum oxide (AO) and is defined as PVAO. Table 2 and Table 3 show the instruments and nanoparticles used in this study. For the present prototype, a one mm-thick CaCl2·6H2O PCM layer was integrated behind a 156 mm × 156 mm STPV module. The corresponding PCM volume is 2.43 × 10⁻⁵ m3, giving a total mass of ≈41.6 g (≈1.7 kg/m2). This additional mass is minimal compared to the baseline module mass, and thus, the PCM integration does not significantly affect the overall weight of the STPV module. The PCM layer thickness was limited to 1 mm due to design constraints related to weight, available space, and prototype fabrication.
PCM’s latent heat alone cannot sustain multi-hour cooling for the given module geometry. To address this, a time-resolved thermal energy balance was developed that accounts for all heat transfer pathways—latent, sensible, and convective—which together explain the observed full-day temperature moderation.
The governing transient energy balance for the PV–PCM composite is expressed as by [30]:
m c e l l c c e l l d T c e l l d t = q s o l a r ( 1 η e l ) A h A ( T c e l l T a m b ) q c o n d
m P C M c P C M d T P C M d t + m P C M L d f d t = q c o n d h P C M A P C M ( T P C M T a m b )
where
  • m c e l l , m P C M : mass of PV layer and PCM
  • c c e l l , c P C M : specific heat capacities
  • L : latent heat of fusion of PCM
  • f ( t ) : liquid fraction (0–1)
  • A : exposed area of module
  • h , h P C M : convective heat transfer coefficients
  • q s o l a r : absorbed solar flux
  • η e l : instantaneous electrical conversion efficiency
  • q c o n d : conductive heat flow between the PV layer and the PCM interface
During the melting stage (0 < f < 1),
m P C M L d f d t = q c o n d h P C M A P C M ( T P C M T a m b )
Dominates, providing strong temperature regulation for roughly 10–15 min under 1000 W m−2.
After full melting (f = 1), latent storage ceases, and the sensible term.
m P C M c P C M d T P C M d t
governs heat absorption. Because of the PCM’s thermal inertia and gradual convective loss, the surface temperature rises slowly, producing an extended apparent cooling effect lasting several hours under diurnal irradiance variation.
Integration of these equations with representative parameters
( A = 0.01 m 2 ,   m P C M = 0.02 kg ,   L = 180 kJ   kg 1 ,   c P C M = 2.0 kJ   kg 1 K 1 ,   h = 10 W   m 2 K 1 )
Shows that latent storage (~36 kJ m−2) is consumed in about 12 min, while sensible and convective terms delay equilibrium for 3–5 h, consistent with measured full-day thermal trends.
In Table 2, thermal conductivity refers to the material’s ability to transfer heat, expressed in W/m·K, and indicates the rate of heat flow through the PCM composite. Conductivity, on the other hand, represents electrical conductivity, expressed in S/m, and is related to the material’s ability to conduct electric current, particularly influenced by the presence of nanomaterials such as graphene oxide or aluminum oxide.

2.3. Analyzing Experimental Uncertainty

The measurement error is the discrepancy between the actual and measured values of the substance being measured. To be more specific, there is both random error and systematic error. A systematic error cannot be corrected, whereas a random error can be reduced by conducting experiments under different conditions. Methods for calculating the margin of error for experimental findings were laid out in detail [31]. Type B uncertainty, determined by the instrument’s accuracy and calibration features, applies to all independent variables in this study because their distributions are uniform. Voltage, current, surface temperature, ambient temperature, room temperature, and incident solar radiation were the independent variables measured in the reports of these studies. As shown in [32], the usual uncertainty statement for Type B is provided.
X = k 3
The ‘k’ is the manufacturer-specified accuracy and ‘u’ is the standard uncertainty. Table 4 displays the experimental equipment-related uncertainties. To determine the uncertainty of ai when it is dependent on many inputs ci, one can use the formula [30,31]:
X a = δ a δ c 1 2 X 2 c 1 + δ a δ c 2 2 X 2 c 2 + 1 2
The uncertainty for daily efficiency and output power is calculated as 0.4%.

3. Results and Discussion

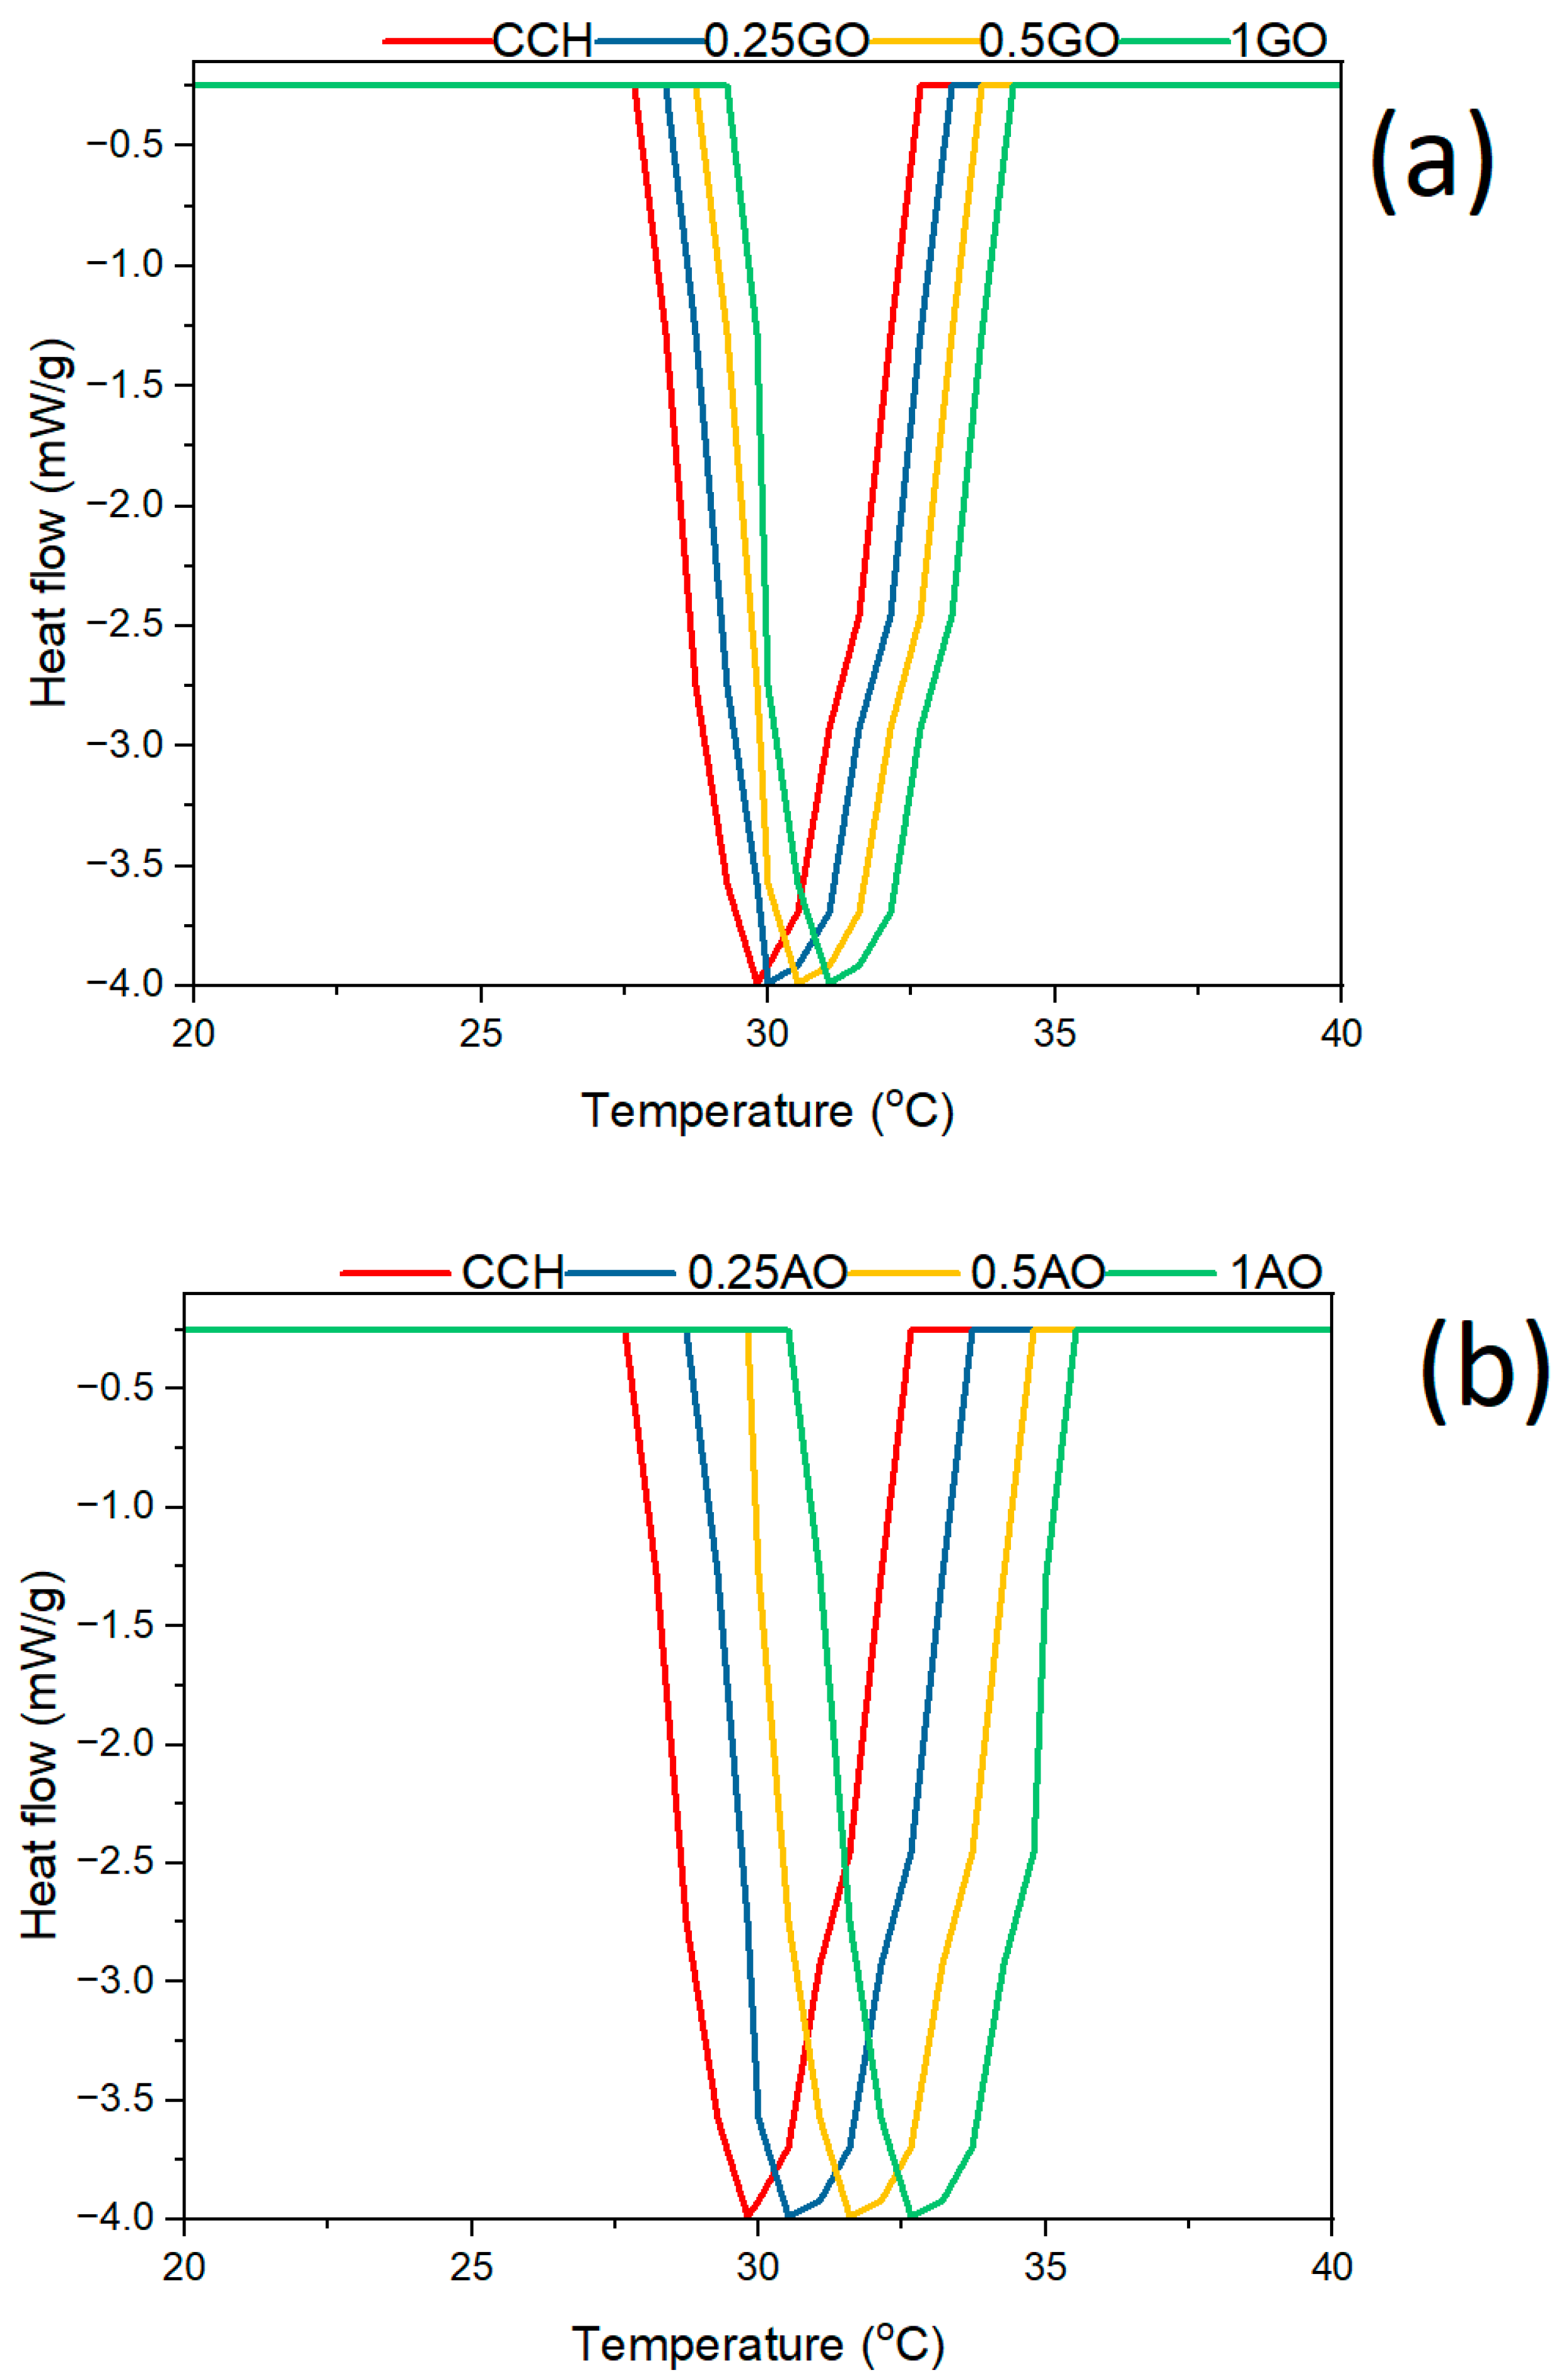
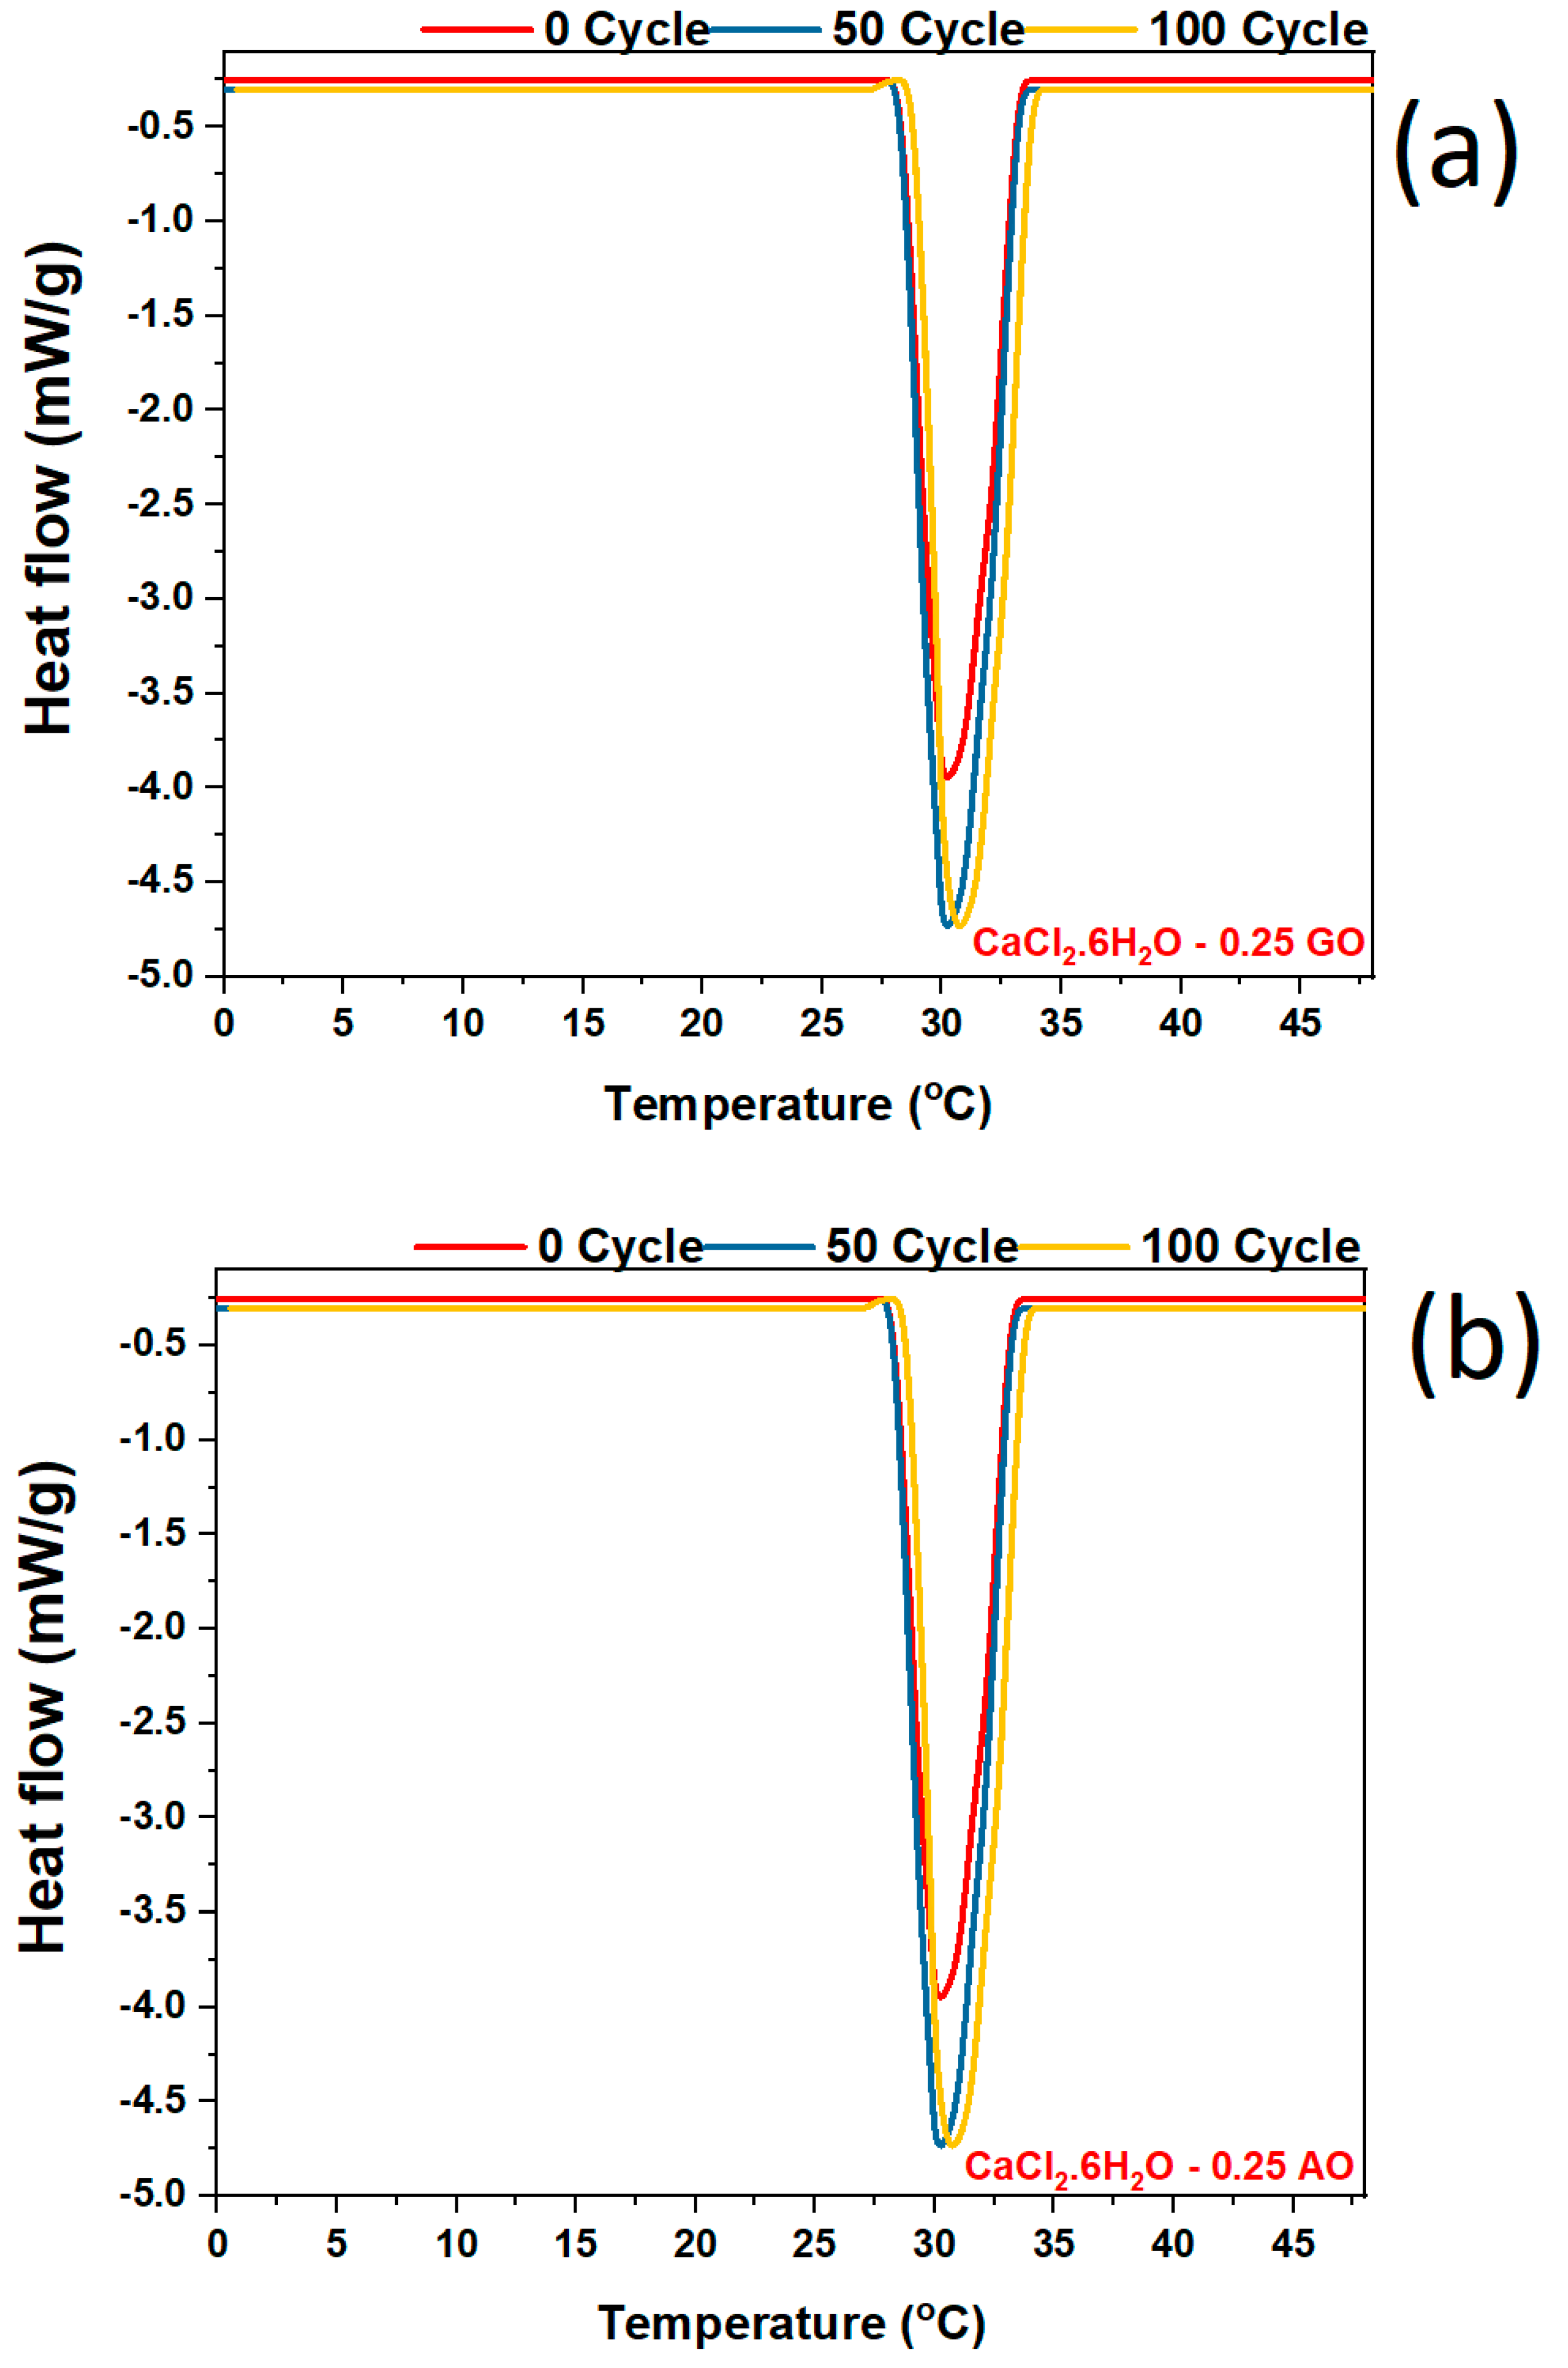
Differential scanning calorimetry (DSC) is used to measure the thermal characteristics of calcium chloride hexahydrate (CaCl2·6H2O) nanoparticles composed of GO and AO. The thermal properties of the nanoparticle-added samples —both the melting point and the latent heat capacity—were evaluated. The heating profiles obtained using differential scanning calorimetry (DSC) are shown in Figure 5a,b for CaCl2·6H2O and GO/AO nanocomposites, respectively. Additional information on the melting enthalpies of the samples is provided in Table 2 and Table 3. The storage of heat in the form of latent heat is the primary function of a phase change material (PCM). On the other hand, phase change materials (PCMs) can release energy when temperatures drop and absorb energy when temperatures rise. The enthalpy of the substance has a direct bearing on the amount of energy that may be stored.
Because of their low molecular weight and highly linear structure, all inorganic PCM chains participate in the crystallization process, resulting in about 100% crystallinity. The prevention of complete crystallization that nanoparticles exhibit when added to CaCl2·6H2O is typically responsible for the decrease in enthalpy observed upon their addition. On the other hand, phase change materials (PCMs) are exceptional energy storage media because they reduce enthalpy to a negligible level. The experimental investigation was conducted over 20 consecutive days during the summer season at the selected site. To ensure consistency and reliability of the results, data were considered only from days with relatively uniform solar radiation throughout the daytime hours. The differential scanning calorimetry (DSC) curves of CaCl2·6H2O-GO containing 0.25%, 0.5%, and 1% AO nanoparticles are presented in Figure 5b, which exhibits a comparable trend and displays the curves.
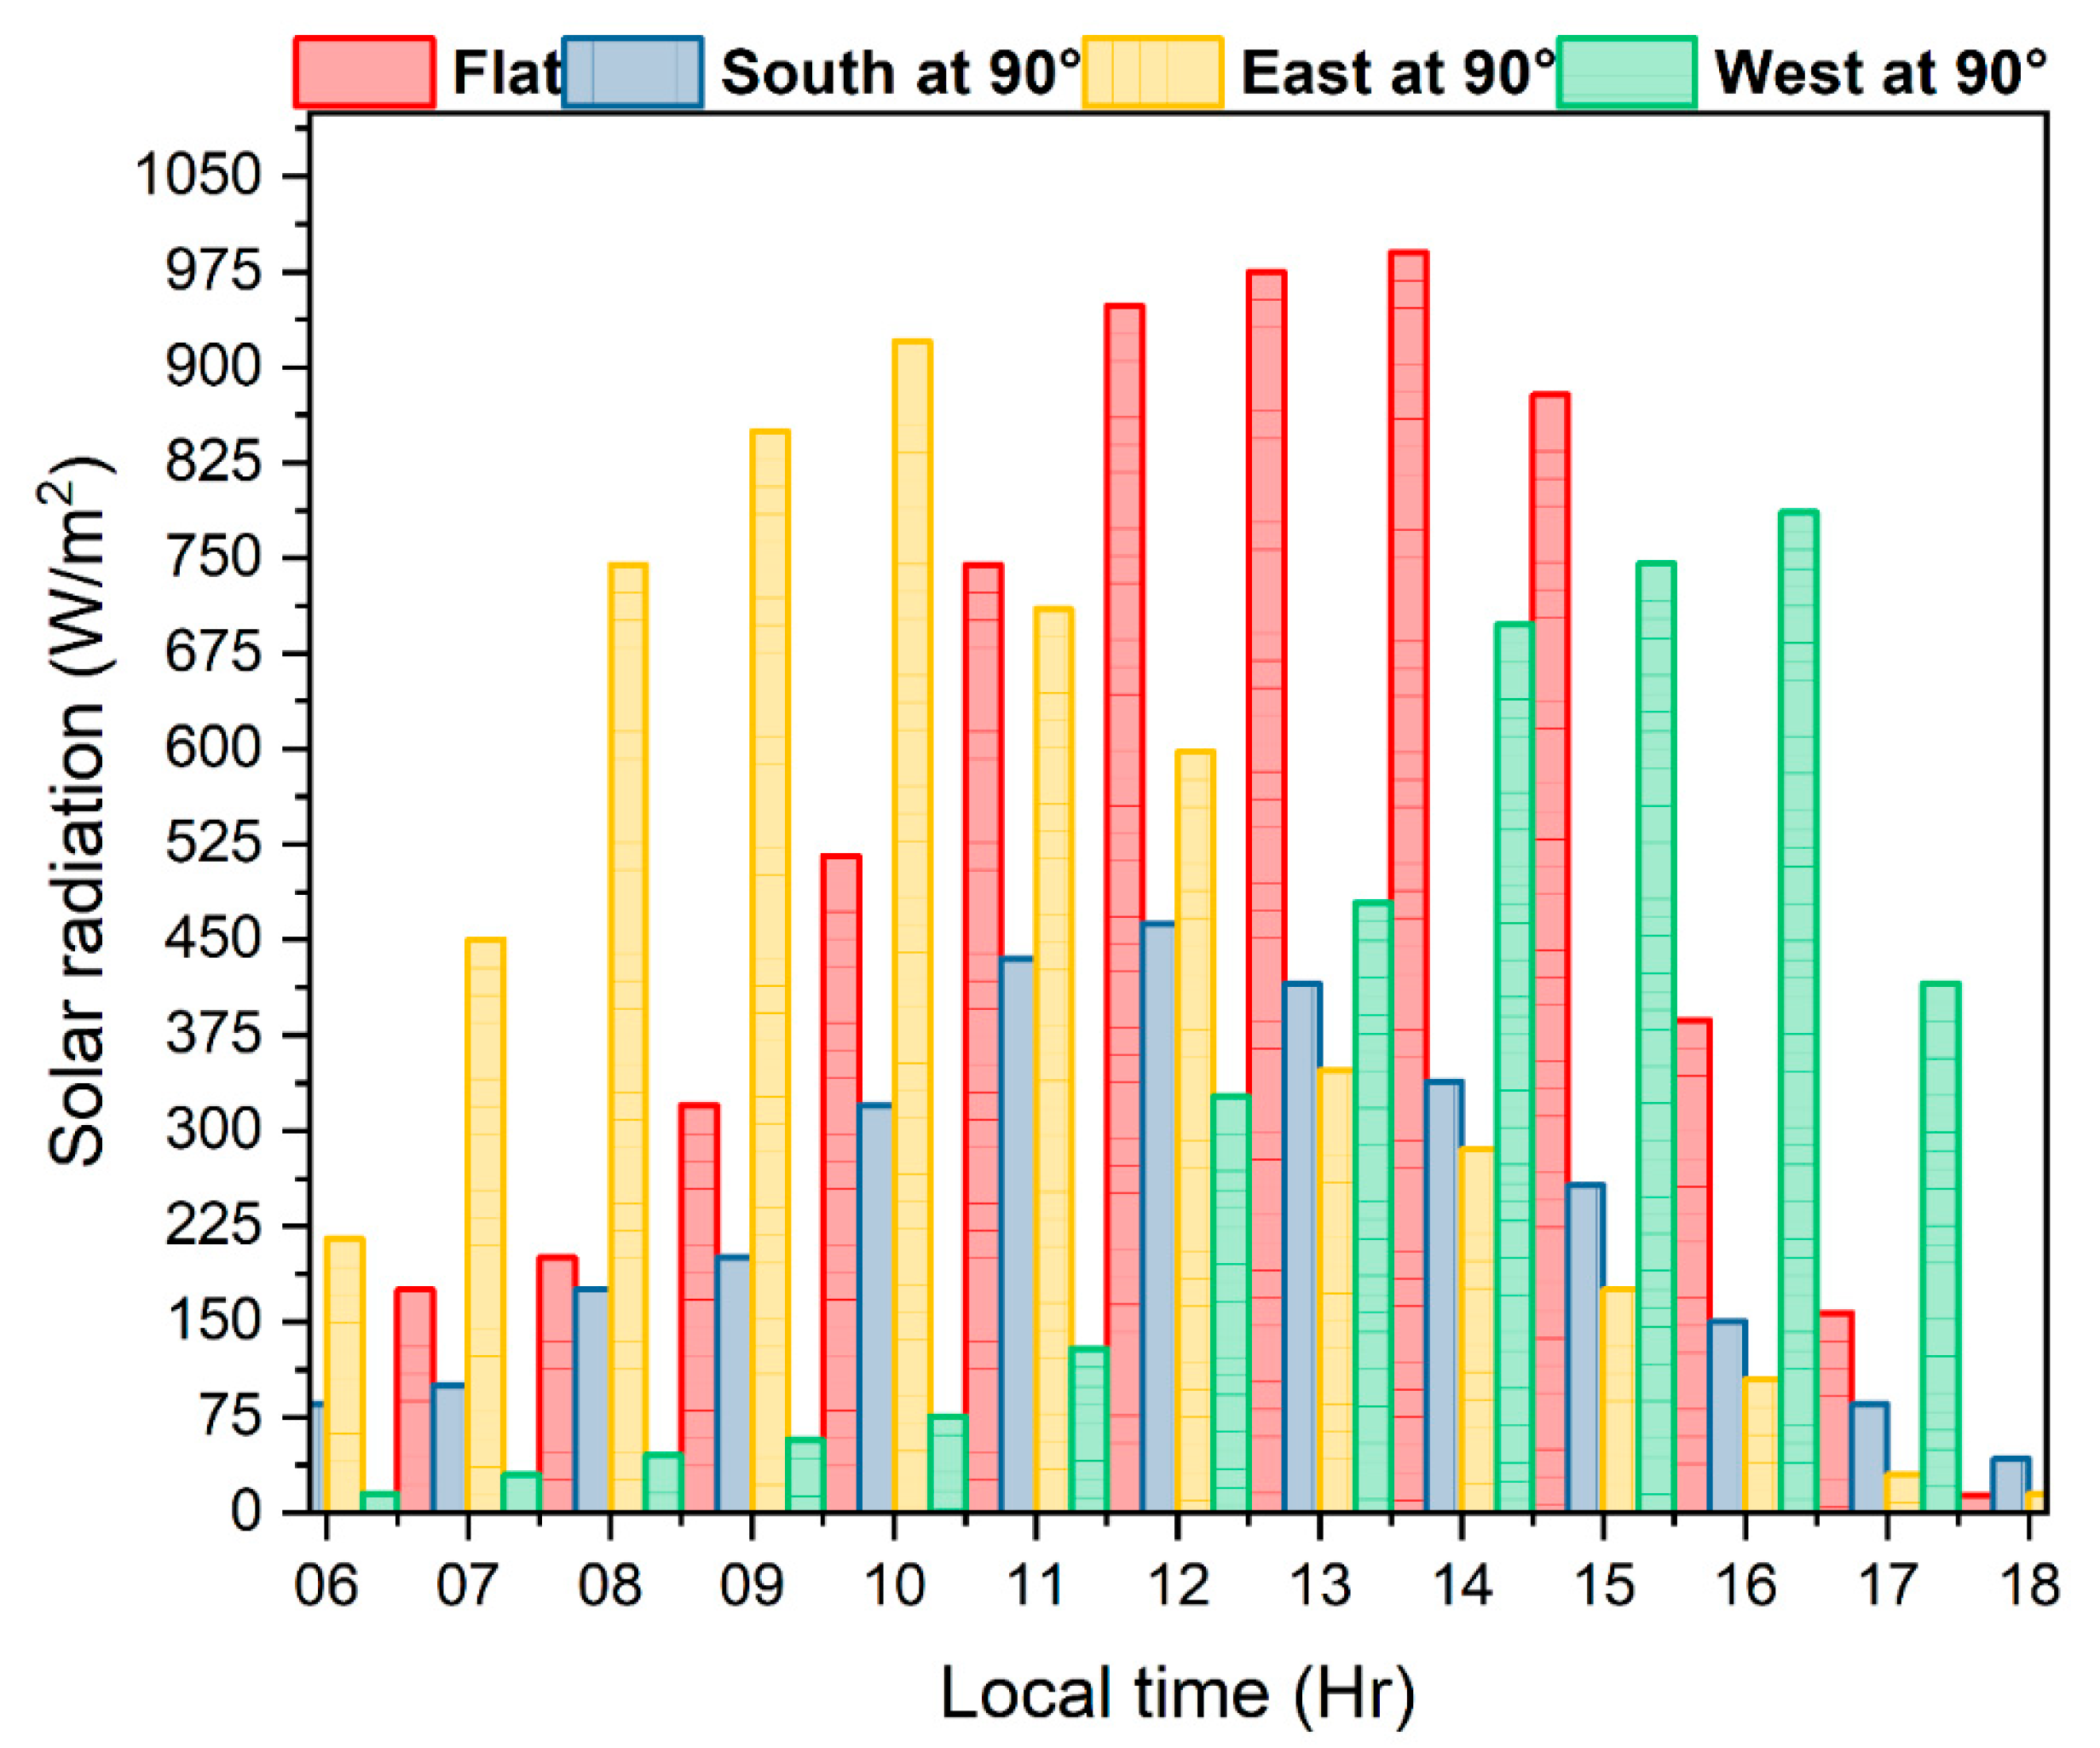
The melting temperatures of the samples containing 0.25%, 0.5%, and 1% AO nanoparticles were 32 °C, 33.5 °C, and 34 °C, respectively. An illustration of the thermal cycles of the CaCl2·6H2O, GO, and AO mixture may be found in Figure 6a,b. The thermal stability is satisfactory after several cycles. Upon completion of the 100th cycle, stability was attained. The amount of incident radiation influences the efficiency of electrical systems powered by solar energy. The amount of irradiation present has a significant impact on the electrical performance of photovoltaic (PV) cells. This performance includes increased power, thermal energy, and overall energy. Figure 7 shows the Hourly variation of the solar radiation on typical days of March 2025. In the present prototype, the integrated PCM layer is relatively thin (1 mm) and composed of calcium chloride hexahydrate (CaCl2·6H2O), which has a melting temperature below 29 °C. Under typical operating conditions, the ambient temperature during the morning period rises gradually, and once the PV cell temperature exceeds the PCM’s melting point (generally several degrees above ambient due to solar irradiance and heat buildup), the PCM begins to absorb latent heat. Direct correlation between the ambient temperature and the PCM phase-change process, where the PCM acts as a thermal buffer during the early sunshine hours, delaying the rapid rise of PV module temperature. Although the total PCM mass is limited, latent heat absorption helps stabilize module temperature near the PCM melting point and reduces the peak temperature.
They have a greater capacity for heat absorption and PCM heat gain when PVGO and PVAO modules are oriented westward. This is due to the modules’ orientation. There was a clear relationship between the increase in PCM cooling and the module’s power generation.
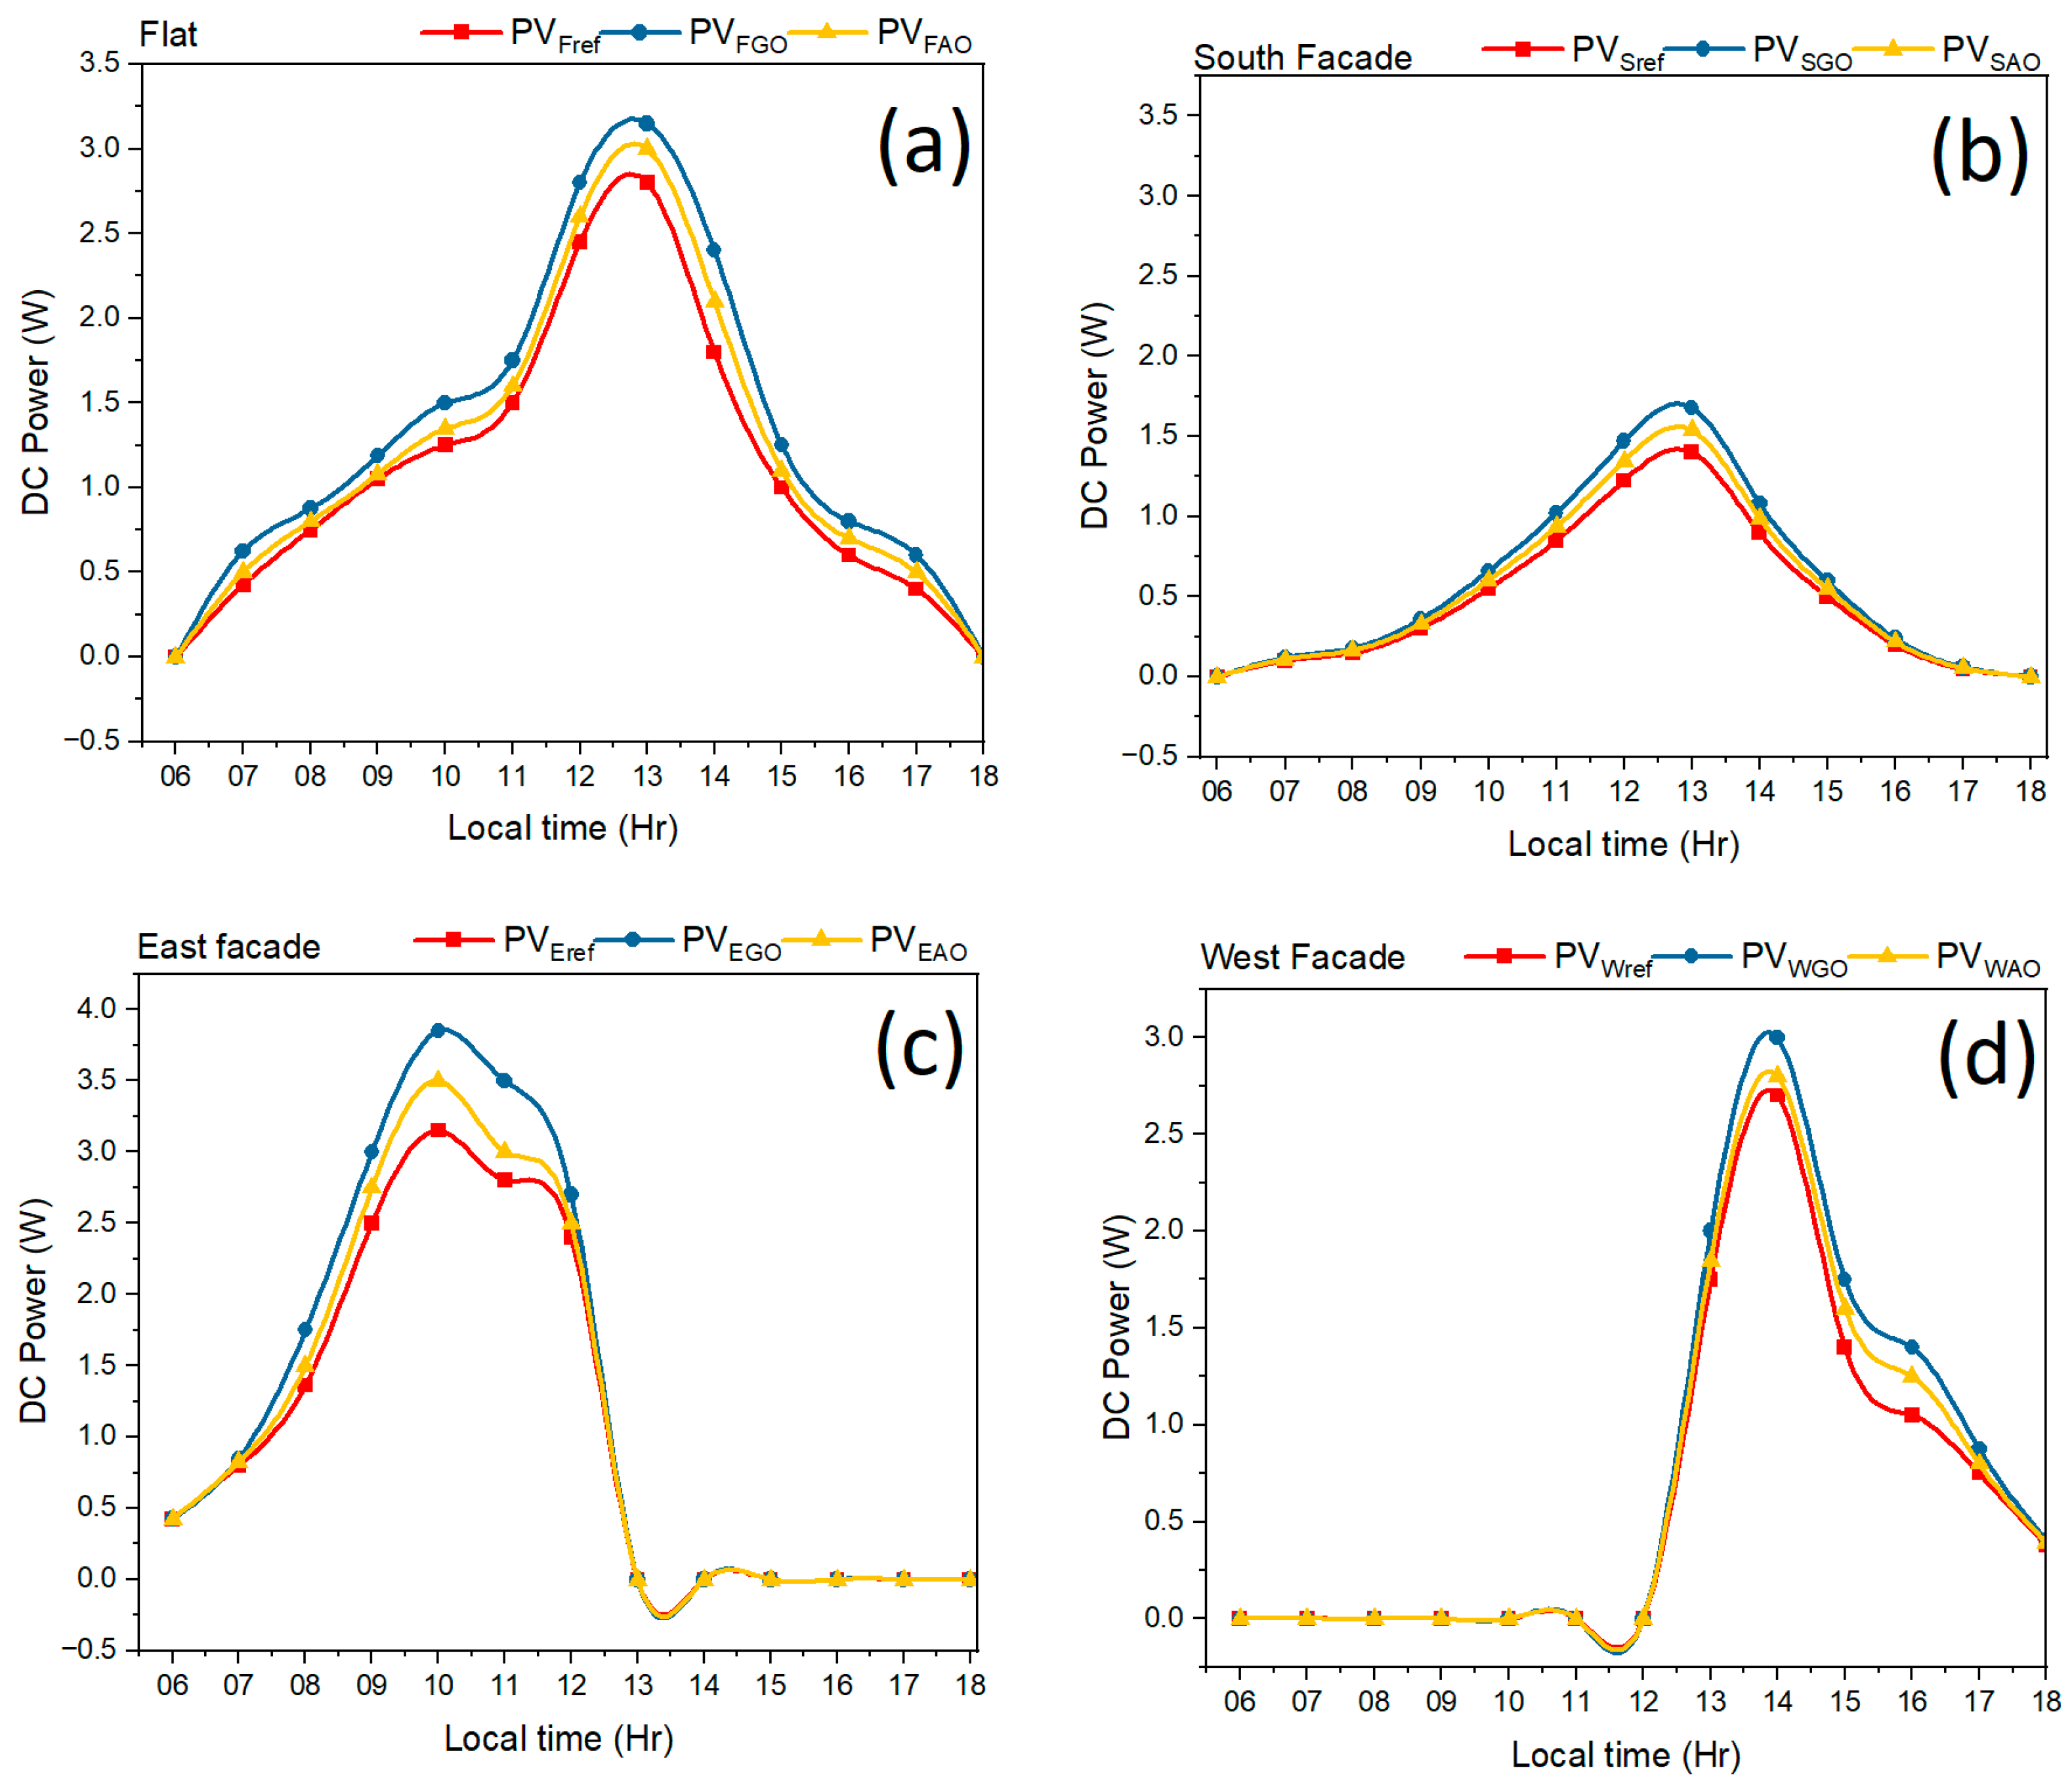
The electrical performance of the PV, PVGO, and PVAO modules is illustrated in Figure 8, which provides details on the power output of each module under various scenarios. As shown in Figure 8a and Figure 8b, respectively, the power of the PVGO module is 2.95 W, the power of the PVAO module is 2.695 W, and the power of the PV modules is 2.45 W. This information is based on the highest solar radiation that is available. This comparison of electricity output is significant since it provides insight into the efficiency with which different PV systems operate. As a result, the amount of electricity produced by PV–PCM systems is more than that produced by PV modules on their own. Figure 8c graphically depicts the amount of electrical power that is produced by the east direction.
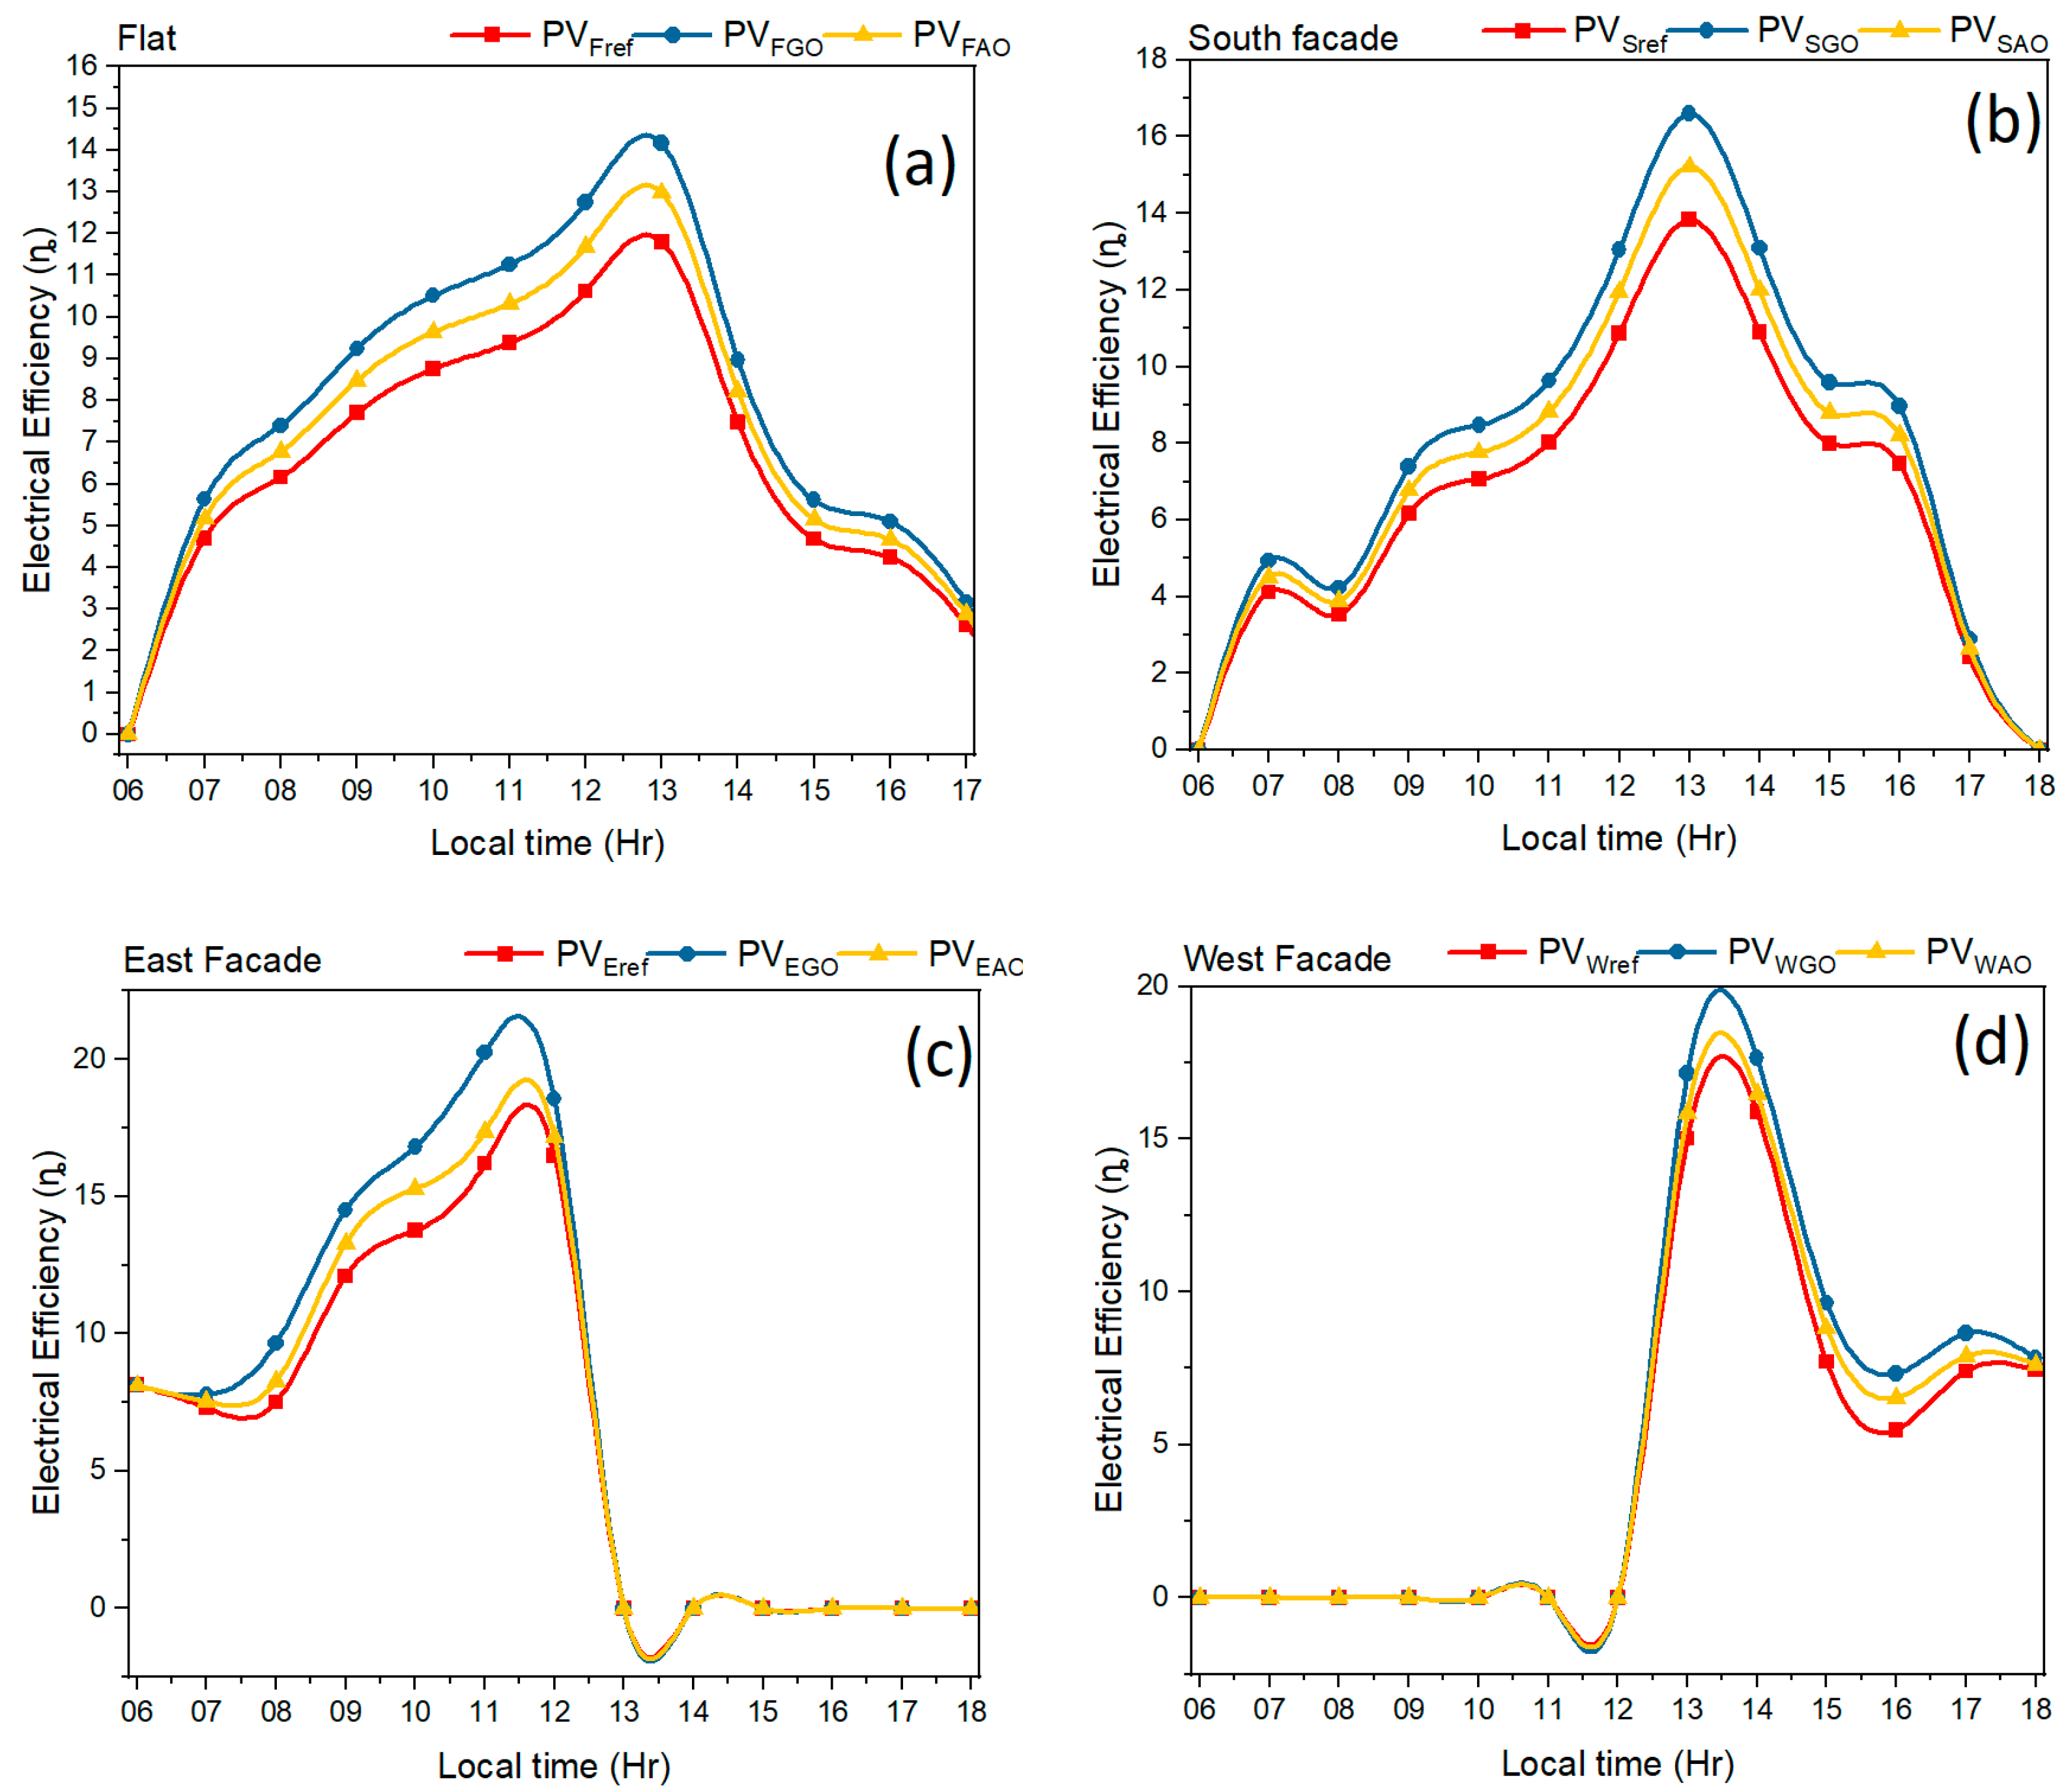
As shown in Figure 9, the module facing east produced the most electricity at 10 a.m., when the sun’s rays are at their maximum intensity. PV modules that are oriented eastward have a power generation of 3.15 W, while PVGO modules have a power generation of 3.85 W, and PVAO modules have a power generation of 3.5 W. The three modules had maximum electrical efficiencies of 13.75%, 16.84%, and 15.28% when measured at 941 W/m2. The maximum difference in electrical efficiency between PV and PVAO modules is 3.25%, and between PV and PVGO modules is 1.8%. As shown in Figure 9b, the three modules (PV, PVGO, and PVAO) achieved maximum electrical efficiencies of 13.8%, 16.5%, and 15.2%, respectively, when oriented southward and receiving 453.00 W/m2 of solar radiation. In addition, Figure 9b shows that the PVGO and PVAO modules exhibit maximum electrical efficiency differences of 2.7% and 1.65%, respectively, relative to the reference system.
Figure 9c,d shows that the three modules achieve maximum electrical efficiencies of 15.8%, 17.6%, and 16.48%, respectively, at a solar radiation of 698 W/m2. A direct proportional relationship exists between the amount of sunlight reaching the panels and the power they produce. Clearly, the PV, PVGO, and PVAO modules differ slightly in the amount of electric power they produce. It is important to stress that PCM, an essential component for enhancing power output, significantly increases electrical power production. For the three modules (PV, PVGO, and PVAO), the maximum electrical efficiencies were calculated to be 10.6%, 12.7%, and 11.68% respectively, at a solar radiation of 948 W/m2. The electrical efficiency values of PV, PVGO, and PVAO modules vary by 2.2%, with a further range of 1.01% for PV and PVAO modules.
The three modules had maximum electrical efficiencies of 13.75%, 16.84%, and 15.28% when measured at 941 W/m2. PV modules that are oriented eastward have a power generation of 3.15 W, while PVGO modules have a power generation of 3.85 W, and PVAO modules have a power generation of 3.5 W. The three modules had maximum electrical efficiencies of 13.75%, 16.84%, and 15.28% when measured at 941 W/m2. The maximum difference in electrical efficiency between PV and PVAO modules is 3.25%, and between PV and PVGO modules is 1.8%.
They have a greater capacity for heat absorption and PCM heat gain when PVGO and PVAO modules are oriented westward. This is due to the modules’ orientation. There was a clear relationship between the increase in PCM cooling and the module’s power generation. A direct proportional relationship exists between the amount of sunlight reaching the panels and the power they produce. Clearly, the PV, PVGO, and PVAO modules differ slightly in the amount of electric power they produce. It is important to stress that power conversion mode (PCM), an essential component for enhancing power output, significantly increases electrical power production. For the three modules (PV, PVGO, and PVAO), the maximum electrical efficiencies were calculated to be 10.6%, 12.7%, and 11.68% respectively, at a solar radiation of 948 W/m2. The electrical efficiency values of PV, PVGO, and PVAO modules vary by 2.2%, with a further range of 1.01% for PV and PVAO modules.
This is demonstrated in Figure 9a. As shown in Figure 9, both the PV–PCM modules and the reference PV module exhibit daily-average electrical efficiency. The PV–PCM module’s electrical efficiency ranged from 13.26% to 17.78% during the day, while the reference PV modules ranged from 13.40% to 18.03%. There was a significant difference between the two efficiencies. This section discusses how the reference PV, PVGO, and PVAO are affected by the cell’s temperature. It is possible to determine the cell temperature using the radiative and convective heat transfer coefficients. Figure 9d shows that the three modules achieve maximum electrical efficiencies of 15.8%, 17.6%, and 16.48%, respectively, at a solar radiation of 698 W/m2.
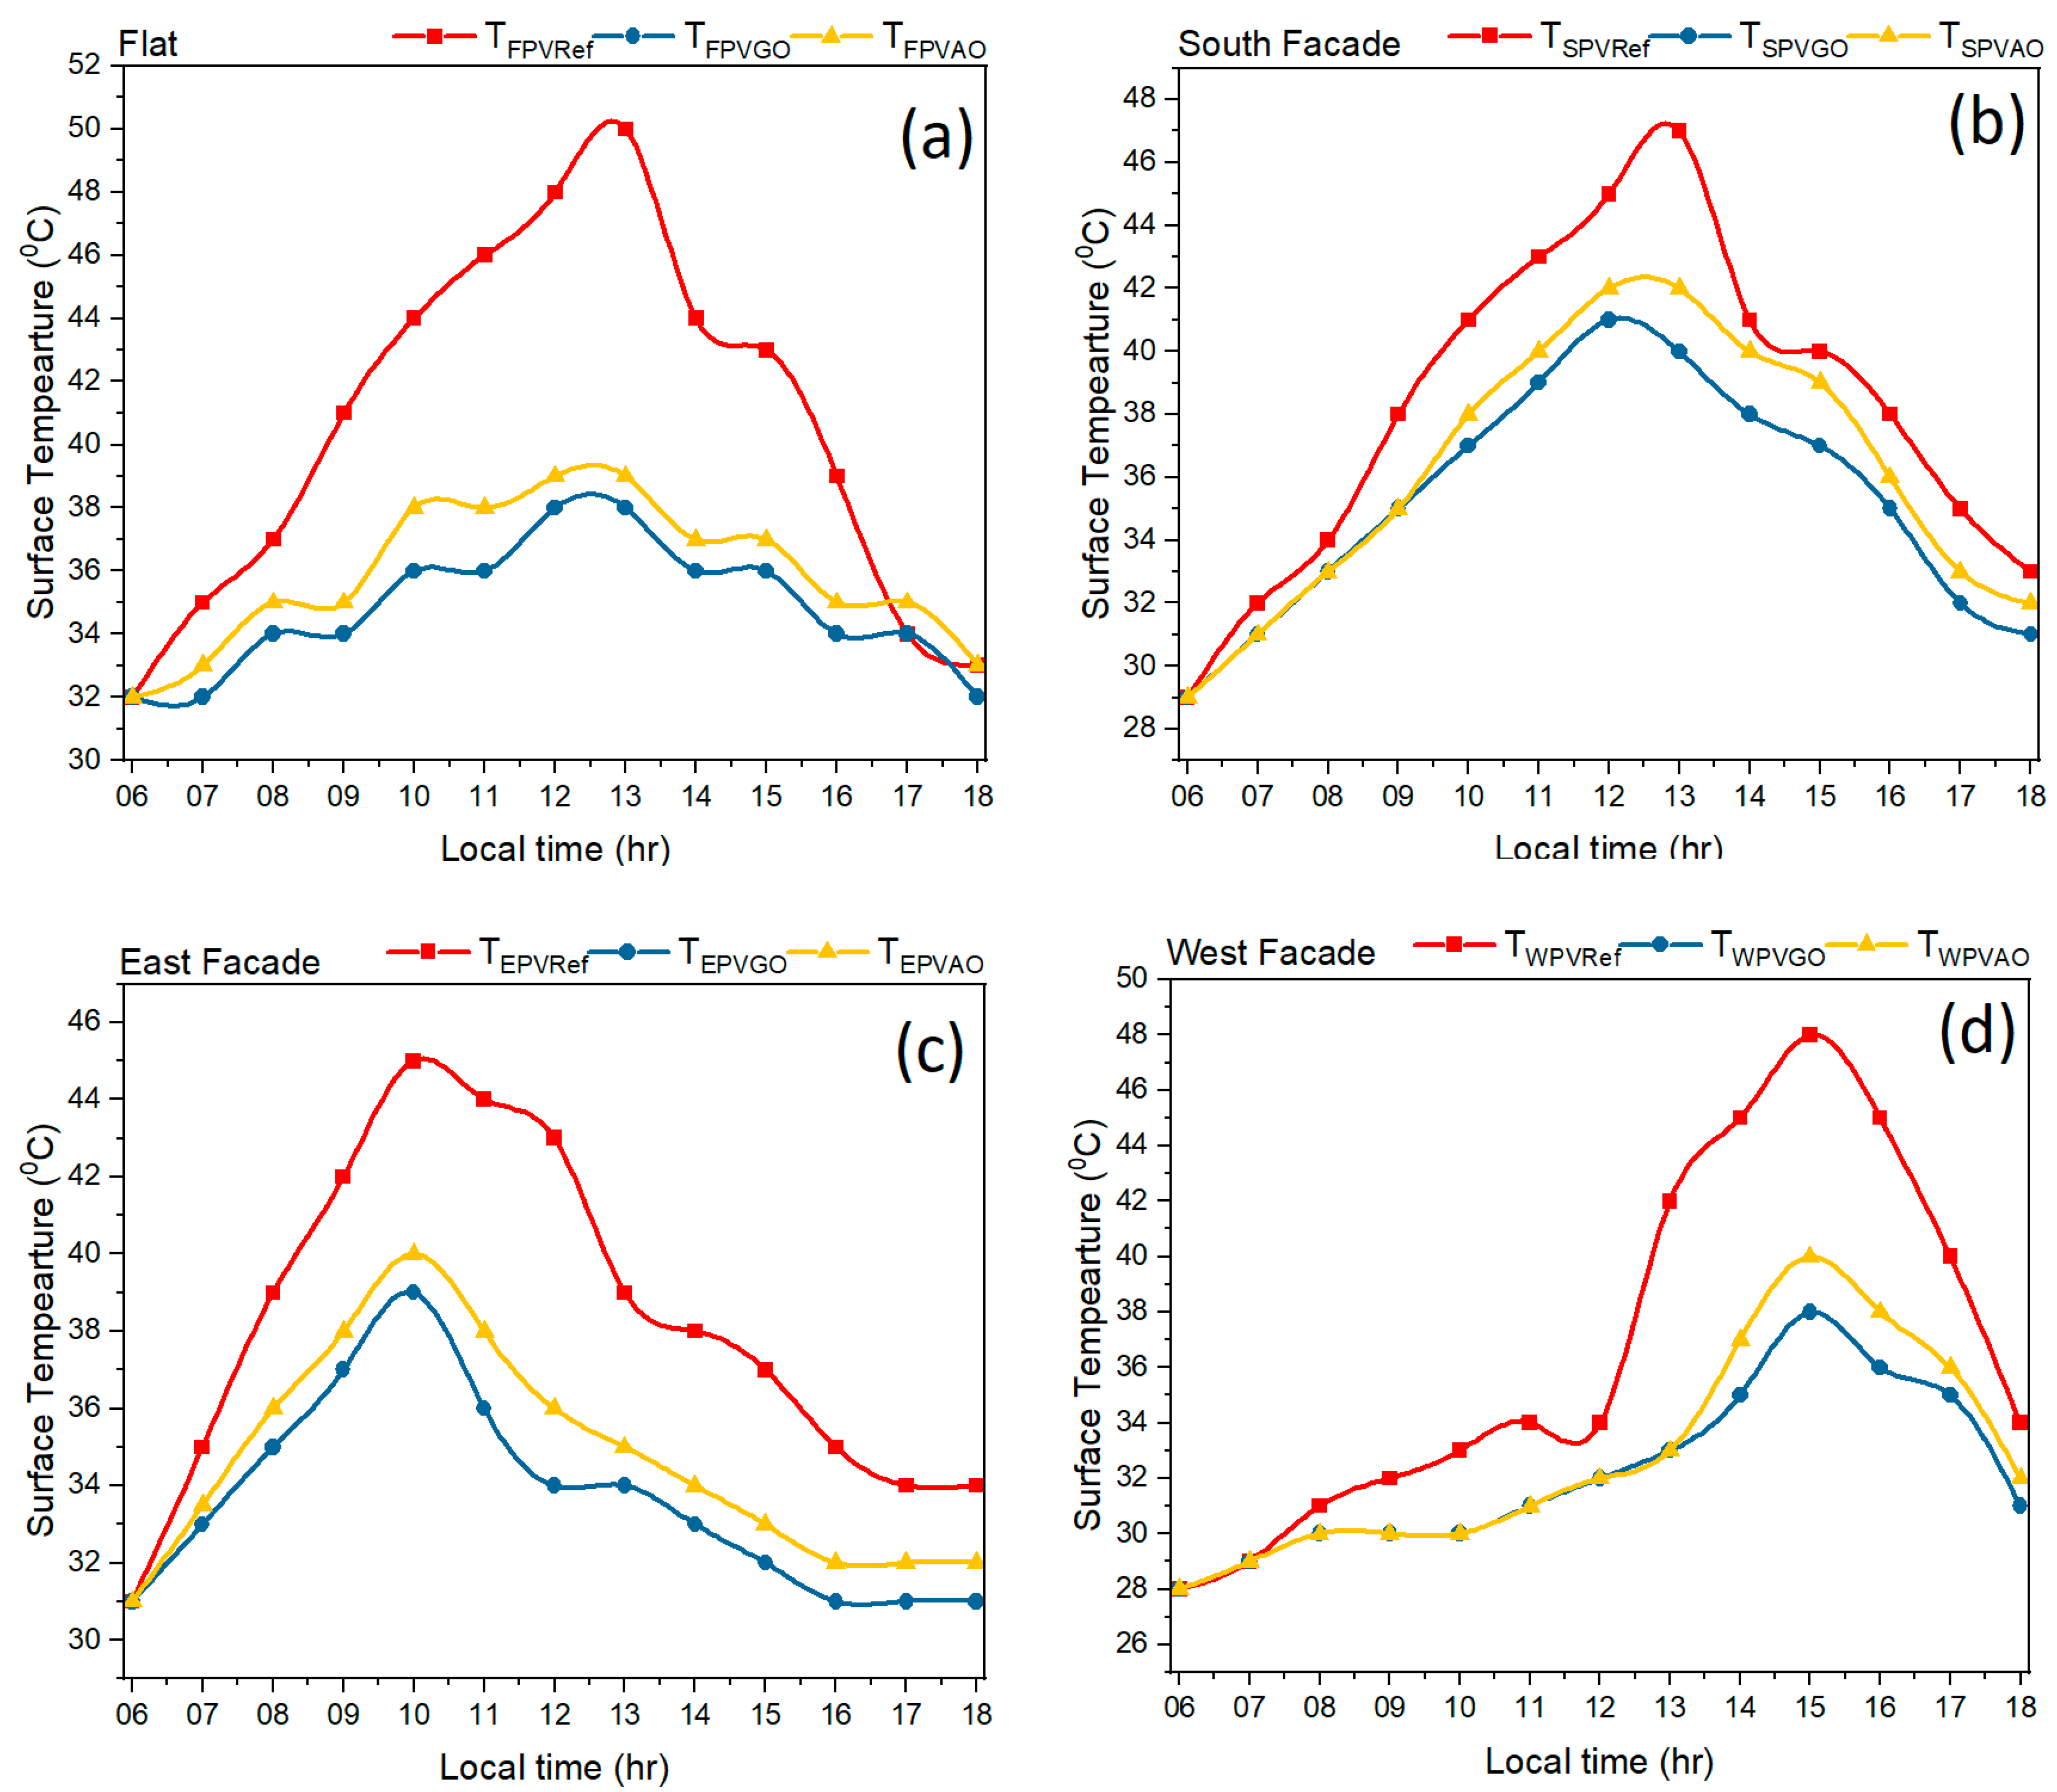
In fact, the convective heat transfer coefficient takes into account the speed of the wind. Temperature and wind speed are two factors that significantly impact photovoltaic (PV) cells. During cooling, a higher wind speed can increase the power generated by a solar panel. The heat from the photovoltaic panel will be extracted more effectively if it is exposed to wind. On the other hand, wind has less effect on photovoltaic modules when irradiance is low. If you look at Figure 10, you can see how the cell temperature influences the electrical performance of PV, PVGO, and PVAO. As shown in Figure 10a–d, when the sun is at its peak intensity, the temperature of the cells of the PV, PVGO, and PVAO modules is 47 °C, 40 °C, and 42 °C, respectively, when the modules are oriented towards the south. Upon experimentation, it has been shown that the most significant cell temperature difference occurs at 7 °C and 5 °C for PV, PVGO, and PVAO compared to the reference PV. Table 5 presents the globally reported PCM with CaCl2.6H2O.
The observed cooling effect is attributed to the PCM’s latent heat storage capacity rather than its quantity alone. Although the PCM thickness used in this study is relatively small, its phase change process absorbs substantial heat during melting, thereby reducing direct heat transfer to the PV module. This mechanism allows the PCM to buffer the temperature rise effectively during peak solar radiation. The more than 12 °C reduction observed is due to this latent heat absorption combined with improved heat dissipation by conduction and natural convection around the module. However, it is acknowledged that the cooling duration depends on both the PCM volume and the ambient/irradiance conditions, and the present results are specific to the tested configuration. Future work can include optimizing PCM thickness and encapsulation design to extend the cooling effect over longer sunshine hours and different climatic conditions. A time-resolved energy balance was formulated to evaluate the transient heat flow in the PV–PCM system. The analysis confirms that latent heat absorption stabilizes temperature for the initial 10–15 min, while subsequent sensible heat storage and convective release extend the cooling period throughout the day. The two-stage thermal response reconciles the measured full-day temperature moderation with the PCM’s theoretical energy capacity.
Differential Scanning Calorimetry (DSC) showed a slight rise in specific heat capacity (from 2.1 to 2.4 kJ/kg·K) and latent heat (from 178 to 185 kJ/kg) after nanomaterial addition, along with a 0.8 °C reduction in supercooling. Thermal conductivity increased from 0.54 to 0.68 W/m·K as observed from TGA-supported thermal stability improvement. These enhancements improved heat absorption and dissipation, lowering the PV operating temperature by 3–4 °C and yielding an approximate 2–3% rise in electrical efficiency.
The semi-transparent photovoltaic (STPV) modules used in this study exhibited an average visible light transmittance (VLT) of 20% and a solar transmittance (ST) of 10%. These values indicate that the modules allow a controlled fraction of natural daylight to penetrate the building interior while simultaneously harvesting solar energy. From a façade application perspective, such transmittance levels contribute positively to daylight autonomy (DA) by reducing reliance on artificial lighting during daytime, thereby lowering overall building energy consumption. However, glare risk needs to be carefully considered, as higher VLT values can make spaces too bright or visually uncomfortable for those living there, particularly in areas that receive significant direct sunlight. Conversely, if VLT is too low, it may reduce daylight autonomy and raise lighting energy use. In order to achieve a balance between visual pleasure, daylight sufficiency, & energy efficiency, it is crucial to maintain an ideal range of VLT and ST when integrating STPV systems into façades.

Environmental and Economic Benefits

The use of GO and Al2Ot enhances the thermal stability, charge transport, and light harvesting capabilities of PV devices, leading to improved efficiency and sustainability. More efficient power generation allows for cleaner energy by reducing the amount of land and materials needed. Both materials are non-toxic and have a long history of chemical stability, so they will not leach harmful compounds into the environment like heavy-metal alternatives might. Conservation of building energy: They decrease the building’s carbon footprint over its operating lifetime by enhancing the performance and durability of PV modules, which in turn reduces dependency on traditional energy sources derived from fossil fuels. Durability and cost-effectiveness: PV layers with added GO and Al2Ot have better mechanical strength and thermal resistance, meaning they degrade at slower rates. This reduces the need for replacement and maintenance while increasing the lifetime of the modules. Both graphite and bauxite, two common precursors to GO and Al2Ot, are inexpensive to produce, allowing for scalability to occur with little to no financial restraints.

4. Conclusions

This study investigated the integration of semi-transparent photovoltaic (STPV) modules with nano-enhanced phase change materials (PCMs) to improve building energy efficiency through better thermal regulation. The results showed that module performance was strongly influenced by orientation, solar irradiance, and surface temperature. Calcium chloride hexahydrate-based PCMs doped with graphene oxide (GO) and aluminum oxide (Al2O3) nanoparticles enhanced thermal conductivity and latent heat capacity, thereby improving electrical performance. The optimized PCM composition with 0.25 wt.% GO and Al2O3 achieved the most favorable results, reducing surface temperature from 47 °C (PV) to 40 °C (PV-GO) and 42 °C (PV-AO), while increasing peak efficiency from 13.75% to 16.84% and 15.28%, respectively, under 941 W/m2 irradiance. These findings highlight the potential of nano-enhanced PCMs to stabilize STPV operating temperatures, increase efficiency, and support energy savings in building-integrated solar systems. Future work will focus on optimizing nanoparticle concentrations, improving long-term stability and integration methods, and conducting life-cycle and economic assessments to further advance sustainable, thermally regulated STPV technologies.

Author Contributions

Conceptualization, data curation, formal analysis, investigation, and visualization, N.H.A. Formal analysis, investigation, methodology, project administration, resources, software, supervision, validation, and writing—original draft, A.K. Formal analysis, investigation, methodology, project administration, funding acquisition, and writing—review and editing, P.M.K. Conceptualization, data curation, formal analysis, investigation, and visualization, V.R. All authors have read and agreed to the published version of the manuscript.

Funding

This work was supported and funded by the Deanship of Scientific Research at Imam Mohammad Ibn Saud Islamic University (IMSIU) (grant number IMSIU-DDRSP2503).

Data Availability Statement

The original contributions presented in this study are included in the article.

Conflicts of Interest

The authors declare no conflicts of interest.

Abbreviations

The following abbreviations are used in this manuscript:
PCMPhase change material
STPVSemi-transparent photovoltaic
GOGraphene oxide
Al2O3Aluminum oxide
TGAThermogravimetric analysis
DSCDifferential scanning calorimetry
PVPhotovoltaic

References

  1. Zhang, Z.; Wang, J.; Xia, Y.; Wei, D.; Niu, Y. Solar-Mixer: An Efficient End-to-End Model for Long-Sequence Photovoltaic Power Generation Time Series Forecasting. IEEE Trans. Sustain. Energy 2023, 14, 1979–1991. [Google Scholar] [CrossRef]
  2. Hossen, M.D.; Islam, M.F.; Ishraque, M.F.; Shezan, S.A.; Arifuzzaman, S.M. Design and Implementation of a Hybrid Solar-Wind-Biomass Renewable Energy System Considering Meteorological Conditions with the Power System Performances. Int. J. Photoenergy 2022, 2022, 8792732. [Google Scholar] [CrossRef]
  3. Aruna, M.; Nagabhooshanam, N.; Parihar, P.S.; Kedia, N.; Jemmy Christy, H.; Satya, G.; Barik, D.; Thirugnanasambandham, T.; Sathiyamurthy, S. Enhancement of Solar Thermal Performance and Reduction of Thermal Loss Behaviour of Solar Thermal Collector Featured with Polyaniline and Paraffin. Appl. Therm. Eng. 2025, 278, 127273. [Google Scholar] [CrossRef]
  4. Maneechot, P.; Klungsida, N.; Kueathaweekun, T.; Butploy, N.; Somnugpong, S.; Khiewwan, K.; Thongchai, J.; Tantisantisom, K.; Ramachandran, T.; Kuppusamy, M.; et al. A Portable Hybrid Photovoltaic Thermal Application: Shape-Stabilised Phase-Change Material with Metal Flakes for Enhanced Heat Transfer. Energies 2025, 18, 452. [Google Scholar] [CrossRef]
  5. Rajamony, R.K.; Pandey, A.K.; Sofiah, A.G.N.; Wadaan, M.A.; Siaw Paw, J.K.; Suraparaju, S.K.; Baabbad, A.; Samykano, M.; Paranthaman, V. Energy, Exergy, Economic and Environmental (4E) Analysis of Serpentine Tube Absorber Photovoltaic Thermal System Using Nano Enhanced Phase Change Material. Energy 2025, 319, 135032. [Google Scholar] [CrossRef]
  6. Bouzidi, M.; Aljibori, H.S.S.; Raizah, Z.; Ali, M.H.; Saidani, T.; Alresheedi, F.; Elhassanein, A.; Sabour, M.; Ghalambaz, M. Simulation of Conjugate Free Convection Heat Transfer of NEPCM/Al2O3-Kerosene Non-Newtonian Hybrid Nanoliquid between a Double-Pipe Space. Case Stud. Therm. Eng. 2025, 71, 106143. [Google Scholar] [CrossRef]
  7. Anand, A.; Shukla, A.; Panchal, H.; Sharma, A. Thermal Regulation of Photovoltaic System for Enhanced Power Production: A Review. J. Energy Storage 2021, 35, 102236. [Google Scholar] [CrossRef]
  8. Chandel, S.S.; Agarwal, T. Review of Cooling Techniques Using Phase Change Materials for Enhancing Efficiency of Photovoltaic Power Systems. Renew. Sustain. Energy Rev. 2017, 73, 1342–1351. [Google Scholar] [CrossRef]
  9. Jayaprakash, V.; Ganesan, S.; Beemkumar, N.; Sunil Kumar, M.; Kamakshi Priya, K. Enhancing Thermal Energy Storage Efficiency: Synthesis and Analysis of Hybrid Nano-PCMs. Results Eng. 2025, 26, 104899. [Google Scholar] [CrossRef]
  10. Venkatesh, R.; Logesh, K.; Vinayagam, M.; Prabagaran, S.; Chaturvedi, R.; Hossain, I.; Soudagar, M.E.M.; Salmen, S.H.; Al Obaid, S. Hybrid Photovoltaic Solar System Performance Enriched by Adaptation of Silicon Carbide Made Porous Medium. Electr. Eng. 2025, 107, 3271–3283. [Google Scholar] [CrossRef]
  11. Sathish, T.; Giri, J.; Saravanan, R.; Said, Z.; Al-lehaibi, M. MWCNT/SiO2 Hybrid Nano-PCM for Ultrafast Solar Cookers: An Experimental Study. Eng. Rep. 2025, 7, e13102. [Google Scholar] [CrossRef]
  12. Ashok, R.; Sakthivel, T.G. A Complete Review of Augmenting Solar Desalination Efficiency with PCMs. Results Eng. 2025, 25, 104421. [Google Scholar] [CrossRef]
  13. Hasan, A.; Sarwar, J.; Alnoman, H.; Abdelbaqi, S. Yearly Energy Performance of a Photovoltaic-Phase Change Material (PV-PCM) System in Hot Climate. Sol. Energy 2017, 146, 417–429. [Google Scholar] [CrossRef]
  14. Waqas, A.; Ji, J. Thermal Management of Conventional PV Panel Using PCM with Movable Shutters—A Numerical Study. Sol. Energy 2017, 158, 797–807. [Google Scholar] [CrossRef]
  15. Sharma, S.; Micheli, L.; Chang, W.; Tahir, A.A.; Reddy, K.S.; Mallick, T.K. Nano-Enhanced Phase Change Material for Thermal Management of BICPV. Appl. Energy 2017, 208, 719–733. [Google Scholar] [CrossRef]
  16. Hasan, A.; McCormack, S.J.; Huang, M.J.; Sarwar, J.; Norton, B. Increased Photovoltaic Performance through Temperature Regulation by Phase Change Materials: Materials Comparison in Different Climates. Sol. Energy 2015, 115, 264–276. [Google Scholar] [CrossRef]
  17. Abdelrazik, A.S.; Al-Sulaiman, F.A.; Saidur, R. Numerical Investigation of the Effects of the Nano-Enhanced Phase Change Materials on the Thermal and Electrical Performance of Hybrid PV/Thermal Systems. Energy Convers. Manag. 2020, 205, 112449. [Google Scholar] [CrossRef]
  18. Sivashankar, M.; Selvam, C.; Manikandan, S.; Harish, S. Performance Improvement in Concentrated Photovoltaics Using Nano-Enhanced Phase Change Material with Graphene Nanoplatelets. Energy 2020, 208, 118408. [Google Scholar] [CrossRef]
  19. Abdollahi, N.; Rahimi, M. Potential of Water Natural Circulation Coupled with Nano-Enhanced PCM for PV Module Cooling. Renew. Energy 2020, 147, 302–309. [Google Scholar] [CrossRef]
  20. Zhang, Y.; Zhang, X. Thermal Properties of a New Type of Calcium Chloride Hexahydrate-Magnesium Chloride Hexahydrate/Expanded Graphite Composite Phase Change Material and Its Application in Photovoltaic Heat Dissipation. Sol. Energy 2020, 204, 683–695. [Google Scholar] [CrossRef]
  21. Abdelrazik, A.S.; Saidur, R.; Al-Sulaiman, F.A. Thermal Regulation and Performance Assessment of a Hybrid Photovoltaic/Thermal System Using Different Combinations of Nano-Enhanced Phase Change Materials. Sol. Energy Mater. Sol. Cells 2020, 215, 110645. [Google Scholar] [CrossRef]
  22. Emam, M.; Ookawara, S.; Ahmed, M. Performance Study and Analysis of an Inclined Concentrated Photovoltaic-Phase Change Material System. Sol. Energy 2017, 150, 229–245. [Google Scholar] [CrossRef]
  23. Foteinis, S.; Savvakis, N.; Tsoutsos, T. Energy and Environmental Performance of Photovoltaic Cooling Using Phase Change Materials under the Mediterranean Climate. Energy 2023, 265, 126355. [Google Scholar] [CrossRef]
  24. Xu, Z.; Kong, Q.; Qu, H.; Wang, C. Cooling Characteristics of Solar Photovoltaic Panels Based on Phase Change Materials. Case Stud. Therm. Eng. 2023, 41, 102667. [Google Scholar] [CrossRef]
  25. Velmurugan, K.; Karthikeyan, V.; Korukonda, T.B.; Madhan, K.; Emsaeng, K.; Sukchai, S.; Sirisamphanwong, C.; Wongwuttanasatian, T.; Elavarasan, R.M.; Alhelou, H.H. Experimental Studies on PV Module Cooling with Radiation Source PCM Matrix. IEEE Access 2020, 8, 145936–145949. [Google Scholar] [CrossRef]
  26. Badi, N.; Alghamdi, S.A.; El-Hageen, H.M.; Albalawi, H. Onsite Enhancement of REEEC Solar Photovoltaic Performance through PCM Cooling Technique. PLoS ONE 2023, 18, e0281391. [Google Scholar] [CrossRef]
  27. Bria, A.; Raillani, B.; Chaatouf, D.; Salhi, M.; Amraqui, S.; Mezrhab, A. Effect of PCM Thickness on the Performance of the Finned PV/PCM System. Mater. Today Proc. 2023, 72, 3617–3625. [Google Scholar] [CrossRef]
  28. Devarajan, M.M.; Kumaraguruparan, G. Thermal Analysis of Solar Panel with Phase Change Material: Experimental and Numerical Study. J. Braz. Soc. Mech. Sci. Eng. 2024, 46, 222. [Google Scholar] [CrossRef]
  29. Refaey, H.A.; Abdo, S.; Saidani-Scott, H.; El-Shekeil, Y.A.; Bendoukha, S.; Barhoumi, N.; Abdelrahman, M.A. Thermal Regulation of Photovoltaic Panels Using PCM with Multiple Fins Configuration: Experimental Study with Analysis. Therm. Sci. Eng. Prog. 2024, 49, 102457. [Google Scholar] [CrossRef]
  30. Karthick, A.; Kalidasa Murugavel, K.; Sudalaiyandi, K.; Muthu Manokar, A. Building Integrated Photovoltaic Modules and the Integration of Phase Change Materials for Equatorial Applications. Build. Serv. Eng. Res. Technol. 2020, 41, 634–652. [Google Scholar] [CrossRef]
  31. Kline, S.J. Describing Uncertainties in Single-Sample Experiments. Mech. Eng. 1963, 75, 3–8. [Google Scholar]
  32. Kirkup, L.; Frenkel, R.B. An Introduction to Uncertainty in Measurement: Using the GUM (Guide to the Expression of Uncertainty in Measurement); Cambridge University Press: Cambridge, UK, 2006; ISBN 1139454900. [Google Scholar]
  33. Stritih, U. Increasing the Efficiency of PV Panel with the Use of PCM. Renew. Energy 2016, 97, 671–679. [Google Scholar] [CrossRef]
  34. Kumar, K.S.; Revanth, S.; Sanjeev, D.; Kumar, P.S.; Surya, P. Experimental Investigation of Improving the Energy Conversion Efficiency of PV Cell by Integrating with PCM. Mater. Today Proc. 2021, 37, 712–716. [Google Scholar] [CrossRef]
  35. Kibria, M.G.; Mohtasim, M.S.; Paul, U.K.; Das, B.K.; Saidur, R. Impact of Hybrid Nano PCM (Paraffin Wax with Al2O3 and ZnO Nanoparticles) on Photovoltaic Thermal System: Energy, Exergy, Exergoeconomic and Enviroeconomic Analysis. J. Clean. Prod. 2024, 436, 140577. [Google Scholar] [CrossRef]
  36. Hassan, E.A.; Tony, M.A.; Awad, M.M. Thermal Energy Storage Using Hybrid Nanofluid Phase Change Material (PCM) Based on Waste Sludge Incorp Rated ZnO/α-Fe2O3. Nanomaterials 2024, 14, 604. [Google Scholar] [CrossRef]
  37. Kalidasan, B.; Pandey, A.K.; Rahman, S.; Yadav, A.; Samykano, M.; Tyagi, V. V Graphene–Silver Hybrid Nanoparticle Based Organic Phase Change Materials for Enhanced Thermal Energy Storage. Sustainability 2022, 14, 13240. [Google Scholar] [CrossRef]
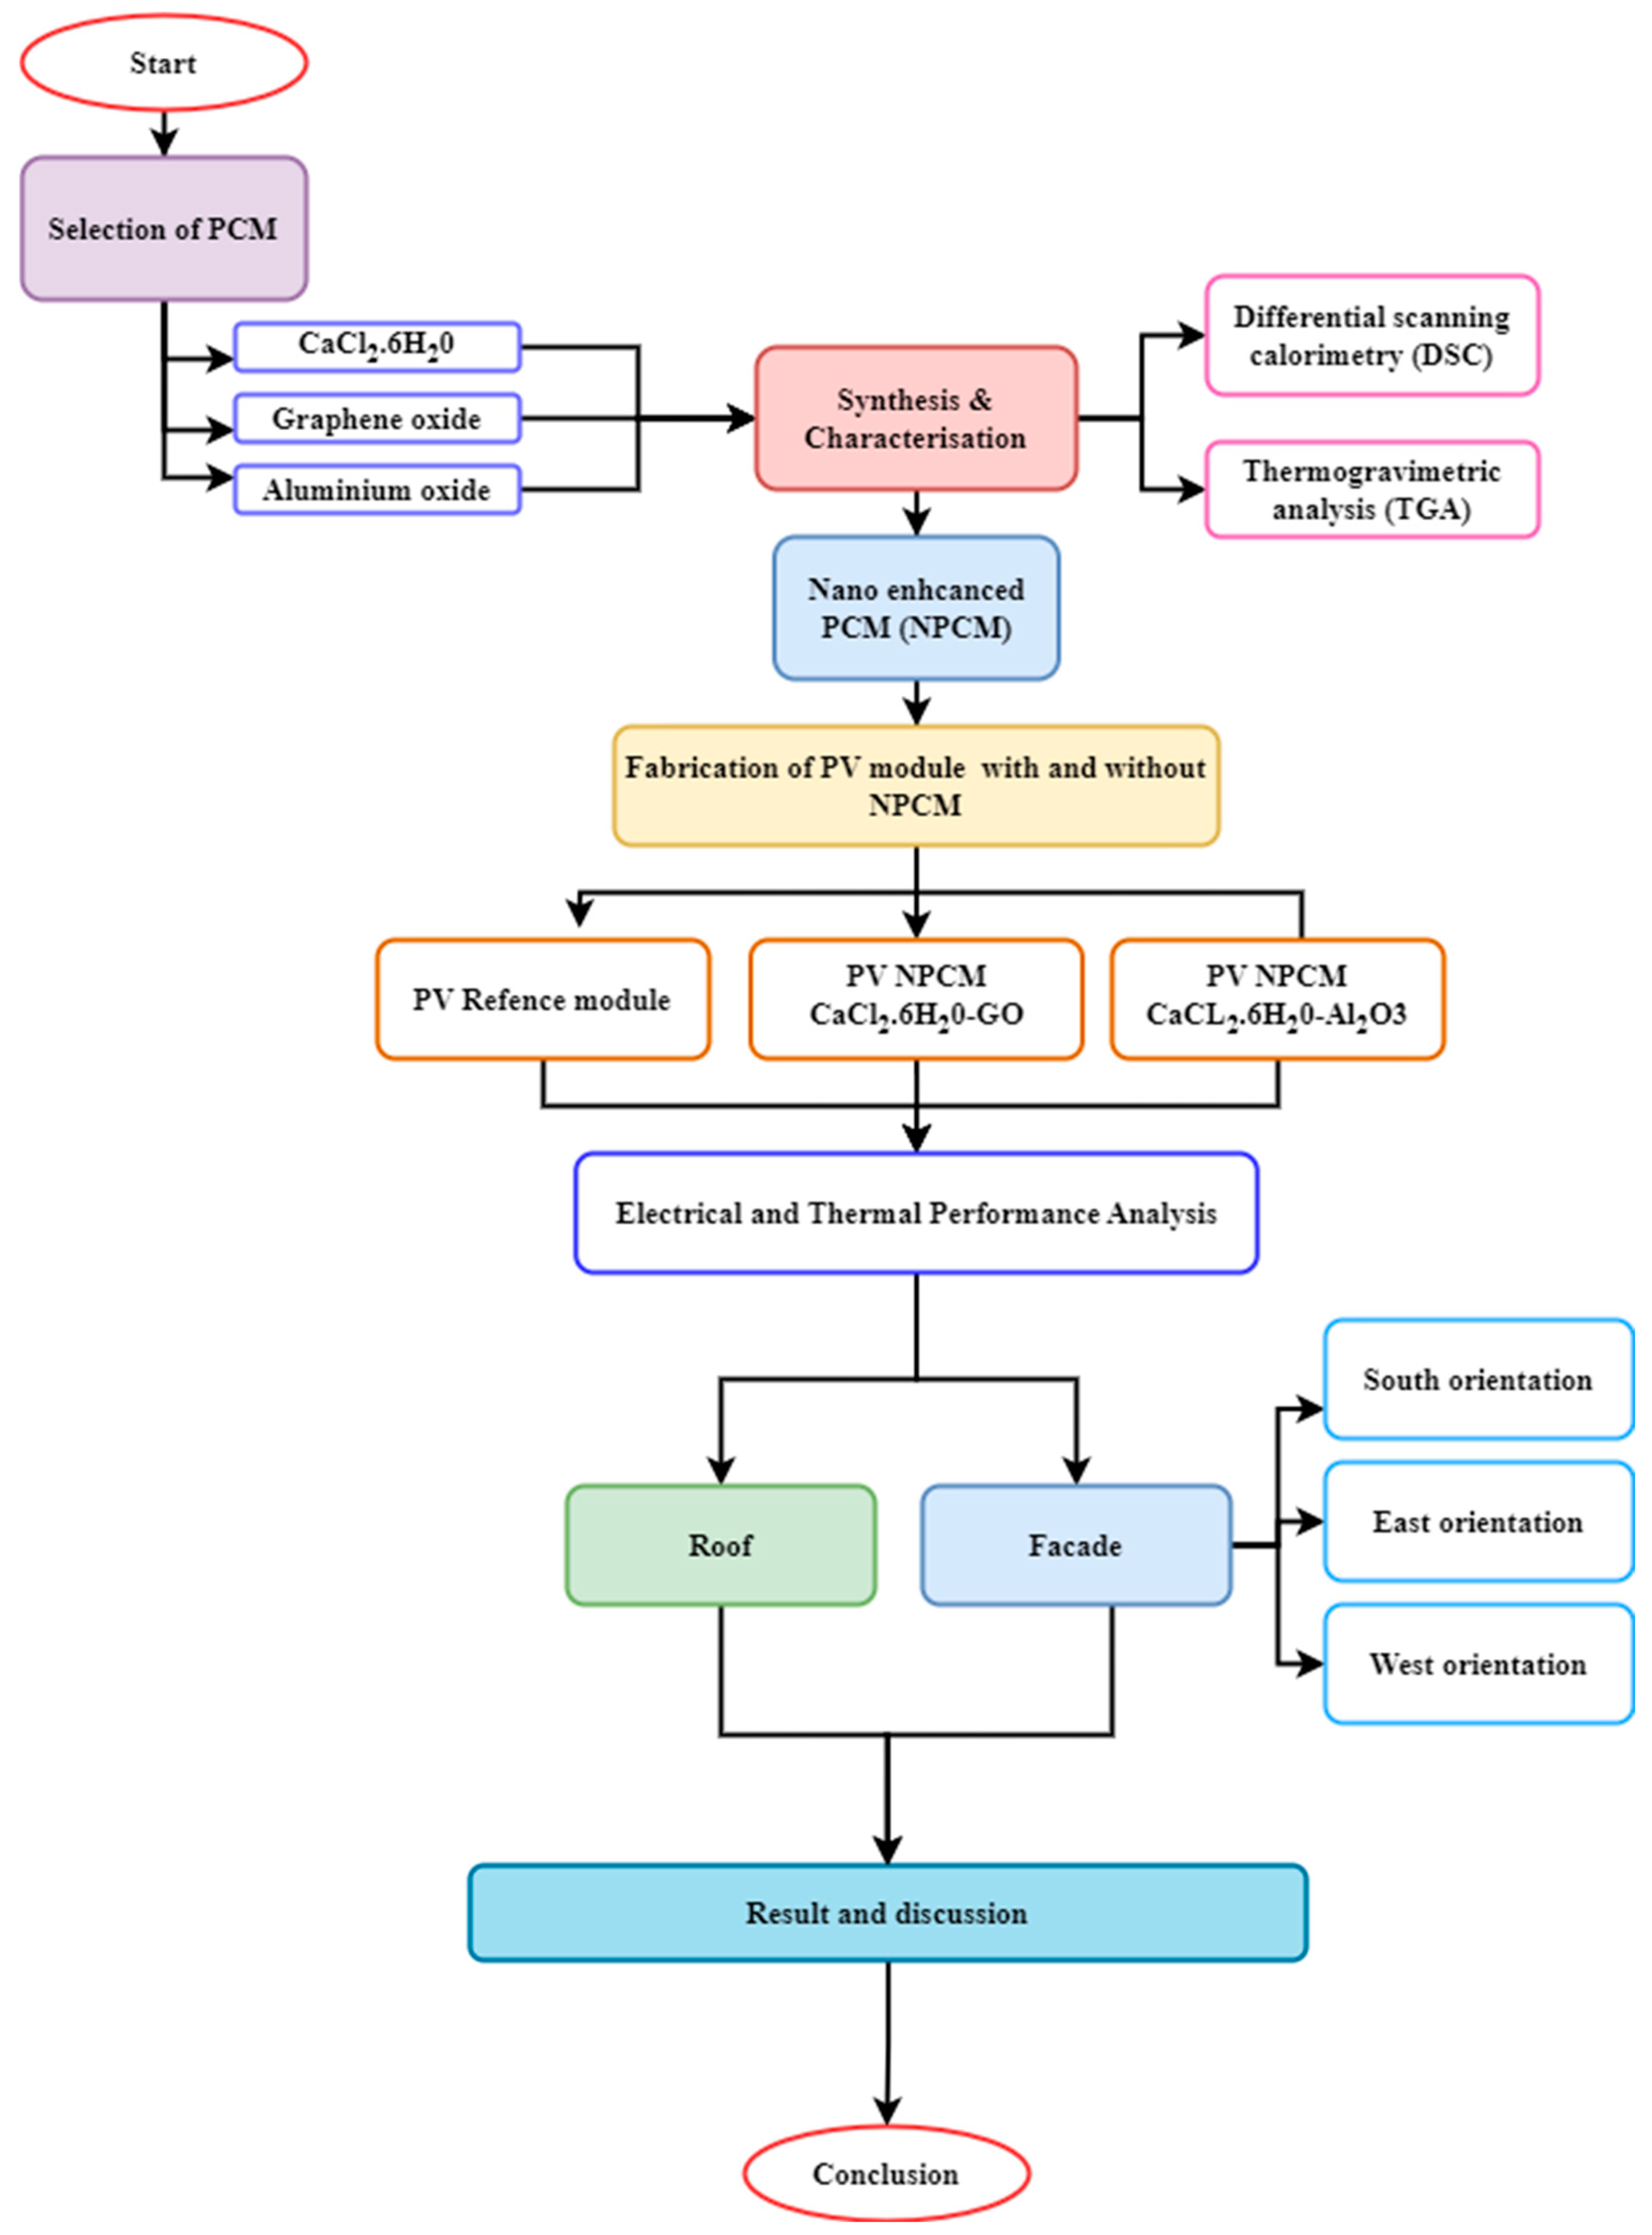
Figure 1. Methodology adopted in this study.
Buildings 15 04236 g001
Figure 2. Preparation of a nanocomposite.
Buildings 15 04236 g002
Figure 3. Experimental setup with instrumentation: (a) STPV, (b) STPV PCM1, and (c) STPV PCM2.
Buildings 15 04236 g003
Figure 4. STPV PCM cell: (a) rear side with PCM and (b) front side of the STPV PCM module.
Buildings 15 04236 g004
Figure 5. Results of differential scanning calorimetry. (a) CaCl2·6H2O-GO and (b) CaCl2·6H2O-AO.
Buildings 15 04236 g005
Figure 6. Results of thermal cycles of (a) CaCl2·6H2O-GO and (b) CaCl2·6H2O-AO.
Buildings 15 04236 g006
Figure 7. Hourly variation of the solar radiation on typical days of March 2025.
Buildings 15 04236 g007
Figure 8. Hourly variation of DC power for the typical day in March 2025: (a) flat surface, (b) south-oriented façade, (c) east-oriented façade, and (d) west-oriented façade.
Buildings 15 04236 g008
Figure 9. Hourly variation of electrical efficiency for the typical day in March 2025: (a) flat surface, (b) south-oriented façade, (c) east-oriented façade, and (d) west-oriented façade.
Buildings 15 04236 g009
Figure 10. Hourly variation of surface temperature for the typical day in March 2025: (a) flat surface (b) south-oriented façade, (c) east-oriented façade, and (d) west-oriented façade.
Buildings 15 04236 g010
Table 1. Specification of STPV module.
ParameterSpecification
STPV
(PVRef)
STPV PCM1
(PVGO)
STPV PCM2
(PVAO)
Type of solar cellPolycrystalline silicon cell
Nominal power (Wp)4.33 W4.33 W4.33 W
Current at maximum power (Imp) (A)8.22 A8.22 A8.22 A
Voltage at maximum power (Vmp) (V)0.53 V0.53 V0.53 V
Short circuit current (Isc) (A)8.7 A8.7 A8.7 A
Open circuit voltage (VOC) (V)0.631 V0.631 V0.631 V
Conversion efficiency %17.817.817.8
Cooling method-PassivePassive
Type of cooling-PCM—CaCl2·6H2OPCM—CaCl2·6H2O
Nano Material-Graphene oxideAluminum oxide
Dimension 56 mm × 156 mm ± 0.5 mm
Thickness200 µm ± 30 µm (Wafer thickness)
FrontSilver bus bars; silicon nitride antireflection coating
BackSilver bus bars; Full-surface
Table 2. Properties of calcium chloride hexahydrate (CaCl2·6H2O), graphene oxide, and aluminum oxide.
PropertyValue/Description
Chemical FormulaCaCl2·6H2OCxOyHzAl2O3
Molar Mass219.08 g/mol~60–80 g/mol per C atom unit101.96 g/mol
AppearanceColorless to white crystalline solidBrown to yellow-brown powderWhite crystalline solid
Density1.71 g/cm3 (at 20 °C)1.8–2.2 g/cm33.95–4.1 g/cm3
Thermal Conductivity~0.5–0.6 W/m·K (estimated for solid form)5–10 W/m·K20–38.5 W/m·K
Table 3. Eutectic mixture and synthesis of CCH/GO and CCH/AO.
Sample CodeSample NameCaCl2·6H2O (%)Concentration (%)WtThermal Conductivity (W/mK)Latent Heat
(kJ/kg)
CaCl2·6H2OCalcium chloride hexahydrate10000.58160
0.25GONanocomposite PCM99.750.250.78172
0.5GONCP99.50.50.72165
1GONCP9910.7158
0.25 AONCP99.750.250.68155
0.5AONCP99.50.50.65152
1AONCP9910.62148
Table 4. Instrument specification.
InstrumentRangeAccuracy
Pyranometer0–2000 W/m2±1 W/m2
Temperature sensor0–200 °C±1 °C
Analog Ammeter (A)0–5 A±0.1 A
Analog Voltmeter (V)75 V±1 V
Loading Rheostat (ohm)90 ohm, 4 A±0.1%
Thermocouple sensor K-type 220 °C±5 °C
Thermal conductivity
Sensor InterfaceDB-15 connector±5 C
0.00–50.00 °C
Conductivity0.02–2.00 W/(m K)±0.01 W/(m K)
Resistivity50–5000 °Ccm/W±10 C
Table 5. Comparison of the globally reported PCM with CaCl2·6H2O.
PCMFindingsLocationReferences
CaCl2·6H2O-capric and palmitic acidsCaCl2⋅6H2O performed best in both climates, lowering temperatures and improving overall performance, with particularly notable gains in the hot environment of Vehari.Dublin, Ireland[26]
PCM RT28HCIncreased yearly power output by 7.3%; surface temperature decreased on panels of up to 35.6%City of Ljubljana[32]
Copper, silicon carbide, paraffin waxAnalyzing the impact of PV cell combinations between and without PCMCoimbatore
India
[33]
PCM-RT27A drop in temperature occurs. Boosts electrical production by nearly 9.4%Greece[23]
PCM-OM37PKeep the temperature at or near the ambient level. The increase in power output could reach 3%.Tabuk[34]
Hybrid nanoparticles (2.0 wt% ZnO and 2.0 wt% Al2O3) used in the PCMAs the rate of heat transmission increases, the temperature drops. The electrical efficiency was around 35% higher than that of the standard PV panel.Bangladesh[35]
AS-ZnO/α-Fe2O3 nanocrystals added to PCMAs the rate of heat transmission increases, the temperature drops. A 93% improvement in thermal storage performance was possible with 1.0 wt% hybrid nanoparticles in PCM.Saudi Arabia[36]
Gr, Ag nano-powder is distributed at 0.8 wt% in RT50As the rate of heat transmission increases, the temperature drops. A 93% improvement in thermal storage performance was possible with 1.0 wt% hybrid nanoparticle in PCM.Malaysia[37]
Cacl2·6H2O mixture of Aluminium oxide and graphene oxideTemperature reduction of a maximum of 12 °C in the façade during peak hoursCoimbatore
India
Present study
Disclaimer/Publisher’s Note: The statements, opinions and data contained in all publications are solely those of the individual author(s) and contributor(s) and not of MDPI and/or the editor(s). MDPI and/or the editor(s) disclaim responsibility for any injury to people or property resulting from any ideas, methods, instructions or products referred to in the content.