Article

Functional Strut-and-Tie Model of Filament Pipes in Extradosed Cable-Stayed Bridges Under Mechanical Loading

1
Faculty of Engineering, China University of Geosciences, Wuhan 430074, China
2
Faculty of Engineering and Technical Studies, University of Kordofan, El-Obeid 51111, Sudan
3
Wuhan Yucheng Construction Group Co., Ltd., Wuhan 430061, China
4
Faculty of Engineering and Quantity Surveying, INTI International University, Nilai 71800, Malaysia
*
Author to whom correspondence should be addressed.
Buildings 2025, 15(23), 4235; https://doi.org/10.3390/buildings15234235
Submission received: 15 October 2025 / Revised: 7 November 2025 / Accepted: 18 November 2025 / Published: 24 November 2025
(This article belongs to the Special Issue Soil–Structure Interactions for Civil Infrastructure)

Abstract

Designing reinforcements for concrete towers in extra-dosed cable-stayed bridges is challenging due to the passage of filament pipes, particularly in the D-region, where strain distribution is nonlinear under mechanical loading. The strut-and-tie model (STM) is a widely used approach for designing these regions; however, its development in the presence of filament pipe passages requires further refinement. This study introduces a functional STM based on topology optimization to represent stress flow beneath filament pipe passages. The method retains structural elements essential for force transmission while eliminating less significant ones, thereby establishing optimal load paths. Using ANSYS software, the effects of varying the radius of curvature of the cable saddle on stress distribution induced by filament pipes were analyzed. Results indicate that the curvature radius strongly influences internal forces in STM members: as the radius increases, both stress and internal forces decrease within the tower, clarifying the evolution of force distribution with changing curvature. These findings provide a functional framework for STM applications and are expected to serve as a reference for the comprehensive structural design of concrete towers in extra-dosed cable-stayed bridges.

1. Introduction

Cable-stayed bridges represent a significant advancement in bridge engineering and are frequently selected for their extensive span and aesthetic appeal, rendering them popular for crossings over mountainous regions and wide rivers. Their distinctive structural system, consisting of cables directly connecting the towers and the deck, provides an efficient means of load transfer.
The evolution of cable-stayed bridges has been marked by a growing trend towards longer spans; for instance, the Sutong Bridge in Figure 1, which opened in 2008, showcased the capabilities of the cable-stayed design with its main span of over 1000 m, a record at the time [1]. The performance of stay cables, for example, is critical because they endure substantial tensile loads and environmental stresses throughout the bridge’s lifespan [2]. These contemporary bridges comprise a main beam, cables, and a bridge tower that transfers loads from the main beam to the pier or foundation, bearing the vertical components of the cable forces. This emphasizes the importance of ensuring the structural integrity of cable-stayed bridges.
Concrete construction constitutes the majority of bridge towers, making the prevention of cracks in concrete sections a pressing challenge. In cable-stayed bridges, forces from the main beam are transmitted to the concrete towers through cables, necessitating optimized designs to handle these forces effectively. In this regard, filament pipes in the context of extradosed cable-stayed bridges act principally as tension elements that assist in the support of the bridge deck. Furthermore, the design principles of extradosed bridges emphasize the importance of optimizing cable forces and understanding the interactions between the cables, beams, and towers to achieve desired performance [3,4,5,6,7].
Traditional methods, such as beam theory and finite element analysis (FEA), are commonly used to analyze and design these structures. While these approaches are effective for many applications, they may fall short when addressing nonlinear stress distributions and localized force concentrations in certain regions, such as deep beams or highly stressed concrete sections.
To address these challenges, the strut-and-tie model (STM) has emerged as a valuable analytical tool. STM provides a valuable framework for simplifying the representation of load paths and internal forces in structural engineering. By representing structures as systems of compressive struts and tensile ties, STM enables engineers to visualize complex stress distributions and align designs with the actual behavior of materials under loading. Initially proposed by Ritter [8] and Mörsch [9] in the early 20th century as a truss analysis method, STM was later popularized as a design approach by Schleich et al. [10] and Schlaich and Schafer [11]. STM addresses the limitations of traditional beam theory, particularly for deep beams and elements subjected to significant shear forces [12,13]. STM has proven to be an effective method for analyzing D-regions, where the stress distribution is nonlinear and Bernoulli’s hypothesis does not apply, and has gained widespread acceptance among researchers [14,15,16,17].
In cable-stayed bridges, STM is especially valuable for analyzing disturbed regions (D-regions), such as cable anchorage zones, tower connections, and the traverse of filament pipes through concrete towers, where conventional beam theory fails to capture the intricate load paths and stress distributions. For instance, Cui and Huang [18] developed optimized STM models for cable-tower anchorage zones using topology optimization techniques and the principle of minimum strain energy, offering accurate representations of these critical regions. Similarly, Li et al. [19] demonstrated that STM provides a robust framework for analyzing stress concentrations in concrete bridge towers under vertical cable forces, which are often overlooked by traditional methods.
Beyond anchorage zones, STM’s versatility extends to various structural configurations and loading scenarios. Researchers like Kumar et al. [20,21] have highlighted its utility in addressing shear-critical regions and nonlinear behaviors under diverse loading conditions. Its integration with FEA and other computational methods has further enhanced its applicability in modern structural design [22,23].
Extensive studies have examined the vertical components of single and double cables [19,24], as well as the friction between cables and saddles [25,26,27]. Relatively few investigations focus on the passage of filament pipes through concrete constructions as the primary emphasis [26,28]. This study fills that gap by analyzing how the radius of curvature of a cable saddle affects filament pipes. A thorough and solid understanding of these concerns is required to ensure the safety and structural integrity of cable-stayed bridges.
To generate STM in concrete structures, the initial step involves determining an appropriate truss system for transferring loads in D-regions. Although the STM method is valued for its simplicity, its practical application necessitates the identification of suitable truss-like patterns [29,30,31,32,33]. Although several studies have applied optimization methods to generate STM for the anchorage zone in cable-stayed bridges [34,35,36,37], the specific case of filament pipe passage through concrete towers has not yet been investigated.
The primary objectives of this study are twofold. Firstly, it endeavored to assess the impact of the radius of curvature on concrete towers within the distributed loads of the filament pipe anchorage zone in extradosed cable-stayed bridges with a single plane of cables. This assessment was conducted by applying Model 1, which focused on investigating the stresses beneath the cable to understand how the distributed loads from the filament pipe are transferred to the concrete tower, thereby mitigating potential risks associated with concrete exposure to fractures and cracks. Secondly, this study aimed to establish the STM by identifying the optimal load path. This was achieved by applying the topology optimization method in Model 2.

2. Cable-Stayed Bridges

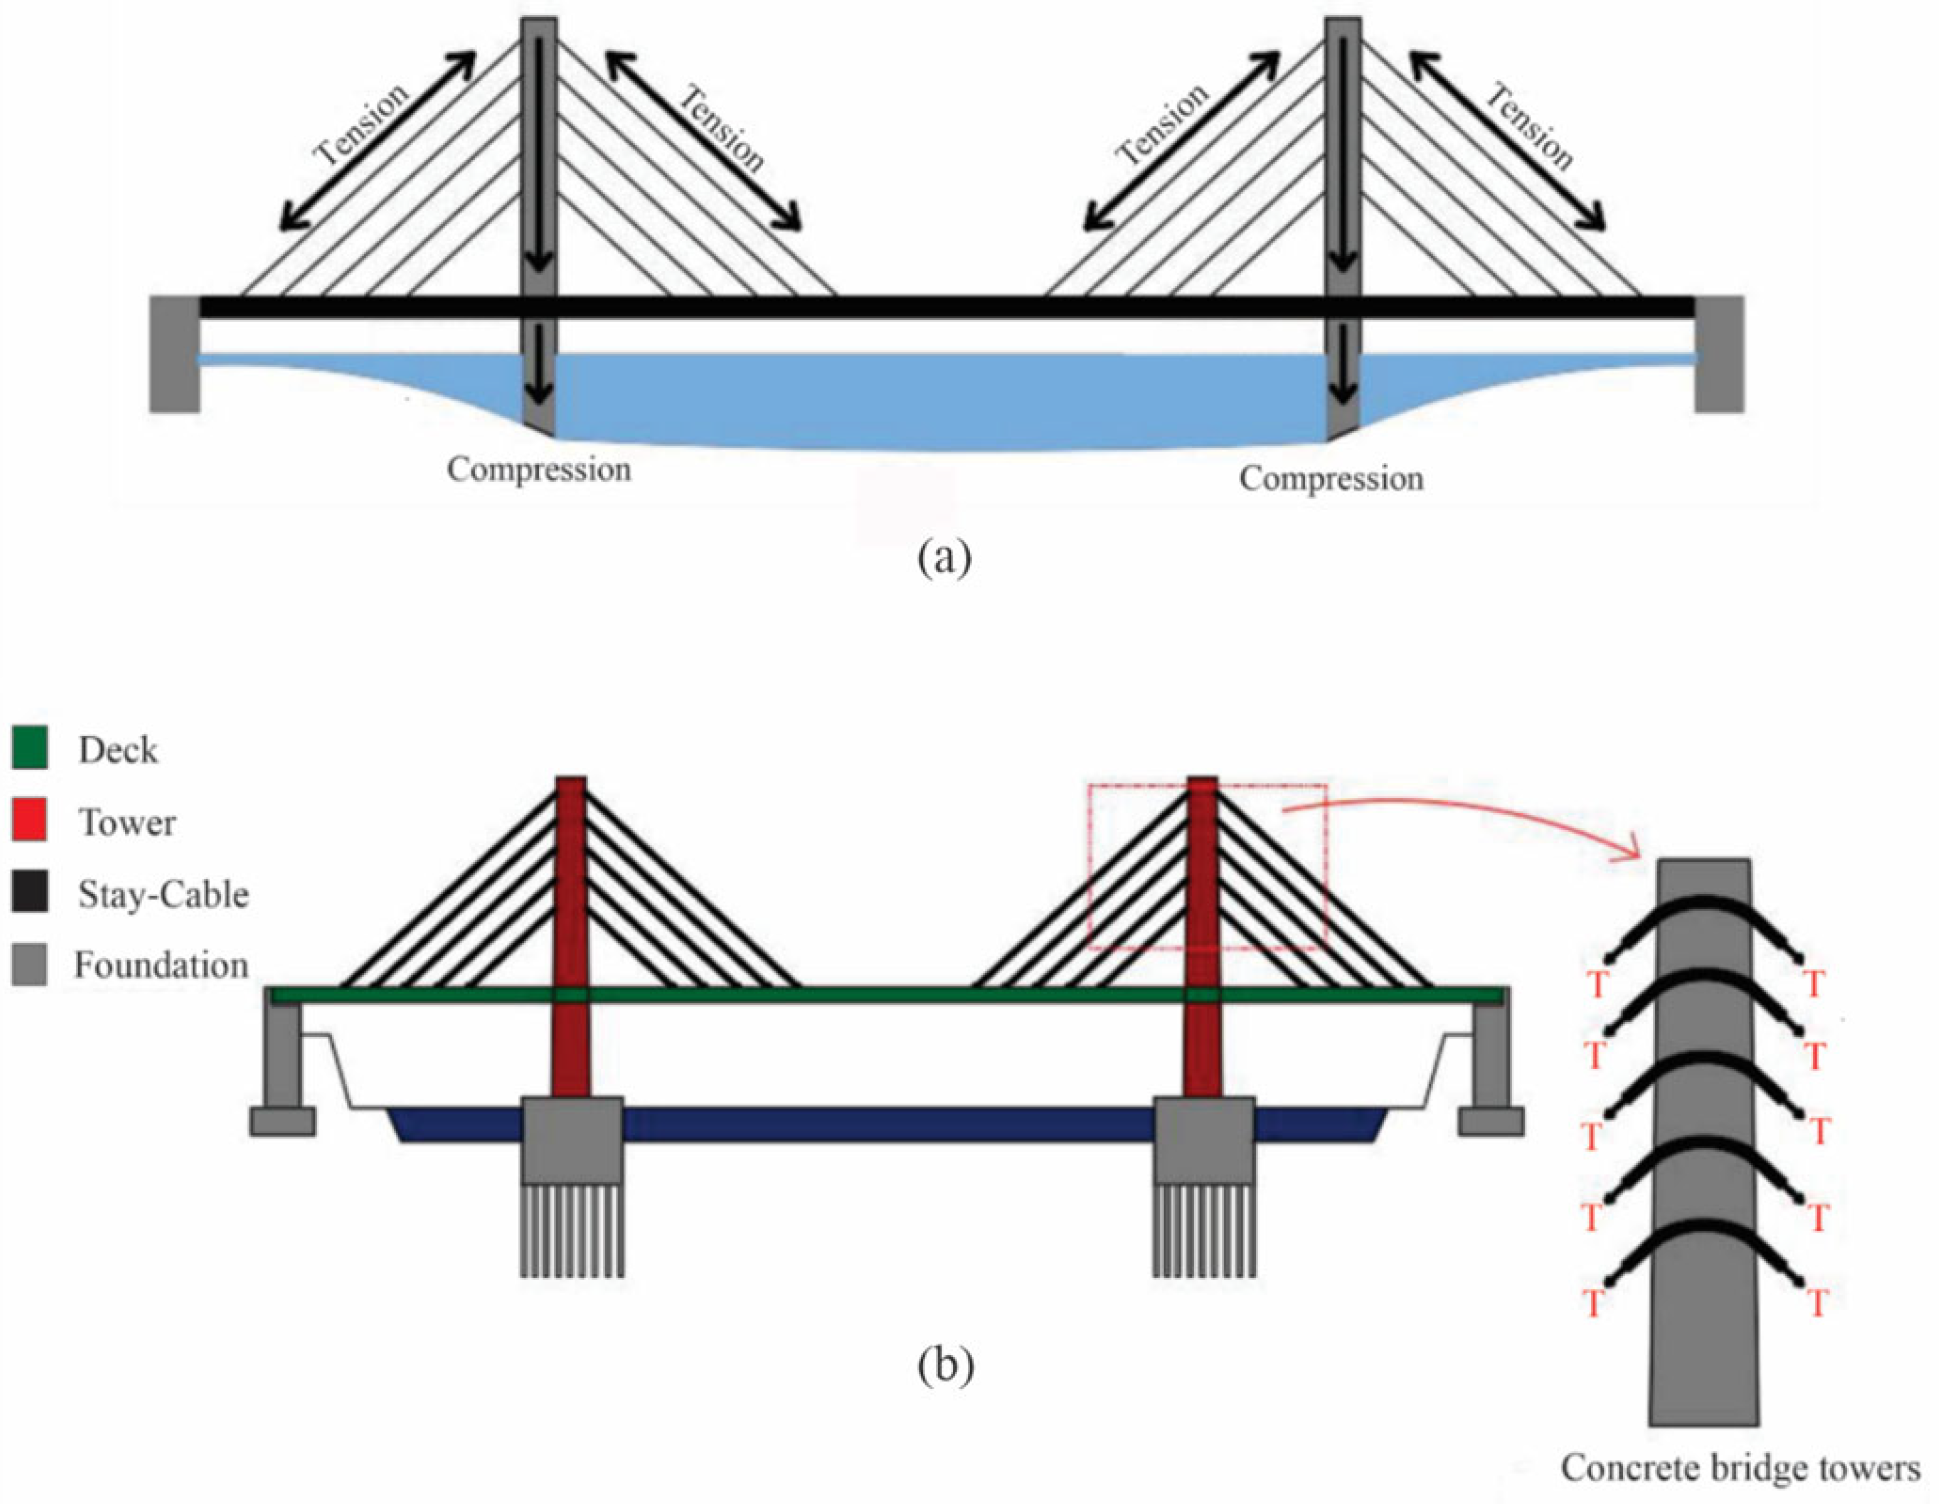
Cable-stayed bridges represent a well-established yet continually evolving form of bridge engineering, widely recognized for their efficiency in spanning long distances and their architectural appeal. These towers typically adopt a box-section configuration in the anchorage zone, wherein the stayed cables are securely fastened. In these bridge designs, the main beam is supported by multiple stay cables connected to the bridge towers. This structural arrangement is particularly advantageous for crossings over mountains and rivers, leveraging the exceptional span capabilities of bridges. A defining characteristic of cable-stayed bridges is their ability to efficiently transfer loads from the deck to the towers via cables, effectively dispersing the load to the ground, as illustrated in Figure 2.

2.1. Model Geometry

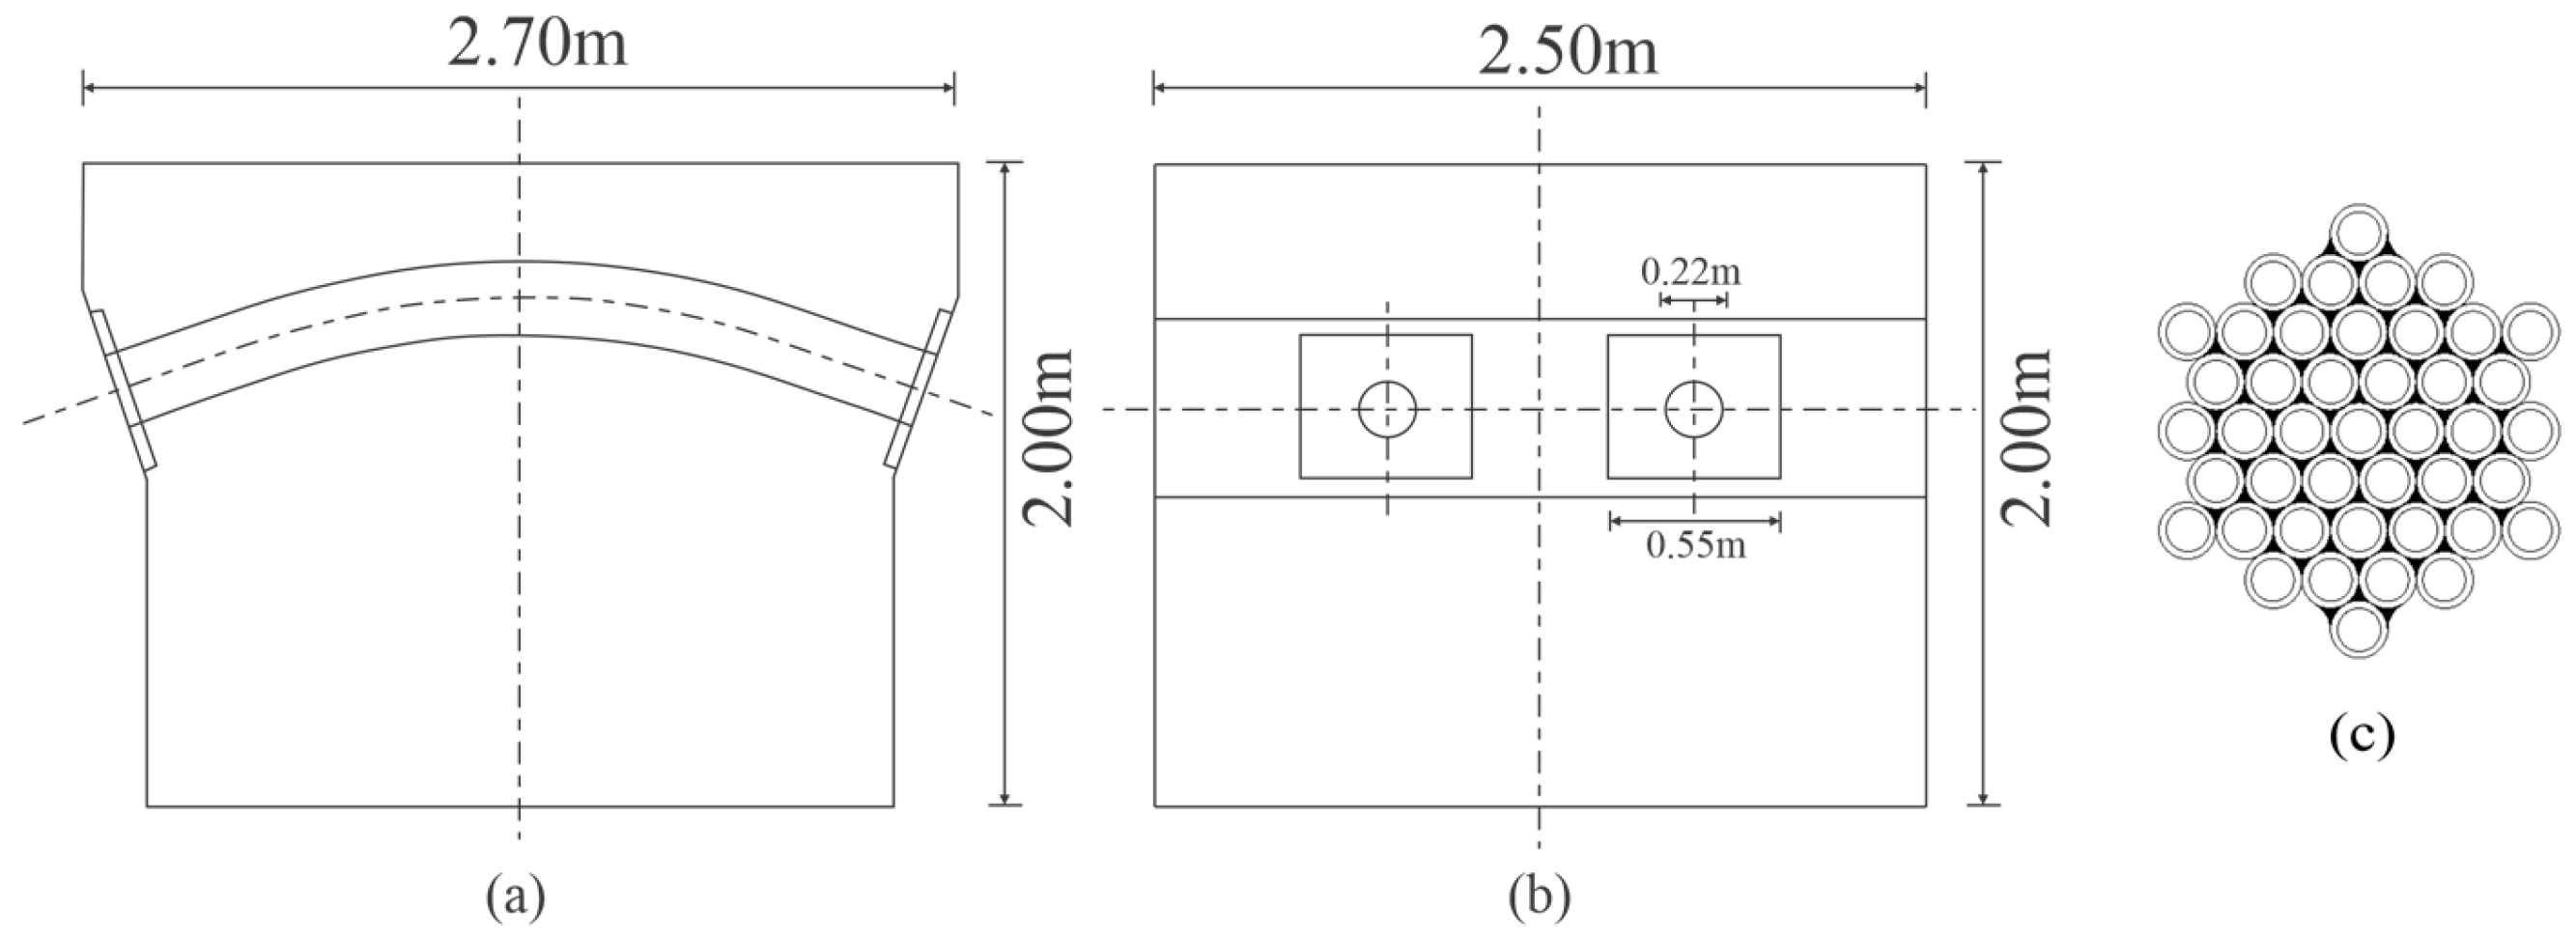
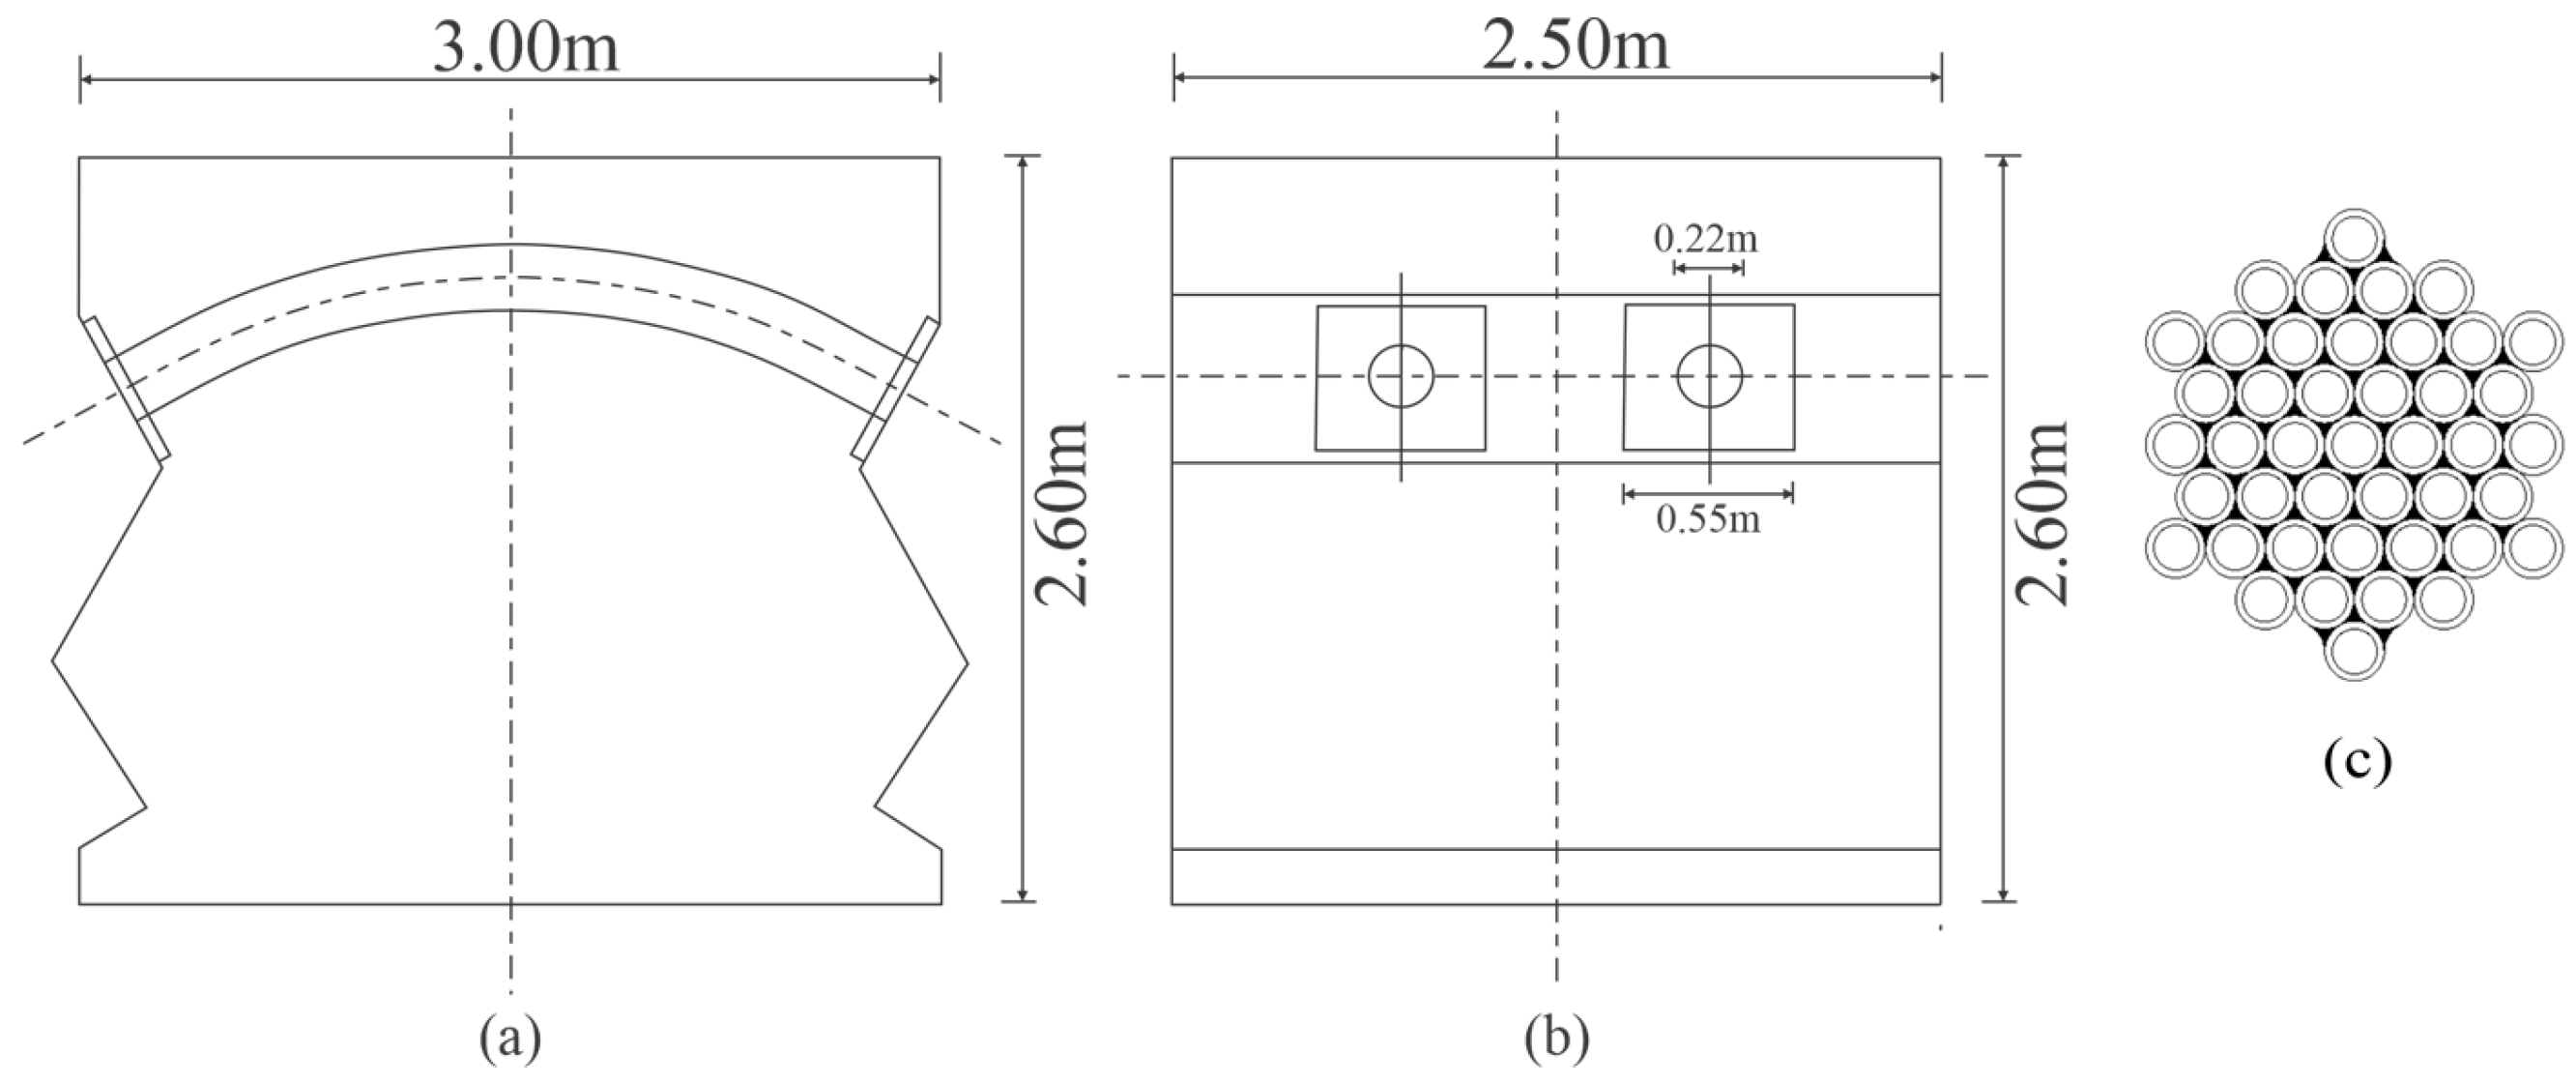
The tower dimensions (Figure 3 and Figure 4) were defined based on representative dimensions of typical extradosed cable-stayed bridges. The geometry was first drafted in AutoCAD 2019 and subsequently imported into ANSYS 19.0 for meshing and analysis.

2.2. Finite Element Analysis of Filament Pipe Anchorage Zone and Tower

In the present model, the steel filament passageways and the surrounding concrete were bonded using mesh-merging (vglue) in ANSYS, thereby ensuring full displacement compatibility at the steel–concrete interface. Potential stress concentrations at the interface were mitigated by locally refining the mesh density around the pipe circumference and at the transition zones. This approach ensured a realistic transfer of tensile forces from the filament pipes into the surrounding concrete while avoiding artificial stress singularities that could arise from coarser meshing.
The material properties (elastic modulus, density, and Poisson’s ratio) for concrete and steel, listed in Table 1 and Table 2, were taken directly from internationally recognized design standards [38,39,40] and assigned to the respective element type: SOLID45 for concrete and the filament pipes.
The loading conditions were defined according to Equation (1). In this formulation, q is the distributed load, T is the cable tension force (taken as 650 kN), and R is the curvature radius of the filament pipe. The distributed load q was applied as a surface pressure along the curved pipe surfaces. The tower base was fully restrained to represent a fixed support boundary condition.
q = T R
In Model 1, the stresses on the concrete in various areas were analyzed using a quarter model with a single cable, as illustrated in Figure 3. In Model 2, the entire model with one cable was used to study the formation of the STM beneath the anchorage zone of the filament pipe, as depicted in Figure 4.

3. Topology Optimization Method

Structural topology optimization is an optimization problem regarding material distribution in a collection space. Through iterative calculations, the elements that were beneficial to the force transmission performance of the structure were retained, and the elements that had minimal effect on the force transmission of the structure were removed. Prior to conducting the topology optimization analysis, a static structural or modal analysis, which will serve as a reference, must be performed. The static analysis optimizes all required information, such as material properties, loads, and limit conditions.
Several methods have been used for topology optimization, including homogenization, density, and topological function description. Among these, the variable-density method is the most commonly used.
This study adopted a variable-density approach. Assuming that the maximum or minimum objective function f is solved under the known constraint condition g j , the mathematical model of topology optimization can be expressed as follows:
find : Min / Mmax   f ( η i ) S . t .   0   <   η i 1 ( i   = 1 , 2 , 3 , ,   N ) g j < g j g j ( j = 1 , 2 , 3 , ,   M ) ,
Where η i is the pseudo density for each element varies from 0 to 1. Specifically, and η i   0 represents material to be removed, and η i   1 represents material that should be retained. Additionally, N is the number of finite elements, M is the number of constraints, g j is the jth constraint, g j is the upper limit of jth constraint, and g j denotes the lower limit of jth constraint.
Considering the mass of the structure, to minimize the deformation of the structure when a load is applied, the variables used for the optimization can be expressed as follows:
find : Min   f ( η i ) S . t .   0   <   η i 1 ( i   = 1 , 2 , 3 , ,   N ) V     φ V 0 ( 0   <   φ   1 ) ,
where f ( η i ) represents the mass of the members, V is the deformation after optimization, V 0 is the deformation before optimization, and φ is the percentage of reduced deformation.
In this study, Equations (2) and (3) were implemented within the ANSYS Workbench Topology Optimization module using the variable-density method. The objective function f ( η i ) represents the total structural compliance (strain energy), which was minimized to achieve the stiffest possible structure under the applied loads. Each finite-element cell within the design domain was assigned a pseudo-density value η i (0 ≤ η i ≤ 1), indicating the proportion of material retained in that element.
The constraint condition V / V 0 φ in Equation (3) was enforced directly through the retained-mass ratio parameter ( φ ) in ANSYS. This parameter specifies the allowable percentage of the initial mass that remains after optimization. Several retained-mass ratios (70%, 60%, 50%, and 45%) were tested to evaluate structural efficiency and determine the optimal configuration.
The same boundary conditions and loading scheme described in the static structural analysis (Section 2.2) were adopted for the optimization stage-specifically, a fixed tower base and a distributed load defined as q = T/R, acting along the curvature of the filament pipe. ANSYS employed an iterative solver based on the Method of Moving Asymptotes (MMA), and convergence was achieved when the change in compliance between successive iterations was less than 1%.
The resulting topology corresponding to a 45% retained-mass ratio exhibited the most efficient load-carrying configuration, with continuous and well-defined stress-flow paths. This optimized topology was subsequently used to derive the functional Strut-and-Tie Model (STM) presented in Section 5.
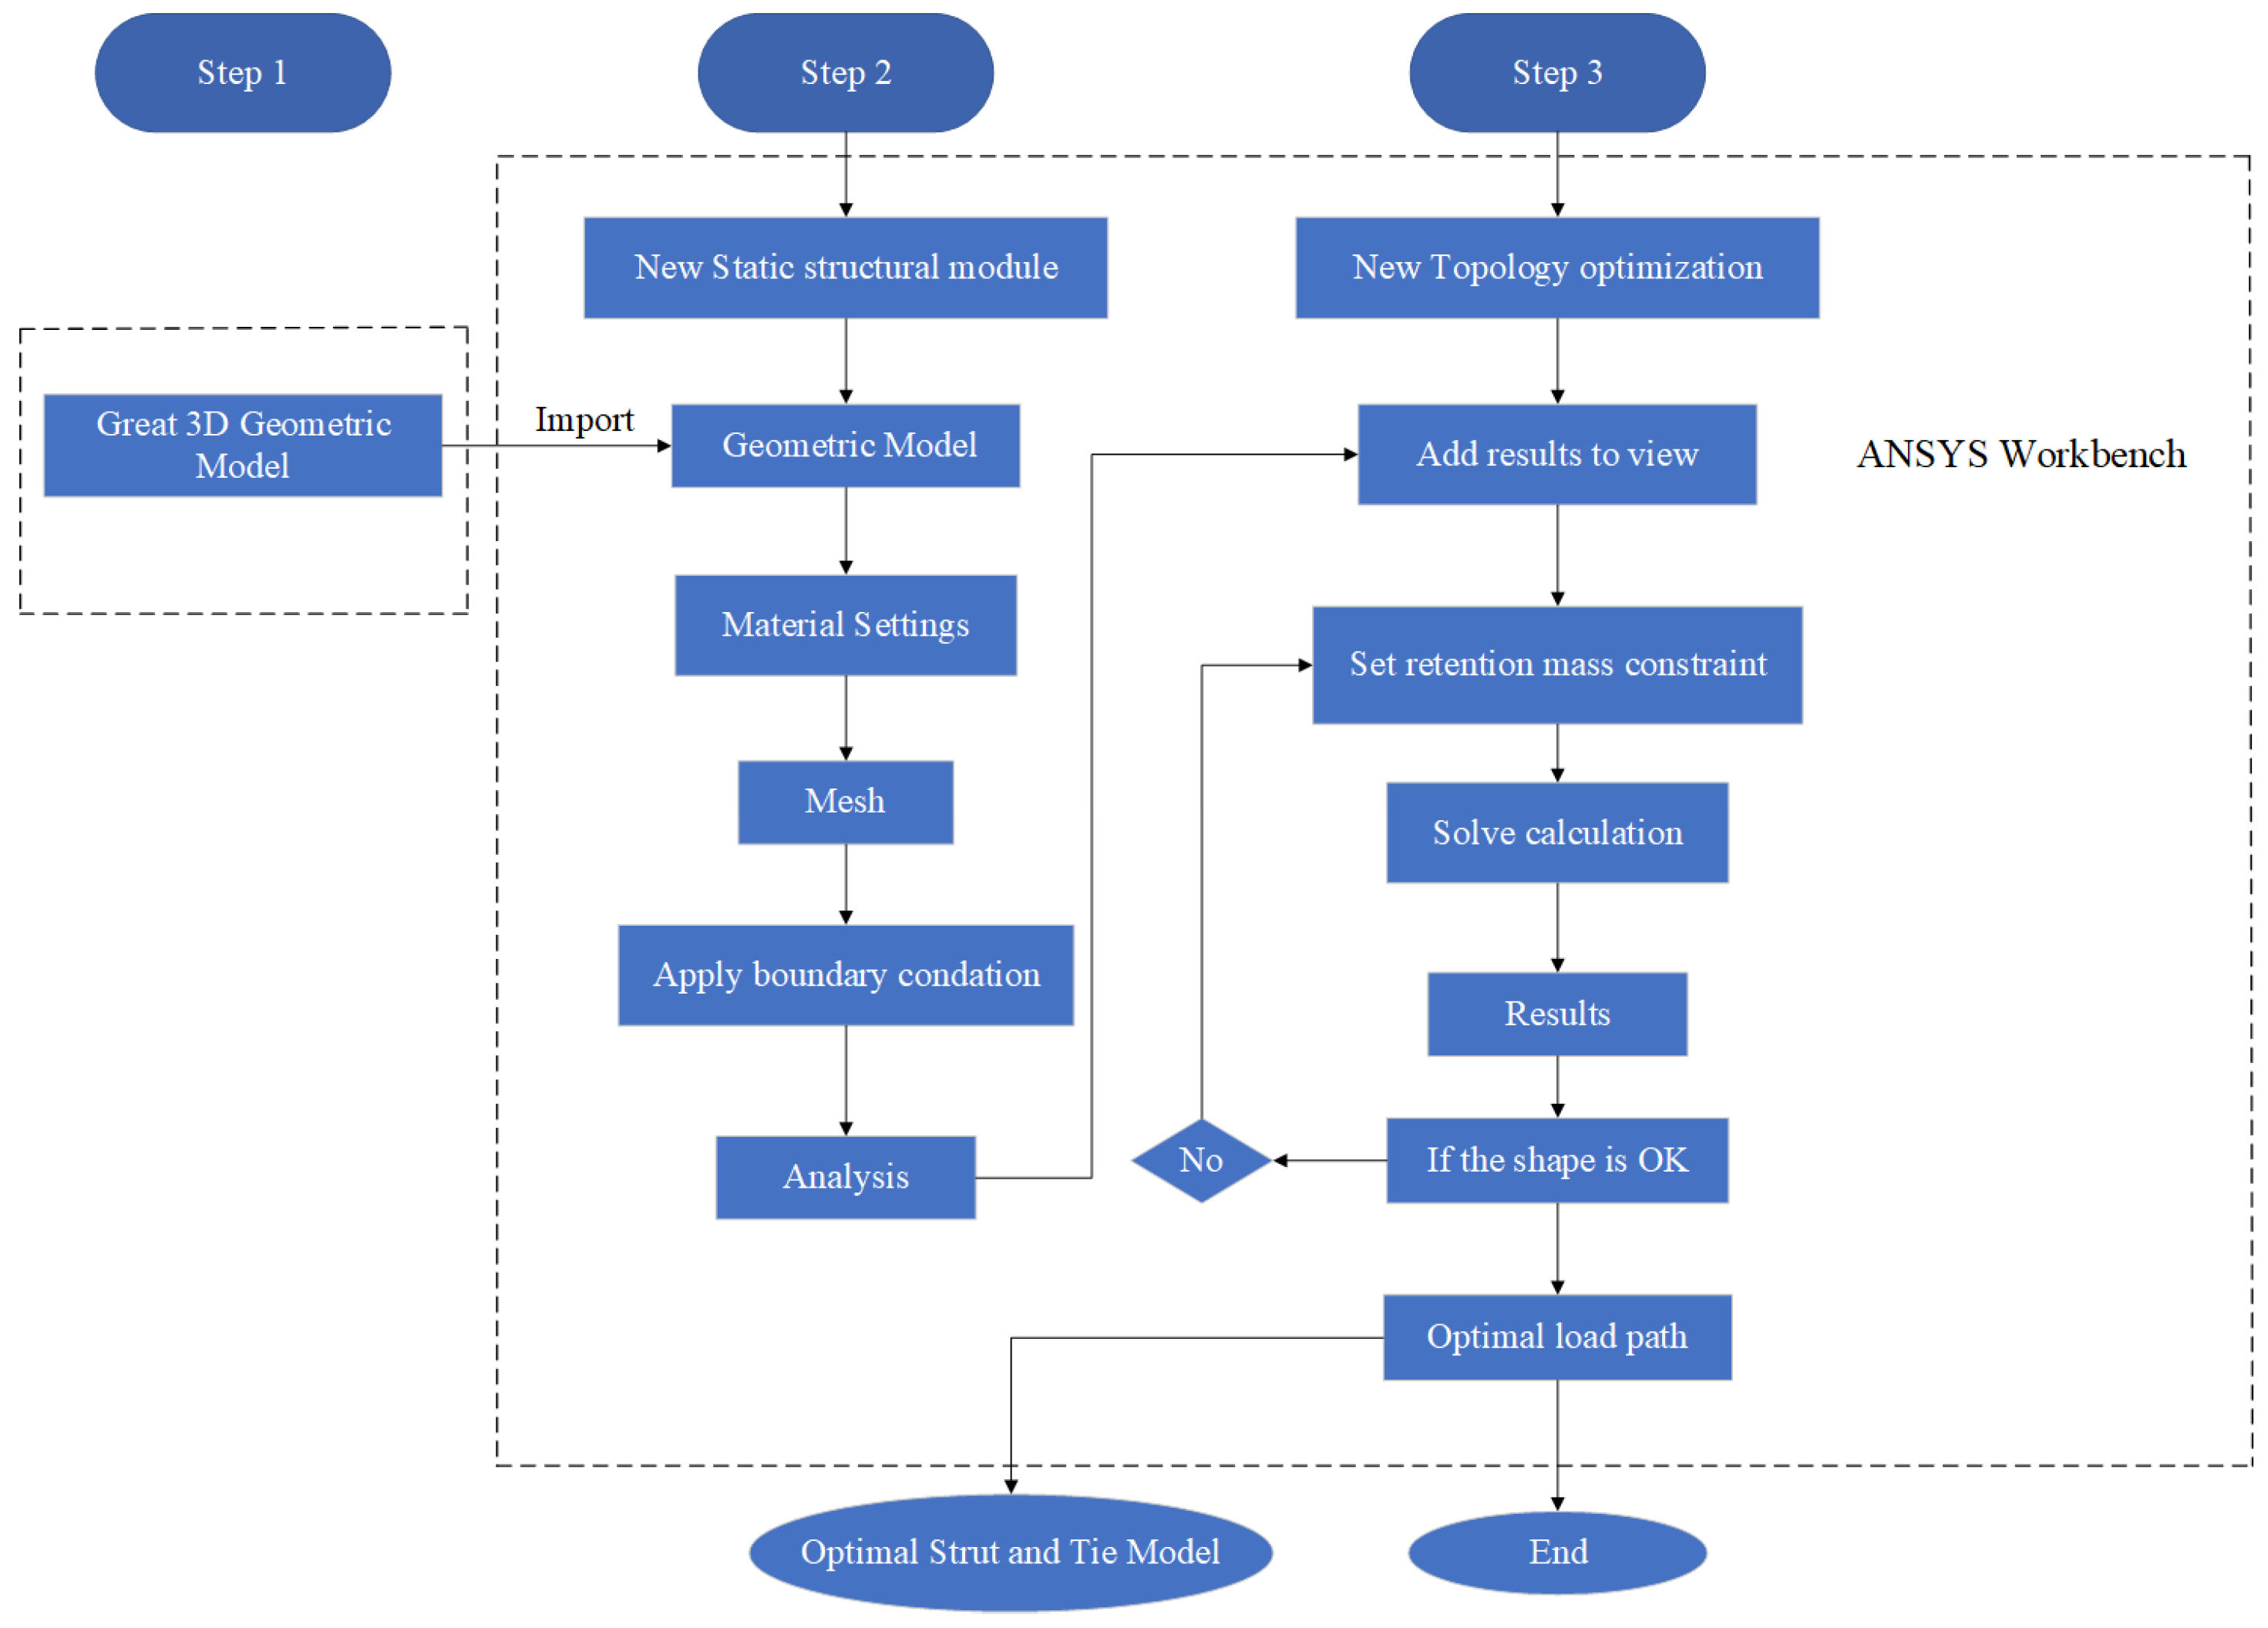
Using ANSYS Workbench, the statics and topology of the filament pipe anchorage zone in extradosed cable-stayed bridges were optimized by refining the load path. A workflow diagram outlining the operational principles is presented in Figure 5.
The model was transferred from the AutoCAD (2019) software in Step 1 to the ANSYS software in Step 2 by utilizing a static structural module to define the materials, boundary conditions, and loads. Subsequently, analysis was conducted. After completing Step 2, the process advances to Step 3, which involves topology optimization, where the retention mass constraint ratio is determined. If the shape is satisfactory, an optimal STM that supports the load path is obtained. If the shape is unsatisfactory, the retention mass constraint is adjusted and the analysis is repeated until an optimal model is achieved.

4. Parameter Selection

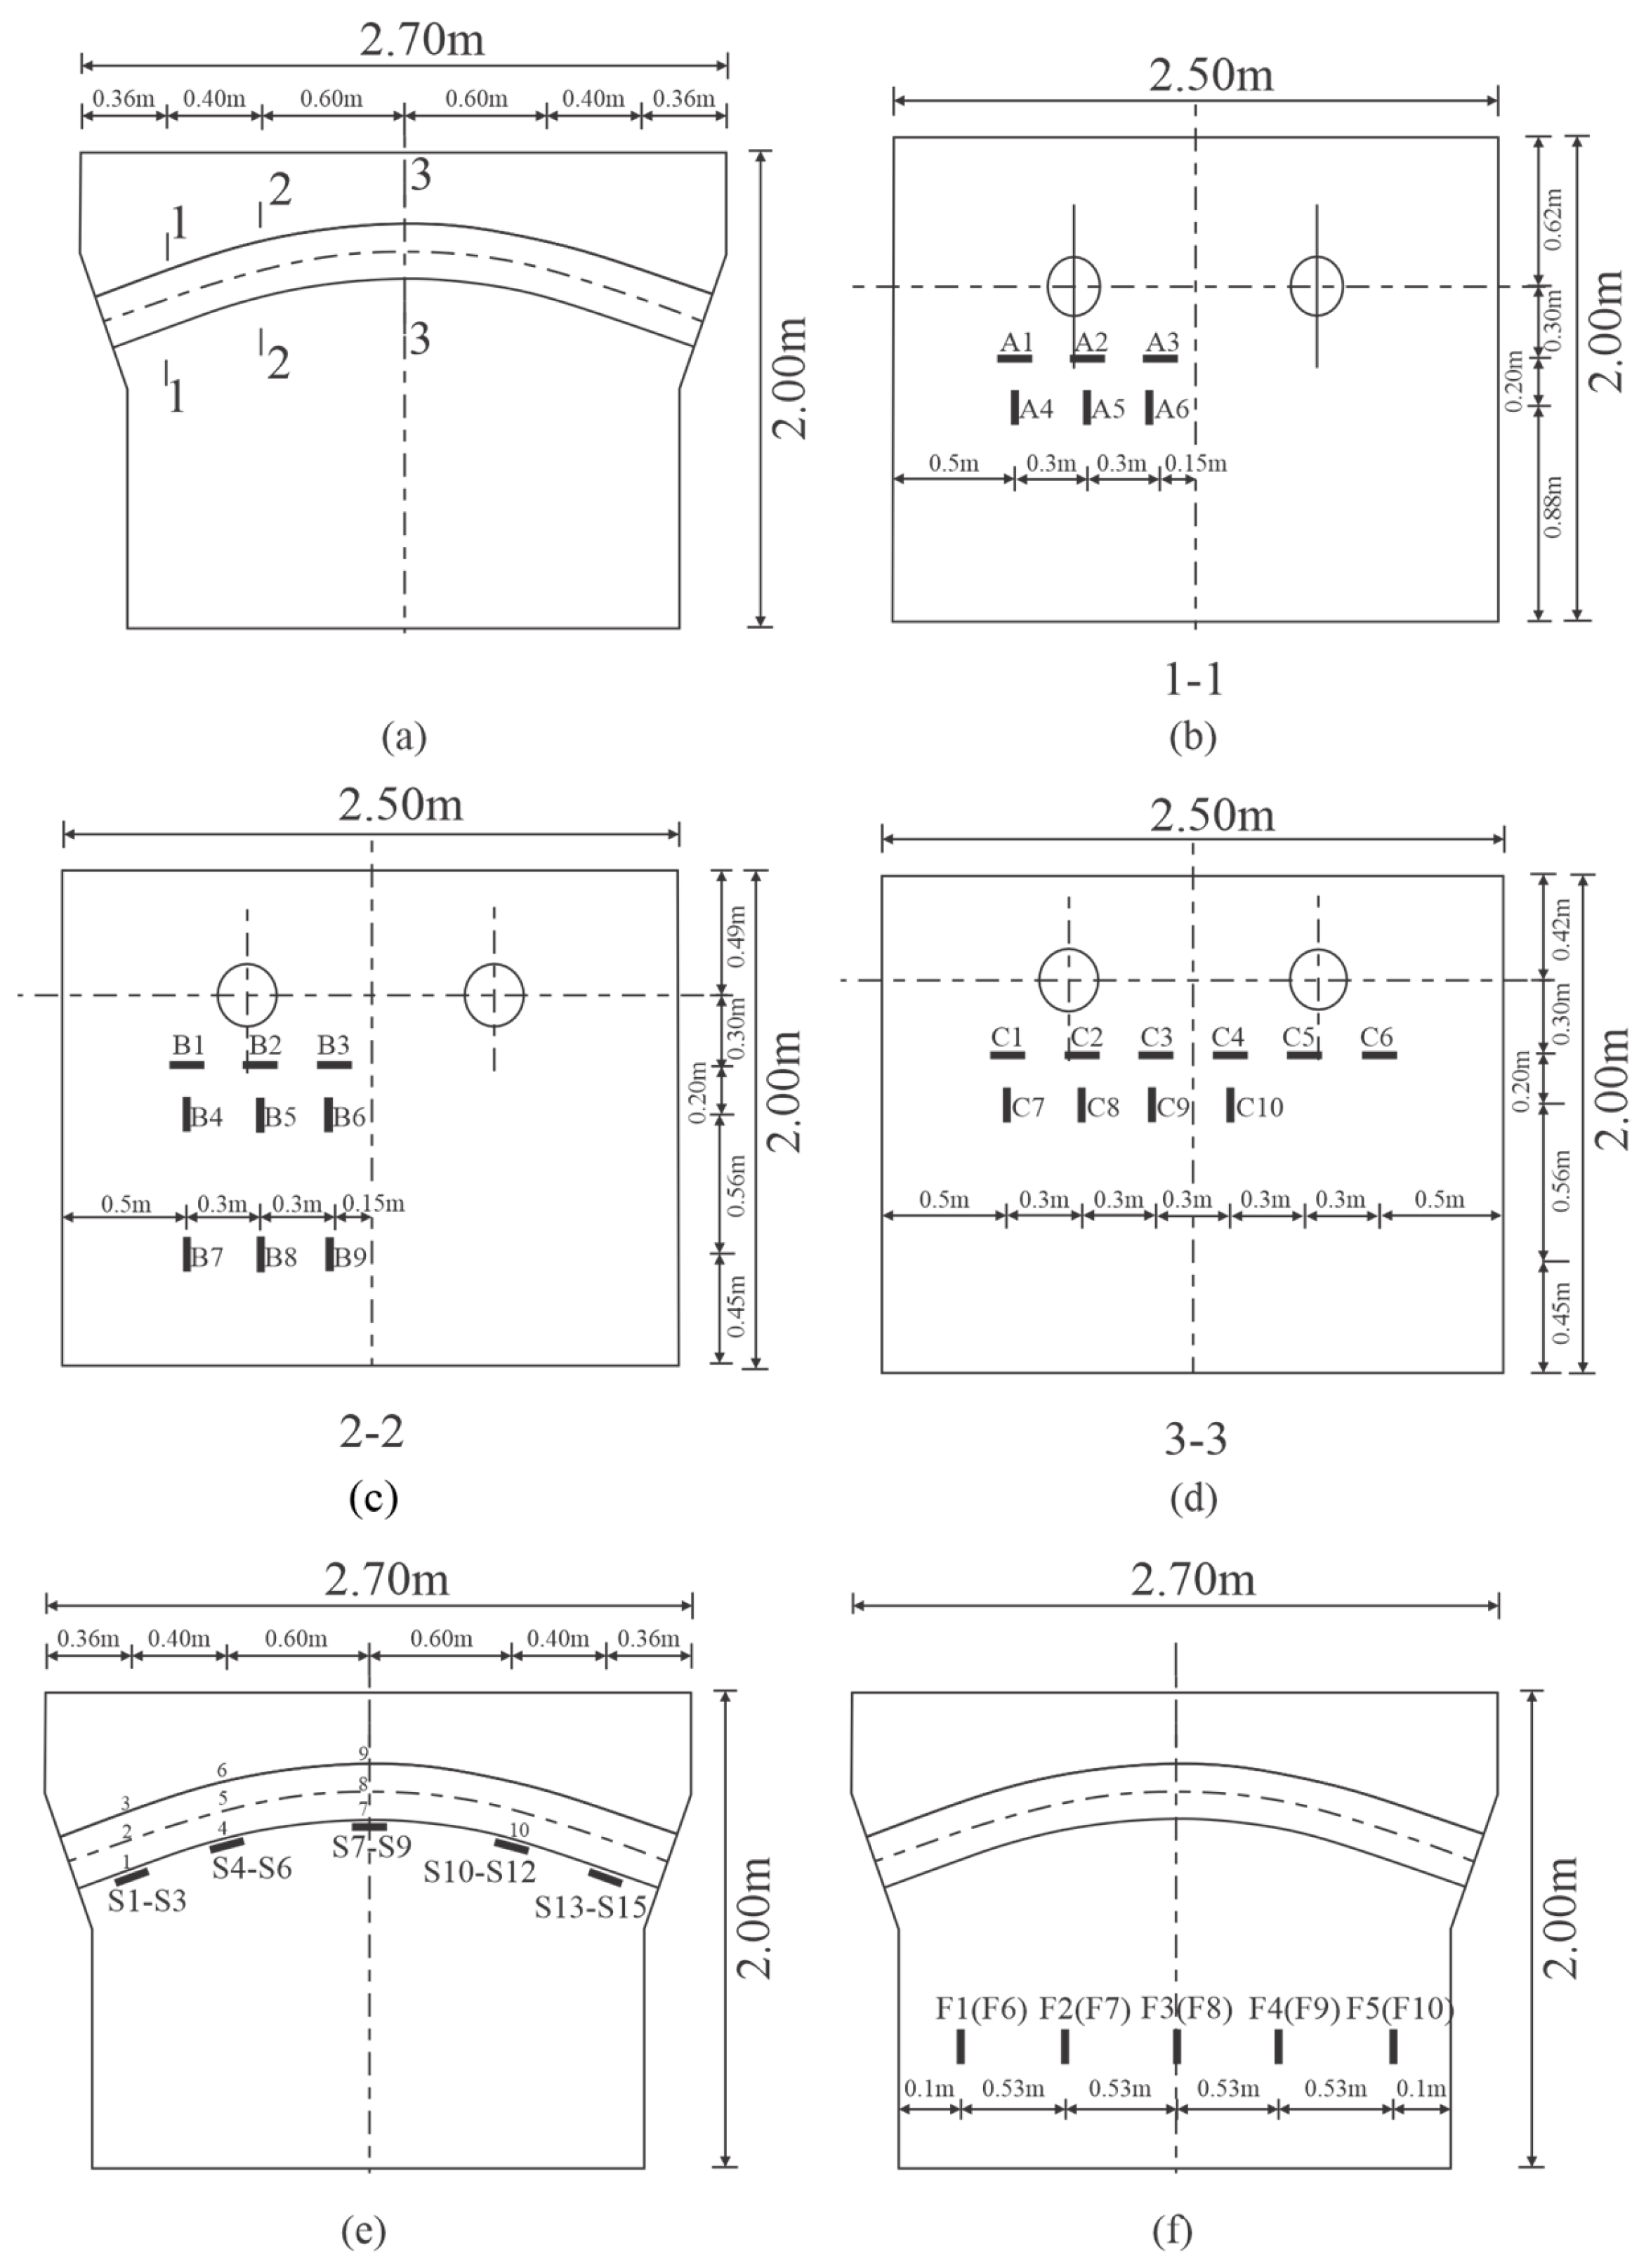
Model 1 was used to investigate the impact of the radius of curvature of the cable saddle (R) on stress variations. In this study, different areas within the concrete beneath the cables were examined. Figure 6 and Table 3 present the parameters studied.

5. Results and Discussion

This study primarily involved static analysis and overall topology optimization. Therefore, the results are presented and discussed in terms of static analysis and optimization. Different areas were selected to determine the stresses in the model, as depicted in Figure 6.

5.1. Von Mises Stress

A static analysis of the model was conducted to derive the stresses in several sections, as shown in Figure 6. This study has several limitations. The number of points considered to obtain the stress depends on their locations. As the point approaches the center of the tower, the number of points to be considered increases.
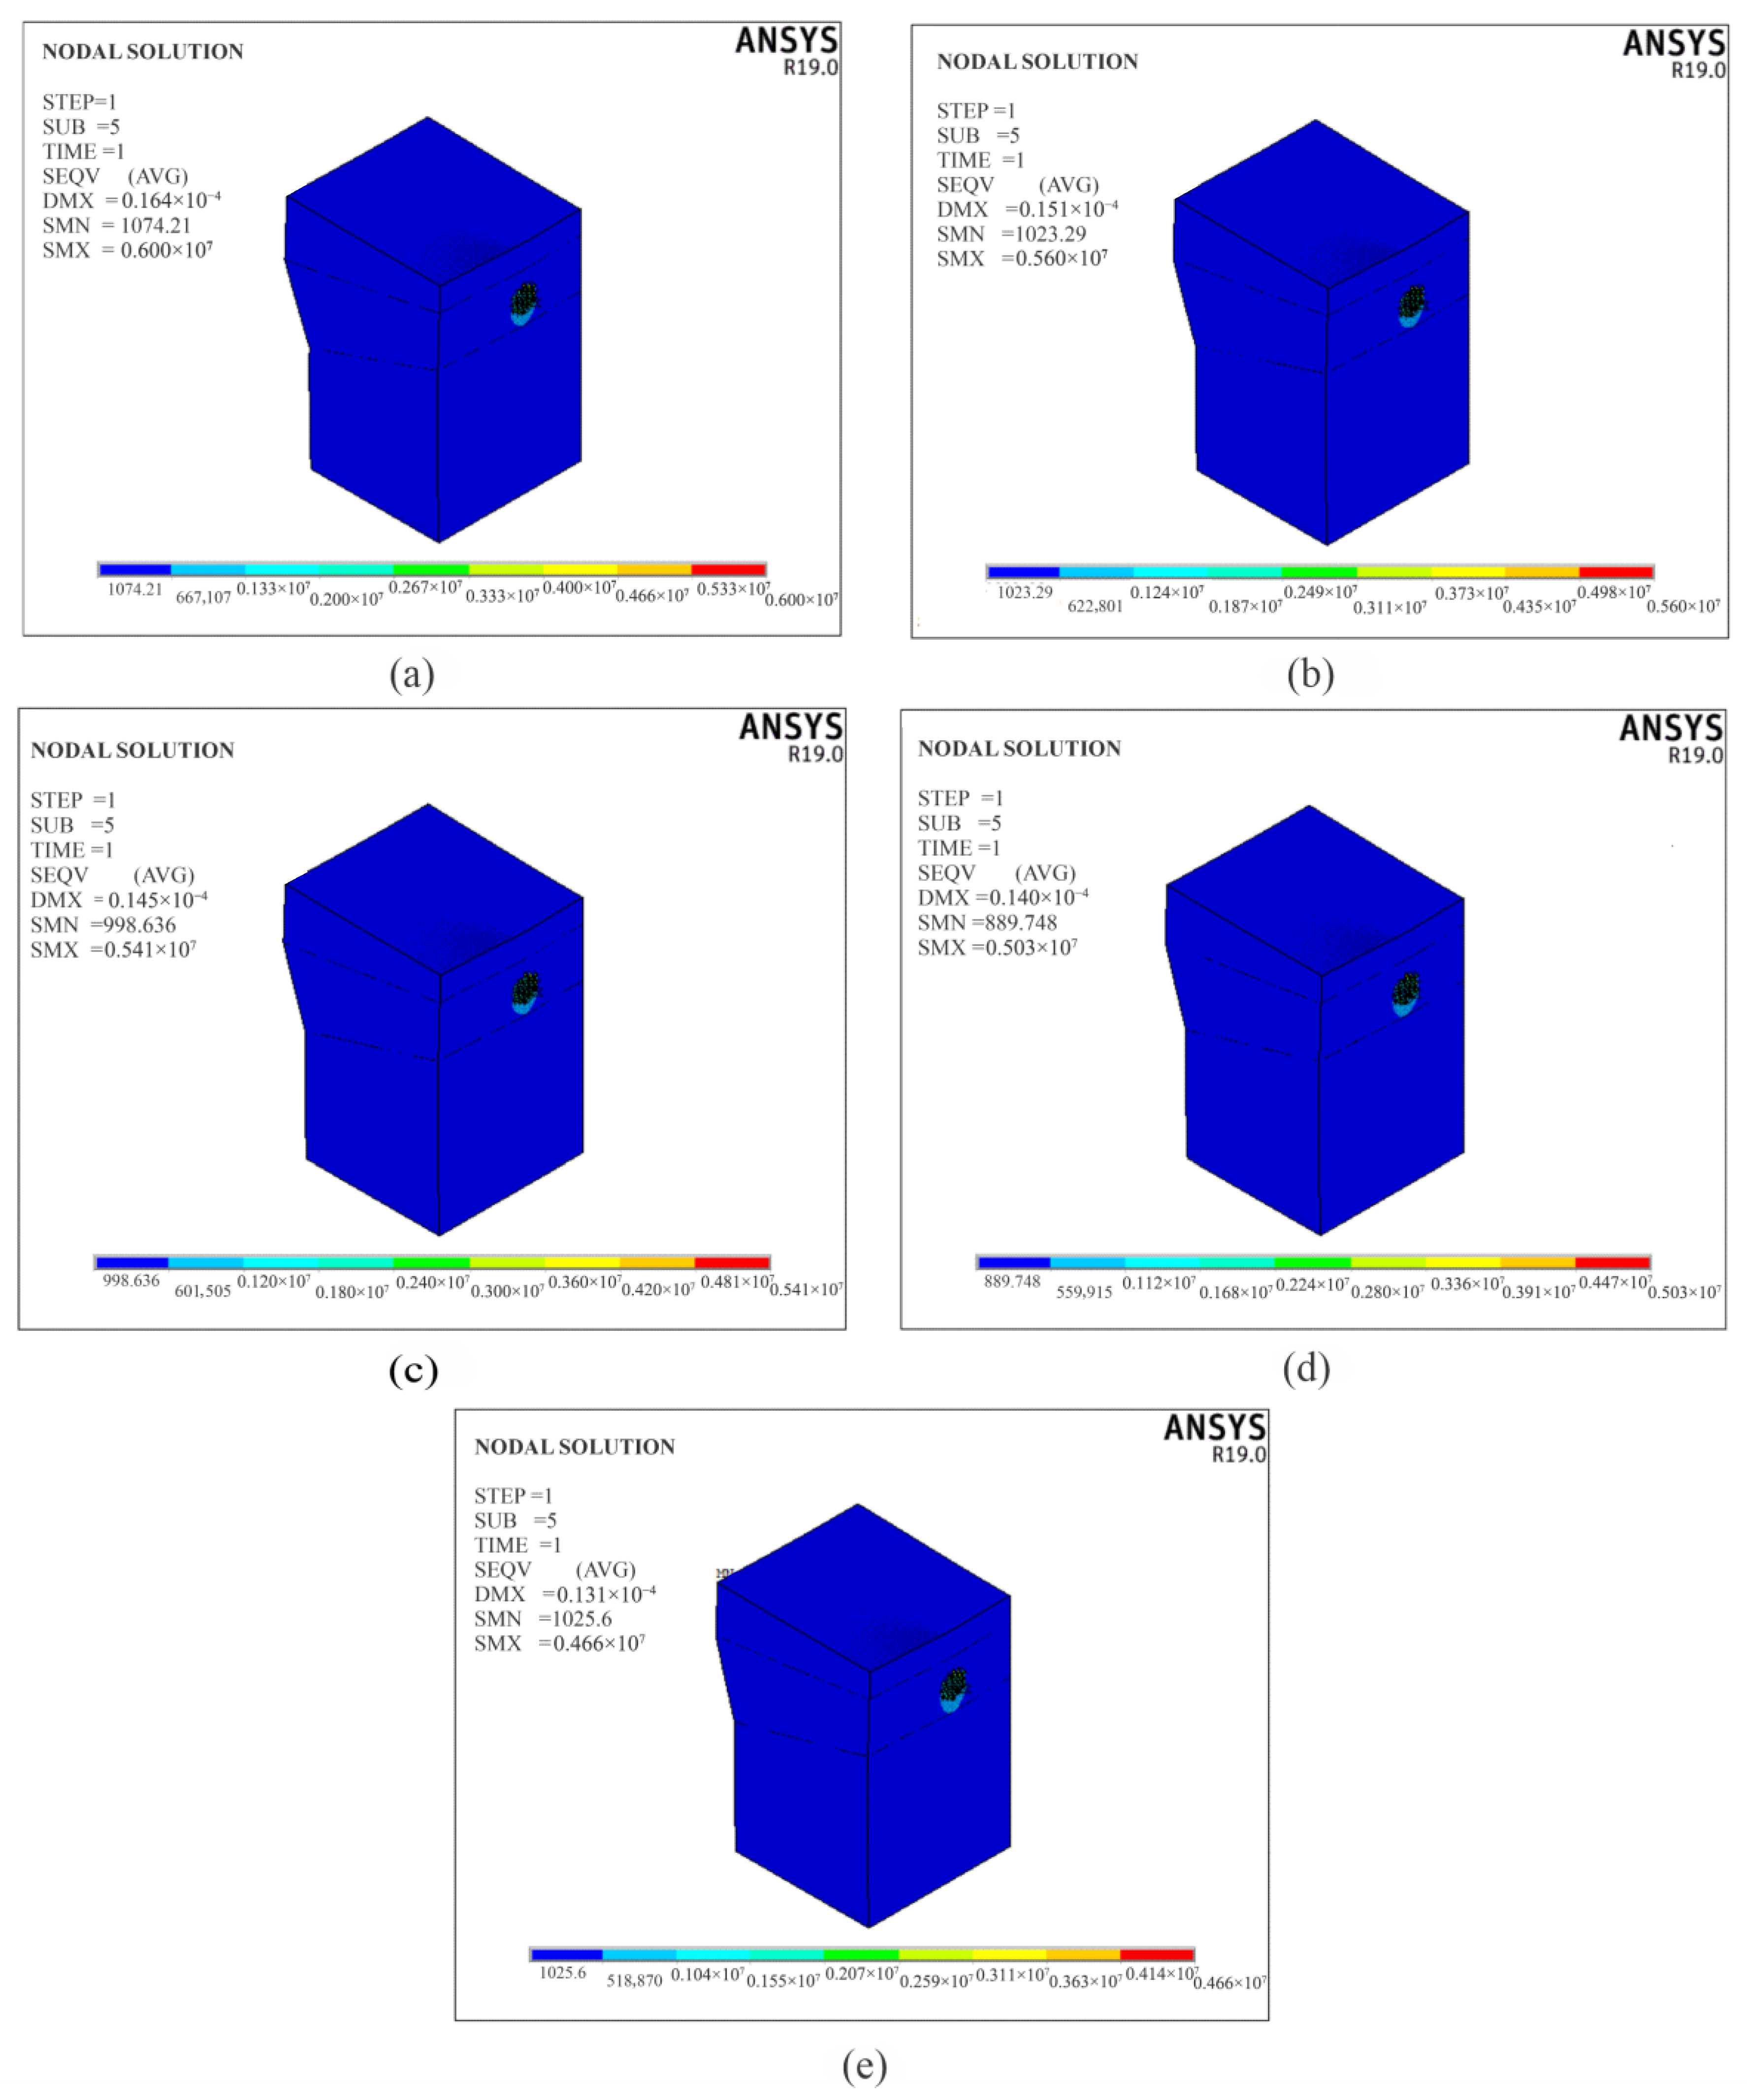
This is because the stress transferred from the cable to the concrete decreases as one moves away from the center of the tower. Therefore, the region around towers is critical, and the number of nodes analyzed is greater. The stresses in these sections were derived for all five models, with variations across the models displayed in each plot as shown in Figure 6. The plots for the five sections and five models are presented. The von Mises stresses at the center of the tower for different models are shown in Figure 7.
The results presented in Figure 8 show that as the cable-saddle curvature radius increased from 2.1 m (Model A) to 2.7 m (Model E), the maximum von Mises stress within the concrete tower decreased markedly, from approximately 6 MPa to 4.66 MPa. This trend indicates that increasing the curvature radius reduces the stress concentration in the anchorage zone. A flatter saddle entry promotes a smoother load transfer path between the cable and the surrounding concrete, thereby lowering the shear–compression interaction near the filament pipe and reducing the risk of cracking initiation in this region. This confirms that curvature radius is a governing geometric parameter in controlling stress demand in the anchorage zone.

5.1.1. Stresses on Sections 1-1, 2-2, and 3-3

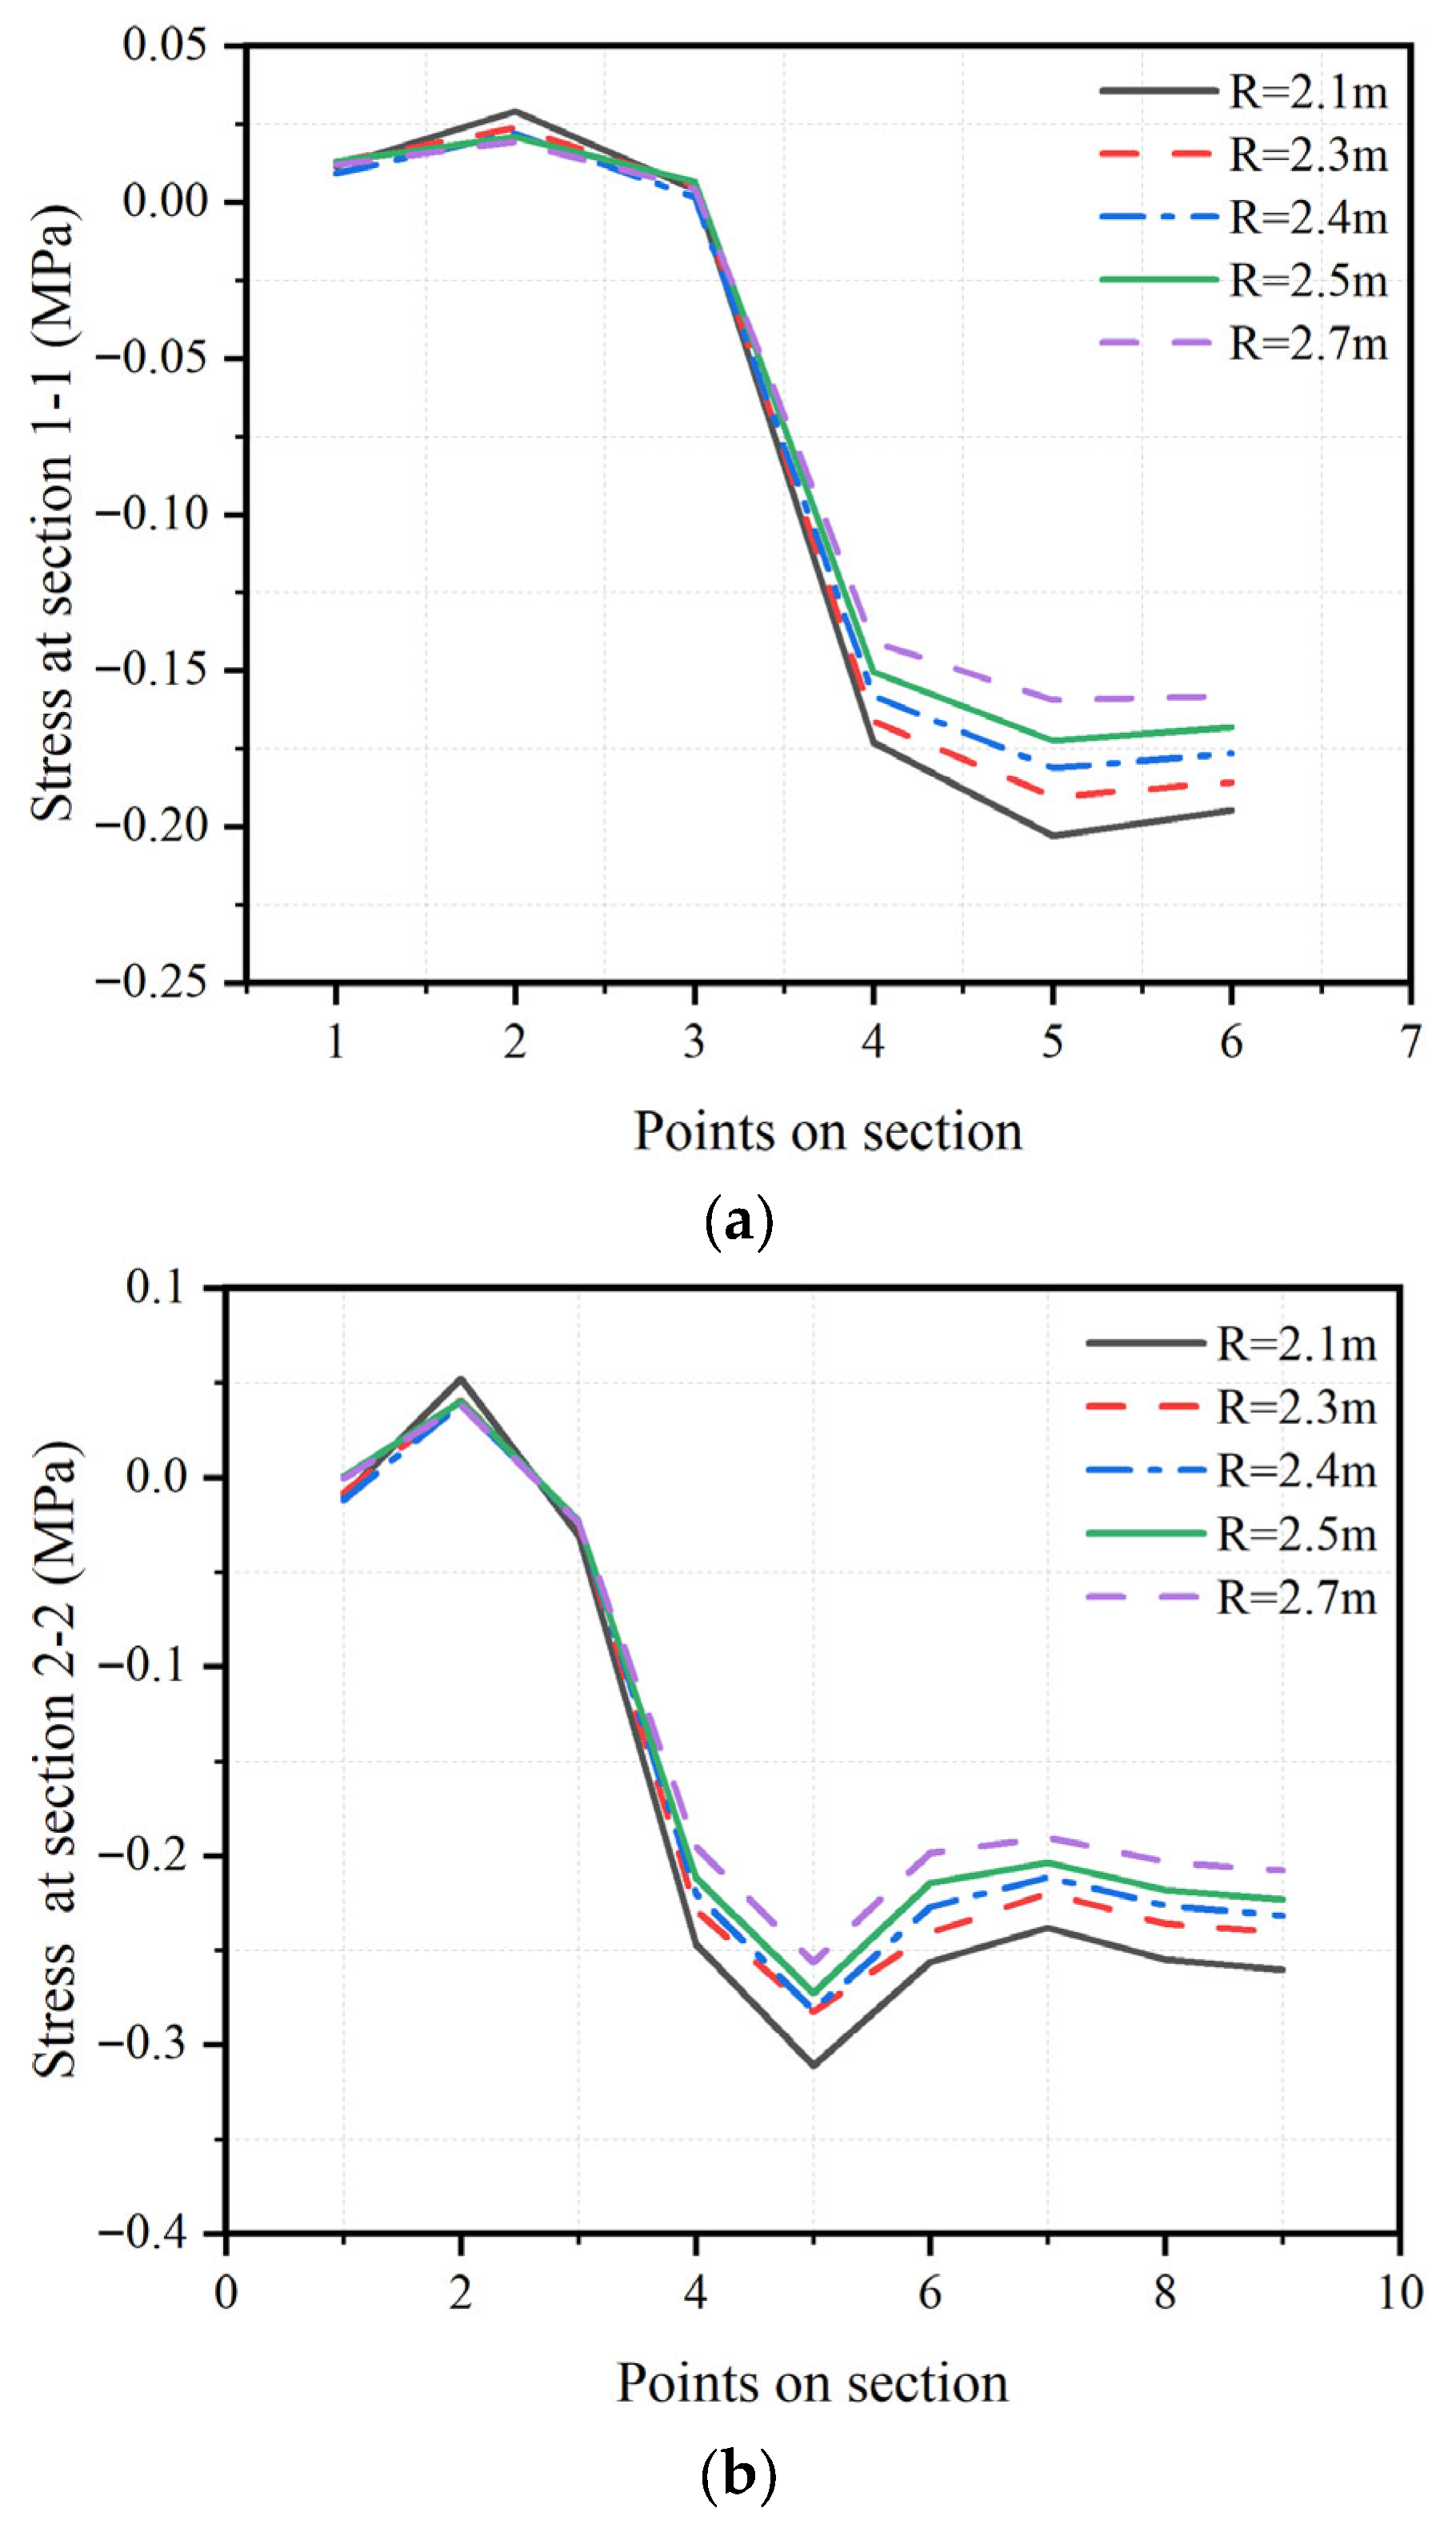
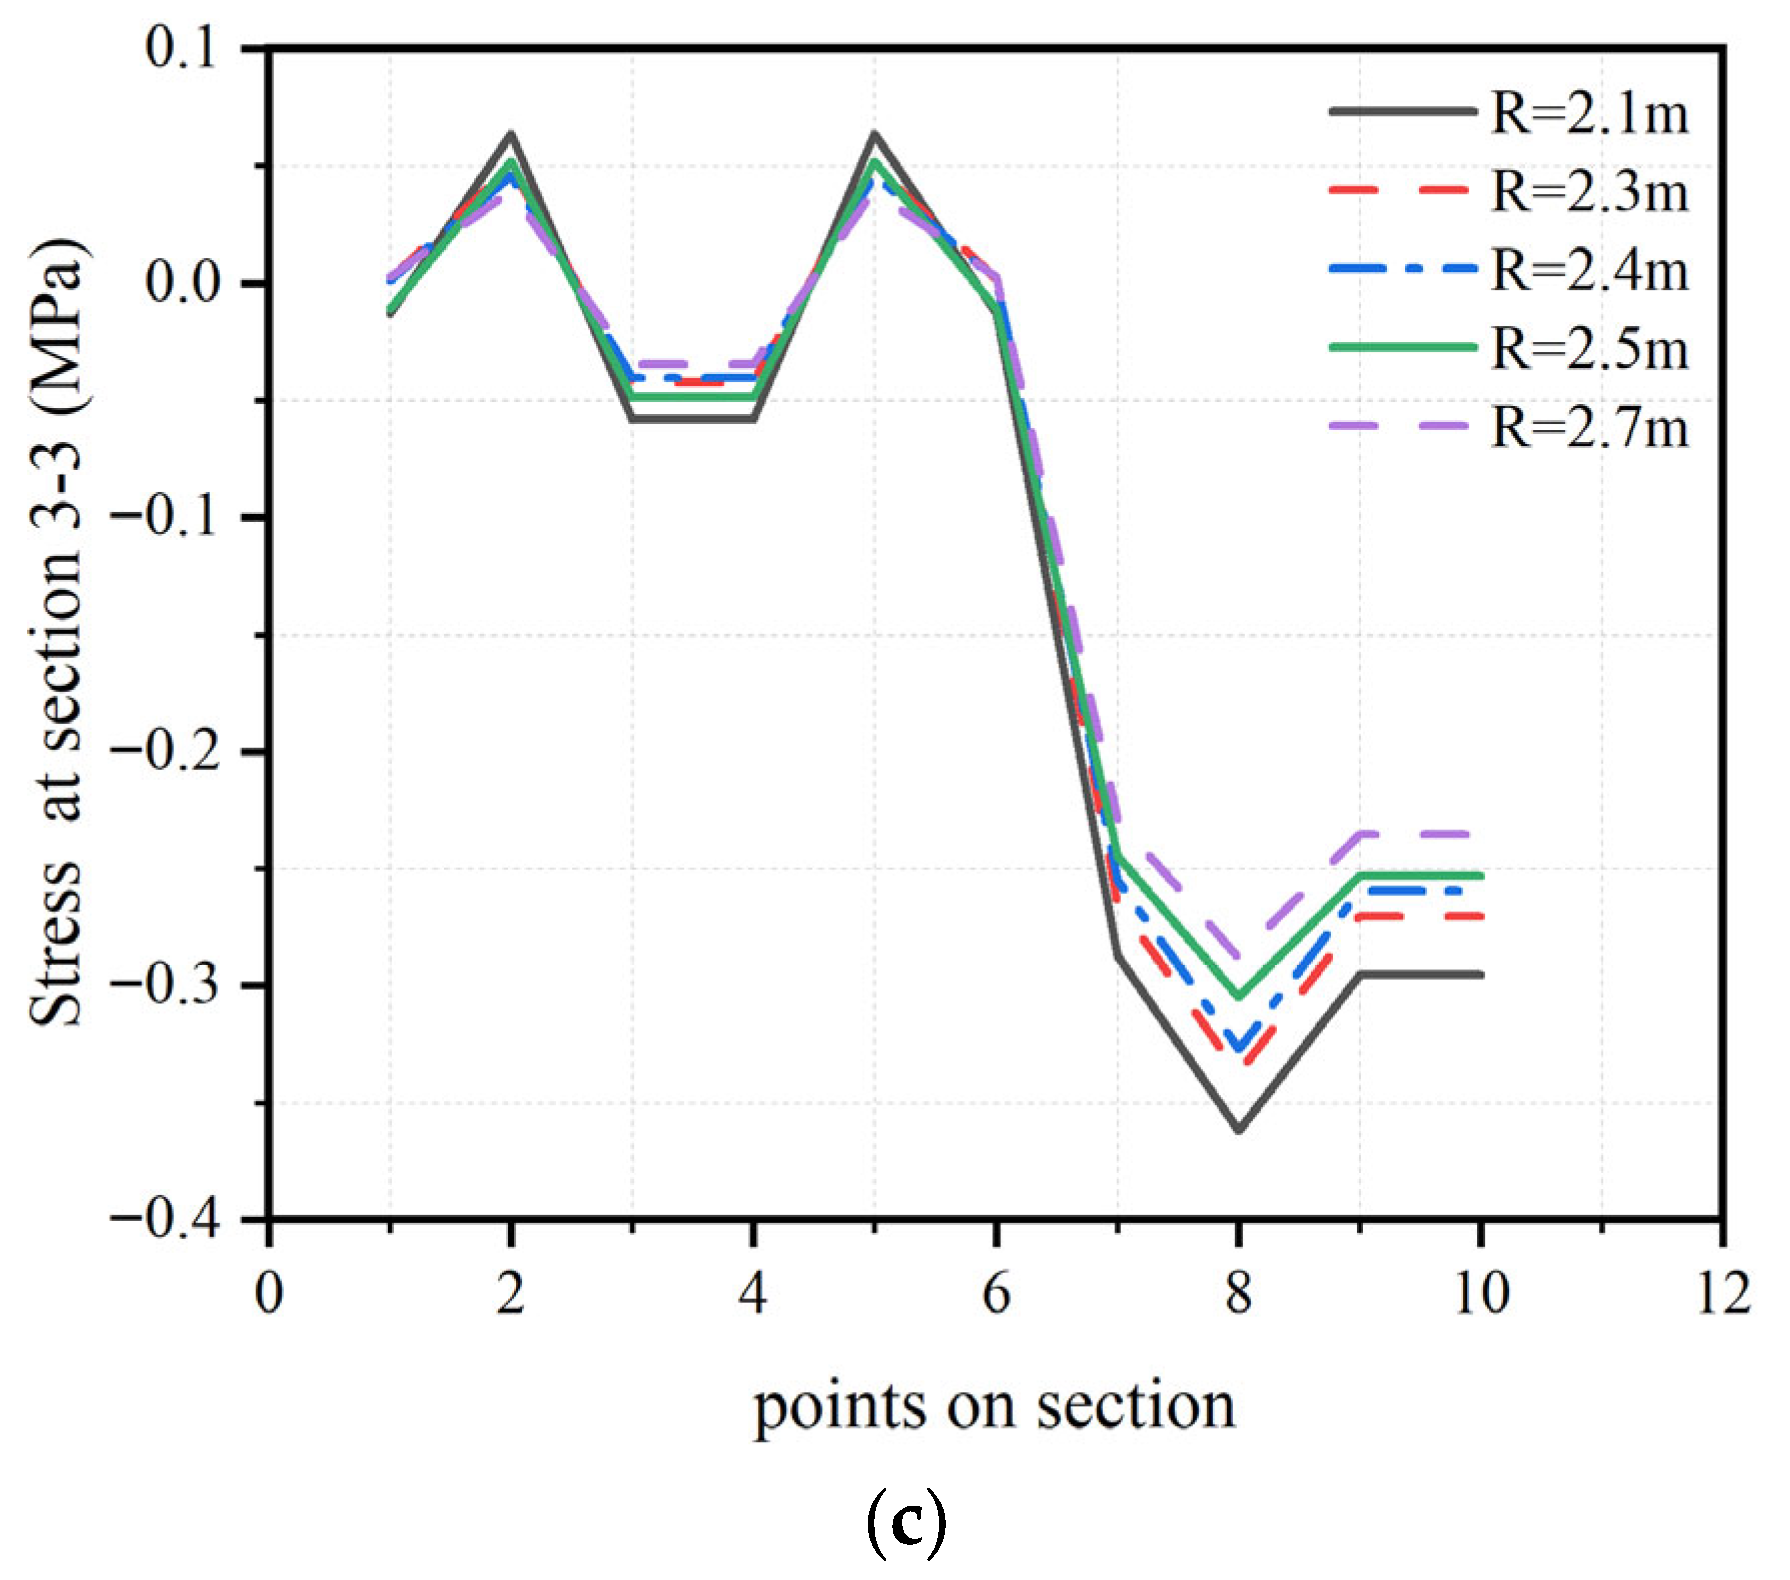
Figure 9 presents the stresses in Sections 1-1, 2-2, and 3-3. The results showed that Section 1-1, situated far from the tower’s center, had minimal stress. Additionally, the stress within this section varied based on the location of the point, with vertical stress being dominant. However, only a small amount of horizontal stress was observed. The first three points correspond to horizontal stress. Thus, a small level of horizontal stress existed. The vertical stress on the concrete increased as the closer the point is to the center of the tower. Similarly, the model with a smaller radius of curvature exhibited higher stress. This result indicates that as the radius increases, the stress on the concrete decreases, and vice versa. Section 1-1 had a high stress at location A5. Section 2-2 (B1–B9) and Section 3-3 (C1–C10) exhibit a similar pattern, with vertical stress dominating and the highest stress at the point closest to the center of the tower. In addition, the stress for a smaller radius of curvature was high across all sections. Section 2-2 had a high stress at location B5, whereas Section 3-3 had a high stress at location C8.

5.1.2. Stresses on Sections S and F

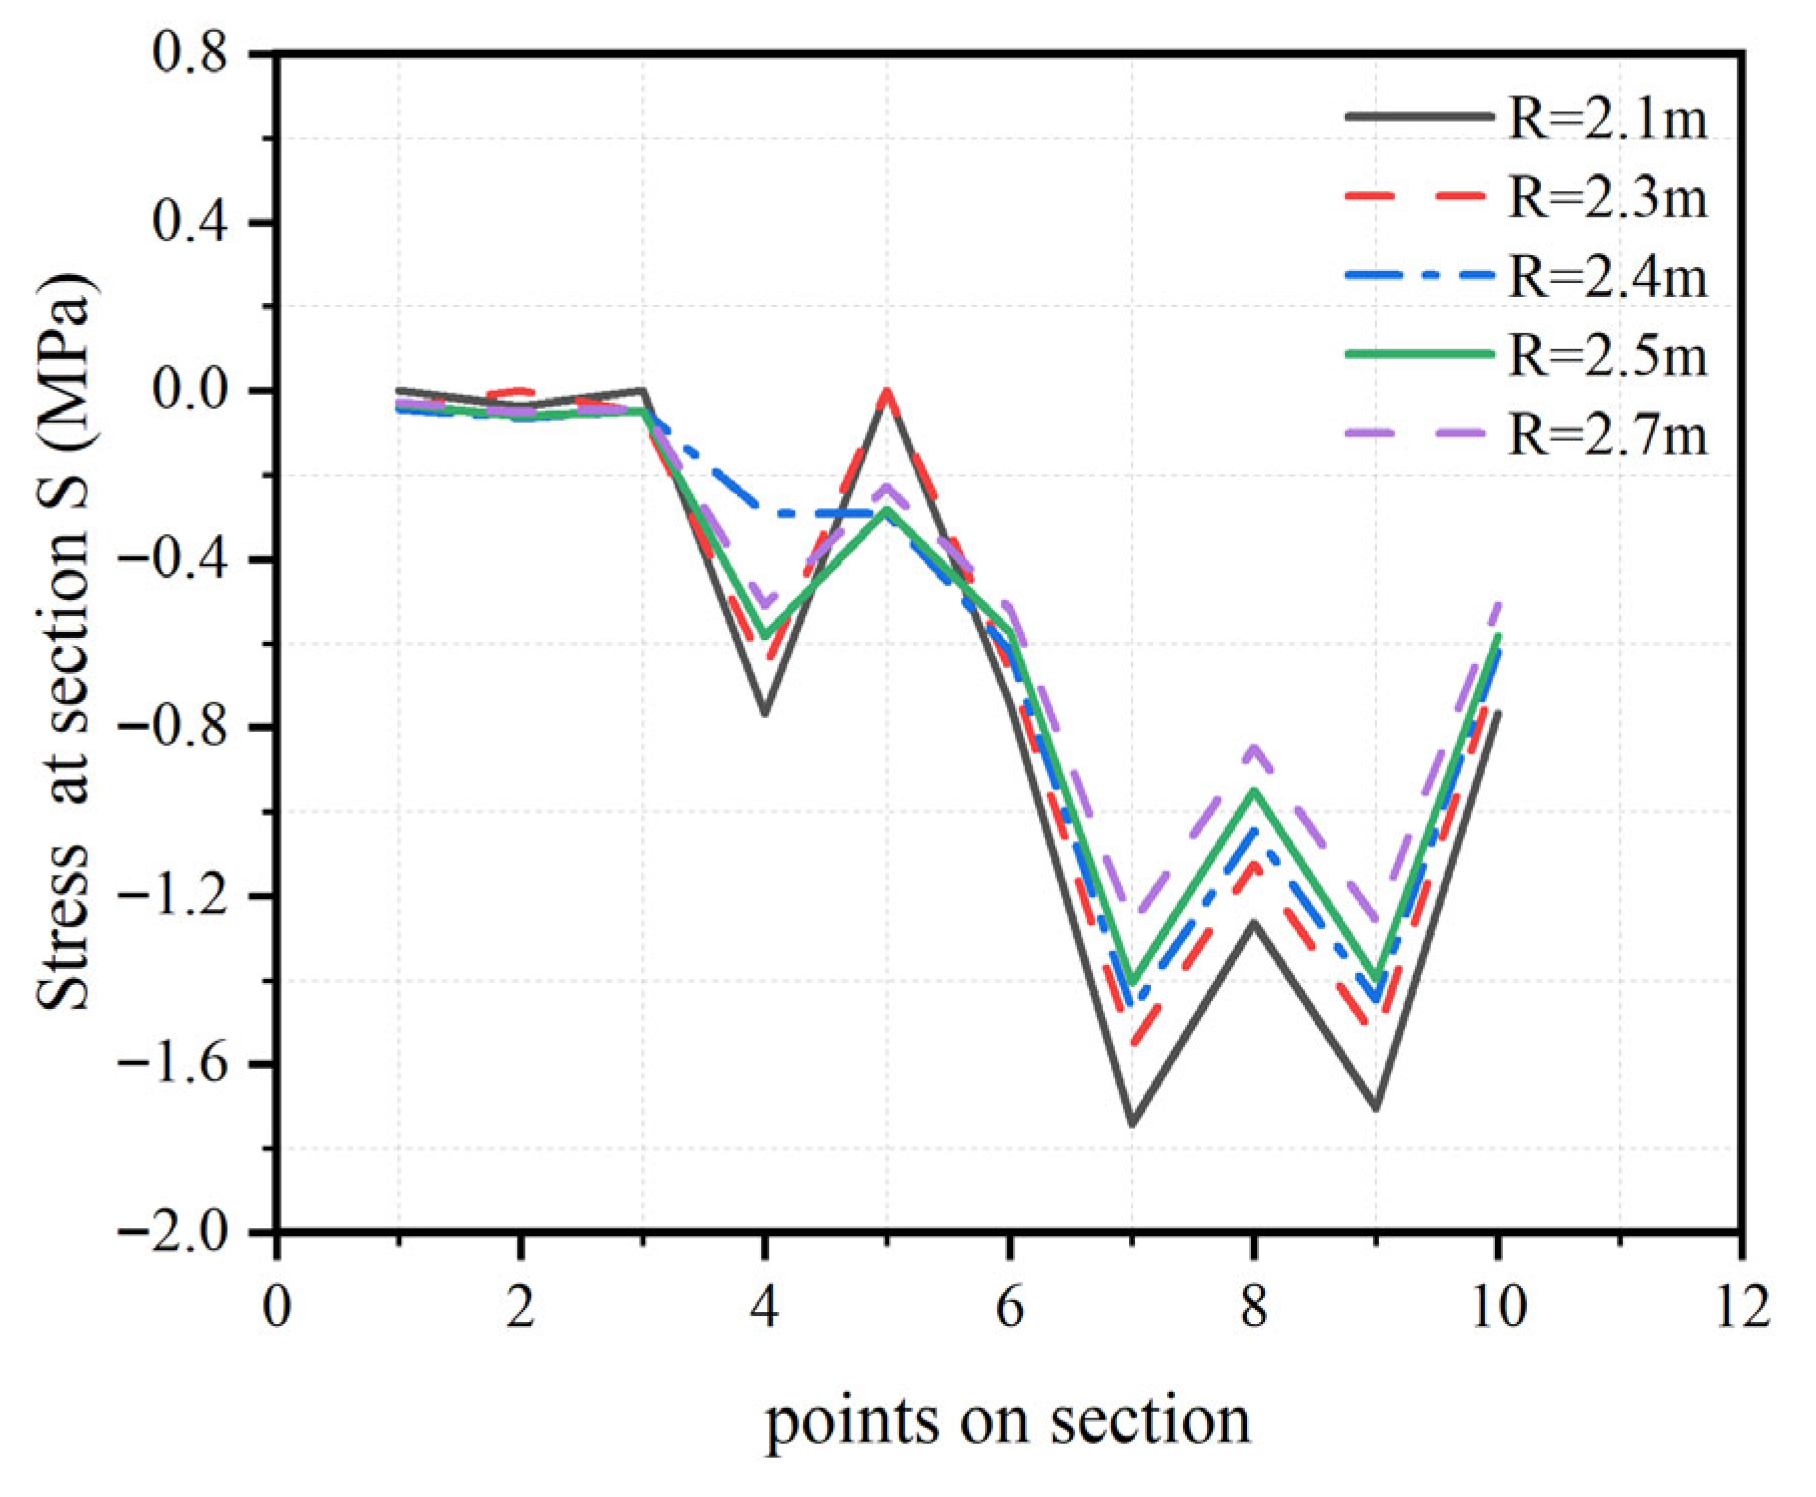
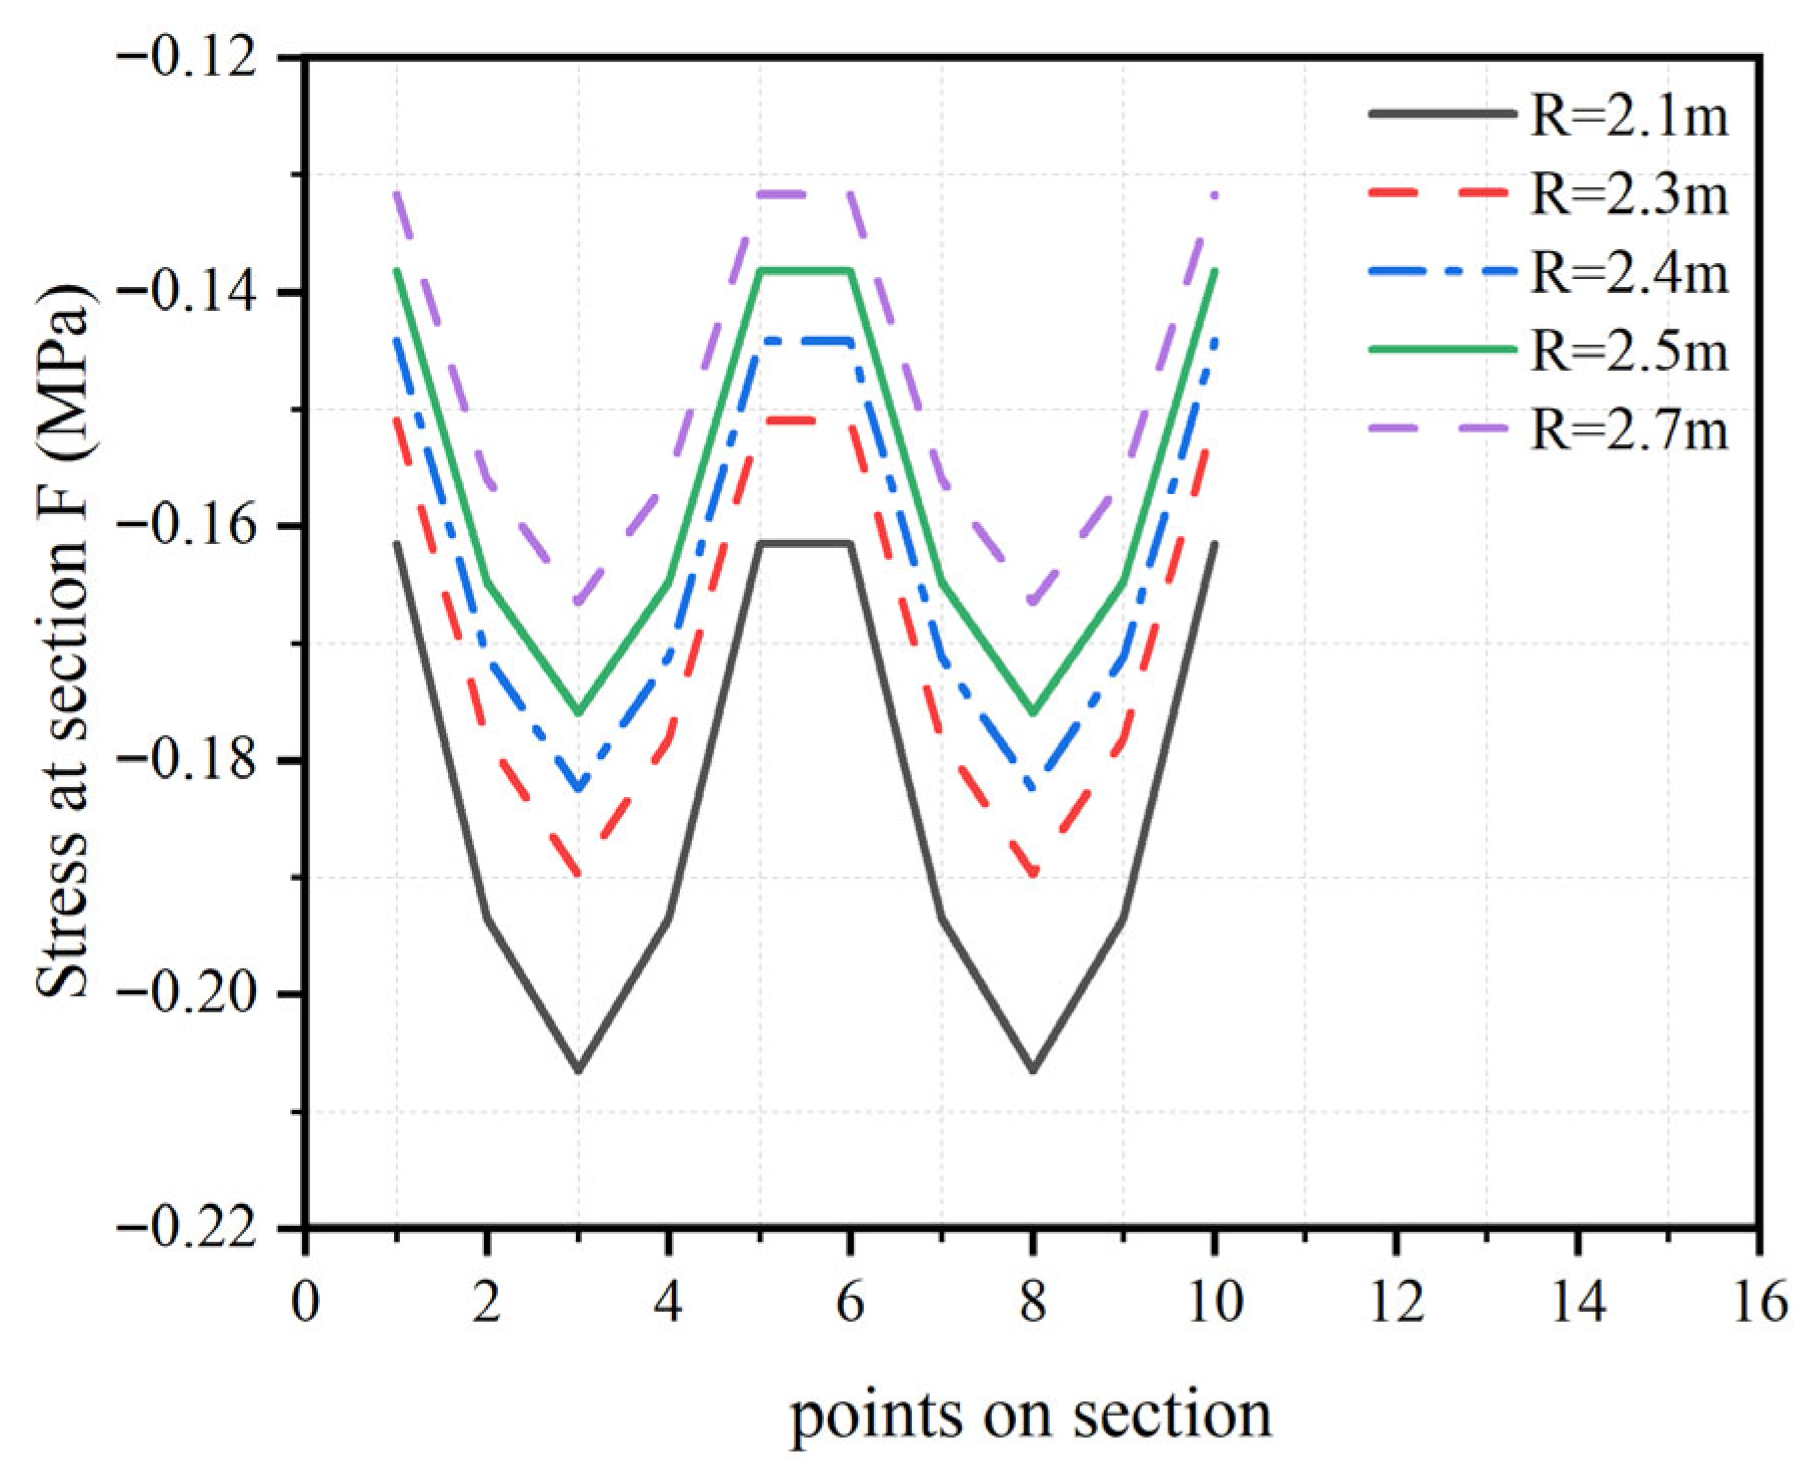
The stresses in Section S are shown in Figure 10. In Section S, stresses from only the horizontal forces were considered. This section is located immediately beneath the cable along its curvature. The stress pattern reveals that it increased from the edge of the tower toward its center. The maximum stress occurred directly beneath the cable along the curvature (Section S) in the center of the tower (S7 and S9). The stresses in Section F are illustrated in Figure 11. In this section, only the stress from the vertical force was considered. It is evident that the stress increases near the center of the tower and then decreases toward the edge. The maximum stress in Section F occurs at positions close to the tower’s center, specifically at points F3 and F8
The observed decrease in internal tensions with increasing cable-saddle curvature radius results from the redistribution of geometry-induced bending stresses along the filament pipe path. When the saddle has a smaller radius of curvature, the cable deviates sharply, producing larger transverse components of tensile force that induce both compressive and tensile stresses in the surrounding concrete near the anchorage zone. Conversely, a larger curvature radius causes a gentler cable deflection and a smoother load from the filament pipe into the concrete, thereby reducing local stress concentrations. This behavior is consistent with the theoretical principles of curved tendon mechanics and agrees with previous numerical and experimental findings on cable–saddle interactions in bridge towers [25,26,27,28], which also report a reduction in stress concentration as the curvature radius increases.
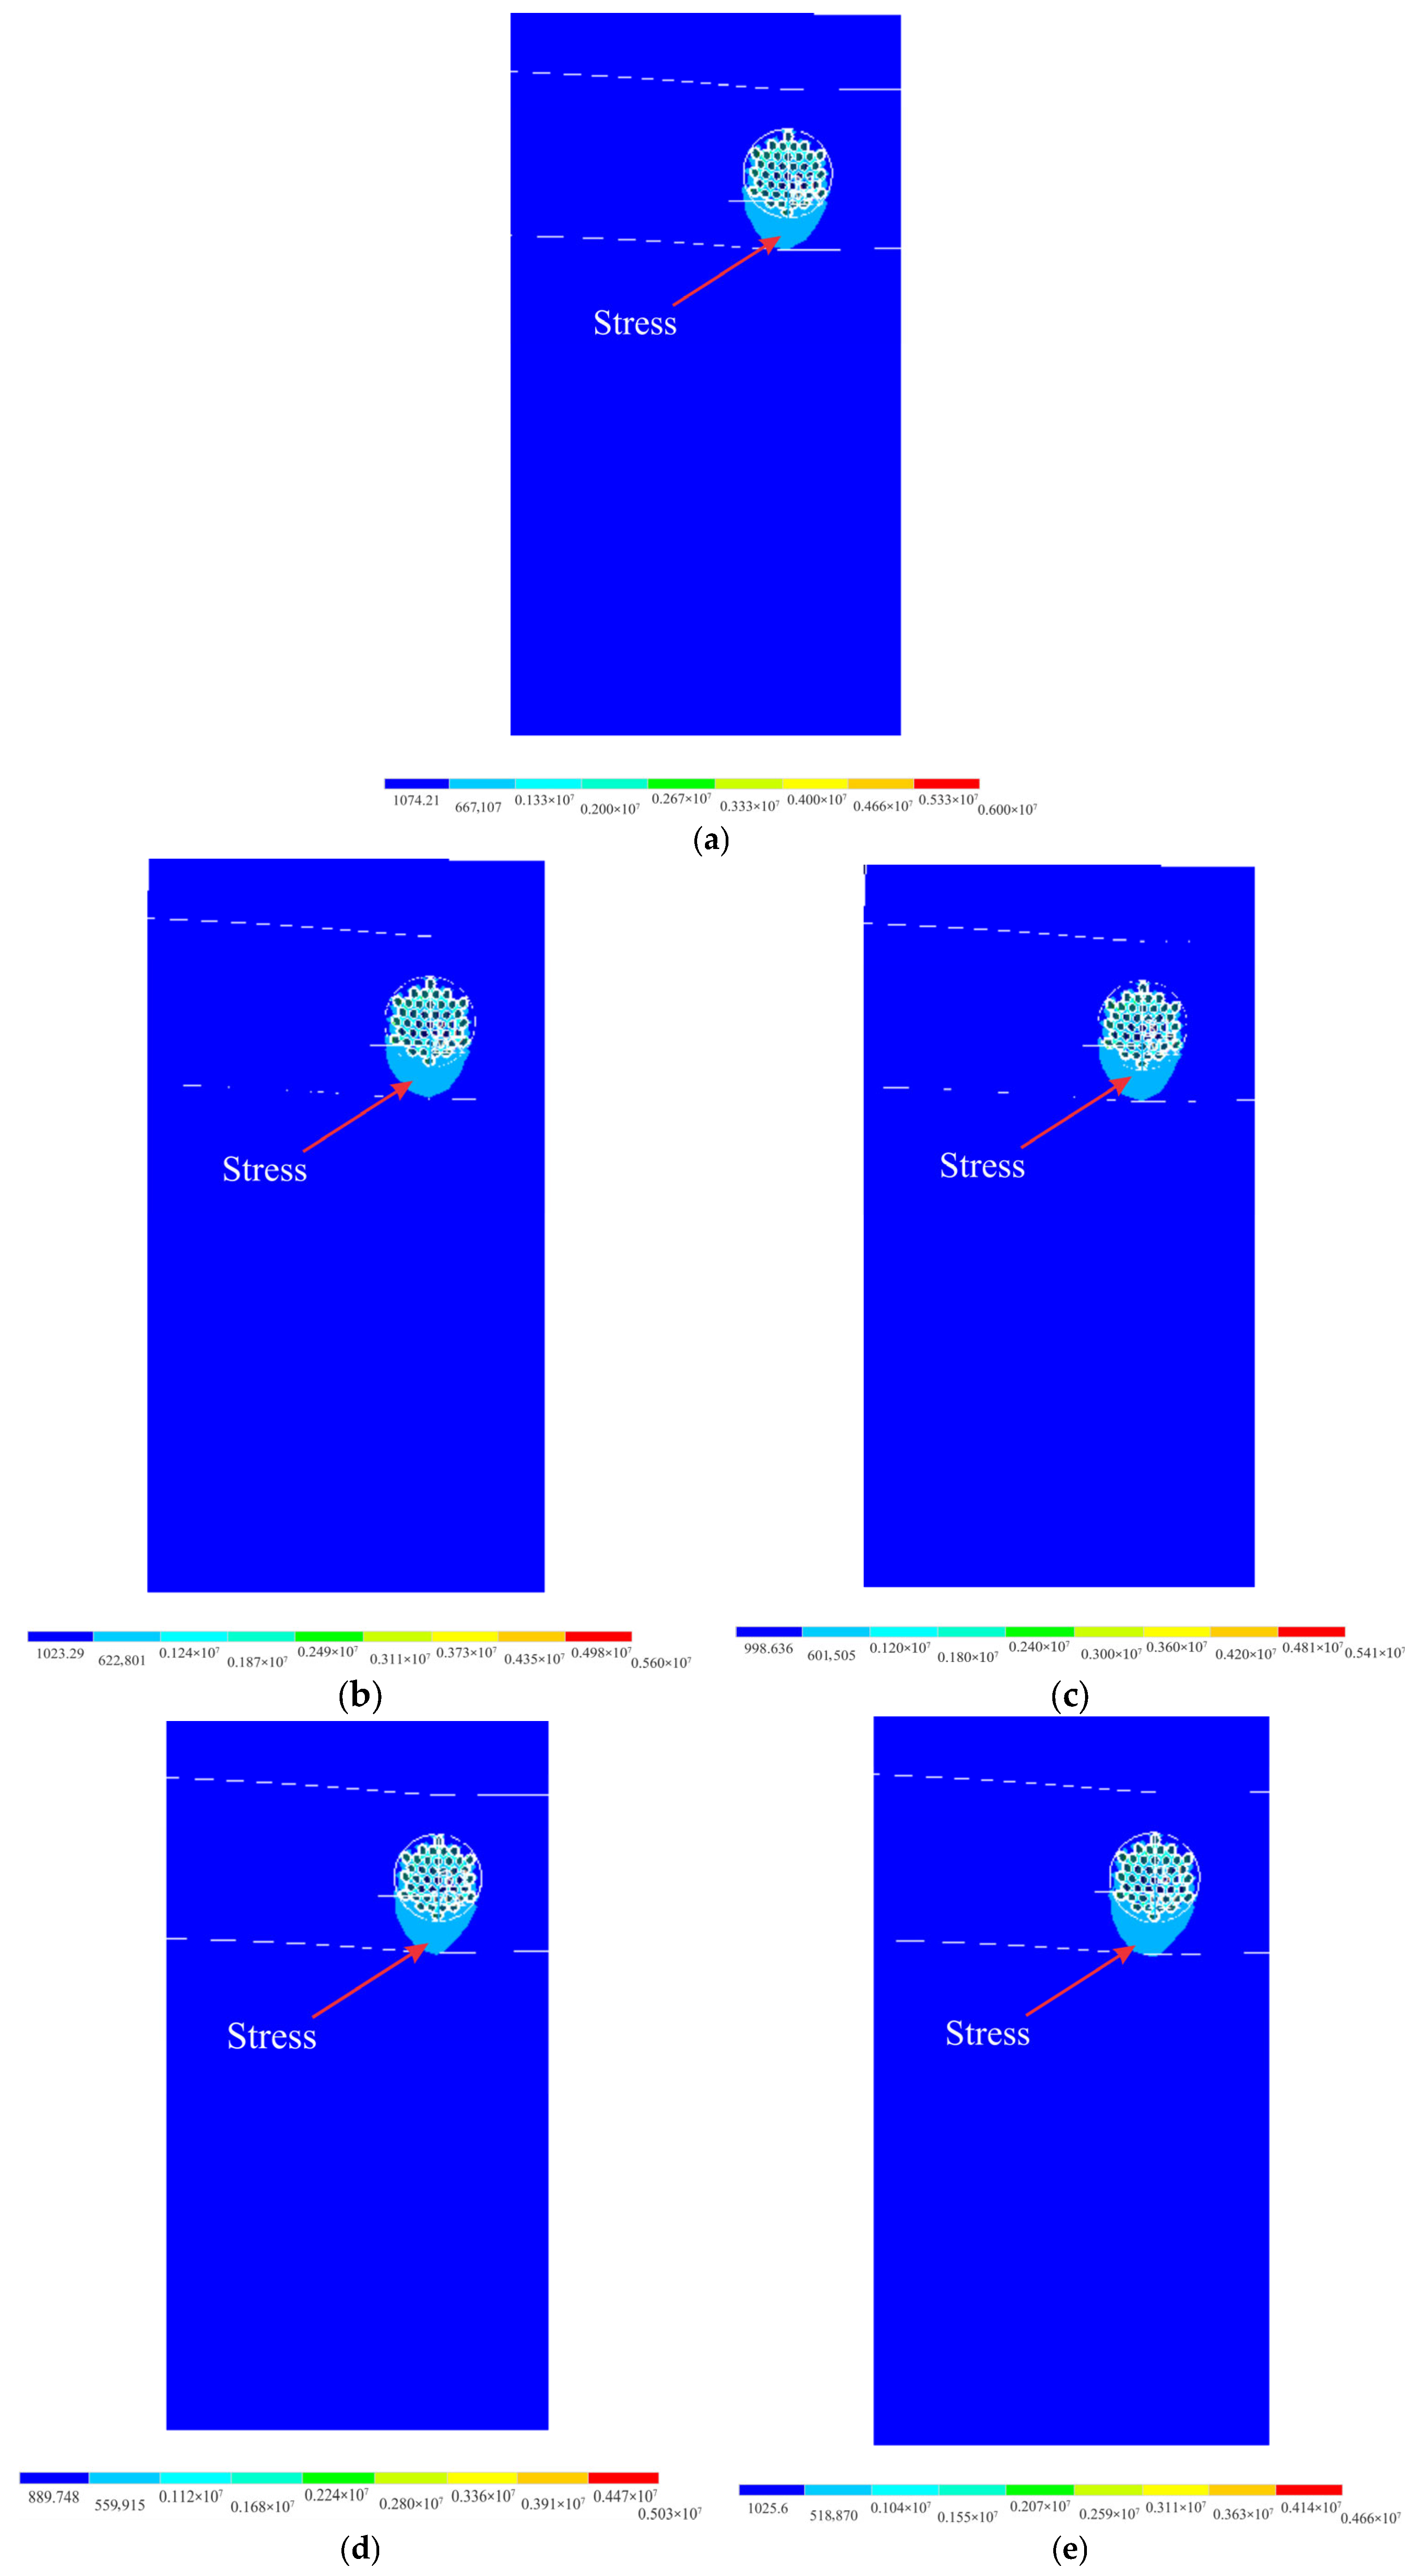
As shown in the side-section views in Figure 8, the von Mises stress concentration zone appears as a focused vertical stress band beneath the filament pipe area. When comparing Models A–E, this band becomes less intense and slightly more spread out as the curvature radius increases. The figure directly shows visually that a larger curvature radius reduces the stress and distributes the force over a larger area of the tower section.

5.2. Topology Optimization

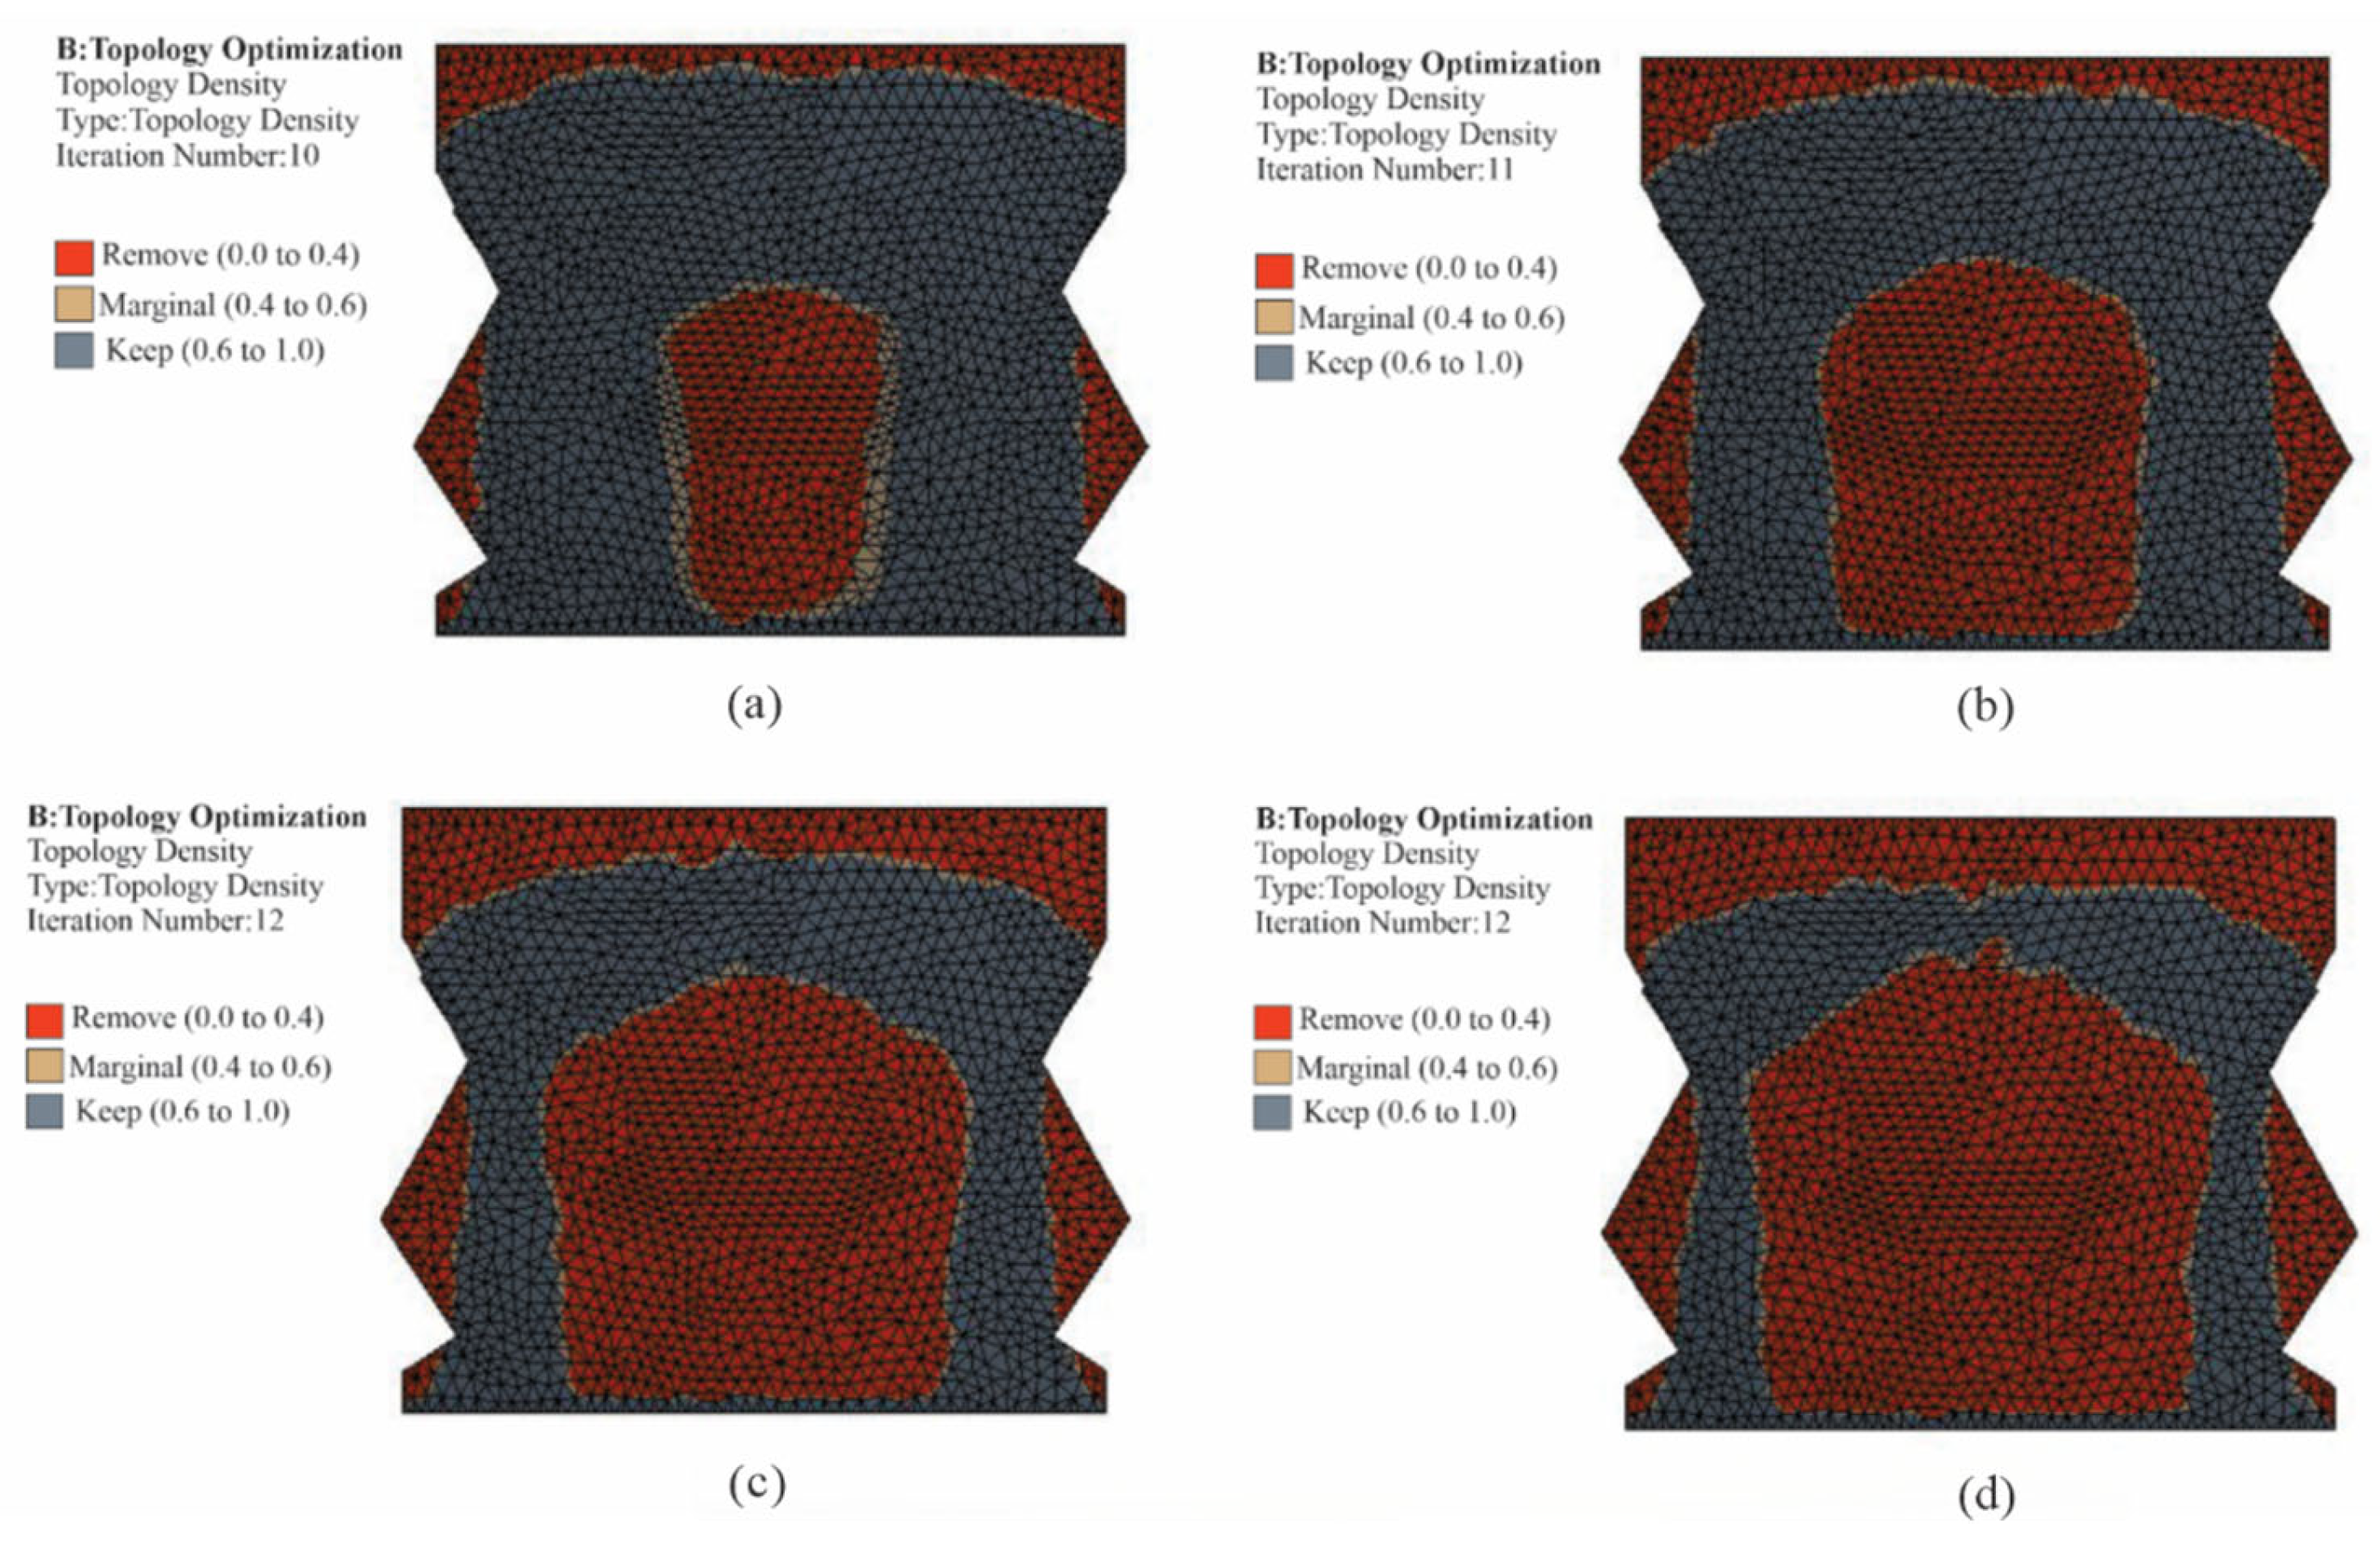
After conducting a static analysis in Model 2, topology optimization was performed. The optimization process involved iterating through different mass percentages to determine the optimal load path. This iterative procedure was repeated for various mass percentages until an optimal load path was identified. Specifically, the load paths for mass percentages ranging from 70% to 45% were determined and are illustrated in Figure 12a–d.
In the adopted variable-density topology optimization procedure, the retained-mass ratio determines the proportion of material permitted to remain within the structural domain after optimization. A high retention ratio (e.g., 70–80%) retains excessive material, resulting in redundant members that do not meaningfully contribute to force transfer. Conversely, a very low ratio (e.g., below 40%) eliminates critical load paths, creating unrealistic discontinuities in the strut-and-tie configuration.
Through iterative refinement, the retained-mass ratio was gradually reduced from 70% to 45%, at which point the topology converged to a stable load path with continuous principal compressive and tensile trajectories. This outcome indicates that a 45% retention ratio provides an optimal balance between material efficiency and structural integrity. Accordingly, this value holds practical design significance, as it represents the minimum material fraction required to maintain a complete and continuous load transfer mechanism.

5.3. Optimal Strut-and-Tie Model

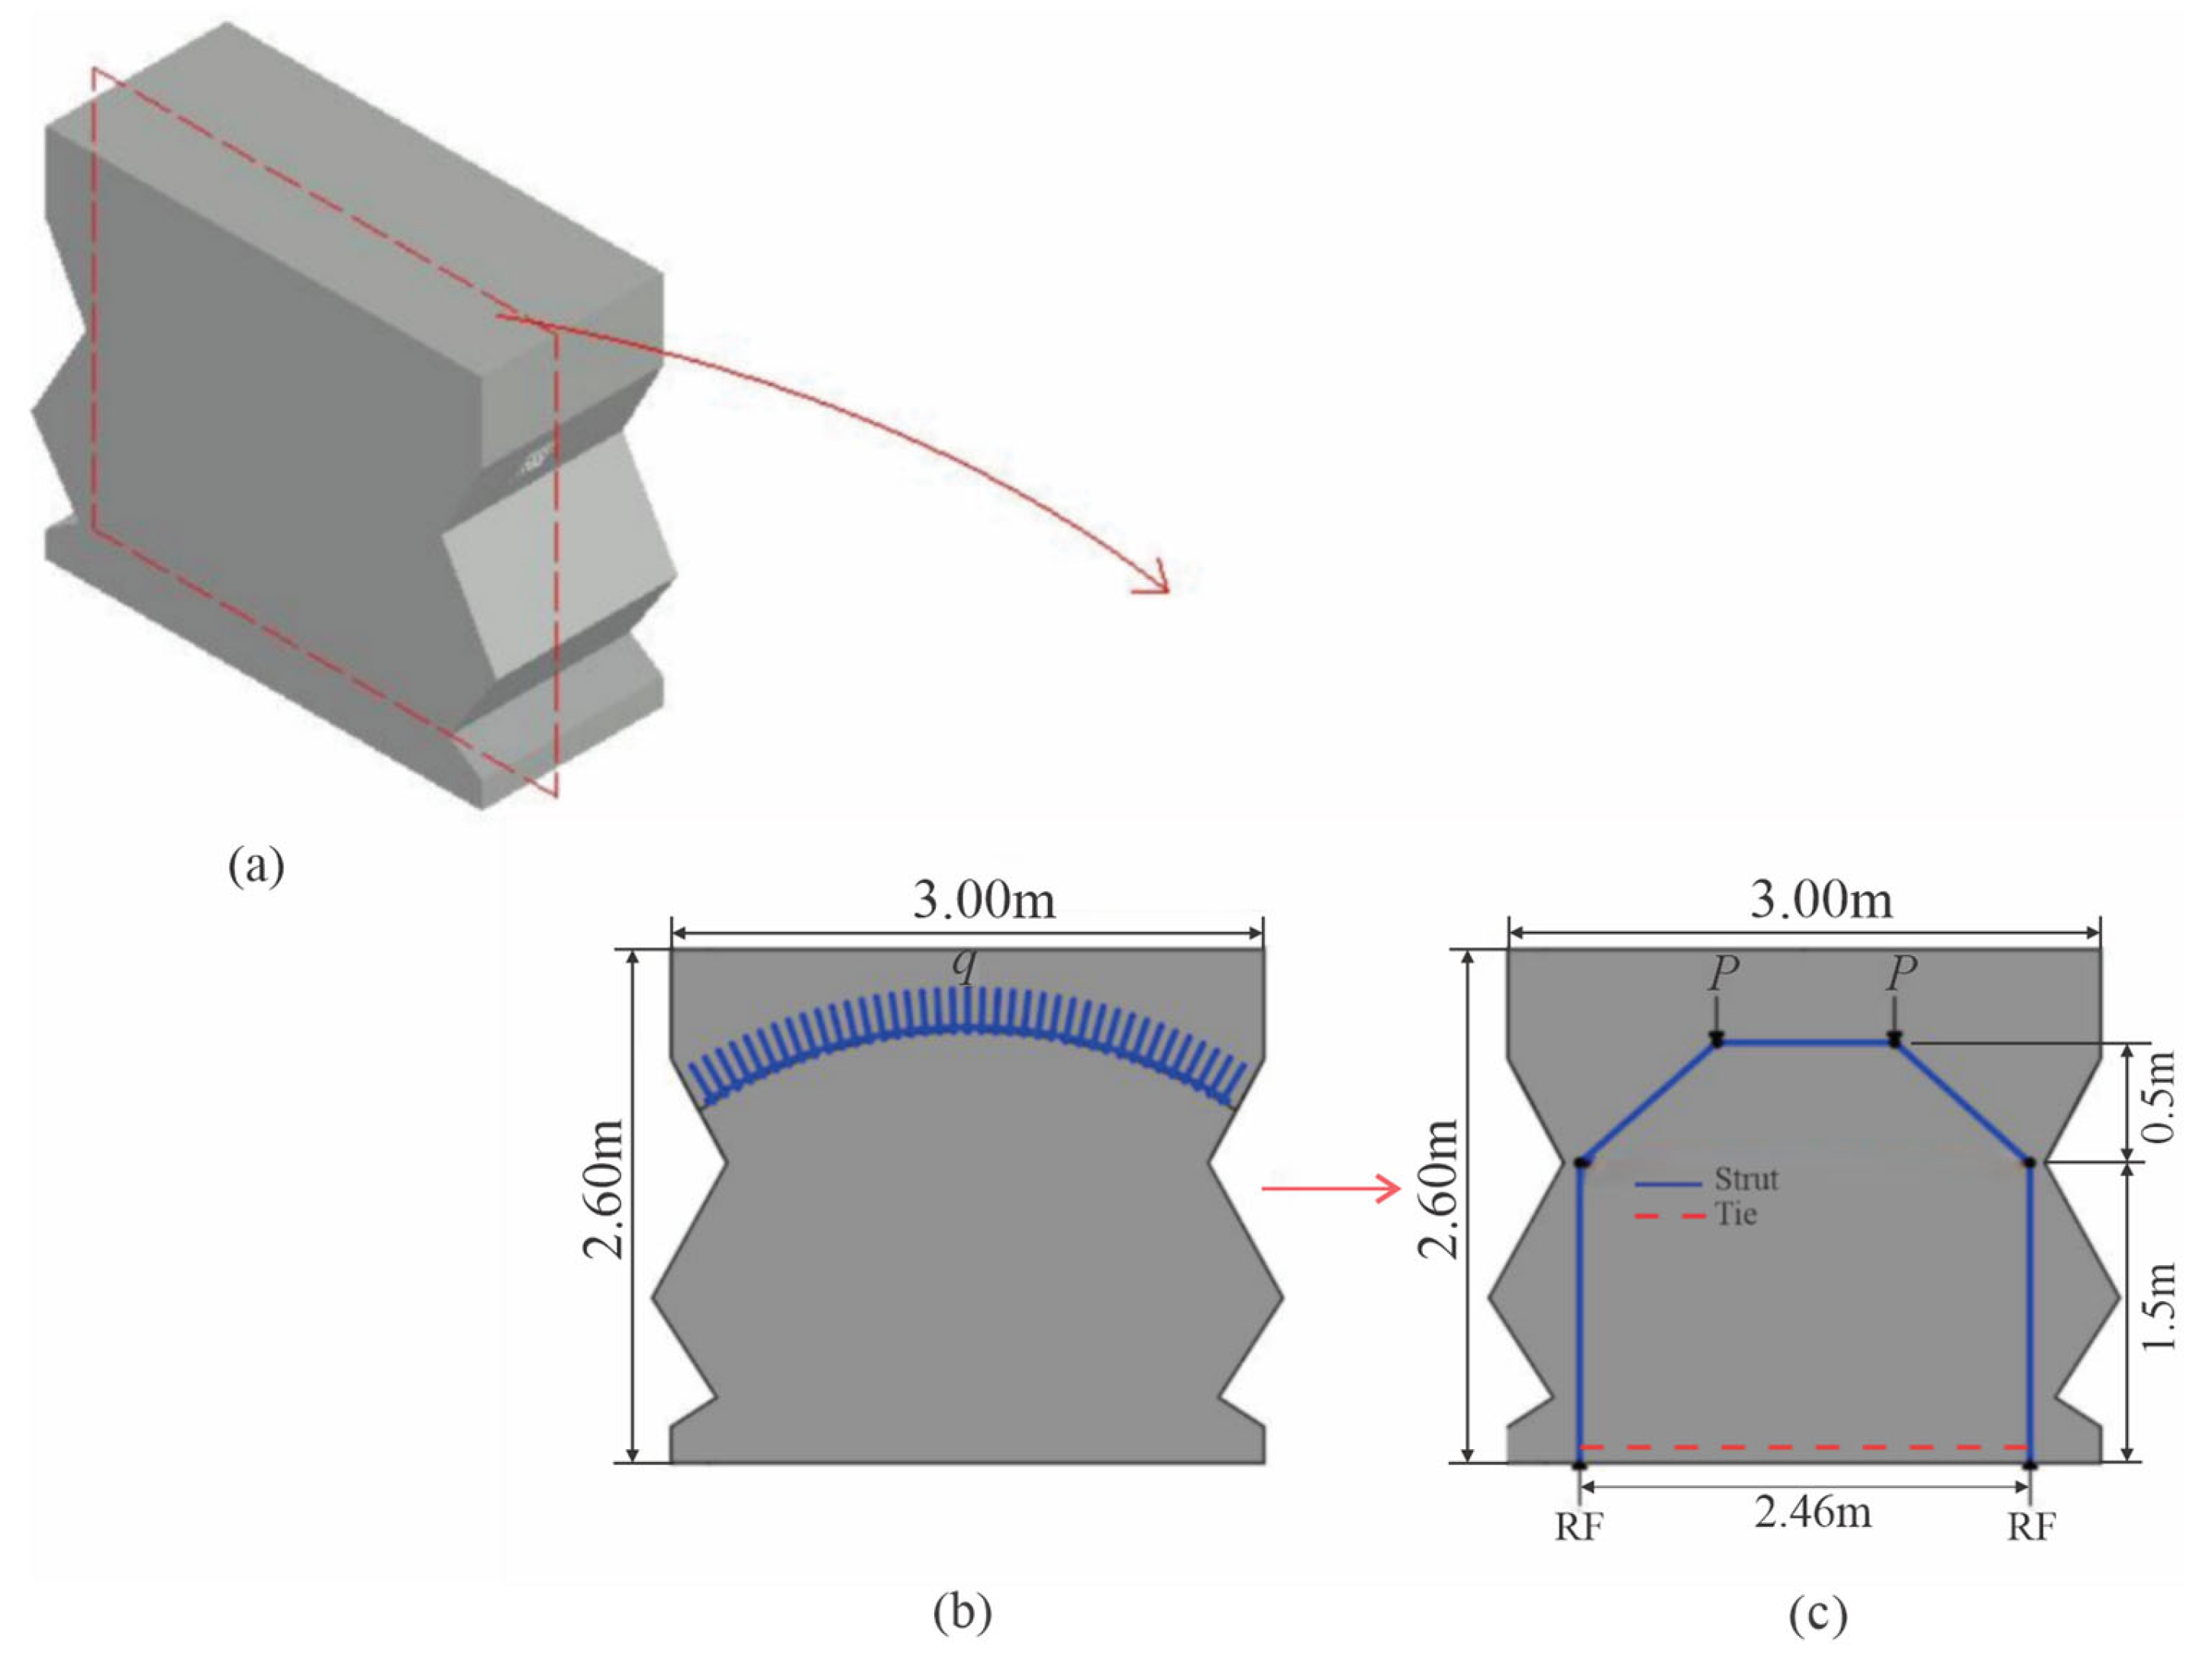
After finishing drawing Model 2 in Figure 13a, we distributed the tensile force along the filament pipe as it passed through the concrete tower, as depicted in Figure 13b. Next, we conducted a static analysis and then a topology optimization analysis to identify the optimal load path. Figure 13c displays the optimal STM based on the results.
In Model 2, the topology optimization method was used to generate the STM. The process involved iteratively testing various mass percentages until the optimal load path was identified. Moreover, the optimal mass was determined to be 45%. The optimal load path obtained from the topology optimization method in Figure 12d simplifies the distributed load (T) into two symmetrical point loads (P), as shown in Figure 13c. Since both the loading and the structure are symmetrical, the total load is divided evenly between these two points.
In the present study, the STM generated through topology optimization exhibited continuous and symmetric load paths connecting the cable saddle zone to the tower base, consistent with the expected behavior of D-regions under concentrated loads. The orientations of the tensile and compressive members adhered to the minimum strain energy principle, ensuring a smooth flow of internal forces without abrupt discontinuities an essential indicator of an accurately formulated STM. Moreover, the resulting topology demonstrated that the derived STM realistically captures the force transfer mechanism within nonlinear regions influenced by curved filament pipes. This outcome aligns with the established understanding that the strut-and-tie model (STM) provides an effective framework for analyzing disturbed regions (D-regions), such as cable anchorage zones in bridge towers [19].
The main findings of this study were obtained from detailed finite-element simulations conducted in ANSYS. Although field measurements were not included within the scope of this work, the simulated STM behavior and stress-distribution patterns are consistent with previously reported experimental and analytical studies [9,10,11]. Moreover, earlier experimental and STM-based investigations on cable–pylon anchorage zones have demonstrated that the STM approach accurately represents force flow in disturbed regions with complex stress fields, thereby confirming its suitability for such conditions [19,35]. Hence, while no new experimental data were collected in the present study, the numerical results are in close agreement with verified findings in the literature, supporting the reliability and validity of the model predictions.
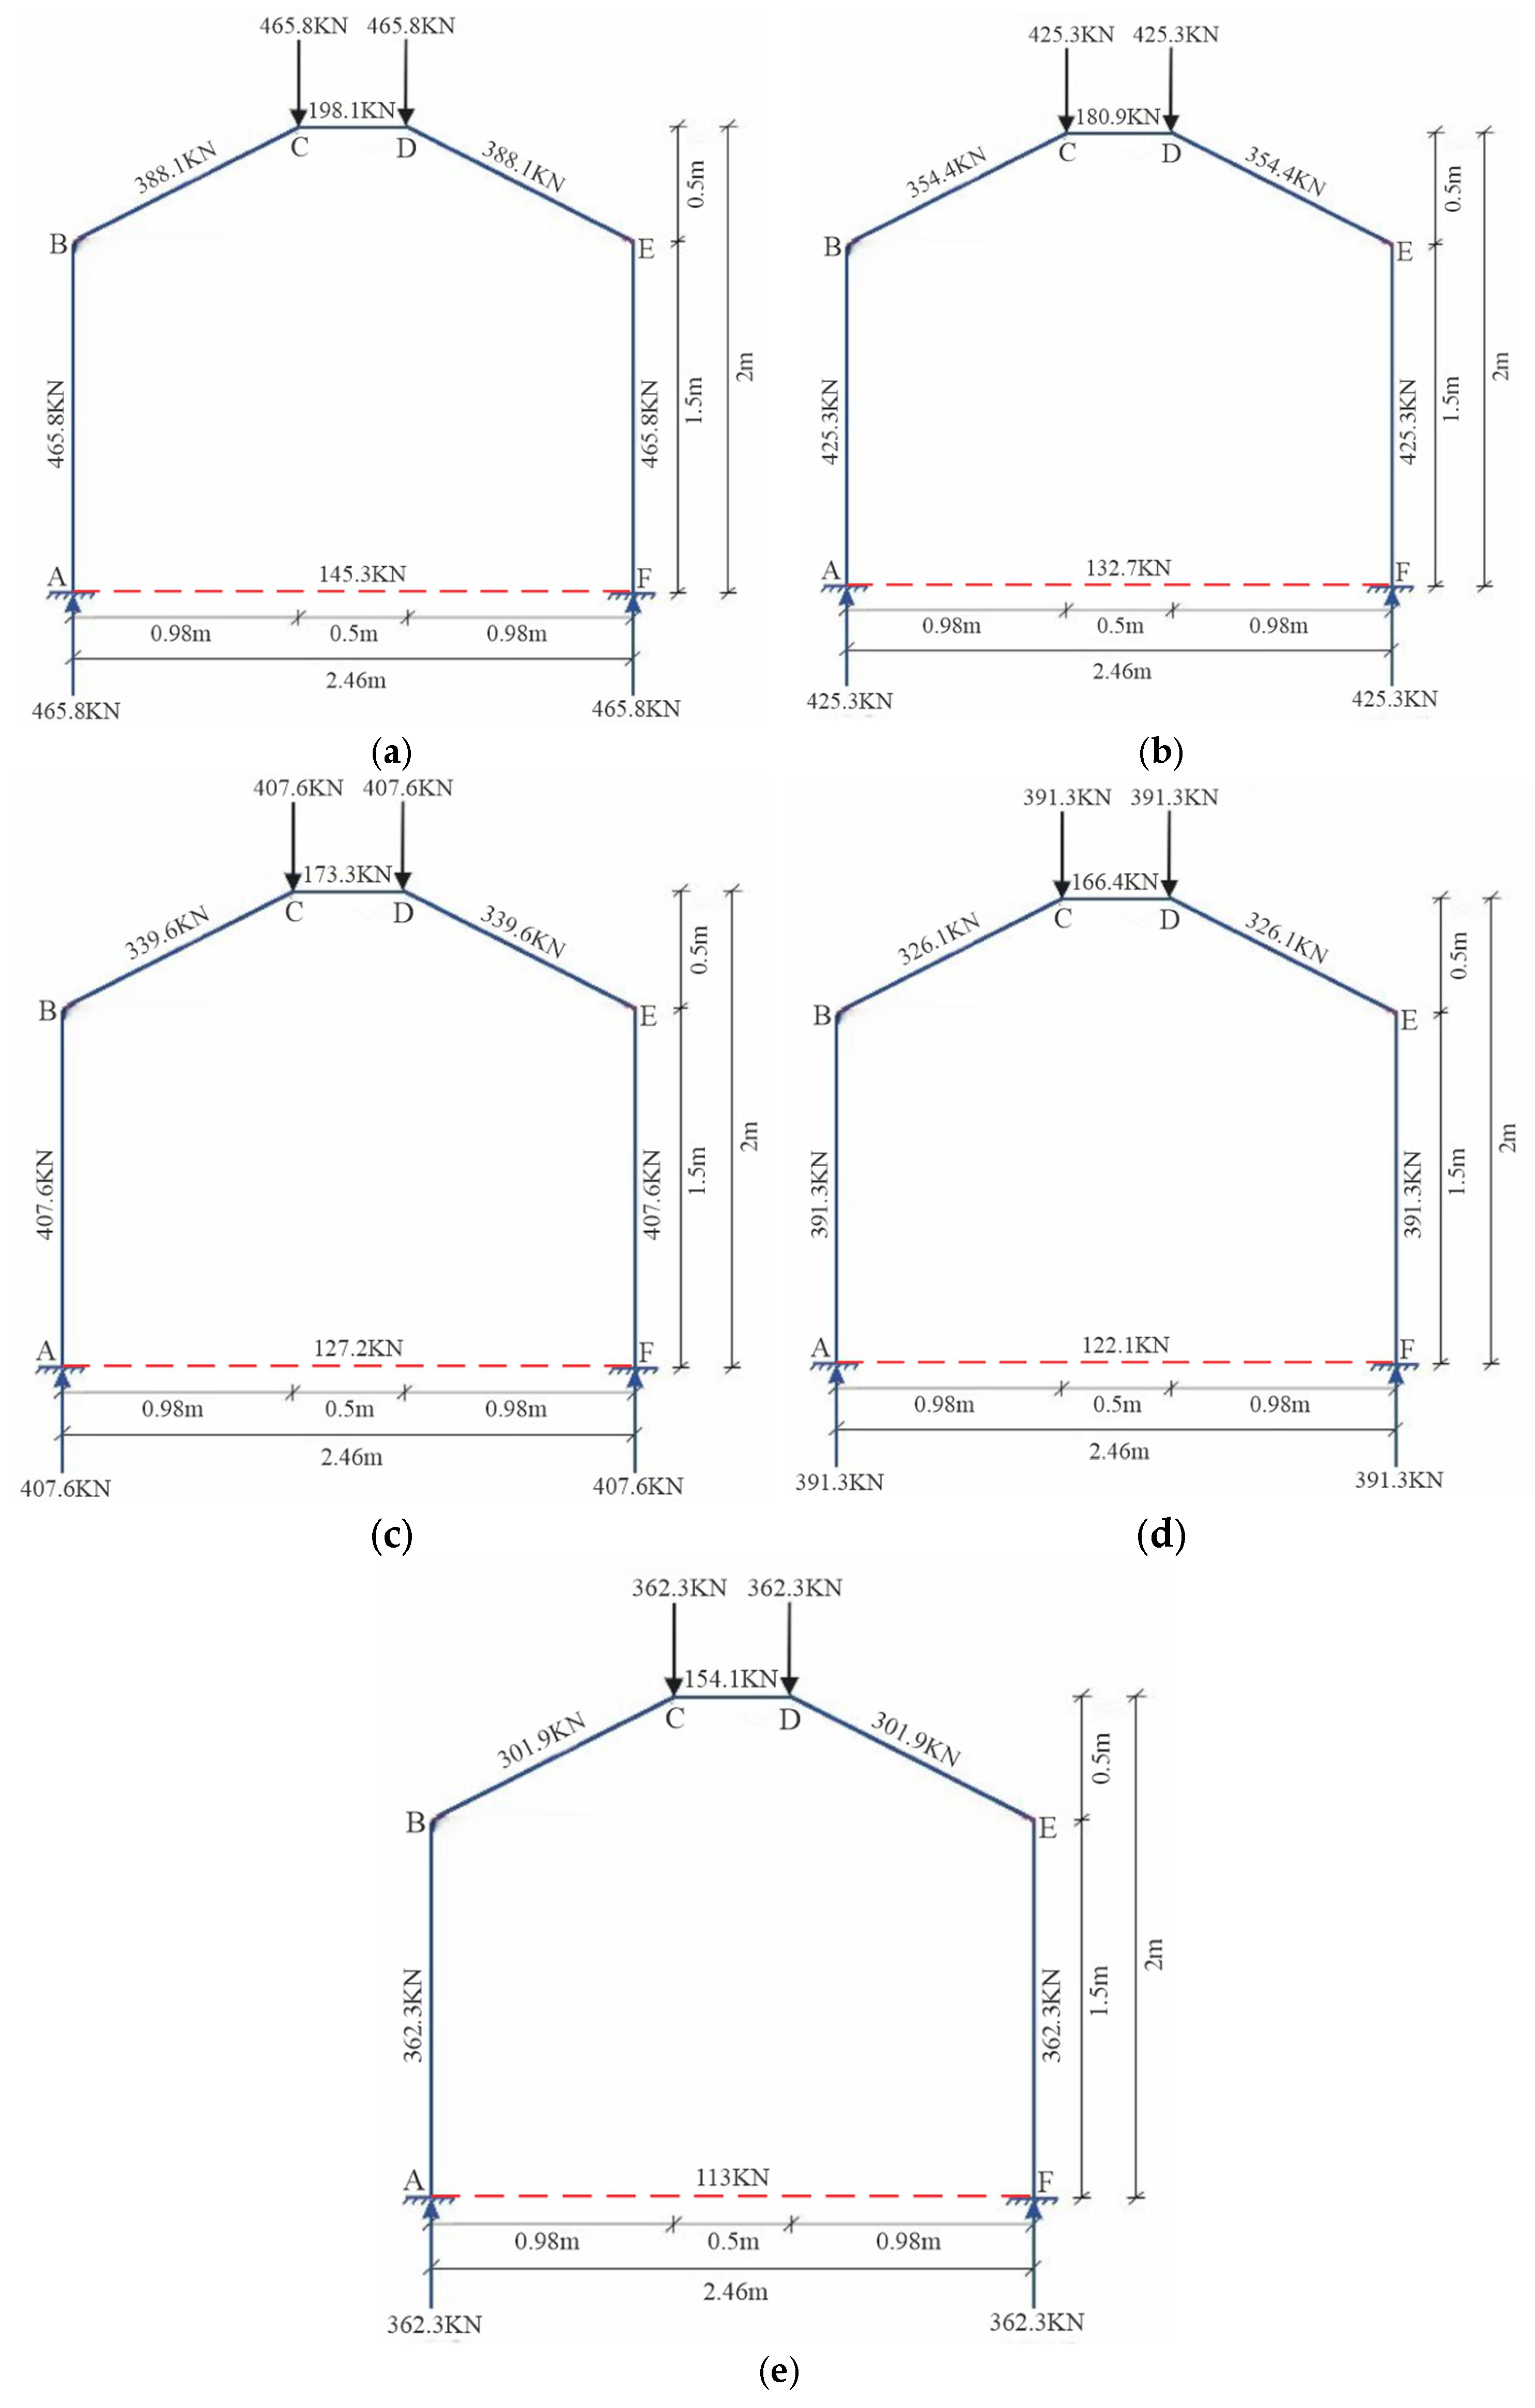
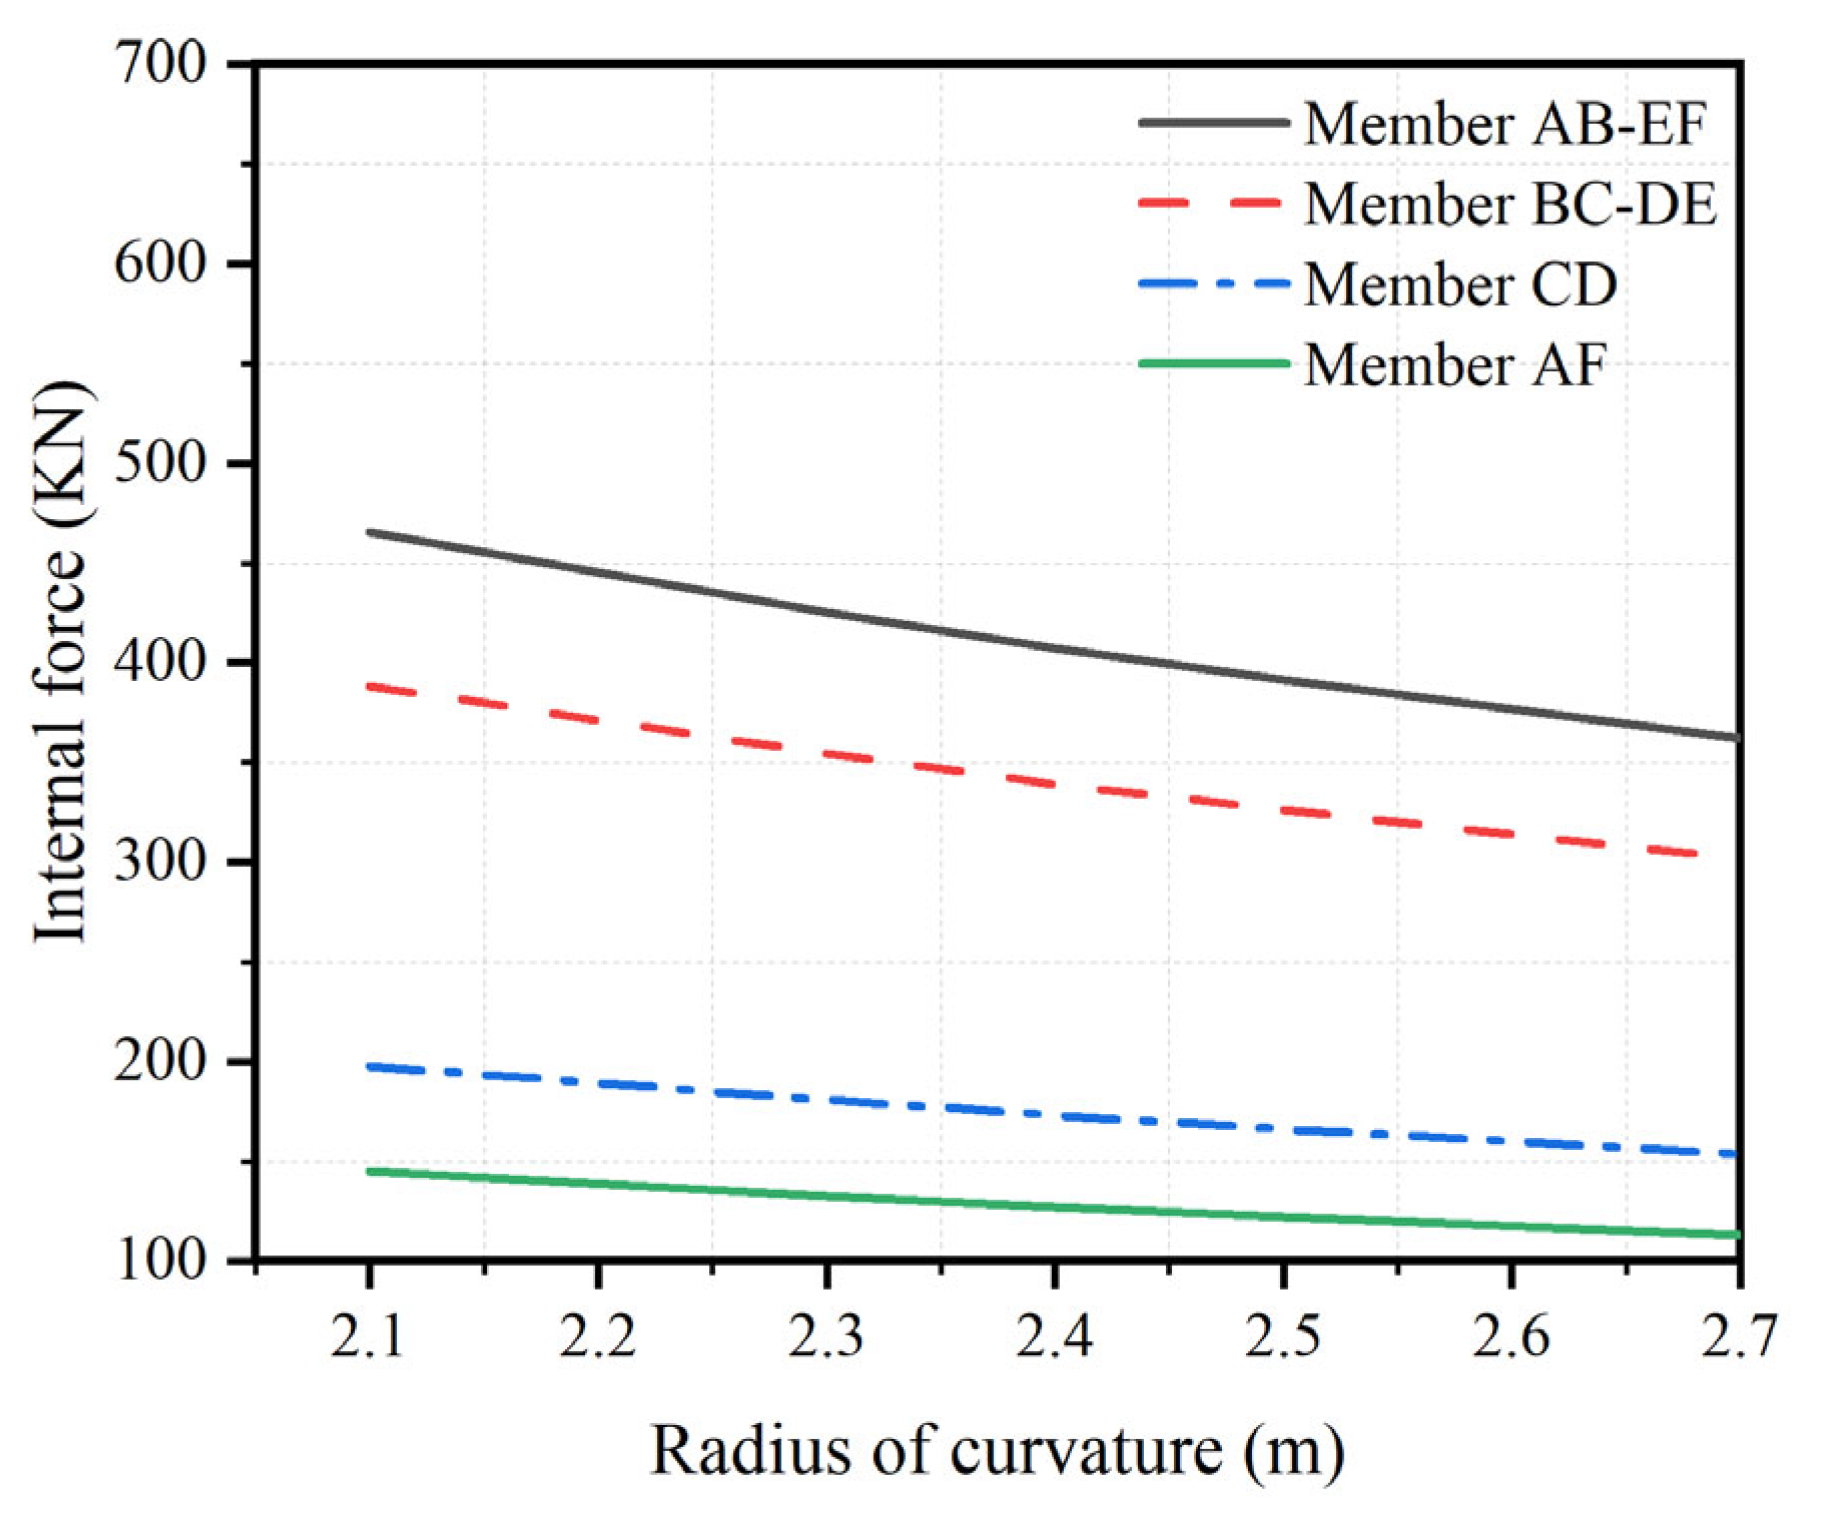
Figure 14 provides a detailed illustration of the internal forces acting on STM members for various radius of curvature (R), showing how the force distribution changes with R. Figure 15 illustrates the internal force in STM members as a function of the radius of curvature (R), highlighting how the force distribution evolves with changes in R. As R increases, the internal force in the members decreases. The applied force (P), varying with R, is calculated using Equation (1). This finding also supports the conclusion drawn from the stress-section curves for Sections 1-1, 2-2, 3-3, S, and F in Model 1, namely, that increasing R leads to a reduction in stress.

6. Conclusions

This study encompassed the analysis of the mechanical response behavior of filament pipes in concrete towers subjected to distributed loads resulting from the passage of the pipes. Furthermore, the stresses induced in the concrete tower owing to this phenomenon were investigated, and STM patterns were generated using the topology optimization method. The conclusions and recommendations derived from the study results are as follows:
  • The results indicated that vertical stress predominated in Section A, with a minor presence of horizontal stress. Consequently, the horizontal stress component was minimal. Furthermore, the vertical stress in the concrete increased the closer the point is to the center of the tower.
  • Stress levels were notably high in sections with smaller radius of curvature. In Section B, the stress was highest at point B5, and in Section C, it was highest at point C8.
  • In Section S, only horizontal forces were considered, as this section is located directly beneath the cable along the tower curvature. The stress distribution indicated an increase from the edge of the tower to its center.
  • The stress analysis revealed that sections farther from the center of the tower experienced lower stress levels. The highest stress concentration occurred directly beneath the cable along the curvature, as evidenced in the distribution at Section S.
  • In Section F, only the vertical force-induced stress was analyzed. The stress levels increased near the center of the tower and then decreased toward the edge.
  • The model with the smaller radius of curvature exhibited higher stress levels. This indicates an inverse relationship between the stress in the concrete and the radius of curvature of the cable saddle (R), whereby increasing the radius reduces the stress, and vice versa.
  • The STM was generated using the topology optimization method. The optimal mass was determined to be 45%.
  • The internal force distribution evolves with changes in the radius of curvature (R), which plays a crucial role in optimizing STM designs by ensuring adequate load transfer and preventing overstressing in the concrete tower.
  • Specifically, the results show that as the cable-saddle curvature radius increased from 2.1 m (Model A) to 2.7 m (Model E), the maximum von Mises stress within the concrete tower decreased from approximately 6.00 MPa to 4.66 MPa, representing a reduction of about 22%. This addition clarifies the magnitude of the stress improvement achieved through the optimization process and enhances the quantitative insight of the study’s conclusions.
  • The present STM formulation was derived for a single-plane, box-section tower segment subjected to symmetrical loading. However, the underlying topology optimization-based framework is general and can be extended to three-dimensional geometries. For towers with asymmetrical cross-sections or multiple cable planes, the same process—finite-element stress analysis followed by topology-based STM extraction—can be used to determine the corresponding optimal load paths. The resulting STM geometry naturally adapts to different boundary and loading conditions. In such cases, the struts represent compressive force flow lines (which can be enhanced through concrete confinement or compressive reinforcement), while the ties indicate tension trajectories (to be aligned with primary reinforcement bars or tendon ducts). This adaptability enables the STM to guide reinforcement orientation and anchorage detailing even in complex D-regions. Nonetheless, the broader application of this framework is presently constrained by the assumptions of linear elasticity and the absence of experimental validation. Future work will extend the method to incorporate dynamic loading effects and nonlinear material behavior, enhancing its applicability to diverse bridge tower configurations.
The present study is limited use of linear elastic material models and loading conditions, as well as the absence of experimental validation. Nevertheless, the findings establish a robust theoretical foundation for developing a functional STM in filament pipe regions. Future research should incorporate nonlinear material behavior, dynamic loading effects, and experimental verification to further improve the model’s applicability to bridge design practice.

Author Contributions

Conceptualization, M.A.F. and W.W.; Methodology, M.A.F., J.Y., C.W., M.A.A., T.I., O.A.A. and W.W.; Software, M.A.F., J.Y., M.A.A., T.I. and O.A.A.; Formal analysis, M.A.F., C.W. and M.A.A.; Writing—original draft, M.A.F.; Writing—review & editing, J.Y. and M.A.A.; Project administration, J.Y. and W.W.; Funding acquisition, C.W. and W.W. All authors have read and agreed to the published version of the manuscript.

Funding

The National Natural Science Foundation of China supported this research with Grant Nos. 52178371 and 52578446. The ‘CUG Scholar’ Scientific Research Funds at China University of Geosciences (Wuhan) (Project No. 2023121) is also acknowledged.

Data Availability Statement

Data is available on request from the authors. The raw data supporting the conclusions of this article will be made available by the authors on request.

Conflicts of Interest

Author Jingliang Ye and Chunbin Wan were employed by the company Wuhan Yucheng Construction Group Co., Ltd. The remaining authors declare that the research was conducted in the absence of any commercial or financial relationships that could be construed as a potential conflict of interest.

References

  1. Sun, S.; Zhang, J. Stay Cable Vibration Mitigation: A Review. Adv. Struct. Eng. 2022, 25, 1573–1588. [Google Scholar] [CrossRef]
  2. Li, M.; Ou, J. The State of the Art in Structural Health Monitoring of Cable-Stayed Bridges. J. Civ. Struct. Health Monit. 2015, 5, 297–307. [Google Scholar] [CrossRef]
  3. Wang, X.L.; Liang, T.; Qi, T.D. Study on Cable Force Optimization for Extradosed Cable-Stayed Bridge under the Rational Completion Stage. Appl. Mech. Mater. 2014, 501, 1170–1173. [Google Scholar] [CrossRef]
  4. Lamesgin, A.; Golla, A.; Rasool, G.; Jemanenh, W. Optimization of extradosed bridge and analysis of parameters’ sensitiveness: A case study on Abay Bridge. Ce/papers 2023, 6, 1144–1152. [Google Scholar] [CrossRef]
  5. Yan, L.; Guo, W.; Yang, N.; Dong, C.; Liu, M.; Cai, Y.J.; Zhang, Z.Z. Research progress of intelligent operation and maintenance of high-speed railway bridges. Intell. Transp. Infrastruct. 2022, 1, 015. [Google Scholar] [CrossRef]
  6. Zhou, X.; Lu, D.C.; Du, X.L.; Wang, G.S.; Meng, F.P. A 3D non-orthogonal plastic damage model for concrete. Comput. Methods Appl. Mech. Eng. 2020, 360, 112716. [Google Scholar] [CrossRef]
  7. Lu, D.C.; Meng, F.P.; Zhou, X.; Zhuo, Y.H.; Gao, Z.W.; Du, X.L. A dynamic elastoplastic model of concrete based on a modeling method with environmental factors as constitutive variables. J. Eng. Mech. 2023, 149, 04023102. [Google Scholar] [CrossRef]
  8. Ritter, W. Die Bauweise Hennebique. Schweiz. Bauztg. 1899, 33, 49–50. [Google Scholar]
  9. Mörsch, E. Concrete-Steel Construction (Der Eisenbetonbau); The Engineering News Publishing Company: New York, NY, USA, 1909. [Google Scholar]
  10. Schlaich, J.; Schäfer, K.; Jennewein, M. Toward a consistent design of structural concrete. PCI J. 1987, 32, 74–150. [Google Scholar] [CrossRef]
  11. Schlaich, J.; Schäfer, K. Design and detailing of structural concrete using strut-and-tie models. Struct. Eng. 1991, 69, 113–125. [Google Scholar]
  12. Panjehpour, M.; Ali, A.A.; Mohammed Parvez, A.; Aznieta, F.N.; Voo, Y.L. An overview of strut-and-tie model and its common challenges. Int. J. Eng. Res. Afr. 2012, 8, 37–45. [Google Scholar] [CrossRef]
  13. Gong, H.J.; Su, M. Introduction of the application of strut-and-tie model in concrete deep beams. Adv. Mater. Res. 2013, 671, 704–708. [Google Scholar] [CrossRef]
  14. Hou, D.W.; Zhao, J.L.; Shen, J.S.; Chen, J. Investigation and improvement of strut-and-tie model for design of end anchorage zone in post-tensioned concrete structures. Constr. Build. Mater. 2017, 136, 482–494. [Google Scholar] [CrossRef]
  15. Lu, D.C.; Wang, G.S.; Du, X.L.; Wang, Y. A nonlinear dynamic uniaxial strength criterion that considers the ultimate dynamic strength of concrete. Int. J. Impact Eng. 2017, 103, 124–137. [Google Scholar] [CrossRef]
  16. Dawood, A.A.; Abdul-Razzaq, K.S. Shear friction and strut-and-tie modeling verification for pier caps. J. Bridge Eng. 2021, 26, 04021059. [Google Scholar] [CrossRef]
  17. Tian, Y.D.; Zhang, J.H.; Lyu, Y.F.; Zhang, J. Comprehensive review of noncontact sensing technologies for bridge condition monitoring and assessment. Intell. Transp. Infrastruct. 2024, 3, 012. [Google Scholar] [CrossRef]
  18. Cui, N.; Huang, S. On the optimal strut-and-tie models and design approach for the cable-pylon anchorage zone. J. Civ. Eng. Manag. 2019, 25, 576–586. [Google Scholar] [CrossRef]
  19. Li, S.; Hong, Y.; Huang, S.; Pu, Q. Investigation of the strut-and-tie model of a two-plane cable-stayed bridge tower under vertical component of the cable force. Struct. Concr. 2021, 22, 3288–3303. [Google Scholar] [CrossRef]
  20. Vinayak, H.K.; Nak, S.S.; Tv, P.K. Direct strut-and-tie model for reinforced concrete bridge pier cap. Math. Model. Civ. Eng. 2016, 12, 1–8. [Google Scholar]
  21. Byun, N.; Lee, J.; Won, J.Y.; Kang, Y.J. Structural response estimation of cable-stayed bridge from limited number of multi-response data. Sensors 2022, 22, 3745. [Google Scholar]
  22. Asgari, B.; Osman, S.A.; Adnan, A. Sensitivity analysis of the influence of structural parameters on dynamic behaviour of highly redundant cable-stayed bridges. Adv. Civ. Eng. 2013, 2013, 426932. [Google Scholar] [CrossRef]
  23. Wu, W.H.; Chen, C.C.; Lin, S.L.; Lai, G.L. Automatic anomaly detection and processing for long-term tension monitoring of stay cables based on vibration measurements. Intell. Transp. Infrastruct. 2022, 1, liac002. [Google Scholar] [CrossRef]
  24. Li, S.; Hong, Y.; Chen, L.; Pu, Q. Investigation of the strut-and-tie model of a single-plane cable-stayed bridge tower under vertical component of the cable force. Struct. Concr. 2023, 24, 4515–4529.20. [Google Scholar] [CrossRef]
  25. Zhang, Q.; Kang, J.; Bao, Y.; Cheng, Z.; Jia, D.; Bu, Y. Numerical study on cable-saddle frictional resistance of multi-span suspension bridges. J. Constr. Steel Res. 2018, 150, 51–59. [Google Scholar] [CrossRef]
  26. Wang, L.; Shen, R.; Zhang, S.; Bai, L.; Zhen, X.; Wang, R. Strand-element analysis method for interaction between cable and saddle in suspension bridges. Eng. Struct. 2021, 242, 112283. [Google Scholar] [CrossRef]
  27. Cheng, Z.; Zhang, Q.; Bao, Y.; Jia, D.; Bu, Y.; Li, Q. Analytical models of frictional resistance between cable and saddle equipped with friction plates for multispan suspension bridges. J. Bridge Eng. 2018, 23, 04017118. [Google Scholar] [CrossRef]
  28. Zhang, Q.; Cheng, Z.; Cui, C.; Bao, Y.; He, J.; Li, Q. Analytical model for frictional resistance between cable and saddle of suspension bridges equipped with vertical friction plates. J. Bridge Eng. 2017, 22, 04016103. [Google Scholar] [CrossRef]
  29. Liang, Q.Q.; Xie, Y.M.; Steven, G.P. Topology optimization of strut-and-tie models in reinforced-concrete structures using an evolutionary procedure. Struct. J. 2000, 97, 322–330. [Google Scholar]
  30. Kwak, H.G.; Noh, S.H. Determination of strut-and-tie models using evolutionary structural optimization. Eng. Struct. 2006, 28, 1440–1449. [Google Scholar] [CrossRef]
  31. He, Z.Q.; Liu, Z. Optimal three-dimensional strut-and-tie models for anchorage diaphragms in externally prestressed bridges. Eng. Struct. 2010, 32, 2057–2064. [Google Scholar] [CrossRef]
  32. Jewett, J.L.; Carstensen, J.V. Experimental investigation of strut-and-tie layouts in deep RC beams designed with hybrid bi-linear topology optimization. Eng. Struct. 2019, 197, 109322. [Google Scholar] [CrossRef]
  33. Ma, C.; Lu, D.C.; Du, X.L.; Qi, C.Z.; Zhang, X.Y. Structural components functionalities and failure mechanism of rectangular underground structures during earthquakes. Soil Dyn. Earthq. Eng. 2019, 119, 265–280. [Google Scholar] [CrossRef]
  34. Li, S.; Lim, E.; Shen, L.; Hong, Y.; Pu, Q. Strut-and-Tie Model-Based Prestress Design for the Cable–Pylon Anchorage Zone of Cable-Stayed Bridges. J. Bridge Eng. 2021, 26, 04021069. [Google Scholar] [CrossRef]
  35. Zhu, J.; Wang, M.; Li, Y.; Cui, N.; Xun, J. Research on topology optimization strut-and-tie model and prestress construction for cable-pylon anchorage zone of Fengshuba Bridge. Structures 2024, 68, 107146. [Google Scholar] [CrossRef]
  36. Li, S.; Lim, E.; Chen, Z.; Hong, Y.; Pu, Q. Simplified method for predicting the internal forces in strut-and-tie model of cable-pylon anchorage zone in a cable-stayed bridge. Struct. Concr. 2024, 25, 4134–4149. [Google Scholar] [CrossRef]
  37. Wang, P.G.; Xu, H.R.; Shen, Y.M.; Qu, Y.; Du, X.L. Dynamic response analysis of a floating bridge structure under combined actions from seismic loading and waves at different incident angles. Intell. Transp. Infrastruct. 2024, 3, 016. [Google Scholar] [CrossRef]
  38. GB 50010-2010; Code for Design of Concrete Structures. China Architecture &. Building Press: Beijing, China, 2010.
  39. GB/T 700-2006; Carbon Structural Steels. Standards Press of China: Beijing, China, 2006.
  40. American Association of State Highway and Transportation Officials (AASHTO). AASHTO LRFD Bridge Design Specifications, 9th ed.; American Association of State Highway and Transportation Officials (AASHTO): Washington, DC, USA, 2020. [Google Scholar]
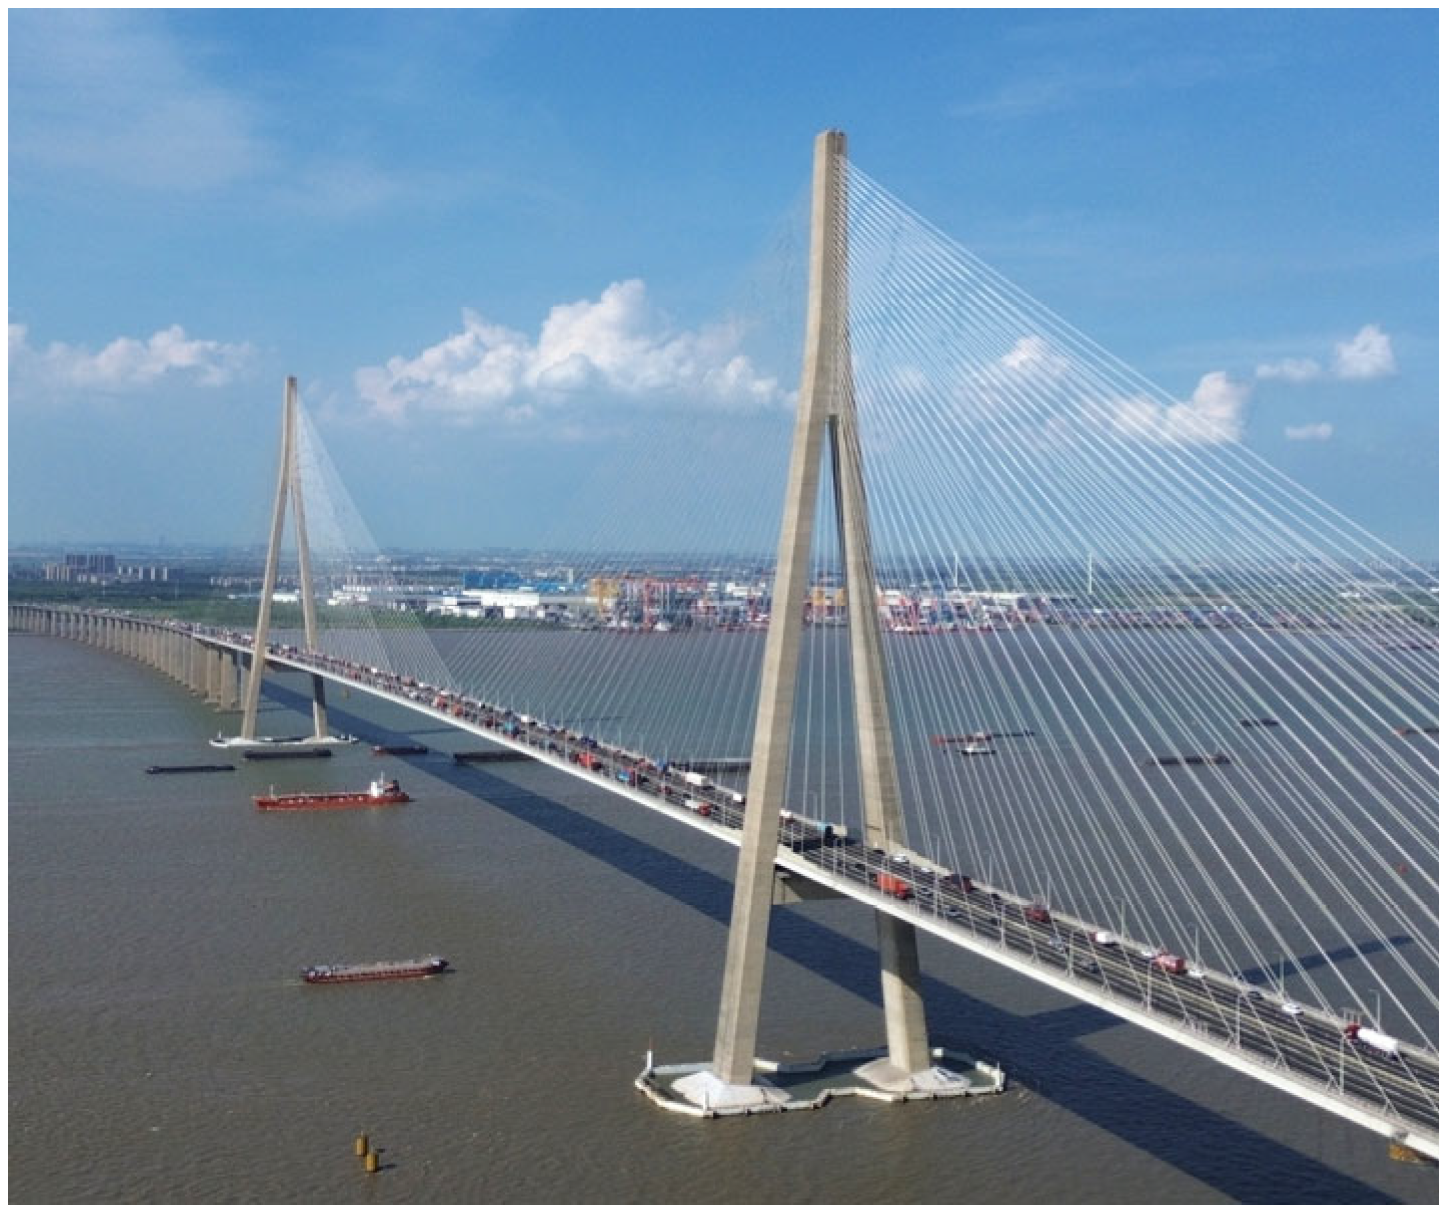
Figure 1. The Sutong Yangtze River Bridge in China [1].
Buildings 15 04235 g001
Figure 2. Cable-stayed bridge: (a) load transfer mechanism, and (b) section elevation.
Buildings 15 04235 g002
Figure 3. Geometry dimensions for the filament pipe anchorage zone segment in Model 1: (a) elevation section, (b) side section, and (c) filament pipes.
Buildings 15 04235 g003
Figure 4. Geometry dimensions for the filament pipe anchorage zone segment in Model 2 (initial model prior to topology optimization): (a) elevation section, (b) side section, and (c) filament pipes.
Buildings 15 04235 g004
Figure 5. Flow chart of the statics and topology optimization process of the filament pipe anchorage zone in the extradosed cable-stayed bridges.
Buildings 15 04235 g005
Figure 6. Different areas within the concrete beneath the cable: (a) elevation sections, (b) Section 1-1 (Points A), (c) Section 2-2 (Points B), (d) Section 3-3 (Points C), (e) elevation section of the Points S, and (f) elevation section of the Points F.
Buildings 15 04235 g006
Figure 7. Von mises stress results of the various models: (a) Model A, (b) Model B, (c) Model C, (d) Model D and (e) Model E.
Buildings 15 04235 g007
Figure 8. Von mises stress results side-section of the various models: (a) Model A, (b) Model B, (c) Model C, (d) Model D and (e) Model E.
Buildings 15 04235 g008
Figure 9. Stress for the various sections: (a) Section 1-1 (Points A); (b) Section 2-2 (Points B); and (c) Section 3-3 (Points C).
Buildings 15 04235 g009aBuildings 15 04235 g009b
Figure 10. Stress for Section S.
Buildings 15 04235 g010
Figure 11. Stress for Section F.
Buildings 15 04235 g011
Figure 12. Topology optimisation results showing mass distribution at various percentages: (a) 70%; (b) 60%; (c) 50%; and (d) 45%.
Buildings 15 04235 g012
Figure 13. Strut-and-tie model (STM): (a) 3D modelling; (b) section elevation with distribution load and (c) optimal STM.
Buildings 15 04235 g013
Figure 14. The internal force of the members in STM: (a) R = 2.1 m; (b) R = 2.3 m; (c) R = 2.4 m; (d) R = 2.5 m and (e) R = 2.7 m.
Buildings 15 04235 g014
Figure 15. The internal force of members for strut-and-tie model (STM) versus the radius of curvature.
Buildings 15 04235 g015
Table 1. Material properties of concrete.
PropertyValueUnit
Density2600Kg/m3
Young’s Modulus3.45 × 1010pa
Poisson’s Ratio0.2
Table 2. Material properties of steel.
PropertyValueUnit
Density7850Kg/m3
Young’s Modulus2.0 × 1011pa
Poisson’s Ratio0.3
Table 3. Radius of curvature of the cable saddle in different models.
PropertyRadius of Curvature of Cable Saddle (m)
Model A2.1
Model B2.3
Model C2.4
Model D2.5
Model E2.7
Disclaimer/Publisher’s Note: The statements, opinions and data contained in all publications are solely those of the individual author(s) and contributor(s) and not of MDPI and/or the editor(s). MDPI and/or the editor(s) disclaim responsibility for any injury to people or property resulting from any ideas, methods, instructions or products referred to in the content.