Article

Reference Static Pressure Effect on Fluctuating Wind Pressure on Roofs of Low-Rise Buildings in Open-Circuit Wind Tunnels

Department of Architectural Engineering, Dongshin University, Naju 58245, Republic of Korea
*
Author to whom correspondence should be addressed.
Buildings 2025, 15(23), 4208; https://doi.org/10.3390/buildings15234208
Submission received: 2 November 2025 / Revised: 18 November 2025 / Accepted: 18 November 2025 / Published: 21 November 2025
(This article belongs to the Section Building Structures)

Abstract

The structural characteristics of open-circuit wind tunnels result in internal static pressure instability, which can affect the accuracy of wind pressure coefficient measurements on rigid models of low-rise buildings. To address this issue, a Pitot tube and an ESP electronic pressure scanning system were used to collect data on reference static pressure variation and wind pressure on the roof of a low-rise building under Class B wind terrain and different temperature conditions. The results indicate that the reference static pressure decreases with increasing temperature and is significantly influenced by external airflow disturbances at the beginning of the experiment, and it tends to stabilize approximately 5 min after the wind tunnel is activated. The probability density of reference static pressure under different conditions mostly follows a Gaussian distribution, although a few samples exhibit heavy-tailed or skewed fluctuations. The sliding standard deviation and coefficient of variation of the reference static pressure are both relatively small, but occasional samples show extreme fluctuations. It is recommended to apply filtering techniques or repeated measurements to reduce experimental errors. At a wind direction angle of 0°, the fluctuating wind pressure coefficients on the roof calculated using reference static pressures from different samples exhibit good consistency. The average mean relative error of the fluctuating wind pressure coefficients across roof zones I–VIII was 3.71%, which is within an acceptable range. The research findings provide a useful reference for reducing result errors in wind pressure tests conducted in open-circuit wind tunnels.

1. Introduction

In recent years, with increasing demands for accuracy in wind load assessment for wind-resistant design, wind tunnel testing has played an increasingly important role in the study of wind pressure characteristics on low-rise buildings [1]. As a key method for simulating atmospheric boundary layers and obtaining wind pressure data on building surfaces, wind tunnel tests directly influence structural safety and the reliability of wind-induced response analysis [2]. Currently, mainstream wind tunnels are primarily divided into two types: open-circuit and closed-circuit [3]. While closed-circuit tunnels offer advantages such as stable airflow and strong resistance to external disturbances, their construction and operational costs are relatively high [4]. In contrast, open-circuit tunnels feature simpler structures and greater economic flexibility, but due to their inlet and outlet being exposed to the external environment, the internal airflow is more susceptible to ambient influences, particularly with respect to static pressure stability [5]. In building model wind pressure experiments, the reference static pressure serves as a reference parameter for calculating wind pressure coefficients, and its accuracy is of utmost importance [6]. Since the pressure measurement system records the difference between the total pressure and the reference static pressure, any fluctuation or error in the reference static pressure will propagate throughout the system, thereby affecting the reliability of the final data [7,8].
Several studies have been conducted on the effect of reference static pressure on wind pressure characteristics in open-circuit wind tunnels. Pomaranzi and Zasso [9] performed high-frequency wind pressure measurement experiments on high-rise buildings in both closed and open-circuit wind tunnels, revealing certain statistical differences in the wind pressure data obtained from different tunnel types. He et al. [10] proposed an accurate measurement method for reference static pressure and reference wind speed in wind tunnel experiments, confirming that the average static pressure difference between two points is linearly related to the square of the average wind speed. Dalley and Richardson [11] pointed out that static pressure is influenced by factors such as the model’s position, wind direction, different boundary-layer simulated flow fields, and turbulence characteristics; they recommended continuous monitoring of static pressure and the collection of a large number of samples to eliminate low-frequency fluctuations. Liberzon and Shemer [12] introduced a pressure probe and sensor application scheme for measuring static pressure fluctuations. Nijhof and Wickern [13] compared various reference static pressure measurement methods and found that the static pressure chamber method is more adaptable to blockage effects, emphasizing that under high blockage conditions, additional correction of reference static pressure is required. Grossir et al. [14] evaluated the performance of slender static pressure probes in hypersonic wind tunnels under cold gas conditions and proposed a cost-effective calibration method suitable for low static pressure environments. Voznyak et al. [15] presents the results of an investigation into the effect of natural and mechanical ventilation on airflow around a bus, in both the passenger and driver compartments. Based on the measurements, the distribution of air velocities in the boundary layer was determined. Furthermore, the effect of natural ventilation on the interior space’s air boundary layer thickness was analysed. Zhelykh et al. [16] considers the distribution of the pressure coefficient on the surface of a modular house model to assess the feasibility of operating a thermosyphon solar collector integrated into the external protection. The experiment was designed to evaluate the factors affecting the aerodynamic coefficient value.
Existing studies on open-circuit wind tunnels have primarily focused on the effects of flow characteristics on the aerodynamic response of models. Although these studies highlight the importance of flow-field stability in pressure measurements, the dynamic fluctuation characteristics of the reference static pressure within the flow field have not been thoroughly investigated [17]. In addition, the coupled influence of temperature variations and external disturbances on the stability of the reference static pressure remains insufficiently addressed, and quantitative analyses of how reference static-pressure fluctuations affect fluctuating wind pressure coefficients are still lacking. Conventional approaches for determining the reference static pressure typically rely on time-averaging, which is inadequate for capturing transient or abnormal disturbances that may introduce measurement bias. Therefore, a systematic investigation into the dynamic behavior of reference static pressure and its influence on wind pressure measurements in open-circuit wind tunnels is of significant theoretical and engineering importance. For this reason, the present study examines the instability of reference static pressure in an open-circuit wind tunnel. Using a Pitot tube and an ESP electronic pressure scanning system, the time-history data of reference static pressure under Class B wind terrain and varying temperature conditions were repeatedly sampled and analyzed. The study focuses on the distribution patterns, statistical characteristics, and abnormal disturbance behavior of reference static pressure, proposing improved methods for its acquisition and processing. Furthermore, the impact of reference static pressure on the distribution of fluctuating wind pressure coefficients on the roof of a rigid model of a low-rise building with a flat roof is evaluated. The findings of this study provide theoretical insights and technical support for improving the accuracy and stability of wind pressure measurements in open-circuit wind tunnel experiments.

2. Wind Tunnel Experimental Overview

The experimental study was conducted in a full-steel, open-circuit suction-type wind tunnel with a test section of 21.0 m (length) × 4.0 m (width) × 3.0 m (height). The atmospheric boundary layer for Category B terrain at a scale of 1:20 was simulated using passive devices including triangular wedges, roughness elements, and baffles (see Figure 1a), the profiles of the mean wind speed and turbulence intensity are illustrated in Figure 1b. Reference static pressure and model wind pressure data were measured using a Pitot tube and an ESP electronic pressure scanning system (DTC series, PSI Inc., Hampton, VA, USA), According to the time scale similarity law between the model and the prototype (λT = 1/5), the measurement time of 30 s corresponds to 2.5 min in full scale, which is sufficient to capture the characteristics of low-frequency turbulent structures. The ESP electronic pressure scanning system sampled at a frequency of 333.3 Hz, with 10,000 data points collected in each measurement.
To ensure the accuracy of reference static pressure measurements, the measurement location should adhere to the following principles: (1) The measurement location was positioned outside the model’s flow disturbance region to avoid interference effects and (2) the flow characteristics at the reference pressure measurement location should match those in the test section to minimize errors caused by flow non-uniformity [18]. Accordingly, in this study, the reference static pressure was measured at Point P01, located at the front-right side of the model (see Figure 1a), with the reference height fixed at 40 cm. Repeated sampling was conducted to ensure data reliability.
The wind tunnel pressure measurement model was constructed from ABS sheets as a rigid zero-slope model (see Figure 1a and Figure 2a). The model dimensions are 600 mm × 400 mm × 400 mm (length × width × height), corresponding to a geometric scale of 1:20, and the blockage ratio was less than 5%. A total of 130 pressure measurement points (numbered 1 to 130) were installed on the roof surface and divided into eight zones (Zones I–VIII) as shown in Figure 2b: Zones I and VI represent the eaves areas, Zones II and V correspond to the gable areas, Zones III and IV are the ridge areas, and Zones VII and VIII are the corner areas [19].

3. Reference Static Pressure Test Value Patterns

Temperature has a significant effect on the static pressure of airflow [20]. In this study, under Class B wind field conditions and taking an atmospheric pressure of 101 kPa as the reference, multiple reference static pressure tests were conducted at point P01 under different temperature conditions. The test conditions are detailed in Table 1 [21].
Figure 3 shows the variation trend of reference static pressure (Pref) at point P01 under six temperature conditions.
As shown in Figure 3, temperature has a significant impact on the reference static pressure, with the static pressure decreasing as the temperature increases. Under temperature conditions T1, T2, and T3, the variations in reference static pressure were relatively small, while a more pronounced decrease was observed for conditions T4 through T6. The highest static pressure among all samples was 147.6 Pa (T1-17), and the lowest was 138.8 Pa (T6-4). This phenomenon is mainly attributed to the decrease in gas density and the increase in fluid diffusivity with rising temperature, which leads to a reduction in reference static pressure [22].
Under all temperature conditions, the 21 reference static pressure measurements exhibited slight fluctuations to varying degrees. The smallest fluctuation occurred under condition T2, while relatively larger variations were observed under conditions T1, T4, T5, and T6; nevertheless, the overall fluctuations remained within a limited range. It is noteworthy that during the initial measurement stage (N = 1–4), the data showed relatively larger fluctuations, indicating that the reference static pressure was more susceptible to external airflow disturbances at the beginning of the experiment. Generally, the measured reference static pressure became stable after approximately five minutes of operation.

4. Stability Analysis of Reference Static Pressure

To investigate the stability of the reference static pressure time-series data in the open-circuit wind tunnel, this study conducted statistical analyses on the reference static pressure at a height of 40 cm at point P01 in the Category B wind terrain, including probability density distribution, kurtosis and skewness, sliding standard deviation, and coefficient of variation.

4.1. Probability Density Distribution of the Reference Static Pressure Time History

Based on the time-history data of reference static pressure, this study employs kernel density estimation (KDE) as a non-parametric method to estimate the probability density function and to plot the probability distributions of the reference static pressure under different temperature conditions (see Figure 4) [23]. Owing to space constraints, 6 equally spaced samples (N = 1, 5, 9, 13, 17, 21) were analyzed for each temperature scenario.
The probability distribution characteristics of the reference static pressure are described using third-order moment (skewness) and fourth-order moment (kurtosis), which are important indicators for determining whether the time-history data follows a Gaussian distribution. The definitions of these parameters are as follows:
S = n 1 i = 1 n P ref ( t ) P ref , m P ref , r 3
K = n 1 i = 1 n P ref ( t ) P ref , m P ref , r 4
In the equation, S and K represent the skewness and kurtosis of the reference static pressure, respectively; Pref,m and Pref,r denote the mean value and root mean square (RMS) value of the reference static pressure, respectively; n is the number of sampling points.
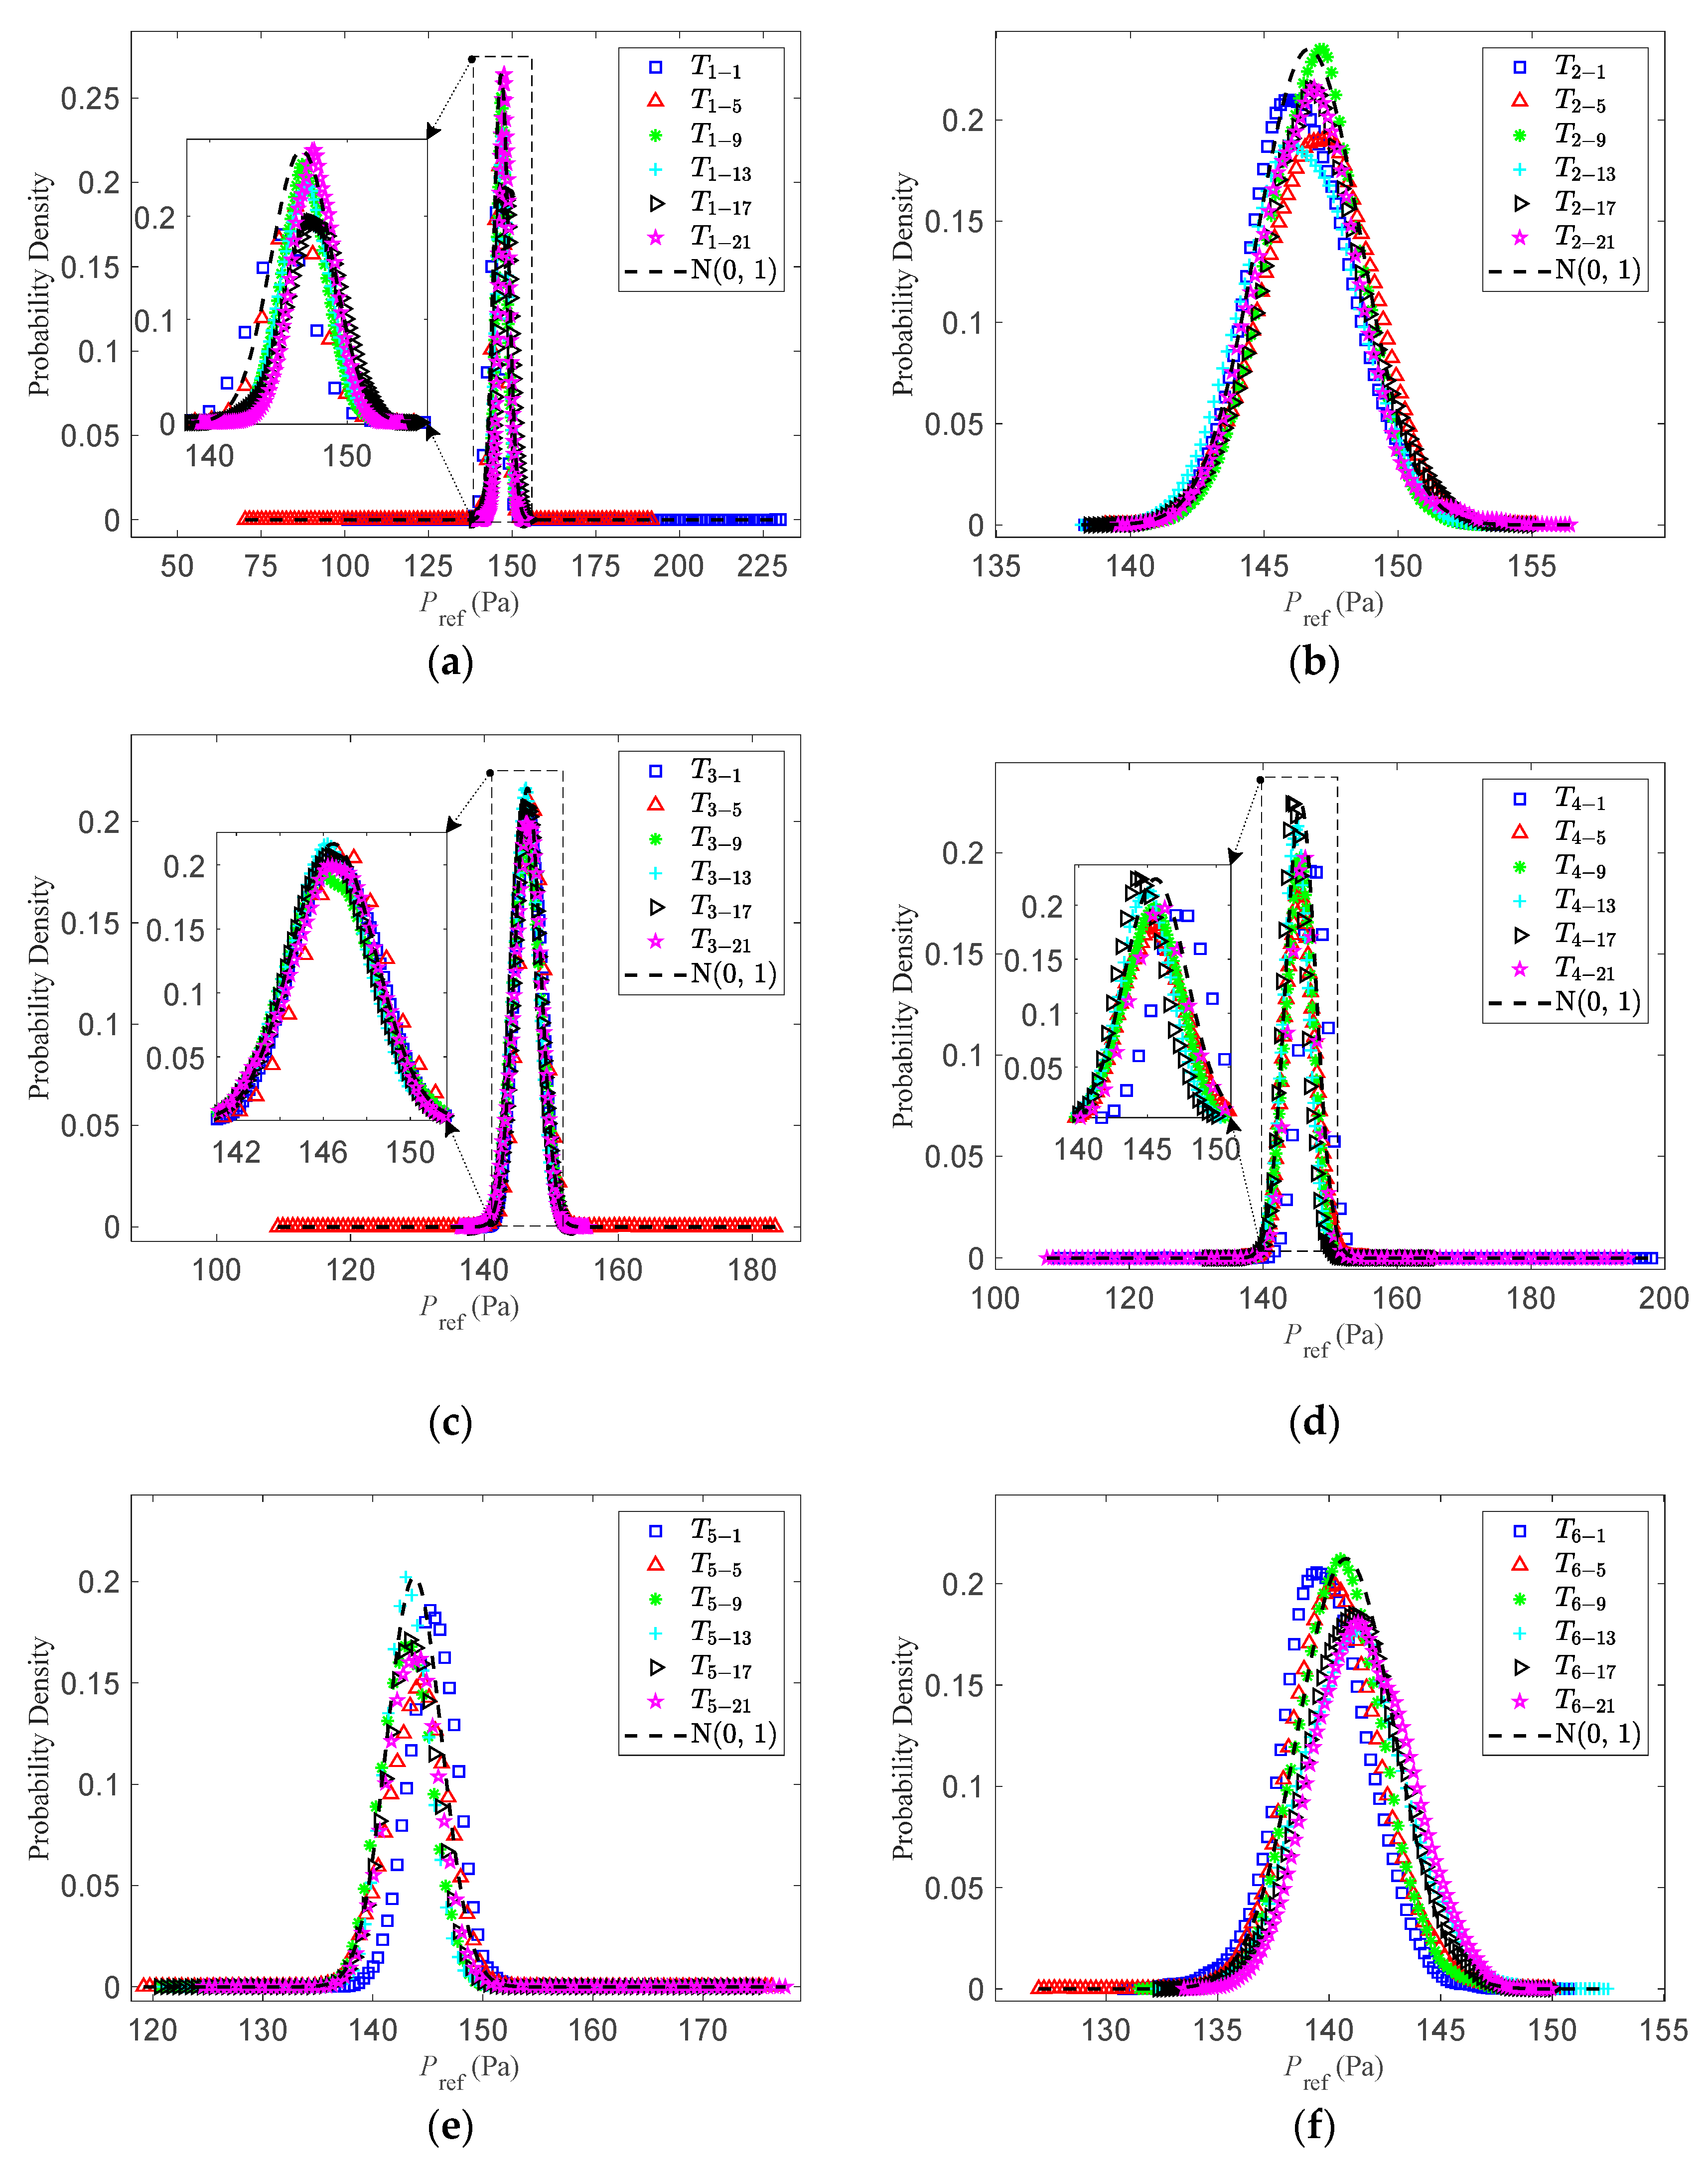
Figure 4 shows the probability density distribution of the reference static pressure at point P01 under temperatures T1T6 (26.8 °C, 27.8 °C, 28.9 °C, 29.4 °C, 31.0 °C, and 33.3 °C).
As shown in Figure 4a–f, the probability density distribution curves of the static pressure measurements under different temperature conditions nearly overlap and all approximately follow a Gaussian distribution. This indicates that the static pressure measurement conditions in this study were stable, the experimental method was reliable, and the data exhibited good repeatability and credibility. Among them, the samples collected under condition T2 (27.8 °C) were the most stable. The peak values of the reference static pressure probability density ranged from 0.151 (T5-5) to 0.264 (T1-21), suggesting good data concentration without significant dispersion or abnormal peaks, thereby reflecting the overall stability of the pressure measurement system.
In Figure 4a–f, most of the reference static pressure probability density distributions are approximately symmetrical, with fluctuations exhibiting typical random characteristics and no evident anomalies or skewness. However, in several samples shown in Figure 4a,c–e, the probability density distributions display leptokurtic characteristics (sharp peaks and heavy tails). In Figure 4a, for instance, the T1-1 and T1-5 samples show left and right tail ranges of 100.8–230.1 Pa and 70.4–191.6 Pa, respectively, with significantly extended tails, indicating a higher frequency of extremely high and low values in the time-series data. For the T1-1 sample, the extreme values on both tails deviate from the peak position by 44.4 Pa and 84.9 Pa, while for T1-5, the deviations are 75.8 Pa and 45.5 Pa, respectively, suggesting the presence of certain skewed disturbances in the reference static pressure. Although most measurements are concentrated near the probability density peak, occasional large deviations occur. This phenomenon may be attributed to the open nature of the inlet and outlet of the open-circuit wind tunnel, making it more susceptible to external airflow disturbances or to measurement errors generated during the experiment. These outliers, which deviate significantly from the main peak, may affect the accuracy of the wind pressure test results. Therefore, it is recommended to apply filtering techniques or repeat the measurements to reduce experimental errors.
Therefore, it is recommended that the wavelet soft-threshold denoising method be applied to the raw reference static pressure time histories with extreme values in practical wind tunnel measurements. This technique, which belongs to wavelet-based denoising, performs multilevel wavelet decomposition and applies soft-threshold processing to the high-frequency detail coefficients at each level. It can effectively suppress high-frequency noise and occasional spike disturbances while preserving the primary fluctuation characteristics of the reference static pressure signal to the greatest extent. In addition, to further assess measurement uncertainty and enhance data reliability, it is suggested to conduct no fewer than three (preferably 3–5) independent repeated measurements for key test conditions and report the mean, standard deviation, or confidence interval obtained from the repeated tests. All repeated measurements should be performed under consistent experimental conditions to avoid systematic biases affecting the final results.
Given the stochastic nature of the reference static pressure samples and the need to assess their Gaussianity, further investigation into the skewness and kurtosis of the reference static pressure time series is required. Theoretically, the skewness and kurtosis of a Gaussian distribution should be 0 and 3, respectively: positive skewness is reflected by values above 0, whereas values below 0 imply negative skewness; a kurtosis greater than 3 indicates a leptokurtic distribution, and less than 3 indicates a platykurtic distribution. In this study, the Gaussianity criterion for reference static pressure is set as: skewness between −0.5 and 0.5, and kurtosis between 2.5 and 3.5 [24]. Figure 5 shows the scatter plot of the skewness and kurtosis relationship of the reference static pressure at point P01 under different temperature conditions (T1T6: 26.8 °C, 27.8 °C, 28.9 °C, 29.4 °C, 31.0 °C, 33.3 °C). Since the specific numerical values cannot be directly read from the figure, the corresponding dataset is provided in Table A1 of Appendix A to more clearly show the variations in skewness and kurtosis under the different operating conditions (see Appendix A, Table A1).
In Figure 5, most of the data points have skewness and kurtosis values concentrated around 0 and 3, respectively. Statistical analysis shows that 92 groups of data, accounting for 73.1%, conform to a Gaussian distribution, indicating that the reference static pressure time-series data generally follow a normal distribution. A total of nine groups (7.1%) exhibit kurtosis values greater than 10, suggesting that these reference static pressure samples were likely influenced by external airflow disturbances from the open-circuit wind tunnel. Except for T2 and T6, a few samples under conditions T1, T3, T4, and T5 show relatively large skewness or kurtosis values—for instance, high kurtosis (K > 3.5) or significant skewness (S > 0.5 or S < −0.5). For these measurements, it is advisable to either filter out extreme outliers or repeat the experiments to reduce measurement errors.

4.2. Analysis of Reference Static Pressure Fluctuations

The time-history data of reference static pressure generally approximate a Gaussian distribution, though some individual measurement samples exhibit heavy-tailed characteristics and skewed distributions. To quantitatively assess the fluctuation level of the reference static pressure, this study employs sliding standard deviation and coefficient of variation for analysis (see Figure 6).
Due to space limitations, an equal interval sampling method was used, with six sample sets selected for analysis at each temperature (N = 1, 5, 9, 13, 17, 21). Figure 6 illustrates the sliding standard deviation of reference static pressure under different temperature conditions T1T6 (26.8 °C, 27.8 °C, 28.9 °C, 29.4 °C, 31.0 °C, 33.3 °C).
Figure 6 shows that the sliding standard deviation (SSD) of the reference static pressure measured under different conditions is mostly between 1 and 2, indicating relatively small fluctuations. This suggests that the reference static pressure time series is generally stable and the measurement data are highly reliable. However, some measurement sets exhibit a sharp increase in the SSD, particularly the T1-1, T1-5, T3-5, T4-1 and T4-21 samples, which show several points of significant fluctuation (SSD > 4). This indicates the presence of non-deterministic instability in the reference static pressure time series data during certain periods of the experiment.
As shown in Figure 6b,f, the reference static pressure under temperature conditions T2 and T6 exhibited good stability in terms of the sliding standard deviation. The average sliding standard deviations (SSDs) for all samples under these two temperature conditions were 1.25 Pa and 1.50 Pa, respectively, with the maximum value (2.2 Pa) occurring at 16.31 s in the T6-17 sample. Such fluctuations can be attributed solely to the influence of internal turbulence within the open-circuit wind tunnel. In contrast, more pronounced fluctuations were observed in the T1-1 and T1-5 samples. The T1-1 sample reached a peak of 6.72 Pa at 7.42 s, while the T1-5 sample peaked at 6.63 Pa at 1.21 s. These fluctuations are considered to result primarily from external atmospheric pressure disturbances acting on the open-circuit wind tunnel.
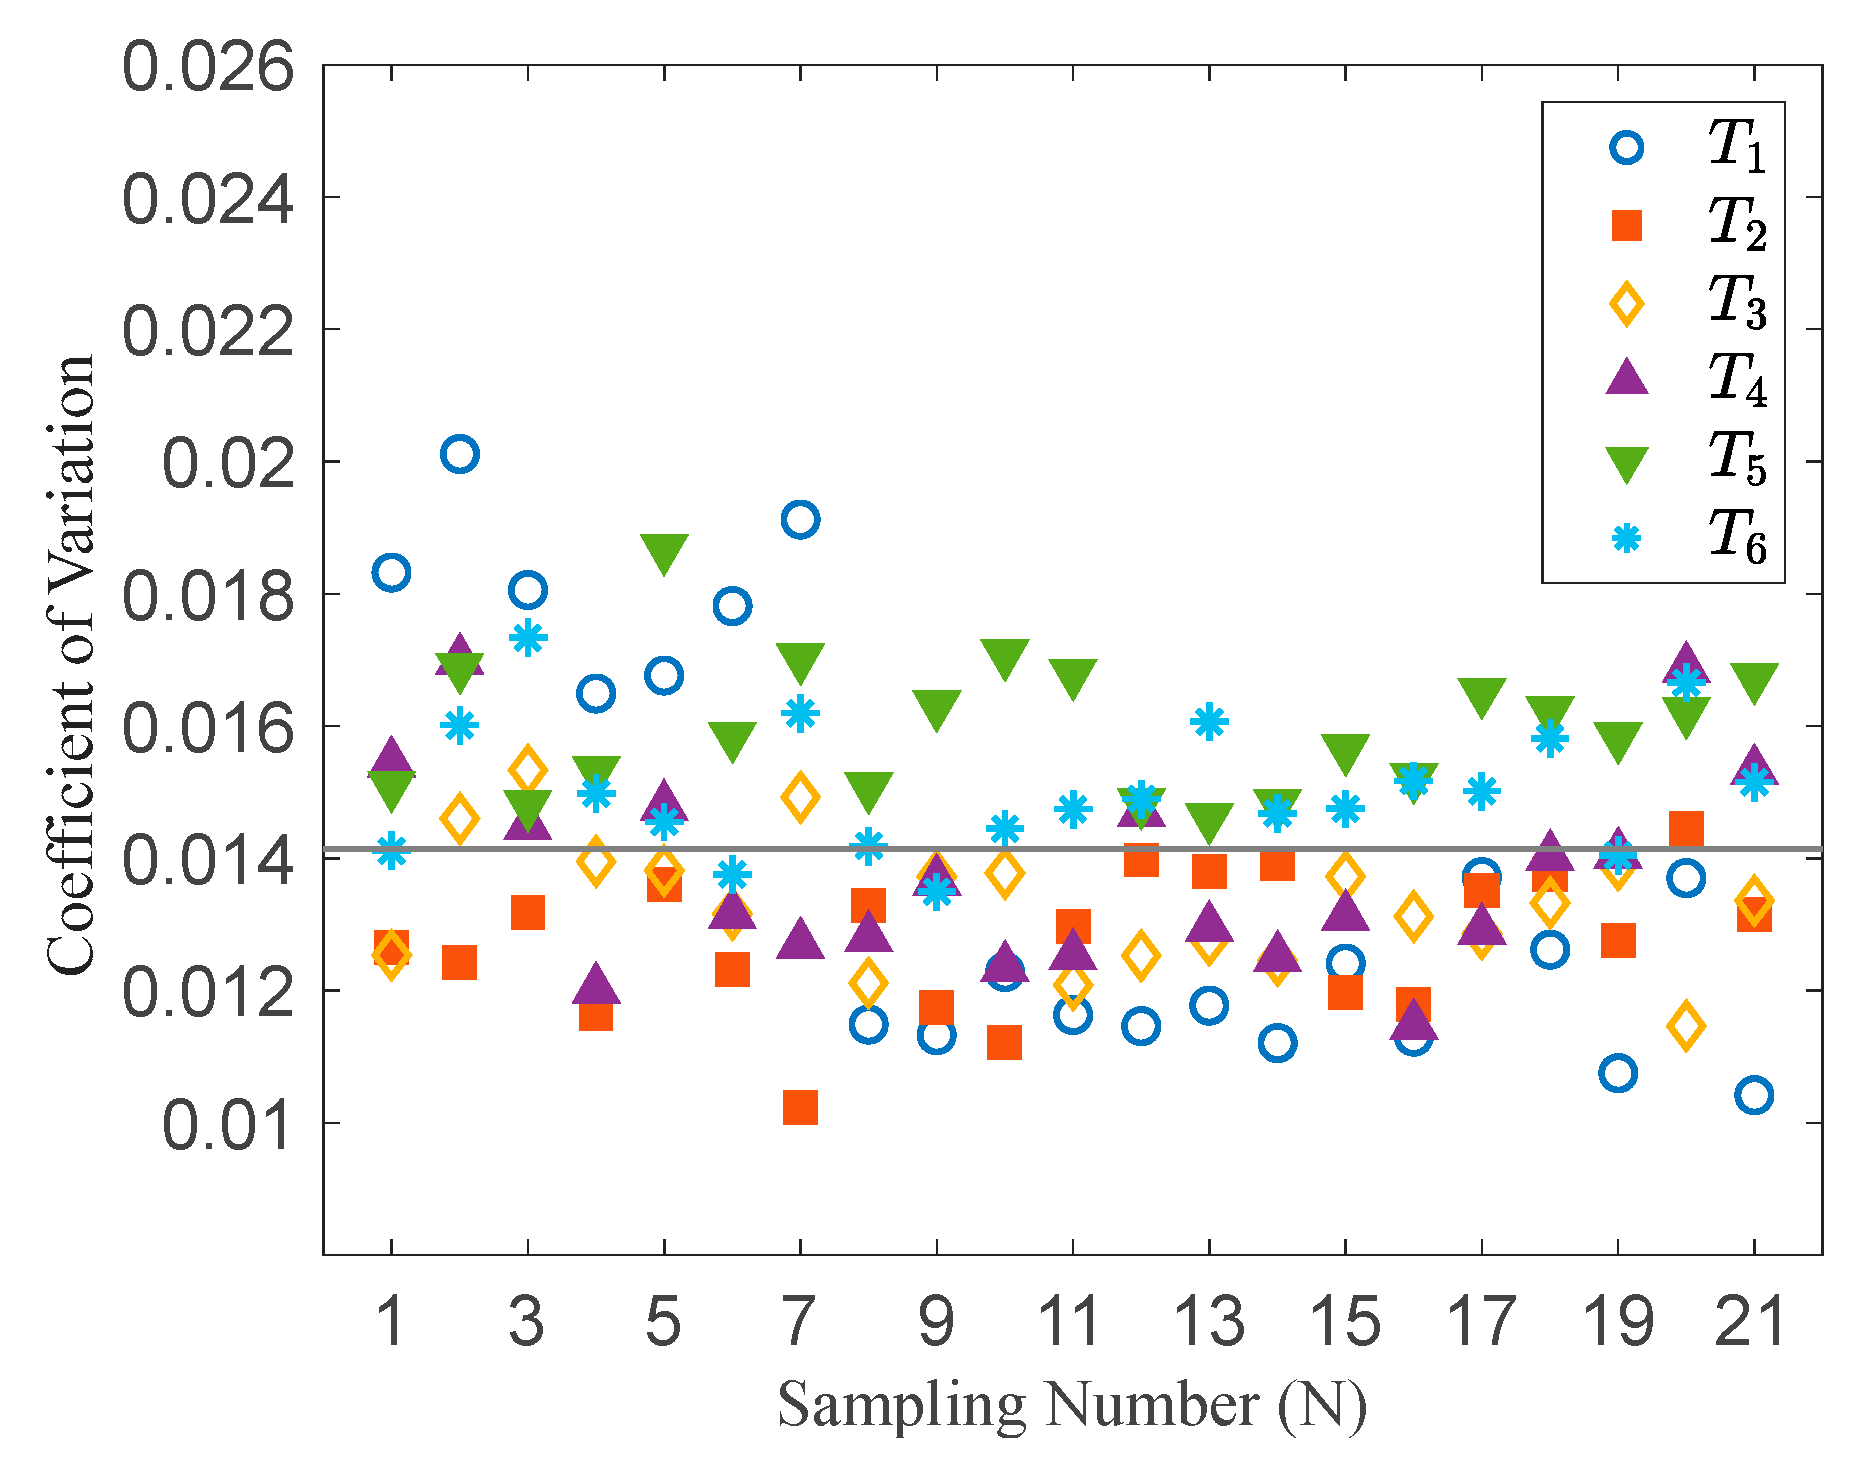
For a more intuitive and quantitative comparison of fluctuation characteristics and stability across different conditions, Figure 7 presents the coefficient of variation (CV) of reference static pressure under varying temperatures T1T6. The CV below 0.1 is commonly interpreted as an indication of low data variability [25]. Since the differences among the conditions in Figure 7 cannot be directly discerned, the corresponding data are provided in Table A2 of Appendix A for reference (see Appendix A, Table A2).
As shown in Figure 7, the coefficients of variation (CVs) are generally distributed within the range of 0.010 to 0.020, with an average value of 0.0141 (<0.1). This indicates that the dispersion of all reference static pressure time-history data remains at a low level, with small fluctuation amplitudes, reflecting good stability of the experimental data.
At temperature T1 condition, the coefficients of variation for the reference static pressure samples from N = 1 to N = 7 are generally higher, all exceeding 0.016, with the maximum reaching 0.0201 under T1-2. In contrast, subsequent samples exhibit relatively lower CVs, indicating that the stability of the reference static pressure time-history data varies under the same temperature condition, which should be considered in practical applications. Under temperature T2, the CVs are consistently lower and exhibit better stability, with most values falling below the overall mean line of 0.0141. Notably, the CV for the T2-2 sample is the lowest, at 0.0102, indicating that the data acquired at T2 show superior stability compared to other conditions and therefore hold greater reliability and reference value. In contrast, the CVs at temperatures T5 and T6 are mostly above the mean line, reflecting greater fluctuation in the reference static pressure. Meanwhile, the CVs at T3 and T4 are generally distributed around the mean line, showing moderate fluctuation.

5. Effect of Reference Static Pressure on Fluctuating Wind Pressure Coefficients

The stability of the reference static pressure has a certain influence on the calculated results of the wind pressure coefficient, particularly in the case of fluctuating wind pressure coefficients [26]. Furthermore, the analysis in Chapter 4 indicates that the reference static pressure measured under the T2 temperature condition exhibits higher reliability and reference value. Therefore, this study investigates the influence of reference static pressure on the fluctuating wind pressure coefficients of flat-roof low-rise buildings based on wind tunnel tests conducted at T2 (27.8 °C) (see Figure 1a). The fluctuating wind pressure coefficient is given in Equations (3) and (4). Six sets of reference static pressure samples (sample numbers N = 1, 5, 9, 13, 17, 21) were selected under temperature T2. Based on the reference wind speed shown in Figure 1b, a value of 8.6 m/s was chosen to calculate the fluctuating wind pressure coefficients on the roof of a low-rise flat-roofed building. The following method was used for quantitative analysis: (1) contour maps of the fluctuating wind pressure coefficient distribution on the roof were plotted; (2) a comparative analysis of the fluctuating wind pressure coefficients for Roof Zones I–VIII was conducted to reveal the error characteristics induced by reference static pressure variations. Due to space limitations, this study focuses only on the fluctuating wind pressure coefficients on the flat roof of a low-rise building under Category B wind terrain conditions at a 0° wind direction.
C ~ P i = σ p i 0.5 ρ U 2
σ p i = 1 N t = 1 N [ p ( t ) p ¯ ] 2
In the equation, N is the total number of sampled time steps; p(t) denotes the instantaneous wind pressure at time t; p ¯ represents the mean wind pressure at the corresponding measurement point; σ p i is the root-mean-square (RMS) value of the fluctuating wind pressure; ρ is the air density; and U denotes the reference wind speed.

5.1. Contour Maps of Fluctuating Wind Pressure Coefficients

From Figure 8, under the 0° wind direction and T2 temperature condition, the roof fluctuating wind pressure coefficients obtained from the 6 reference static pressure samples are overall similar in both distribution pattern and value. This indicates that the fluctuation of reference static pressure under the same temperature condition has minimal influence on the fluctuating wind pressure coefficients. The fluctuating wind pressure coefficients exhibit a decreasing trend from the windward side to the leeward side of the roof. Moreover, higher values are observed near the corner regions of the windward side, primarily due to the effects of vortex separation, shedding, and reattachment of the airflow, which generate conical and columnar vortices [27]. The contour lines of the fluctuating wind pressure coefficients predominantly range between 0.1 and 0.26. Among them, samples T2-5, T2-17, and T2-21 exhibit slightly higher values, while T2-1 shows relatively lower coefficients. These results demonstrate that the fluctuating wind pressure data calculated based on reference static pressures from different samples maintain overall stability; however, slight discrepancies still exist.

5.2. Fluctuating Wind Pressure Coefficients for Different Roof Zones

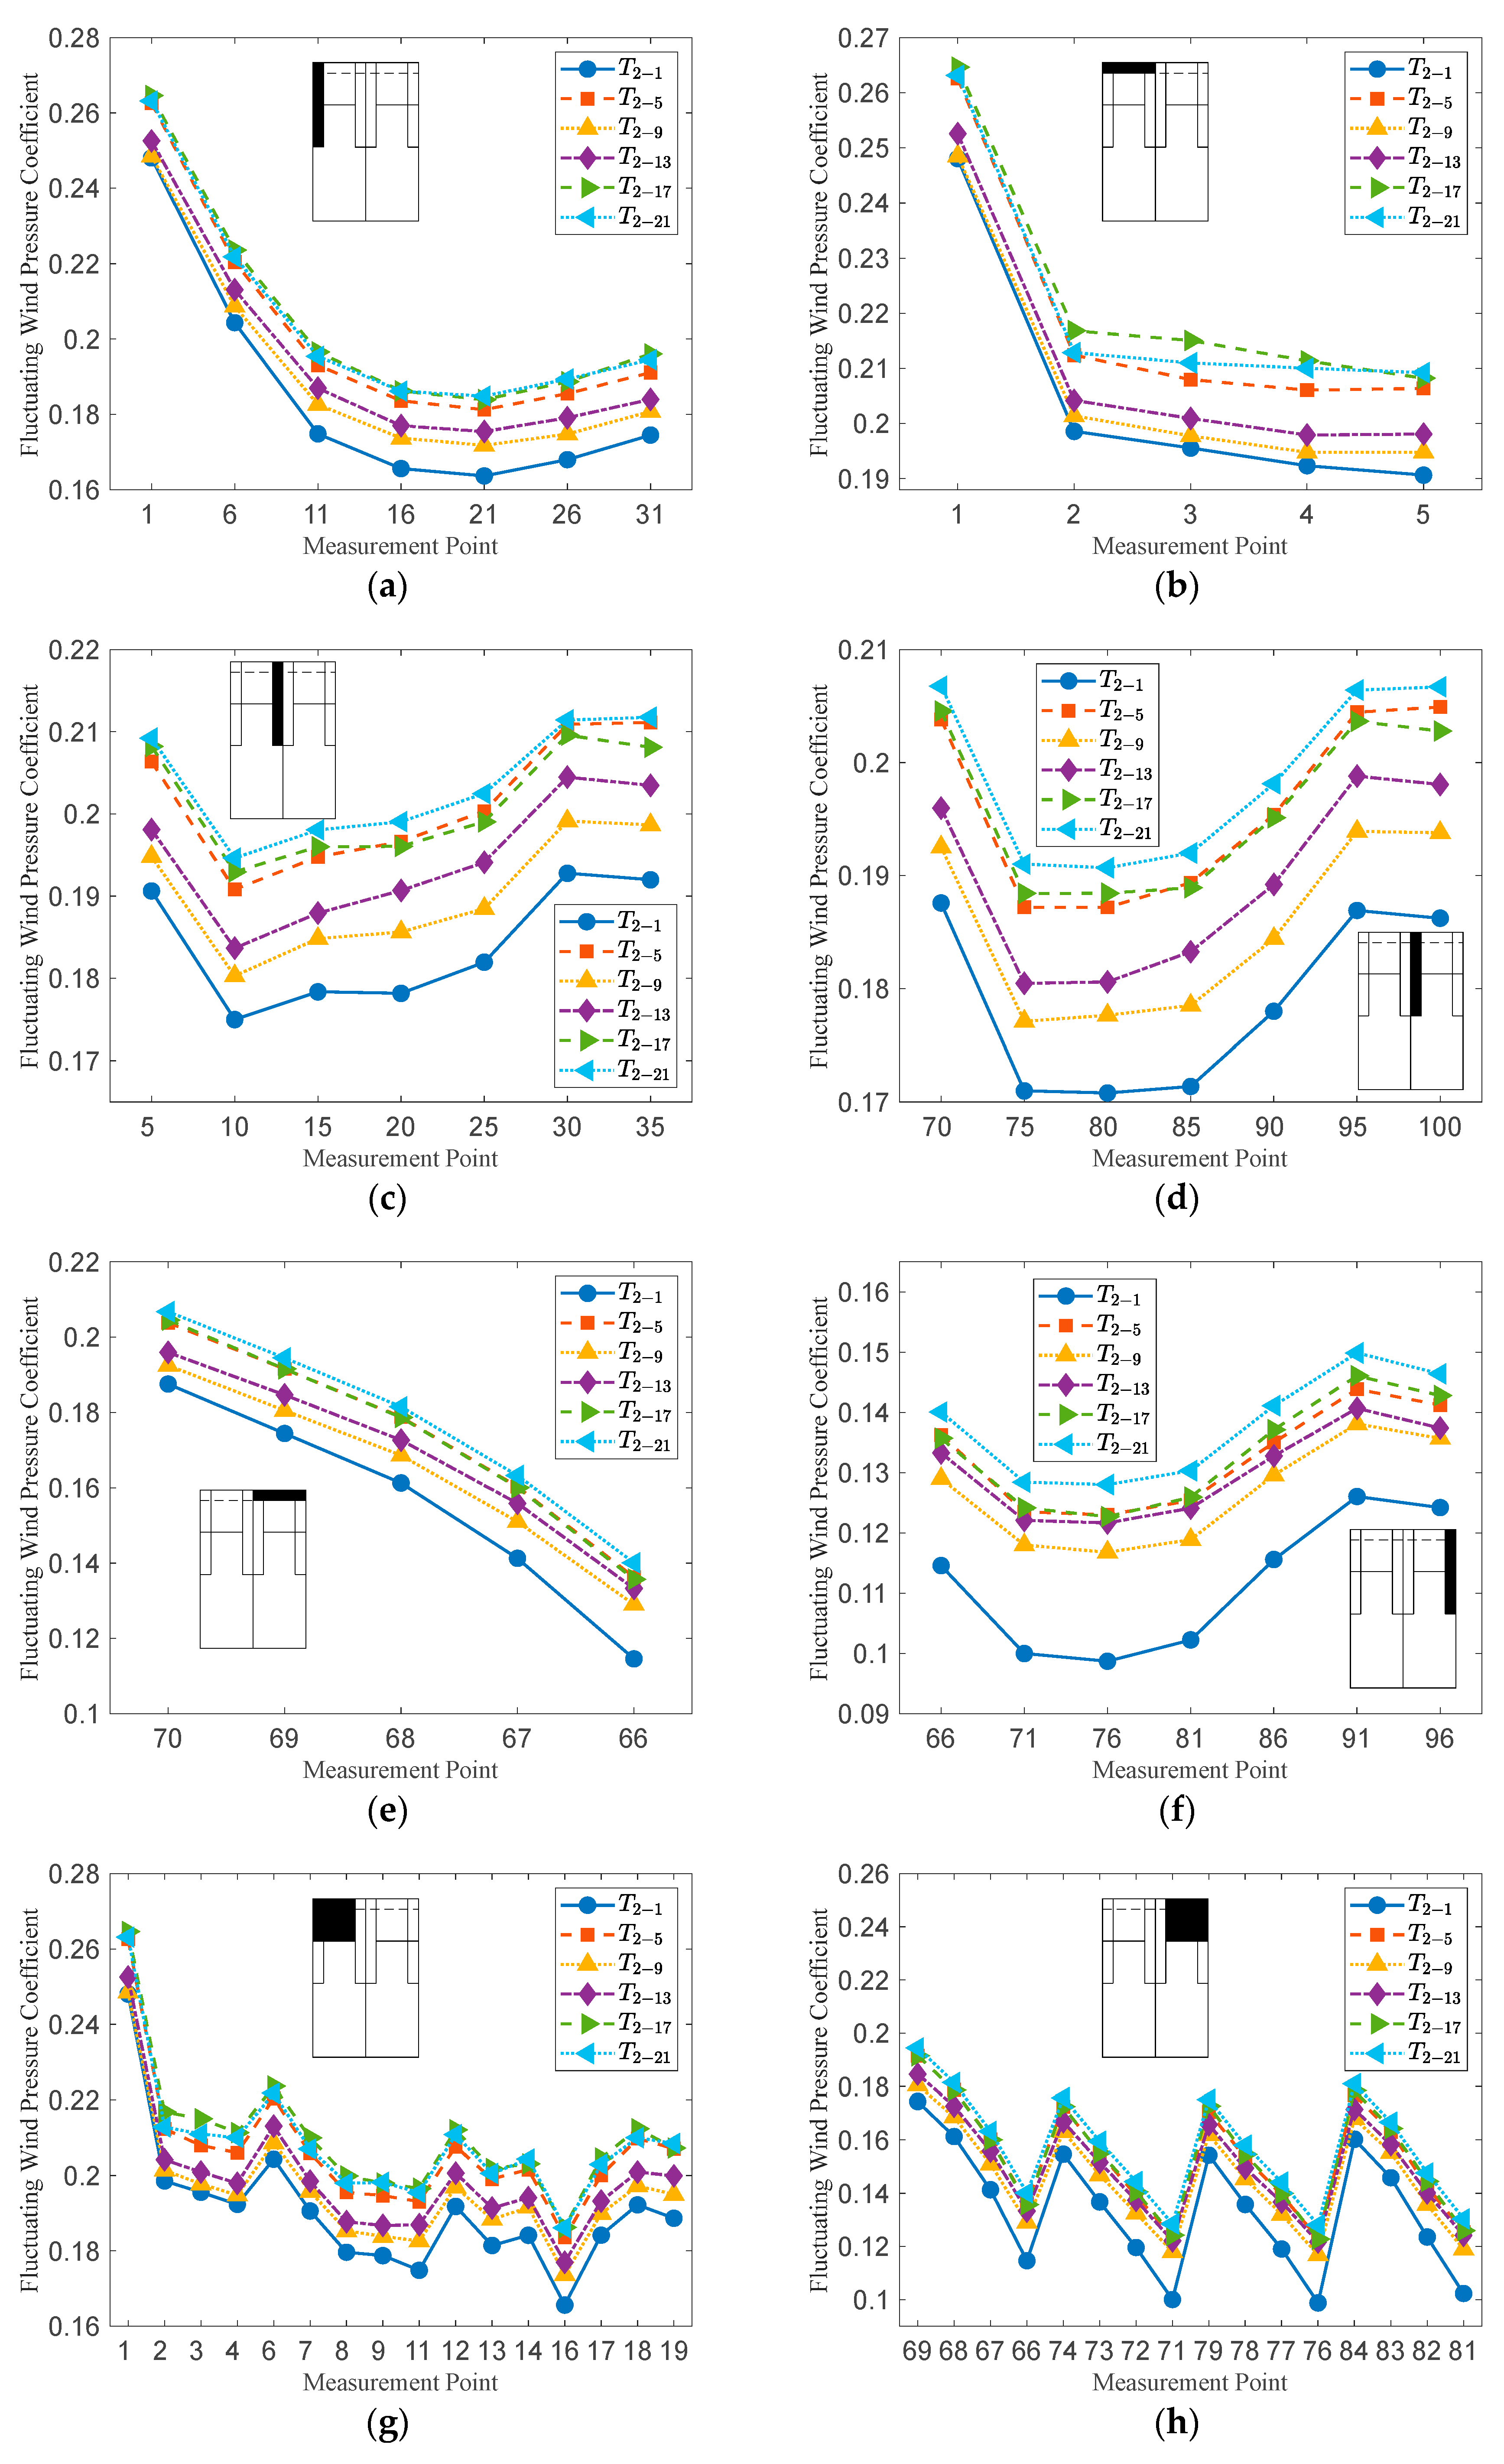
To provide a more intuitive analysis of the influence of different reference static pressure samples on fluctuating wind pressure coefficients, this study performs a comparative analysis of the fluctuating wind pressure coefficients at each measurement point in Zones I to VIII on the roof of the low-rise building (see Figure 9), roof Zones I to VIII include the eaves regions I and VI, gable regions II and V, ridge regions III and IV, and corner regions VII and VIII (see Figure 2). The mean relative error (MRE) was used to evaluate the differences in fluctuating wind pressure coefficients calculated using 6 sets of reference static pressure samples at temperature T2 (see Figure 10), The definition of MRE is as follows:
MRE = 1 n 1 n C ~ P i C ~ p i , m C ~ p i , m
In the equation, n is the total number of data points in each zone; C ˜ P i represents the fluctuating wind pressure coefficient at the i-th measurement point; and C ˜ p i , m denotes the mean fluctuating wind pressure coefficient for all measurement points in the corresponding zone.
Figure 9a–h show that under a wind direction of 0° and temperature T2, the fluctuating wind pressure coefficients in each zone, calculated from six sets of reference static pressure samples, exhibit similar trends, with only minor linear differences between them. Among these, the fluctuating wind pressure coefficients under the T2-21 and T2-17 samples are relatively higher. Except for zones II of the windward gable and VII of the windward corner, where the T2-17 sample slightly exceeds T2-21, the coefficients in all other zones are higher for T2-21. Meanwhile, the values for T2-13, T2-9, and T2-1 decrease successively. The difference in fluctuating wind pressure coefficients between the T2-21 and T2-1 samples in each figure is approximately 0.02. This indicates that although different reference static pressure samples do not alter the distribution trends of the fluctuating wind pressure coefficients, they can cause a slight overall shift in magnitude.
Figure 10 presents the distribution of the mean relative error (MRE) of fluctuating wind pressure coefficients for Roof Zones I–VIII at a 0° wind angle. The average MRE across Zones I–VIII is 3.71%, which is generally acceptable [28,29], indicating that the fluctuating wind pressure coefficients calculated using different reference static pressure samples exhibit good consistency. The lowest MRE is observed in the leeward gable region (Zone II) at 3.16%, while the MRE in the leeward eave region (Zone VI) (5.06%) and the leeward corner region (Zone VIII) (4.35%) are relatively higher. For such high-error regions, repeated measurements or increased measurement point density could be considered to enhance data accuracy, thereby improving the precision of engineering wind load analysis.
It should be noted that the error analysis in this study was conducted only for the case of a 0° wind direction. As the wind direction changes, flow separation, recirculation, and roof pressure distributions around the building may vary significantly, and the locations and magnitudes of high-error regions may also differ. Therefore, the applicability of the present findings to other wind directions should be interpreted with caution. Future work could consider repeating measurements at different wind directions or increasing the measurement point density in high-error regions to more comprehensively assess the effect of reference static pressure on the calculation of fluctuating wind pressure coefficients, thereby improving the reliability of engineering wind load analyses.

6. Conclusions

(1)
In open-circuit wind tunnels, the reference static pressure exhibits a decreasing trend with increasing temperature. The main reason for this is that higher temperatures lead to a decrease in gas density and an increase in fluid diffusivity, which in turn causes a reduction in static pressure. Under the same temperature conditions, small fluctuations are observed in the reference static pressure measurements. Specifically, when the sampling numbers are N = 1 to 4, the data fluctuation is relatively larger. This is due to the initial stage of the experiment, where the reference static pressure is more susceptible to external airflow interference; after approximately 5 min of test operation, the reference static pressure values stabilize.
(2)
The probability density of reference static pressure under different conditions generally resembles a Gaussian distribution, with the measurements at temperature T2 being the most stable. For individual samples under temperatures T1T6, the probability density distributions exhibit leptokurtic characteristics and certain skewed disturbances. This phenomenon can be attributed to the influence of external airflow on the inlet and outlet of the open-circuit wind tunnel. Such leptokurtic features and skewed disturbances may affect the accuracy of wind pressure data processing. It is therefore recommended to apply filtering techniques or repeat the measurements to reduce experimental errors.
(3)
Under different temperature conditions, the SSD of the reference static pressure from multiple measurements is mostly within the range of 1 to 2 Pa, and the CV is generally distributed between 1% and 2%. This indicates that the time-history data of the reference static pressure exhibit low dispersion and minor fluctuations, demonstrating favorable overall stability. However, a sudden increase in SSD was observed in some measurement groups, and this phenomenon appeared to occur randomly. It is worth noting that the data stability under the T2 temperature condition is superior to that under other conditions, demonstrating higher reliability and reference value.
(4)
At a wind direction angle of 0°, the distribution patterns and magnitudes of the fluctuating wind pressure coefficients across the 6 test samples at T2 temperature were generally consistent, exhibiting only minor linear variations between them. The average MER of the fluctuating wind pressure coefficients in Roof Zones I–VIII was 3.71%, which falls within an acceptable range; this deviation primarily stems from systematic errors induced by the structural characteristics of the open-circuit wind tunnel. Notably, higher error rates were observed in Zone VI (leeward eave) and Zone VIII (leeward corner); for such high-error regions, increasing the number of measurements or enhancing the density of measurement points could be considered to improve data accuracy, thereby enhancing the reliability of engineering wind load analyses.

Author Contributions

Conceptualization, M.Y. and E.W.; methodology, M.Y.; software, M.Y.; validation, M.Y., E.W. and I.-S.Y.; formal analysis, M.Y.; investigation, M.Y.; resources, E.W.; data curation, M.Y.; writing—original draft preparation, M.Y.; writing—review and editing, E.W. and I.-S.Y.; visualization, M.Y.; supervision, E.W.; project administration, E.W.; funding acquisition, E.W. All authors have read and agreed to the published version of the manuscript.

Funding

This research was funded by the Middle-aged and Young Teachers’ Basic Ability Promotion Project of Guangxi, grant number (Project No. 2024KY0758).

Data Availability Statement

Data are contained within the article. Additional data are available from the corresponding author upon reasonable request.

Acknowledgments

The wind tunnel tests for this study were conducted at the Wind Engineering Research Center of Hunan University of Science and Technology. The authors gratefully acknowledge the Center for providing the experimental facilities and technical support.

Conflicts of Interest

The authors declare no conflicts of interest.

Abbreviations

The following abbreviations are used in this manuscript:
RMSroot mean square
SSDsliding standard deviation
KDEkernel density estimation
CVcoefficient of variation
MREmean relative error

Appendix A

Table A1. Numerical Values of Kurtosis and Skewness of Reference Static Pressure under Different Temperature Conditions.
Sampling Number (N)T1 (26.8 °C)T2 (27.8 °C)T3 (28.9 °C)T4 (29.4 °C)T5 (31.0 °C)T6 (33.3 °C)
SKSKSKSKSKSK
12.8713.780.162.960.022.710.405.080.043.86−0.013.49
21.9214.160.082.810.403.43−0.6911.200.313.330.053.03
3−2.576.690.142.950.143.030.807.300.649.72−0.043.25
40.408.760.433.64−0.233.070.083.200.149.500.083.55
5−2.2713.38−0.082.79−0.2411.540.182.94−0.223.230.203.31
62.6914.51−0.092.870.032.840.162.940.203.590.003.48
73.0111.980.143.030.473.110.032.780.203.360.023.08
80.013.130.262.81−0.143.05−0.243.32−0.183.350.194.02
9−0.053.11−0.122.980.002.85−0.102.80−0.033.260.123.19
100.022.74−0.142.90−0.092.860.012.98−0.024.980.233.14
110.103.020.082.810.042.80−0.012.870.603.990.063.06
120.072.95−0.392.87−0.072.98−0.162.910.488.42−0.222.91
130.063.000.002.750.003.08−0.043.170.8011.200.172.97
140.063.15−0.363.19−0.042.890.043.11−0.223.83−0.112.91
15−0.082.80−0.032.840.112.910.072.99−0.343.67−0.032.84
160.253.16−0.042.82−0.133.43−0.233.03−0.093.390.303.00
17−0.143.110.093.14−0.012.960.743.650.557.320.002.99
180.172.830.312.860.002.930.408.80−0.113.190.273.20
190.193.16−0.042.800.183.072.994.33−0.084.120.143.02
200.142.550.413.090.113.091.793.980.104.40−0.032.72
21−0.103.130.243.52−0.223.020.4513.760.354.650.092.71
Table A2. Data Table of the Coefficient of Variation of Reference Static Pressure under Different Temperature Conditions.
Sampling Number (N)Coefficient of Variation
T1 (26.8 °C)T2 (27.8 °C)T3 (28.9 °C)T4 (29.4 °C)T5 (31.0 °C)T6 (33.3 °C)
10.0180.0130.0130.0150.0150.014
20.0200.0120.0150.0170.0170.016
30.0180.0130.0150.0140.0150.017
40.0160.0120.0140.0120.0150.015
50.0170.0140.0140.0150.0190.015
60.0180.0120.0130.0130.0160.014
70.0190.0100.0150.0130.0170.016
80.0110.0130.0120.0130.0150.014
90.0110.0120.0140.0140.0160.013
100.0120.0110.0140.0120.0170.014
110.0120.0130.0120.0130.0170.015
120.0110.0140.0130.0150.0150.015
130.0120.0140.0130.0130.0150.016
140.0110.0140.0120.0120.0150.015
150.0120.0120.0140.0130.0160.015
160.0110.0120.0130.0110.0150.015
170.0140.0140.0130.0130.0170.015
180.0130.0140.0130.0140.0160.016
190.0110.0130.0140.0140.0160.014
200.0140.0140.0110.0170.0160.017
210.0100.0130.0130.0150.0170.015

References

  1. Khaled, M.F.; Aly, A.M. Assessing aerodynamic loads on low-rise buildings considering Reynolds number and turbulence effects: A review. Adv. Aerodyn. 2022, 4, 24. [Google Scholar] [CrossRef]
  2. Picozzi, V. The Relationship between Wind Pressure and Building Surface Aerodynamics: Review of Wind Tunnel and CFD Studies. Buildings 2022, 12, 225. [Google Scholar] [CrossRef]
  3. Jiménez-Portaz, M.; Chiapponi, L.; Clavero, M.; Losada, M.A. Air flow quality analysis of an open-circuit boundary layer wind tunnel and comparison with a closed-circuit wind tunnel. Phys. Fluids 2020, 32, 125120. [Google Scholar] [CrossRef]
  4. Wei, Y.; Zhou, P.; Fang, Y.; Guo, J.; Zhong, S.; Zhang, X.; Huang, X.; Zhou, G.; Chen, B. Design and characterization of a multifunctional low-speed anechoic wind tunnel at HKUST. Aerosp. Sci. Technol. 2021, 115, 106814. [Google Scholar] [CrossRef]
  5. Gol-Zaroudi, H.; Aly, A.M. Open-jet boundary-layer processes for aerodynamic testing of low-rise buildings. Wind Struct. 2017, 25, 233–259. [Google Scholar]
  6. Zhu, Y.; Zhou, X.; Chen, Y.; Ma, C.; Wang, L.; Zheng, C.; Yan, B. Comparison of aerodynamic effects on the CAARC tall building model tested in two wind tunnel laboratories. Appl. Sci. 2025, 15, 811. [Google Scholar] [CrossRef]
  7. Richards, P.J.; Hoxey, R.P. Pressures on a cubic building—Part 1: Full-scale results. J. Wind Eng. Ind. Aerodyn. 2012, 102, 72–86. [Google Scholar] [CrossRef]
  8. Richards, P.J.; Hoxey, R.P. Pressures on a cubic building—Part 2: Quasi-steady and other processes. J. Wind Eng. Ind. Aerodyn. 2012, 102, 87–96. [Google Scholar] [CrossRef]
  9. Lamberti, G.; Amerio, L.; Pomaranzi, G.; Zasso, A.; Gorlé, C. Comparison of high resolution pressure measurements on a high-rise building in a closed and open-section wind tunnel. J. Wind Eng. Ind. Aerodyn. 2020, 204, 104247. [Google Scholar] [CrossRef]
  10. He, Y.C.; Cheung, J.C.K.; Li, Q.S.; Fu, J.Y. Accurate determination of reference wind speed and reference static pressure in wind tunnel tests. Adv. Struct. Eng. 2020, 23, 531–546. [Google Scholar] [CrossRef]
  11. Dalley, S.; Richardson, G. Reference static pressure measurements in wind tunnels. J. Wind Eng. Ind. Aerodyn. 1992, 42, 909–920. [Google Scholar] [CrossRef]
  12. Liberzon, D.; Shemer, L. An inexpensive method for measurements of static pressure fluctuations. J. Atmos. Ocean. Technol. 2010, 27, 776–784. [Google Scholar] [CrossRef]
  13. Nijhof, B.; Wickern, G. Reference static and dynamic pressures in automotive wind tunnels. SAE Trans. 2003, 112, 341–355. [Google Scholar]
  14. Grossir, G.; Van Hove, B.; Paris, S.; Rambaud, P.; Chazot, O. Free-stream static pressure measurements in the Longshot hypersonic wind tunnel and sensitivity analysis. Exp. Fluids 2016, 57, 64. [Google Scholar] [CrossRef]
  15. Voznyak, O.; Dovbush, O.; Kapalo, P.; Adamski, M.; Domnita, F.; Bacotiu, C. Frontal resistance coefficient of the buses with the different ventilation equipment. Eng. Rev. 2021, 41, 15–25. [Google Scholar] [CrossRef]
  16. Zhelykh, V.; Ulewicz, M.; Furdas, Y.; Adamski, M.; Rebman, M. Investigation of Pressure Coefficient Distribution on the Surface of a Modular Building. Energies 2022, 15, 4644. [Google Scholar] [CrossRef]
  17. Jin, L.; Deng, X.B.; Wang, X.; Zhang, J.; Zeng, W. Suppression Methods for Low-Frequency Pressure Fluctuations in Open-Jet Wind Tunnels. Appl. Sci. 2023, 13, 10808. [Google Scholar] [CrossRef]
  18. Cheng, X.X.; Zhao, L.; Ke, S.T.; Ge, Y.J. A new research scheme for full-scale/model test comparisons to validate the traditional wind tunnel pressure measurement technique. Appl. Sci. 2022, 12, 12847. [Google Scholar] [CrossRef]
  19. Holmes, J.D. Wind Loading of Structures, 2nd ed.; CRC Press: London, UK, 2007. [Google Scholar]
  20. Pan, Y.; Niu, B.; Yang, Z. Research on the distribution characteristics of static pressure in data centers from the perspective of airflow transmission path. J. Build. Eng. 2024, 87, 108557. [Google Scholar] [CrossRef]
  21. Sun, C.; Shi, C.; Zhu, Z.; Lin, H.; Li, Z.; Du, F.; Cao, Z.; Lu, P.; Liu, L. Overburden failure characteristics and fracture evolution rule under repeated mining with multiple key strata control. Sci. Rep. 2025, 15, 28029. [Google Scholar] [CrossRef] [PubMed]
  22. Zhong, M.; Wang, C.; Lin, M.; Lu, J.; Wang, X. An Investigation into the Distribution of Fluctuating Wind Pressure and Associated Probabilistic Characteristics of Low-Rise Buildings Impacted by the Gap between the Hillside and the Building. Buildings 2024, 14, 1435. [Google Scholar] [CrossRef]
  23. Cao, Z.; Xiong, Y.; Xue, Y.; Du, F.; Li, Z.; Huang, C.; Wang, S.; Yu, Y.; Wang, W.; Zhai, M.; et al. Diffusion Evolution Rules of Grouting Slurry in Mining-induced Cracks in Overlying Strata. Rock Mech. Rock Eng. 2025, 58, 6493–6512. [Google Scholar] [CrossRef]
  24. Montgomery, D.C.; Runger, G.C. Applied Statistics and Probability for Engineers, 7th ed.; John Wiley: New York, NY, USA, 2019. [Google Scholar]
  25. Zhou, Y.; Kareem, A. Gust loading factor: New model. J. Struct. Eng. 2001, 127, 168–175. [Google Scholar] [CrossRef]
  26. Cheon, D.-J.; Kim, Y.-C.; Lee, J.-H.; Yoon, S.-W. Fluctuating wind pressure characteristics of dome roofs with low rise-span ratio. Buildings 2023, 13, 1673. [Google Scholar] [CrossRef]
  27. Chen, F.; Kang, W.; Shu, Z.; Li, Q.; Li, Y.; Chen, Y.F.; Zhou, K. Predicting roof-surface wind pressure induced by conical vortex using a BP neural network combined with POD. Build. Simul. 2022, 15, 1475–1490. [Google Scholar] [CrossRef]
  28. Bre, F.; Gimenez, J.M.; Fachinotti, V.D. Prediction of wind pressure coefficients on building surfaces using artificial neural networks. Energy Build. 2018, 158, 1429–1441. [Google Scholar] [CrossRef]
  29. Ye, T.; Zhu, L.; Tan, Z. Numerical statistic approach for peak factor of non-Gaussian wind pressure on building claddings. Adv. Civ. Eng. 2021, 2021, 2918656. [Google Scholar] [CrossRef]
Figure 1. Test setup for reference static pressure and model wind pressure measurements: (a) Test setup for reference static pressure and model wind pressure measurements; (b) profiles of mean wind speed and turbulence intensity.
Buildings 15 04208 g001
Figure 2. Detailed design of the rigid model: (a) Scaled model of a low-rise building with a flat roof; (b) roof pressure tap arrangement and zonal division.
Buildings 15 04208 g002
Figure 3. Measured reference static pressure at point P01 for temperature cases T1T6.
Buildings 15 04208 g003
Figure 4. Probability density distribution of reference static pressure at different temperatures: (a) T1 (26.8 °C); (b) T2 (27.8 °C); (c) T3 (28.9 °C); (d) T4 (29.4 °C); (e) T5 (31 °C); (f) T6 (33.3 °C).
Buildings 15 04208 g004
Figure 5. Kurtosis and skewness of reference static pressure under different temperatures.
Buildings 15 04208 g005
Figure 6. Sliding Standard Deviation of Reference Static Pressure under Different Temperature Conditions: (a) T1 (26.8 °C); (b) T2 (27.8 °C); (c) T3 (28.9 °C); (d) T4 (29.4 °C); (e) T5 (31 °C); (f) T6 (33.3 °C).
Buildings 15 04208 g006aBuildings 15 04208 g006b
Figure 7. Coefficient of Variation of Reference Static Pressure under Different Temperature Conditions.
Buildings 15 04208 g007
Figure 8. Contour plots of fluctuating wind pressure coefficients on roof surface at 0° wind angle sliding: (a) T2-1 (N = 1); (b) T2-5 (N = 5); (c) T2-9 (N = 9); (d) T2-13 (N = 13); (e) T2-17 (N = 17); (f) T2-21 (N = 21).
Buildings 15 04208 g008aBuildings 15 04208 g008b
Figure 9. Fluctuating Wind Pressure Coefficient Distribution in Zones Ⅰ–Ⅷ under 0° Wind Direction: (a) Zone I (windward eave area); (b) Zone II (windward gable area); (c) Zone III (windward ridge area); (d) Zone IV (leeward ridge area); (e) Zone V (leeward gable area); (f) Zone VI (leeward eave area); (g) Zone VII (windward corner area); (h) Zone VIII (leeward corner area).
Buildings 15 04208 g009
Figure 10. The mean relative error (MRE) of the fluctuating pressure coefficients in zones I–VIII under a 0° wind direction angle.
Buildings 15 04208 g010
Table 1. Test conditions for reference static pressure measurements at varying temperatures.
Terrain TypeWind Field Scale RatioMeasurement Height (cm)Sampling Number (N)Temperature (°C)
Category B1:2040with 21 measurements per temperature case T1T6 (T1-1~T1-21, T2-1~T2-21, T3-1~T3-21, T4-1~T4-21, T5-1~T5-21, T6-1~T6-21)T1~T6 (26.8 °C, 27.8 °C, 28.9 °C, 29.4 °C, 31.0 °C, 33.3 °C)
Disclaimer/Publisher’s Note: The statements, opinions and data contained in all publications are solely those of the individual author(s) and contributor(s) and not of MDPI and/or the editor(s). MDPI and/or the editor(s) disclaim responsibility for any injury to people or property resulting from any ideas, methods, instructions or products referred to in the content.