Reference Static Pressure Effect on Fluctuating Wind Pressure on Roofs of Low-Rise Buildings in Open-Circuit Wind Tunnels
Abstract
1. Introduction
2. Wind Tunnel Experimental Overview
3. Reference Static Pressure Test Value Patterns
4. Stability Analysis of Reference Static Pressure
4.1. Probability Density Distribution of the Reference Static Pressure Time History
4.2. Analysis of Reference Static Pressure Fluctuations
5. Effect of Reference Static Pressure on Fluctuating Wind Pressure Coefficients
5.1. Contour Maps of Fluctuating Wind Pressure Coefficients
5.2. Fluctuating Wind Pressure Coefficients for Different Roof Zones
6. Conclusions
- (1)
- In open-circuit wind tunnels, the reference static pressure exhibits a decreasing trend with increasing temperature. The main reason for this is that higher temperatures lead to a decrease in gas density and an increase in fluid diffusivity, which in turn causes a reduction in static pressure. Under the same temperature conditions, small fluctuations are observed in the reference static pressure measurements. Specifically, when the sampling numbers are N = 1 to 4, the data fluctuation is relatively larger. This is due to the initial stage of the experiment, where the reference static pressure is more susceptible to external airflow interference; after approximately 5 min of test operation, the reference static pressure values stabilize.
- (2)
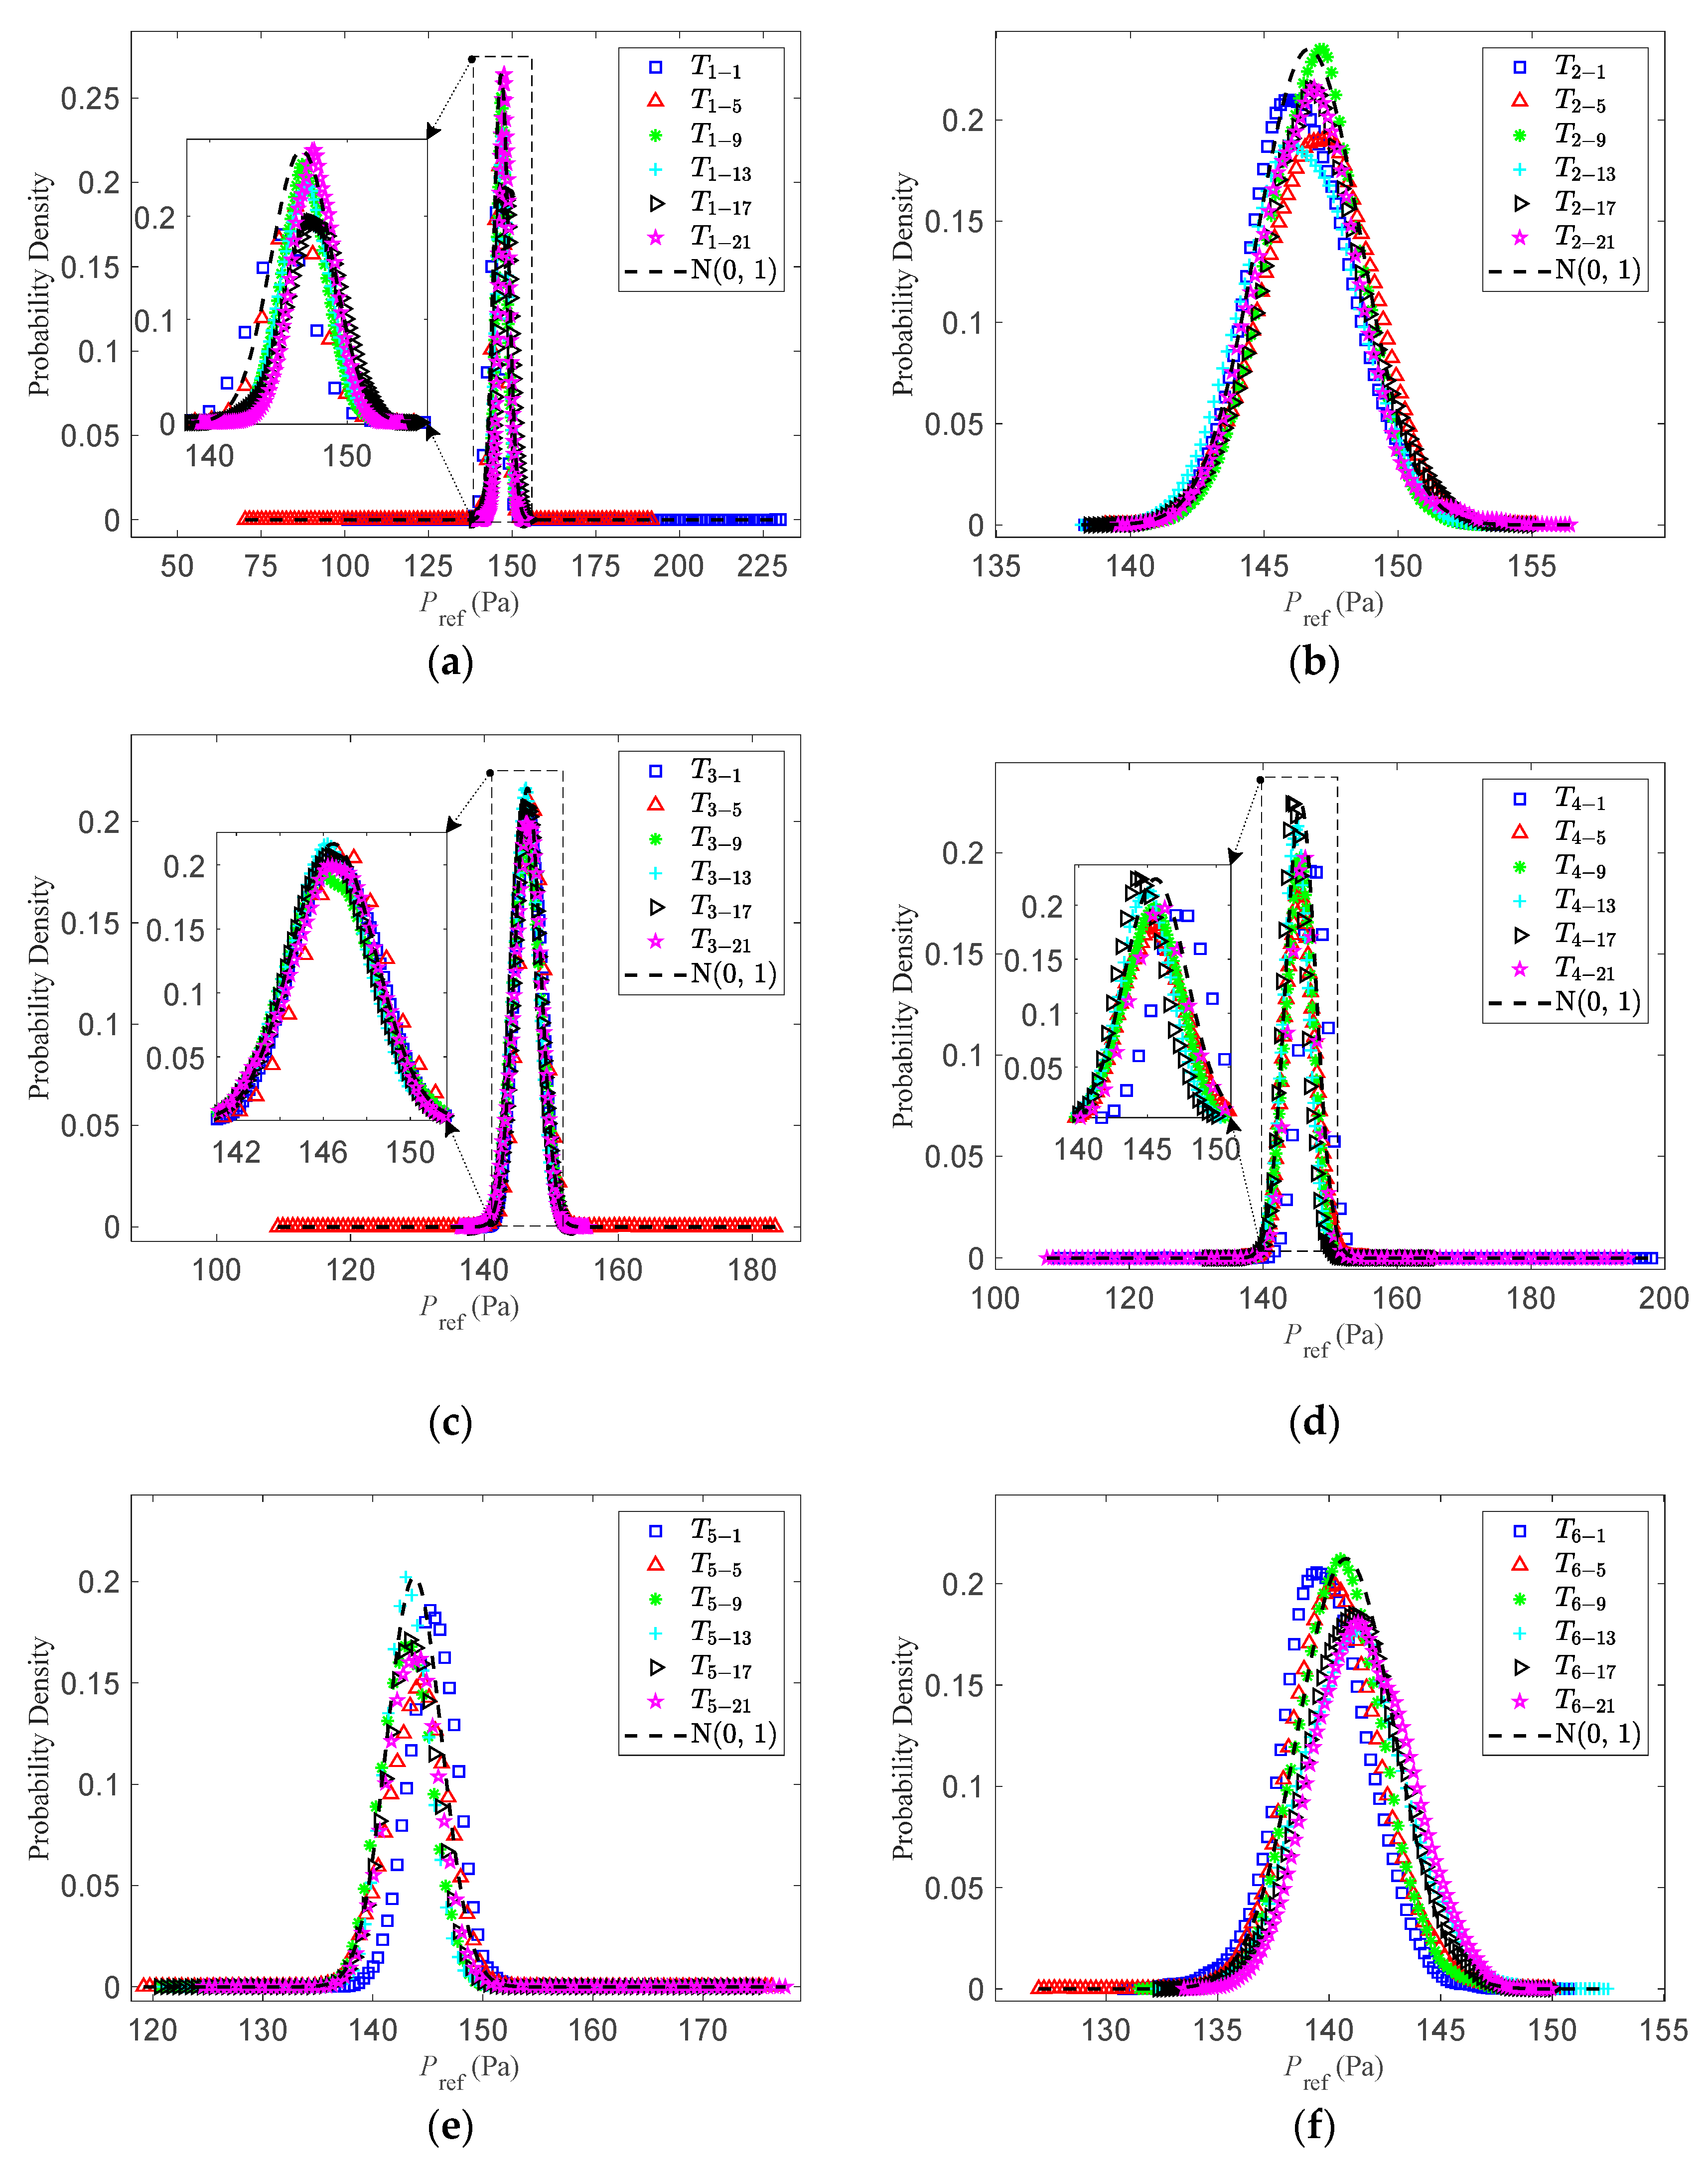
- The probability density of reference static pressure under different conditions generally resembles a Gaussian distribution, with the measurements at temperature T2 being the most stable. For individual samples under temperatures T1–T6, the probability density distributions exhibit leptokurtic characteristics and certain skewed disturbances. This phenomenon can be attributed to the influence of external airflow on the inlet and outlet of the open-circuit wind tunnel. Such leptokurtic features and skewed disturbances may affect the accuracy of wind pressure data processing. It is therefore recommended to apply filtering techniques or repeat the measurements to reduce experimental errors.
- (3)
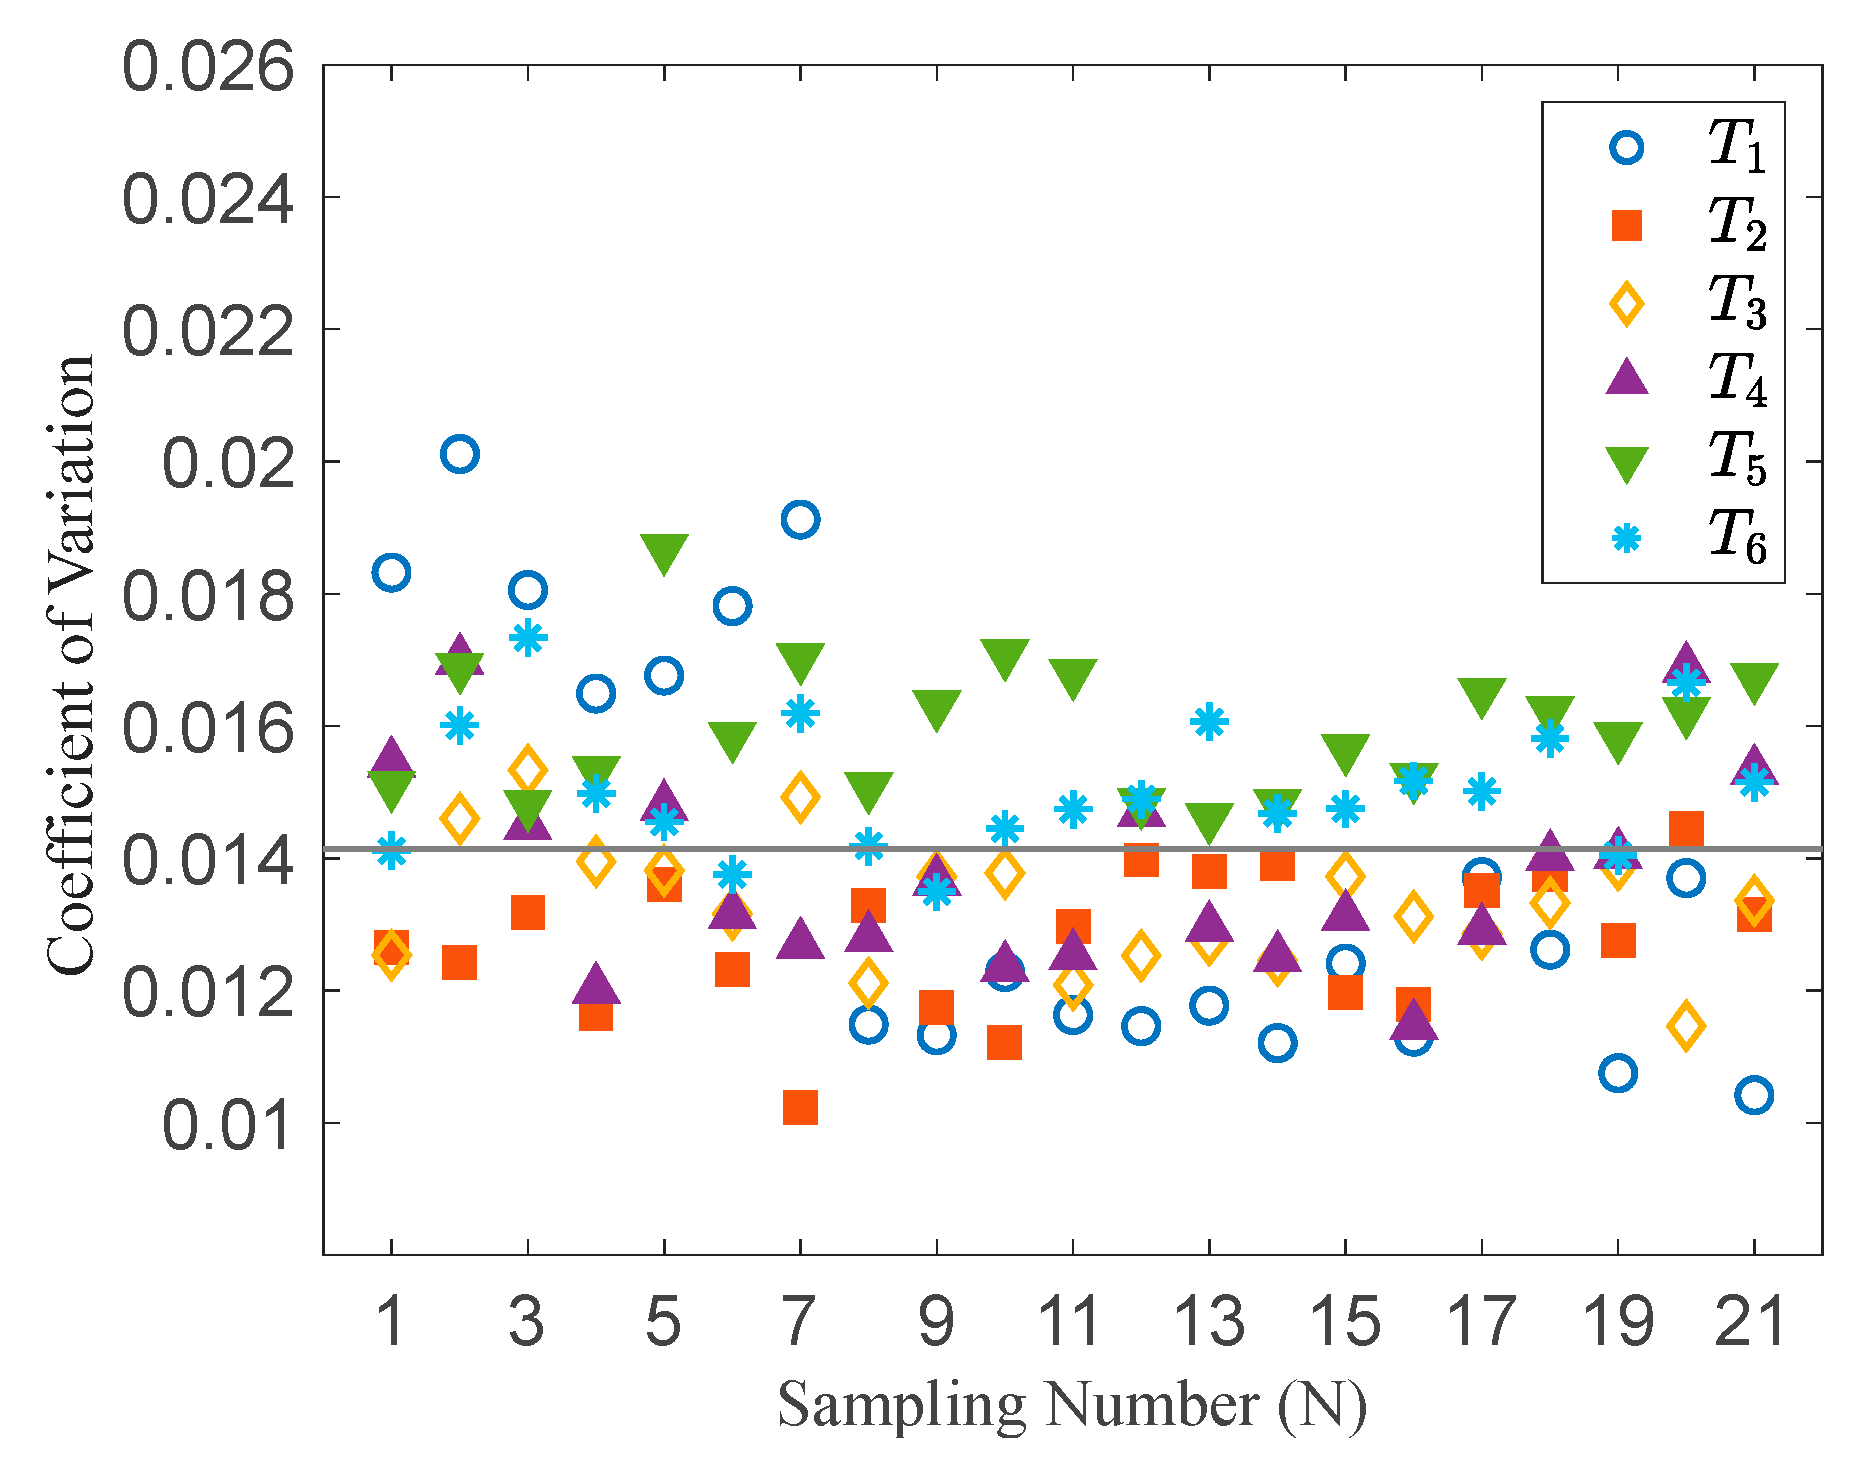
- Under different temperature conditions, the SSD of the reference static pressure from multiple measurements is mostly within the range of 1 to 2 Pa, and the CV is generally distributed between 1% and 2%. This indicates that the time-history data of the reference static pressure exhibit low dispersion and minor fluctuations, demonstrating favorable overall stability. However, a sudden increase in SSD was observed in some measurement groups, and this phenomenon appeared to occur randomly. It is worth noting that the data stability under the T2 temperature condition is superior to that under other conditions, demonstrating higher reliability and reference value.
- (4)
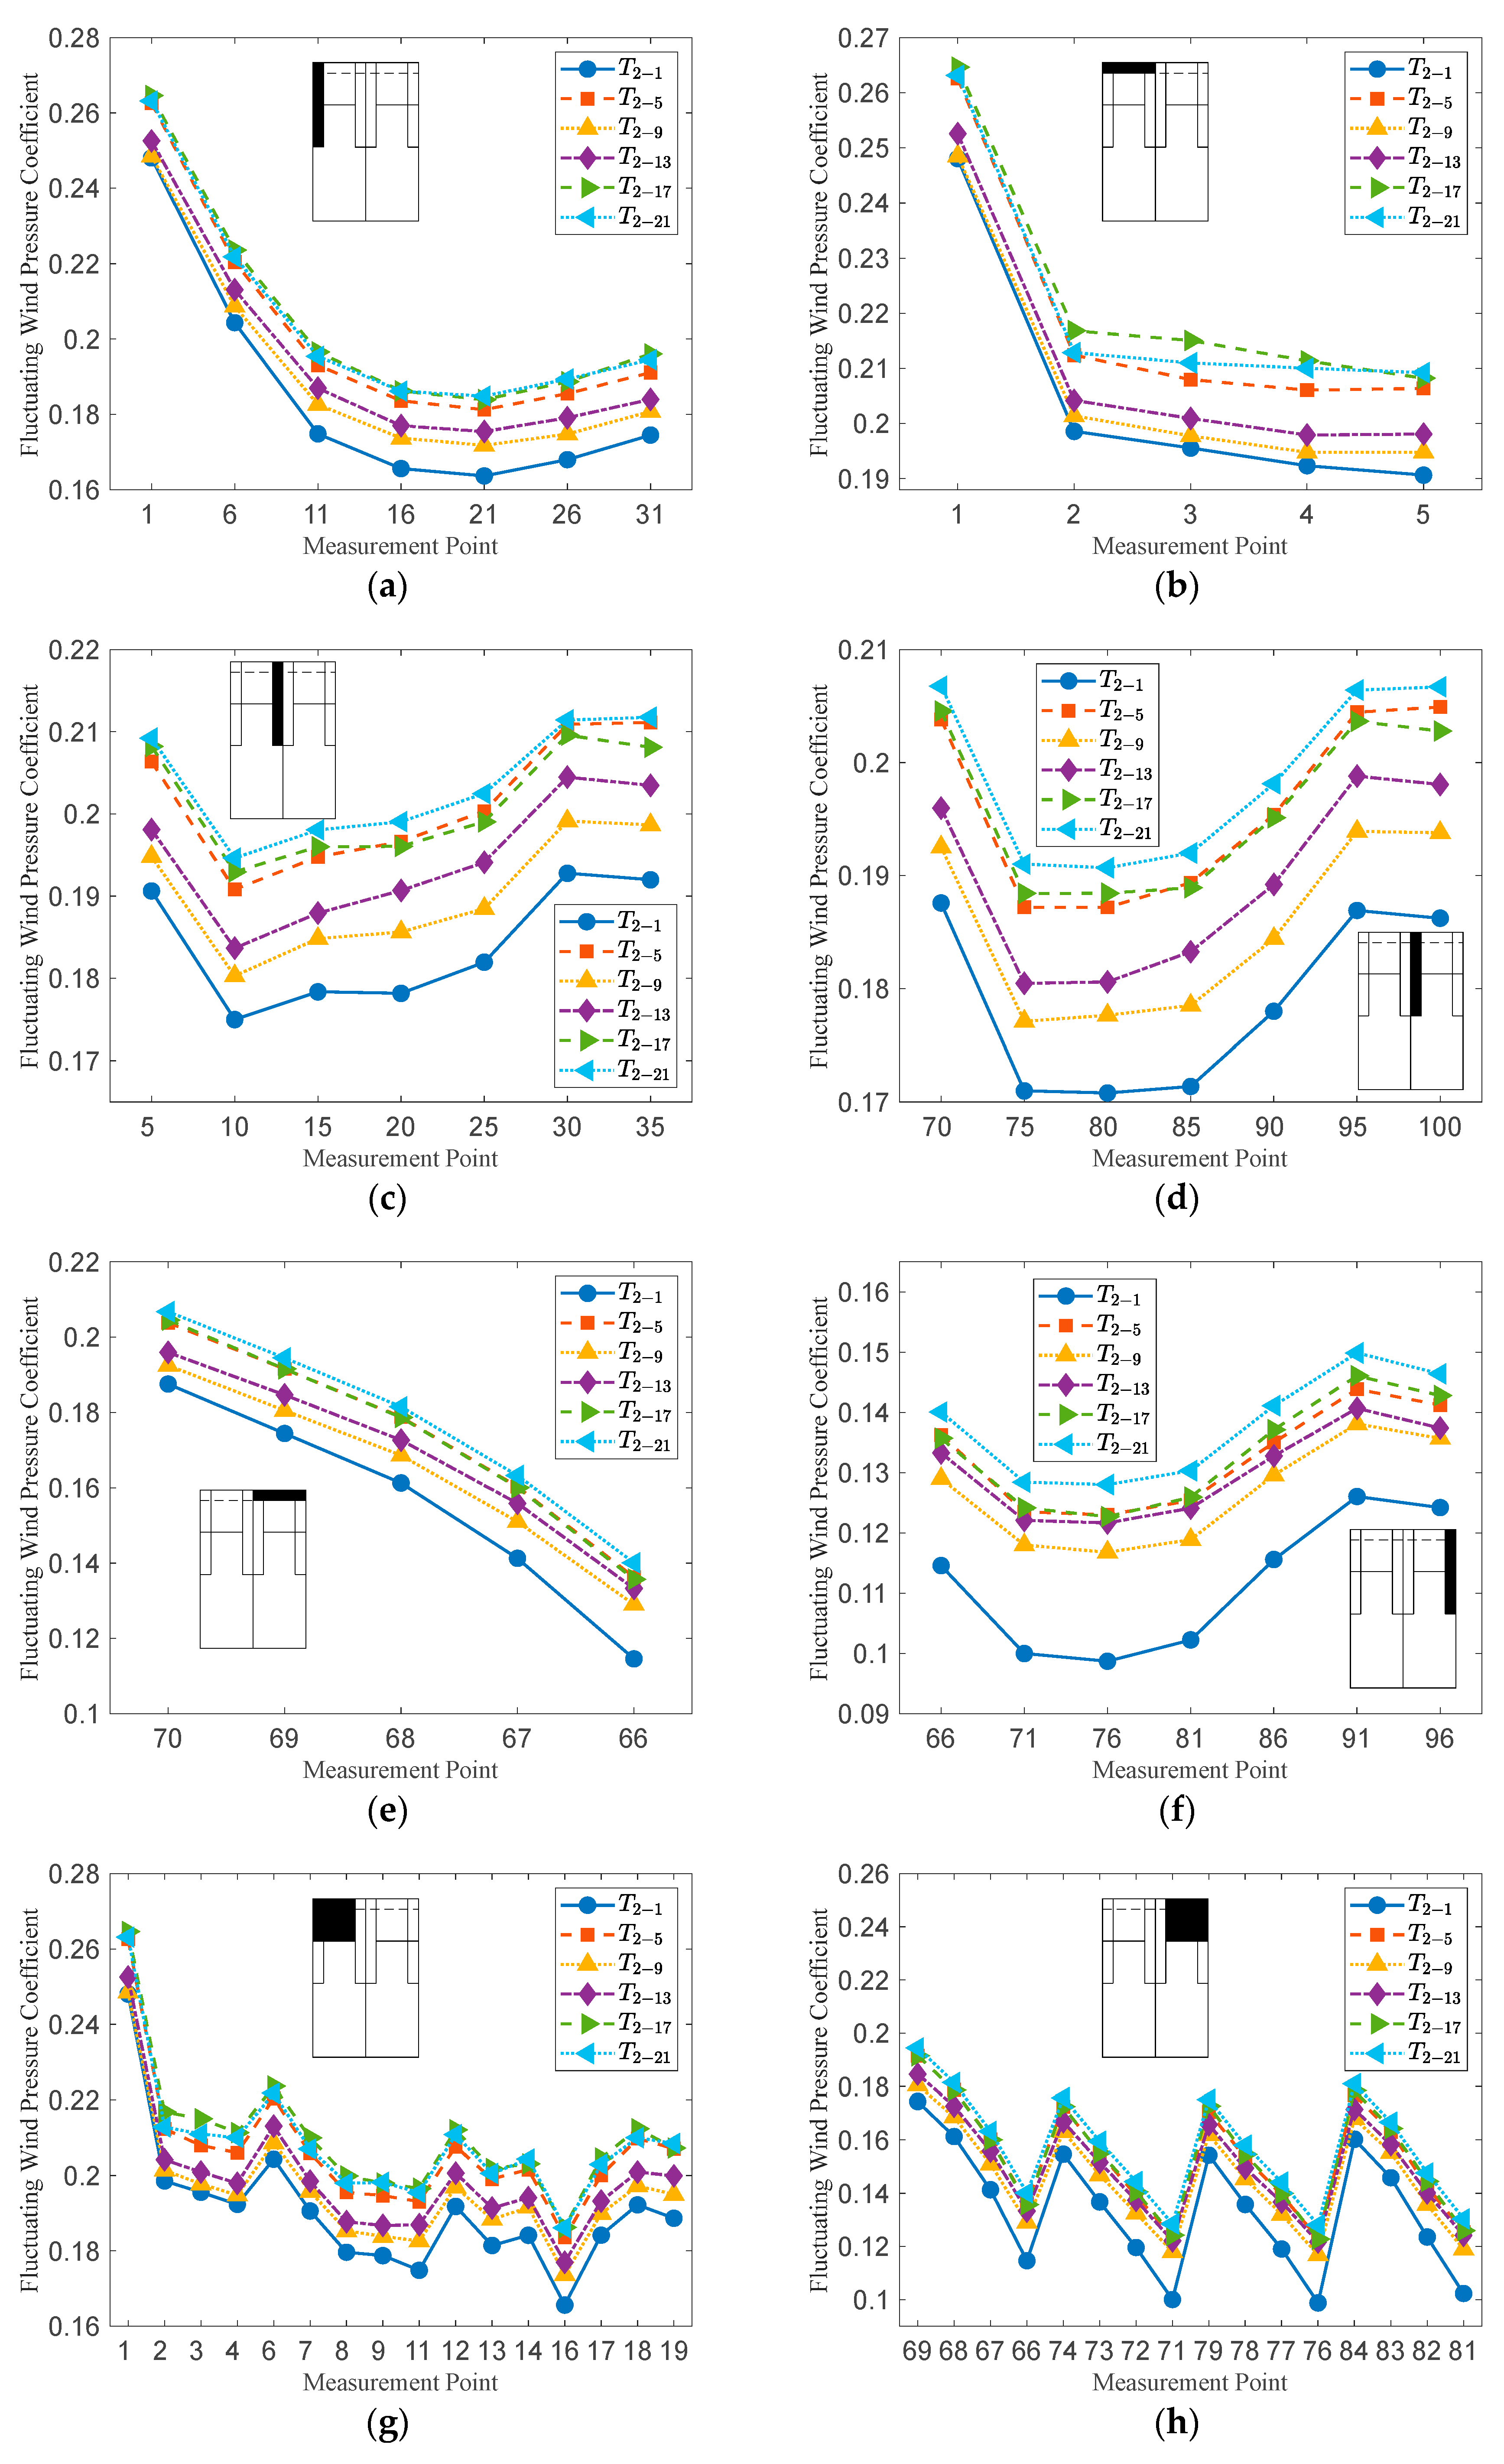
- At a wind direction angle of 0°, the distribution patterns and magnitudes of the fluctuating wind pressure coefficients across the 6 test samples at T2 temperature were generally consistent, exhibiting only minor linear variations between them. The average MER of the fluctuating wind pressure coefficients in Roof Zones I–VIII was 3.71%, which falls within an acceptable range; this deviation primarily stems from systematic errors induced by the structural characteristics of the open-circuit wind tunnel. Notably, higher error rates were observed in Zone VI (leeward eave) and Zone VIII (leeward corner); for such high-error regions, increasing the number of measurements or enhancing the density of measurement points could be considered to improve data accuracy, thereby enhancing the reliability of engineering wind load analyses.
Author Contributions
Funding
Data Availability Statement
Acknowledgments
Conflicts of Interest
Abbreviations
| RMS | root mean square |
| SSD | sliding standard deviation |
| KDE | kernel density estimation |
| CV | coefficient of variation |
| MRE | mean relative error |
Appendix A
| Sampling Number (N) | T1 (26.8 °C) | T2 (27.8 °C) | T3 (28.9 °C) | T4 (29.4 °C) | T5 (31.0 °C) | T6 (33.3 °C) | ||||||
|---|---|---|---|---|---|---|---|---|---|---|---|---|
| S | K | S | K | S | K | S | K | S | K | S | K | |
| 1 | 2.87 | 13.78 | 0.16 | 2.96 | 0.02 | 2.71 | 0.40 | 5.08 | 0.04 | 3.86 | −0.01 | 3.49 |
| 2 | 1.92 | 14.16 | 0.08 | 2.81 | 0.40 | 3.43 | −0.69 | 11.20 | 0.31 | 3.33 | 0.05 | 3.03 |
| 3 | −2.57 | 6.69 | 0.14 | 2.95 | 0.14 | 3.03 | 0.80 | 7.30 | 0.64 | 9.72 | −0.04 | 3.25 |
| 4 | 0.40 | 8.76 | 0.43 | 3.64 | −0.23 | 3.07 | 0.08 | 3.20 | 0.14 | 9.50 | 0.08 | 3.55 |
| 5 | −2.27 | 13.38 | −0.08 | 2.79 | −0.24 | 11.54 | 0.18 | 2.94 | −0.22 | 3.23 | 0.20 | 3.31 |
| 6 | 2.69 | 14.51 | −0.09 | 2.87 | 0.03 | 2.84 | 0.16 | 2.94 | 0.20 | 3.59 | 0.00 | 3.48 |
| 7 | 3.01 | 11.98 | 0.14 | 3.03 | 0.47 | 3.11 | 0.03 | 2.78 | 0.20 | 3.36 | 0.02 | 3.08 |
| 8 | 0.01 | 3.13 | 0.26 | 2.81 | −0.14 | 3.05 | −0.24 | 3.32 | −0.18 | 3.35 | 0.19 | 4.02 |
| 9 | −0.05 | 3.11 | −0.12 | 2.98 | 0.00 | 2.85 | −0.10 | 2.80 | −0.03 | 3.26 | 0.12 | 3.19 |
| 10 | 0.02 | 2.74 | −0.14 | 2.90 | −0.09 | 2.86 | 0.01 | 2.98 | −0.02 | 4.98 | 0.23 | 3.14 |
| 11 | 0.10 | 3.02 | 0.08 | 2.81 | 0.04 | 2.80 | −0.01 | 2.87 | 0.60 | 3.99 | 0.06 | 3.06 |
| 12 | 0.07 | 2.95 | −0.39 | 2.87 | −0.07 | 2.98 | −0.16 | 2.91 | 0.48 | 8.42 | −0.22 | 2.91 |
| 13 | 0.06 | 3.00 | 0.00 | 2.75 | 0.00 | 3.08 | −0.04 | 3.17 | 0.80 | 11.20 | 0.17 | 2.97 |
| 14 | 0.06 | 3.15 | −0.36 | 3.19 | −0.04 | 2.89 | 0.04 | 3.11 | −0.22 | 3.83 | −0.11 | 2.91 |
| 15 | −0.08 | 2.80 | −0.03 | 2.84 | 0.11 | 2.91 | 0.07 | 2.99 | −0.34 | 3.67 | −0.03 | 2.84 |
| 16 | 0.25 | 3.16 | −0.04 | 2.82 | −0.13 | 3.43 | −0.23 | 3.03 | −0.09 | 3.39 | 0.30 | 3.00 |
| 17 | −0.14 | 3.11 | 0.09 | 3.14 | −0.01 | 2.96 | 0.74 | 3.65 | 0.55 | 7.32 | 0.00 | 2.99 |
| 18 | 0.17 | 2.83 | 0.31 | 2.86 | 0.00 | 2.93 | 0.40 | 8.80 | −0.11 | 3.19 | 0.27 | 3.20 |
| 19 | 0.19 | 3.16 | −0.04 | 2.80 | 0.18 | 3.07 | 2.99 | 4.33 | −0.08 | 4.12 | 0.14 | 3.02 |
| 20 | 0.14 | 2.55 | 0.41 | 3.09 | 0.11 | 3.09 | 1.79 | 3.98 | 0.10 | 4.40 | −0.03 | 2.72 |
| 21 | −0.10 | 3.13 | 0.24 | 3.52 | −0.22 | 3.02 | 0.45 | 13.76 | 0.35 | 4.65 | 0.09 | 2.71 |
| Sampling Number (N) | Coefficient of Variation | |||||
|---|---|---|---|---|---|---|
| T1 (26.8 °C) | T2 (27.8 °C) | T3 (28.9 °C) | T4 (29.4 °C) | T5 (31.0 °C) | T6 (33.3 °C) | |
| 1 | 0.018 | 0.013 | 0.013 | 0.015 | 0.015 | 0.014 |
| 2 | 0.020 | 0.012 | 0.015 | 0.017 | 0.017 | 0.016 |
| 3 | 0.018 | 0.013 | 0.015 | 0.014 | 0.015 | 0.017 |
| 4 | 0.016 | 0.012 | 0.014 | 0.012 | 0.015 | 0.015 |
| 5 | 0.017 | 0.014 | 0.014 | 0.015 | 0.019 | 0.015 |
| 6 | 0.018 | 0.012 | 0.013 | 0.013 | 0.016 | 0.014 |
| 7 | 0.019 | 0.010 | 0.015 | 0.013 | 0.017 | 0.016 |
| 8 | 0.011 | 0.013 | 0.012 | 0.013 | 0.015 | 0.014 |
| 9 | 0.011 | 0.012 | 0.014 | 0.014 | 0.016 | 0.013 |
| 10 | 0.012 | 0.011 | 0.014 | 0.012 | 0.017 | 0.014 |
| 11 | 0.012 | 0.013 | 0.012 | 0.013 | 0.017 | 0.015 |
| 12 | 0.011 | 0.014 | 0.013 | 0.015 | 0.015 | 0.015 |
| 13 | 0.012 | 0.014 | 0.013 | 0.013 | 0.015 | 0.016 |
| 14 | 0.011 | 0.014 | 0.012 | 0.012 | 0.015 | 0.015 |
| 15 | 0.012 | 0.012 | 0.014 | 0.013 | 0.016 | 0.015 |
| 16 | 0.011 | 0.012 | 0.013 | 0.011 | 0.015 | 0.015 |
| 17 | 0.014 | 0.014 | 0.013 | 0.013 | 0.017 | 0.015 |
| 18 | 0.013 | 0.014 | 0.013 | 0.014 | 0.016 | 0.016 |
| 19 | 0.011 | 0.013 | 0.014 | 0.014 | 0.016 | 0.014 |
| 20 | 0.014 | 0.014 | 0.011 | 0.017 | 0.016 | 0.017 |
| 21 | 0.010 | 0.013 | 0.013 | 0.015 | 0.017 | 0.015 |
References
- Khaled, M.F.; Aly, A.M. Assessing aerodynamic loads on low-rise buildings considering Reynolds number and turbulence effects: A review. Adv. Aerodyn. 2022, 4, 24. [Google Scholar] [CrossRef]
- Picozzi, V. The Relationship between Wind Pressure and Building Surface Aerodynamics: Review of Wind Tunnel and CFD Studies. Buildings 2022, 12, 225. [Google Scholar] [CrossRef]
- Jiménez-Portaz, M.; Chiapponi, L.; Clavero, M.; Losada, M.A. Air flow quality analysis of an open-circuit boundary layer wind tunnel and comparison with a closed-circuit wind tunnel. Phys. Fluids 2020, 32, 125120. [Google Scholar] [CrossRef]
- Wei, Y.; Zhou, P.; Fang, Y.; Guo, J.; Zhong, S.; Zhang, X.; Huang, X.; Zhou, G.; Chen, B. Design and characterization of a multifunctional low-speed anechoic wind tunnel at HKUST. Aerosp. Sci. Technol. 2021, 115, 106814. [Google Scholar] [CrossRef]
- Gol-Zaroudi, H.; Aly, A.M. Open-jet boundary-layer processes for aerodynamic testing of low-rise buildings. Wind Struct. 2017, 25, 233–259. [Google Scholar]
- Zhu, Y.; Zhou, X.; Chen, Y.; Ma, C.; Wang, L.; Zheng, C.; Yan, B. Comparison of aerodynamic effects on the CAARC tall building model tested in two wind tunnel laboratories. Appl. Sci. 2025, 15, 811. [Google Scholar] [CrossRef]
- Richards, P.J.; Hoxey, R.P. Pressures on a cubic building—Part 1: Full-scale results. J. Wind Eng. Ind. Aerodyn. 2012, 102, 72–86. [Google Scholar] [CrossRef]
- Richards, P.J.; Hoxey, R.P. Pressures on a cubic building—Part 2: Quasi-steady and other processes. J. Wind Eng. Ind. Aerodyn. 2012, 102, 87–96. [Google Scholar] [CrossRef]
- Lamberti, G.; Amerio, L.; Pomaranzi, G.; Zasso, A.; Gorlé, C. Comparison of high resolution pressure measurements on a high-rise building in a closed and open-section wind tunnel. J. Wind Eng. Ind. Aerodyn. 2020, 204, 104247. [Google Scholar] [CrossRef]
- He, Y.C.; Cheung, J.C.K.; Li, Q.S.; Fu, J.Y. Accurate determination of reference wind speed and reference static pressure in wind tunnel tests. Adv. Struct. Eng. 2020, 23, 531–546. [Google Scholar] [CrossRef]
- Dalley, S.; Richardson, G. Reference static pressure measurements in wind tunnels. J. Wind Eng. Ind. Aerodyn. 1992, 42, 909–920. [Google Scholar] [CrossRef]
- Liberzon, D.; Shemer, L. An inexpensive method for measurements of static pressure fluctuations. J. Atmos. Ocean. Technol. 2010, 27, 776–784. [Google Scholar] [CrossRef][Green Version]
- Nijhof, B.; Wickern, G. Reference static and dynamic pressures in automotive wind tunnels. SAE Trans. 2003, 112, 341–355. [Google Scholar]
- Grossir, G.; Van Hove, B.; Paris, S.; Rambaud, P.; Chazot, O. Free-stream static pressure measurements in the Longshot hypersonic wind tunnel and sensitivity analysis. Exp. Fluids 2016, 57, 64. [Google Scholar] [CrossRef]
- Voznyak, O.; Dovbush, O.; Kapalo, P.; Adamski, M.; Domnita, F.; Bacotiu, C. Frontal resistance coefficient of the buses with the different ventilation equipment. Eng. Rev. 2021, 41, 15–25. [Google Scholar] [CrossRef]
- Zhelykh, V.; Ulewicz, M.; Furdas, Y.; Adamski, M.; Rebman, M. Investigation of Pressure Coefficient Distribution on the Surface of a Modular Building. Energies 2022, 15, 4644. [Google Scholar] [CrossRef]
- Jin, L.; Deng, X.B.; Wang, X.; Zhang, J.; Zeng, W. Suppression Methods for Low-Frequency Pressure Fluctuations in Open-Jet Wind Tunnels. Appl. Sci. 2023, 13, 10808. [Google Scholar] [CrossRef]
- Cheng, X.X.; Zhao, L.; Ke, S.T.; Ge, Y.J. A new research scheme for full-scale/model test comparisons to validate the traditional wind tunnel pressure measurement technique. Appl. Sci. 2022, 12, 12847. [Google Scholar] [CrossRef]
- Holmes, J.D. Wind Loading of Structures, 2nd ed.; CRC Press: London, UK, 2007. [Google Scholar]
- Pan, Y.; Niu, B.; Yang, Z. Research on the distribution characteristics of static pressure in data centers from the perspective of airflow transmission path. J. Build. Eng. 2024, 87, 108557. [Google Scholar] [CrossRef]
- Sun, C.; Shi, C.; Zhu, Z.; Lin, H.; Li, Z.; Du, F.; Cao, Z.; Lu, P.; Liu, L. Overburden failure characteristics and fracture evolution rule under repeated mining with multiple key strata control. Sci. Rep. 2025, 15, 28029. [Google Scholar] [CrossRef] [PubMed]
- Zhong, M.; Wang, C.; Lin, M.; Lu, J.; Wang, X. An Investigation into the Distribution of Fluctuating Wind Pressure and Associated Probabilistic Characteristics of Low-Rise Buildings Impacted by the Gap between the Hillside and the Building. Buildings 2024, 14, 1435. [Google Scholar] [CrossRef]
- Cao, Z.; Xiong, Y.; Xue, Y.; Du, F.; Li, Z.; Huang, C.; Wang, S.; Yu, Y.; Wang, W.; Zhai, M.; et al. Diffusion Evolution Rules of Grouting Slurry in Mining-induced Cracks in Overlying Strata. Rock Mech. Rock Eng. 2025, 58, 6493–6512. [Google Scholar] [CrossRef]
- Montgomery, D.C.; Runger, G.C. Applied Statistics and Probability for Engineers, 7th ed.; John Wiley: New York, NY, USA, 2019. [Google Scholar]
- Zhou, Y.; Kareem, A. Gust loading factor: New model. J. Struct. Eng. 2001, 127, 168–175. [Google Scholar] [CrossRef]
- Cheon, D.-J.; Kim, Y.-C.; Lee, J.-H.; Yoon, S.-W. Fluctuating wind pressure characteristics of dome roofs with low rise-span ratio. Buildings 2023, 13, 1673. [Google Scholar] [CrossRef]
- Chen, F.; Kang, W.; Shu, Z.; Li, Q.; Li, Y.; Chen, Y.F.; Zhou, K. Predicting roof-surface wind pressure induced by conical vortex using a BP neural network combined with POD. Build. Simul. 2022, 15, 1475–1490. [Google Scholar] [CrossRef]
- Bre, F.; Gimenez, J.M.; Fachinotti, V.D. Prediction of wind pressure coefficients on building surfaces using artificial neural networks. Energy Build. 2018, 158, 1429–1441. [Google Scholar] [CrossRef]
- Ye, T.; Zhu, L.; Tan, Z. Numerical statistic approach for peak factor of non-Gaussian wind pressure on building claddings. Adv. Civ. Eng. 2021, 2021, 2918656. [Google Scholar] [CrossRef]


| Terrain Type | Wind Field Scale Ratio | Measurement Height (cm) | Sampling Number (N) | Temperature (°C) |
|---|---|---|---|---|
| Category B | 1:20 | 40 | with 21 measurements per temperature case T1–T6 (T1-1~T1-21, T2-1~T2-21, T3-1~T3-21, T4-1~T4-21, T5-1~T5-21, T6-1~T6-21) | T1~T6 (26.8 °C, 27.8 °C, 28.9 °C, 29.4 °C, 31.0 °C, 33.3 °C) |
Disclaimer/Publisher’s Note: The statements, opinions and data contained in all publications are solely those of the individual author(s) and contributor(s) and not of MDPI and/or the editor(s). MDPI and/or the editor(s) disclaim responsibility for any injury to people or property resulting from any ideas, methods, instructions or products referred to in the content. |
© 2025 by the authors. Licensee MDPI, Basel, Switzerland. This article is an open access article distributed under the terms and conditions of the Creative Commons Attribution (CC BY) license (https://creativecommons.org/licenses/by/4.0/).
Share and Cite
Yang, M.; Wang, E.; Yang, I.-S. Reference Static Pressure Effect on Fluctuating Wind Pressure on Roofs of Low-Rise Buildings in Open-Circuit Wind Tunnels. Buildings 2025, 15, 4208. https://doi.org/10.3390/buildings15234208
Yang M, Wang E, Yang I-S. Reference Static Pressure Effect on Fluctuating Wind Pressure on Roofs of Low-Rise Buildings in Open-Circuit Wind Tunnels. Buildings. 2025; 15(23):4208. https://doi.org/10.3390/buildings15234208
Chicago/Turabian StyleYang, Mengchang, Enguang Wang, and Il-Seung Yang. 2025. "Reference Static Pressure Effect on Fluctuating Wind Pressure on Roofs of Low-Rise Buildings in Open-Circuit Wind Tunnels" Buildings 15, no. 23: 4208. https://doi.org/10.3390/buildings15234208
APA StyleYang, M., Wang, E., & Yang, I.-S. (2025). Reference Static Pressure Effect on Fluctuating Wind Pressure on Roofs of Low-Rise Buildings in Open-Circuit Wind Tunnels. Buildings, 15(23), 4208. https://doi.org/10.3390/buildings15234208


