1. Introduction
As a crucial component of the power supply system, the high-voltage electricity transmission network offers significant advantages, including a large transmission capacity, extensive coverage, high efficiency, and low power loss. Earthquakes, characterized by their strong destructiveness and high frequency, pose a severe threat to power grid security. The collapse of transmission tower–line structures during seismic events can trigger cascading failures, jeopardizing the stability of regional power grids and leading to severe disruptions to social functioning and public safety [
1,
2,
3,
4].
Under seismic action, the dynamic response of the transmission tower–line system is complex. In recent years, scholars have conducted extensive research on seismic performance evaluation.
Initially, simplified models were used for the simulation of transmission towers [
5,
6,
7], followed by more sophisticated ones. Suzuki et al. [
8] idealized the conductors as springs attached at the cross-arms and simplified the transmission tower as an equivalent beam model. Wu et al. [
9] found that the pulse effect of near-fault ground motions significantly amplifies the seismic response of transmission tower–line systems. Du et al. [
10] developed collapse fragility curves for hurricane events to avoid the difficulty of quantifying the correlations of failure probabilities across different time intervals within a storm. Miguel et al. [
11] compared and analyzed the nonlinear dynamic responses of two typical tower–line systems under different seismic load scenarios, finding that moderate earthquakes can reduce the tower’s resistance to future climatic events. Lai et al. [
12] demonstrated that stainless steel tube-confined ultra-high-performance concrete (SS+UHPC) stub columns exhibit excellent ductility and stable residual strength under cyclic loading. This configuration effectively mitigates the brittle failure characteristics of concrete, offering a new material option for the design of seismic-resistant components in structures such as transmission towers.
Given the various characteristics of earthquakes [
13,
14,
15], such as near-fault mainshock–aftershock sequences, Li et al. [
16] generated mainshock–aftershock sequences to investigate the damage states of frame structures. Although the repeated synthesis method is straightforward and convenient, it overlooks the randomness and dispersion of ground motions, resulting in significant application limitations. Moustafa et al. [
17] employed this method to evaluate the additional damage inflicted by aftershocks on structures. Bruneau et al. [
18] introduced the concept of “resilience” into the seismic field of engineering structures, defining community seismic resilience as the ability to mitigate disaster-induced damage, facilitate recovery, and reduce future earthquake impacts. Xu et al. [
19] established a database for the recovery time and functional loss of frame structures based on seismic fragility functions. Liu et al. [
20] studied the seismic capacity of transmission towers under mainshock–aftershock sequences. Based on a global damage-based fragility assessment method, five damage states for transmission towers were defined. Dynamic analysis considering the steel constitutive model in ABAQUS was conducted to obtain seismic damage under 20 sets of mainshock–aftershock sequences, and fragility curves were derived through a probability density distribution. The results showed that the damage probability of the transmission tower increases significantly with the intensity of aftershocks. Pan et al. [
21] adopted the fragility research methodology used for subsea free-span pipelines under spatial ground motions to conduct a seismic fragility analysis of transmission towers. Considering the loss of spatial coherence and directivity effects of ground motions, they evaluated the influence of different input modes on the failure probability. Zheng et al. [
22] proposed an explicit dynamic analysis method and used member failure criteria to analyze the progressive collapse of a transmission tower. The results showed that the tower exhibits different collapse failure modes under different seismic waves.
To more accurately assess the seismic safety of high-voltage transmission tower–line systems, this paper, based on a specific 765 kV transmission line project in Pakistan, establishes a refined finite element model of the tower–line system considering conductor coupling effects by utilizing an advanced constitutive model that reflects the hysteretic behavior of steel. Through modal analysis, dynamic response analysis, and IDA, the nonlinear response laws and damage evolution process of the structure are systematically studied. Furthermore, the collapse mechanism of the system is revealed, and its probabilistic fragility curves are established, aiming to provide references for the seismic design of high-voltage transmission projects.
4. Collapse Failure Analysis of the Tower–Line System
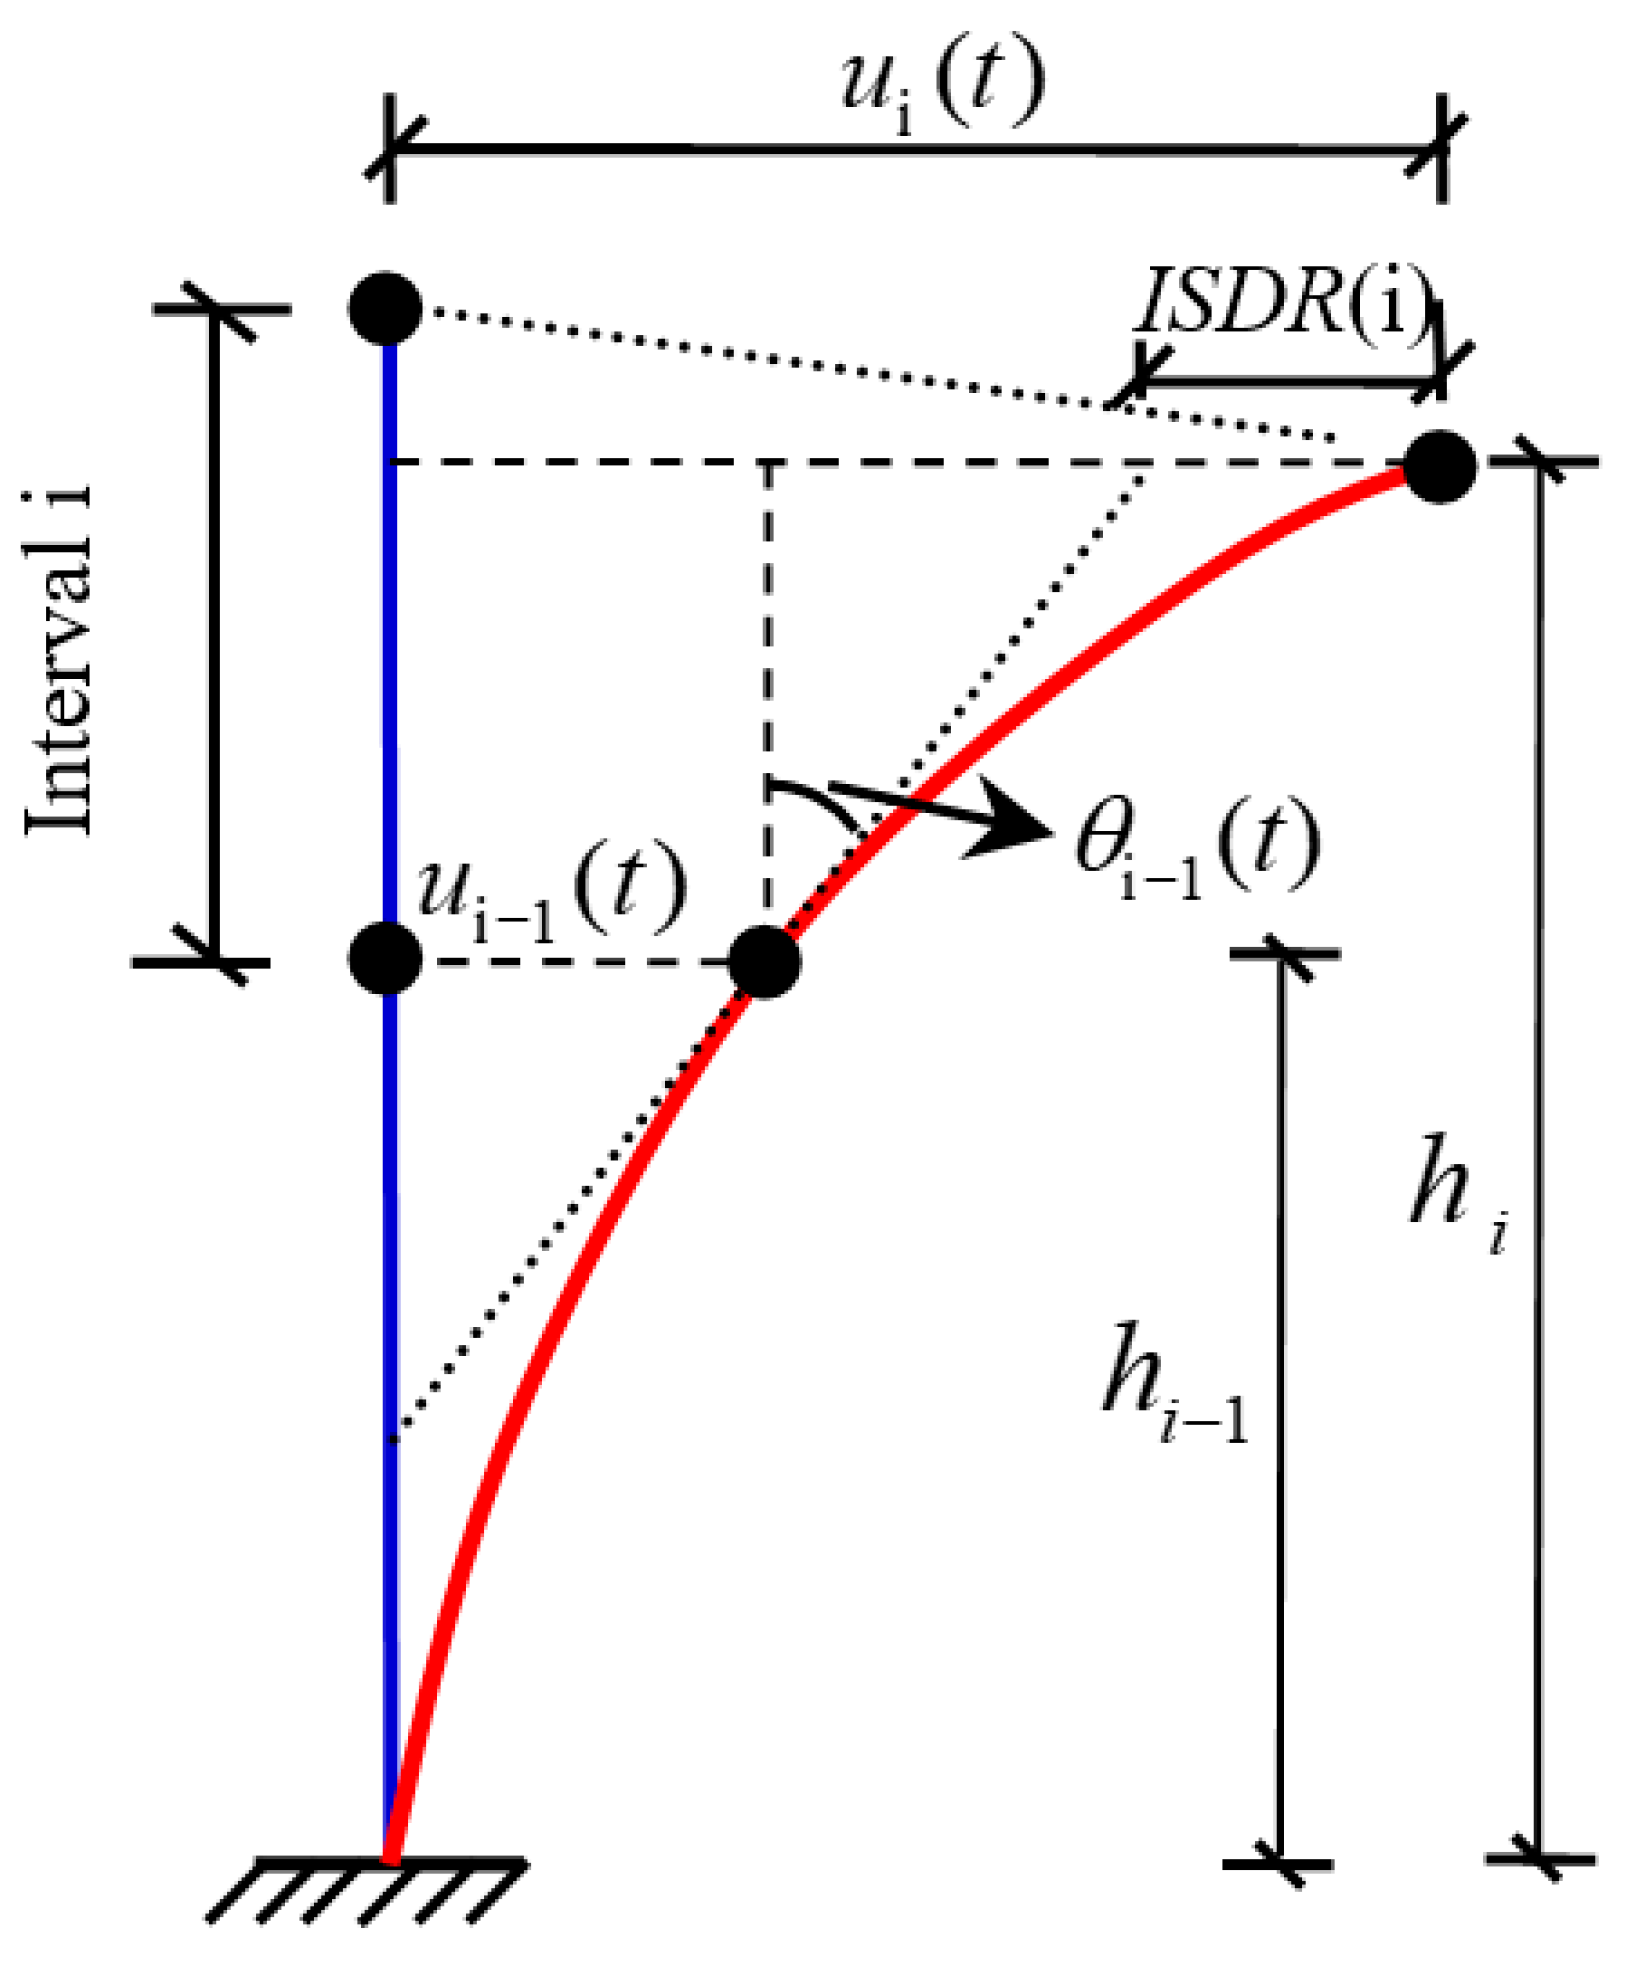
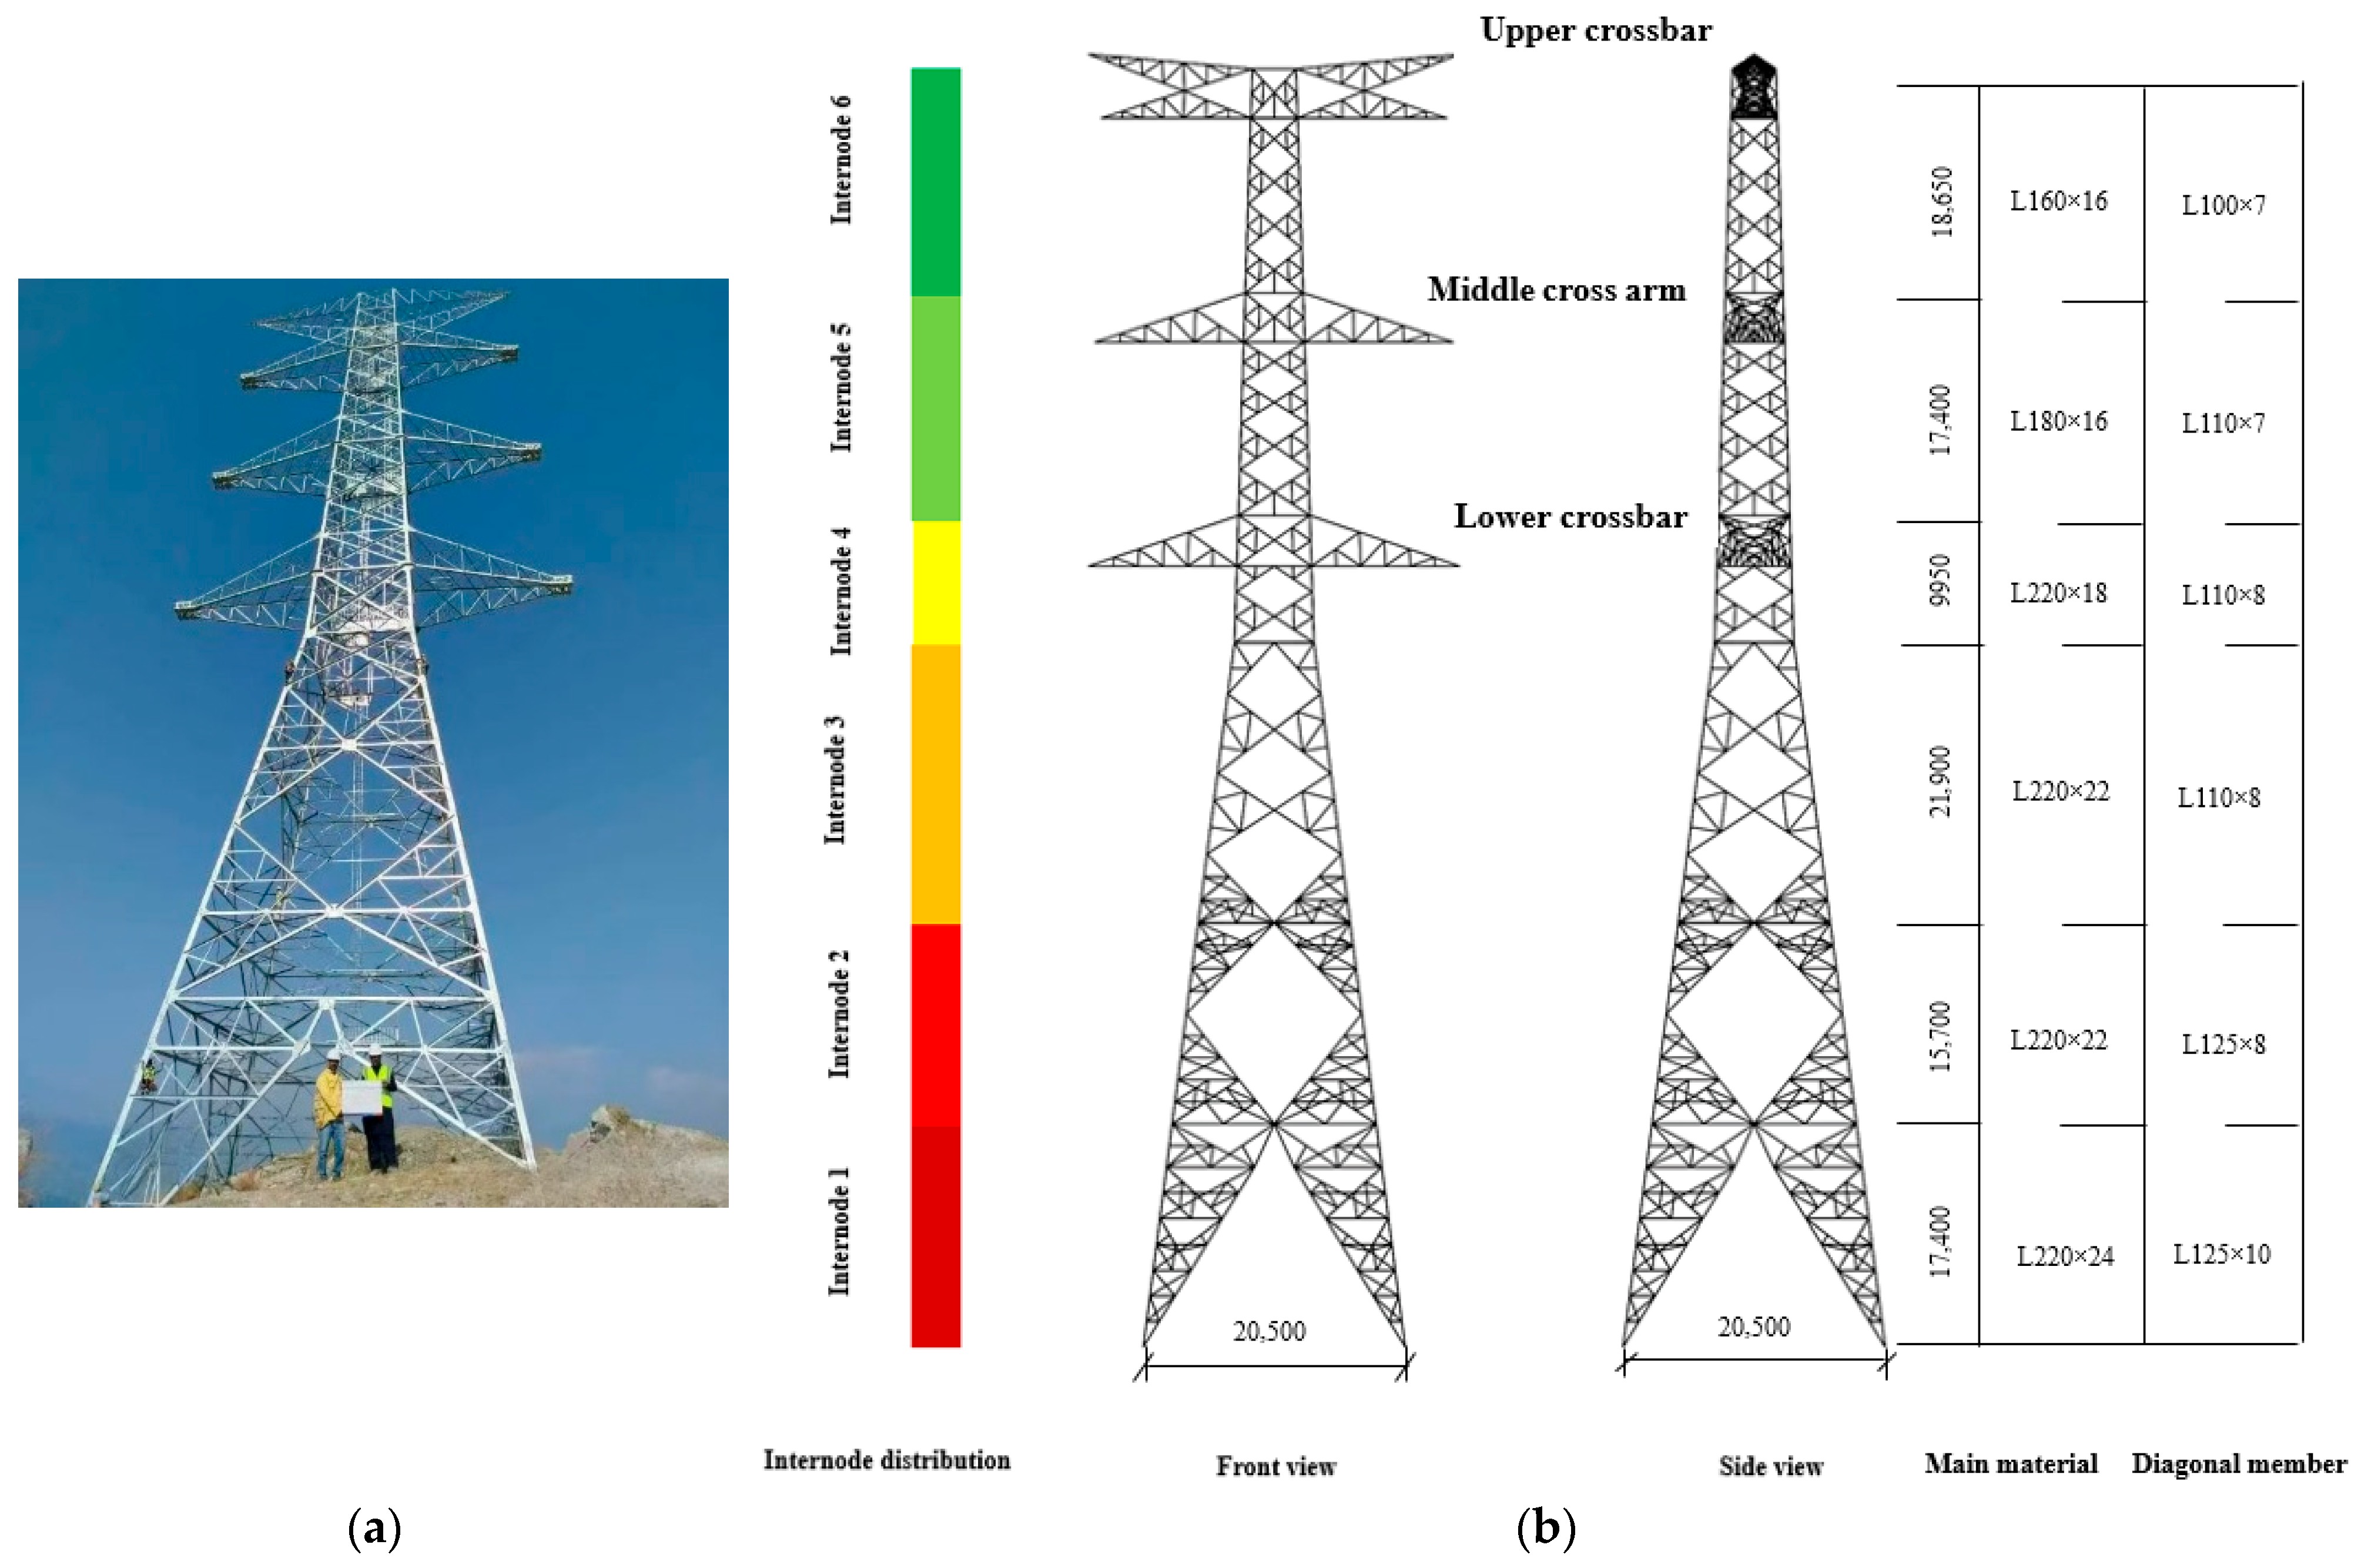
To investigate the collapse failure mechanism of the tower–line system under seismic action, this section employs 10 sets of typical ground motions to perform Incremental Dynamic Analysis (IDA) on the tower–line system. These ground motion records, defined as GM01 to GM10, were selected from the Pacific Earthquake Engineering Research Center (PEER) ground motion database, encompassing actual strong motion records with different magnitudes, spectral characteristics, and durations to ensure the representativeness and statistical significance of the analysis results. The PGA is incrementally increased from 0.2 g to 1.2 g in steps of 0.1 g, obtaining the progressive collapse modes and ultimate seismic capacity under different conditions. The inter-story drift ratio can intuitively present the seismic response along the height and identify potential weak locations under different ground motions, and it is widely used as a failure criterion in building structure seismic research. However, compared to traditional building structures, transmission towers have a large height-to-width ratio and lack floor system support between segments, leading to large rotational deformations in the segments. Therefore, this paper modifies the traditional inter-story drift ratio by eliminating the effect of rotational deformation [
27] and adopting the Inter-Segment Displacement Ratio (ISDR) as the failure criterion for the transmission tower structure. When the ISDR of the transmission tower exceeds 2%, the structure is judged to have collapsed. The segment division is shown in
Figure 1. A schematic diagram of the ISDR is shown in
Figure 8, and the calculation formula is as follows:
In the formula, is the internode number, which is equal to 1, 2, …, 6; the is the internode displacement angle along the ith horizontal node; t is time; and are the displacement time histories of the top and bottom of the ith node along the horizontal direction, respectively; and are the heights of the top and bottom of the ith internode along the horizontal direction, respectively; and is the time history of torsional displacement along the bottom of the ith node in the horizontal direction.
Figure 8.
Inter-segment displacement angle.
Figure 8.
Inter-segment displacement angle.
4.1. Weak Location Analysis
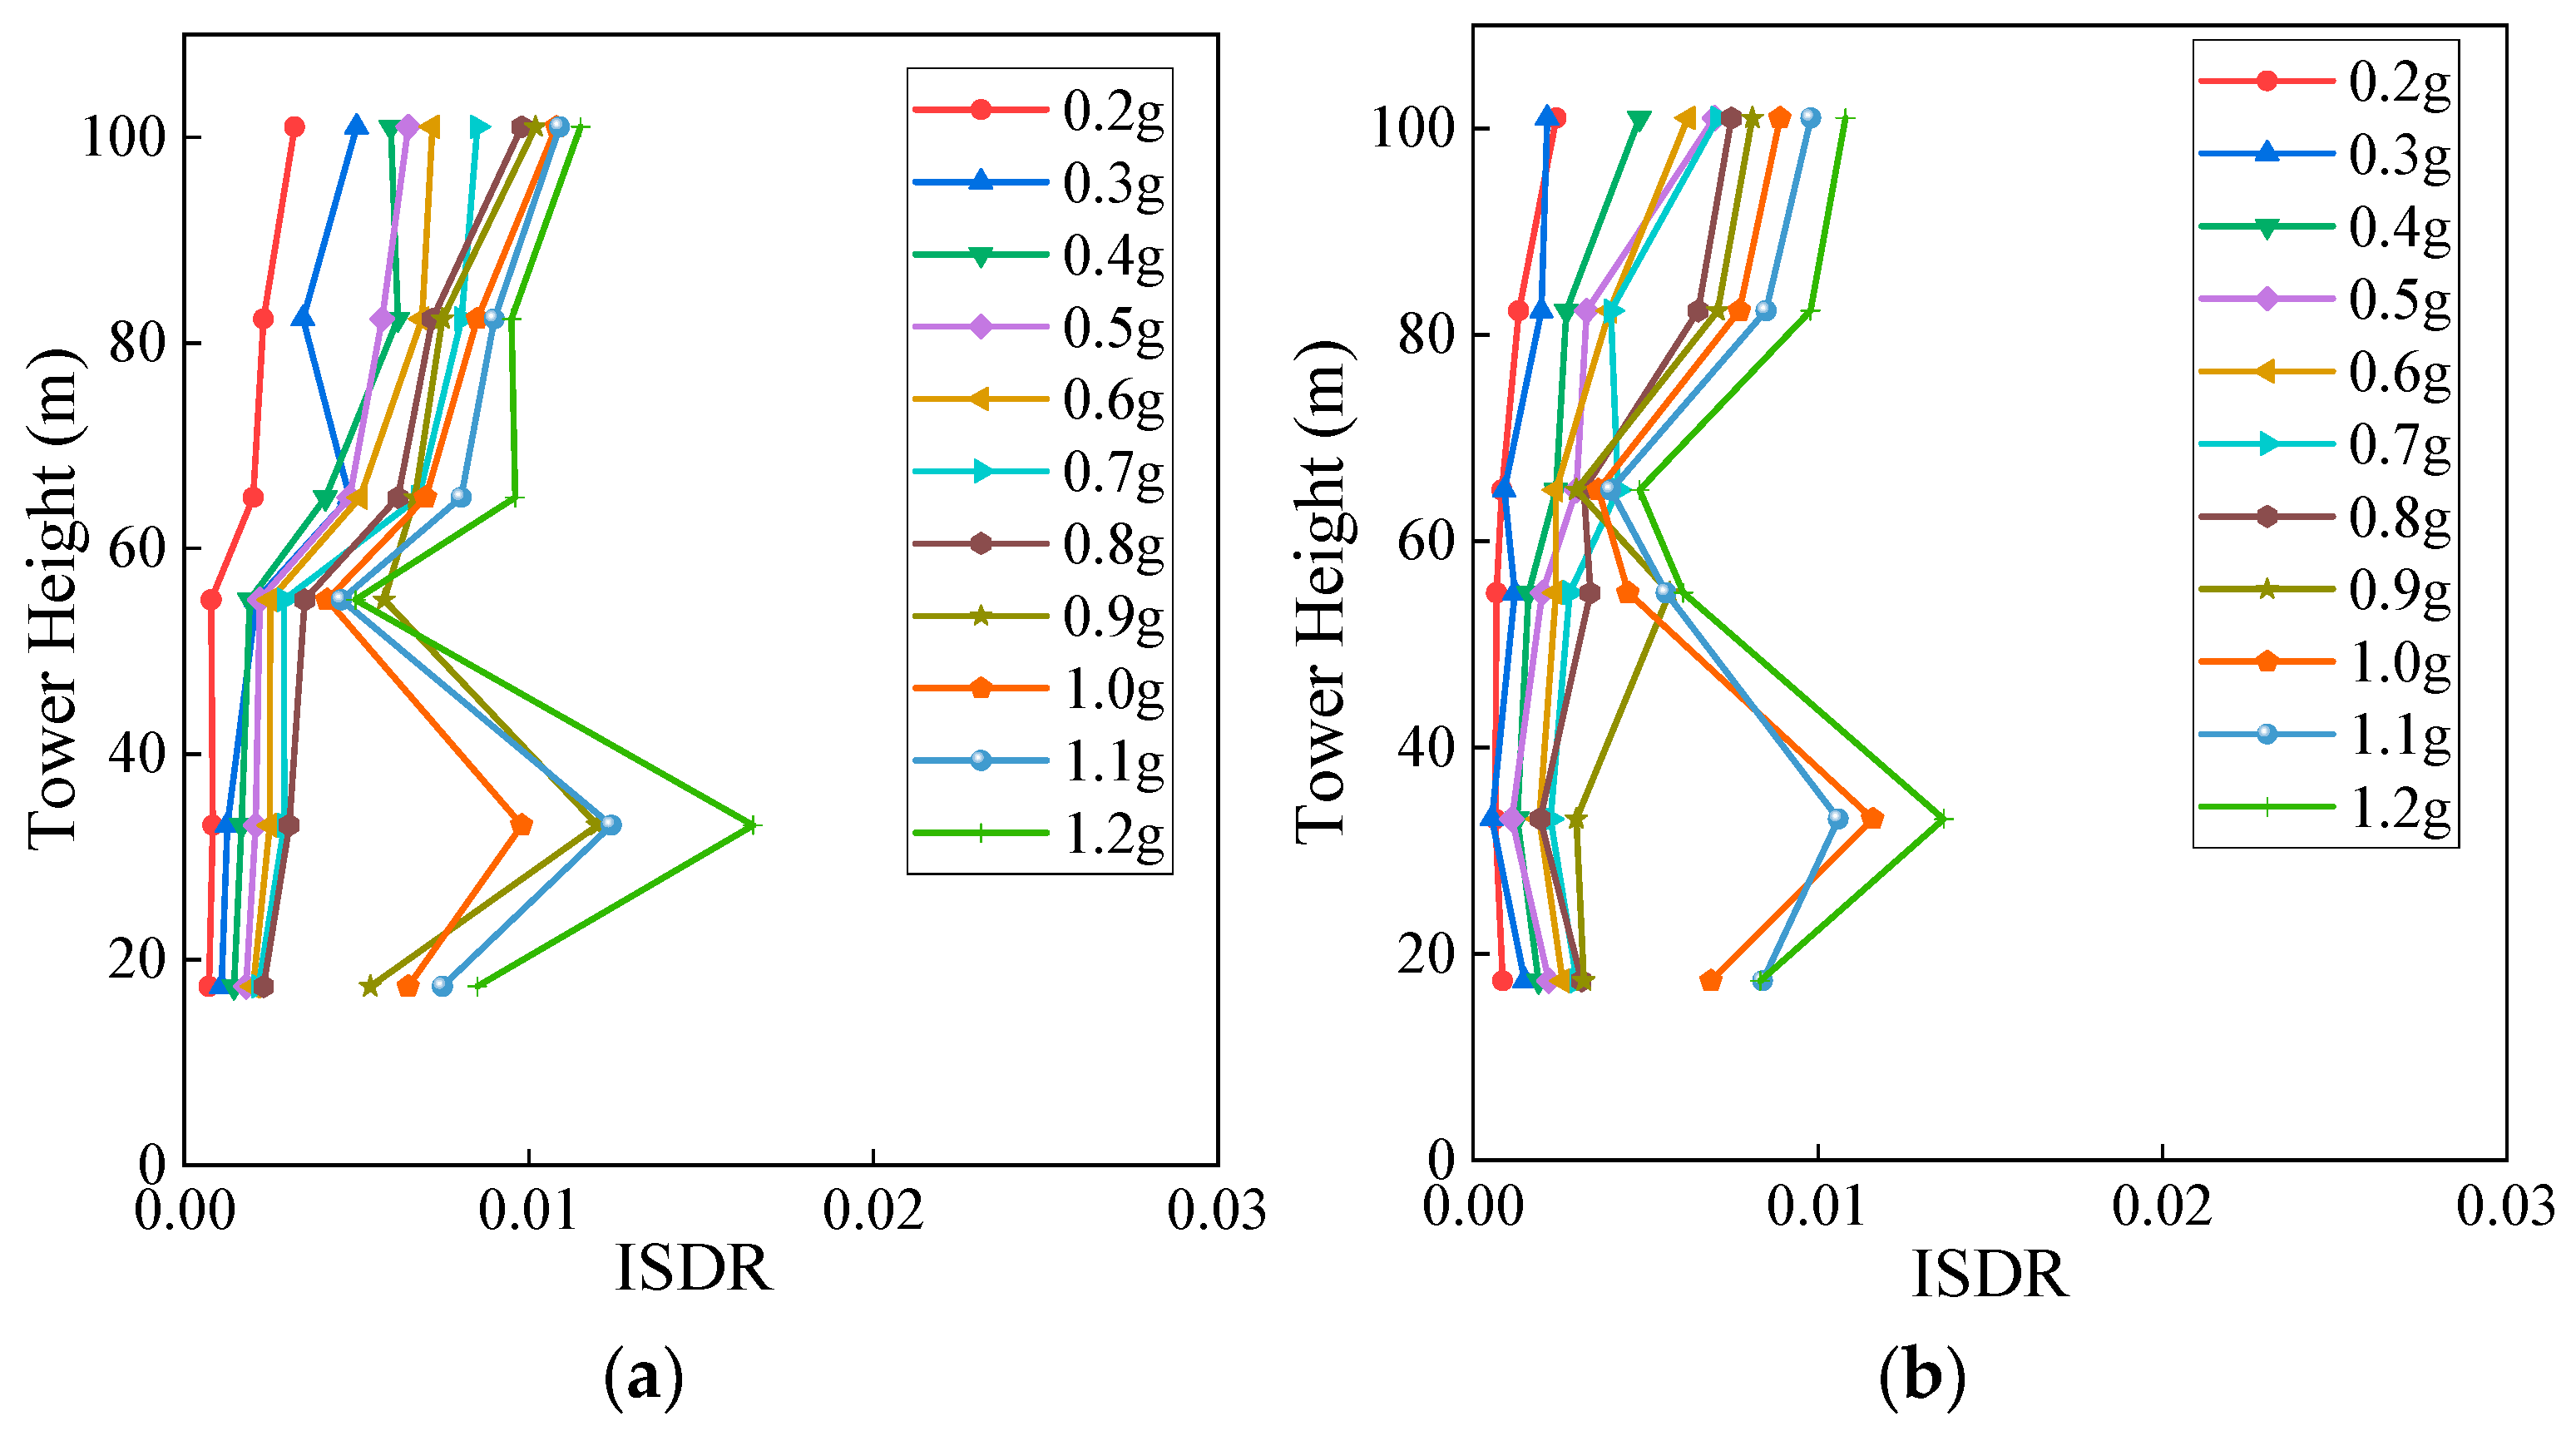
The median displacement angle between transmission towers in the transmission tower–line system under seismic excitation is shown in
Figure 9.
Figure 9a,b, respectively, provide the median displacement angle between transmission towers in the X and Y directions. It can be seen that when the PGA is small, the trend of the ISDR variation in the transmission tower is basically the same; that is, as the height increases, the ISDR gradually increases. As the PGA increases, the trend of the ISDR of the transmission tower changes, indicating that the transmission tower has entered plasticity. When the PGA is 0.2 g, the ISDRs of the first to sixth segments in the X direction are 0.07%, 0.08%, 0.09%, 0.20%, 0.23%, and 0.32%, respectively. When the PGA is 0.8 g, the ISDRs of the first to sixth segments in the X direction are 0.23%, 0.31%, 0.35%, 0.62%, 0.72%, and 0.98%, respectively. It can be seen that the seismic PGA increases significantly from 0.2 g to 0.8 g in the third and fourth segments. When the PGA is less than 1.0 g, the ISDR of the transmission tower is less than 2%. When the PGA is 1.0 g and 1.1 g, although the ISDR of the transmission tower is less than 2%, there is already a mutation position. When the PGA is 1.0 g, the ISDR mutation position of the transmission tower in the X direction is 17.4 m, and the ISDR is 0.014. When the PGA is 1.1 g, the ISDR mutation position of the transmission tower in the Y direction is 33.1 m, and the ISDR is 0.011. When the PGA of the local seismic intensity is low, the ISDR of the sixth segment is the highest. As the seismic intensity gradually increases, the ISDR of the lower segment of the transmission tower gradually increases. The results above indicate that with the increase in seismic intensity, the damage mode of transmission towers gradually shifts from overall bending deformation to concentrated plastic deformation in the middle and lower segments (such as the second and third segments), clearly revealing the nonlinear evolution process of the structure and the transfer path of weak links.
Table 5 summarizes the locations of the damaged segments in the transmission tower within the tower–line system under ten different seismic excitations. The inter-story locations are defined as follows: X and Y represent the X and Y directions in the finite element model, respectively, and the numbers indicate the segments positions. For example, “Y3” denotes the third segment in the Y direction of the transmission tower. Based on this information, it can be concluded that the weak areas of the transmission tower are located at the second and third inter-story segments, and the mutation points (i.e., the locations most susceptible to damage) differ between the X direction and the Y direction, primarily due to the inherent asymmetry in structural stiffness of the transmission tower–line system.
4.2. Collapse PGA Analysis
Table 6 lists the collapse PGA and its mean value for the transmission tower–line system under ten different seismic excitations. With the exception of GM01 and GM09, under which the transmission tower–line system did not collapse, the ISDR under all other seismic excitations exceeded the limit of 2%, indicating structural collapse. According to the statistical data in
Table 6, the collapse PGA for the transmission tower–line system ranges from 0.9 g to 1.2 g, with a mean value of 1.07 g.
4.3. Collapse–Failure Process Analysis
Taking GM07 as an example,
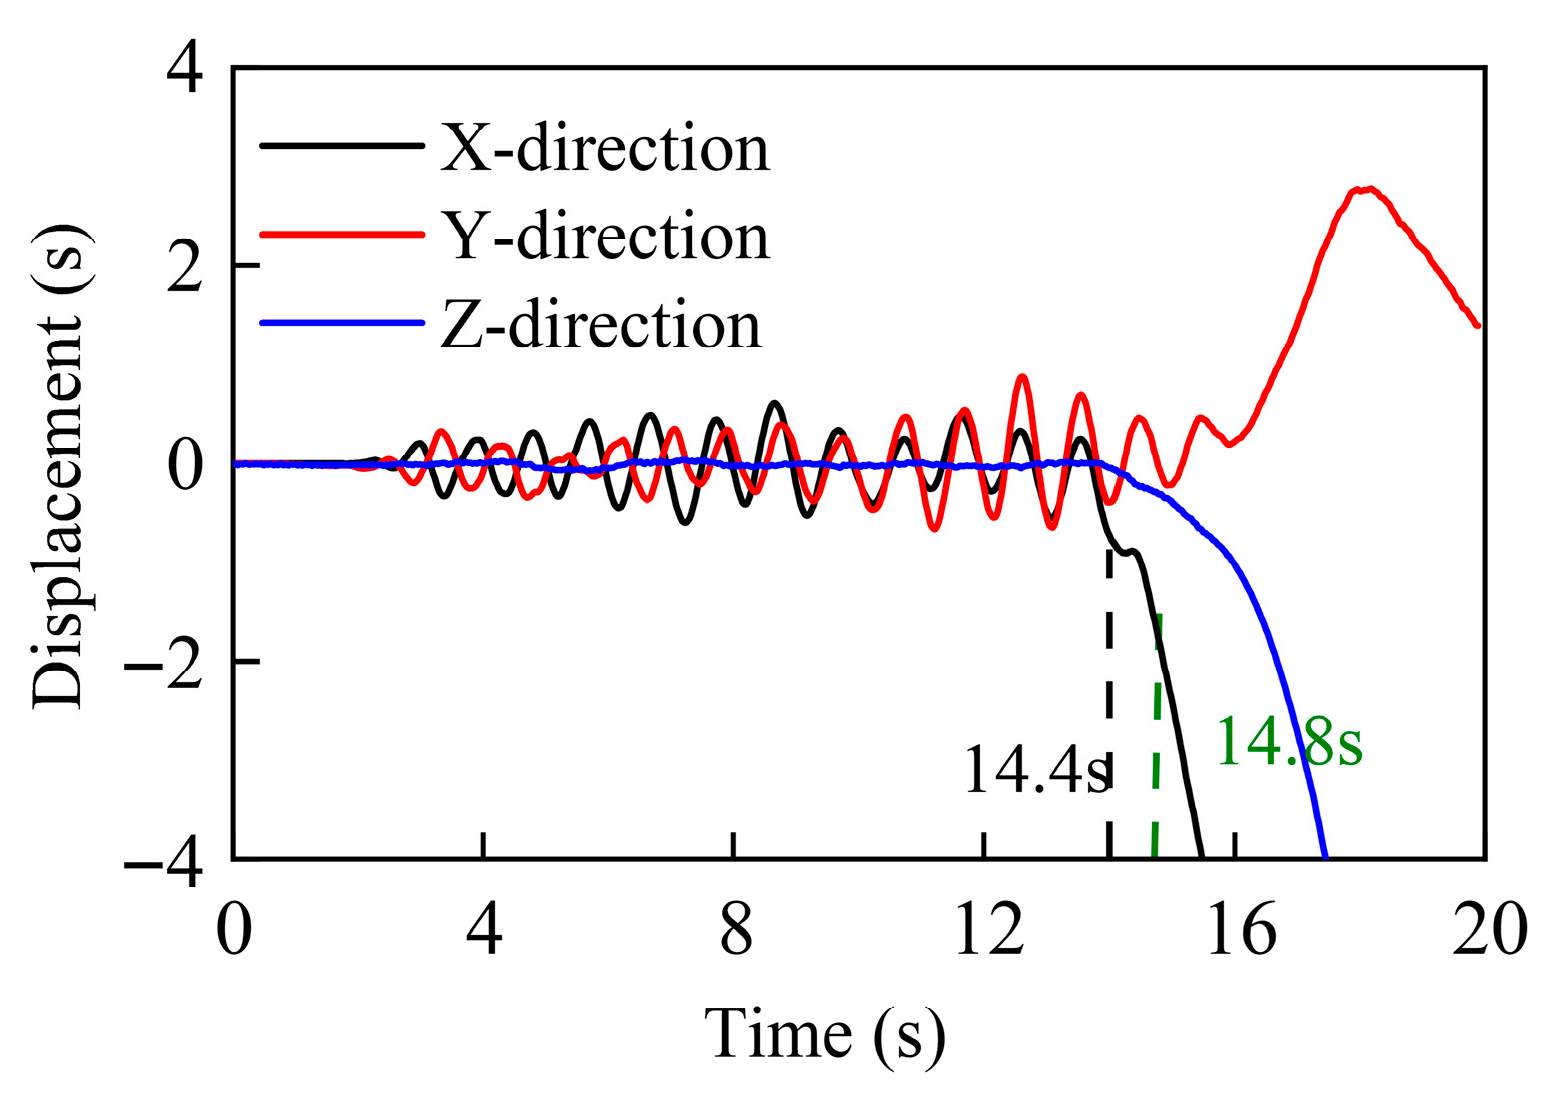
Figure 10 presents the time-history curve of the tower-top displacement for the transmission tower–line system under the collapse PGA seismic excitation condition. It can be observed that in the early stage of seismic excitation, the tower-top displacement ranged from −0.738 m to 0.862 m. When the excitation time reached 14.4 s under the collapse PGA, the tower-top displacement began to exhibit a divergent trend, indicating the onset of damage in the transmission tower–line system. At 14.8 s, the ISDR of the transmission tower exceeded 2%, demonstrating that the transmission tower–line system experienced collapse failure.
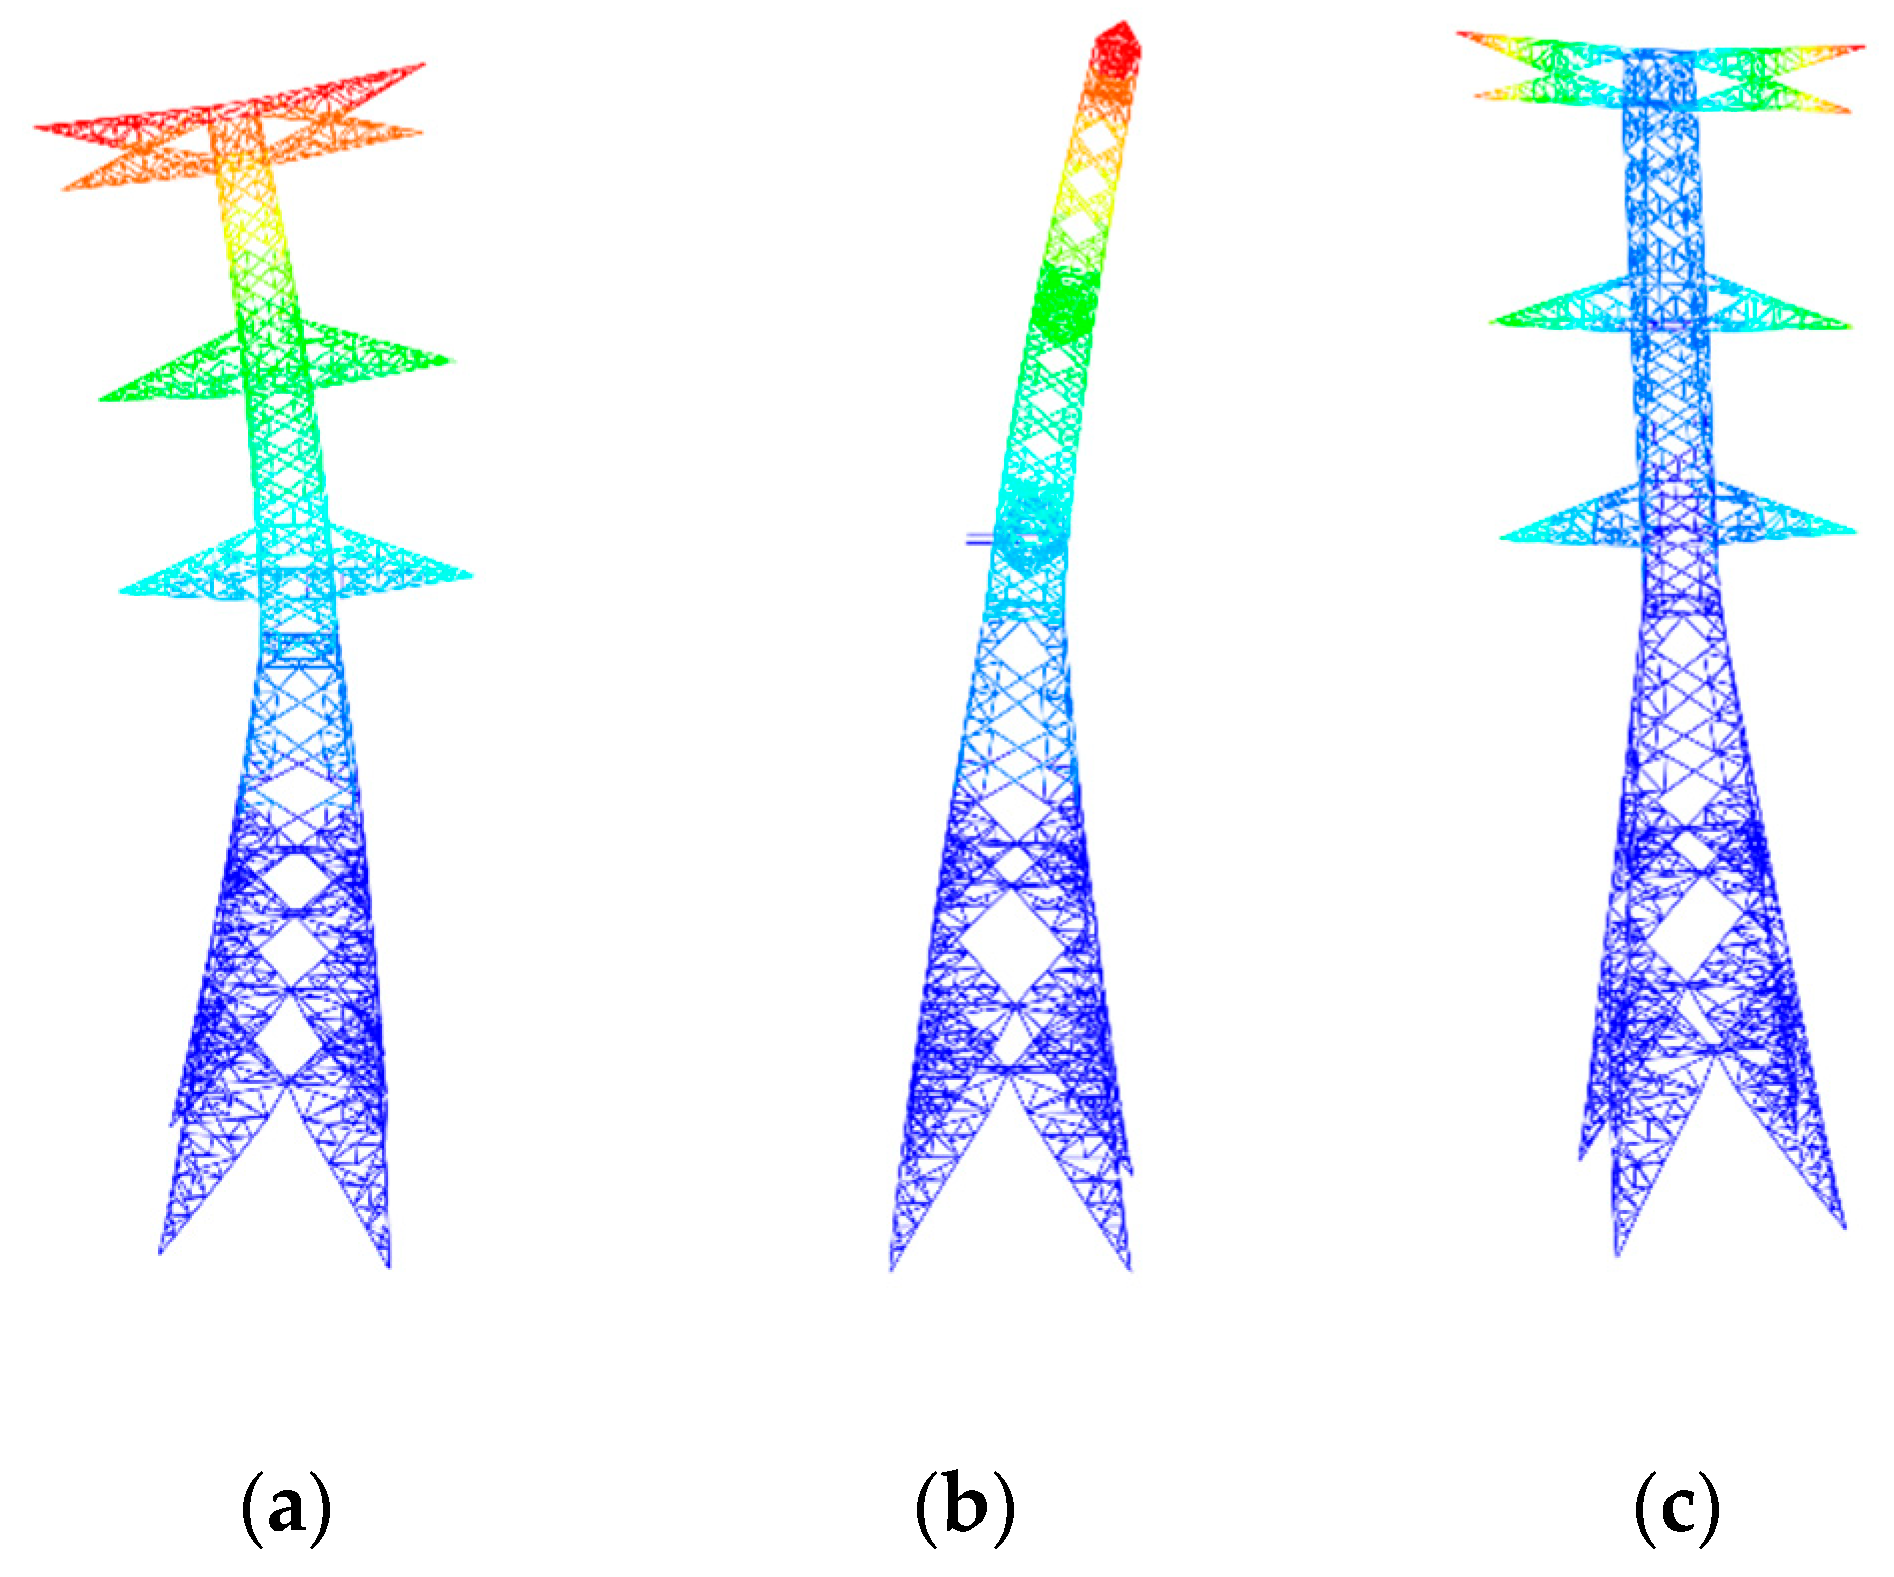
To further analyze the cumulative damage effect of the transmission tower–line system and clarify the process of its progressive collapse, this section quantitatively presents the cumulative damage in the transmission tower members using the SDV4 parameter from a novel nonlinear hysteretic constitutive model. The value of SDV4 increases progressively with the maximum plastic strain and the cumulative plastic strain in the transmission tower members. This accumulation process is monotonic and irreversible. A value of SDV4 = 0 indicates an intact member, whereas SDV4 = 1 signifies that the member has fractured, so it is removed from the analysis.
Figure 11 shows the damage contour of the transmission tower–line system under this seismic excitation condition.
It can be observed that significant deformation occurred in the lower inter-story segments of the transmission tower, leading to the collapse failure of the tower–line system. The collapse process of the transmission tower is as follows: At t = 3.6 s, multiple diagonal members in the lower inter-story segments began to exhibit cumulative damage. By t = 15.0 s, widespread damage had developed in the diagonal, auxiliary, and cross-diagonal members within these segments. A few components reached SDV4 = 1 (complete failure), and significant global structural deformation was observed. Based on the tower-top displacement time-history curve, the transmission tower was determined to have entered a collapsing state. Subsequently, the progression of member failures accelerated. By t = 18.0 s, most members in the lower inter-story segments were severely damaged, with multiple components reaching SDV4 = 1, resulting in extensive deformation of the overall structure.
5. Fragility Analysis of the Transmission Tower–Line System
Seismic fragility of a structure refers to the probability of the structure reaching a specific performance level under seismic excitations of varying intensities. It serves as a scientific basis for assessing the seismic performance of the structure and estimating the potential extent of damage it may sustain during an earthquake [
28,
29,
30]. Based on the IDA results from
Section 4, this section analyzes the seismic performance of a typical transmission tower–line system by developing fragility curves. First, pushover analysis was conducted to quantify the threshold values for different performance levels of the transmission tower. Then, using the maximum ISDR of the tower as the seismic demand parameter and PGA as the seismic intensity measure, the seismic demand relationship of the system was established. Based on this, fragility curves were generated to analyze the seismic damage of the transmission tower system.
5.1. Quantification of Critical States
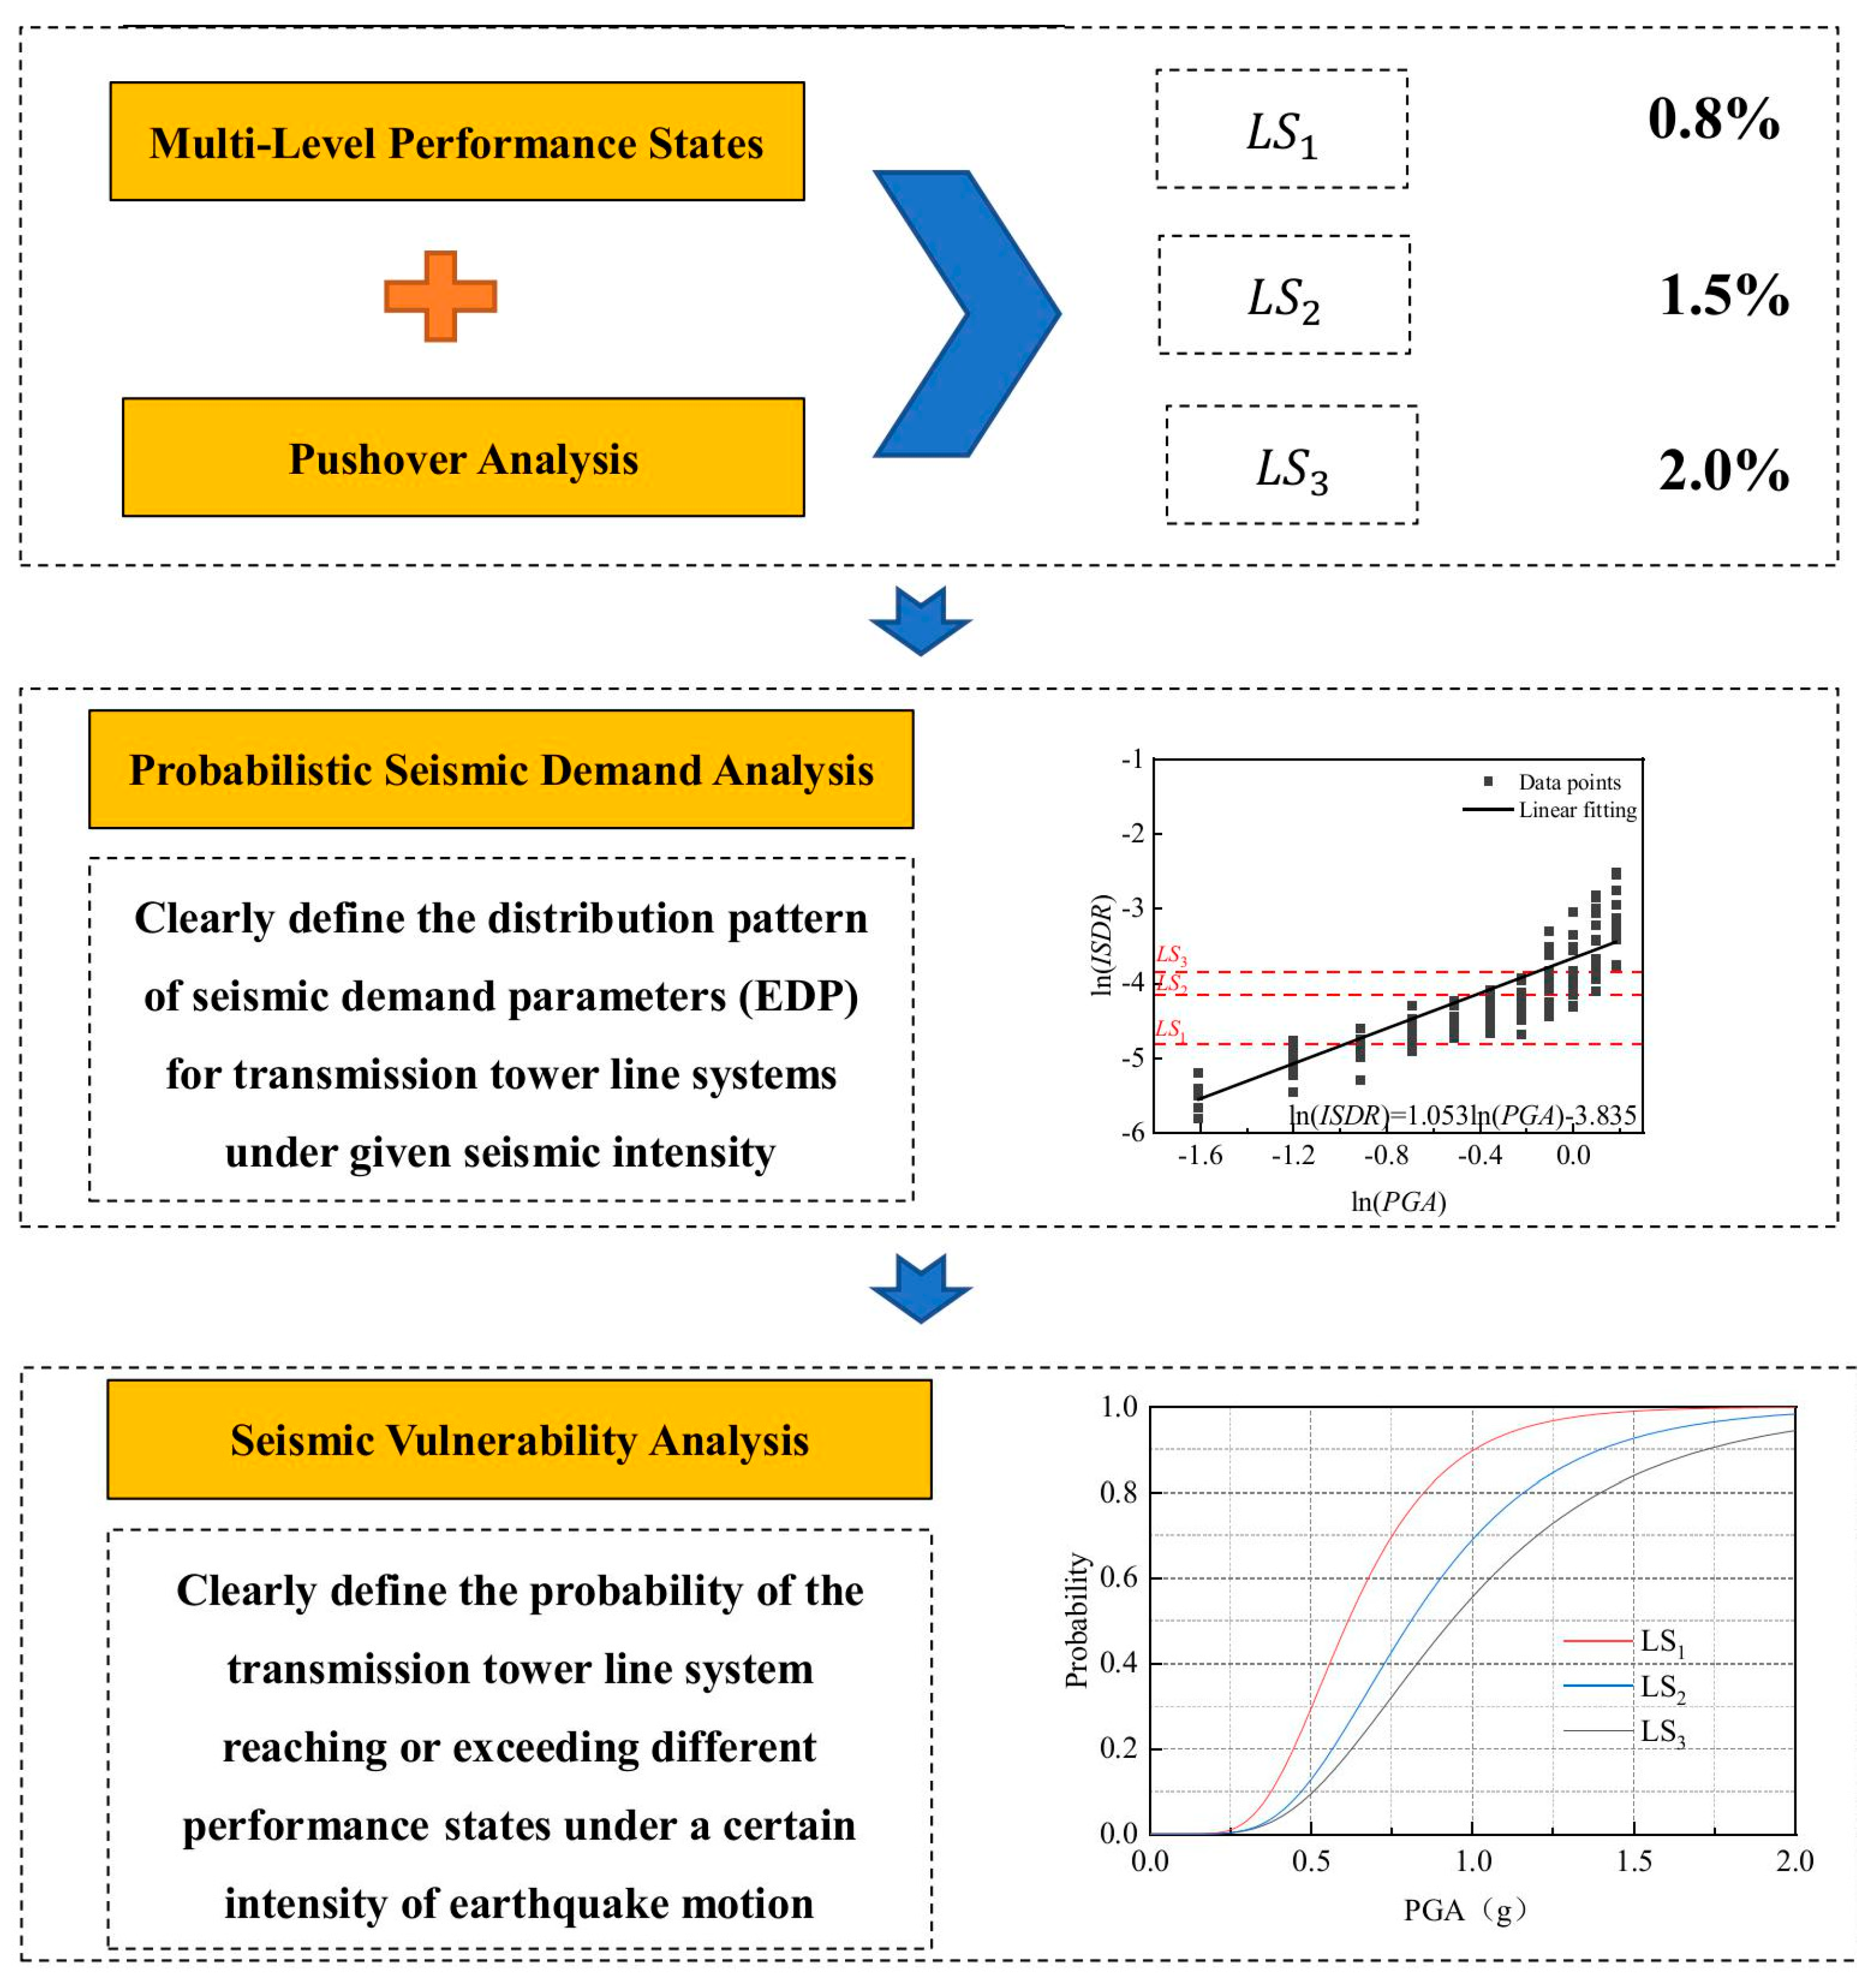
The fragility analysis workflow for the structural system is shown in
Figure 12. The quantitative assessment of different performance levels for the selected transmission tower–line system serves as the starting point of the fragility analysis. According to ‘Seismic Grade Classification for Lifeline Engineering’ (GB/T 24336-2009) [
31], the seismic damage grades of the transmission tower system are divided into five phases: Grade I (essentially intact), Grade II (slight damage), Grade III (moderate damage), Grade IV (severe damage), and Grade V (collapse). For a transmission tower subjected to severe damage, under seismic action, damage to its members accumulates rapidly, causing the structure to swiftly enter a collapsing state—that is, to reach a state of complete collapse. It can be considered that once such a transmission tower–line system experiences severe damage during an earthquake, it will inevitably progress to collapse. Therefore, this study categorizes severe damage and collapse of the transmission tower–line system as the same damage grade. Specifically, four damage states (
DS) are defined, namely essentially intact (
), slight damage (
), moderate damage (
), and severe damage/collapse (
), as listed in
Table 7. Correspondingly, there are three limit states (
):
,
, and
.
A pushover analysis was conducted on the transmission tower to obtain the relationship curve between the base shear force and the ISDR. This curve was used to determine the various limit states, thereby enabling a quantitative evaluation of the damage grades. The pushover analysis applies laterally distributed forces that incrementally increase according to a specific pattern along the height of the structure, simulating the distribution of story shear forces under seismic action. The reasonableness of the selected lateral force distribution pattern directly affects the accuracy of the pushover analysis results. For slender structures like transmission towers, the story mass can be assumed to be uniformly distributed along the height [
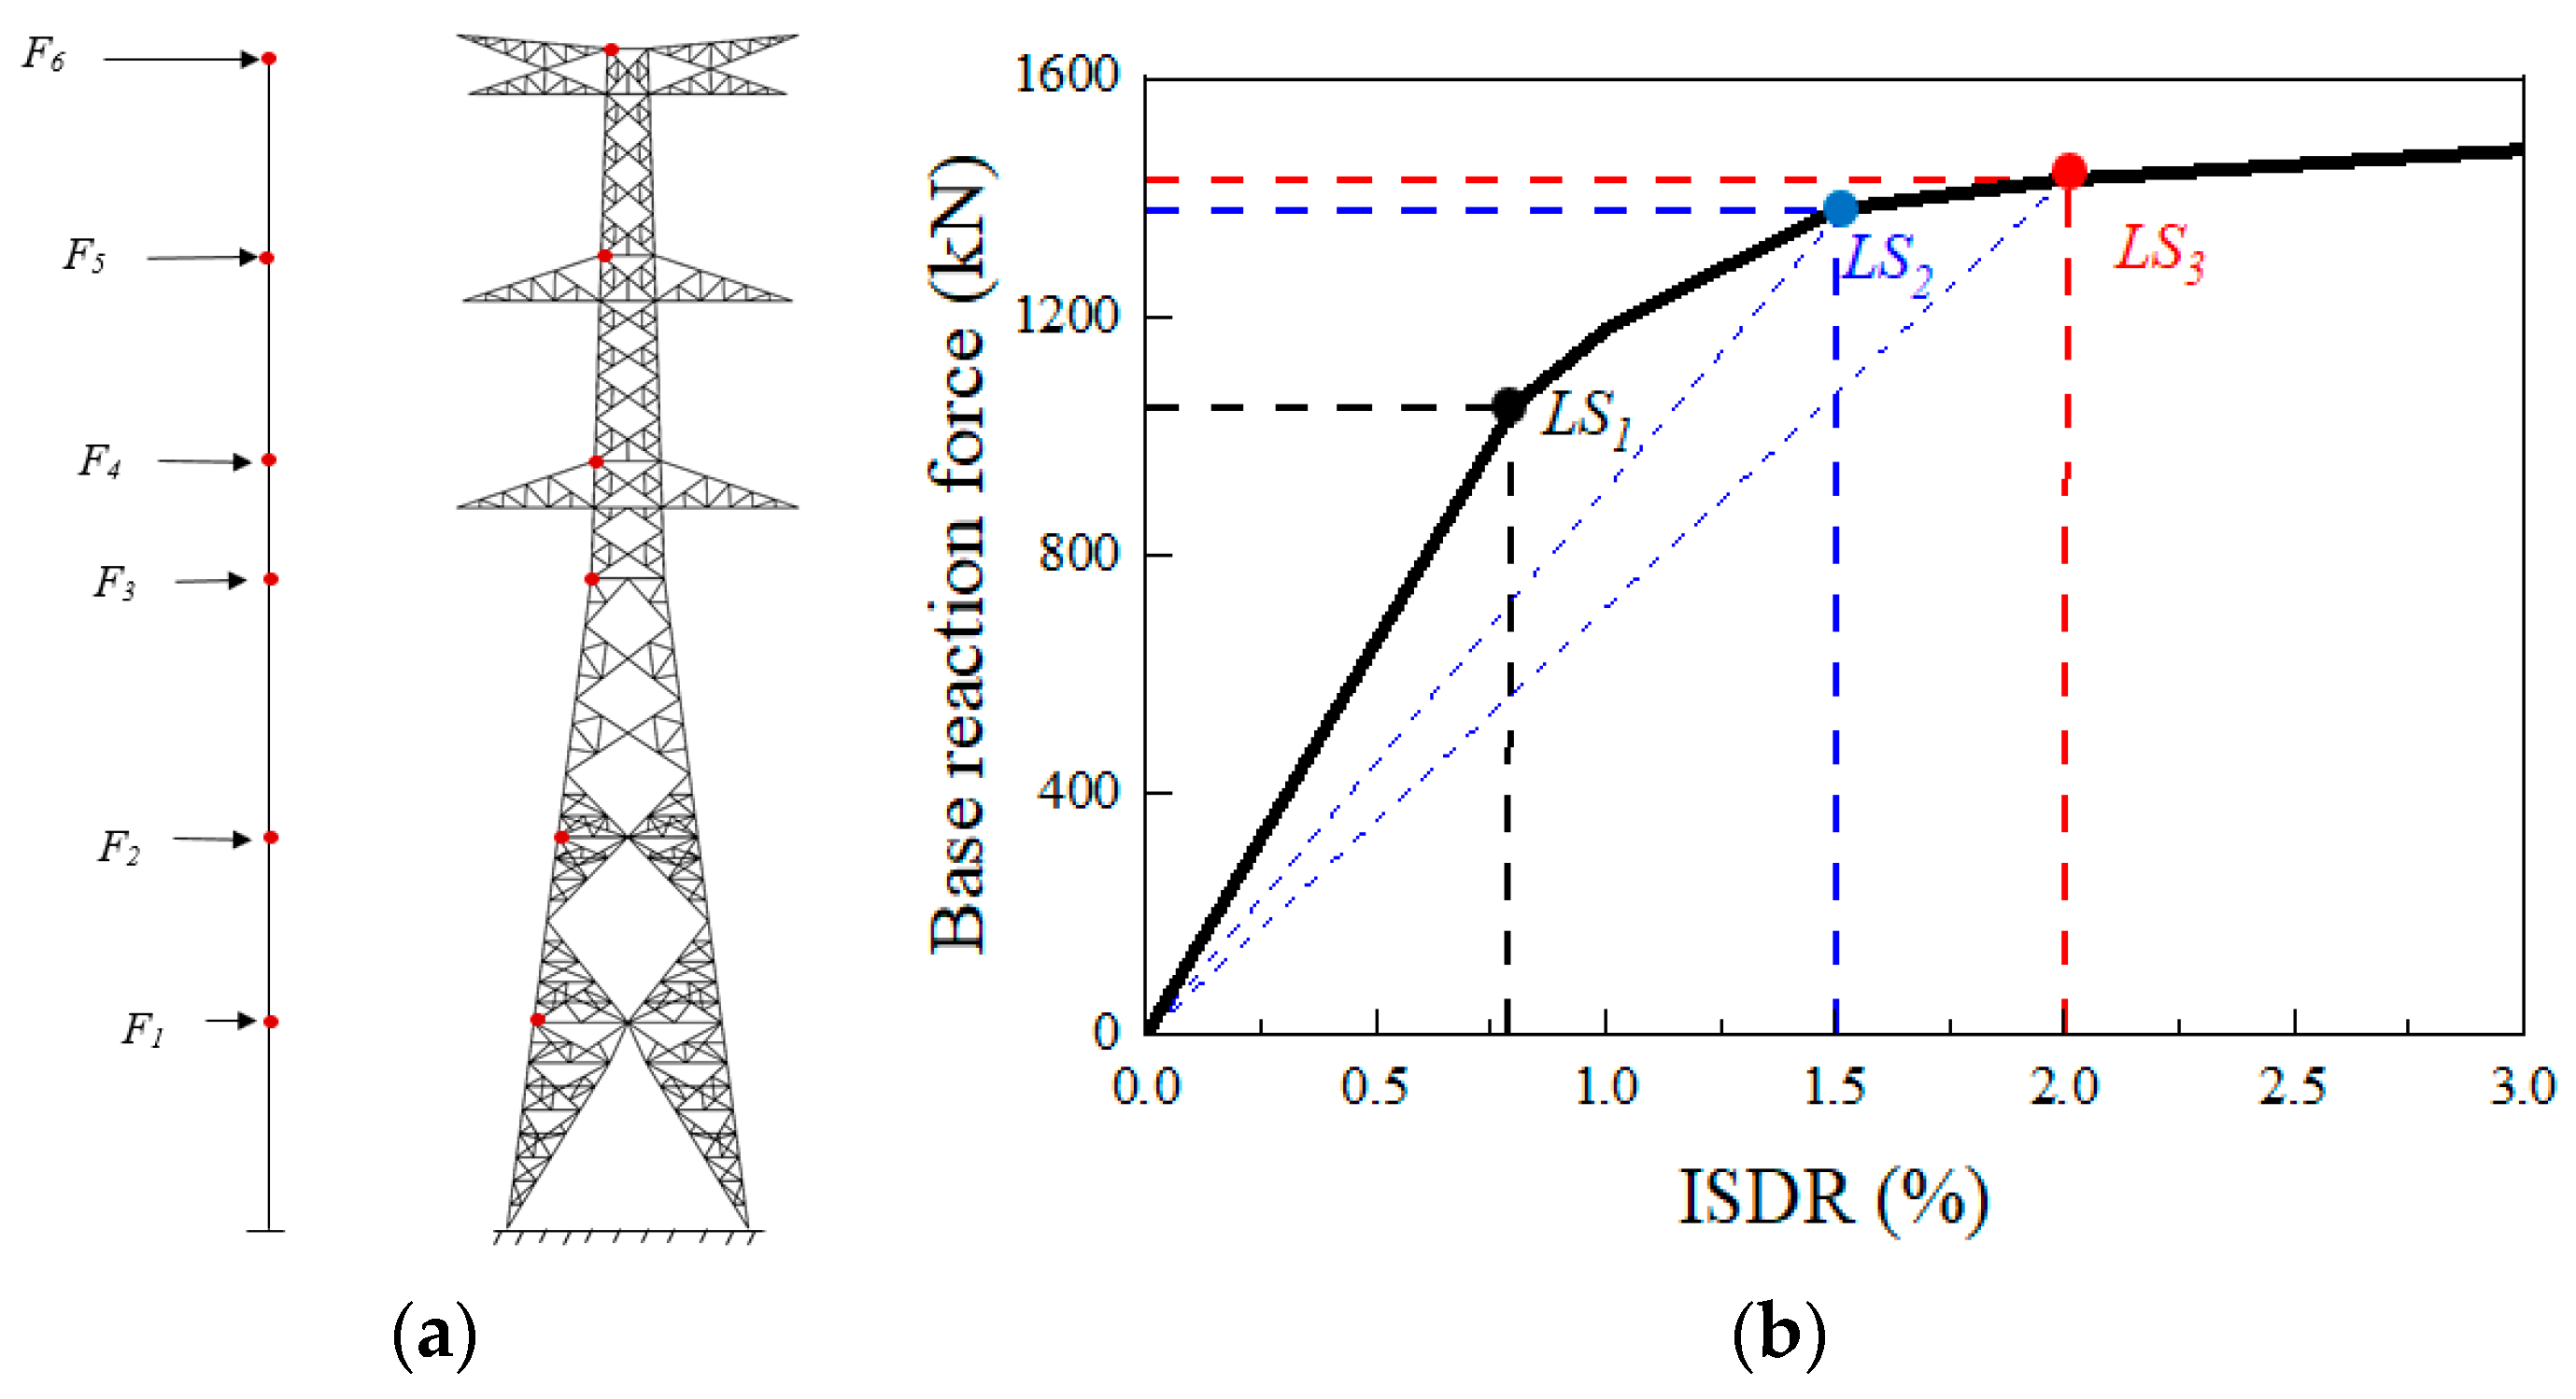
32]. Therefore, this chapter employs an inverted triangular distribution load to apply lateral forces to the transmission tower, as shown in
Figure 13. We performed a “static” pushover analysis using a fixed inverted triangular load distribution pattern. Its core characteristic is that the lateral force distribution pattern applied to the structure (defined by Equation (2) in the revised manuscript) is predetermined and remains fixed throughout the entire analysis process. The calculation formula for the lateral forces on the transmission tower is as follows:
In the formula, i is the inter-story segment number, where i = 1, 2, 3, …, 6; n is the total number of inter-story segments; Fi is the lateral force applied to the ith segment; mi is the mass of the ith segment; hi is the height of the ith segment; and Vb is the base shear of the transmission tower.
Figure 13.
Definition of limit states from the pushover analysis. The images are listed as follows: (a) schematic diagram of lateral force and (b) ISDR–base shear force curve.
Figure 13.
Definition of limit states from the pushover analysis. The images are listed as follows: (a) schematic diagram of lateral force and (b) ISDR–base shear force curve.
Based on the pushover analysis, the relationship between the base shear force and the maximum ISDR of the transmission tower was obtained, as shown in
Figure 13. The figure also indicates the limit states corresponding to various damage grades of the transmission tower. The linear segment of the curve ends at an ISDR of approximately 0.8%; before this point, the structure can be considered to remain within the elastic range, which is consistent with the findings by Kwon et al. [
33]. As loading continues, some members begin to yield, leading to a reduction in the curve’s slope. A more pronounced decrease in slope occurs at an ISDR of 1.5%, suggesting that severe damage has initiated in certain members, beyond which repair of the transmission tower is necessary. When the ISDR reaches 2%, the slope of the curve approaches zero. Since 2% is the predefined collapse limit for the transmission tower, this point is regarded as the structural collapse point. Consequently, the ISDR values corresponding to limit states
LS1,
LS2, and
LS3 are 0.8%, 1.5%, and 2%, respectively. Based on the pushover analysis results, the inter-story drift ratio intervals and limits for the structural damage grades were determined, as listed in
Table 7.
5.2. Probabilistic Seismic Demand Model (PSDM)
The core step in conducting a seismic fragility analysis is to establish a probabilistic seismic demand model (PSDM), which describes the probabilistic relationship between an earthquake intensity measure (IM) and an engineering demand parameter (EDP). This relationship is generally assumed to follow a lognormal distribution, and the following expression can be obtained through regression analysis:
In the formula, a and b are regression coefficients determined through linear regression.
Based on the database of ISDR responses of the structure under different seismic records and varying PGAs obtained from
Section 4, the IDA curves for the constructed transmission tower–line system were derived.
Figure 14a,b present the clusters of IDA curves for the transmission tower in the X and Y directions, respectively, along with the 16th, 50th, and 84th percentile IDA curves. It can be observed that the maximum ISDR in the transmission tower–line system gradually increases with rising PGA. When the PGA reaches a certain critical value, the IDA curves exhibit a distinct inflection point, where the ISDR increases rapidly and exceeds the limit, indicating that the transmission tower–line system experiences severe damage or even collapse. In the 50th percentile curve, the PGA at the inflection point is approximately 1.0 g, which is close to the collapse PGA of the transmission tower–line system.
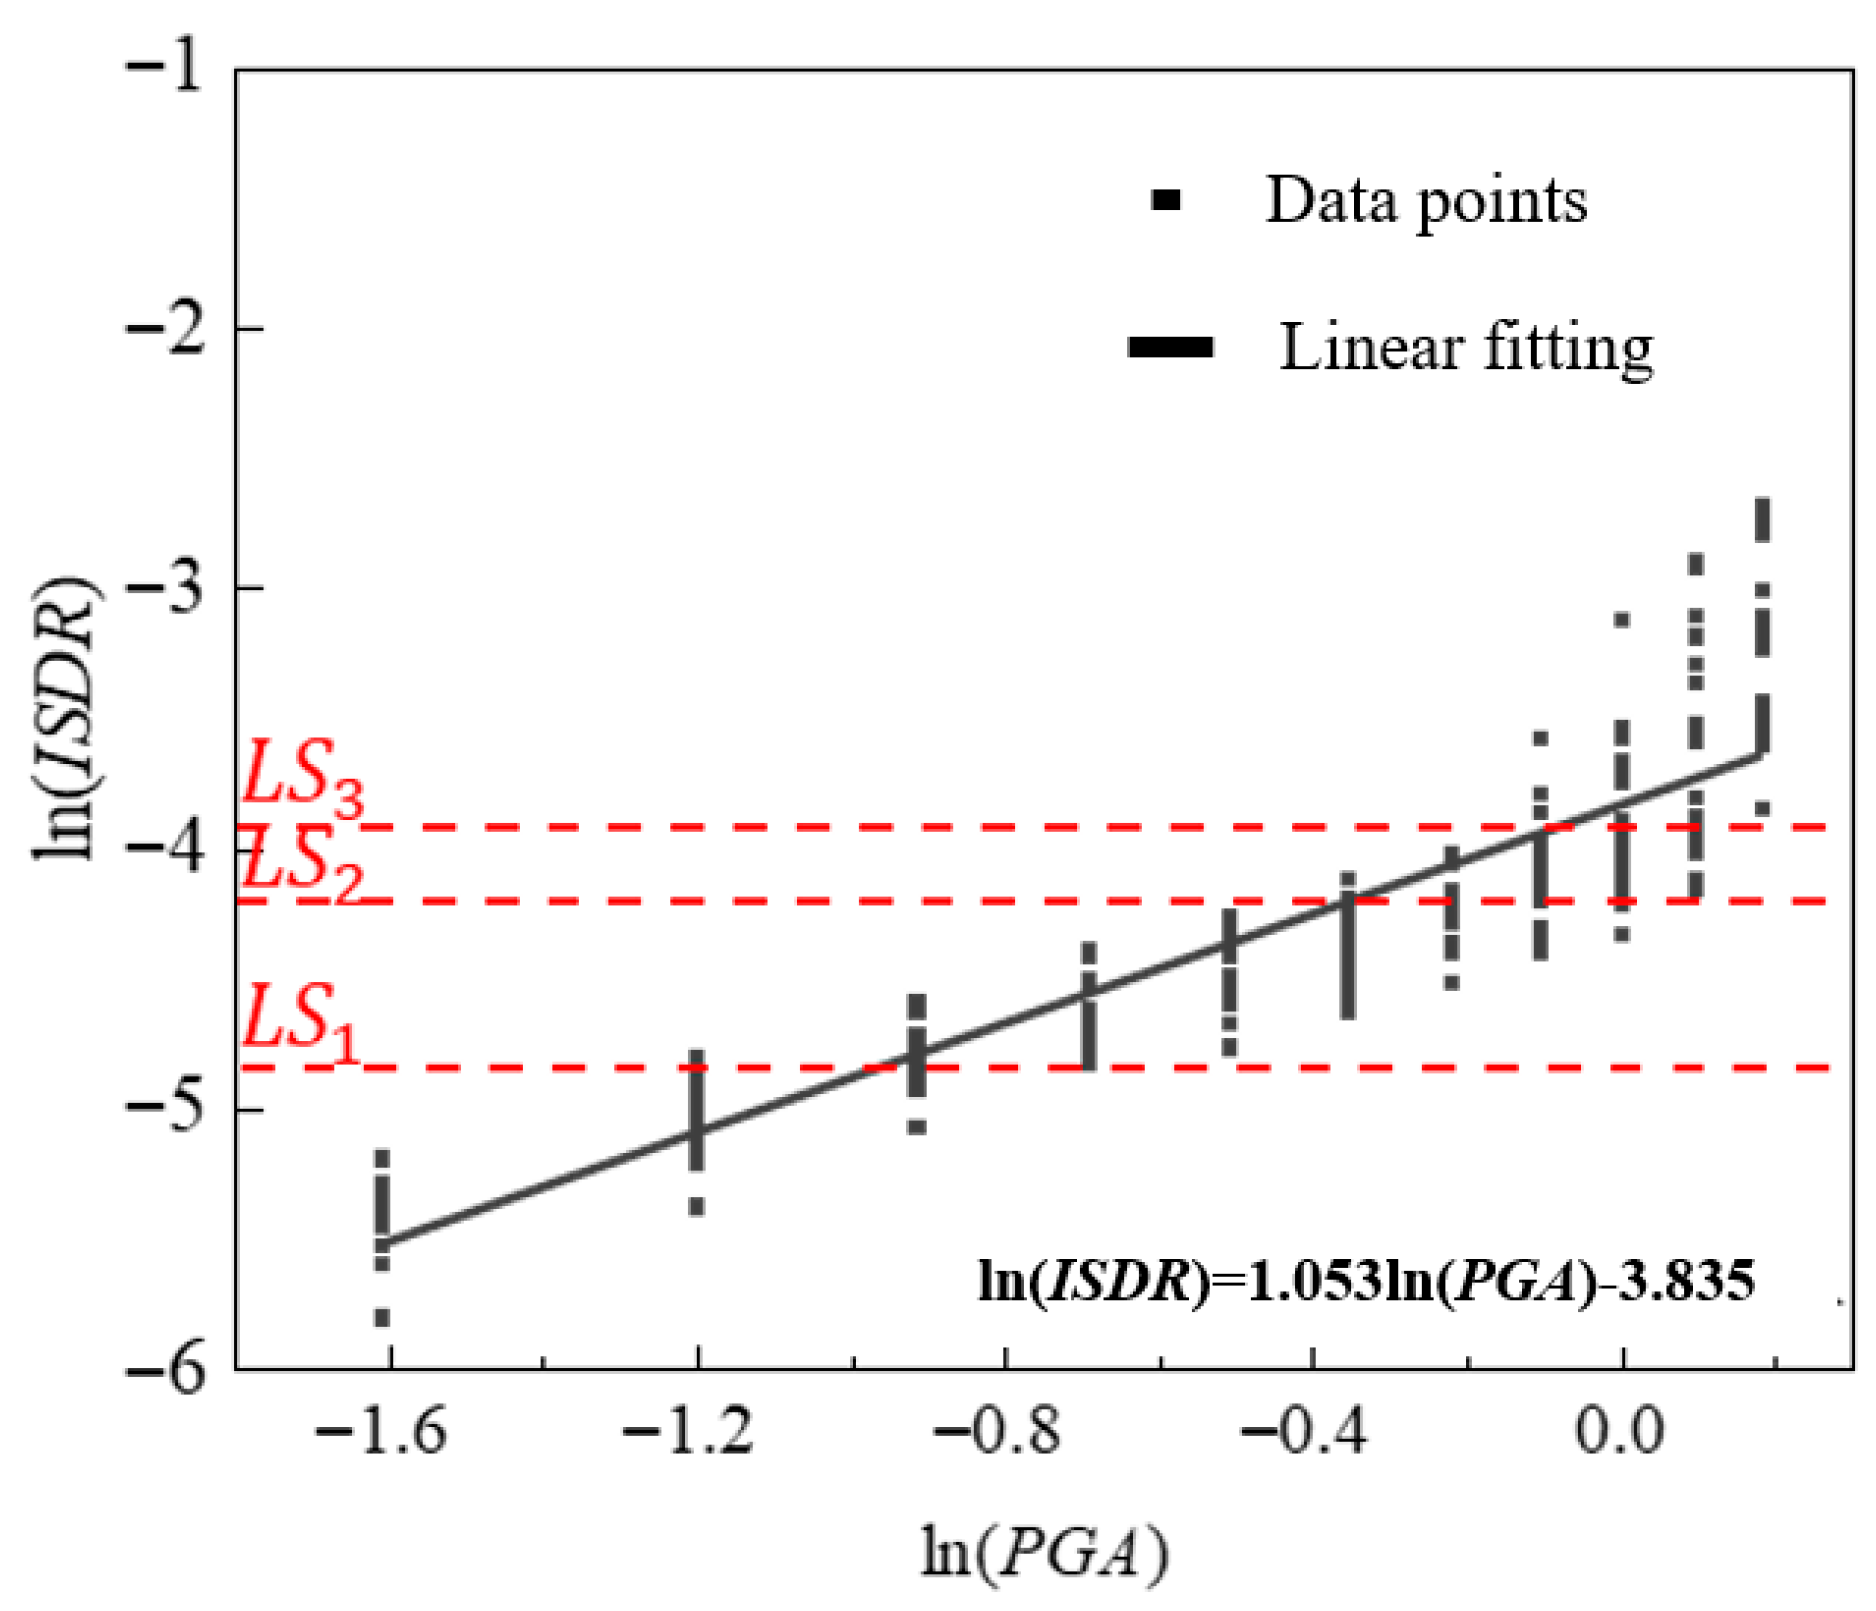
Figure 15 displays the logarithmic scatter distribution of PGA versus the ISDR for the transmission tower–line system and its linear fitting results. In the figure, each column of data points shares the same PGA value, with PGA increasing sequentially from 0.2 g to 1.2 g for different columns. The limit states
LS1,
LS2, and
LS3 defined in
Section 5.1 are set at 0.8%, 1.5%, and 2%, respectively, with corresponding logarithmic values of −4.81, −4.18, and −3.95. When the PGA is below 0.7 g, the ISDR values of the transmission tower–line system are mostly below the limit specified by
LS2, indicating that the structure remains primarily in an essentially intact or slightly damaged state. In contrast, under higher seismic intensities, some data points exceed
LS3. For instance, at a PGA of 1.2 g, all data points surpass the
LS3 limit, indicating that the structure has undergone significant deformation and is in a state of severe damage or collapse. Moreover, as the seismic intensity increases, the dispersion of the inter-story drift angles gradually widens. For example, the distribution range of drift angles at a PGA of 1.2 g is noticeably larger than that at 1.0 g, further reflecting the enhanced nonlinear response and more pronounced variability in deformation capacity after the structure enters the plastic stage. Linear regression of ln(
PGA) against ln(
ISDR) yields fitting coefficients a and b of 1.053 and −3.835, respectively.
5.3. Fragility Analysis
Based on the obtained PSDM, the fragility equation for the transmission tower–line system can be derived using Equation (4).
In the formula, D represents the seismic demand; C represents the structural capacity; denotes the standard normal distribution function; represents different limit states; and and are the logarithmic standard deviations of the seismic demand and structural capacity, respectively. When PGA is used as the intensity measure in the seismic fragility analysis, is taken as 0.5.
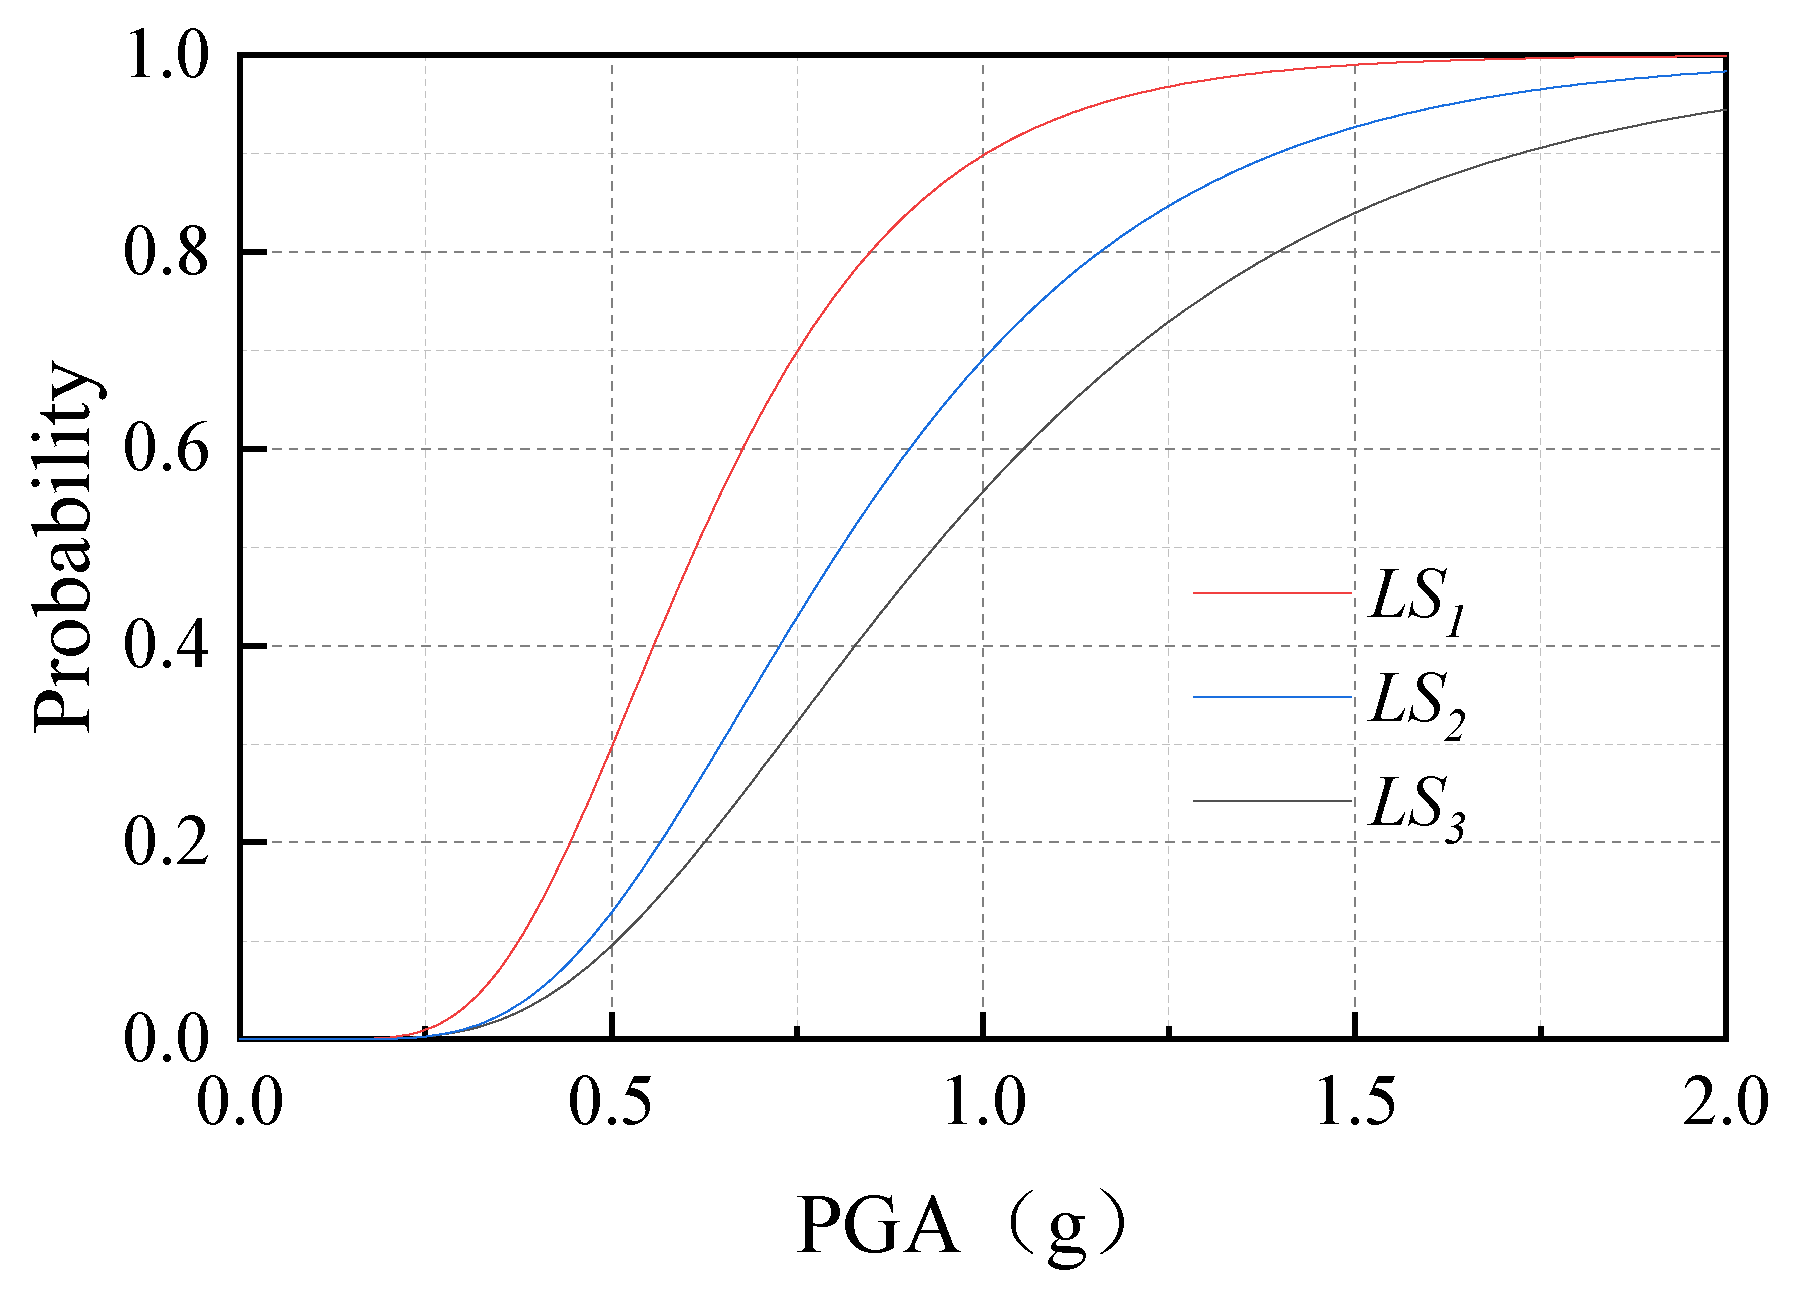
Figure 16 shows the fragility curves of the transmission tower–line system. It can be observed that the probability of structural failure gradually increases with rising seismic intensity. The probabilities of exceeding limit states
LS1,
LS2, and
LS3 increase rapidly at PGAs of 0.26 g, 0.35 g, and 0.41 g, respectively. When the PGA reaches 1.0 g for
LS1,
LS2, and
LS3, the probabilities of failure exceed 90%, 65%, and 55%, respectively. The trend of the fragility curves corroborates the phenomenon observed in
Section 3, where the structural response intensified significantly with increasing PGA, thereby quantifying the safety margin from a probabilistic perspective.
