Abstract
Bridge columns, as core load-bearing and force-transferring components in bridge structures, are highly susceptible to partial damage and even global failure when subjected to close-in explosions. Therefore, analyzing the damage characteristics of reinforced concrete (RC) bridge columns under such blast scenarios and developing corresponding damage assessment methods are significant. In this study, a high-fidelity three-dimensional numerical model of an RC bridge column was developed in ANSYS/LS-DYNA and validated against field blast experimental measurements. Using the verified model, the typical failure processes and damage mechanisms of the column were systematically investigated. According to the extent of cross-sectional damage, the failure modes of the column were classified into three types: non-spalling, spalling, and breaching. Additionally, the influence of initial axial load was considered, and the regions for different failure modes were analyzed. Finally, on the basis of the analysis of failure modes and residual capacity, a material loss-based damage index P was proposed, and the relationship curves between residual capacity-based damage indices D and P under different damage modes were established. Using the control variable method, the relationship between these two indices under the influence of a single parameter was further explored, and empirical formulas were derived to express the correlations among longitudinal reinforcement ratio, damage index D, and damage index P under both non-spalling and spalling damage modes.
1. Introduction
Over the past half-century, global security has grown increasingly precarious due to numerous terrorist threats and accidental blast loads. Strategic transportation infrastructure, including bridges, is now exposed to escalating threats from blast incidents. Studies have shown that bridge structures are often damaged by close-in explosions, severely compromising their functionality and highlighting their high vulnerability to such threats [1,2,3]. As critical load-bearing components, reinforced concrete (RC) bridge columns are particularly susceptible—once damaged, they can lead to partial or even total structural collapse. Therefore, it is of great significance to investigate the damage behavior and assessment of RC bridge columns subjected to close-in blast loading.
Currently, there is a number of studies on the failure mode of RC slabs/beams under blast loads, and some specifications/manuals for blast-resistant design have been published [4,5,6,7]. Although studies on RC columns have received widespread attention, their progress is relatively lagging. The United States National Transportation Research Board (TRB) conducted a group of small standoff explosion tests on RC bridge columns when compiling the highway bridge blast design guide [8]. Sixteen half-scale RC columns were tested, and the observed failure modes were classified into three categories: non-spalling, spalling, and breaching. Accordingly, Puryear et al. [9] used a 3D model developed in LS-DYNA to investigate the three failure modes and define boundaries between regions of different modes. Zong et al. [10] conducted blast experiments on RC bridge columns and similarly observed the above three failure modes. Additionally, the study found that cover concrete spalling occurred exclusively on the column sides, a phenomenon not reported in previous studies on RC slabs and beams. Yan et al. [11] and Cui et al. [12] conducted extensive numerical simulations to study the failure modes and local damage mechanisms of RC columns subjected to blast loads. Their results indicate that the sensitivity of RC column damage to explosive mass is stronger under close-in explosions than far-field explosions. For instance, according to Yan et al. [11], a 0.4 kg change in explosive mass can lead to different failure modes of RC square columns.
It is noticed from the above literature review that several major local failure modes of RC columns have been identified; however, due to the complex and high level of variability of failure modes under close-in explosions, few studies have addressed damage assessment of RC columns under such conditions. Shi et al. [13] evaluated the damage degree of axially loaded RC columns under close-in detonations through blast tests and residual load-bearing capacity tests. Li et al. [14] obtained residual load-bearing capacity data for a batch of steel-concrete columns through field tests and conducted extensive parameter analysis based on test results, fitting a formula for rapid prediction of residual load-bearing capacity. In addition, assessment methods based on blast vulnerability analysis and machine learning have also attracted increasing attention. Lv et al. [15] conducted explosion tests and axial compression tests on RC columns and proposed a performance-based probabilistic fragility framework, in which the uncertainty of blast distance caused by weapon targeting accuracy was considered. Momeni et al. [16] performed a reliability-based blast fragility analysis of steel columns, considering uncertainties in loading and material properties, and proposed practical formulas for estimating safe scaled distances. Zhang et al. [17] presented a performance-based approach for blast fragility analysis of FRP-strengthened RC columns, establishing fragility curves for both typical and FRP-strengthened columns. Zhou et al. [18] employed deep learning models to predict and assess various failure modes and the extent of damage of blast-loaded RC columns. Almustafa et al. [19] introduced a machine learning model utilizing the gradient boosting regression tree algorithm, which can accurately and efficiently predict the maximum deflection of blast-loaded RC columns. It is evident that some effective assessment methods for RC column damage have been proposed, but recent research works specifically targeting close-in explosions are limited, especially studies that address different failure modes. Therefore, it is necessary to investigate damage assessment methods for RC bridge columns under close-in explosions, with consideration of various failure modes. In this paper, a high-fidelity three-dimensional numerical model of RC bridge columns was established using LS-DYNA. The modeling methods for the column were validated against the field blast tests from open literature. On this basis, the failure modes and their regions of RC bridge columns subjected to close-in blasts were analyzed, and a damage assessment method that accounts for different failure modes was further developed.
2. Numerical Simulation
In this study, a detailed three-dimensional numerical model, including the RC bridge column, TNT explosive, and air domain, is developed in LS-DYNA based on the Arbitrary Lagrangian-Eulerian algorithm. To ensure the accuracy and reliability of the numerical simulation, the model is validated against blast experiment measurements on RC bridge columns from open literature. The validation process includes the blast load, the failure mode, the acceleration response and the residual capacity of the column.
2.1. Finite Element Model
For the verification of the blast load, the RC bridge column is modeled based on a 1/3 scale circular specimen as reported in Ref. [20]. The column has a diameter of 0.4 m and a calculation height of 3.5 m, with additional extensions of 0.5 m below ground level and 0.2 m above the column top to simulate the embedded portion within the pile cap and the confinement from the column top stirrups in real engineering structures. The air region is defined as 1.5 m × 4.0 m × 4.0 m along the X, Y, and Z axes. The three-dimensional model is shown in Figure 1. In this study, a 20 mm mesh is used for the air region, while a refined 10 mm mesh is applied to the TNT block. This meshing strategy has been addressed and validated in our previous work [21]. A 10 mm mesh size is adopted for the entire column model, as determined from a sensitivity analysis using three mesh sizes (5 mm, 10 mm, and 20 mm). The comparison between simulated and measured spalling height and core crushing depth shows discrepancies within 5%. The column’s elements are modeled using the Lagrangian mesh, whereas the explosive and air elements are modeled using the Euler mesh. The blast wave-structure interaction is captured using *CONSTRAINED_LAGRANGE_IN_SOLID with a penalty-based coupling approach. To represent the boundary conditions of actual structures, the bottom of the RC bridge column is fixed to mimic the restraint provided by the embedded footing in the field test. Lateral displacement constraints in both X- and Y-axis are applied at the column top to represent the confinement provided by the circular stirrups in the experiment, which is adopted and named as propped-cantilever by Ref. [8]. This setup reflects a realistic bridge cap-beam restraint, where the superstructure limits lateral movement while allowing vertical displacement. As noted in Ref. [8], this boundary condition is also conservative because it induces the maximum base shear demand among typical restraint scenarios. To account for the blast wave reflection at the ground surface and the subsequent formation of a Mach stem with the incident wave, considering the small charge weight and relatively stiff ground on the site, the ground was modeled using the *RIGIDWALL_PLANAR_FINITE option. The use of a rigid boundary may lead to slightly higher reflected pressures near the base compared to deformable soil, but the overall influence on global column response is expected to be limited, as confirmed by prior studies under similar conditions [22]. Additionally, to minimize the effects of the limited air domain dimension on the simulation results, all boundaries except the bottom are treated as non-reflecting using the keyword *BOUNDARY_NON_REFLECTING.
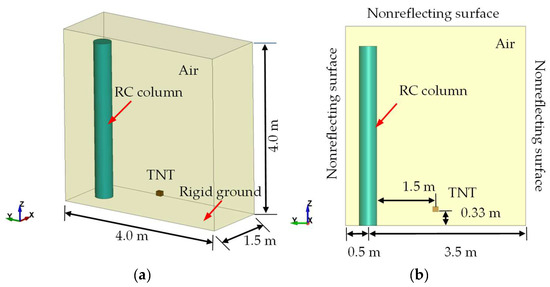
Figure 1.
Schematic diagram of the model used for blast load validation: (a) Overall view; (b) Side view.
For the validation of the column failure mode, the air domain is set as 1.0 m × 1.5 m × 3.6 m along the X, Y, and Z axes. The three-dimensional numerical model is shown in Figure 2. The explosive charge was modeled with dimensions approximately equal to the actual configuration of the assembled TNT blocks. All other settings of the numerical model are kept the same as those used in the blast load validation model.
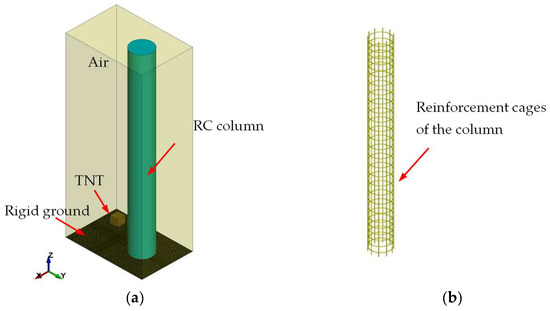
Figure 2.
Schematic diagram of the model adopted for failure mode validation: (a) Overall view; (b) Details of the column rebar cage.
2.2. Material Model
The material model for the explosive and air used in the blast load validation and failure mode validation is kept consistent, while the material model for steel bars and concrete varies.
2.2.1. Explosive and Air
The *MAT_HIGH_EXPLOSIVE_BURN material model is used for the TNT charge in combination with the *EOS_JWL equation-of-state, which characterizes the pressure generated by the chemical energy of the detonation and is expressed as follows:
where represents the specific volume, specific energy; are constants and can be found in Ref. [14].
The air domain is assumed as an ideal gas using *MAT_NULL material model with a linear polynomial equation-of-state, the formulation of which is given as follows:
In the equation: is the air pressure; represents the coefficient of the polynomial equation; , and correspond to the current and initial densities of air, respectively; denotes the specific internal energy. For an ideal gas that satisfies the ideal gas law, where are set to zero and , Equation (2) can be simplified as follows:
where is the adiabatic index; for air, . The initial density of air is taken as 1.29 , and E is set to 250 .
2.2.2. Concrete and Steel Reinforcement
Researchers pointed out that the stiffness and deformation of components or structures have little effect on the magnitude of blast loads [23]. Therefore, in the numerical model for verifying blast loads, both the concrete and reinforcement materials are defined with the *MAT_RIGID model. This approach treats the column as a rigid body to avoid unnecessary computational resource consumption and to reduce solution time.
For the validation of the column’s failure mode, the concrete is modeled using the *MAT_CONCRETE_DAMAGE_REL3 material model, while the reinforcement is modeled using *MAT_PLASTIC_KINEMATIC. According to Ref. [20], specimen S1 is constructed with C40-grade concrete, HRB400 ribbed bars (12 mm in diameter) as longitudinal reinforcement, and HPB300 plain round bars (8 mm in diameter) as transverse stirrups. The detailed input parameters are listed in Table 1.

Table 1.
Parameters of concrete and steel reinforcement material model.
In addition, it is commonly acknowledged that concrete and steel are rate sensitive, the strain rate effects were accounted for in the numerical model through the application of a dynamic increase factor (DIF). It should be noted that the strain-rate effect is not presented in detail in this study, as it has been discussed by the authors elsewhere [21].
2.3. Analytical Process and Damage Index
Figure 3 illustrates the loading process of initial axial load, blast load, and column top displacement. The loading is carried out in four stages. During the first stage, a uniformly distributed load is implemented on the column’s top face to simulate the initial axial pressure in actual engineering; in the second stage, the interaction between the explosive load and the structure is involved; in the third stage, the explosives and air from the previous stage are removed, allowing the structure to vibrate fully until it decays to a balanced state. To save computational effort, the *DAMPING_GLOBAL option was applied to accelerate convergence to quasi-static equilibrium. When all nodal velocities dropped below 0.1 m/s, the system was deemed equilibrated and the post-blast dynamic analysis was terminated [24]; in the fourth stage, the column’s vertical residual load-bearing capacity is obtained by imposing a displacement-time curve on its top surface.
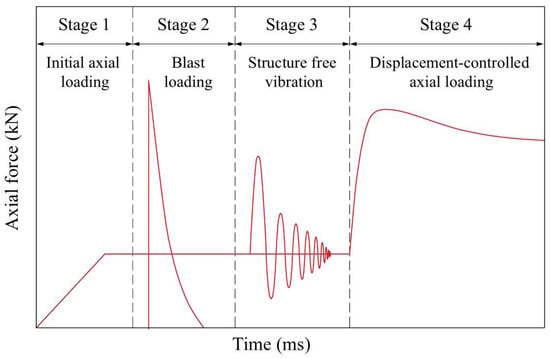
Figure 3.
Numerical analysis process for residual capacity of blast-loaded columns.
Given that the primary function of RC columns is to bear axial loads and transmit forces, their axial load-bearing capacity depends not only on local material damage but also on the overall structural performance. Accordingly, this study adopts the damage evaluation index for RC columns introduced by Shi et al. [24], which quantifies the degree of damage under different failure modes based on the reduction in vertical load-bearing capacity. The damage index, denoted as D, serves as a quantitative measure of column damage and is calculated using Equation (4):
In the equation, represents the residual capacity of the RC column after blasts; is the initial axial load value of the RC column; is the axial ultimate capacity of the undamaged RC column; is the axial residual capacity of the damaged RC column after the explosion; and is the axial ultimate capacity of the column prior to the explosion. It should be noted that D = 0 corresponds to the no damage state, whereas D = 1 corresponds to the total loss of load-carrying capacity. The value of D is constrained within the range [0, 1].
In all cases considered in this study, the axial load ratio is selected as 0.1. The method for calculating the ultimate bearing capacity of an undamaged RC column differs slightly from the four-stage procedure described here. Specifically, instead of applying explosive loading, a displacement-controlled approach is employed, and the axial force–displacement response is recorded. This curve is then compared with theoretical predictions to verify the model’s validity, as detailed in Ref. [25]. The numerical simulation predicts an ultimate axial capacity of 5566.08 kN, compared with the theoretical value of 5478.94 kN, yielding a relative error of 1.57%. This close agreement confirms the reliability of the numerical model for predicting the ultimate axial load capacity. Accordingly, 5566.08 kN is taken as the ultimate capacity of the column prior to the explosion for the subsequent analyses.
2.4. Numerical Model Validation
2.4.1. Validation of Blast Load
To verify the accuracy of the established model for blast loads, the experimental data from scenario 9 of the explosion tests in Ref. [20] were selected. In scenario 9, the explosive mass is 2.0 kg, the distance from the explosive is 1.5 m, and the explosion height is 0.33 m. The overpressure–time histories at measurement point P1, positioned directly at the explosive height, and point P3, located at 2.33 m, were compared with the numerical results, as shown in Figure 4. It seems that the overpressure-time history curve from the numerical model appears to closely match the experimental data in both shape and attenuation behavior. The peak overpressure calculated by the numerical model is 0.987 MPa, which is approximately 2.1% higher than the experimental peak overpressure of 0.967 MPa, falling within an acceptable range. It is particularly emphasized that the experimentally measured overpressure-time history curves exhibit oscillatory attenuation, which results from the complex field environment of the explosion test and the influence of reflected waves generated by the explosion [20]. During the tests, many factors may interfere with the overpressure measurement results, and the numerical model cannot simulate all complex factors. For example, the ALE algorithm may experience energy leakage in the mesh, particularly in the mesh during the explosive initiation phase, leading to subsequent overpressure deviations; the dissipation of shock wave energy in an ideal air medium differs from that in the actual air on-site. Although the simulation results differ slightly from the field test data, these discrepancies are considered acceptable.
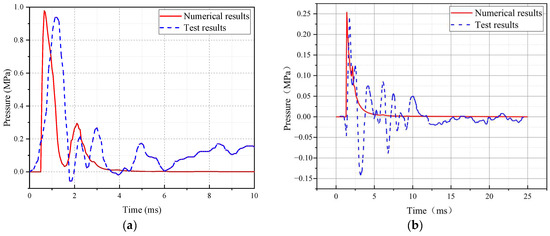
Figure 4.
Comparison of overpressure-time histories between simulation and experimental results: (a) Gauge point P1 for scenario 9; (b) Gauge point P3 for scenario 9.
2.4.2. Validation of Failure Modes and Dynamic Response of RC Columns
To validate the reliability of the developed model, experimental data from specimen S1 under scenario 6 in Ref. [20] were extracted. Scenario 6 involves a contact detonation with explosive weight being 1.0 kg and an explosive height of 0.33 m. The simulation results indicate that the column did not undergo overall deformation. The damage height on the front face was approximately 57 cm, and the maximum depth of destruction in the core concrete was approximately 3.4 cm. Close to the explosive height, the front face longitudinal reinforcement and stirrups exhibited slight inward plastic deformation. The most severe spalling of the cover concrete occurred on the side face, with a damage height of approximately 55 cm. From the experimental results, the column also did not exhibit overall deformation. The primary failure pattern consisted of spalling of the cover concrete and minor crushing of the core concrete close to the charge location. The cover concrete on the front face spalled to a height of 60 cm, while the core concrete experienced a maximum damage depth of 4 cm. The longitudinal reinforcement showed inward concave deformation. On the side, the average damage height of the cover concrete was similar to that on the front face, but near the rear face, significant peak damage was observed: the cover concrete on the rear face exhibited numerous vertical and semi-ring cracks, and hammering the cover concrete caused it to fall off, indicating that the cover concrete on the back face had been destroyed. Figure 5 presents a comparison between the numerical simulation results and the test observations. Overall, the simulation outcomes align well with the field test records, accurately and objectively reflecting the experimental phenomena.
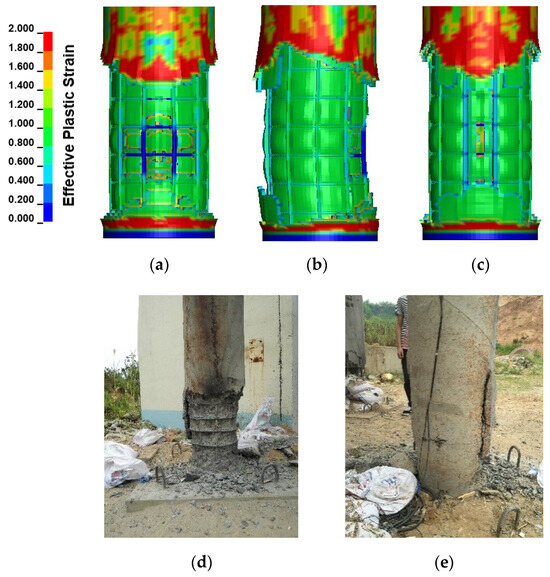
Figure 5.
Comparison of simulation results (a–c) and test observations (d,e) [3]: (a) Front face; (b) Side face; (c) Back face; (d) Front diagonal face; (e) Back face.
Meanwhile, the acceleration time-history curve at measurement gauge point 3# (2.33 m) of specimen S1 under the contact explosion of 1 kg TNT was verified. It should be noted that, unlike P1 and P3 which are located on the front face to record overpressure data, gauge point 3# is positioned on the rear face of the column to record acceleration data. As shown in Figure 6, the numerical results agree well with the test observations. However, the oscillation period in the simulation is longer and the amplitude attenuation is slower. This is mainly due to the many random factors in the actual experiment and the complexity of the explosion environment. Additionally, the damping in field tests is often greater than that in numerical simulations, which leads to the aforementioned differences. Overall, the acceleration response timing shows good consistency, indicating that the numerical model can effectively capture the experimental process and outcomes.
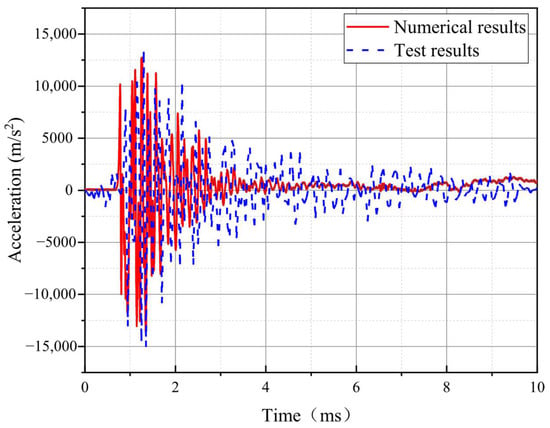
Figure 6.
Comparison of measured and calculated acceleration at gauge point 3#.
2.4.3. Verification of Residual Load-Bearing Capacity
To verify the numerical procedure for evaluating the residual vertical capacity, the field explosion tests on RC columns conducted by Dua et al. [26] were utilized to simulate and reproduce the damage characteristics and residual capacity of the column in the E-115-300 test scenario. Herein, the test designation follows the rule: ‘E’ denotes Experiment, and the subsequent numbers indicate the explosive charge weight (in grams) and the specimen dimensions (in millimeters), respectively. A 3D refined model including the column, air and explosive was established to reproduce the field test. The modeling approach is the same as that used for the circular column above, and the resulting simulation outcomes are illustrated in Figure 7. The results show that on the front face, the spalling height of the concrete in the test ranged from 180 to 400 mm, while the spalling height in the numerical simulation was approximately 300 mm. It is worth noting that although the charge was centrally located on the column surface in the field test, the spalling heights on the two sides were asymmetric. This is reasonable due to the numerous random disturbances in field tests and the inherent heterogeneity of concrete material. However, such asymmetry cannot be readily reproduced in simulations, so a symmetrical average height of 29 mm was used as the damage height for the test, showing minimal difference between the two results. On the back face, the field test primarily exhibited transverse cracks near the height of the explosive, which was consistent with the degree of damage and crack distribution in the numerical simulation. Thus, the damage characteristics of the numerical model were consistent with the experiment, indicating that the modeling method used in this paper is reliable.
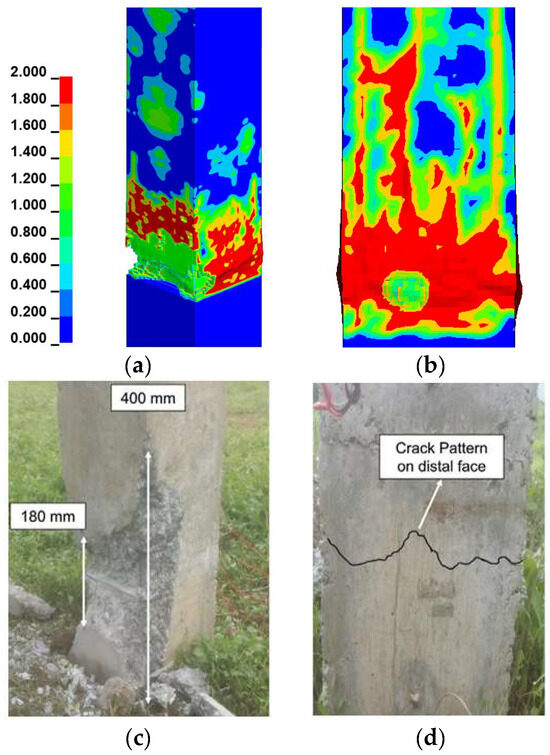
Figure 7.
Comparison of simulation results (a,b) and test observations (c,d) [3]: (a) Front face; (b) Back face; (c) Front face; (d) Back face.
Additionally, to further confirm the reliability of the proposed four-stage method for analyzing the residual capacity of RC columns, the residual capacity of the damaged columns needed to be verified. The residual capacity curves obtained from the tests and simulations are shown in Figure 8. The recorded residual capacity of the damaged column in the test was 2050 kN, while the residual bearing capacity obtained in the numerical simulation was 1890 kN, with a relative deviation of about 7.8%. Moreover, the variation of residual bearing capacity with displacement was quite consistent. Accordingly, the simulation findings validate the reliability and effectiveness of the numerical model adopted in this study.
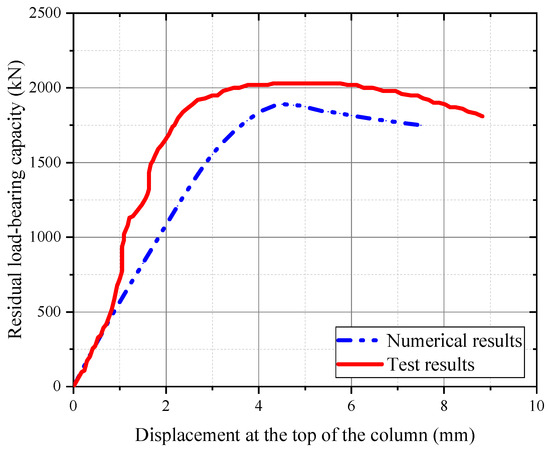
Figure 8.
Numerical results for the residual capacity of the column after blast loading.
3. Failure Modes of the Column Subjected to Close-In Explosion
The damage to columns under close-in detonations exhibits significant variability. For example, even slight changes in the distance might lead to noticeable alterations in the extent and mode of damage [13]. Herein, to further investigate the failure modes of the column subjected to close-in explosions and clarify the region of different failure modes, the column from Ref. [20] is used as an example for numerical simulation, and the geometric dimensions and material properties of the column are provided in Section 2. Numerical simulations with explosive mass in the range of 0.4 kg–8 kg were conducted using the aforementioned verified numerical model, with the explosive’s center maintained at a height of 0.2 m above the ground and a distance of 0.25 m from the front of the column. The study found that under close-in explosions, column damage is mainly concentrated near the base and in the region surrounding the explosive height. The front, side, and rear faces of the column exhibit varying degrees of localized damage upon load application. With increasing equivalent TNT mass, the RC column’s failure mode progresses and can be categorized as non-spalling, spalling, or breaching failure.
In addition, it should be noted that the damage of the column is represented using a normalized scale ranging from 0 to 2, with the damage contours accompanied by a color bar indicating the damage level. A value of 1 denotes that the material has just reached its peak strength, whereas values between 1 and 2 signify that the material has exceeded its peak strength and entered the softening stage. Accordingly, in the tensile region, colors approaching red represent concrete cracking, while in the compressive region, colors approaching red indicate concrete crushing (i.e., softening) and approaching or reaching failure [27].
3.1. Non-Spalling Failure
Figure 9 shows damage contours of RC bridge columns under three masses of TNT: 0.4 kg, 0.8 kg and 1.0 kg, respectively. It can be found that when the explosive weight is relatively small, the bridge column does not exhibit significant overall damage. However, the explosive shock wave induces numerous cracks in the cover concrete near the explosive height, as highlighted by markers 1 and 3 in Figure 9a,b. Additionally, it is evident that the back face of the column undergoes plastic deformation earlier than the front face, and the number of cracks is greater on the back face. This is because the tensile waves generated by the explosive at this mass cause more severe damage to the side and back faces of the column compared to the crushing damage on the front face. Furthermore, as the charge mass increases, diagonal and transverse cracks begin to appear in the middle and upper portions of the front face of the column, as indicated by markers 2 and 4 in Figure 9b. It seems that the damage to the middle and upper parts of the column is much greater on the front face than on the back and the side faces. This is because, with an increase in the charge amount, the front face bears more of the shock wave overpressure, while the composite waves formed by flow-around and incident waves behind the column have a weaker impact at heights far from the explosion center. Similar damage phenomena were observed in the small standoff tests explosion tests for columns 1A1 and 2A1 in Ref. [8]. Specimen labels 1A1 and 2A1 are adopted from Ref. [8] to remain consistent with the original test identification. As the charge masses increase, the plastic zone near the height of the explosive begins to gradually expand. Due to the strong impact of the shock wave pressure on the front face, the cover concrete on this side undergoes crushing damage first, as indicated by marker 5 in Figure 9c. In numerical simulations, this means the crushing failure of the cover concrete on the front face. In the numerical calculations, once the plastic zone (i.e., the red area) forms on the front face, the concrete there has experienced crushing damage.
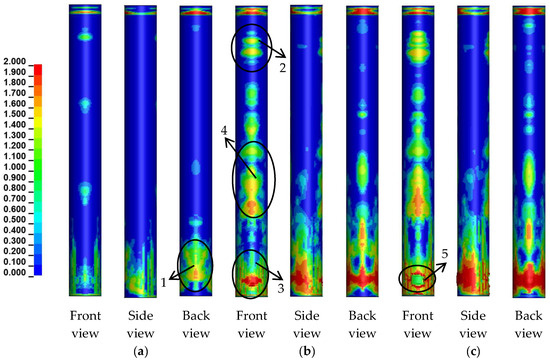
Figure 9.
Damage contours of RC bridge columns under different charge weights: (a) 0.4 kg; (b) 0.8 kg; (c) 1.0 kg.
3.2. Spalling Failure
Figure 10 shows damage contours of RC bridge columns under three masses of TNT: 1.5 kg, 2.5 kg and 3 kg, respectively. When the charge mass increases to 1.5 kg, besides the deepening of the cover concrete crushing on the front face, tensile waves formed on the back face of the column cause cover concrete spalling for the first time, as shown by marker 1 in Figure 10a. The area of concrete spalling on the side and rear faces continues to extend and expand as the charge mass increases. At a charge mass of 2.5 kg, the cover concrete within a certain range of the explosive height is completely detached, with an average detachment height of 43.6 cm. The red plastic zone on the side of the column, indicated by marker 2 in Figure 10b, represents the projection of the detached and spattered concrete elements on the column side. In reality, these elements have been detached from the structure, losing their physical significance. Similar spalling damage of the cover concrete was observed in the close-in explosion tests on RC bridge columns in [6,28]. Once the cover concrete at the lower part of the column is completely detached, further increases in the charge mass result in a progressive increase in the height of concrete spalling in the RC column, and the core concrete begins to suffer damage. When the charge mass reaches 3 kg, the core concrete at the center of front and rear faces of the column at the explosive height is impacted by the shock wave, resulting in damage, as indicated by markers 1 and 2 in Figure 10a,b. This leads to the exposure of the reinforcement.
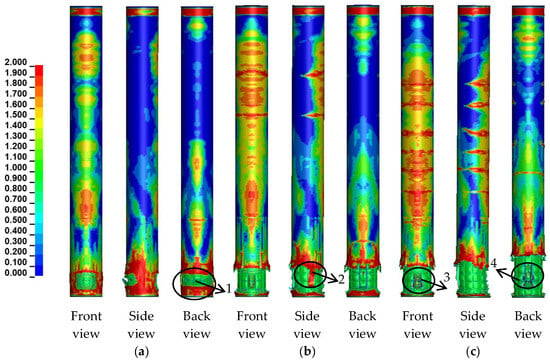
Figure 10.
Damage contours of RC bridge columns under different charge weights: (a) 1.5 kg; (b) 2.5 kg; (c) 3 kg.
3.3. Breaching Failure
Figure 11 shows damage contours of RC bridge columns under three masses of TNT: 4 kg, 5 kg and 8 kg, respectively. Once the charge reaches 8 kg, the stress wave penetrates the core concrete on both front and rear faces of the column, causing severe loss of core concrete, and the rebar cage undergoes significant plastic deformation or even fracture, as shown by markers 1 and 2 in Figure 11c. The penetration height continues to increase with the increase in charge mass. Similar conditions of column breaching, rebar cage fracture, and severe loss of core concrete were observed in the localized damage tests for columns 2A1 and 2B. Specimen labels 2A1 and 2B are adopted from Ref. [8] to remain consistent with the original test identification.
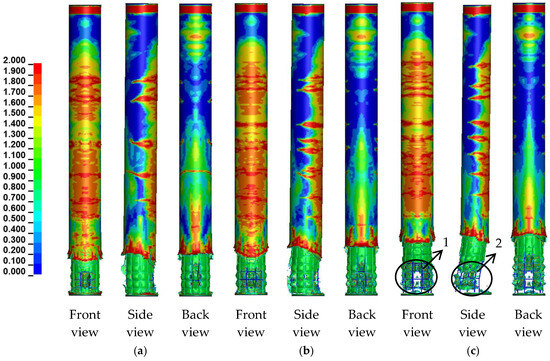
Figure 11.
Damage results of RC bridge columns under different charge weights: (a) 4 kg; (b) 5 kg; (c) 8 kg.
In summary, under close-in explosion scenarios, the damage to RC columns is primarily concentrated near the explosive height, exhibiting a typical localized damage pattern. Due to the different stress states on the column’s front, side, and back faces, the damage response is highly sensitive to the charge mass when the standoff distance is kept constant. For example, a mass variation of approximately 0.5 kg around a 1 kg charge, or 1 kg around a 3 kg charge, can trigger a transition in the failure mode. Accordingly, RC column failure modes are categorized into several typical regions based on the scaled distance: for , non-spalling damage occurs, and there is no loss of concrete material in the cross-section of the column, with damage limited to surface cracks; for , spalling damage occurs, with the depth of damage in the column cross-section not exceeding the thickness of the cover concrete; and for , breaching failure occurs, with the depth of damage in the column cross-section reaching the core concrete. The damage phenomena corresponding to these three failure modes are shown in Table 2, with their interpretations illustrated in Figure 12.

Table 2.
Classification of failure modes for RC bridge columns subjected to close-in detonation.
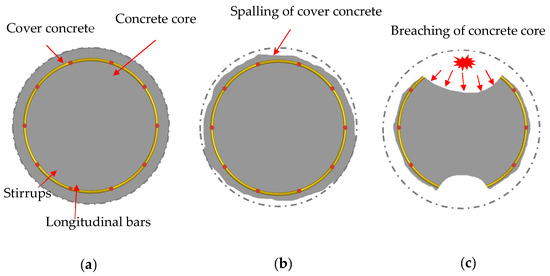
Figure 12.
Illustration for failure modes of RC columns: (a) Non-spalling; (b) Spalling; (c) Breaching.
4. Damage Assessment of RC Columns Considering Different Failure Modes
4.1. Damage Evaluation of RC Columns in Accordance with Residual Capacity
Figure 13 shows the variation curve of the residual capacity of RC columns with different explosive masses. It can be observed that when the explosive mass is below 1.5 kg, the decline in residual capacity is relatively slow and steady. However, once the charge mass reaches 1.5 kg, the column’s residual capacity drops sharply in a linear fashion until it gradually stabilizes between 2.5 kg and 3 kg. When the charge mass exceeds 3 kg, the column essentially loses its load-bearing capacity. According to the aforementioned study of failure modes, the column is generally in a non-spalling failure mode before 1.5 kg. Between 1.5 kg and 2.5 kg, the column begins to experience spalling failure, which continues to deteriorate. After 2.5 kg, the column enters the region of breaching failure. Therefore, this change in load-bearing performance is closely associated with the changes in failure modes of RC columns. The rate of change in residual load-bearing capacity varies under different failure modes, especially with the onset of spalling failure, which significantly reduces the vertical load-bearing performance of RC columns. Spalling failure affects the load-bearing performance throughout the entire process, from minor damage to collapse. When breaching failure occurs, the column has essentially lost all load-bearing capacity.
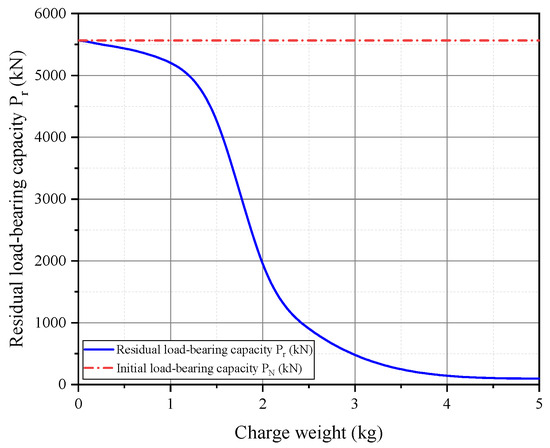
Figure 13.
Residual capacity curves of RC columns under different charge weights.
4.2. Determination of Damage Indicators for RC Columns Under Different Failure Modes
Due to the failure characteristics of RC columns under close-in explosion effects and the complexity of explosion tests and post-disaster site environments, accurately and quickly obtaining the residual capacity of RC columns is very challenging. For RC column components, damage indicators that are convenient for on-site inspection and recording are often parameters directly related to explosion damage phenomena, such as the maximum and residual displacements at critical locations [28,29], maximum support rotation angles [30], degree of concrete spalling [31,32,33], length of crushed concrete [31,32], and combinations of damage phenomenon parameters with structural size parameters. Considering the material loss due to local damage, it is not appropriate to use overall structural deformation-related parameters to evaluate the damage state. In this paper, the crushed concrete area , the cover concrete spalling area , the volume loss of core concrete , and the area of the upper-middle plastic zone were chosen to assess the column damage.
Figure 14 illustrates the concrete material loss of RC columns subjected to various charge mass. As the charge mass increases, , , and appear successively and their values continue to increase within their respective failure modes, indicating that the indicators based on local material loss and the damage indicator D based on vertical residual capacity are positively correlated. It is noteworthy that the sudden decrease in crushed area is because a higher charge mass causes the severely crushed concrete to spall off, resulting in an increase in spalling area while the crushed area decreases. Therefore, this study selects different indicators for more accurate assessment based on different failure modes: using the crushed concrete area for non-spalling modes, the spalling area of the cover concrete Ss for spalling failure modes, and the volume loss of core concrete for breaching failure modes. The zone of the upper-middle plastic zone mainly reflects the damage degree in the upper-middle part of the structure, but has low correlation with local damage, thus it is not the focus of this study in subsequent research.
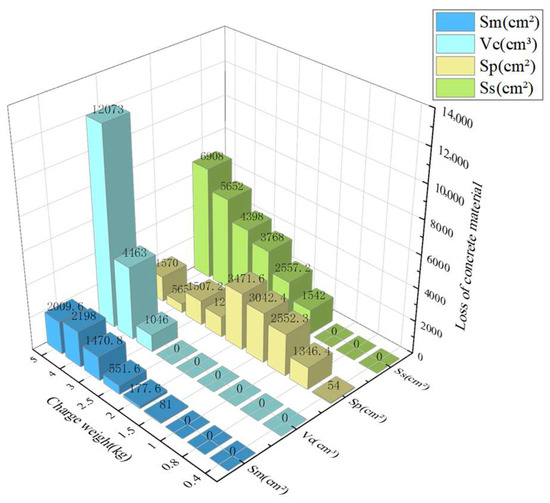
Figure 14.
Loss of concrete material under different charge weights.
4.3. Damage Assessment Formula Dominated by a Single Parameter
In an explosion system, parameters are divided into structural parameters and environmental parameters. Structural parameters include column height, cross-sectional shape, cross-sectional dimensions, longitudinal reinforcement ratio, and stirrup reinforcement ratio. Environmental parameters include explosive equivalent, standoff distance, boundary constraints of the column, and initial axial load, among others. These numerous factors can influence the load-bearing performance of RC columns under explosive loads to varying degrees [26]. Considering that the reinforcement ratio is a core structural parameter that can greatly affect the blast performance of columns, this paper uses the longitudinal reinforcement ratio as an example. Through numerical simulation analysis, damage assessment formulas dominated by the longitudinal reinforcement ratio are derived for each failure mode zone. The longitudinal reinforcement ratios considered are 0.8%, 1.2%, and 1.6%. Simulations are conducted within their respective zones for non-spalling damage (for ) and spalling damage (for ). Since columns essentially lose axial load-bearing capacity when subjected to breaching failure, they are considered to have completely lost their load-bearing capacity and thus are not studied further. Additionally, the material loss is non-dimensionalized (with the crushed area and spalling area divided by the column surface area corresponding to the maximum average damage height), and this is denoted as the damage index P based on material loss. It should be noted that the local damage patterns of the columns are often irregular, and the determination of the spalling area, crushing area, and maximum average damage height requires manual judgement. Although slight discrepancies may occur among different operators, such variations are generally minor for experienced researchers.
4.3.1. Damage Assessment for Non-Spalling Failure
Figure 15 presents the relationship between the damage indices under non-spalling damage for RC columns with varying longitudinal bar ratios. The results indicated that the damage index D is approximately linearly correlated with P in this case. Through fitting calculations, the relationship formulas between D and P for the RC column with longitudinal reinforcing steel ratios of 0.8%, 1.2%, and 1.6% are respectively given by Formulas (5)–(7):
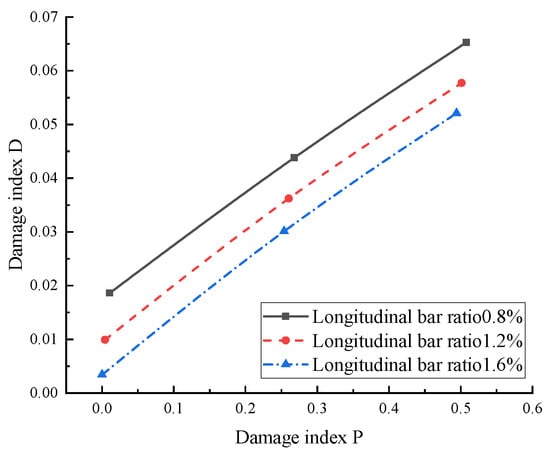
Figure 15.
Relationship between D and P under different longitudinal reinforcement ratios for non-spalling failure.
The sum of squared residuals R2 for the fittings are 0.999, 0.998, and 0.998, respectively, indicating that the fitting results are very good.
By further fitting Equations (5)–(7), we derived Equation (8), which describes the relationship between longitudinal reinforcement ratio , damage index D, and damage index P. The value for this fit is 0.997, indicating a good fit. The fitting results are shown in Figure 16. Equation (11) enables rapid assessment of damage to RC columns with different longitudinal reinforcement ratios under conditions without spalling damage.
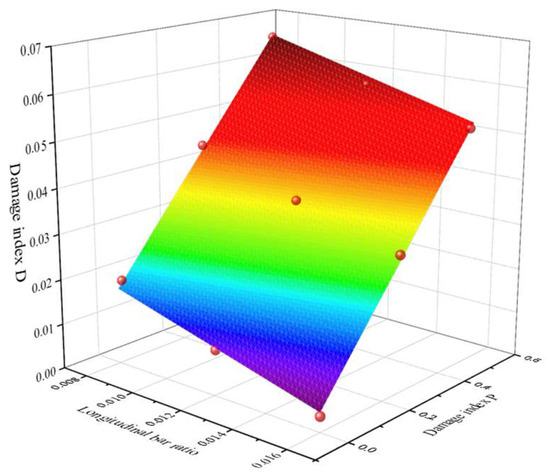
Figure 16.
Influence of longitudinal reinforcing steel on D and P for non-spalling failure.
4.3.2. Damage Assessment for Spalling Failure
The relationship between damage indices under different longitudinal reinforcement ratios for RC columns experiencing spalling failure is shown in Figure 17. It can be observed that, without spalling failure, D and P are essentially exponentially related, and similarly, with spalling failure, D and P also exhibit an exponential relationship. Through fitting calculations, the relationship formulas between damage index D and damage index P for RC columns with longitudinal bar ratios of 0.8%, 1.2%, and 1.6% are given by Equations (9)–(11), respectively.
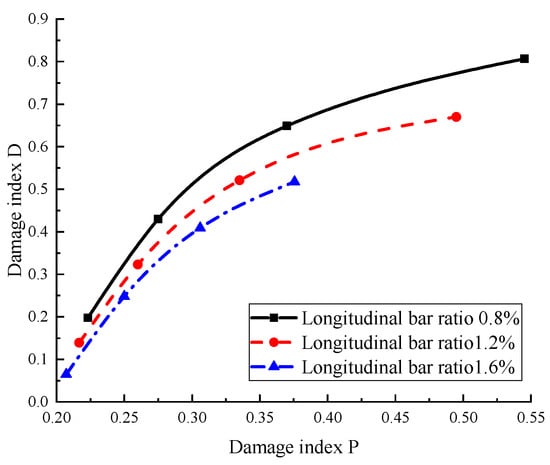
Figure 17.
Relationship between D and P under different longitudinal reinforcement ratios for spalling failure.
The sum of squared residuals for the fittings are 0.998, 0.999, and 0.999, respectively, indicating that the fitting results are very good.
By further fitting Equations (9)–(11), we derived Equation (12), which describes the relationship between longitudinal reinforcement ratio , damage index D, and damage index P. The value for this fit is 0.988, indicating a good fit. The fitting results are shown in Figure 18. Equation (12) enables rapid assessment of damage to RC columns with different longitudinal reinforcement ratios under conditions with spalling failure.
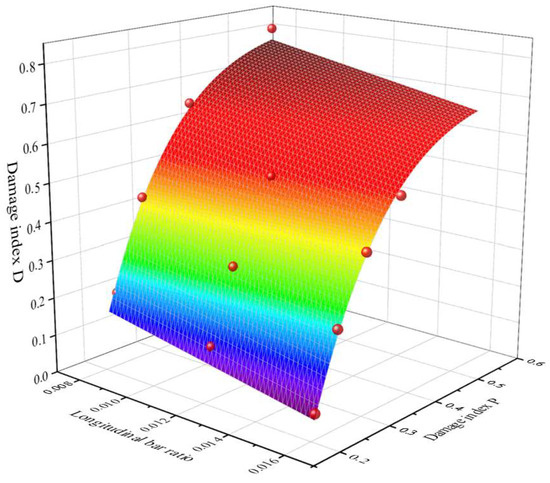
Figure 18.
Influence of longitudinal reinforcement ratio on D and P for spalling failure.
In summary, using the aforementioned parameter analysis research methods, it is possible to establish multiple damage assessment formulas dominated by single parameters for various failure modes of the RC column. According to these established formulas, if some parameters have a similar directional influence on the columns, meaning the structural forms of the resulting formulas are similar, three-dimensional variable analysis of single-parameter formulas can be extended to four-dimensional parameter analysis. Subsequently, this approach can even be expanded to more dimensions, allowing for the simultaneous consideration of multiple parameters for fitting. Consequently, multi-parameter damage evaluation formulas are established for RC columns subjected to close-in explosive loading. Since directly measuring the residual capacity at explosion sites is challenging, while related damage indices are easier to measure, the derived formulas enable rapid assessment of damage to any RC column under different failure modes. Also, these formulas offer guidance for designing RC columns with improved blast resistance.
5. Conclusions
In this study, a high-fidelity three-dimensional numerical model of RC bridge columns under close-in blast loading was developed and validated, and the typical failure processes and mechanisms were systematically clarified. The failure modes were categorized into three types, and their corresponding regions were identified. In addition, the correlation between the proposed damage index P and the existing damage index D from previous studies was established. Using the control variable method, the impact of influencing factors such as longitudinal bar ratio on the D-P relationship were further investigated. The main findings are as follows:
- (1)
- Through numerical simulations of RC circular bridge column specimens at different scaled distances, the damage to column was categorized into three types: non-spalling, spalling, and breaching. For , the damage to the column is relatively light, resulting in non-spalling failure; for , the cover concrete of the column begins to detach, resulting in spalling failure; for , the column completely loses its load-bearing capacity, resulting in breaching damage.
- (2)
- A material loss–based indicator P is introduced to assess the damage extent of RC columns, and it shows a positive correlation with the residual capacity–based indicator D. Accordingly, the crushed concrete area, spalled cover area, and core concrete loss volume are used to quantify local damage in non-spalling, spalling, and breaching failures, respectively.
- (3)
- Using the control variable method, the correlation between the material loss–based index P and the residual capacity–based damage index D was investigated under the influence of a single parameter. Relational formulas among longitudinal reinforcement ratio, D and P were derived for non-spalling and spalling failures. This approach can be extended to other parameters, enabling rapid damage evaluation of RC columns under various failure modes.
The simulation presented in this study couples mode-dependent material-loss metrics with residual axial capacity to give implementable D–P relations. The implementation schemes can be divided into: (i) Failure mode classification and regional division; (ii) Proposal of a material loss-based damage index P; (iii) Establishment of the D–P relationship for different failure modes. Similar approaches have scarcely been documented in the existing literature. It is noted that although the knowledge gap has been recognized, research in this area remains very limited. This study represents an initial exploratory effort toward addressing this gap. The conclusions of this study are drawn based on the specific columns, explosion scenarios, and proposed damage indices considered, and are therefore limited to the investigated parameter ranges. To obtain more general and reliable conclusions, further systematic and comprehensive simulations with experimental validation over a broader range of scenarios and column parameters are required.
Author Contributions
Conceptualization, C.G. and Y.J.; methodology, S.Y.; software, C.G.; validation, Y.J. and S.Y.; formal analysis, X.W.; investigation, C.G.; resources, Y.J.; data curation, X.W.; writing—original draft preparation, C.G.; writing—review and editing, S.Y.; visualization, S.Y. and X.W.; supervision, Y.J.; funding acquisition, C.G. and S.Y. All authors have read and agreed to the published version of the manuscript.
Funding
This research was supported by Hubei Key Laboratory of Blasting Engineering, Jianghan University (No. BL202404), the National Natural Science Foundation of China (52478524), Natural Science Foundation of Hubei Province (2025AFB632) and Fundamental Research Funds for the Central Universities, CHD (No. 300102213201).
Data Availability Statement
The original contributions presented in this study are included in the article. Further inquiries can be directed to the corresponding authors.
Conflicts of Interest
The authors declare no conflicts of interest.
References
- Jia, H.; Wei, H.; Li, J.; Cui, S.; Xu, L.; Zheng, S. Blast Resistance of Steel Jacket Reinforced Double-Column Bridge Pier. Eng. Struct. 2025, 329, 119882. [Google Scholar] [CrossRef]
- Xu, J.P.; Wu, H.; Ma, L.L.; Fang, Q. Residual Axial Capacity of Seismically Designed RC Bridge Pier after Near-Range Explosion of Vehicle Bombs. Eng. Struct. 2022, 265, 114487. [Google Scholar] [CrossRef]
- Yuan, S.; Li, Y.; Zong, Z.; Li, M.; Xia, Y. A Review on Close-in Blast Performance of RC Bridge Columns. J. Traffic Transp. Eng.-Engl. Ed. 2023, 10, 675–696. [Google Scholar] [CrossRef]
- Bai, F.; Guo, Q.; Root, K.; Naito, C.; Quiel, S. Blast Vulnerability Assessment of Road Tunnels with Reinforced Concrete Liners. Transp. Res. Rec. 2018, 2672, 156–164. [Google Scholar] [CrossRef]
- Li, J.; Wu, C.; Hao, H.; Su, Y.; Li, Z.-X. A Study of Concrete Slabs with Steel Wire Mesh Reinforcement under Close-in Explosive Loads. Int. J. Impact Eng. 2017, 110, 242–254. [Google Scholar] [CrossRef]
- Wu, J.; Zhou, Y.; Zhang, R.; Liu, C.; Zhang, Z. Numerical Simulation of Reinforced Concrete Slab Subjected to Blast Loading and the Structural Damage Assessment. Eng. Fail. Anal. 2020, 118, 104926. [Google Scholar] [CrossRef]
- Han, G.; Bo, Y.; Zan, Y. Damage Model Test of Prestressed T-Beam Under Explosion Load. IEEE Access 2019, 7, 135340–135351. [Google Scholar] [CrossRef]
- Williamson, E.B. Blast-Resistant Highway Bridges: Design and Detailing Guidelines; Transportation Research Board: Washington, DC, USA, 2010. [Google Scholar]
- Puryear, J.M.H.; Stevens, D.J.; Marchand, K.A.; Williamson, E.B.; Sammarco, E.L.; Crane, C.K. Predicting Spall and Breach for Blast-Loaded Reinforced-Concrete Columns; Texas ASCE Centennial Conference; ASCE: Reston, VA, USA, 2012. [Google Scholar]
- Zong, Z.; Tang, B.; Gao, C.; Liu, L.; Li, M.; Yuan, S. Experiment on blast-resistance performance of reinforced concrete piers. J. China J. Highw. Transp. 2017, 30, 51–60. (In Chinese) [Google Scholar] [CrossRef]
- Yan, J.; Liu, Y.; Li, Z.; Xv, Z.; Huang, F. Effects of transverse reinforcement ratio and axial load on the blast response of steel reinforced concrete columns. J. Acta Armamentarii 2020, 41, 35–43. (In Chinese) [Google Scholar]
- Cui, J.; Shi, Y.; Li, Z.-X.; Chen, L. Failure Analysis and Damage Assessment of RC Columns under Close-In Explosions. J. Perform. Constr. Facil. 2015, 29, B4015003. [Google Scholar] [CrossRef]
- Shi, Y.; Hu, Y.; Chen, L.; Li, Z.-X.; Xiang, H. Experimental Investigation into the Close-in Blast Performance of RC Columns with Axial Loading. Eng. Struct. 2022, 268, 114688. [Google Scholar] [CrossRef]
- Li, M.; Zong, Z.; Hao, H.; Zhang, X.; Lin, J.; Liao, Y. Post-Blast Performance and Residual Capacity of CFDST Columns Subjected to Contact Explosions. J. Constr. Steel Res. 2020, 167, 105960. [Google Scholar] [CrossRef]
- Lv, C.; Yan, Q.; Li, L.; Li, S. Field Test and Probabilistic Vulnerability Assessment of a Reinforced Concrete Bridge Pier Subjected to Blast Loads. Eng. Fail. Anal. 2023, 143, 106802. [Google Scholar] [CrossRef]
- Momeni, M.; Bedon, C.; Hadianfard, M.A.; Baghlani, A. An Efficient Reliability-Based Approach for Evaluating Safe Scaled Distance of Steel Columns under Dynamic Blast Loads. Buildings 2021, 11, 606. [Google Scholar] [CrossRef]
- Zhang, X.; Li, Z.-X.; Shi, Y.; Wu, C.; Li, J. Fragility Analysis for Performance-Based Blast Design of FRP-Strengthened RC Columns Using Artificial Neural Network. J. Build. Eng. 2022, 52, 104364. [Google Scholar] [CrossRef]
- Zhou, X.-Q.; Huang, B.-G.; Wang, X.-Y.; Xia, Y. Deep Learning-Based Rapid Damage Assessment of RC Columns under Blast Loading. Eng. Struct. 2022, 271, 114949. [Google Scholar] [CrossRef]
- Almustafa, M.K.; Nehdi, M.L. Machine Learning Model for Predicting Structural Response of RC Columns Subjected to Blast Loading. Int. J. Impact Eng. 2022, 162, 104145. [Google Scholar] [CrossRef]
- Tang, B. Experimental Investigation of Reinforced Concrete Bridge Piers Under Blast Loading. Master’s Thesis, Southeast University, Nanjing, China, 2017. (In Chinese). [Google Scholar]
- Yuan, S.; Hao, H.; Zong, Z.; Li, J. Numerical Analysis of Axial Load Effects on RC Bridge Columns under Blast Loading. Adv. Struct. Eng. 2021, 24, 1399–1414. [Google Scholar] [CrossRef]
- Yuan, S.; Hao, H.; Zong, Z.; Li, J. A Study of RC Bridge Columns under Contact Explosion. Int. J. Impact Eng. 2017, 109, 378–390. [Google Scholar] [CrossRef]
- Shi, Y.; Hao, H.; Li, Z.-X. Numerical Simulation of Blast Wave Interaction with Structure Columns. Shock Waves 2007, 17, 113–133. [Google Scholar] [CrossRef]
- Shi, Y.; Hao, H.; Li, Z.-X. Numerical Derivation of Pressure–Impulse Diagrams for Prediction of RC Column Damage to Blast Loads. Int. J. Impact Eng. 2008, 35, 1213–1227. [Google Scholar] [CrossRef]
- Liu, L.; Zong, Z.H.; Li, M.H. Numerical Study of Damage Modes and Assessment of Circular RC Pier under Noncontact Explosions. J. Bridge Eng. 2018, 23, 04018061. [Google Scholar] [CrossRef]
- Dua, A.; Braimah, A.; Kumar, M. Experimental and Numerical Investigation of Rectangular Reinforced Concrete Columns under Contact Explosion Effects. Eng. Struct. 2020, 205, 109891. [Google Scholar] [CrossRef]
- Williams, G.D. Analysis and Response Mechanisms of Blast-Loaded Reinforced Concrete Columns. Ph.D. Thesis, The University of Texas at Austin, Austin, TX, USA, 2009. [Google Scholar]
- Chen, L.; Hu, Y.; Ren, H.; Xiang, H.; Zhai, C.; Fang, Q. Performances of the RC Column under Close-in Explosion Induced by the Double-End-Initiation Explosive Cylinder. Int. J. Impact Eng. 2019, 132, 103326. [Google Scholar] [CrossRef]
- Hu, Y.; Chen, L.; Fang, Q.; Xiang, H. Blast Loading Model of the RC Column under Close-in Explosion Induced by the Double-End-Initiation Explosive Cylinder. Eng. Struct. 2018, 175, 304–321. [Google Scholar] [CrossRef]
- Li, Y. Study on Rapid Assessments Method of Damage to Buildings Under Blast Loading. Master’s Thesis, National University of Defense Technology, Changsha, China, 2018. (In Chinese). [Google Scholar]
- Li, J.; Hao, H. Numerical Study of Concrete Spall Damage to Blast Loads. Int. J. Impact Eng. 2014, 68, 41–55. [Google Scholar] [CrossRef]
- Zhang, D.; Yao, S.; Lu, F.; Chen, X.; Lin, G.; Wang, W.; Lin, Y. Experimental Study on Scaling of RC Beams under Close-in Blast Loading. Eng. Fail. Anal. 2013, 33, 497–504. [Google Scholar] [CrossRef]
- Yao, S.; Zhang, D.; Lu, F.; Wang, W.; Chen, X. Damage Features and Dynamic Response of RC Beams under Blast. Eng. Fail. Anal. 2016, 62, 103–111. [Google Scholar] [CrossRef]
Disclaimer/Publisher’s Note: The statements, opinions and data contained in all publications are solely those of the individual author(s) and contributor(s) and not of MDPI and/or the editor(s). MDPI and/or the editor(s) disclaim responsibility for any injury to people or property resulting from any ideas, methods, instructions or products referred to in the content. |
© 2025 by the authors. Licensee MDPI, Basel, Switzerland. This article is an open access article distributed under the terms and conditions of the Creative Commons Attribution (CC BY) license (https://creativecommons.org/licenses/by/4.0/).