1. Introduction
Wind-driven rain (WDR) is a phenomenon where raindrops are given a horizontal velocity component by the wind, causing them to fall in an inclined manner [
1,
2]. It represents a critical moisture source affecting the hygrothermal performance and long-term durability of building envelopes [
3,
4]. As one of the most critical external moisture loads on building envelopes, WDR directly governs the hygrothermal balance, surface wetting, and durability of exterior walls, particularly in climates with high wind exposure [
5]. WDR significantly affects various aspects of building performance, including energy consumption, mechanical properties, and risks associated with moisture accumulation, such as mold growth and material degradation [
6,
7,
8]. Recent studies have shown that neglecting WDR can lead to underestimation of surface moisture flux and long-term deterioration risks in simulation-based envelope analyses [
9]. Moreover, the regional variability of WDR exposure, which depends on wind speed, rainfall intensity, and façade orientation, has been recognized as a dominant factor influencing envelope degradation and energy demand [
10]. Consequently, accurate quantification and understanding of WDR impacts are essential prerequisites for climate-responsive envelope design and durability assessment [
11].
WDR is one of the primary moisture sources affecting the hygrothermal performance and long-term durability of exterior walls [
12,
13]. WDR exposure quantification methods have been systematically reviewed, covering field measurements, semi-empirical models, and numerical simulation approaches [
14]. These quantification methods are generally categorized into three types: (1) empirical and semi-empirical approaches that calculate exposure indices from meteorological data; (2) numerical models based on computational fluid dynamics (CFD) that simulate the airflow–raindrop interaction around building envelopes; and (3) coupled heat-air-moisture (HAM) transfer models used to predict moisture penetration and drying behavior inside multilayer wall systems. Among these, the ISO 15927-3 (2009) standard [
15] provides a widely accepted framework for calculating the annual and extreme driving rain index from hourly wind and rainfall data, forming the basis for WDR evaluation across climatic regions. Early numerical studies, such as Choi [
16] and Blocken and Carmeliet [
17], established the fundamental principles for predicting raindrop trajectories and façade wetting intensity. Subsequent research enhanced model precision by integrating high-resolution CFD analyses with full-scale façade measurements [
18]. With the development of HAM modeling, the WUFI
® program, originally proposed by Künzel [
19], has become a standard tool for dynamic simulation of hygrothermal processes under wind-driven rain exposure. Numerous studies have investigated the hygrothermal responses of different exterior wall assemblies under WDR exposure [
20]. Palani et al. [
21] validated WUFI predictions against field data for a cold-climate wall system, while Nath et al. [
22] confirmed its accuracy for long-term mold growth assessment under temperate conditions. Dang et al. [
13] further emphasized the influence of material vapor permeability and capillary absorption on HAM-based simulations. These validated modeling frameworks provide a solid foundation for quantitative assessment of WDR-induced moisture transport and have been increasingly applied in performance-based design and regional durability evaluation [
23].
Significant progress has been made in quantifying WDR and assessing its hygrothermal impacts. A consensus acknowledges that the hygrothermal response of walls to WDR is a complex process involving the coupling of multiple factors, including climate, assembly design, and material properties [
12,
13]. Effective moisture management strategies, such as the use of ventilated rainscreens and capillary-active insulation, along with robust simulation models, are crucial for optimizing the performance and durability of wall assemblies in varying climates [
10]. In recent years, research has shifted from single-climate analyses to comparative investigations across multiple climatic zones, aiming to understand how regional WDR variations influence wall performance and moisture risk. Huang et al. compared wall assemblies in twenty North American cities and demonstrated that neglecting WDR leads to underestimation of hygrothermal degradation [
24]. Yu et al. analyzed public buildings across different Chinese climate zones using WUFI-Plus, showing that WDR-induced hygrothermal coupling reduced cooling demand in northern China while increasing it in southern regions [
20]. Pakkala and Lahdensivu [
10] examined Finnish climate zones and found that WDR loads are highest in coastal regions, with future increases projected under warming conditions. Dae and Cannon further predicted a general rise in WDR indices across Canadian climate regions, especially in western and northern areas, while Cornick and Dalgliesh demonstrated the conversion of rainfall observations into quantitative WDR data for simulation use [
25,
26,
27,
28]. These studies collectively reveal the climate-dependent and regionally differentiated nature of WDR impacts on hygrothermal performance.
Different wall assembly types exhibit varied hygrothermal responses under WDR exposure due to differences in material moisture storage, vapor permeability, and insulation configuration [
10,
11,
28]. Previous studies have demonstrated that ventilated rainscreen façades and exterior insulation systems provide superior resistance to WDR-induced wetting compared with face-sealed claddings, particularly in hot–humid climates [
29,
30]. Capillary-active insulation systems have been shown to mitigate interstitial condensation and enhance drying potential under cyclic wetting conditions [
13]. In contrast, highly insulated lightweight walls—such as deep-cavity wood-framed assemblies—are more vulnerable to moisture accumulation and mold growth when exposed to repeated wind-driven rain and imperfect detailing [
31]. Recent investigations have also emphasized that material selection and surface finish significantly affect the wall’s response to WDR. Bastien and Winther-Gaasvig reported that driving rain combined with vapor diffusion strongly influences the overall thermal efficiency of hygroscopic envelopes, especially during prolonged wet seasons [
32]. Similarly, Hamid and Wallentén highlighted that internally insulated masonry walls in cold climates are highly sensitive to moisture accumulation when exterior layers remain vapor-tight [
33]. In parallel, material-oriented research has explored microstructural modifications and polymer-based composite designs to improve moisture resilience. For instance, Xian et al. developed a self-healing carbon nanotube/epoxy system that exhibited superior durability under cyclic hygrothermal stress, demonstrating material-level innovations that may inspire envelope performance enhancement under WDR exposure [
34]. Experimental and simulation studies further confirmed that the absorption and drying behavior of finishing materials strongly depend on surface treatment and cumulative WDR exposure [
35]. Collectively, these findings indicate that the interplay between assembly design, material properties, and climatic factors fundamentally governs moisture transport and durability performance under WDR. However, current research has predominantly examined either the performance of single-wall assemblies across multiple climates or different wall assemblies within the same climate zone, while comprehensive cross-comparisons encompassing multiple wall types and climatic conditions remain limited.
Beyond this research gap, another limitation exists in practical design, where the envelope design practice guided by the China National Code for Thermal Design of Civil Buildings (GB 50176–2016) predominantly relies on U-value criteria, while the effects of WDR-induced moisture accumulation are seldom considered in design evaluation [
36]. As a result, the suitability of wall assemblies is often assessed only from the perspective of thermal insulation, neglecting the coupled influence of WDR and moisture transport on long-term durability. Moreover, existing comparative studies lack a unified evaluation framework that integrates both thermal and moisture performance under realistic WDR exposure, especially across different climatic zones. To address this gap, this study aims to establish a dual-dimensional analytical framework for systematically investigating the hygrothermal performance of wall assemblies across typical thermal zones in China. Specifically, it seeks to compare: (1) the performance of identical wall assembly types across different climate zones to reveal the conditioning role of climate; and (2) the performance of different wall assembly types within the same thermal zone to identify pathways for assembly optimization. All analyses will explicitly consider long-term WDR exposure as a core influencing factor.
In hygrothermal simulations, moisture content serves as the primary indicator of wall performance because it directly reflects the dynamic balance between wetting and drying under coupled heat–moisture transfer. The accumulation of moisture not only accelerates material degradation but also alters thermal conductivity and reduces insulation efficiency [
21]. Moreover, WUFI simulations calculate transient moisture content across each material layer, making it a physically consistent and widely validated variable for assessing both hygrothermal behavior and long-term durability [
19,
37]. Therefore, this study adopts the mean moisture content of wall assemblies as the key quantitative indicator to evaluate their moisture resistance and drying potential under long-term WDR exposure across different thermal zones, and further quantifies the effects of WDR intensity and U-value on the variation in moisture content.
2. Research Methods
Current research on WDR and building envelopes typically adopts three main approaches: field measurements [
38], computational fluid dynamics (CFD) simulations [
11,
16,
17,
18,
31], and semi-empirical models [
35,
39,
40,
41,
42], each with its own strengths and limitations [
38,
39,
40,
43]. In contrast, semi-empirical models enable faster calculations and have been continuously refined and calibrated over time [
38,
39,
44,
45], making them one of the most widely used approaches [
15,
40,
41].
Simulation tools based on semi-empirical models include DELPHIN 5, COMSOL Multiphysics 6.3, DeST-Standard, and WUFI pro (6.7), among a total of 14 widely used hygrothermal modeling software packages. A comparative study of these 14 hygrothermal tools assessed their performance in predicting external wall surface temperatures, revealing that WUFI exhibited the highest accuracy in quantitative simulations of nighttime cooling effects [
46]. A previous study validated WUFI’s performance across 15 North American cities, demonstrating that both climatic conditions, such as humidity and precipitation, and material properties, such as thermal conductivity and vapor diffusion resistance, affect wall moisture dynamics [
24]. Another study further emphasized the impact of WDR-induced hygrothermal coupling on building energy use, affirming the relevance of dynamic simulation tools in moisture-related assessments [
20]. Such precision in surface temperature prediction helps minimize errors in moisture analysis caused by inaccurate external temperature calculations. It must be acknowledged that existing studies have confirmed certain limitations in semi-empirical models, such as insufficient consideration of building width and wind-blocking effects [
40]. Therefore, their applicability in scenarios with complex building geometries or airflow fields requires careful evaluation. However, since this study does not involve multiple complex building shapes or significant wind-blocking effects, the semi-empirical model can still be reasonably adopted for this study.
2.1. Weather Data and Location
The selection of meteorological datasets was guided by two key criteria. First, the study requires a full year of hourly meteorological data, including temperature, relative humidity, global radiation, wind direction, wind speed, and precipitation, with each variable comprising 8760 records. Among the currently accessible and budget-compliant datasets, the 2020 weather dataset from the European Center for Medium-Range Weather Forecasts (ECMWF) represents the most recent and authoritative source that fulfills these requirements. It has undergone rigorous validation and demonstrates high reliability [
47].
Second, considerable emphasis was placed on the climatic typicality and long-term representativeness of the data. Although multi-year climate datasets such as the 1991–2020 China Surface Standard Climate Normals Dataset (CSCND, authoritative data from the China Meteorological Administration) exhibit strong long-term representativeness, they only provide annual or monthly averages, which are inadequate for hourly simulations. Therefore, to evaluate the climatic typicality and long-term representativeness of the station data, we quantified the statistical agreement between the monthly average precipitation from the ECMWF 2020 dataset and the 1991–2020 CSCND.
A coefficient of determination (
R2) threshold of 0.7 was employed in the regression analysis to evaluate data consistency. This threshold aligns with the established convention in climate data validation studies, where an
R2 ≥ 0.7 is widely adopted to indicate an acceptable level of agreement between datasets for subsequent modeling applications. In their study, “New procedure in developing adjustment algorithm for harmonizing historical climate datasets”, Komutunga indicated that an
R2 > 0.5 (corresponding to a correlation coefficient
R2 > 0.7) between simulated data and observed monthly rainfall can be considered indicative of a “strong and statistically significant linear relationship” [
48]. Their study concluded that an
R2 of 0.53–0.54 sufficiently accounts for a substantial portion of data variance, making it suitable for subsequent analysis. Building on this consensus and considering the need for higher data consistency in this study, we established a more stringent threshold of
R2 ≥ 0.7. This ensures a stronger correlation between the ECMWF 2020 data and the 1991–2020 CSCND, thereby better supporting the quality requirements of input data for subsequent hygrothermal simulations. Among the 106 meteorological stations analyzed, 33 met the
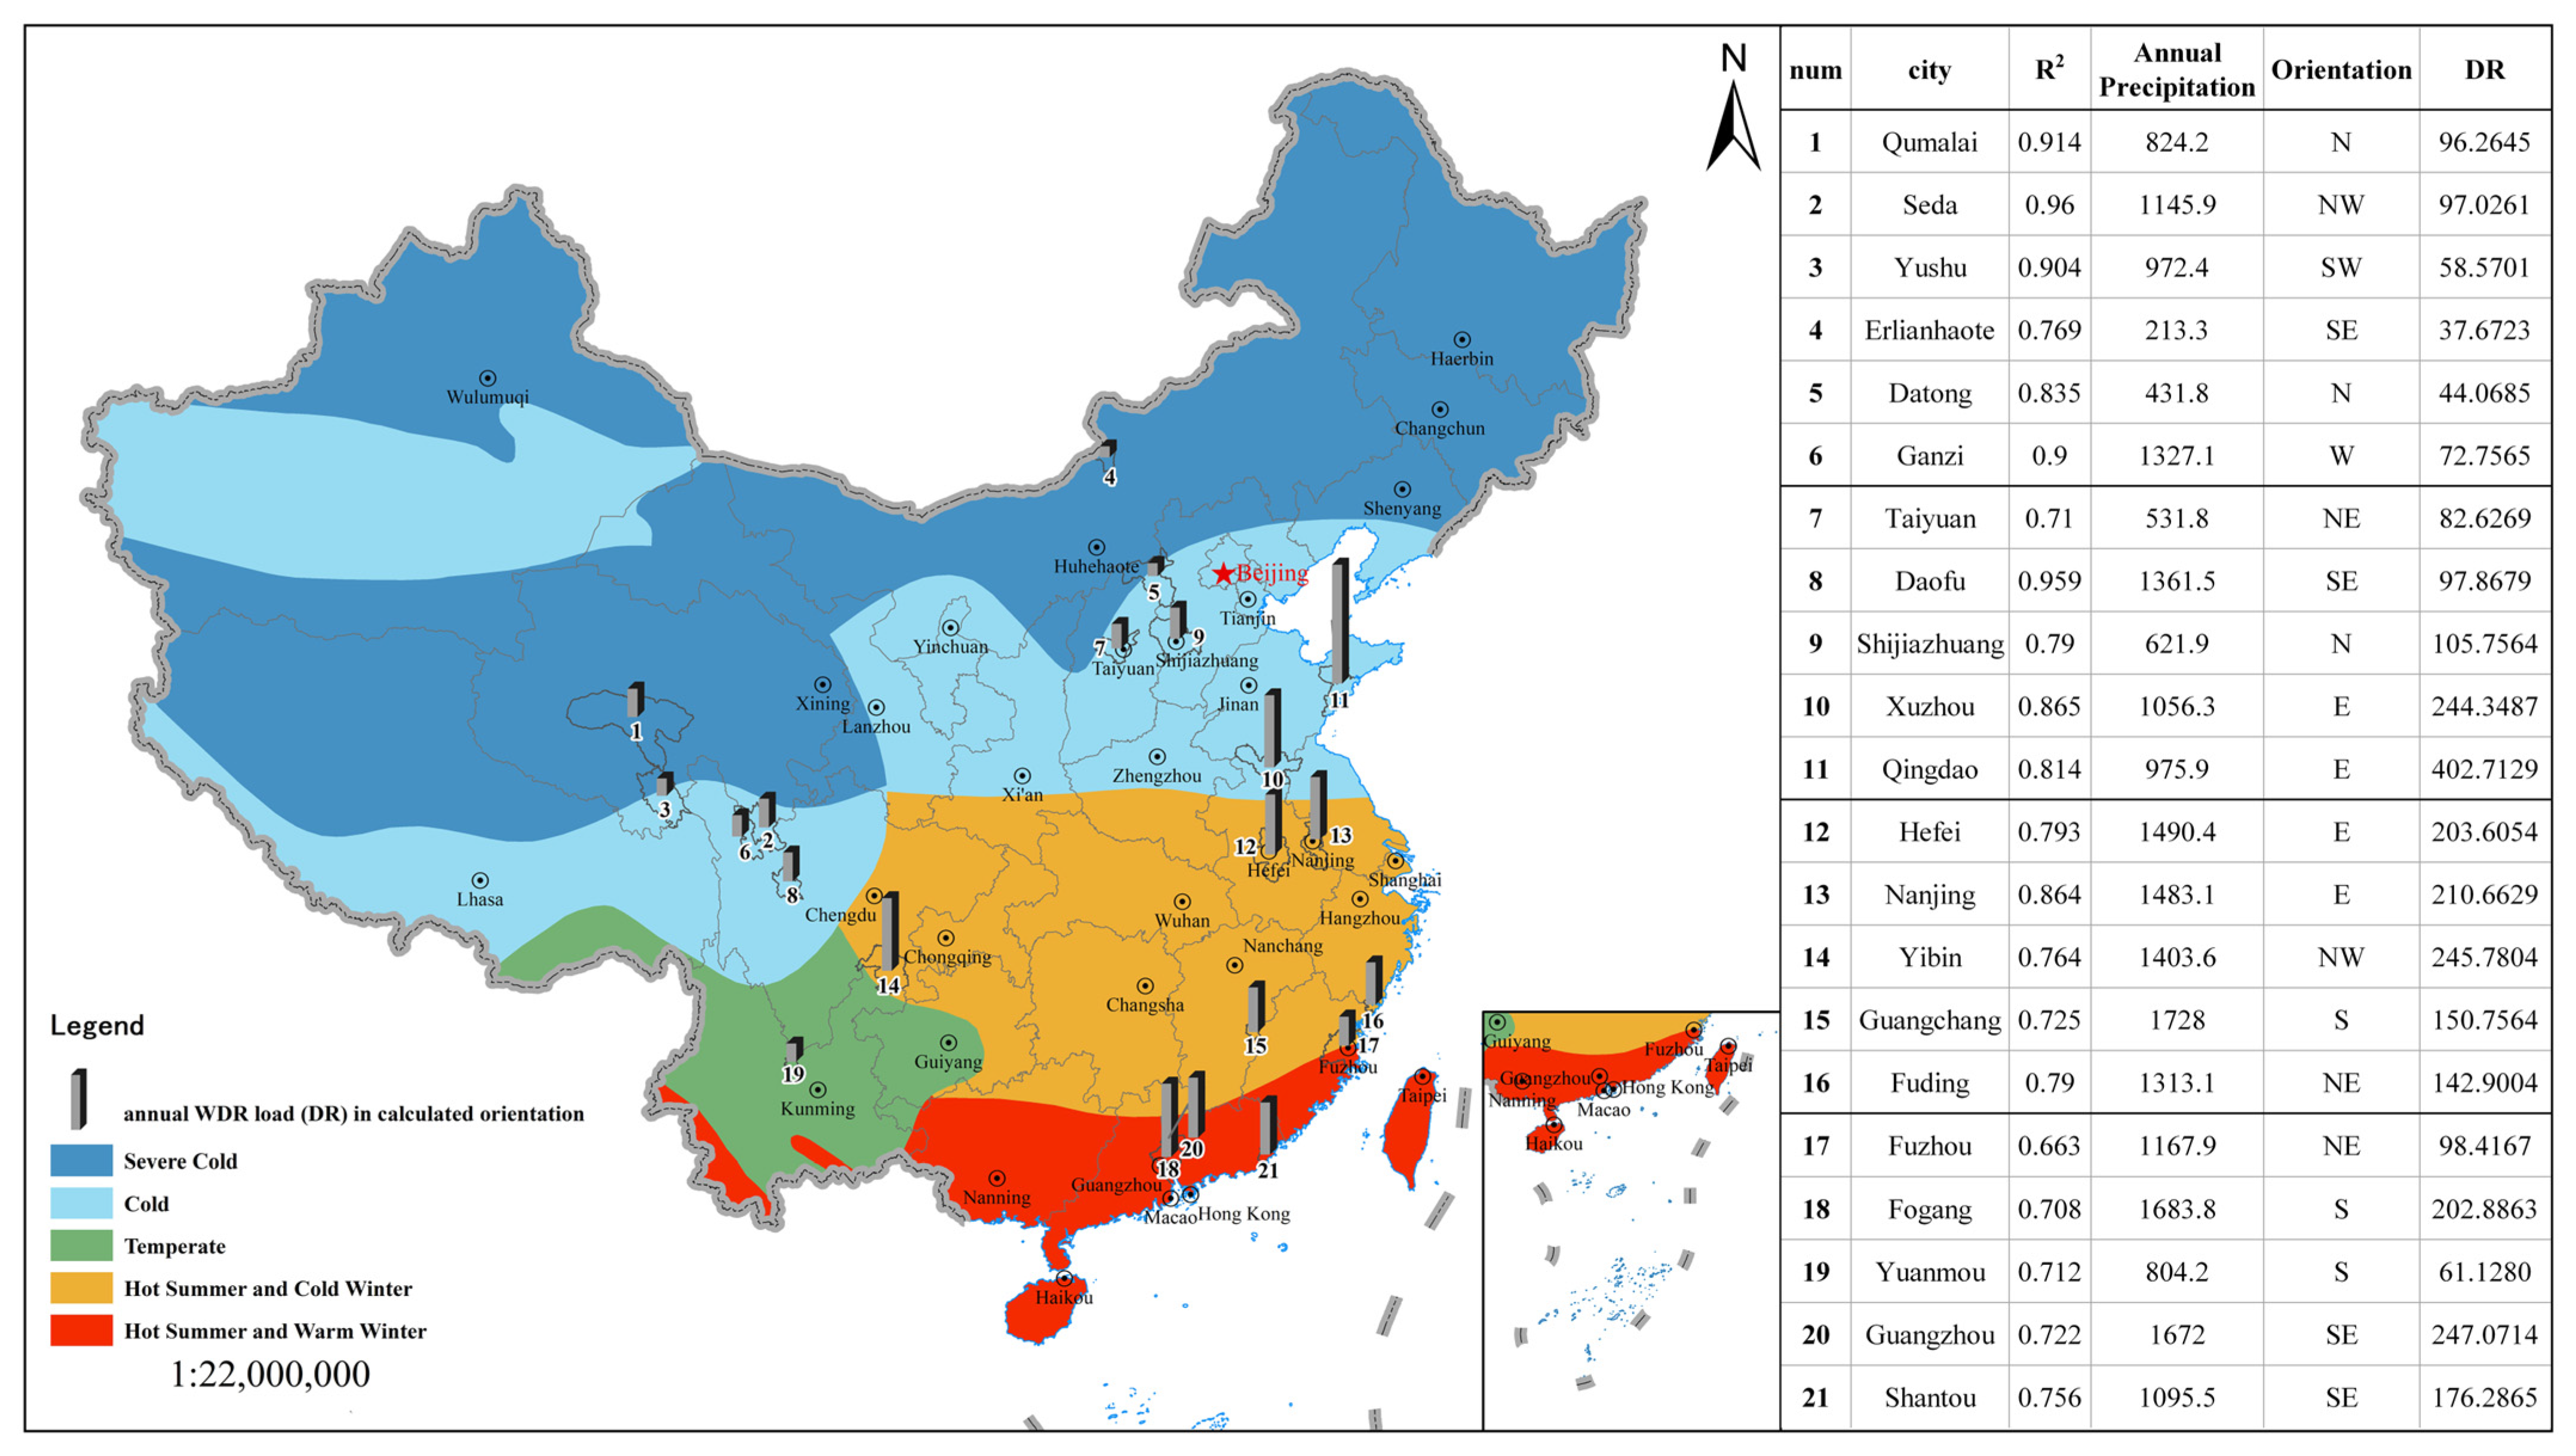
R2 ≥ 0.7 criterion. To ensure spatial distribution uniformity, 21 stations were selected as representative simulation locations according to China’s four thermal zones, with detailed parameters of the selected stations illustrated in
Figure 1.
2.2. Simulation Setup
This study adopted WUFI Pro (version 6.7) for semi-empirical simulations. Developed by the Fraunhofer Institute in Germany, the software is based on the heat–air-moisture transfer (HAMT) model proposed by Künzel [
19]. It comprehensively incorporates key climatic factors, such as material moisture content, WDR, solar radiation, longwave radiation, capillary transport, and summer condensation. WUFI Pro accurately simulates the transient hygrothermal performance of building components under natural climate conditions, supports simulations of standard cross-sections, and performs dynamic hygrothermal analyses in accordance with the DIN EN 15026 standard using real climatic data [
49].
2.2.1. Boundary Conditions
Based on the 2020 hourly meteorological data from the ECMWF, this study adopted the WAC format to construct climate files for the required locations, as WUFI’s built-in weather database lacks meteorological stations in mainland China. The resulting outdoor boundary conditions comprise a full year of hourly data—including temperature, relative humidity, global radiation, wind direction, wind speed, and precipitation—with 8760 records for each variable across the 21 selected cities.
The indoor environmental conditions were derived using the algorithm specified in ASHRAE Standard 160 [
35], which derives indoor thermal conditions from outdoor climate data. In this study, indoor design temperatures for heating and cooling were determined by comprehensively considering the thermal zoning characteristics of each city [
50]. The on/off status of air conditioning systems was automatically controlled according to indoor temperature and humidity conditions to maintain the indoor environment within the target range. Indoor air movement also plays a critical role in heat and moisture transfer processes. Therefore, an appropriate airflow model was applied in the simulation, incorporating designated air change rates to reflect the potential influence of ventilation on the inner surface of the wall. Specifically, in Severe Cold and Cold Zones, the indoor heating temperature was set at 18 °C, with a design ventilation rate of 0.5 air changes per hour during the heating period. In the Hot Summer and Cold Winter Zone, the indoor design temperature was set to 18 °C for winter heating and 26 °C for summer cooling, with a design ventilation rate of 0.5 air changes per hour. In the Hot Summer and Warm Winter Zone, during summer air-conditioning operation, the indoor design temperature for living spaces is maintained at 26 °C, with a design ventilation rate of 1.0 air changes per hour.
In this study, a total of 68 simulation cases, each defined as a unique combination of one location and one wall type, were run for a period of four years with reference to a previous study [
30].
2.2.2. Physical Model Setting
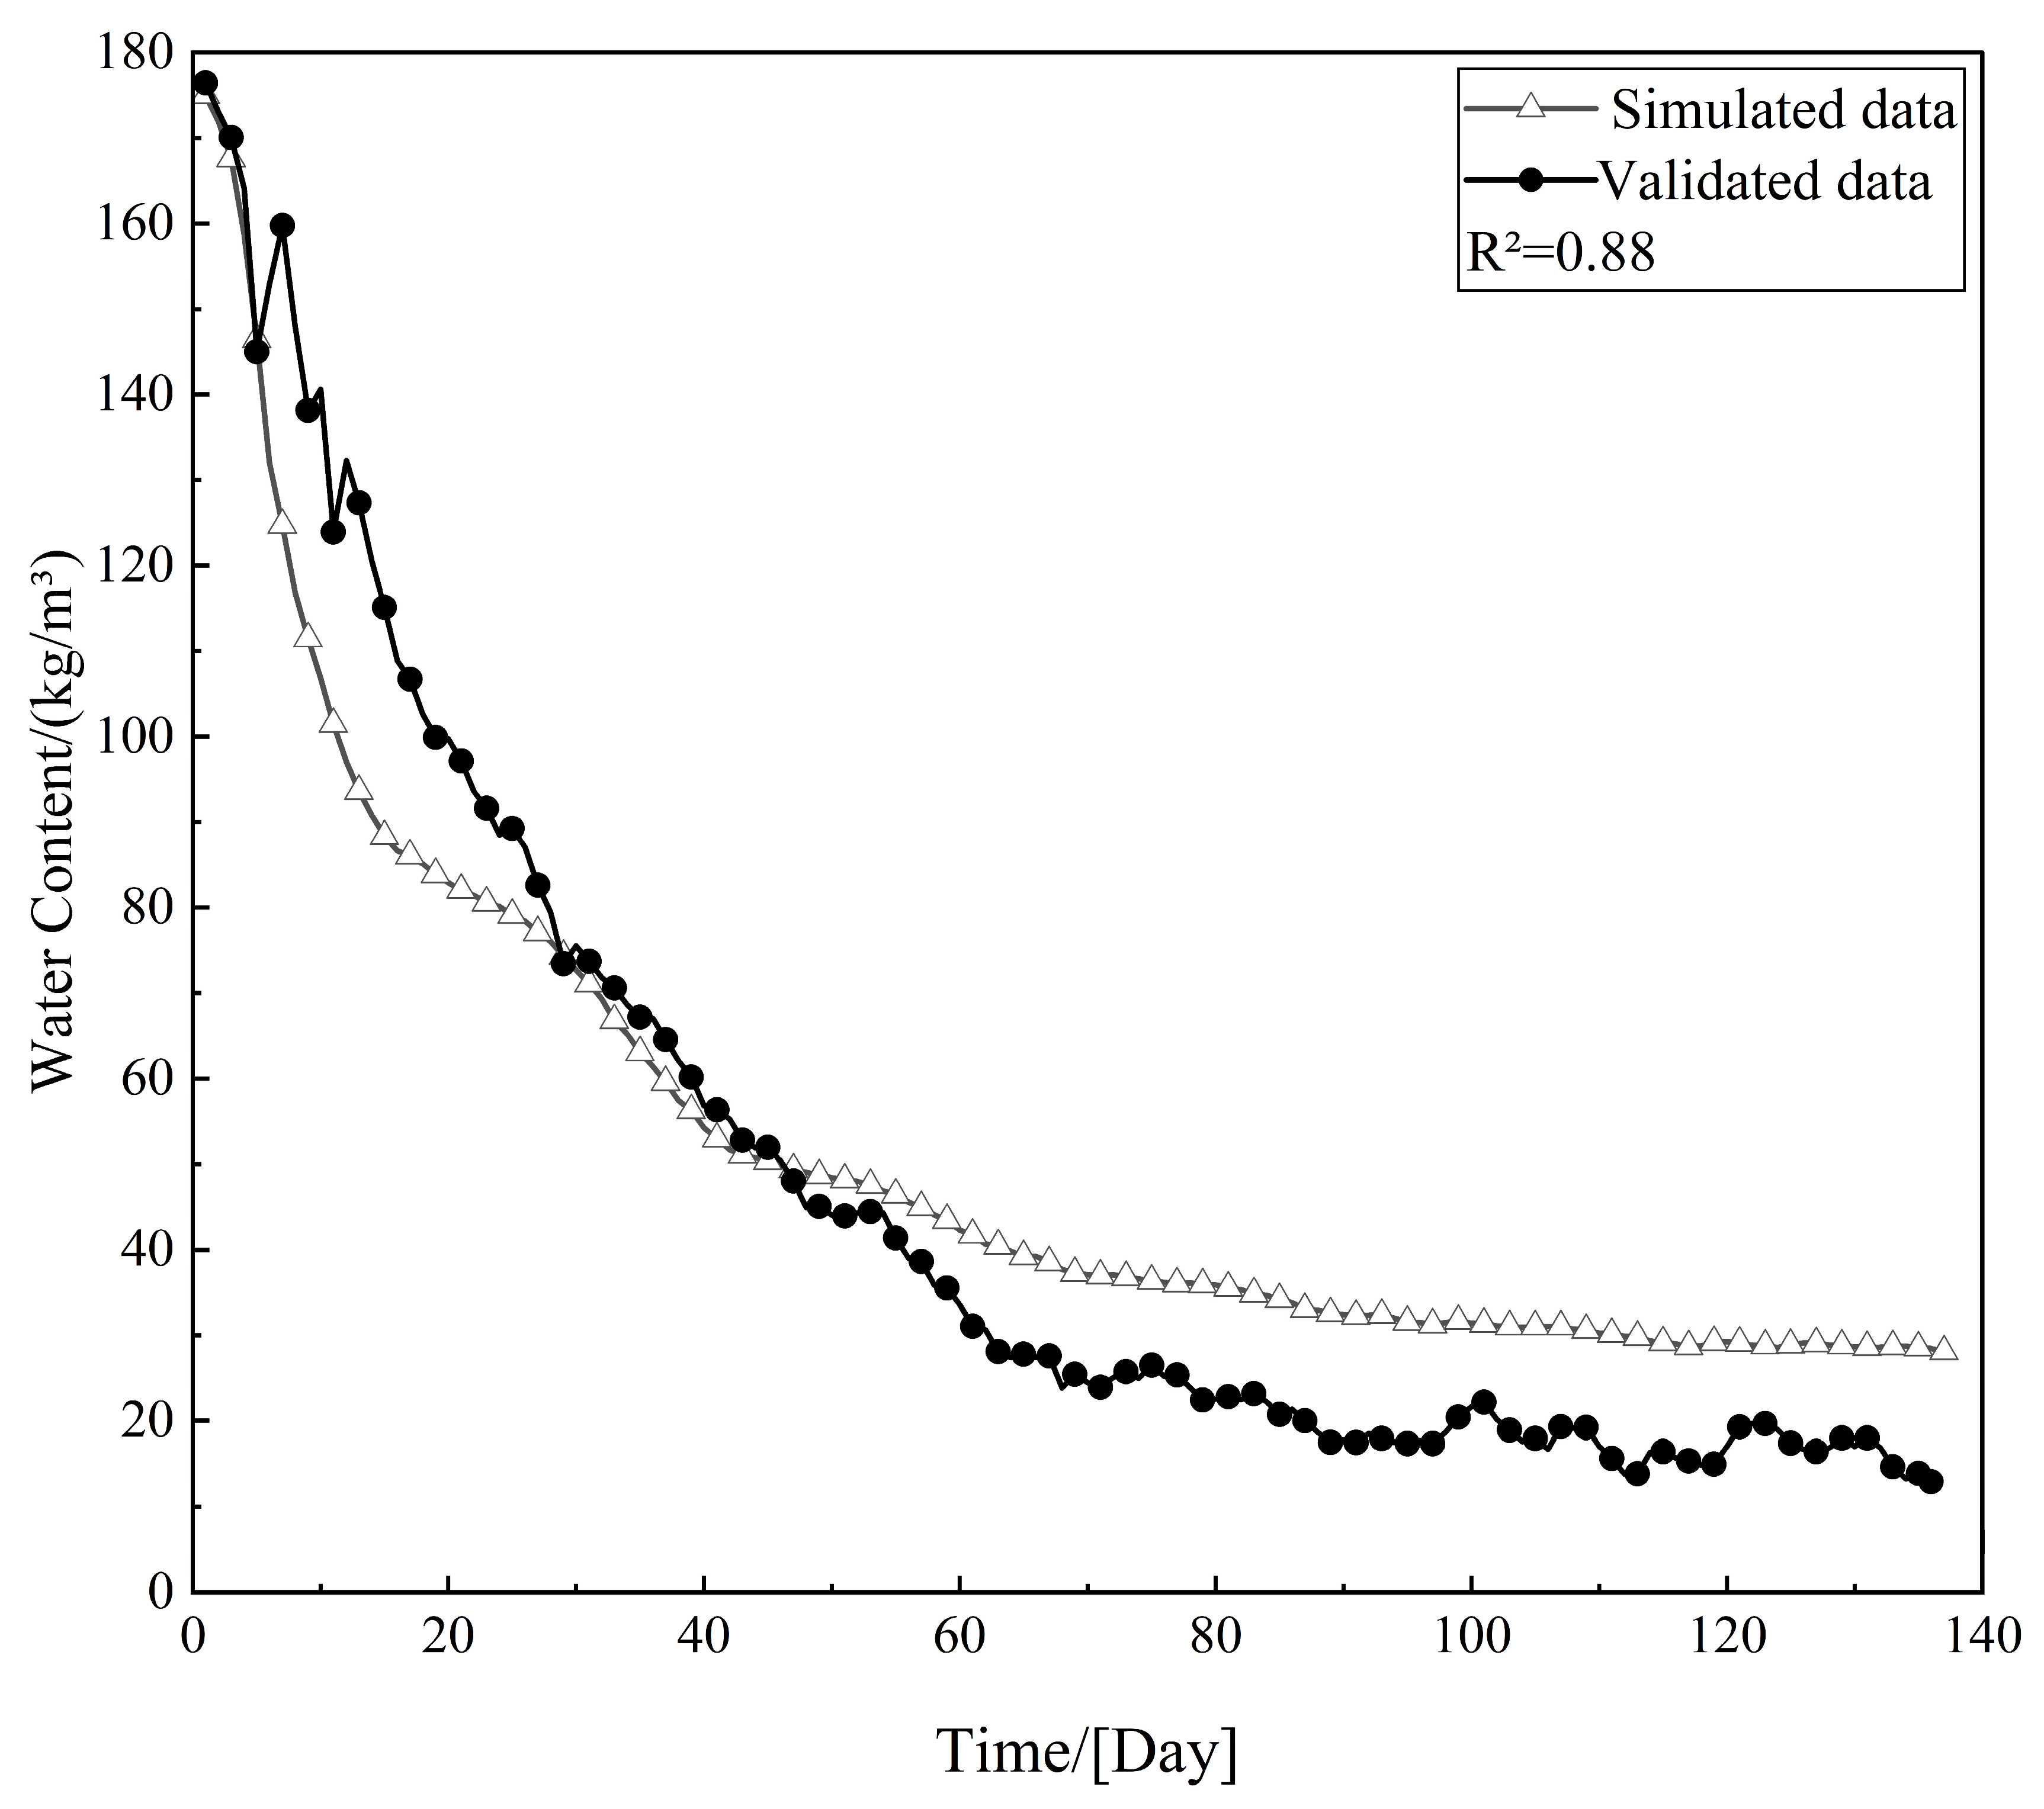
To evaluate the accuracy of the WUFI simulations in this study, we reproduced the study of the EPS internally insulated wall in Beijing from reference [
51], using the moisture content data provided in that study as a validation benchmark. We strictly followed the wall construction, hygrothermal material parameters, and boundary conditions described in the literature to establish the corresponding physical model in WUFI Pro.
A key and unavoidable discrepancy lies in the fact that the original text does not specify the exact source and version of the Typical Meteorological Year data for Beijing used in their study. Due to the diversity of historical weather datasets, it was impossible to ensure the use of a climate file identical to that in the original study. Nevertheless, the simulated moisture content variation over time in the concrete layer of the wall showed a high degree of consistency with the data reported in the literature, both in dynamic trends and numerical magnitude, as shown in
Figure 2. This demonstrates the robustness and reliability of the WUFI model and parameter settings adopted in this study.
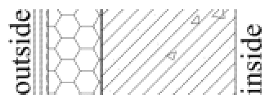
The tested wall assemblies in this study are all thermal insulation types, including thin plastered EPS external insulation system (Type 1), rock wool external insulation system (Type 2), precast concrete sandwich insulation panel system (Type 3), autoclaved aerated concrete block self-insulation system (Type 4), and gypsum board-expanded polystyrene composite internal insulation system (Type 5). Since thermal insulation types are not suitable for mild climate zones, this study does not include locations in the mild climate zone.
For the same wall assembly type to be evaluated across different climate zones, the insulation layer thickness, however, requires adjustment to meet the specified thermal transmittance. Per the requirements outlined in the General Code for Energy Efficiency and Renewable Energy Application in Buildings (GB 55015-2021) [
52], the maximum allowable U-values (W/(m
2·K)) for external walls of residential buildings with three or more stories are 0.40, 0.45, 1.20, and 1.50 for the Severe Cold, Cold, Hot Summer and Cold Winter, and Hot Summer and Warm Winter Zones, respectively. All assemblies selected in this study comply with these criteria. The corresponding configurations and the thermophysical parameters of each wall assembly are summarized in
Table 1 and
Table 2.
Selected typical wall assembly types were precisely modeled as physical assemblies in WUFI Pro. These models detail the layer sequence, thickness of each layer, and specific material parameters, while consistently following a fixed indoor–outdoor orientation convention, where the left side represents the exterior and the right side represents the interior. The determination of the orientation and the calculation of WDR involve two steps. First, the direction with the maximum WDR is determined. The eight available orientations for exterior walls include the four cardinal directions (east, west, south, and north) and four intercardinal directions (northeast, northwest, southeast, southwest). The WDR for each orientation is then computed using Equation (1), with all eight directions included in the calculation.
where the following applies:
—total wind-driven rain amount (mm)
—rainfall intensity on the horizontal plane (mm/h)
—wind-driven rain coefficient related to roof eave inclination
—wind-driven rain coefficient dependent on wind speed
—hourly average wind speed at a height of 10 m (m/s)
—angle between the wind direction and the wall surface normal.
The calculation of the annual WDR load (DR) in a single orientation for each location, as well as the WDR input data used in the simulation, employs the
index (kg/m
2·h) proposed in ASHRAE Standard 160-2009. The indicator accounts for WDR deposition on exterior walls based on hourly meteorological data, incorporating hourly rainfall, hourly average wind speed, and adjusting for terrain, building height, and roof geometry as illustrated in
Figure 1.
The specific calculation uses Equation (2) is as follows:
where the following applies:
—WDR deposition on the vertical wall surface, kg/(m2·h);
—rain exposure factor, taken as 1 (assuming building height < 10 m and moderately exposed conditions);
—rain deposition factor, taken as 0.5 (assuming a wall beneath a low-inclination eave);
—empirical constant, 0.2 kg·s/(m2·mm).
The grid size was set to 100 cells, indicating a relatively fine resolution. Monitoring points were defined within each material layer along the thickness direction. No additional sources of heat, moisture, or air exchange were introduced to isolate the effects of indoor and outdoor environments on wall performance. The simulation outputs included hourly data on moisture content and mold growth potential over the simulation period, providing a basis for performance evaluation.
2.3. Indicators for Evaluation
2.3.1. Moisture Content
In a simulation study for all test cases, the initial relative humidity and temperature of the wall assemblies were set to fixed values of 80% and 20 °C, respectively, throughout the entire model. This criterion indicates the ability of the wall assembly to dry out over time. The initial and final moisture contents for the entire assembly are evaluated for each wall over a 4-year period. If the final value at the end of the modeling period is less than the initial value, this means that the wall has the potential to dry out. The moisture content involved in the research also includes the total mean moisture content (TMC), the insulation layer mean moisture content (IMC), and the outermost layer mean moisture content (OMC).
2.3.2. Dryness Rate
This study employed dryness rate as the key indicator to assess the hygrothermal performance of wall assemblies. The dryness rate provides an intuitive measure of how well wall assemblies can release moisture over time under specific climatic conditions, which is crucial for evaluating the durability and long-term stability of building materials. This indicator has been used in previous studies on hygrothermal performance of external walls [
30].
The dryness rate was calculated as the difference between the initial and final moisture content. A positive value indicates that the case has the capacity to dry over time under the specified climatic conditions. The dryness rate, expressed as a percentage of this moisture loss relative to the initial moisture content, represents the degree of drying achieved during the simulation period.
where the following applies:
—dryness rate
—initial moisture content, kg/m3
—final moisture content, kg/m3
2.3.3. Mold Growth
Mold growth serves as a critical indicator for assessing both wall performance and indoor hygienic conditions [
29,
32]. It is particularly important in the context of adding insulation layers to historic buildings or during retrofitting projects [
33]. In addition to affecting indoor air quality, mold growth can lead to physical degradation of wall assemblies. For example, organic acids secreted by mold can corrode concrete surfaces, causing unevenness, detachment of finishing layers, and deterioration of insulation materials. These effects may result in material softening, chalking, and ultimately a reduction in the service life of the building envelope [
30].
Mold growth on interior wall surfaces is primarily influenced by surface temperature, relative humidity, and duration. In this study, the risk of mold growth was assessed using the bio-hygrothermal model integrated within the WUFI pro (6.7). This model, based on the theory of Sedlbauer [
53], comprehensively considers the synergistic effects of different relative humidity levels and their duration within the temperature range of 0 °C to 50 °C on the germination of mold spores. The assessment thresholds are dynamically interrelated and not fixed values. WUFI simulations provide temperature–humidity scatter plots, where the x-axis represents temperature (°C) and the y-axis represents relative humidity (%). More importantly, the software’s mold analysis function directly outputs evaluation results based on these complex calculations. In this study, the simulation results for the interior surfaces of all wall assemblies were analyzed, and cases identified by the software as posing a mold growth risk were recorded accordingly [
19].
2.3.4. U-Value
Exterior wall assemblies are commonly composed of porous materials due to their capacity to absorb and retain moisture [
54,
55]. Within these materials, moisture may exist in three phases, vapor, liquid, and ice, as a function of temperature, relative humidity, and pore structure. These interrelated factors contribute to the complexity of their hygrothermal behavior [
56].
In dry conditions, wall assemblies exhibit low U-values, ensuring superior thermal insulation. However, upon moisture absorption, their thermal performance can deteriorate significantly, as changes in moisture content affect changes in the U-value, and vice versa [
56]. This mutual influence between moisture transport and heat transfer reduces insulation capacity and may ultimately increase building energy consumption [
57].
The HAMT within building envelopes is a complex process. Therefore, when analyzing the impact of wind-driven rain in different climatic zones and its effects on various wall assemblies, it is essential to incorporate the HAMT process. This is crucial for reducing building energy consumption, assessing and preventing moisture-related damage, improving indoor thermal comfort and hygiene, and optimizing the overall performance of envelope types [
54,
55,
58].
The initial U-values of wall assembly types in each thermal zone were uniformly specified at the beginning of the calculation period, while the simulation process was dynamic. Therefore, in quantifying the effects of DR and U-value on moisture content, this study uses the hourly mean U-value of wall assemblies from the final year of the calculation period, ensuring that the results reflect the actual thermal transmittance characteristics of the envelope under long-term service conditions.
2.4. Statistical Analysis
To examine whether statistically significant differences in moisture content exist among the wall assembly types within each location, a comparative analysis was conducted using the hourly total moisture content from the final simulation year of each case. Since the moisture content data of all 68 wall cases exhibited a pronounced positive skew (skewness coefficients ranging from 0.39 to 4.93) and the sample size was large (n > 8760 per case), the Shapiro–Wilk normality test may be overly sensitive and potentially misleading in this context. In large samples, even minor deviations from normality can lead to statistically significant results (
p < 0.001). Thus, the assumptions for parametric tests were not met, and nonparametric methods were employed in this study. Given that each location has two to five independent groups, i.e., wall assembly types, multiple group comparisons were conducted for each location (involving up to five wall types, corresponding to six pairwise comparisons). To control the false positive error rate (Family-Wise Error Rate, FWER) arising from multiple testing, the Bonferroni correction was applied. This method adjusts the significance threshold (α/m, where m is the number of tests) to ensure that the overall error rate does not exceed the predetermined level (e.g., α = 0.05) [
59]. Specifically, the original α = 0.05 was adjusted to α = 0.0083 (0.05/6 ≈ 0.0083). This adjustment imposes a stricter criterion for determining statistical significance, thereby reducing the risk of false positives, though it may slightly increase the probability of false negatives.
In addition, to investigate the relationship between WDR load and wall moisture content, Spearman’s rank correlation analysis was performed using the TMC, IMC, and OMC as variables. This nonparametric method was selected because both WDR load and moisture content violated the assumption of bivariate normality and exhibited nonlinear relationships, allowing for the assessment of monotonic associations and their statistical significance.
2.5. Quantifying the Impact of Key Factors on Moisture Content
This study further employs a machine-learning approach, specifically the Random Forest Regression Model [
60], combined with the Sobol Sensitivity Analysis [
61]. A previous study has developed a machine-learning method for predicting wind-driven rain catch ratios on building façades and compared multiple algorithms [
62]. Random Forest is an ensemble learning algorithm based on multiple decision trees, improving prediction accuracy and stability through voting mechanisms. Leveraging its robustness and resistance to overfitting, we employ the RF–Sobol framework to investigate the impact of DR (mm/a) and U-value (W/(m
2·K)) on the annual average moisture content of the outermost layer of building structures, where the outermost layer refers to the insulation layer for external insulation system and the structural layer for non-external insulation systems. The research dataset consists of 68 samples, each derived from a single case, with input variables including construction type, DR (mm/a), and the mean U-value for the final year. The output variable is the annual average moisture content of the outermost layer (kg/m
3).
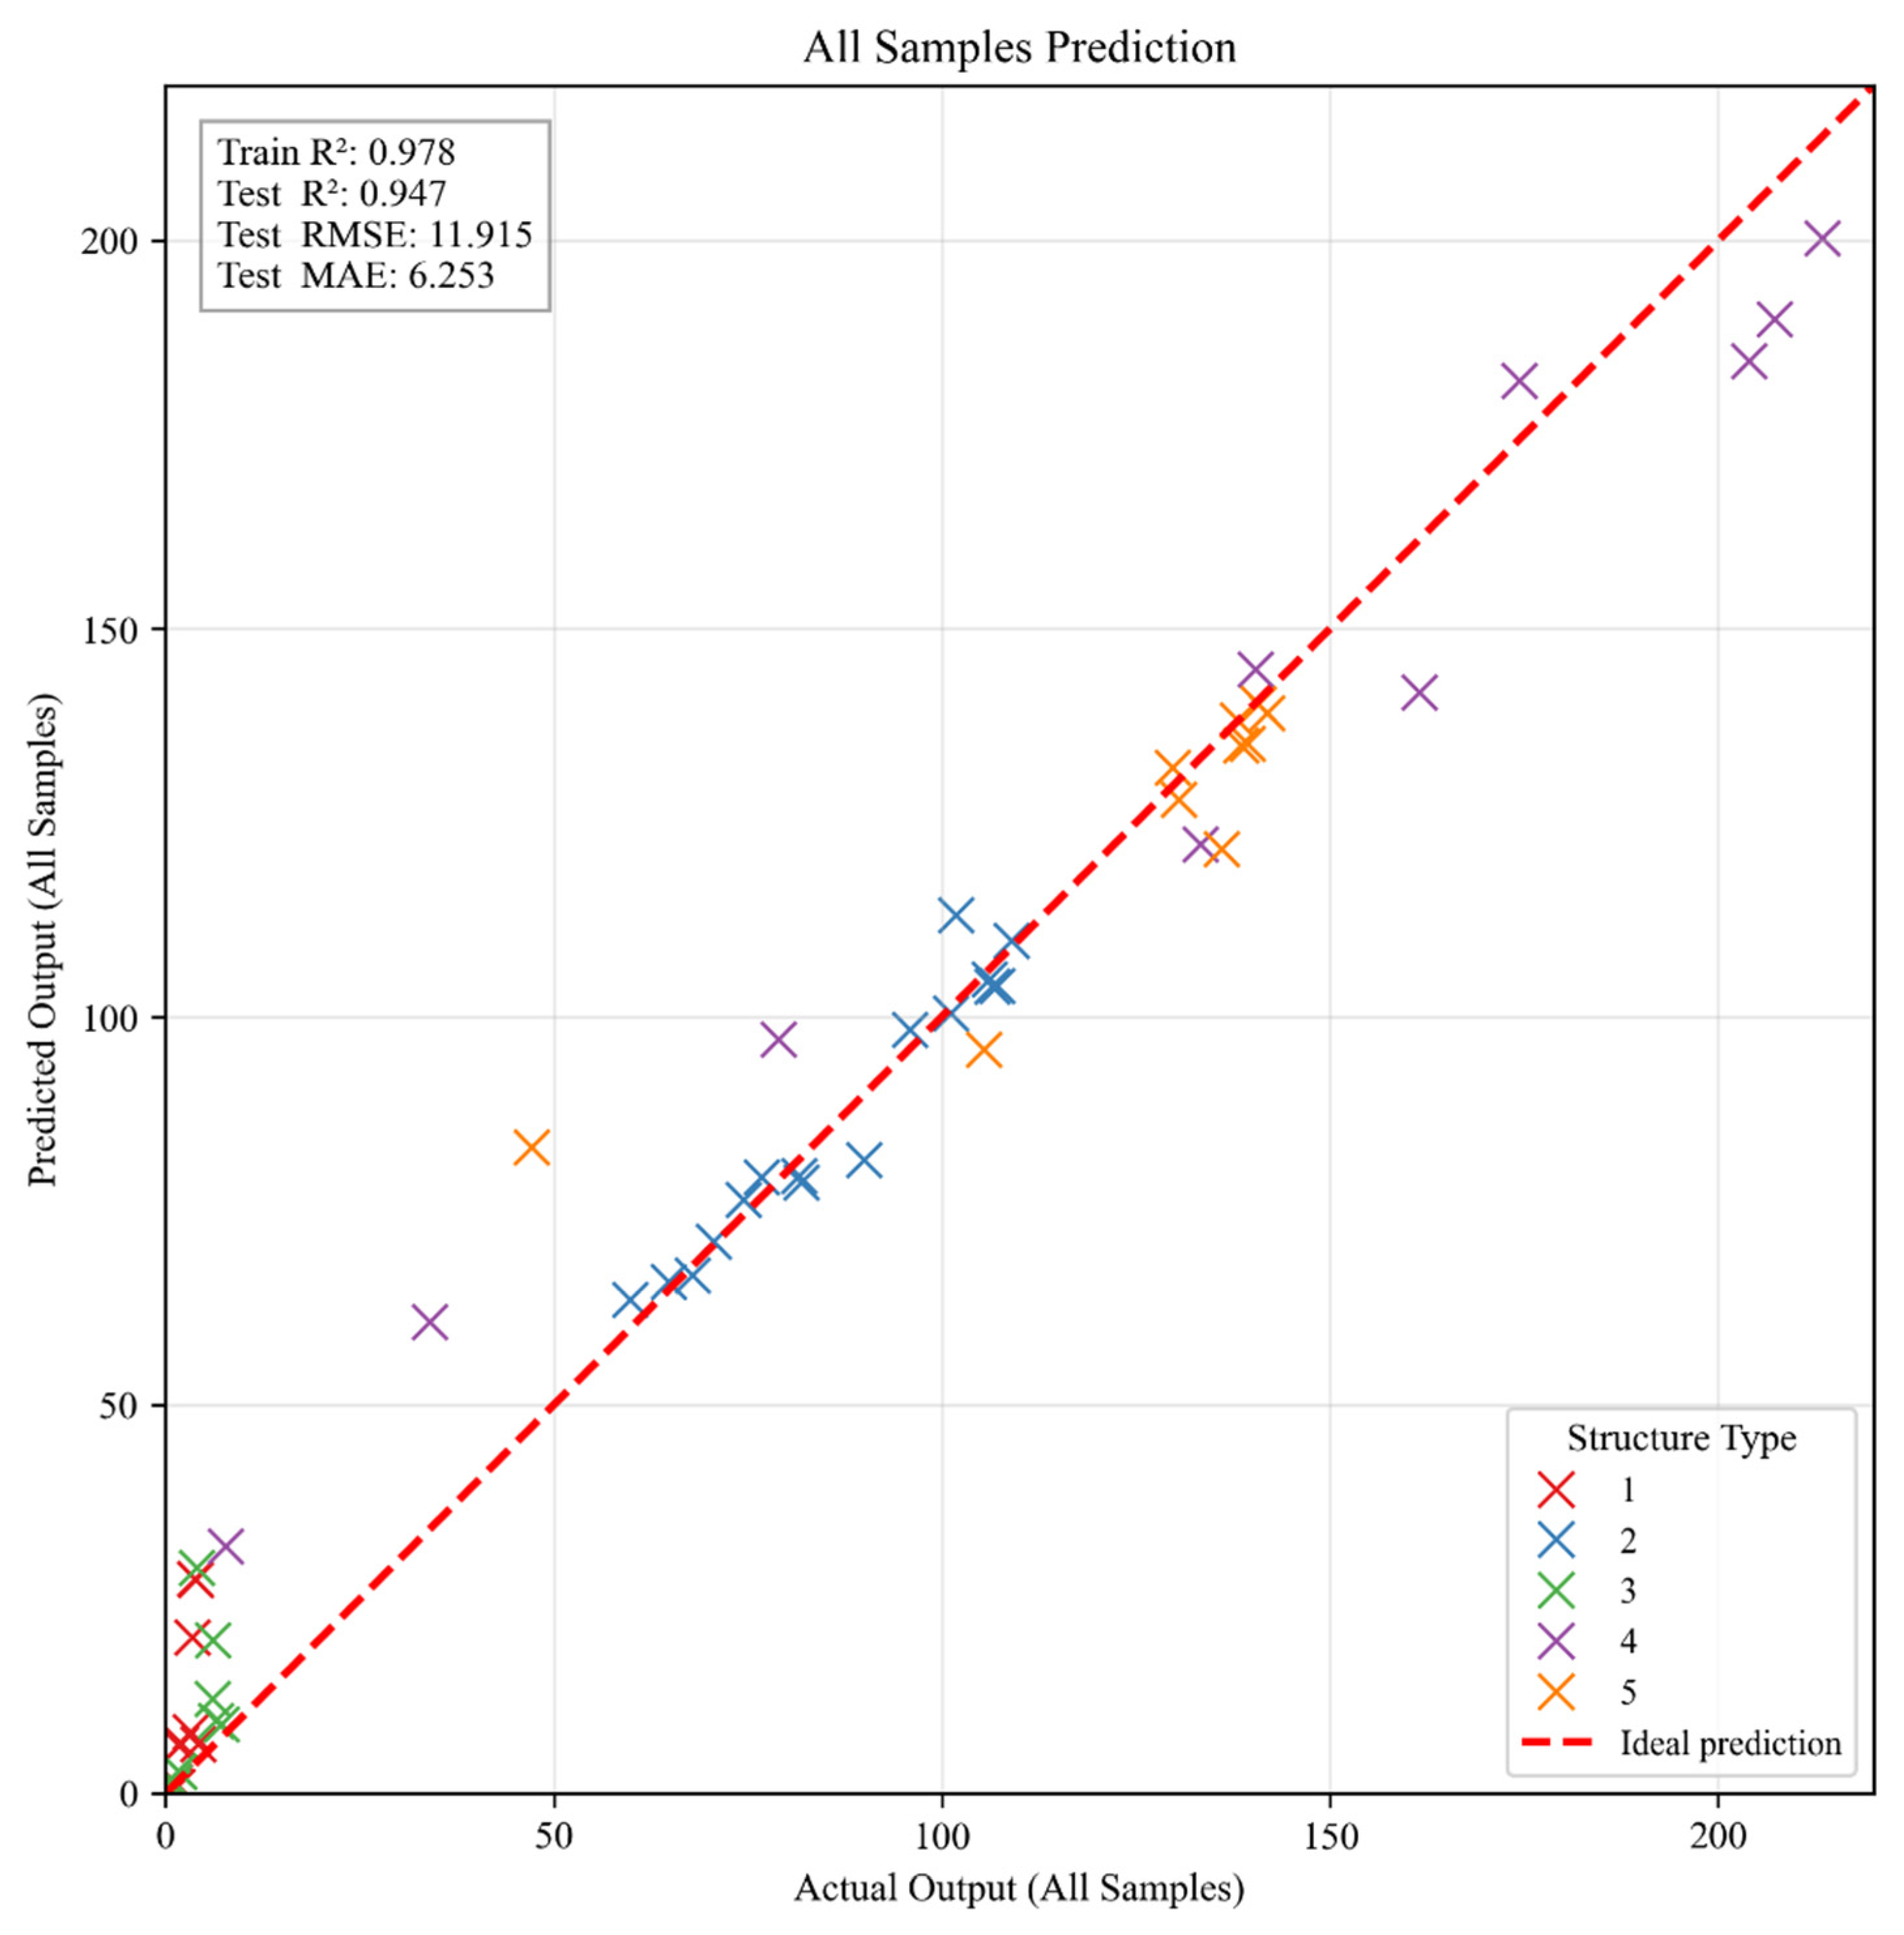
During the modeling phase, wall assembly types were treated as a discrete categorical variable and input into the model using One-Hot encoding along with other continuous parameters. A random forest regression model containing 500 decision trees was constructed using Python (3.9)’s sklearn.ensemble library to characterize the relationship between input variables and moisture content. Model evaluation results showed an
R2 of 0.978 for the training set and 0.947 for the test set, with a test set RMSE of 11.915 and MAE of 6.253, as shown in
Figure 3. These results indicate good agreement between predicted and measured values, along with strong generalization ability. Therefore, this model can serve as a reliable surrogate model for subsequent sensitivity analysis.
In the sensitivity analysis phase, the Saltelli method from the SALib library [
63] was used to generate sampling points within the parameter space. Predictions were made using the trained random forest model, followed by calculations of Sobol first-order sensitivity indices (S1) and total effect indices (ST). DR and mean U-value were continuously sampled across the five wall assembly types to explore the sensitivity characteristics of these two continuous variables under different construction systems.
3. Simulation Results and Discussions
3.1. Moisture Content Assessment
The results demonstrated that, in all locations, the moisture content of different wall assembly types exhibited statistically significant differences (
p < 0.001), indicating that wall assemblies with identical initial U-values had significant differences in moisture content within the same location, and this pattern was consistent across all thermal zones. However, after applying the Bonferroni correction for multiple comparisons, only two pairs showed no significant difference: Type 1 vs. Type 4 in Fuding, and Type 1 vs. Type 3 in Taiyuan. Detailed results are presented in
Table 3. Despite the more stringent significance threshold imposed by the Bonferroni correction (α = 0.0083), the key between-group differences reported in
Table 3 remained statistically significant. This further supports the conclusion that moisture content fundamentally differs across wall types.
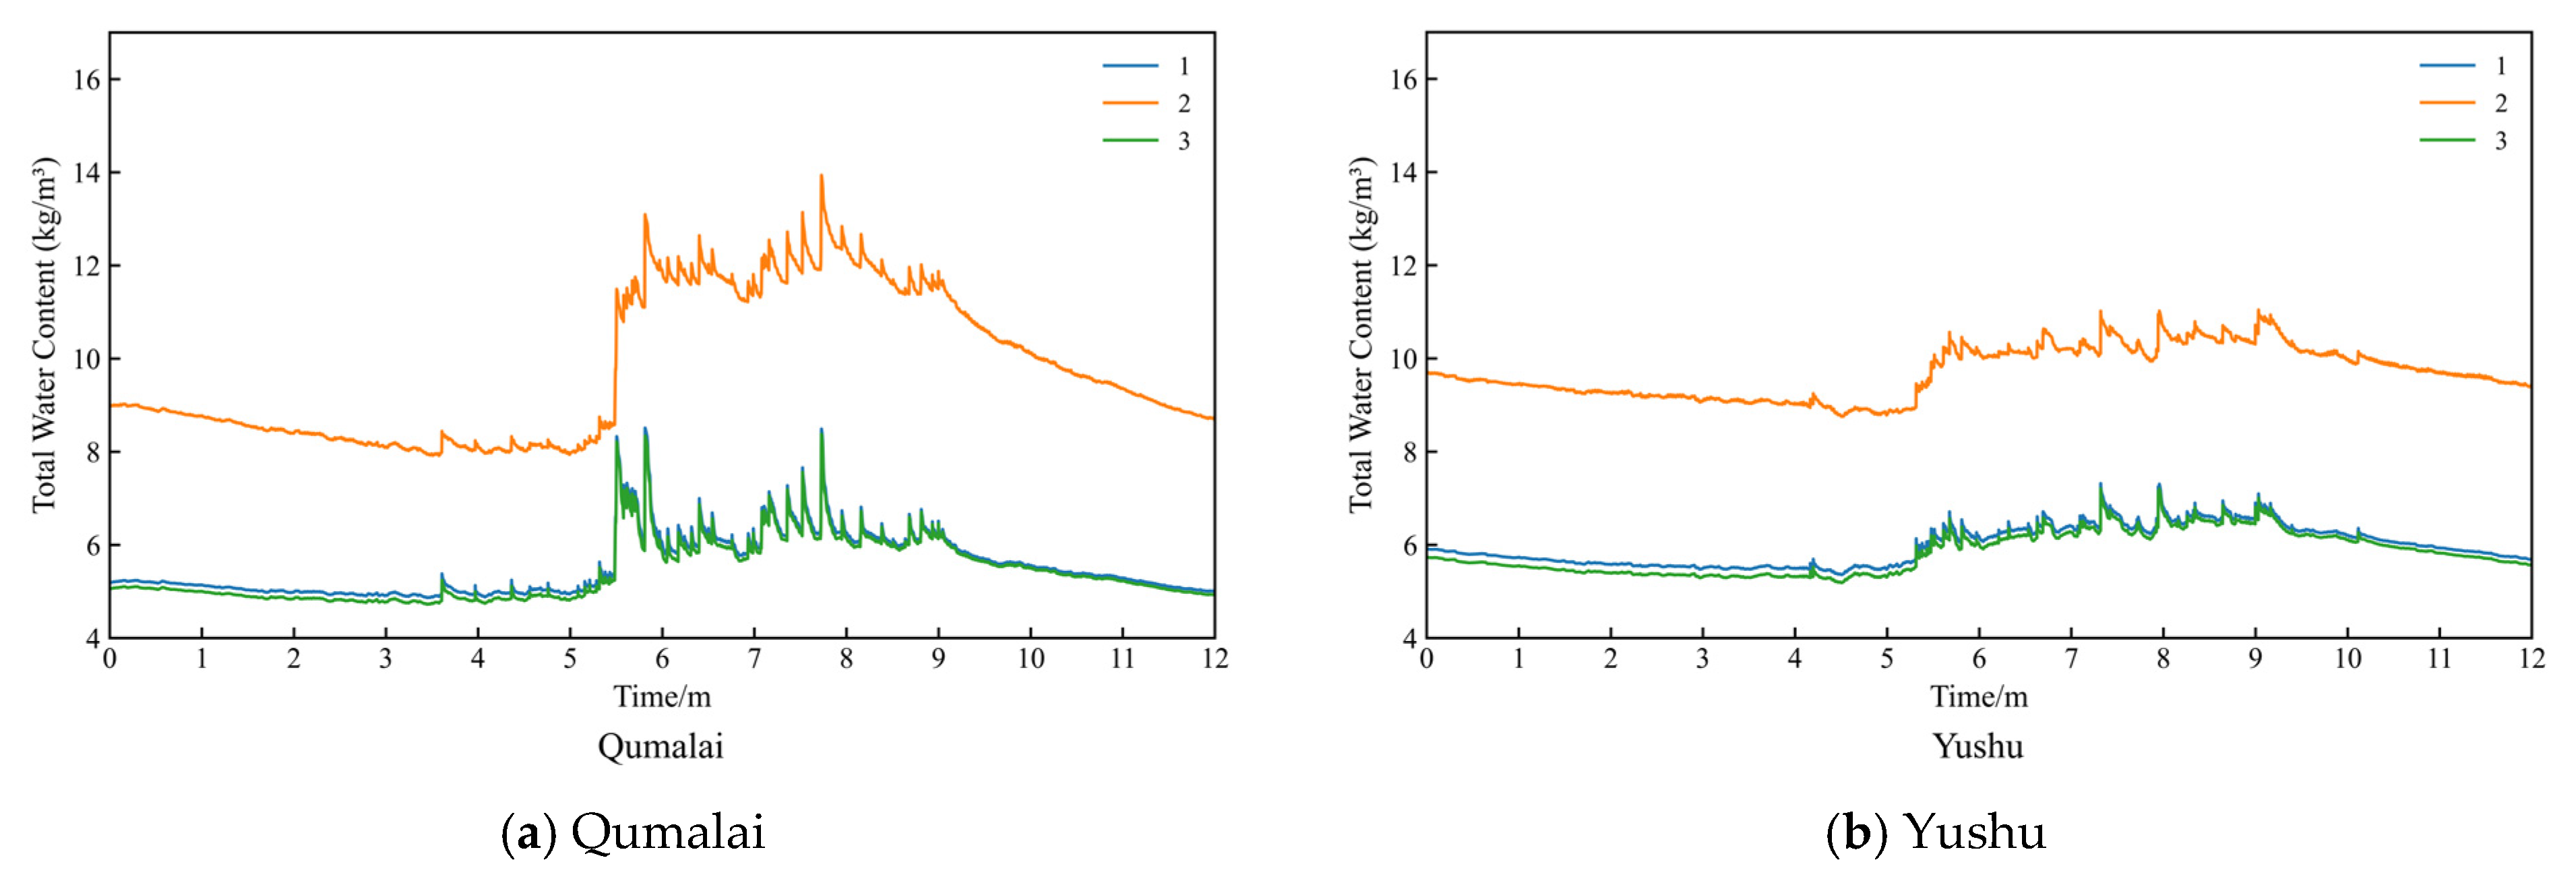
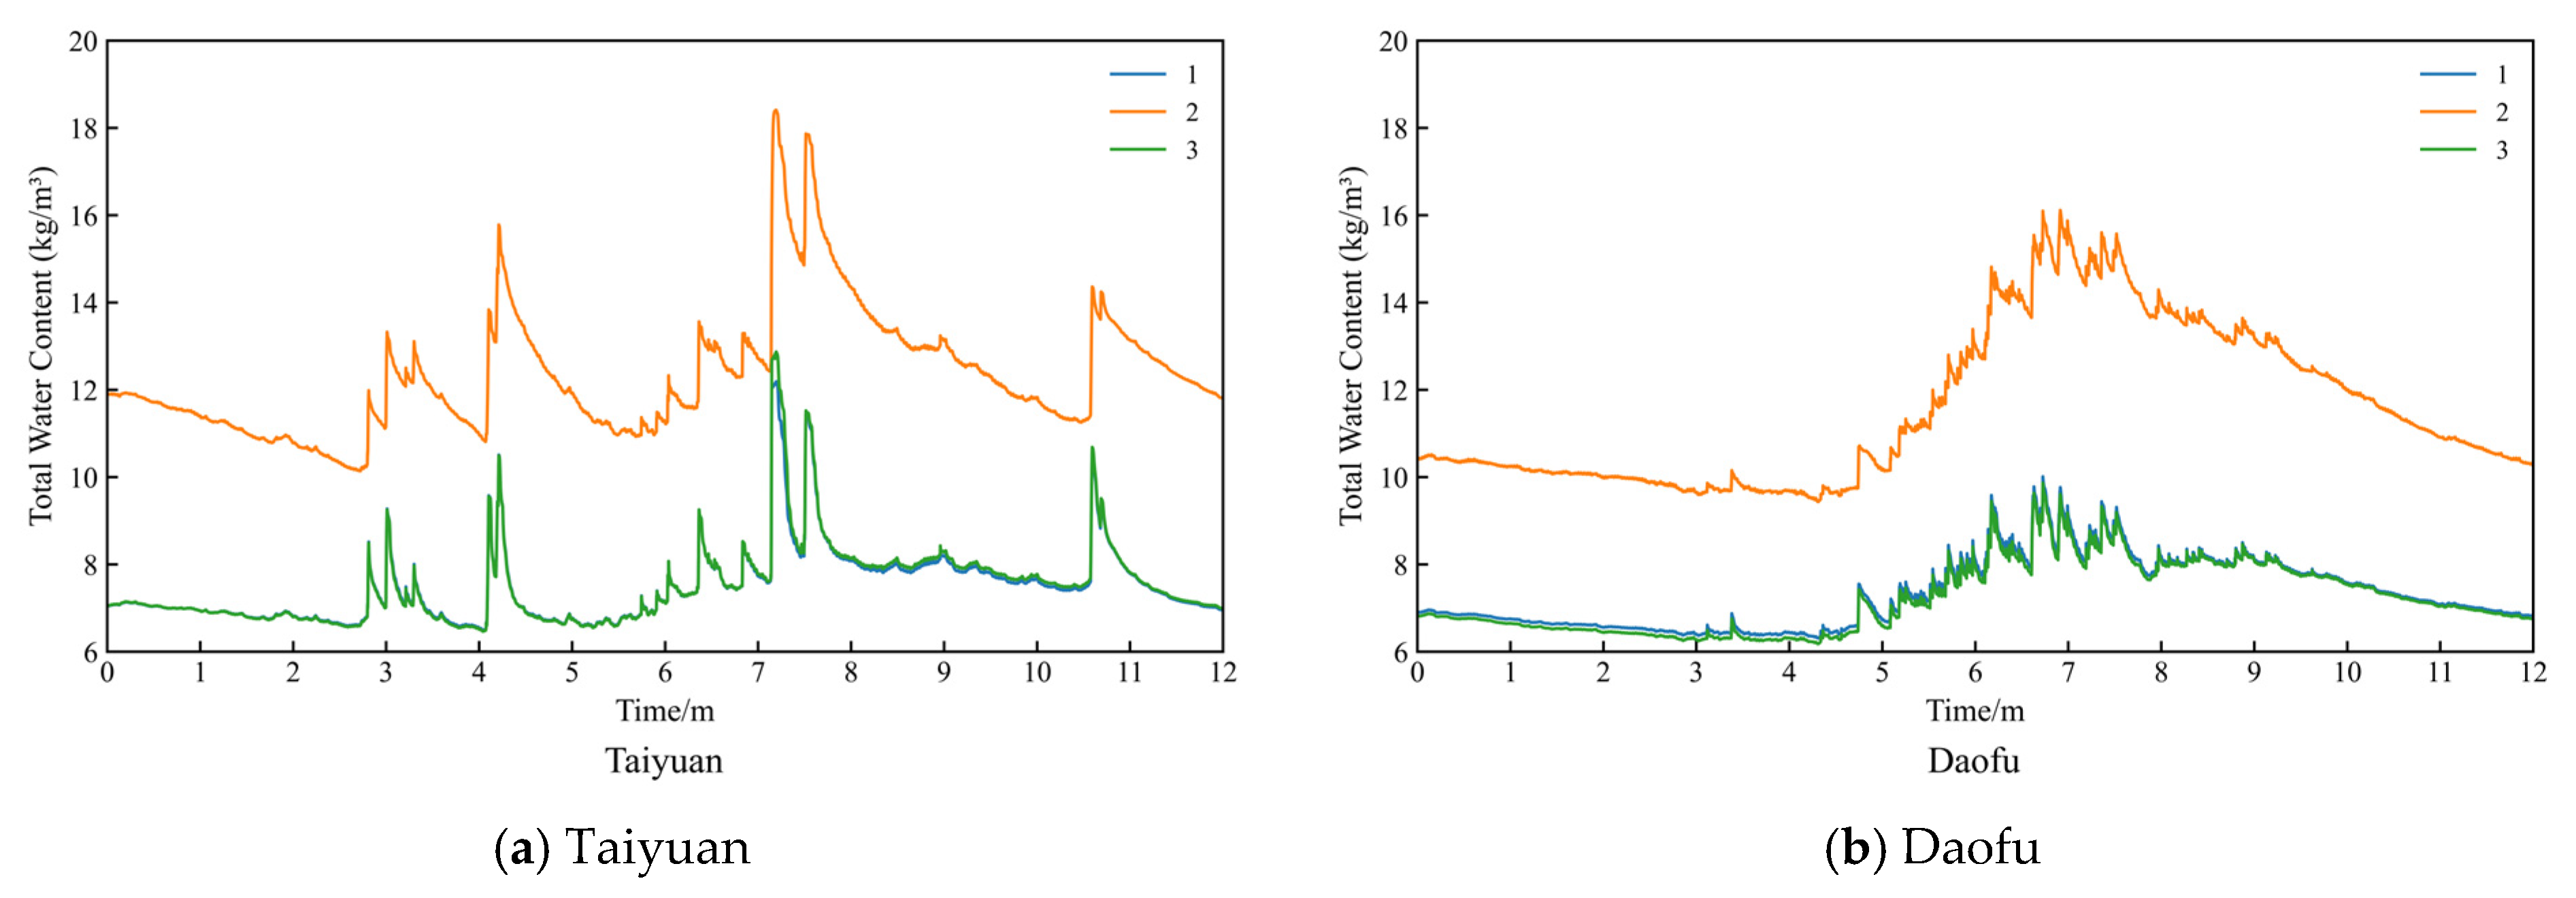
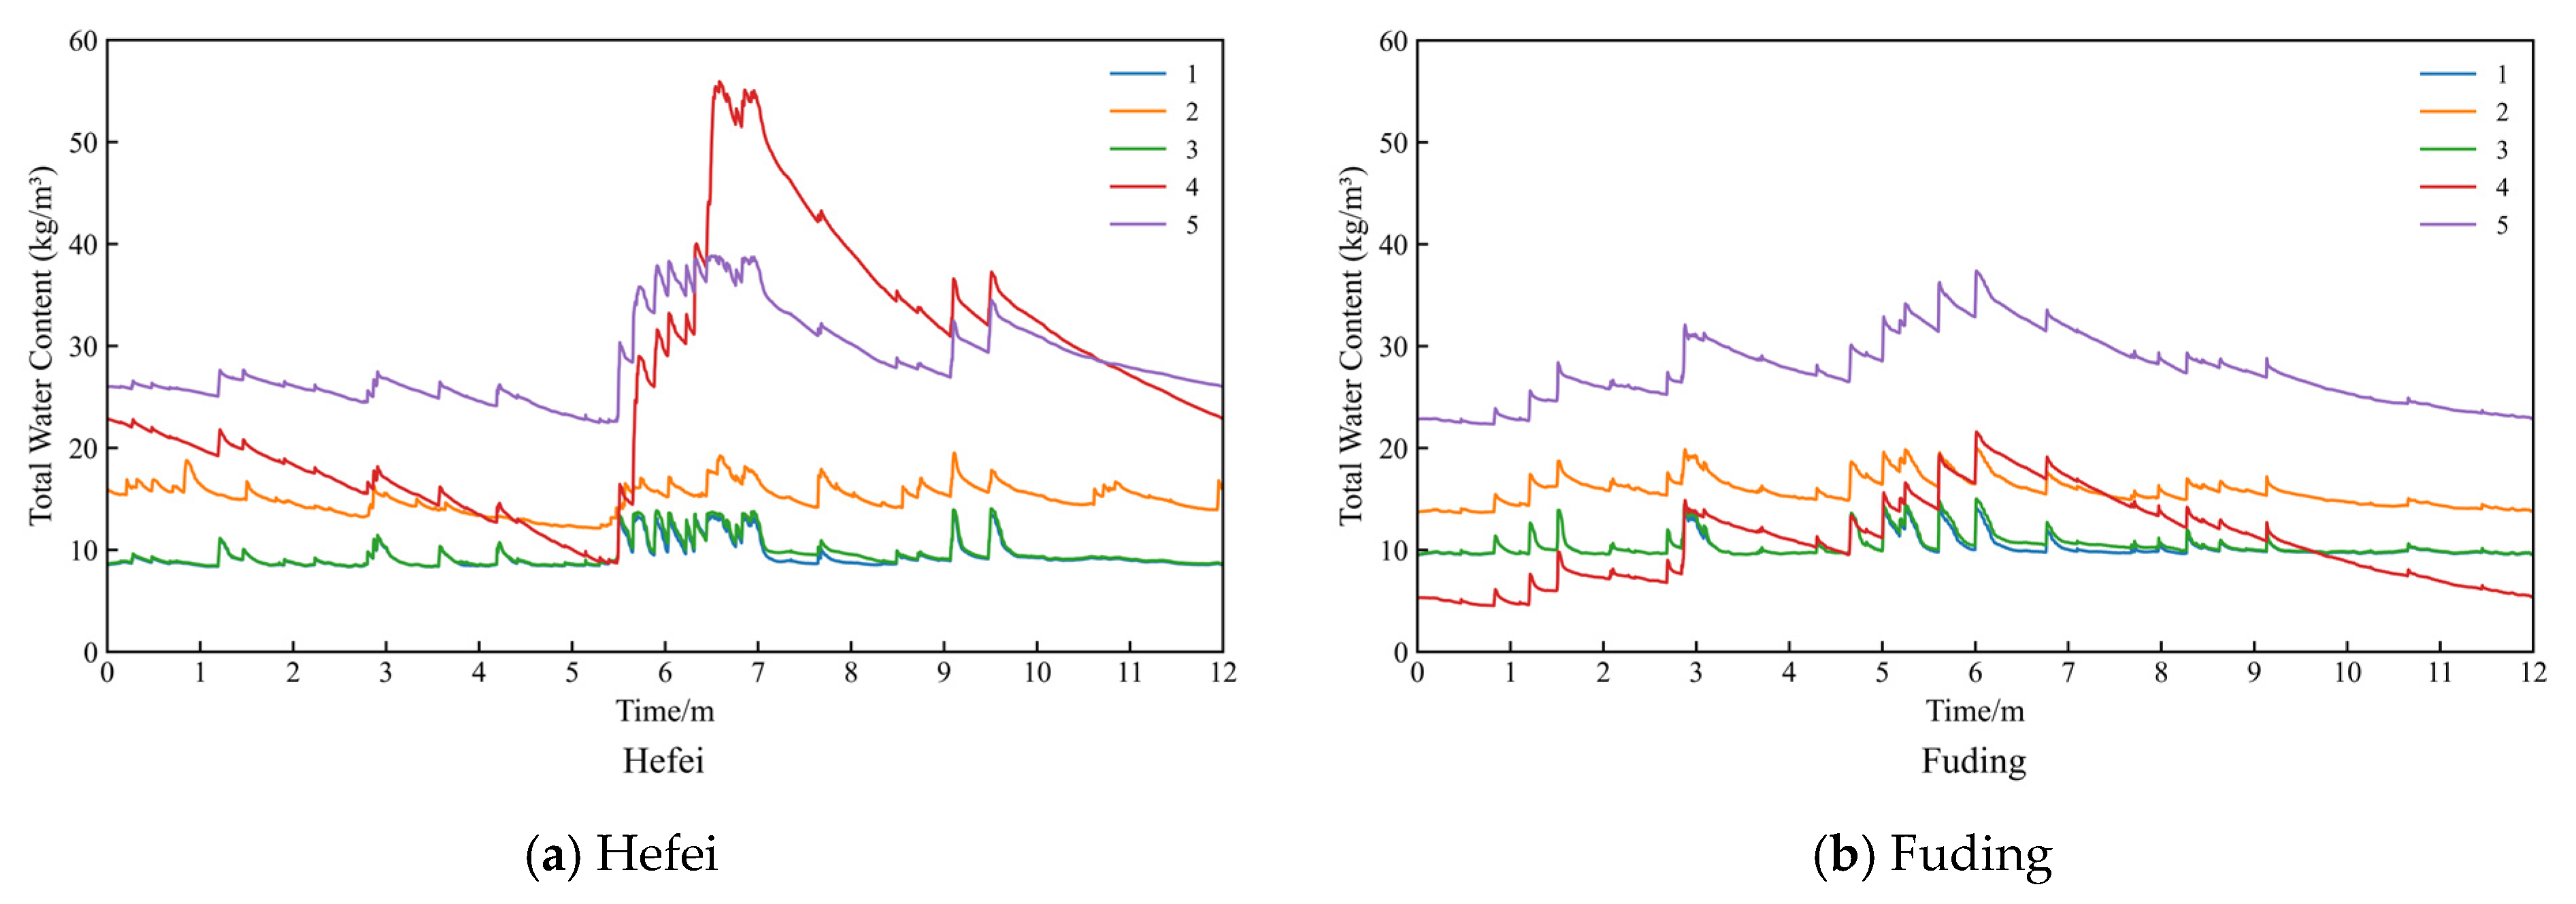
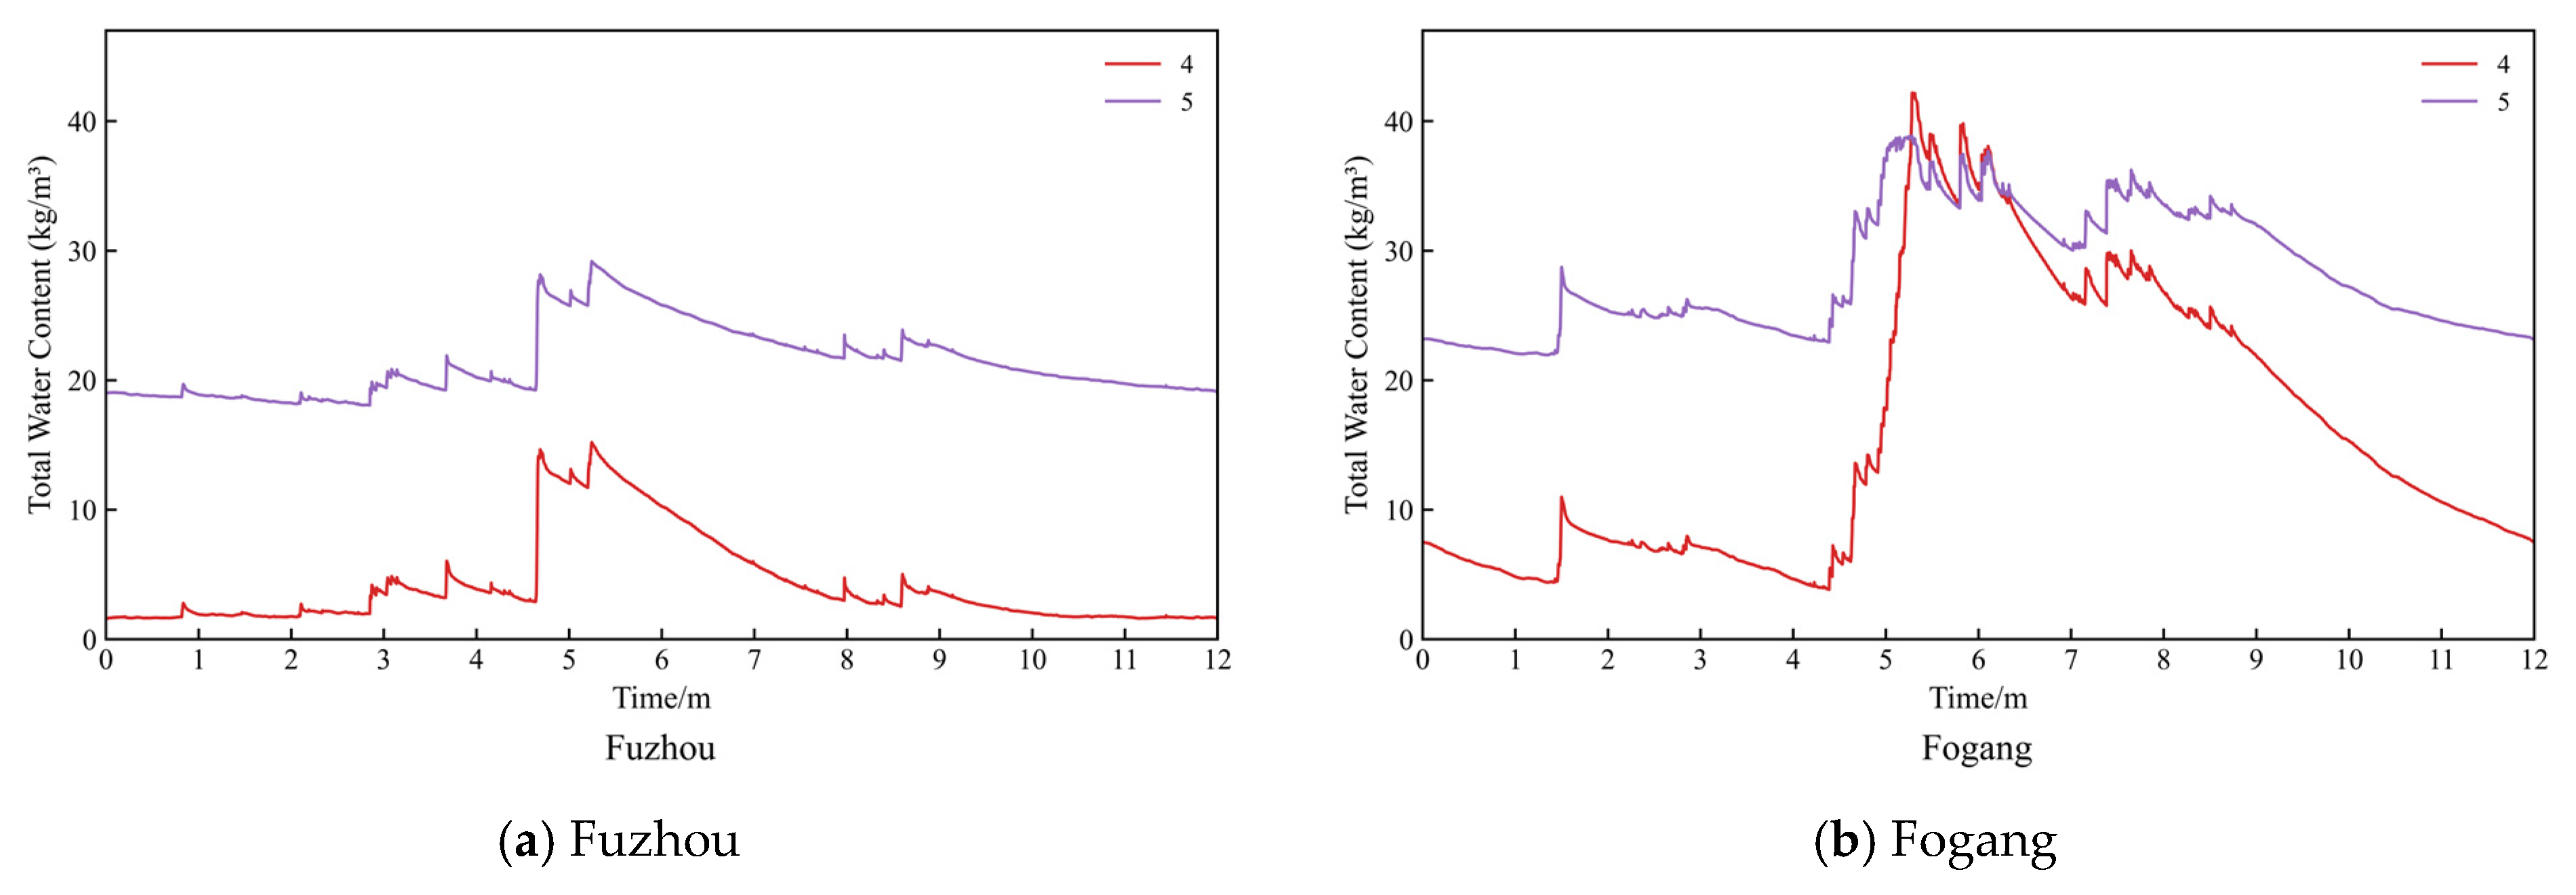
After a calculation period of four years, the moisture content within each layer of all the wall assemblies reached a steady state, exhibiting periodic fluctuations in response to seasonal climatic variations. The amplitude of these fluctuations varied across all wall assembly types due to differences in material properties. To clearly demonstrate the moisture content variation patterns of all wall assembly types across every location within each Thermal Zone during the final year, we selected two representative patterns for each zone, i.e., (a) universal pattern, depicting one representative location that demonstrates the universal moisture content variation trend typical of the thermal zone. (b) unique pattern, showing the location exhibiting distinct moisture content variation patterns or deviating from the universal trend.
In the Severe Cold and Cold Zones, three wall assemblies were simulated for each location, i.e., Type 1, Type 2, and Type 3. In all locations, Types 1 and 3 exhibited similar overall moisture content trends, with consistent seasonal fluctuations and relatively small variation ranges. In contrast, Type 2 consistently showed the highest overall moisture content in both climate zones.
Type 1 adopts an external insulation system using EPS board as the insulation layer; Type 2 adopts a sandwich insulation system with XPS board; and Type 3 is also an external insulation system, but with rock wool board. Regarding the thermal properties, the porosity (m3/m3) of the three insulation materials is similar, with values of 0.95, 0.95, and 0.967, respectively. The initial thermal conductivity [W/(m·K)] measures 0.040, 0.035, and 0.041, with Type 2 slightly lower. In comparison, the most significant difference lies in the water vapor diffusion resistance factor, which is 30, 100, and 1.3 for the three types, respectively, with Type 2 being markedly higher than the other two. This characteristic may account for the consistently higher overall moisture content observed in Type 2 compared to Types 1 and 3. Additionally, the peak moisture content in the Cold Zone was higher than that in the Severe Cold Zone, despite their initial moisture contents being within a similar range between 11 and 14 kg/m3. This difference may be attributed to the higher average DR in the Cold Zone locations, which reached 186.66 mm/a, compared with 67.73 mm/a in the Severe Cold Zone locations.
Notably, among all locations, all types performed the smallest seasonal fluctuations in total moisture content in Yushu (
Figure 4 and
Figure 5). This phenomenon suggests a relationship with the relative stability of humidity at this location. Across the 11 locations in the Severe Cold and Cold Zones, the overall standard deviation of relative humidity averaged 20.66%, with Yushu ranking second lowest at 16.18. Although Qingdao showed the lowest overall standard deviation of relative humidity at 15.99, its total moisture content still exhibited considerable fluctuations. The smaller variation in Yushu is likely attributable to its relatively low annual DR of 58.57 mm/a, compared with 86.62 mm/a in Qingdao.
For the Hot Summer and Cold Winter Zone, five wall assemblies were simulated in each location, i.e., Type 1, Type 2, Type 3, Type 4, and Type 5. Unlike in the Severe Cold and Cold Zone, Type 2 did not exhibit significantly higher moisture content compared to Type 1 and Type 3. These three types consistently maintained lower overall moisture levels compared to Type 4 and Type 5, with smaller seasonal fluctuations, while Type 4 and Type 5 showed larger amplitudes of variation.
Type 4 employs an autoclaved aerated concrete (AAC) self-insulation system without an additional insulation layer, and the AAC material has a density of 600 kg/m3. In contrast, Type 5 adopts an internal insulation system composed of gypsum board combined with EPS board. The insulation layer is positioned on the interior side, while the exterior side consists of concrete with a density of 2200 kg/m3. Notably, the results indicate that non-external insulation systems or wall assemblies featuring a high-density concrete layer on the exterior side are more susceptible to the influence of WDR. This phenomenon can be attributed to the concrete wall layer’s vapor diffusion resistance factor of 92, which prolongs moisture diffusion time and consequently leads to greater moisture accumulation.
However, in Fuding, the total moisture content of Type 4 was comparable to that of Types 1,2, and 3 and even recorded the lowest values during certain periods (
Figure 6). This could stem from the fact that in Fuding, the overall standard deviation of relative humidity averaged 12.96, the lowest among the Hot Summer and Cold Winter Zone, while the DR was also the lowest at 142.90 mm/a. Thus, Type 4 is better suited to climatic conditions characterized by smaller relative humidity fluctuations and lower DR.
In the Hot Summer and Warm Winter Zone, two wall assembly types were simulated, i.e., Type 4 and Type 5. Generally, Type 5 consistently exhibited higher overall moisture content than Type 4 throughout the year. From the perspective of material layers, this difference is attributable to the vapor diffusion resistance factor of the autoclaved aerated concrete blocks in Type 4 being 8.3, which allows faster diffusion, whereas the concrete wall layer in Type 5 has a vapor diffusion resistance factor of 92, leading to longer diffusion times and greater moisture accumulation. However, in Fogang, Guangzhou, and Shantou, Type 4 may exhibit notably higher total moisture content than Type 5 during the summer period (
Figure 7). This can be attributed to the relatively high mean relative humidity during June to September in these locations, with values of 84.43, 81.76, and 81.67, accompanied by smaller fluctuations, with standard deviations of 11.36, 12.12, and 8.93. By contrast, Fuzhou and Yuanmou showed lower mean relative humidity values of 77.73 and 63.92, but with larger fluctuations, with standard deviations of 14.81 and 17.85. A more pronounced difference was observed in the WDR load over the same period: Fogang, Guangzhou, and Shantou recorded 139.05, 174.93, and 121.96 mm/a, which were significantly higher than the values of 33.43 and 44.70 mm/a in Fuzhou and Yuanmou. These results indicate that Type 4 is more sensitive to WDR load. Consequently, under conditions of high WDR and high relative humidity, it tends to accumulate more moisture, resulting in higher overall moisture content compared with Type 5.
Further, even when the initial relative humidity of all wall assembly types is set at 80%, differences in insulation thickness for the same wall assembly type across thermal zones result in differences in initial moisture content. Therefore, when comparing the performance of the same wall assembly type in different thermal zones, more focus should be on the fluctuation pattern of moisture content changing rather than the absolute values of moisture content, as the fluctuation patterns reflect the adaptability of a given wall assembly type within a specific thermal zone.
3.2. Dryness Potential Assessment
The results of wall assembly dryness rates across climate zones reveal distinct drying performance patterns. Severe Cold, Cold, Hot Summer and Cold Winter, and Hot Summer and Warm Winter Zones exhibit significant differences in both the proportion of drying cases and the magnitude of dryness rates, as shown in
Table 4.
In the Severe Cold Zone, all 18 cases demonstrated drying behavior, with final moisture contents consistently lower than initial values. Dryness rates ranged widely from 25.59% to 55.47%, with Type 1 (47.73%), Type 2 (30.46%), and Type 3 (48.27%) showing notable variation in average performance.
The Cold Zone presented a slightly lower drying incidence, with 14 out of 15 cases exhibiting drying behavior—the sole exception being Type 2 in Xuzhou. Dryness rates here were more modest (1.04% to 38.91%), and average values followed a descending order of Type 1 (29.53%), Type 3 (25.47%), and Type 2 (14.23%).
A notable contrast emerged in the Hot Summer and Cold Winter Zone, where only 11 out of 25 cases showed drying behavior. Dryness rates remained low (1.28% to 22.10%), with Type 1 (18.70%) and Type 3 (13.56%) outperforming Types 2, 4, and 5, which exhibited negligible or no drying (≤2.28%).
The Hot Summer and Warm Winter Zone showed the poorest drying performance, with merely three out of ten cases demonstrating drying behavior. Dryness rates ranged from 10.52% to 47.18%, though average values remained low at 13.56% for Type 4 and 2.10% for Type 5.
The percentage of cases exhibiting drying behavior decreased progressively from northern to southern climate zones at 100% in the Severe Cold Zone, 93.33% in the Cold Zone, 44% in the Hot Summer and Cold Winter Zone, and 30% in the Hot Summer and Warm Winter Zone. This climatic gradient reflects the influence of regional climate conditions on moisture dissipation within wall assemblies.
Results revealed pronounced differences in hygrothermal performance between wall assembly types across China’s four thermal zones under long-term WDR exposure. A clear north-to-south decreasing trend in drying capacity emerged, reflecting the combined effects of ambient temperature, relative humidity, and precipitation intensity.
In the Severe Cold and Cold Zones, Type 2 consistently showed higher moisture accumulation tendency with significantly lower dryness rates compared to Types 1 and 3. This pattern arises from the water vapor diffusion resistance factors, which were 30 for Type 1, 100 for Type 2, and 1.3 for Type 3, respectively. Type 2’s substantially higher resistance inhibits moisture release from its insulation layer under low-temperature conditions, thereby reducing drying efficiency.
In the Hot Summer and Cold Winter Zone, characterized by hot-humid summers, relatively cold winters, and large annual temperature fluctuations, Types 2, 4, and 5 generally exhibited low dryness rates, suggesting that external insulation systems, such as Types 1 and 3, are more suitable for this climate.
In the Hot Summer and Warm Winter Zone, although Type 4 performed marginally better than Type 5, approximately 70% of cases showed no drying behavior, indicating a need for additional moisture protection measures.
However, dryness rate alone provides only partial insight into suitability as an indicator. Among all cases, 69.1% exhibited satisfactory dryness rate, yet 19.1% still experienced persistent moisture accumulation with varying degrees of mold growth risk. Cases with relatively high dryness rates may still suffer thermal performance degradation or mold susceptibility. Conversely, when material properties and structural configurations are appropriately optimized, even cases with lower dryness rates can maintain acceptable indoor conditions. A comprehensive assessment should therefore include mold growth risk evaluation alongside dryness rate measurements.
3.3. Mold Growth Risk Assessment
In this study, mold growth risk was classified into four levels for 68 building cases: low risk, moderate risk, elevated risk, and high risk. A total of 49 cases (72.06% of the samples) fell within the low-risk category, indicating that the five representative wall assemblies generally demonstrate favorable hygrothermal adaptability across most thermal zones in China. The remaining 19 cases (27.94%) exhibited varying degrees of mold risk. Among these, nine cases failed to achieve drying, showing consistency between mold risk predictions and the calculated dryness rate. The other 10 cases, despite achieving some degree of drying (maximum dryness rate ≤ 22.10%), still showed signs of mold risk, suggesting that microclimatic conditions conducive to mold growth can persist even under drying conditions.
Notably, in the Hot Summer and Cold Winter Zone and the Hot Summer and Warm Winter Zone, among the 10 cases adopting Type 4, 2 were classified as moderate risk, 3 as elevated risk, and 3 as high risk. This outcome highlights the unsuitability of this wall assembly type under humid and high-temperature climatic conditions, which is consistent with the results of the moisture content assessment and the dryness potential assessment. The only two cases identified as low risk were located in Fuzhou and Yuanmou, where the DR were 98.42 mm/a and 61.13 mm/a, respectively. By contrast, the remaining eight locations exhibited a much higher average DR of 197.50 mm/a, thereby resulting in considerably greater mold growth risks.
Based on both dryness rate and mold growth risk, the suitability of the tested wall assembly types varies significantly across the four thermal zones.
In the Severe Cold Zone, Types 1, 2, and 3 exhibit optimal climatic suitability as all cases achieved drying, with only one case presenting a moderate risk of mold growth. While these types in the Cold Zone rank second in suitability, 13 of 15 cases achieved drying, with two cases presenting a moderate risk of mold growth.
In the Hot Summer and Warm Winter Zone, the commonly used Types 4 and 5 showed poor suitability, with only 30% of cases achieving drying and 30% facing moderate or elevated mold growth risk.
In the Hot Summer and Cold Winter Zone, Type 1, Type 2, Type 3, Type 4, and Type 5 showed relatively worse suitability, with 44% of cases drying, but over half faced elevated or even high mold growth risk.
This indicates that determining wall assembly types in different zones based solely on U-value has limitations, and the impact of WDR must be considered simultaneously. For the former three zones, types using external insulation types like EPS and rock wool, or sandwich insulation types, demonstrated favorable performance and are recommended. Interestingly, Type 4, using autoclaved aerated concrete block, which is frequently regarded as suitable for humid climates, did not exceed the drying performance of external insulation types, and even fell slightly behind. This outcome contrasts with earlier expert-based assessments in a previous study [
64], which reported that in Nanchang, a location in the Hot Summer and Cold Winter Zone, aerated concrete walls achieved the best overall performance among four wall assembly types. This discrepancy may stem from the fact that the earlier study employed the Analytic Hierarchy Process (AHP) to recommend aerated concrete as a suitable solution for humid climates, an approach inherently influenced by subjective judgment and weighting.
3.4. Correlation Between Wdr Load and Moisture Content
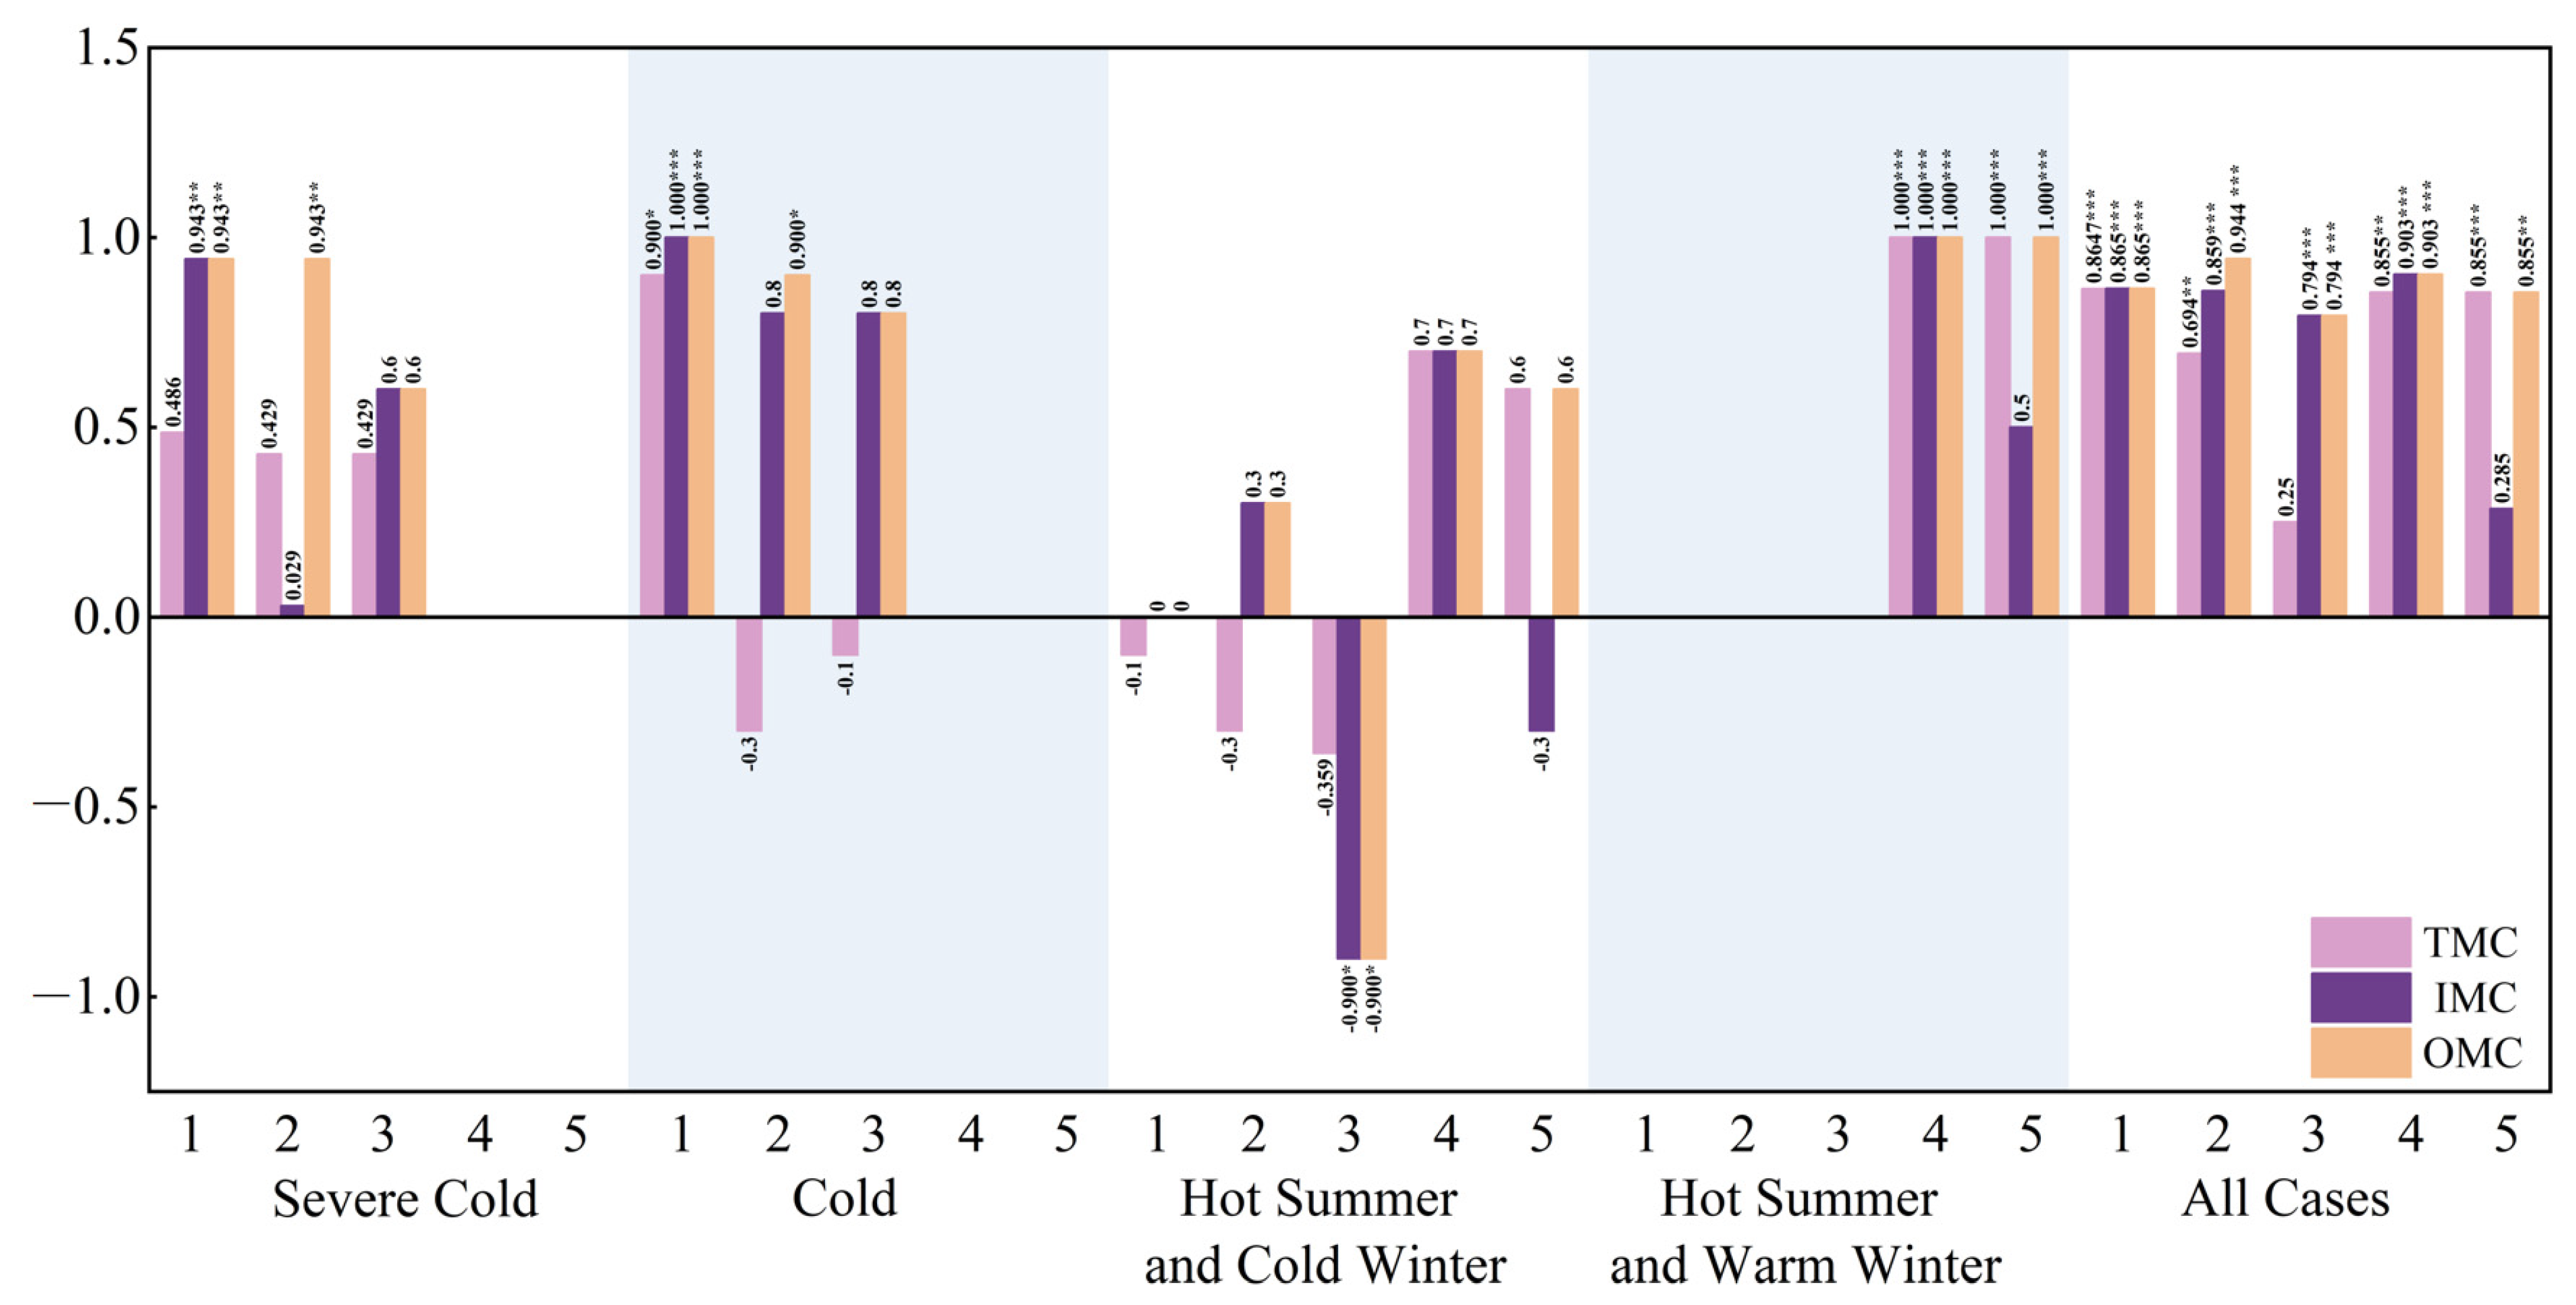
To further explore the relationship between WDR load and wall moisture performance, a correlation analysis was performed to quantify the strength and direction of their associations. The Spearman correlation coefficient (
C) ranges from −1 to 1, where values closer to ±1 indicate stronger monotonic relationships, while values near 0 suggest weaker associations. Statistical significance was assessed at significance levels of α = 0.05 and 0.01. Correlations with
p-values less than 0.05 were considered statistically significant. The results are illustrated in
Figure 8.
3.4.1. Correlation by Wall Assembly Type
The relationship between WDR load and moisture content varied significantly across wall assembly types, with distinct climatic zone-dependent patterns observed for each type:
(1) Type 1
Type 1 exhibited strong climate-dependent correlation variability. In the Severe Cold Zone, WDR showed a weak, non-significant correlation with total moisture content (TMC, C = 0.468, p = 0.329) but a strong, significant association with insulation layer moisture content (IMC, C = 0.934, p = 0.005). This contrast suggests differential moisture response mechanisms between total and inner-layer metrics. In the Cold Zone, both TMC (C = 0.900, p = 0.002) and IMC (C = 1.000, p < 0.001) displayed robust positive correlations, indicating WDR is the primary driver of moisture accumulation in this region. Conversely, negligible correlations were observed in the Hot Summer and Cold Winter Zone (TMC: C = −0.100, p = 0.624; IMC: C = 0.000, p = 0.957), implying minimal WDR influence under hot-humid summer conditions.
(2) Type 2
Type 2 was characterized by layer-specific WDR sensitivity, with the outermost layer consistently showing the strongest associations. In the Severe Cold Zone, only outermost layer moisture content (OMC) exhibited a significant correlation (C = 0.943, p < 0.001), while TMC (C = 0.429, p = 0.397) and IMC (C = 0.029, p = 0.957) correlations remained weak and non-significant. A similar pattern emerged in the Cold Zone, where OMC again demonstrated significance (C = 0.900, p = 0.037), whereas TMC (C = −0.300, p = 0.624) and IMC (C = 0.800, p = 0.104) showed no statistical significance. In the Hot Summer and Cold Winter Zone, all three metrics (TMC, IMC, OMC) displayed uniformly weak correlations (C = 0.300, p = 0.624), confirming minimal WDR impact on moisture dynamics for this assembly type in humid climates.
(3) Type 3
Type 3 showed the weakest overall sensitivity to WDR across climatic zones. In the Severe Cold Zone, both TMC (C = 0.429, p = 0.397) and IMC (C = 0.600, p = 0.208) correlations were weak and non-significant. The Cold Zone similarly exhibited negligible OMC correlation (C = −0.100, p = 0.873) and a moderate but non-significant IMC association (C = 0.800, p = 0.104). Notably, the Hot Summer and Cold Winter Zone displayed a strong negative correlation for IMC (C = −0.900, p = 0.037), though this was offset by weak overall TMC correlation (C = −0.359, p = 0.553), suggesting complex moisture-WDR interactions unique to this climate-assembly combination.
(4) Type 4
Type 4 demonstrated climate-specific WDR responsiveness, with negligible influence in temperate zones and dominant control in hot-humid regions. In the Hot Summer and Cold Winter Zone, TMC and IMC showed moderate non-significant correlations (C = 0.700, p = 0.188), indicating limited WDR impact. In contrast, the Hot Summer and Warm Winter Zone exhibited perfect positive correlations (C = 1.000, p < 0.001) for both metrics, implying WDR entirely determines moisture levels in this assembly type under persistent high humidity.
(5) Type 5
Type 5 mirrored Type 4’s climatic sensitivity but with weaker layer-specific associations. In the Hot Summer and Cold Winter Zone, TMC (C = 0.600, p = 0.285) and IMC (C = −0.300, p = 0.624) correlations were weak and non-significant. The Hot Summer and Warm Winter Zone showed a dichotomous pattern: TMC displayed a perfect positive correlation (C = 1.000, p < 0.001), while IMC showed only a moderate non-significant association (C = 0.500, p = 0.391), suggesting differential moisture accumulation mechanisms between total and inner layers.
Collectively, these results confirm a significant positive correlation between WDR load and moisture content across all cases (
p < 0.05), aligning with previous studies that identify WDR as a primary driver of exterior wall moisture damage [
14,
35,
65]. However, the magnitude and significance of this relationship were strongly modulated by wall assembly type and climatic zone, highlighting the need for context-specific durability assessments.
3.4.2. Key Influencing Factors
Wall assembly type significantly modulated WDR sensitivity. Type 3 exhibited minimal responsiveness with a minimum p-value of 0.037 and no evident WDR-moisture correlation. In contrast, Type 1 and Type 4 demonstrated strong statistically significant positive associations with p-values less than 0.001, indicating direct WDR-driven moisture accumulation. Climatic zone further mediated these relationships. The Hot Summer and Cold Winter Zone displayed inconsistent correlations, including positive, negative, and non-significant patterns, reflecting complex interactions between seasonal humidity and temperature fluctuations. Meanwhile, the Cold Zone and Hot Summer and Warm Winter Zone showed uniformly robust positive correlations with p-values less than 0.001, highlighting WDR’s dominant role in extreme climates. Notably, the outermost layer consistently exhibited the strongest positive correlation with WDR load, with a p-value less than 0.001, confirming surface exposure as a primary moisture ingress pathway and validating the selection of outermost layer annual average moisture content as a representative metric for subsequent DR and U-value analyses.
Overall, the results revealed divergent moisture responses to prolonged WDR exposure among wall assemblies with identical U-values, underscoring the limitations of U-value as a standalone durability indicator. In northern regions, including Severe Cold and Hot Summer and Warm Winter Zones, Type 1 and Type 3 exhibited satisfactory drying capacity but remained susceptible to WDR-induced moisture damage. Conversely, Type 4 and Type 5 in hot-humid zones demonstrated high moisture retention and WDR sensitivity. These findings emphasize that envelope design must integrate region-specific moisture-WDR correlation patterns alongside thermal performance criteria to mitigate durability risks.
3.5. Sensitivity of DR and U-Value on the Outermost Layer Moisture Content
The sensitivity analysis results showed significant differences in the sensitivities of DR and mean U-value across different wall assembly types, as shown in
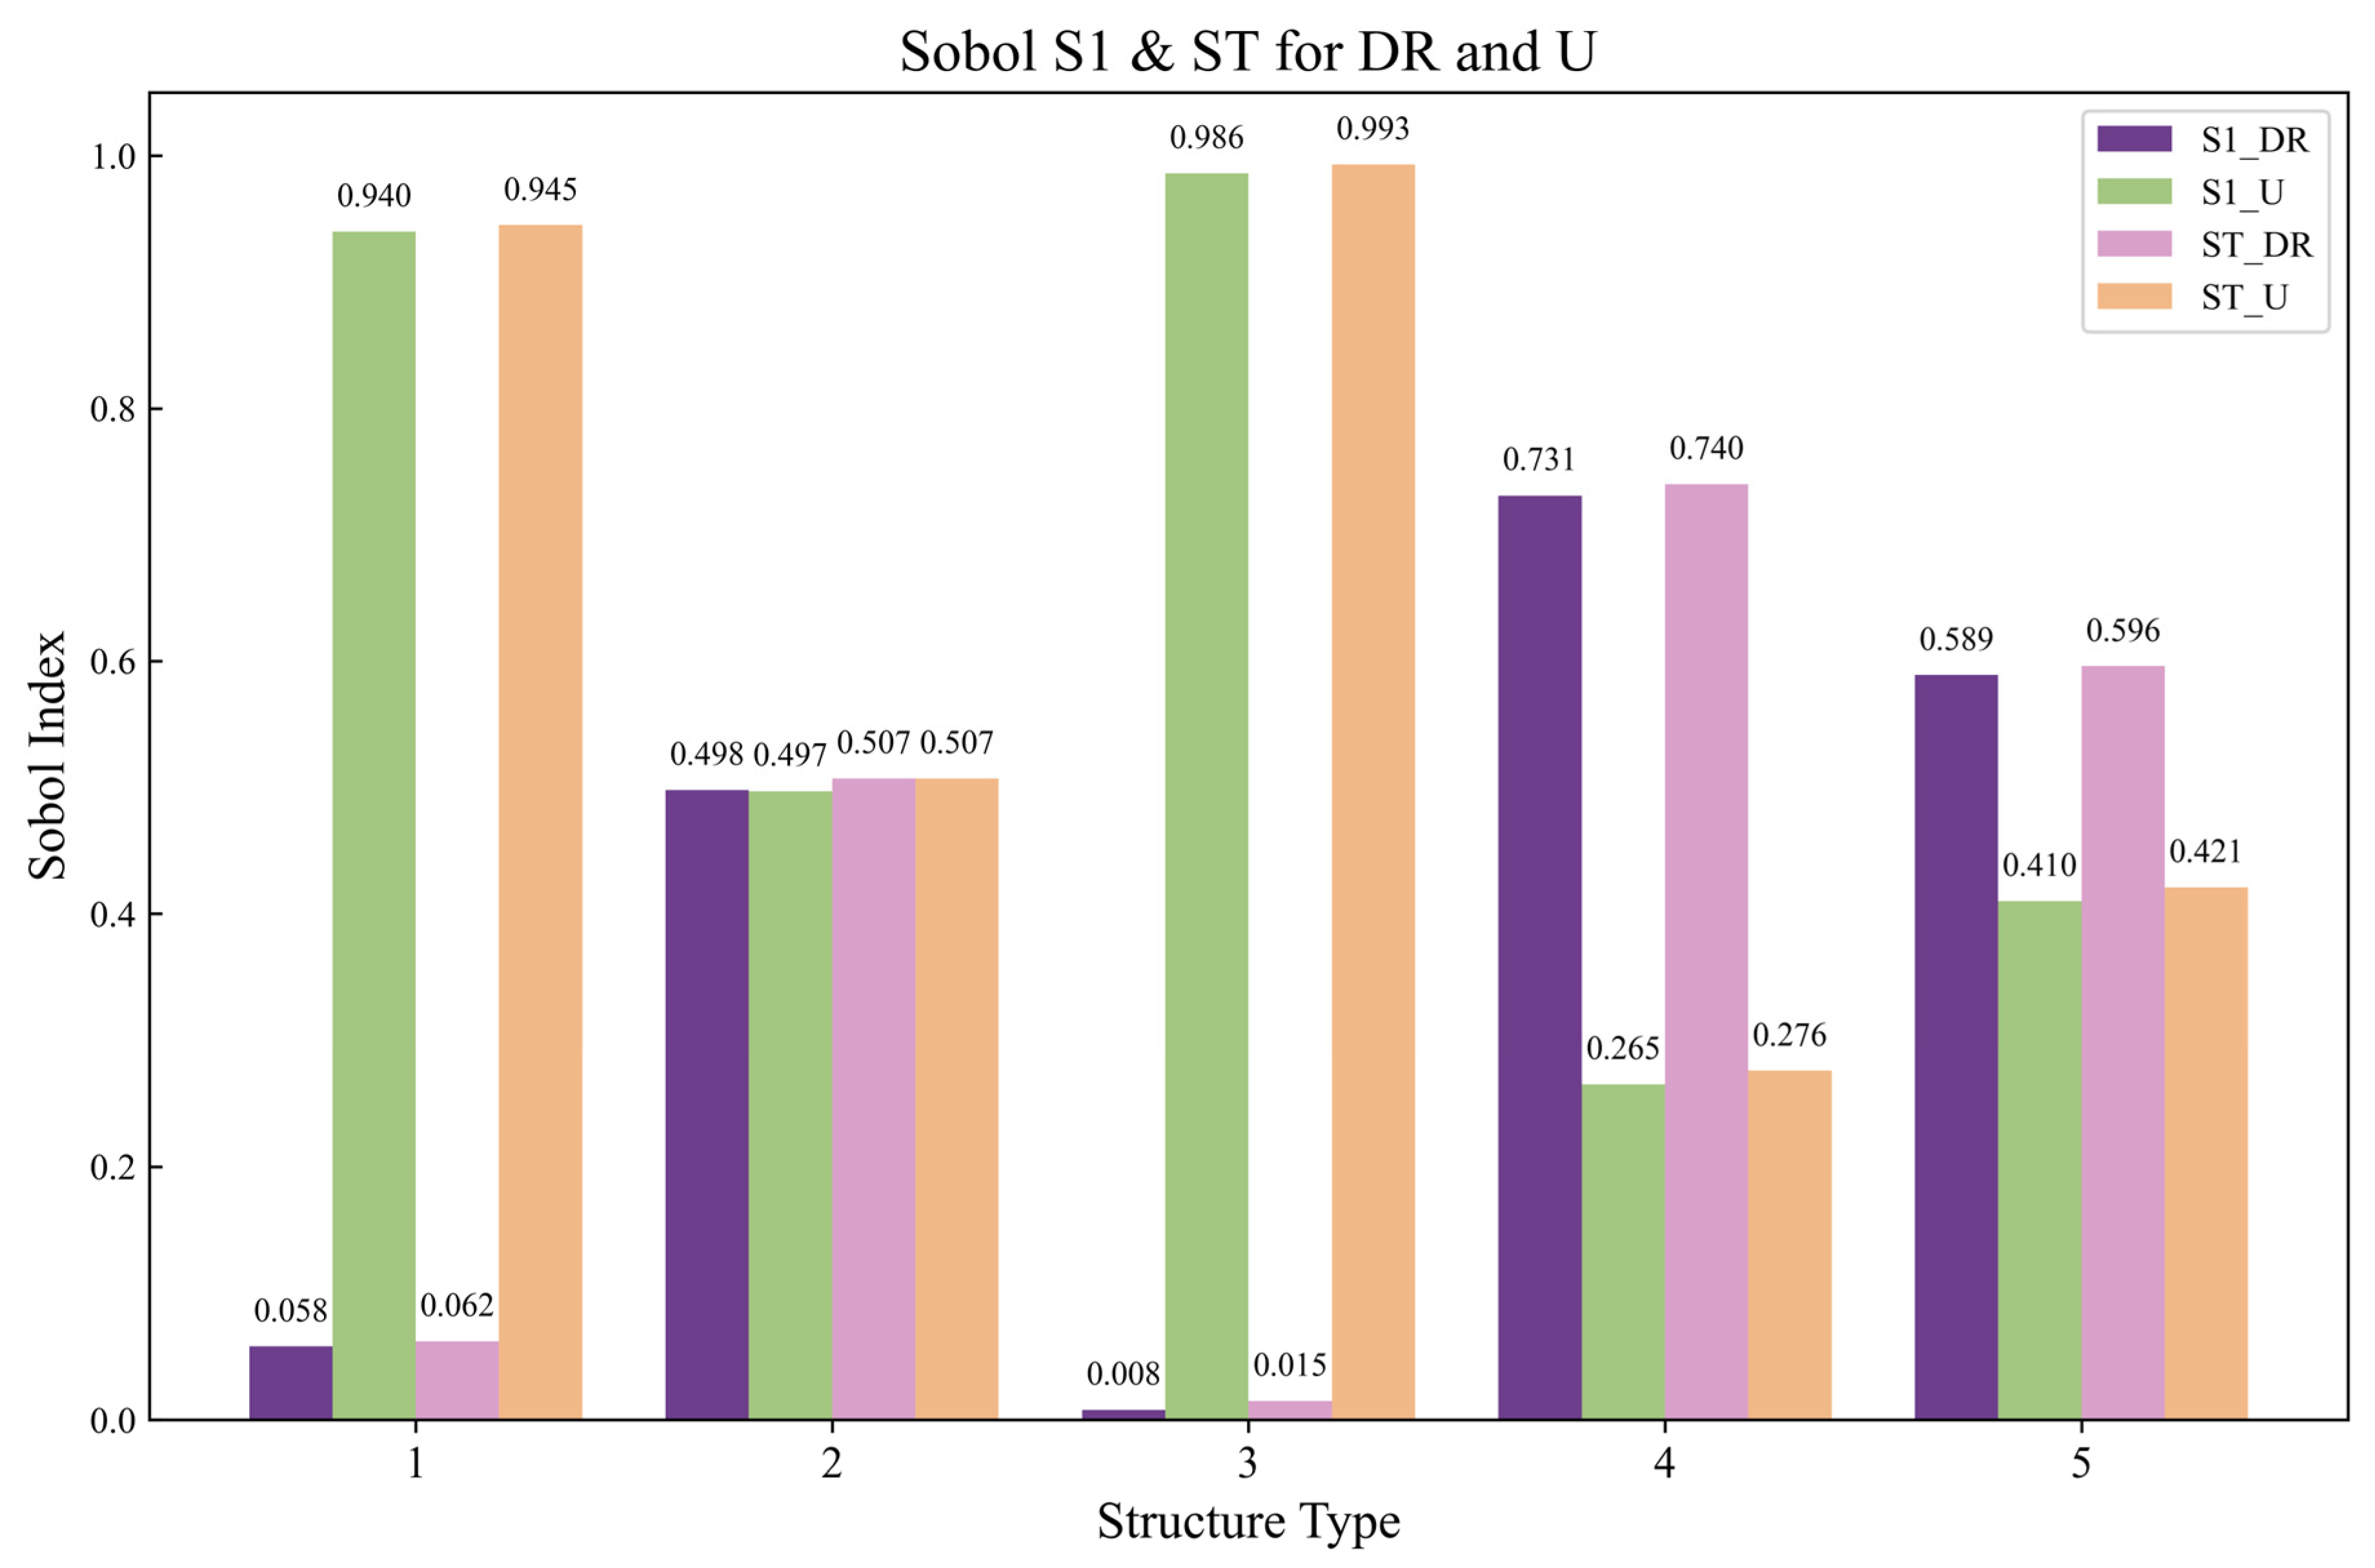
Figure 9. For external insulation types like Type 1 and Type 3, the sensitivity of the mean U-value was significantly higher than that of DR, with the first-order Sobol index of mean U-value (S1_U) and first-order Sobol index of DR (S1_DR) equal to 0.940 and 0.058 for Type 1, and 0.986 and 0.008 for Type 3, respectively. The total Sobol index of mean U-value (ST_U) and total Sobol index of DR (ST_DR) are equal to 0.945 and 0.062 for Type 1, and 0.993 and 0.015 for Type 3, respectively. The small differences between ST and S1 indices (ranging from 0.004 to 0.011 across all wall types) indicate negligible interaction effects between DR and U-value, suggesting their influences on moisture content are primarily independent and additive. This may be related to the outermost layer of the external insulation system being a hydrophobic thermal insulation material, whose barrier effect against rainwater penetration results in low sensitivity to wind-driven rain.
In contrast, the remaining three non-external insulation types, namely Type 2, Type 4, and Type 5, exhibited noticeably higher or at least comparable sensitivity to the DR compared to the mean U-value. Specifically, Type 2 showed almost equal contributions from DR and U-value, with S1_DR of 0.498 and ST_DR of 0.507, while S1_U and ST_U were 0.497 and 0.507, respectively. Type 4 was predominantly affected by DR, as indicated by S1_DR and ST_DR of 0.731 and 0.740, compared to S1_U and ST_U of 0.265 and 0.276. Type 5 presented an intermediate pattern, where DR still exerted a stronger effect, with S1_DR of 0.589 and ST_DR of 0.596, while S1_U and ST_U were 0.410 and 0.421. These results consistently reinforce that for non-external insulation types, WDR plays a more dominant role in influencing moisture content than thermal resistance.
Results from the sensitivity analysis indicated that for non-external insulation types, the impact of WDR on the moisture content of the outermost wall layer is comparable to, or even greater than, that of the U-value. Combined with the findings from the moisture content assessment and dryness rate assessment, it was observed that in the Hot Summer and Warm Winter Zone, internal and self-insulated wall assemblies not only exhibited higher moisture accumulation but also extremely low dryness rates, highlighting their limited hygrothermal resilience under such climatic conditions. The sensitivity analysis results are also consistent with the conclusions of the Spearman correlation analysis, which confirmed that in approximately 80% of climate–type combinations, WDR and wall moisture content were significantly positively correlated, particularly in hot and humid climates. Therefore, when non-external insulation types are selected in the early building design stage, equal consideration should be given to both WDR and U-value to reduce the risk of moisture damage.
Given these findings, WDR should be regarded as a critical factor alongside U-value during the design of building envelopes. If moisture-related risks are not adequately addressed at the design stage, they may lead to premature material deterioration, compromised insulation function, and increased energy consumption over time. Therefore, it is advisable to adopt climate-responsive strategies, such as the use of capillary-inactive materials, integration of ventilated rain screens, and improved detailing based on local weather conditions, to improve envelope durability and hygrothermal resilience.
The findings of this study provide a dataset to support climate-responsive design of building envelopes, thereby facilitating improvements in energy efficiency, operational cost reduction, and overall economic performance. In addition, the results showed an integration of machine learning and building physics simulations to predict drying performance and hygrothermal dynamics of wall assemblies under varying climatic conditions. Such integration will enhance the durability and adaptability of envelope types under the combined impacts of wind-driven rain and climate change, contributing to the development of technical pathways for achieving carbon peaking and carbon neutrality targets in the building sector.
4. Conclusions
The innovation of this study lies in the fact that current wall assembly designs in China primarily follow the Code for Thermal Design of Civil Building (GB 50176-2016) [
36], which mainly considers temperature and heat transfer while insufficiently accounting for the impact of WDR. To bridge this gap, this study conducted comprehensive hygrothermal simulations of five typical wall insulation types across 21 representative cities in China’s four major thermal zones, systematically evaluating the hygrothermal effects of WDR on these assemblies, the associated mold growth risk, and further assessing the applicability of different wall assemblies in each thermal zone. The main conclusions are as follows.
Moisture accumulation in Type 1 (thin plastered EPS external insulation system) was found to be high, sensitive to annual WDR exposure, with this effect being particularly pronounced in the Cold Zone.
Type 2 (precast concrete sandwich insulation panel system), characterized by a high vapor diffusion resistance in the insulation layer, exhibited relatively higher overall moisture content in both the Severe Cold and Cold Zones.
Type 4 (autoclaved aerated concrete block self-insulation system) was more suitable for climates with smaller relative humidity fluctuations and lower annual WDR loads. However, it remained highly susceptible to WDR and thus more vulnerable to external moisture loads.
The following design guidelines for thermal zones are proposed to optimize both thermal performance and WDR considerations: In the Severe Cold Zone, Types 1, 2, and 3 exhibit consistent applicability for thermal performance requirements, with no significant dependency on WDR inclusion. For the Cold Zone, while Types 1, 2, and 3 are all viable when thermal performance is the sole criterion, Type 2 emerges as the superior choice when both thermal performance and WDR are simultaneously evaluated, outperforming Types 1 and 3 in integrated performance. In the Hot Summer and Cold Winter Zone, the applicability range expands to include Types 1–5 under thermal performance-only scenarios. However, when thermal performance and WDR are considered in combination, Types 2, 4, and 5 demonstrate enhanced suitability compared to Types 1 and 3, highlighting their balanced performance under dual constraints. For the Hot Summer and Warm Winter Zone, Types 4 and 5 are identified as applicable for thermal performance alone, yet Type 4 is recommended over Type 5 when both thermal performance and WDR are prioritized, reflecting its optimized adaptability to the region’s climatic characteristics.
China exhibits a clear north-to-south declining trend in dryness rate, with values of 100% in the Severe Cold Zone, 91.67% in the Cold Zone, 44% in the Hot Summer and Cold Winter Zone, and 30% in the Hot Summer and Warm Winter Zone. This gradient reflects the influence of regional climate on moisture dissipation within wall assemblies.
In the thermal design of building envelopes, annual WDR load should be considered of comparable importance to U-value, especially for non-external insulation types, as the total Sobol index of DR ranged from 0.507 to 0.740.
This study offers a reproducible framework for evaluating moisture behavior across a variety of wall assemblies and climate conditions. The findings provide actionable support for material selection and design decision-making in both new construction and retrofit applications. Nonetheless, several limitations should be acknowledged. The simulations were based on typical-year meteorological data, which may not fully capture interannual climatic variability. Furthermore, the modeling approach did not account for construction imperfections or material aging, and the results have yet to be validated through in situ measurements. Future research could extend the analysis to include multi-year climate scenarios, a broader range of insulation configurations, and experimental validation. Incorporating climate change projections and retrofit considerations would further improve the practical relevance and engineering value of hygrothermal design recommendations.
Declaration of generative AI and AI-assisted technologies in the writing process.
During the preparation of this work, the author(s) used Deepseek to improve the language and readability of the article. After using this tool/service, the author(s) reviewed and edited the content as needed and took full responsibility for the content of the publication.
