Abstract
This study presents a comprehensive seismic performance assessment and performance-based seismic design (PBSD) optimization for a 21-story Science and Innovation Building with three basement levels, characterized by pronounced plan and vertical irregularities. An engineering-oriented PBSD framework was established, integrating irregularity identification, nonlinear time-history analysis, performance target definition, and energy dissipation evaluation. Comparative analyses between the actual and modified structural models indicate that skip-floor columns have negligible effects on the global stiffness, vibration periods, and interstory drift ratios, suggesting that they should not be classified as independent irregularities. Nonlinear time-history analyses under rare earthquakes confirm that the tower maintains overall stability, with maximum interstory drift ratios of 1/149 and 1/150 in the X and Y directions, respectively. The core tube acts as the primary energy-dissipation component, while the outer frame remains mostly elastic, forming a dual defense system of “core-tube dissipation and frame protection.” Buckling and PBSD verifications demonstrate that skip-floor columns remain elastic under rare earthquakes, satisfying both strength and deformation limits. For the podium, elastic and elastoplastic analyses using multiple software platforms show consistent responses, revealing that more than 80% of the input seismic energy is dissipated through material hysteresis. In addition, a practical construction sequence based on the recommended design is proposed to facilitate implementation and enhance engineering applicability. The proposed PBSD modeling and optimization framework provides a practical and replicable methodology for evaluating and enhancing the seismic performance of irregular high-rise buildings with discontinuous vertical systems.
1. Introduction
In the construction of modern large-scale public buildings, vertical development is often emphasized to accommodate complex functional requirements and distinctive architectural forms. This tendency, however, introduces substantial challenges to seismic design. As buildings grow taller, they become more susceptible to horizontal seismic forces, and irregularities in structural layout can cause torsional effects and stiffness discontinuities, thereby amplifying seismic risk [1].
Traditional Force-Based Seismic Design (FBSD) methods, which remain widely used globally, possess inherent limitations. They rely solely on elastic analysis to determine structural member strength and fail to effectively capture the nonlinear behavior that occurs after yielding during rare earthquakes. Consequently, FBSD methods inadequately account for force redistribution and energy dissipation, leading to either overly conservative design or potential safety deficiencies.
In contrast, Performance-Based Seismic Design (PBSD) offers a more rational and quantitative framework. PBSD establishes multiple performance objectives corresponding to different seismic hazard levels, allowing engineers to evaluate how structures respond under both frequent and rare earthquakes. This approach enables tailored performance targets based on building functionality and economic factors, and it facilitates direct nonlinear analysis methods such as nonlinear time-history analysis, offering a more realistic understanding of structural behavior beyond elastic limits [2].
The conceptual foundation of PBSD was established primarily in the United States. Beginning in the early 1990s, institutions such as the Applied Technology Council (ATC), Federal Emergency Management Agency (FEMA), and Structural Engineers Association of California (SEAOC) initiated pioneering research efforts. SEAOC’s Vision 2000: A Framework for Performance-Based Engineering (1995) formally proposed a structured framework for PBSD [3]. Subsequent publications, including ATC-40 (1996), FEMA-273/274 (1997), and FEMA-356 (2000), further refined performance levels, evaluation criteria, and member classification into force-controlled and deformation-controlled components [4,5]. These guidelines define seismic performance levels primarily in terms of interstory drift ratios, corresponding to Immediate Occupancy (IO), Life Safety (LS), and Collapse Prevention (CP) limit states. The allowable drift ranges for these performance levels vary among the guidelines but generally reflect increasing deformation demands from IO to CP. These drift-based criteria establish the quantitative foundation for the performance objectives adopted in this study.
Later, the American Society of Civil Engineers (ASCE) integrated these developments into ASCE 41-06 (2006), followed by ASCE 41-13 (2013) and the latest ASCE 41-23 (2023), creating a comprehensive guideline system for the seismic evaluation and retrofit of buildings [6,7,8,9]. Similarly, the Pacific Earthquake Engineering Research Center (PEER) published the Tall Building Initiative (TBI) Guidelines in 2010 and updated them in 2017, extending PBSD methodologies to the design of new tall buildings [10,11].
Other countries also developed PBSD standards. After the 1995 Kobe Earthquake, Japan incorporated performance-based concepts into its revised Building Standard Law (2000) and later published the JSCA Performance Design Manual (2017), emphasizing three steps: setting, constructing, and evaluating performance [12,13]. Europe followed suit, introducing displacement-based methods in the CEB Bulletin (1998) and including PBSD in Eurocode 8 (2003) [14,15].
In China, the application of PBSD to high-rise research buildings is still developing. Representative projects-such as the Tongji University Life Science and Innovation Building and the Shenzhen Guangming Science City Launch Zone-feature complex laboratory functions and vibration-sensitive equipment, creating severe stiffness discontinuities [16,17]. Despite these challenges, targeted research remains relatively limited.
This study focuses on a high-rise Science and Innovation Building exhibiting both plan and vertical irregularities. To address these challenges, a PBSD-oriented analytical and design framework is established, integrating elastic–plastic time-history analysis, irregularity identification, and performance verification. Through this framework, the seismic behavior and optimization strategies of the tower and podium structures are comprehensively evaluated, offering insights into PBSD applications for irregular tall buildings in China.
2. Project Overview
2.1. General Description
The Science and Innovation Building, located in Zhengzhou City, Henan Province, China, is a comprehensive research complex with a total floor area of 80,332 m2. The structure comprises 21 above-ground stories and three basement levels. Its maximum architectural height, including the rooftop crown, is 120 m, while the main roof elevation is 99.6 m.
The building adopts a rectangular plan of 48 m × 102 m, divided into a tower and a podium. To ensure both functional efficiency and seismic safety, the two parts are structurally separated by a 150 mm-wide seismic joint. The overall elevation and typical floor layouts are illustrated in Figure 1, which shows the main façade, section, and representative plans.
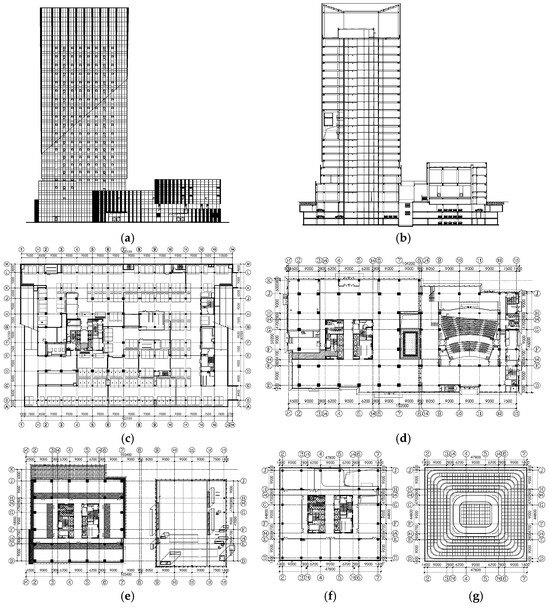
Figure 1.
Architectural section and elevation of the Science and Innovation Building. (a) Architectural facade; (b) architectural section; (c) architectural plan for B2F; (d) architectural plan for the ground floor; (e) architectural plan for the 5th floor; (f) architectural plan for a typical tower floor; and (g) architectural plan for the tower crown roof.
2.2. Functional Layout and Dimensions
The functional distribution follows a clear vertical zoning pattern: Floors 1–3 (podium): entrance foyer, exhibition areas, lecture halls, and multifunctional spaces; Floors 4–10 (lower tower): offices and general laboratories; Floors 11–21 (upper tower): specialized laboratories and research spaces; Basements B1–B3: parking areas and equipment rooms.
The story heights are arranged as follows: B1 = 6.0 m, B2–B3 = 3.9 m, 1F = 6.0 m, 2F–3F = 5.1 m, 4F = 4.8 m, 5F–10F = 4.2 m, and 11F and above = 4.8 m.
2.3. Structural System Configuration
Because the overall height exceeds the code-recommended spacing for expansion joints, a 150 mm seismic joint was installed at the mid-section to mitigate shrinkage and temperature stresses and to reduce plan irregularities. The joint divides the superstructure into two independent seismic units-a tower and a podium-as shown in Figure 2.
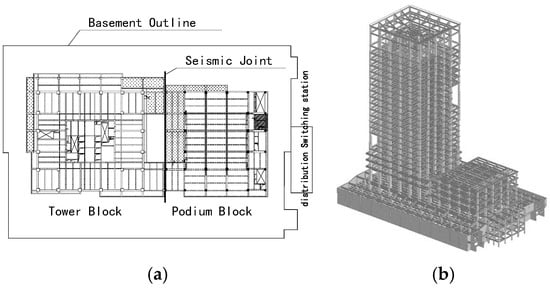
Figure 2.
Structural arrangement of the Science and Innovation Building. (a) Location of structural joints; (b) computational model of the overall structure.
The tower, 99.6 m to roof level, adopts a reinforced-concrete (RC) frame–core-tube system: The core tube provides the primary lateral resistance, while the perimeter frame contributes secondary stiffness and energy dissipation. First-floor columns measure 1300 mm × 1300 mm, and the core-wall thickness is 500 mm. Section dimensions and concrete grades gradually decrease with height to achieve efficient stiffness distribution and material economy.
The podium is a multi-story RC frame structure, in which steel-reinforced concrete (SRC) frames are used in the lecture-hall and multifunction areas to control deflection and satisfy large-span load requirements.
2.4. Material Grades and Member Dimensions
Concrete strength grades are arranged as follows: C60 for floors 1–10, C50 for floors 11–16, and C40 for floors 17 to roof. Beams and slabs are made of C35 concrete.
Key member dimensions of the tower structure are summarized in Table 1.

Table 1.
The dimensions of structural members in the tower’s structure.
2.5. Seismic Design Parameters and Joint Arrangement
The building has a design life of 50 years, with a basic wind pressure of 0.45 kN/m2 and a basic snow pressure of 0.40 kN/m2. It belongs to Standard Category (C) and has a Structural Safety Level II. The seismic fortification intensity is 7 degrees (0.15 g), classified as Seismic Group II; the site is Class II with a characteristic period Tg = 0.45 s.
The presence of the seismic joint not only controls thermal and shrinkage effects but also enhances torsional regularity, allowing independent seismic analysis of the tower and podium [18]. These configurations form the geometric and mechanical basis for the Performance-Based Seismic Design (PBSD) modeling framework introduced in the next section.
3. PBSD Modeling Framework
3.1. Framework Concept and Methodology
The concept of Performance-Based Seismic Design (PBSD) emphasizes controlling structural performance under different earthquake hazard levels through quantitative analysis rather than relying solely on strength-based criteria. PBSD evaluates whether a building can maintain specific functional states-such as full serviceability, reparability, or collapse prevention-corresponding to frequent, design-level, and rare earthquakes.
In this study, the PBSD methodology was adopted to assess the seismic behavior of the Science and Innovation Building, which features significant plan and vertical irregularities. A comprehensive analytical workflow was established to integrate nonlinear time-history analysis, performance evaluation, and design optimization.
The general methodology follows international guidelines such as Vision 2000 (SEAOC 1995), FEMA 356 (2000), and ASCE 41-23 (2023), while adapting them to Chinese codes (GB 50011-2010). The framework defines multi-level performance objectives, nonlinear analysis techniques, and evaluation procedures suitable for both new and existing high-rise structures.
The research process adopted in this paper is illustrated in Figure 3, which presents the technical roadmap for PBSD modeling and analysis.
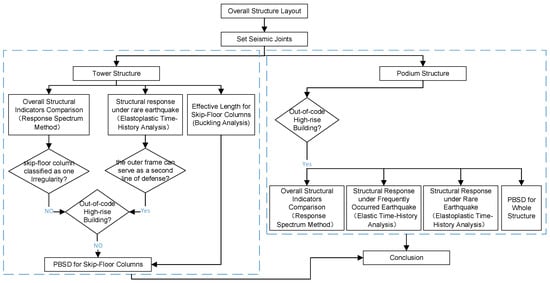
Figure 3.
Technical roadmap.
3.2. Model Development and Analysis Process
To capture the nonlinear seismic behavior of the building, a finite-element model (FEM) was established using the PKPM-SAUSAG V2025 and YJK software V7.0.0 packages. The modeling process includes the following steps:
- (1)
- Material Modeling: Concrete and steel were modeled using constitutive relationships capable of reflecting cyclic behavior, stiffness degradation, and strength reduction. Steel was represented by a bilinear kinematic hardening model with a tensile-to-yield strength ratio of 1.2, accounting for the Bauschinger effect. Concrete followed a uniaxial nonlinear constitutive model, incorporating tensile and compressive damage parameters (dt, dc) to describe stiffness and strength degradation.
- (2)
- Component Modeling: Beam-column elements adopted the fiber-bundle model, enabling interaction between axial force and bending. Shear walls and slabs were simulated using layered shell elements with distributed reinforcement layers, allowing elastic–plastic damage representation.
- (3)
- Global Model Assembly: The overall model was generated by connecting all elements into a three-dimensional system. To account for cracking and flexibility of floors, the rigid-floor assumption was omitted, and slabs were discretized into shell elements.
- (4)
- Damping Model: A quasi-modal damping system was adopted, providing more accurate energy-dissipation representation than the conventional Rayleigh model.
- (5)
- Seismic Input: Three pairs of horizontal acceleration time histories—two natural and one artificial—were selected in accordance with GB 50011-2010. Each pair was applied in orthogonal X and Y directions, scaled to meet the statistical consistency between the average and design response spectra.
The above modeling strategy ensures a realistic representation of the structure’s stiffness, damping, and energy-dissipation mechanisms, forming the foundation for subsequent performance-based analysis.
3.3. Performance Objectives and Verification Principles
In the PBSD framework, performance objectives are defined according to the expected behavior of the structure under different earthquake hazard levels. The fundamental philosophy is that structures should remain elastic and fully functional under frequent earthquakes, sustain controlled and repairable damage under design-level earthquakes, and avoid collapse while ensuring life safety under rare earthquakes.
For the Science and Innovation Building, this principle was implemented by linking each performance objective to measurable engineering parameters, such as interstory drift ratios, stress states of critical components, and overall energy-dissipation behavior. The deformation and internal force demands obtained from nonlinear analysis were compared with the corresponding capacities of the structural components. If the calculated values remain within the envelope of strength and deformation capacity, the performance objectives are considered satisfied.
This verification process provides a direct and quantitative means to evaluate whether both global and local responses meet the desired safety and serviceability requirements. By adopting such an approach, the PBSD methodology ensures that the seismic design of the building not only satisfies code compliance but also reflects realistic performance expectations under varying seismic intensities.
4. Skip-Floor Column Irregularity-Classification and Seismic Performance
4.1. Identification and Modeling of Skip-Floor Column Irregularities
Irregularities in high-rise buildings often lead to complex dynamic behavior and localized stress concentrations under seismic loading. For the Science and Innovation Building, two types of irregularities were identified in the tower: torsional irregularity and discontinuity caused by skip-floor columns and large atrium openings. According to the Technical Guidelines for Special Review of Seismic Fortification for Out-of-Code High-Rise Buildings [19], the tower structure was evaluated for plan and elevation irregularities.
The first irregularity is torsional irregularity, observed when the ratio of torsional displacement to average translational displacement exceeds 1.2. This condition appeared in several lower floors due to asymmetric stiffness and mass distribution. The second irregularity arises from slab discontinuities and skip-floor columns, where discontinuous vertical load paths produce local stiffness jumps, as shown in Figure 4.
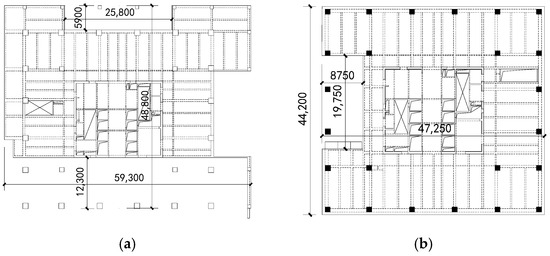
Figure 4.
Structural regularity determination of the tower. (a) large openings on a second-floor slab; (b) skip-floor columns on a standard floor.
- (1)
- Comparative Modeling and Analysis
To determine whether skip-floor columns should be classified as structural irregularities, two analytical models were established using YJK V7.0.0 Structural Design Software: the actual model representing the real tower configuration, and the comparison model with additional outer frame beams connecting skip-floor columns (Figure 5).
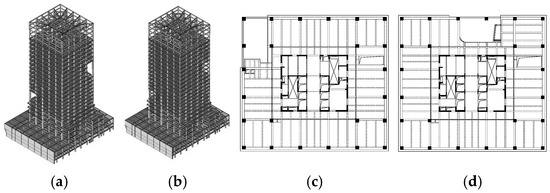
Figure 5.
Structure models for comparison. (a) Actual model; (b) comparison model; (c) adding corner beams to the comparison model; (d) adding unilateral beams to the comparison model.
The structural response under frequent earthquakes was computed using the mode-superposition response spectrum method, incorporating both bidirectional excitation and accidental eccentricity. Modal combination followed the CQC method, and the fixed boundary was defined at the top of the basement structure.
The comparison between both models revealed minimal differences in global properties. As shown in Table 2, the first six vibration periods differed by less than 2%, confirming that the skip-floor configuration has negligible influence on the overall stiffness and torsional response.
Table 2.
The influence of skip-floor columns on structural vibration mode.
- (2)
- Story Drift and Torsional Response
The interstory displacement angles under X- and Y-direction earthquake loading are presented in Figure 6a,b, respectively. Both models exhibited similar deformation patterns, with maximum interstory drifts below 1/800, satisfying code requirements. The comparison model showed slightly smaller interstory drifts due to the additional outer beam stiffness.
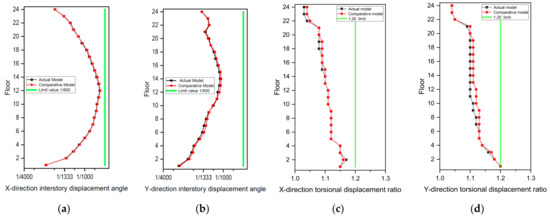
Figure 6.
Story drift index of two models under the conditions of frequently occurring earthquakes. (a) X-direction interstory displacement angle; (b) Y-direction interstory displacement angle; (c) X-direction torsional displacement ratio; (d) Y-direction torsional displacement ratio.
As summarized in Table 3, the maximum interstory drift angles occurred at the 12th and 14th floors in the X and Y directions, respectively, with differences below 1%. The torsional displacement ratios (Figure 6c,d) were below 1.2 for most floors, exceeding this value only in certain lower stories.
Table 3.
Maximum interstory displacement angle comparison.
- (3)
- Shear Distribution and Structural Classification
Further comparisons of shear force distribution between the outer frame and core tube are illustrated in Figure 7. The difference between the two models did not exceed 3% for any floor, indicating that the absence of certain outer frame beams has a negligible impact on lateral load transfer.
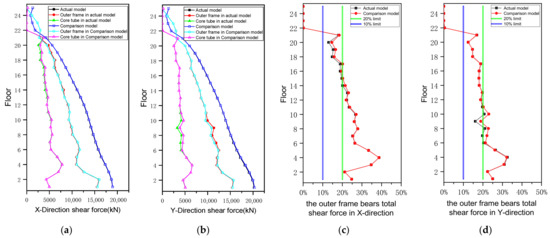
Figure 7.
Shear force distribution of two models under frequently occurring earthquakes. (a) X-direction shear force distribution on each floor; (b) Y-direction shear force distribution on each floor; (c) proportion of outer frame bearing the total floor’s shear force in the X-direction; (d) proportion of outer frame bearing the total floor’s shear force in the Y-direction.
As summarized in Table 4, the relative differences in stiffness, torsional ratios, and shear distribution across all key indicators remained within 5%. Consequently, the skip-floor columns do not significantly affect the seismic response of the tower. They should therefore not be classified as independent irregularities, and the structure can be regarded as a generally irregular high-rise rather than an out-of-code building.
Table 4.
Comparison of Base Shear Force for Various Seismic Waves.
4.2. Seismic Performance Evaluation Under Rare Earthquakes
To evaluate the nonlinear behavior of the tower structure under rare earthquake conditions, an elastoplastic time-history analysis was conducted using the PKPM-SAUSAG platform V2025 with explicit integration. The study focused on global displacement, interstory drift, energy dissipation, and component damage patterns (Figure 8).
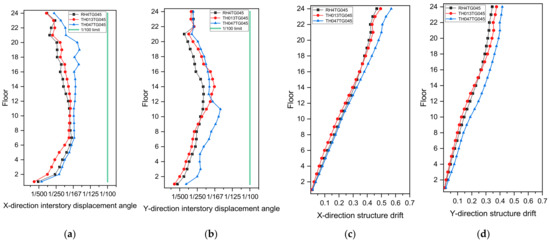
Figure 8.
Story and structure drift under seismic waves. (a) X-direction interstory displacement angle; (b) Y-direction interstory displacement angle; (c) X-direction structure drift; (d) Y-direction structure drift.
- (1)
- Global Displacement and Interstory Drift
Under the three sets of ground motions (RH4TG045, TH013TG045, and TH047TG045), the tower structure remained upright after the shaking.
The maximum roof displacements in the X and Y directions were 0.569 m and 0.439 m, corresponding to 1/228 and 1/296 of the total height, respectively.
The maximum interstory drift angles were 1/149 and 1/150, both well below the design limit of 1/100, indicating adequate ductility and lateral stiffness.
- (2)
- Energy Dissipation Characteristics
The energy distribution during the RH4TG045 motion revealed that damping energy accounted for approximately 50% of total input energy, while strain energy contributed about 40% (Figure 9).
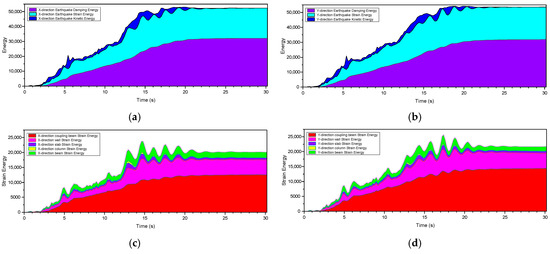
Figure 9.
Energy diagram of seismic wave RH4TG045. (a) X-direction total energy diagram; (b) Y-direction total energy diagram; (c) X-direction strain energy diagram; and (d) Y-direction strain energy diagram.
This demonstrates that the structure dissipates seismic energy primarily through hysteretic behavior of critical components, consistent with a rigid-frame–core-tube system.
According to Table 5, the coupling beams contributed more than 50% of the total strain-energy dissipation, followed by shear walls.
Table 5.
Proportion of strain energy dissipation in structural components.
Frame beams and columns consumed much less energy, confirming that the core tube served as the primary seismic energy-dissipation system, while the outer frame functioned as a secondary defense.
- (3)
- Damage Distribution of Key Components
Damage analysis indicated that most core-tube walls remained in the elastic range, with more than 80% of elements exhibiting a compressive-damage parameter DC below 0.1. Localized damage occurred around wall openings and in the lower strengthening zone (Figure 10). The coupling beams exhibited severe shear cracking, with over 80% of elements having DC > 0.8, though the reinforcement remained largely elastic, confirming shear-dominant failure (Figure 11).
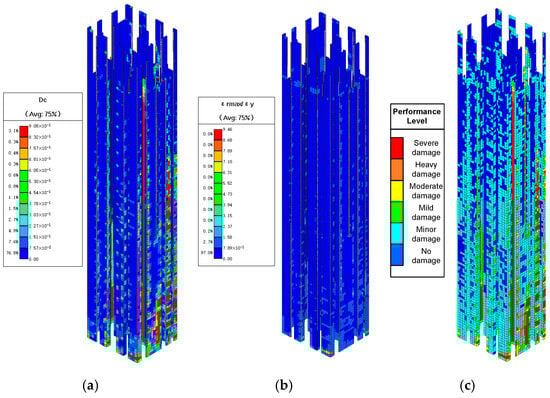
Figure 10.
Performance evaluation of reinforced concrete walls. (a) Concrete compression damage; (b) development degree of rebar plasticity; and (c) performance indicator.
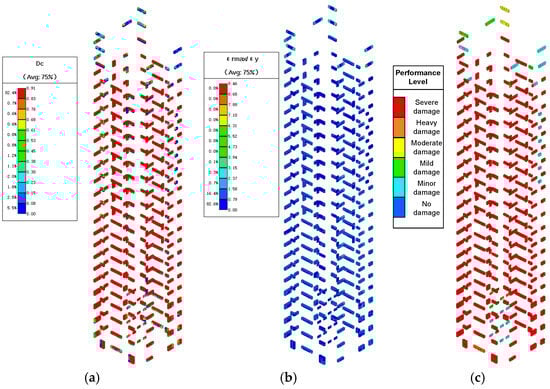
Figure 11.
Performance evaluation of coupling beams in reinforced concrete walls. (a) Concrete compression damage; (b) development degree of rebar plasticity; and (c) performance indicator.
For the outer frame, both beams and columns mainly experienced minor damage. Concrete compressive damage concentrated at beam ends, and reinforcement yielded only locally. Most frame members maintained performance levels below moderate damage, ensuring that the perimeter frame retained integrity as a secondary lateral-resisting system (Figure 12 and Figure 13).
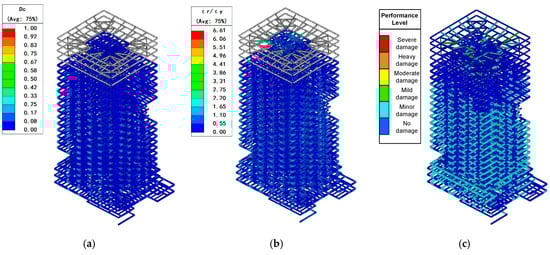
Figure 12.
Performance evaluation of RC beams. (a) Concrete compression damage; (b) development degree of rebar plasticity; and (c) performance indicator.
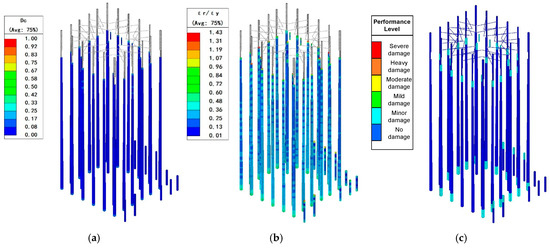
Figure 13.
Performance evaluation of reinforced concrete columns. (a) Concrete compression damage; (b) development degree of rebar plasticity; and (c) performance indicator.
Overall, the elastoplastic analysis confirmed that the tower met PBSD requirements under rare earthquakes: the core tube effectively dissipated energy, the outer frame remained elastic, and no global instability or collapse occurred.
4.3. Performance Verification and Design Implications
To further validate the seismic reliability of the tower, performance verification of skip-floor columns was conducted through buckling analysis and section-capacity assessment. These performance targets correspond to the multi-level objectives summarized in Table 6.
Table 6.
Seismic performance target of columns.
- (1)
- Effective Length of Skip-Floor Columns
Using MIDAS GEN 2023, buckling analysis was performed on a representative skip-floor column (Grid 2/J, Floors 19–21, 14.4 m high, 900 × 900 mm C40).
Under an axial load of 1000 kN, the first and second buckling factors were 244 and 248 (Figure 14), corresponding to an effective length coefficient μ = 0.589, which is significantly less than 1.0 (Figure 14).
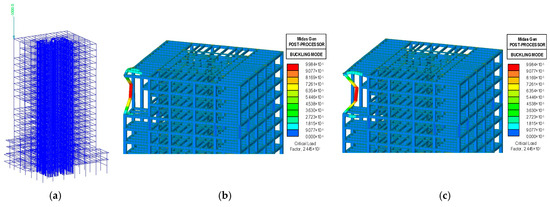
Figure 14.
Buckling analysis of columns. (a) Buckling axial force applied at the top of the skip-floor column; (b) the first-order buckling mode; and (c) the second-order buckling mode.
This confirms that treating the physical height as the effective length satisfies design requirements.
- (2)
- Performance Verification Based on PBSD
The PBSD verification ensured that the skip-floor columns remain elastic under rare earthquakes. Internal-force time histories obtained from elastoplastic analysis were plotted against the column’s P-M interaction envelope, as shown in Figure 15. All response points fell within the elastic capacity boundary, demonstrating that the column did not yield. Therefore, the skip-floor columns meet the “elastic under rare earthquakes” criterion and contribute effectively to maintaining the tower’s lateral integrity.
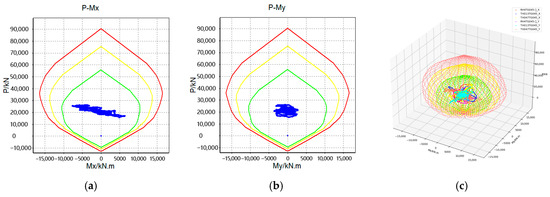
Figure 15.
PMM diagram of the 4-axis/D-axis skip-floor column between the 1st and 2nd floor. (a) P-Mx envelope curve; (b) P-My envelope curve; and (c) PMM diagram.
- (3)
- Design Implications
The analytical results confirm that the omission of certain outer-frame beams has an insignificant effect on the tower’s seismic behavior, while skip-floor columns possess sufficient stiffness and stability.
The combined PBSD and buckling analyses validate that the structural system achieves both strength safety and deformation control under all design-level earthquakes.
These findings provide a rational basis for optimizing irregular high-rise structures with similar discontinuous vertical elements.
5. Vertical Irregularities in the Podium-Response and Energy Dissipation Mechanism
5.1. Structural Characteristics and Elastic Analysis
The podium structure of the Science and Innovation Building features a multi-story reinforced concrete frame with pronounced vertical and planar irregularities.
These irregularities stem from several architectural and functional design requirements: Large-span openings above the lecture and multifunctional halls; Mezzanines and skip-floor columns creating stiffness discontinuities; and Columns supported directly by transfer beams, generating abrupt force redistributions (Figure 16).
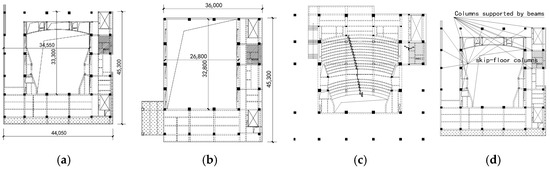
Figure 16.
Determination of the podium structure’s regularity. (a) Large openings in the second-floor slab; (b) large openings in the fourth-floor slab; (c) a lecture hall inclined mezzanine; and (d) second-floor columns supported on beams and skip-floor columns.
To verify the structural response consistency, analytical models were established using both YJK V2025 and PMSAP software V2025 (Figure 17). The mode-superposition response spectrum method was adopted under bi-directional seismic excitations, including accidental eccentricity (Figure 18). As summarized in Table 7, Table 8 and Table 9, both modeling approaches yielded comparable results in mass distribution, vibration periods, and overturning moments, confirming the reliability of the YJK model.
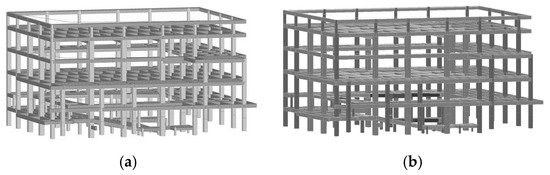
Figure 17.
Analytical models of the podium. (a) YJK model and (b) PMSAP model.
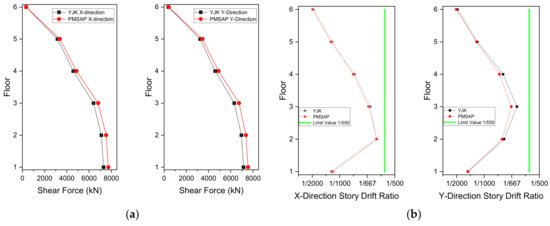
Figure 18.
Comparison of structural floor response of podium structures under seismic action. (a) Comparison of floor shear force; (b) comparison of interlayer displacement angles.
Table 7.
Comparison of structural mass.
Table 8.
Comparison of vibration model.
Table 9.
Comparison of overturning moment.
To further validate the linear analysis, elastic time-history analyses were carried out using seven ground motion records (five natural and two artificial), scaled to a peak acceleration of 55 cm/s2 and a directional ratio of 1.0:0.85.
The results (Figure 19) demonstrated close agreement with the response spectrum method. Despite evident vertical irregularities, no significant whiplash effects were observed, confirming that elastic responses remain within design expectations.
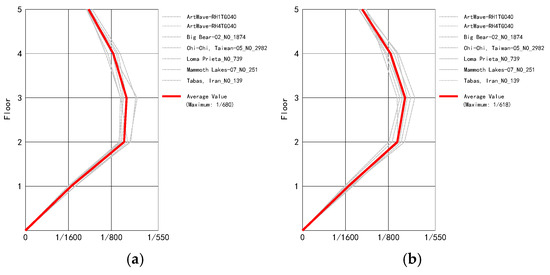
Figure 19.
Comparing the response spectrum method with elastic time-history analysis for the maximum interlayer displacement angle. (a) X direction; (b) Y direction.
5.2. Performance-Based Seismic Design of the Podium
Given the irregular configuration and functional importance of the podium, a Performance-Based Seismic Design (PBSD) approach was applied, targeting Performance Level D. As shown in Table 10.
Table 10.
PBSD performance targets for podium components.
This level requires that the structure remain intact under frequent earthquakes, sustain moderate damage under design-level earthquakes, and avoid collapse under rare earthquakes.
Critical components-such as large-span bearing columns, transition beams, and transfer columns-were designed with enhanced ductility and detailing.
The qualitative performance objectives and deformation limits were established as follows: Intact under frequent earthquakes (1/550 interstory drift limit); Moderate damage under design earthquakes (1/180 limit); No collapse under rare earthquakes (1/60 limit).
For energy-dissipating elements such as frame beams, controlled plastic deformation was allowed, whereas key load-bearing components were constrained to remain within elastic or slightly yielding states.
This hierarchical design ensured that global ductility was achieved through distributed minor yielding rather than localized failure.
5.3. Nonlinear Response and Energy Dissipation Mechanism
An elastoplastic time-history analysis of the podium was performed using PKPM-SAUSAG under four representative earthquake records (Chi-Chi, Taiwan-025, Big Bear-01, and RH2TG045). The peak ground acceleration was scaled to match rare-earthquake intensity.
Results indicated that, excluding the top floor, the maximum interstory drift angles were 1/103 (X-direction) and 1/89 (Y-direction), both within the 1/60 limit. Maximum roof displacements were 0.188 m (X) and 0.175 m (Y), corresponding to 1/127 and 1/137 of total height, confirming overall stability.
The energy analysis (Figure 20) showed that over 80% of total input energy was dissipated by material hysteresis, reflecting a rigid-frame energy-dissipation mechanism. The additional damping ratio was approximately 0.9%, suggesting moderate plastic development with sufficient safety margins. Hysteretic loops of key members (Figure 21) displayed mild pinching and limited slip effects, characteristic of RC frame structures with moderate ductility.
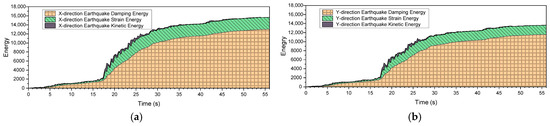
Figure 20.
Energy dissipation diagram for BigBear-01 Wave: (a) X-dominant wave; (b) Y-dominant wave.
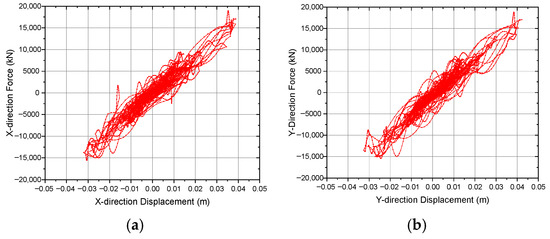
Figure 21.
Triple hysteresis curves for the BigBear-01 wave structure. (a) X-dominant wave; (b) Y-dominant wave.
Performance evaluation of individual members (Figure 22) revealed that SRC beams largely remained elastic, while RC beams and columns developed partial yielding without compromising integrity. Plastic strain and concrete compression damage stayed below critical levels, confirming that the structure meets the PBSD target of “no collapse under rare earthquakes.”
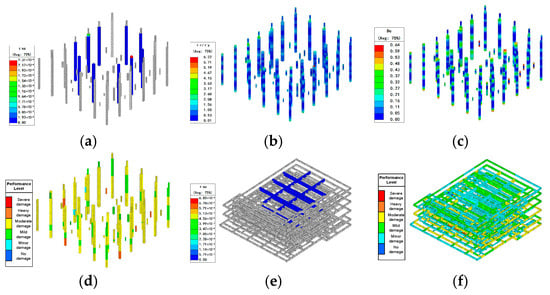
Figure 22.
Performance level of members under rare earthquakes. (a) Plastic strain of steel in the SRC column; (b) degree of plastic development for column reinforcement; (c) compression damage to the column concrete; (d) column performance level; (e) plastic strain of steel in the SRC beam; and (f) beam performance level.
6. Recommended Construction Sequence and Implementation Plan
To enhance the engineering applicability of the proposed PBSD, a recommended construction sequence is presented. The Science and Innovation Building consists of a 21-story tower and a multi-story podium separated by a 150 mm seismic joint, and the two structural units should be constructed independently to ensure overall safety and integrity.
The overall sequence follows the principle of “core-tube first, frame following.” Construction begins with staged excavation and mat foundation works, proceeds with the RC and SRC podium frames, and continues with the tower core tube erected by slipform or jumpform about two to three stories ahead of the outer frame. The perimeter frame, coupling beams, and skip-floor columns are subsequently installed with temporary supports to control construction-stage deformation. Once both structural units reach stable conditions, the seismic joint is finalized, and the façade and MEP systems are completed with flexible connections to maintain structural separation.
During the entire process, temporary lateral bracing is maintained, and interstory drifts are checked floor by floor to prevent any unintended rigid connection across the joint. Differential shortening and settlement are continuously monitored, and necessary adjustments are made when deviations exceed specified limits. Quality control focuses on concrete strength, geometric alignment, and joint width to ensure consistency with the PBSD intent.
This construction sequence ensures safety during erection, preserves the “core-tube dissipation and frame protection” mechanism identified in the PBSD analysis, and provides a practical reference for similar irregular high-rise structures with discontinuous vertical systems.
7. Conclusions
This study analyzed the seismic performance and PBSD-oriented optimization of the Science and Innovation Building, characterized by skip-floor columns and irregularities in both plan and elevation. The main conclusions are as follows:
- (1)
- Influence of Skip-Floor Columns. Comparative analysis between the actual and modified models showed that vibration periods, interstory drift, and shear distribution differed by less than 5%. Skip-floor columns have limited influence on global stiffness and do not require separate classification as irregularities; thus, the tower can be regarded as a generally irregular high-rise structure.
- (2)
- Seismic Behavior of the Tower. Elastoplastic time-history analysis indicated that the tower remained upright under rare earthquakes, with maximum interstory drift ratios of 1/149 and 1/150 in the X and Y directions, respectively. Energy analysis revealed that damping and strain energies accounted for 50% and 40% of total input energy. The core tube remained mostly elastic, coupling beams experienced shear-dominant failure, and the outer frame showed only minor damage, forming a dual seismic defense of “core-tube dissipation and frame protection.”
- (3)
- Performance of Skip-Floor Columns. Buckling analysis yielded an effective length coefficient of μ = 0.589, confirming that physical height can be used as the design length. PBSD verification showed that column internal forces remained within the elastic P–M envelope under rare earthquakes, meeting the target of elastic behavior under extreme conditions.
- (4)
- Podium Seismic Response. The podium exhibited significant vertical irregularities but maintained stable performance. The YJK and PMSAP models produced consistent results under frequent earthquakes. Under rare earthquakes, maximum interstory drifts were 1/103 (X) and 1/89 (Y), with more than 80% of total energy dissipated by material hysteresis, satisfying PBSD requirements for “no collapse under rare earthquakes.”
- (5)
- Engineering Implications. The integrated PBSD and nonlinear analysis framework provides a practical reference for irregular high-rise buildings with discontinuous vertical systems. It achieves a rational balance between safety, economy, and functionality, offering guidance for the seismic design of complex scientific research facilities. In addition, a practical construction sequence based on the recommended design is proposed, which demonstrates the feasibility of applying the PBSD approach to real projects and enhances its engineering applicability.
Author Contributions
J.J. provided the design task and was involved in conception and methodology, writing—original draft and writing—review and editing. K.L. contributed to data curation, formal analysis and software. Z.Y. contributed to the investigation, project administration and resources. All authors have read and agreed to the published version of the manuscript.
Funding
This research received no external funding.
Data Availability Statement
The original contributions presented in this study are included in the article. Further inquiries can be directed to the corresponding author.
Conflicts of Interest
The authors declare no conflicts of interest.
References
- Bhasker, R.; Menon, A. Torsional irregularity indices for the seismic demand assessment of RC moment resisting frame buildings. Structures 2020, 26, 888–900. [Google Scholar] [CrossRef]
- Rooshenas, A. Comparing pushover methods for irregular high-rise structures, partially infilled with masonry panels. Structures 2020, 28, 337–353. [Google Scholar] [CrossRef]
- Leelataviwat, S.; Goel, S.C.; Stojadinovic, B. Energy-Based Seismic Design of Structures using Yield Mechanism and Target Drift. J. Struct. Eng. 2002, 128, 1046–1054. [Google Scholar] [CrossRef]
- Sarkisian, M.; Long, E.; Hassan, W. Performance-Based Engineering of Core Wall Tall Buildings. Structures Congress 2013, Pittsburgh, Pennsylvania, United States. Available online: https://ascelibrary.org/doi/abs/10.1061/9780784412848.097 (accessed on 11 November 2025).
- Da, G.; Wang, B.; Wenhao, X.; Dan, L. Study on the influence of additional deformation of deepfoundation pit construction in sensitive environment. Eng. Constr. 2021, 53, 52–57. (In Chinese) [Google Scholar]
- Brunesi, E.; Nascimbene, R.; Casagrande, L. Seismic analysis of high-rise mega-braced frame-core buildings. Eng. Struct. 2016, 115, 1–17. [Google Scholar] [CrossRef]
- Gan, X.; Xiaoqin, W.; Qun, Z. Shared Mega-Form: A Preliminary Study on the Design of Major National Scientific and Technological Infrastructure. Time + Archit. 2024, 110–117. (In Chinese) [Google Scholar]
- Sun, X.; Li, J.; Qian, Y.; Chai, H. Structural design of Zhengzhou International Cultural Exchange Center. Build. Struct. 2023, 53, 1–7. [Google Scholar]
- Gao, L.; Jia, J.; Cui, Z.; Wei, X. Seismic Performance Analysis of Zhengzhou Science Museum Structure. Build. Struct. 2018, 48, 45–49. [Google Scholar]
- JGJ 3-2010; Technical Specification for Concrete Structures of Tall Buildings. China Architecture & Building Press: Beijing, China, 2011.
- Ellingwood, B.R.; Kinali, K. Quantifying and communicating uncertainty in seismic risk assessment. Struct. Saf. 2009, 31, 179–187. [Google Scholar] [CrossRef]
- Lu, X.; Cui, Y.; Liu, J.; Gao, W. Shaking table test and numerical simulation of a 1/2-scale self-centering reinforced concrete frame. Earthq. Eng. Struct. Dyn. 2015, 44, 1899–1917. [Google Scholar] [CrossRef]
- Nielsen, G.M.; Almufti, I.; Mahin, S.A.; Willford, M.R. Performance of rocking core walls in tall buildings under severe seismic motions. In Proceedings of the 9th US National and 10th Canadian Conference on Earthquake Engineering, Ottawa, ON, Canada, 25–29 July 2010; Paper No 483. Canadian Association for Earthquake Engineering: Vancouver, BC, Canada, 2010. [Google Scholar]
- BS EN 1998-3:2005; Eurocode 8: Design of Structures for Earthquake Resistance—Part 3: Assessment and Retrofitting of Buildings. British Standards Institution: Brussels, Belgium, 2005.
- Lu, X.; Gong, Z.; Weng, D.; Ren, X. The application of a new structural control concept for tall building with large podium structure. Eng. Struct. 2007, 29, 1833–1844. [Google Scholar] [CrossRef]
- Chen, B.; Zhang, Y.; Deng, F.; Zhang, L.; Li, J. Structural Design and Analysis of Zhengzhou Museum New Building. Build. Struct. 2018, 48, 56–59. [Google Scholar]
- Lu, J.; Li, Z.; Teng, J. Two-Stage Seismic Resilience Enhancement for Frame–Core Tube Structures Based on Performance Loss and Repair Paths in Complex Networks. Struct. Des. Tall Spec. Build. 2025, 34, e70067. [Google Scholar] [CrossRef]
- Regulations on Seismic Management of Construction Projects. State Council Decree No.744, effective 1 September 2021. Available online: https://www.gov.cn/gongbao/content/2021/content_5631815.htm (accessed on 11 November 2025).
- Yuan, Z.; Su, F.; Mao, X.; Wang, G.; Li, X.; Wang, J.; Gao, M.; Li, G. Seismic Design of Out-of-Code Complex Structure for Zhengzhou Grand Theater. Build. Struct. 2018, 48, 50–55. [Google Scholar]


Disclaimer/Publisher’s Note: The statements, opinions and data contained in all publications are solely those of the individual author(s) and contributor(s) and not of MDPI and/or the editor(s). MDPI and/or the editor(s) disclaim responsibility for any injury to people or property resulting from any ideas, methods, instructions or products referred to in the content. |
© 2025 by the authors. Licensee MDPI, Basel, Switzerland. This article is an open access article distributed under the terms and conditions of the Creative Commons Attribution (CC BY) license (https://creativecommons.org/licenses/by/4.0/).