Article

A Closed-Loop Scheduling Framework for Prefabricated Bridge Girders: Bayesian Regression and TCTO-Based Optimization

1
Research & Development Center, Saman Corporation, Seoul 05774, Republic of Korea
2
Research & Development Center, Jangheon Corporation, Seoul 05774, Republic of Korea
3
Research & Development Center, Hanmac Engineering, Seoul 05774, Republic of Korea
*
Author to whom correspondence should be addressed.
Buildings 2025, 15(22), 4168; https://doi.org/10.3390/buildings15224168
Submission received: 2 October 2025 / Revised: 3 November 2025 / Accepted: 14 November 2025 / Published: 19 November 2025
(This article belongs to the Special Issue Advanced Studies in Smart Construction)

Abstract

Prefabricated construction has emerged as a key strategy to enhance productivity and quality in infrastructure projects. Yet, construction scheduling for prefabricated infrastructure projects often suffers from persistent discrepancies between planned and actual performance due to static assumptions of task durations and fragmented management methods. To address this challenge, this study proposes a closed-loop framework that integrates probabilistic estimation, prescriptive planning, and performance feedback for prefabricated girder bridge construction. Standard task time (ST) is dynamically modeled using Bayesian regression, which incorporates prior knowledge and updates continuously with new field data. The updated ST distributions are embedded into a time–cost trade-off (TCTO) optimization algorithm to generate resource-constrained schedules. Execution data are captured through an object-based digital logging system, and performance is evaluated using the Schedule Performance Index (SPI). The accumulated results are then used to update the Bayesian model, creating a self-correcting cycle of plan → execution → performance → updating. Using eleven prefabricated girder projects, we standardized task definitions and quantified the plan and actual gaps that motivate the framework. Six projects formed the training set for Bayesian regression to estimate ST with priors; four projects were scheduled with TCTO using the posterior ST, and execution outcomes were compared with the generated plans to validate accuracy, while the collected evidence was used to update the Bayesian model; one final project received the full closed-loop application for comparative assessment of plan versus outcome, with SPI used in the closed-loop evaluation. The deployments improved alignment between plan and actual, narrowed uncertainty in ST over time, and supported credible schedules, real time progress visibility, and resource efficient planning in repetitive prefabrication. From a managerial perspective, the implemented system operationalizes feedback between planning and execution with configurable update cadences such as daily logs, repetitive unit cycles, and project close out. This study provides a validated and extensible template for closed-loop schedule management in prefabricated settings and clarifies the novelty of unifying Bayesian estimation, TCTO optimization, and digital performance feedback in one practical workflow.

1. Introduction

1.1. Research Background

Global construction labor productivity has increased by only about 1% annually over the past two decades, far behind the growth rates of the overall economy (2.8%) and manufacturing (3.6%) [1]. This reflects not only inefficiencies at the project level but also structural mismatches in supply and demand across the infrastructure sector. Case studies in Hong Kong have shown that client-side decision delays, design changes, and uncertain site conditions collectively and persistently cause project delays [2]. In large-scale infrastructure projects, systematic underestimation of initial costs and schedules repeatedly results in overruns, while small planning errors accumulate into performance deterioration, forming what has been described as the “pathology” of projects [3,4]. In contexts with high complexity—such as large infrastructure projects involving multiple stakeholders and frequent changes—limited expertise, weak collaboration, and scope variability accelerate delays [5]. Ultimately, schedules established without dynamic and flexible duration models undermine both project reliability and industry sustainability.
Construction project scheduling essentially depends on the accuracy of predicting task durations, and the concept of Standard Time (ST) lies at its center. ST refers to the time required by a skilled worker to complete a unit task under defined conditions and methods. It serves as a fundamental input in both PERT and CPM: PERT estimates expected durations by combining optimistic, most likely, and pessimistic values based on ST, while CPM fixes a single duration and analyzes the time–cost trade-off to determine the optimal project completion time [6].
However, in practice, ST is often regarded as a static, linear input–output relationships, disregarding variations caused by workforce composition, skill levels, equipment efficiency, and environmental factors. This leads to frequent gaps between planned and actual performance. These gaps persist because, in current practice, the monitoring layer (ST estimation, SPI), the prescriptive layer (TCTO), and field logging are rarely integrated into a single closed-loop workflow that feeds execution data back into planning; in the absence of this feedback loop, schedules cannot adapt, and fragmentation—methodological as well as managerial—undermines reliability and resource efficiency in repetitive prefabricated settings. We focus on prefabricated bridge girders because their repetitive, modular production–transport–erection cycle enables consistent unit definitions and learnable ST functions through object-level logging across cycles, strengthening closed-loop estimation and updating.
In practice and on site, duration estimation, planning, and performance analytics do not operate as a single closed loop, and this break in the chain persists. Concretely, probabilistic ST is not consistently used to parameterize TCTO, and object-level logging/SPI results rarely feedback to update ST, so plans fail to adapt to field realities, undermining schedule reliability and resource efficiency. We address this non-functioning link by implementing an operational, single dataflow: we estimate probabilistic ST and embed it directly in TCTO, then feed object-level SPI logging back to update ST within a closed-loop pipeline that is run on real prefabricated bridge girder projects, thereby progressively reducing plan–actual gaps (narrowing ST credible intervals) and improving plan–execution alignment across cycles.

1.2. Literautre Review on Scheduling Prefabricated Construction

We organize this review into four themes—factory and site synchronization, dynamics of ST and learning effects, prescriptive optimization under uncertainty (embedding Probabilistic ST in TCTO), and performance analytics with feedback—so that practical bottlenecks precede methodological remedies and the closing of the loop.

1.2.1. Prefabrication and Factory Site Synchronization

Prefabricated construction has emerged as a promising approach to simultaneously improve productivity, quality, and safety. Prefab methods shorten project duration and standardize quality by shifting production to factories and assembly on sites. Research has highlighted various strategies, such as multi-skilled labor optimization, productivity gains through off-site construction (OSC), real-time uncertainty monitoring via intelligent systems, and multi-objective scheduling optimization [7,8,9,10,11]. A persistent limitation, however, is the lack of data-level synchronization between factory outputs (production, inventory, dispatch) and site schedules (staging, lifting, erection), which leaves handoff asynchrony unaddressed. When the factory–transport–site supply chain remains loosely coupled, disconnects arise, leading to material storage inefficiencies, equipment idle time, and task interferences [12,13]. Studies in China and Hong Kong have repeatedly pointed out that supply chain bottlenecks and poor integration between factory and site are major obstacles the wider adoption of prefab construction [14,15,16,17,18]. In other words, without operational models and data-driven schedule management to support them, the potential of prefab construction cannot be fully realized.

1.2.2. Standard Time (ST): Dynamics and Learning

Building on these observations, the core gap between traditional methods and prefab operations lies in the treatment of ST dynamics and resource and time interactions. While PERT and CPM provide foundational tools, they rely heavily on expert judgment and assume deterministic critical paths, limiting their ability to reflect uncertainty, resource constraints, and repetitive processes [19,20]. Accordingly, ST should be modeled as a probabilistic, learnable function—rather than a fixed, linear constant—so that duration prediction can adapt to context and repetition in prefabricated settings. When ST is assumed to be a fixed, linear value, repetitive prefab operations fail to capture nonlinearities in time–effort relations caused by variability, learning effects, and resource bottlenecks. Indeed, several precast concrete plants report operating at low utilization levels compared to their design capacities, which can be attributed not only to the construction method itself but also to inaccurate ST assumptions undermining the realism of planning [21]. Although visualization and 4D CAD scheduling have been explored, most studies have remained at a preliminary “feasibility level [22]. In practice, TCTO implementations often inherit a linear duration-input assumption from fixed STs, which masks learning effects and bottlenecks in repetitive work. Moreover, initial STs are frequently behaviorally contaminated: deadline-driven ‘student syndrome’ and Parkinson’s law lead to conservative settings, late starts, and end-loaded resource spikes. Current practice typically reuses previously set STs or aggregates results ex post to ‘consider’ probabilities manually, rather than updating duration models systematically. This leaves a gap: duration parameters are not routinely revised toward truer values based on observed outcomes.

1.2.3. TCTO with Uncertainty Durations

Parallel to these attempts, Time–Cost Trade-Off (TCTO) studies have advanced. Research includes stochastic TCTO analysis, complexity studies of discrete TCTO, Monte Carlo–Time-at-Risk risk evaluation, and hybrid optimization methods tailored to repetitive processes [23,24,25,26]. A remaining practical question is how TCTO can use uncertainty-aware and context-rich duration functions while retaining computational simplicity and interpretability. However, most of these approaches still presuppose deterministic ST, failing to adequately internalize field variability. Consequently, ST (as diagnostic input) and TCTO (as prescriptive planning) remain disconnected modules rather than forming a continuous cycle.

1.2.4. Performance Analytics and Missing Feedback Loop

In parallel, performance analytics for scheduling have progressed, but they are still used mainly in a retrospective manner rather than as an operational feedback layer. A similar gap exists in performance measurement. Earned Value Management (EVM) and Schedule Performance Index (SPI) provide standardized metrics to measure deviations, while the Earned Schedule approach has improved the precision of schedule interpretation [27]. Further advances have explored schedule robustness using activity sensitivity and network topology, as well as integrating growth models with EVM and Earned Schedule for improved forecasting [28,29]. However, these approaches are largely retrospective and are not routinely operated as a feedback mechanism that updates duration models within the same workflow. Yet, these methods remain largely retrospective, offering diagnosis rather than enabling real-time closed-loop integration with planning and resource optimization. As a result, ST, TCTO, and SPI/EVM each perform meaningful roles individually, but they fall short of connecting planning, execution, performance, and feedback into a unified data pipeline.

1.2.5. Synthesis: Toward an Operational Closed-Loop

Across related streams (probabilistic modeling, intelligent planning, and digital execution platforms), prior work has expanded capability, but these strands have rarely been operated together as one end-to-end loop that runs on real projects. Recently, probabilistic and intelligent approaches have been proposed to bridge this gap. Examples include combining Monte Carlo simulation with Bayesian networks to estimate schedule delay probabilities, Bayesian regression models for duration prediction, reinforcement learning to balance schedule–cost–value trade-offs, and multivariate probabilistic models for stochastic scheduling [30,31,32,33,34]. Meanwhile, digital twins (DT) and AI/ML methods are gaining traction, offering operational platforms that integrate production, assembly, and operation data. DT reference models for smart manufacturing, process mining of progress logs, and decision-support systems for modular prefab construction have been reported [35,36,37]. Yet, few studies have demonstrated an integrated framework that links ST estimation, TCTO optimization, performance analysis, and probabilistic updating in a closed loop for real projects. In summary, prior work remains modular and retrospective; what is missing is an end-to-end operational closed loop in which probabilistic ST directly feeds TCTO and object-based logging/SPI feeds back into Bayesian updating—implemented and validated on real projects.

1.3. Purpose of This Study

This study aims to operationalize a closed-loop scheduling framework by (1) estimating probabilistic ST via Bayesian linear regression, (2) embedding ST as the duration function within a TCTO optimizer to generate schedules that satisfy target durations under resource constraints, and (3) logging object-level execution to compute SPI and update ST posteriors. Execution data at the object level are incorporated into SPI-based performance analyses, and accumulated results serve to update ST distributions (mean and variance) through Bayesian inference. This establishes a closed-loop cycle of planning, execution, performance evaluation, and updating. The novelty does not lie in any single method but in the single operational dataflow—Bayesian ST → TCTO → object logging/SPI → Bayesian updating—designed, implemented, and validated on real prefabricated girder projects in South Korea.
In summary, this study proposes a systematic framework that integrates probabilistic ST estimation (diagnosis), prescriptive TCTO planning, execution logging, SPI-based performance analysis, and Bayesian updating (model calibration), applying the framework to prefabricated bridge construction in order to bridge the gap between traditional project management methods and manufacturing-oriented construction practices. We explicitly position this as an implemented and validated system (not purely conceptual); the update cadence (daily, per unit cycle, or project-level) is configured per project and specified in the methodology. The framework is validated through case projects in South Korea, specifically focusing on prefabricated bridge superstructure works.

2. Research Framework and Methodology

As shown in Figure 1, closing the persistent gaps in construction productivity and quality calls for a dynamic, closed-loop approach; accordingly, we now present the proposed framework and methodology that operationalize this idea.

2.1. Overall Closed-Loop Framework

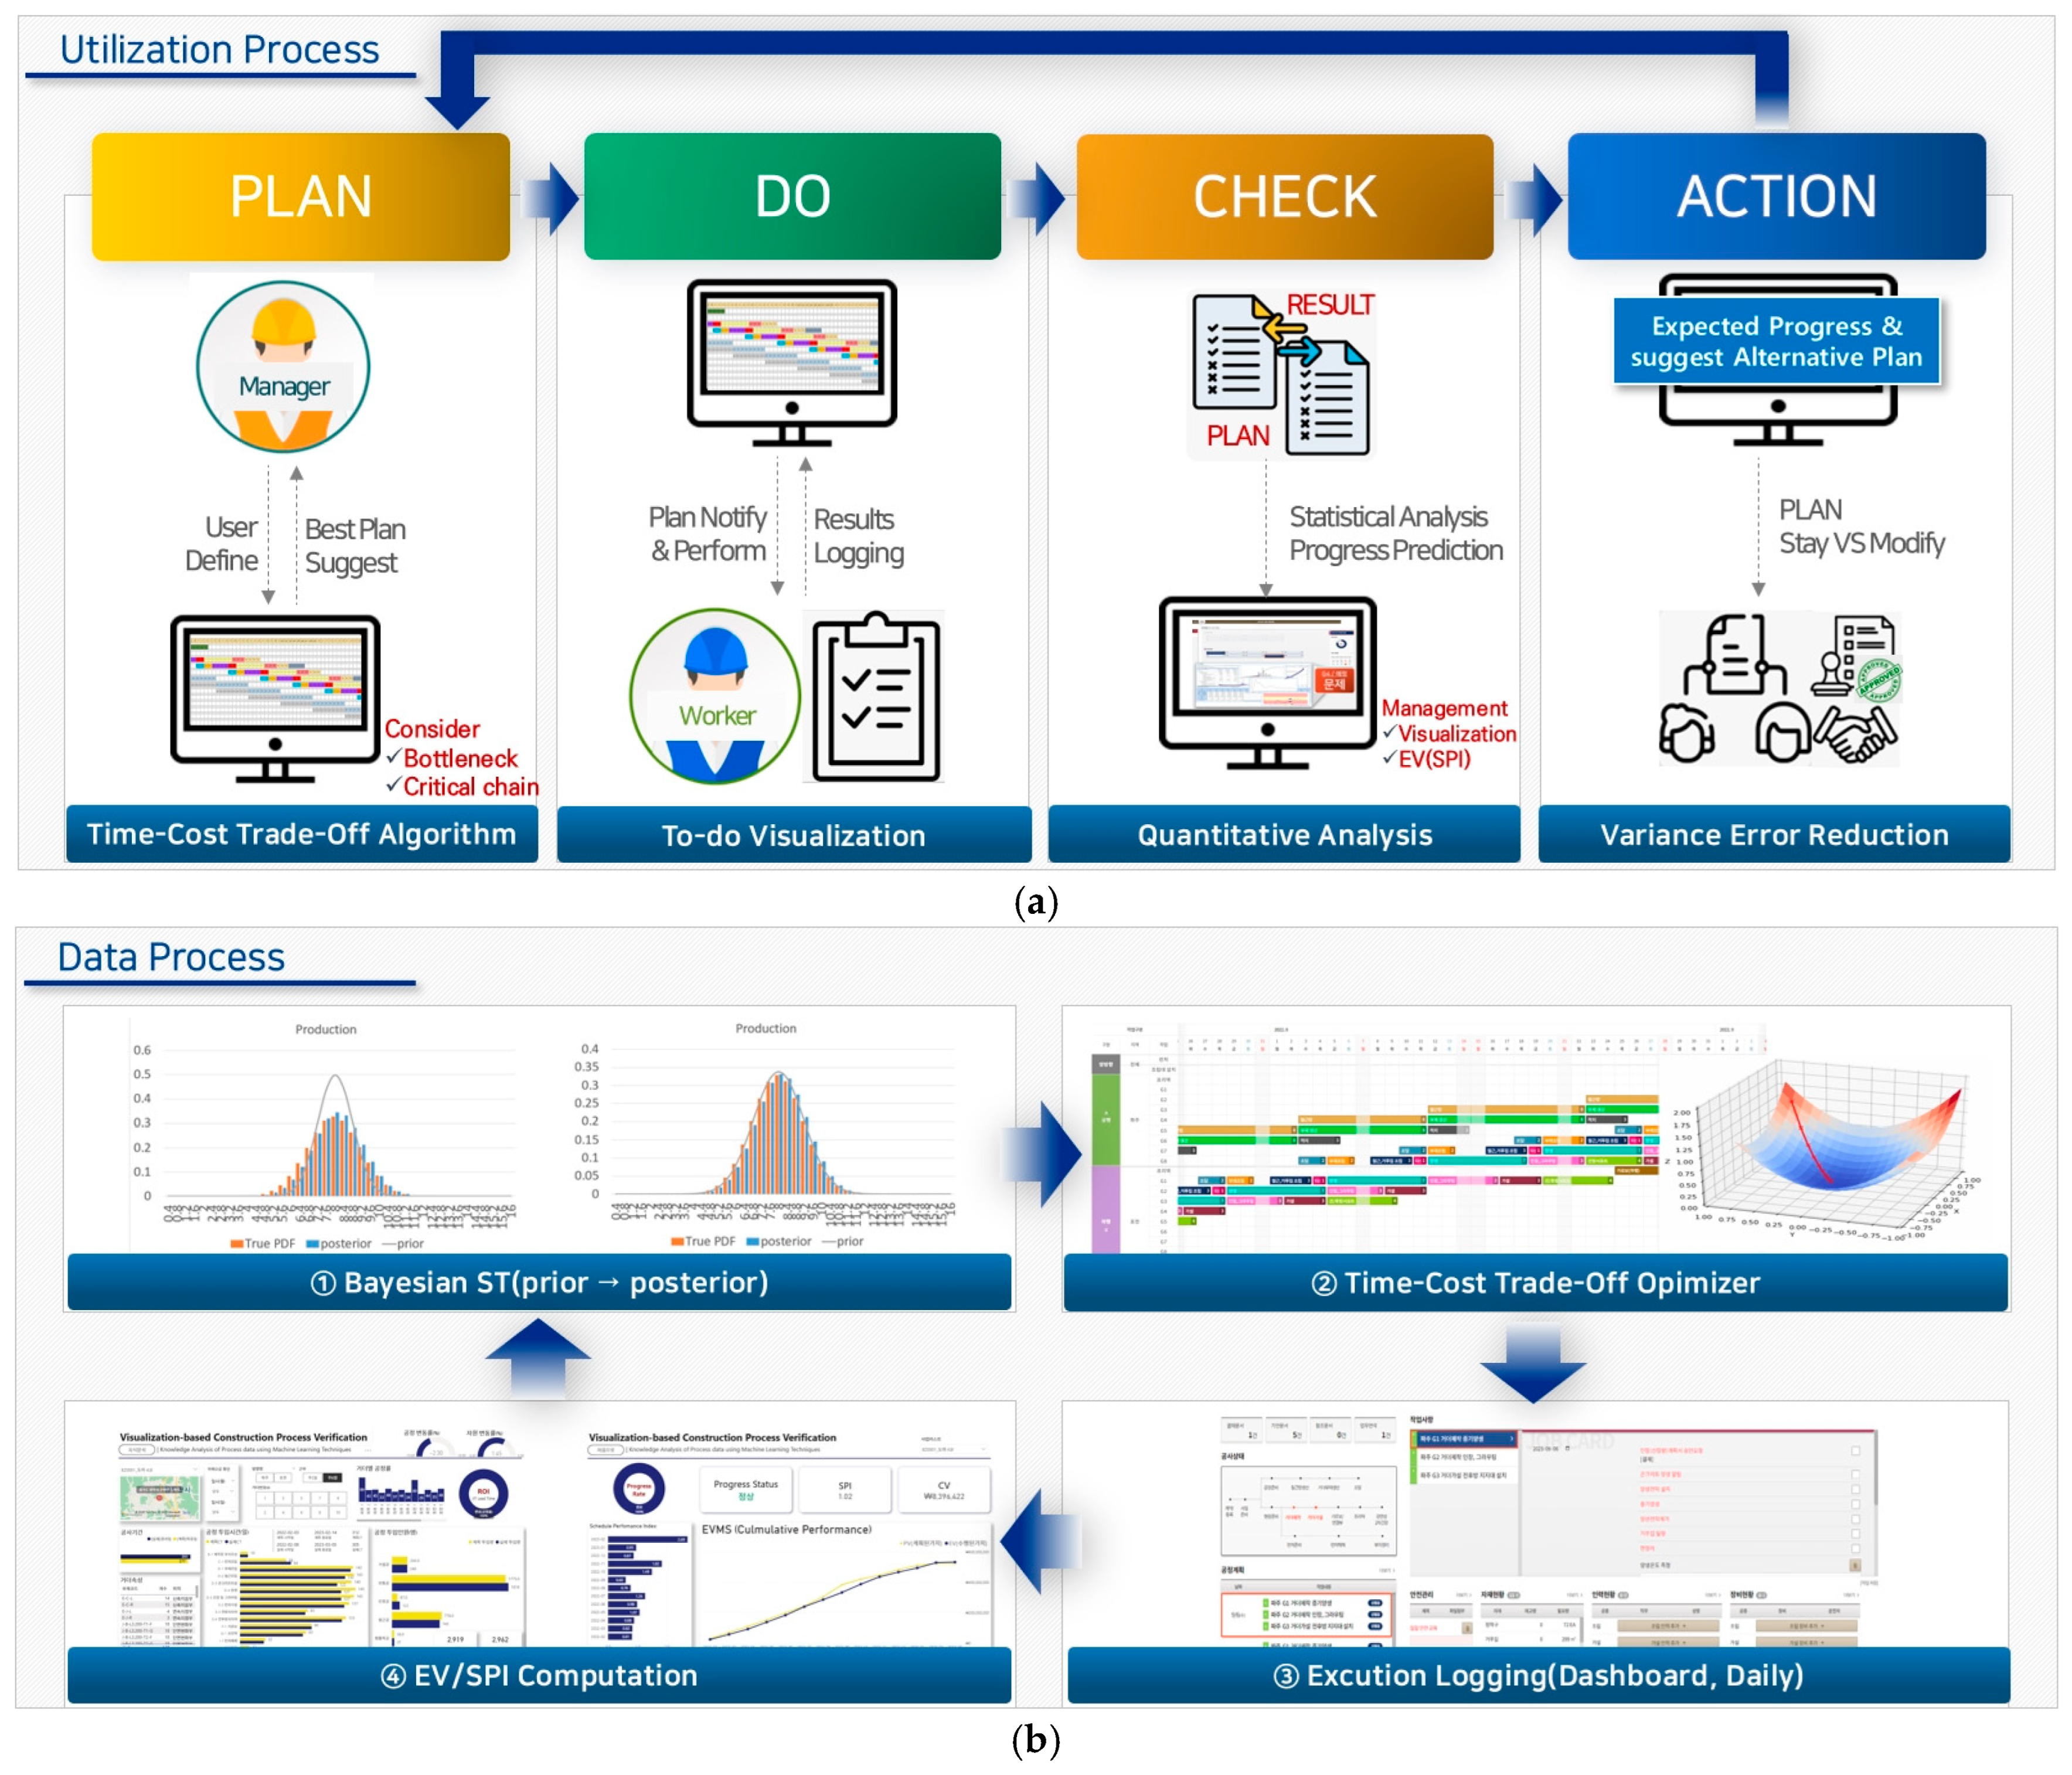
This study proposes a closed-loop management framework that integrates scheduling, execution, performance evaluation, and updating into a single data pipeline. As illustrated in Figure 2, the framework is structured around the PDCA (Plan–Do–Check–Action) cycle.
  • Plan phase: A project schedule is generated using the TCTO (Time–Cost Trade-Off) algorithm, with Bayesian regression-based ST estimates serving as key inputs. This ensures that the schedule accounts for resource constraints while satisfying target duration and cost conditions.
  • Do phase: The schedule is communicated to site workers, and task execution is digitally recorded through a task visualization interface, enabling systematic logging of actual progress.
  • Check phase: Logged data are transformed into Earned Value Management (EVM) metrics, such as Planned Value (PV) and Earned Value (EV), to calculate performance indicators including the Schedule Performance Index (SPI). This enables quantitative analysis of deviations between planned and actual progress.
  • Action phase: Based on the performance analysis, corrective measures and alternative plans are proposed, feeding into the next planning cycle to minimize deviations and improve alignment between plan and execution.
This PDCA-based closed-loop framework functions as a self-correcting management system that gradually enhances prediction accuracy in repetitive prefabricated bridge projects, thereby reducing discrepancies between planned schedules and actual performance.

2.2. Standardizing Key Construction Processes and Data

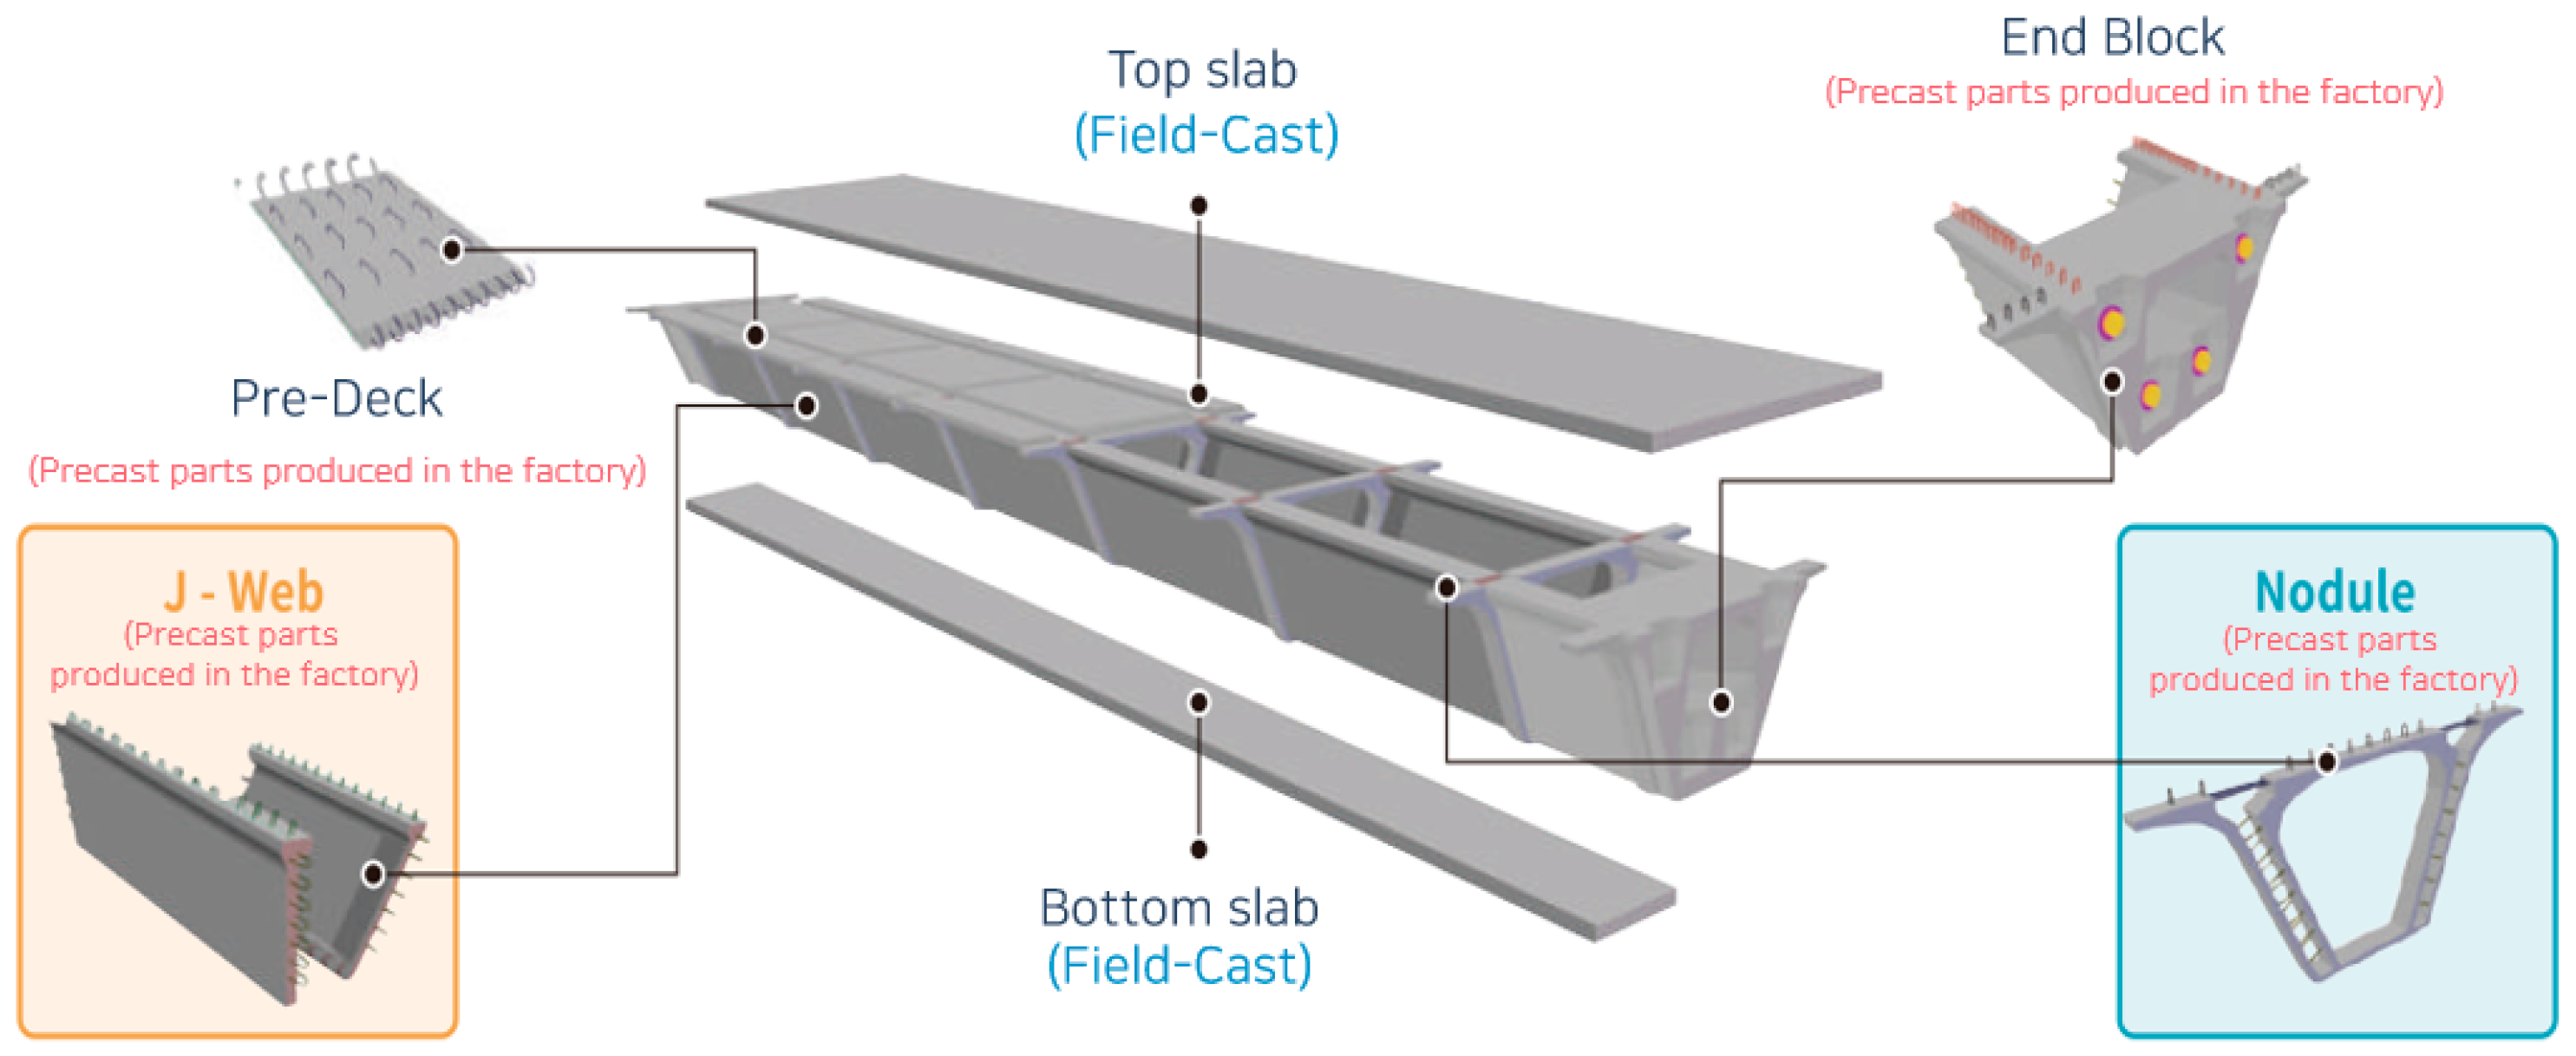
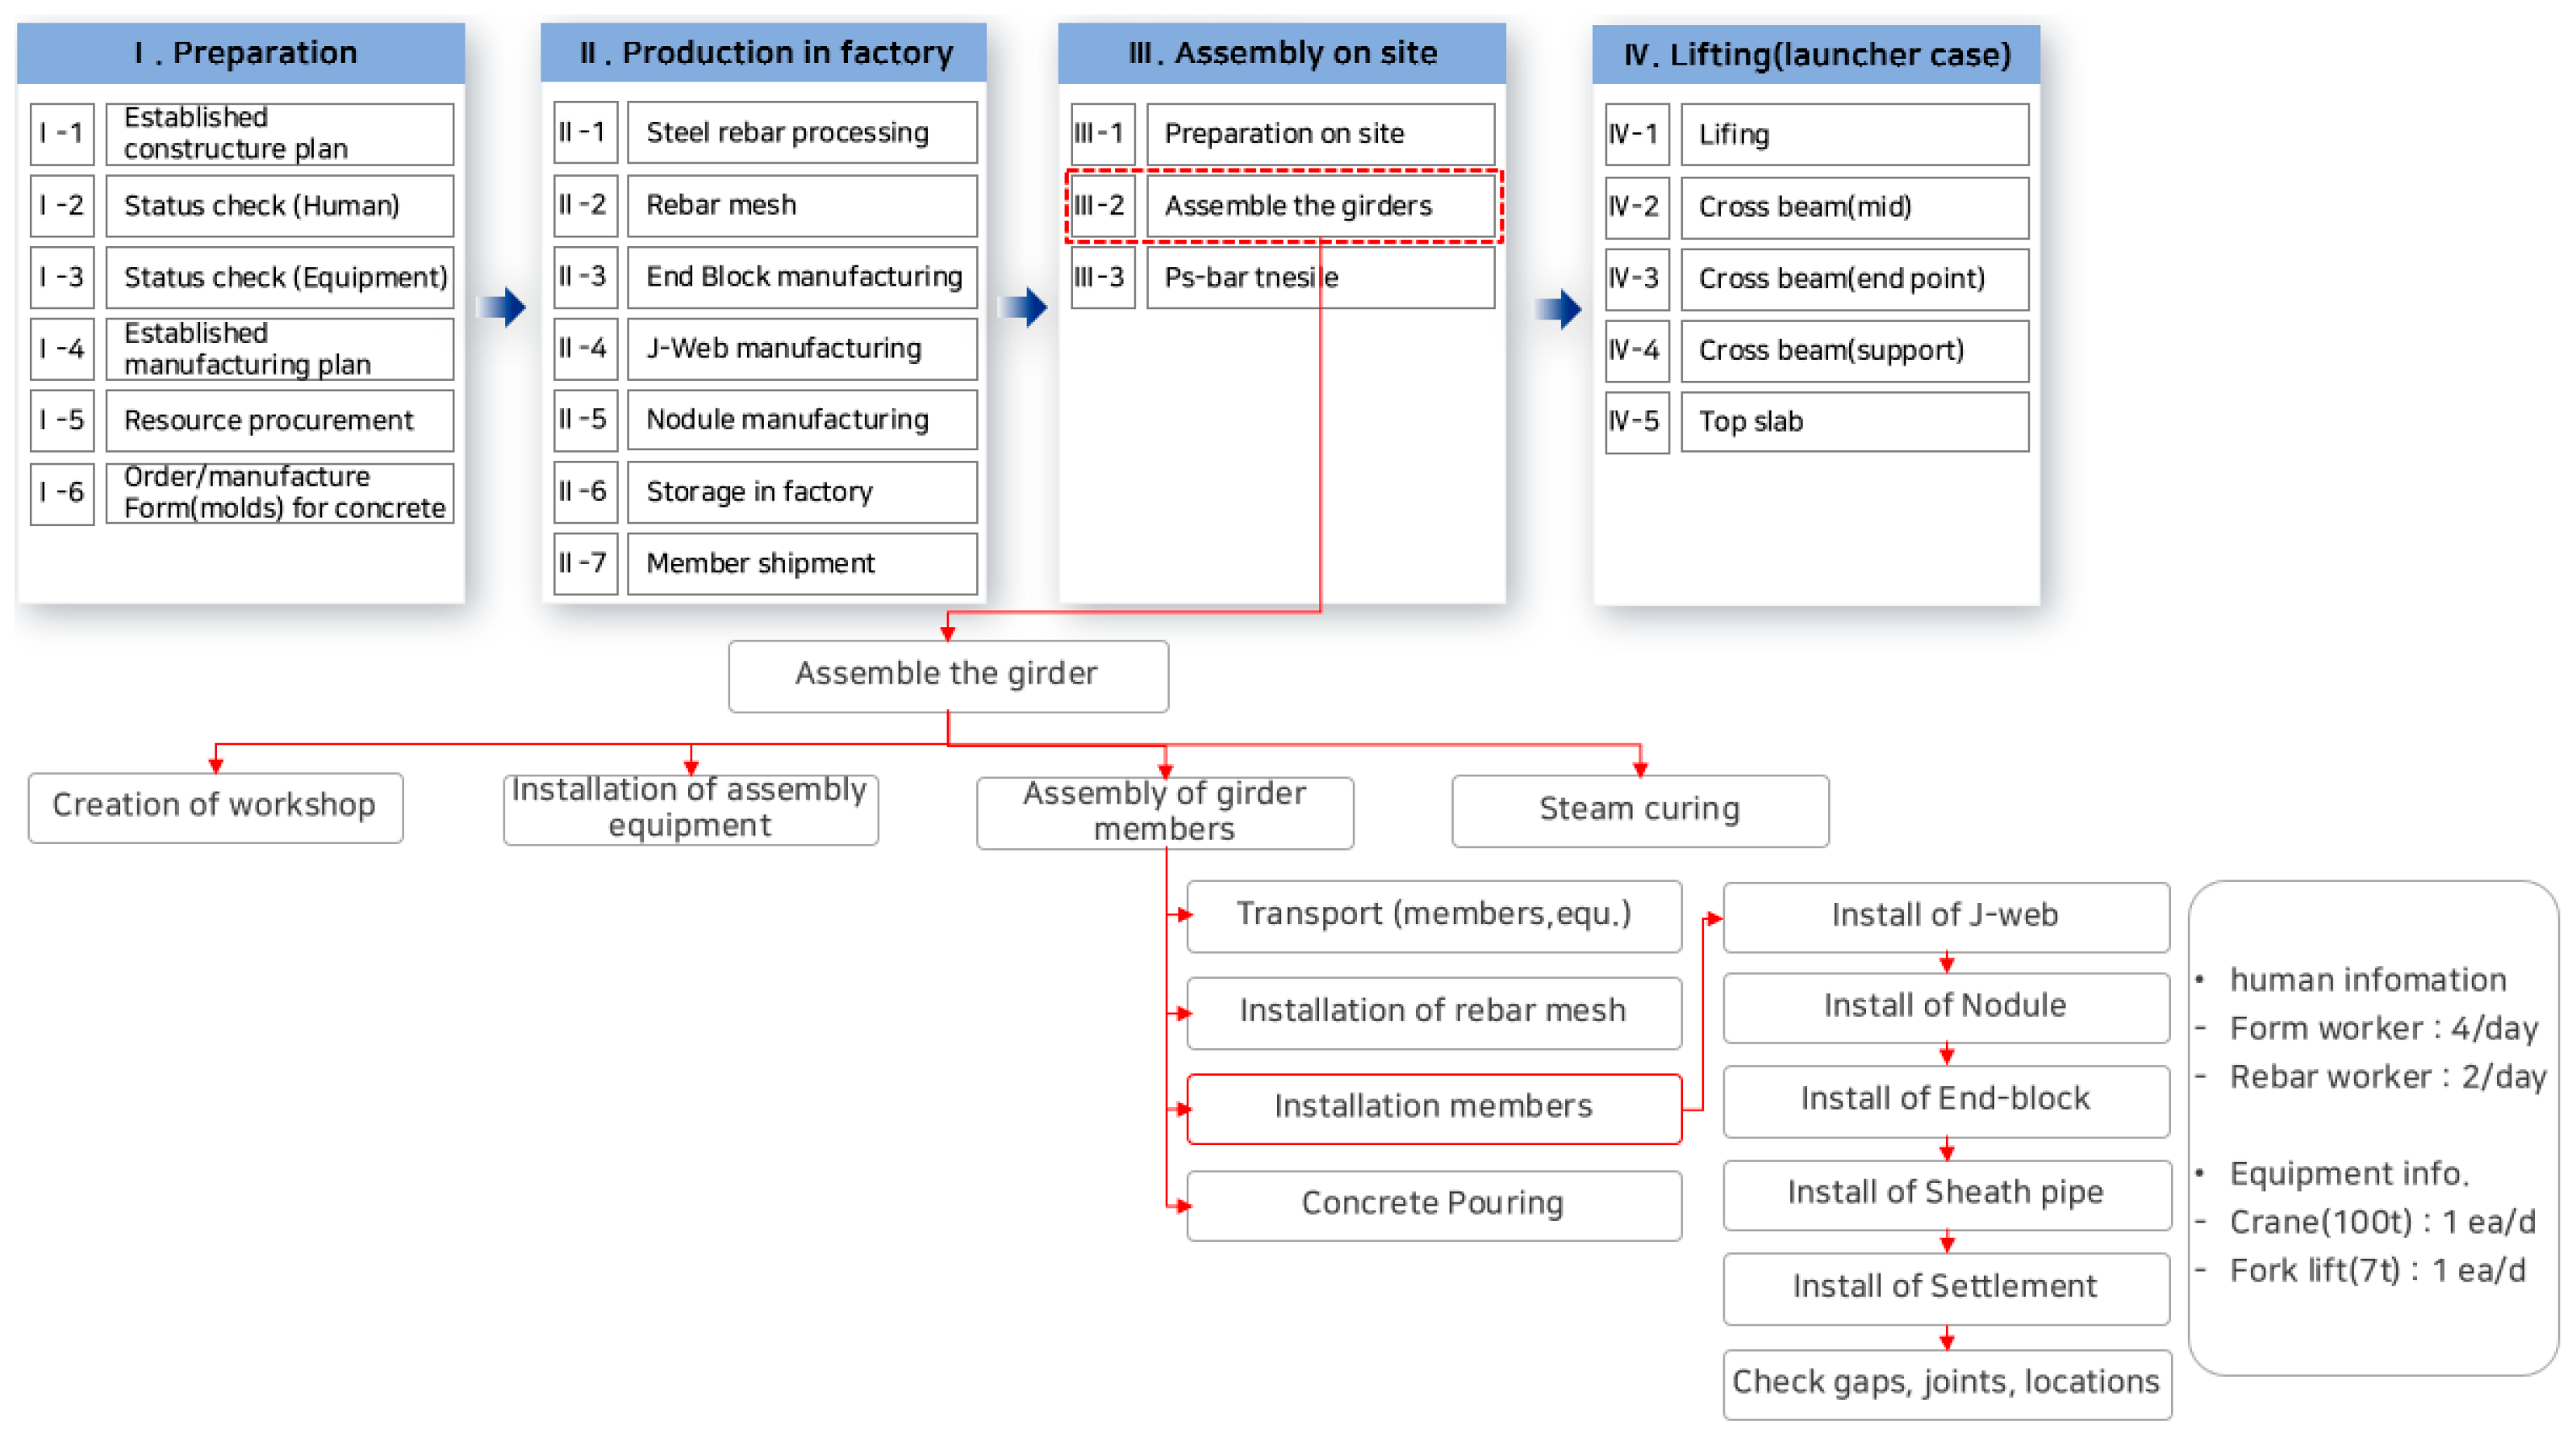
This study focuses on the superstructure works of prefabricated bridges, specifically the erection of Nodular girder (as shown in Figure 3). These works are repetitive in nature and involve spatially separated stages of production, transport, and installation. To enable data-driven scheduling, the entire nodular girder workflow was systematically segmented, reorganized, and formalized into standardized tasks.
Figure 4 illustrates the segmented construction process, in which the overall workflow from preparation to completion was divided into elemental units through field observation and project case analysis. This segmentation highlights the repetitive structure of nodular girder erection. Building on this, Figure 5 presents the standardized workflow that integrates three levels of representation [38]. First, the segmented tasks were structured into a procedural flow chart to clarify their interdependencies. Second, the process was decomposed into unit activities. Third, each activity was assigned specific labor and equipment requirements to establish detailed resource–time allocations.

2.3. Bayesian Regression-Based Estimation of Standard Time (ST)

ST represents the expected task duration under defined resource conditions. In this study, it is formulated within a Bayesian linear regression framework. Unlike deterministic approaches, Bayesian regression incorporates prior knowledge and updates it with observed data to yield posterior distributions of model parameters.
The fundamental formulation is presented in Equation (1):
p θ D = L D θ p θ p D
where p ( θ ) is the prior distribution of parameters, L D θ is the likelihood of observing the data D given parameters θ , and p θ D is the posterior distribution that combines prior beliefs with empirical evidence [39,40]. For each task i , the duration y i is modeled as a function of explanatory variables such as work quantity, number of girders, and crew size. The regression form is given in Equation (2):
y i = β 0 + β 1 x i 1 + β 2 x i 2 + + ε i   ,             ε i   ~   N ( 0 , σ 2 )
where
  • y i : average task duration for project i
  • x i j : explanatory variables (e.g., number of girders, crew size, and other resources);
  • β 0 : intercept term, representing the baseline task duration when all explanatory variables are zero;
  • β j : regression coefficients estimated via Bayesian inference.
  • ε i : normally distributed error term with variance σ 2 .
The posterior distribution of β provides not only point estimates of task durations but also credible intervals, which quantify the uncertainty in ST estimation. As new project data are collected, the posterior is recursively updated, narrowing the credible intervals and improving predictive accuracy.
Importantly, the estimated ST function d j ( x j ) derived from Bayesian regression is nonlinear with respect to resource inputs. This contrasts with the conventional assumption of linear resource–duration trade-offs in traditional TCTO. By capturing diminishing returns and variability in crew performance, the Bayesian-derived ST curve better reflects actual site behavior.
The output of Equation (2) is directly embedded into the TCTO optimization module as the task duration function d j ( x j ) . In this way, Bayesian regression serves as a diagnostic layer that generates realistic input functions for prescriptive optimization. This integration allows the overall framework to represent both the stochastic nature of task execution and the nonlinear impact of resource allocation on schedule performance.

2.4. Time–Cost Trade-Off (TCTO) Algorithm with Bayesian ST Integration

ST values estimated through Bayesian regression in Section 2.3 serve as the primary inputs for the optimization module. To generate feasible and efficient schedules, the problem is formulated as a TCTO model, in which task durations are dynamically linked to resource allocations.
The optimization objective is defined in Equation (3) as the minimization of the total resource cost across all tasks [41]:
M i n i m i z e   C = j = 1 n C j ( x j )
where C j ( x j ) denotes the resource cost function of task j , and x j represents the amount of resources allocated to that task.
The model is subject to schedule and resource constraints, expressed in Equation (4):
j = 1 n d j ( x j ) D t a r g e t   ,           x j m i n x j x j m a x
Here, x j denotes the duration of task j estimated from the Bayesian regression model, which varies according to the allocated resources. D t a r g e t represents the project deadline, while x j m i n and x j m a x are the lower and upper bounds of resource allocation, respectively.
The optimization algorithm iteratively adjusts resource allocations within these bounds and evaluates the resulting schedule through simulation. When the allocated resources increase, task durations d j ( x j ) generally decrease, and this effect propagates through the precedence network to update the entire schedule. Among the feasible solutions, the algorithm selects the scenario that satisfies the project deadline with the minimum total resource cost. In addition, the algorithm evaluates potential bottlenecks within task groups and adjusts allocations to maintain synchronization across repetitive cycles of prefabricated girder erection. This ensures that probabilistic Standard Time estimates obtained from Bayesian regression are seamlessly incorporated into the TCTO optimization process, thereby producing balanced and resource-efficient schedules that comply with project constraints.
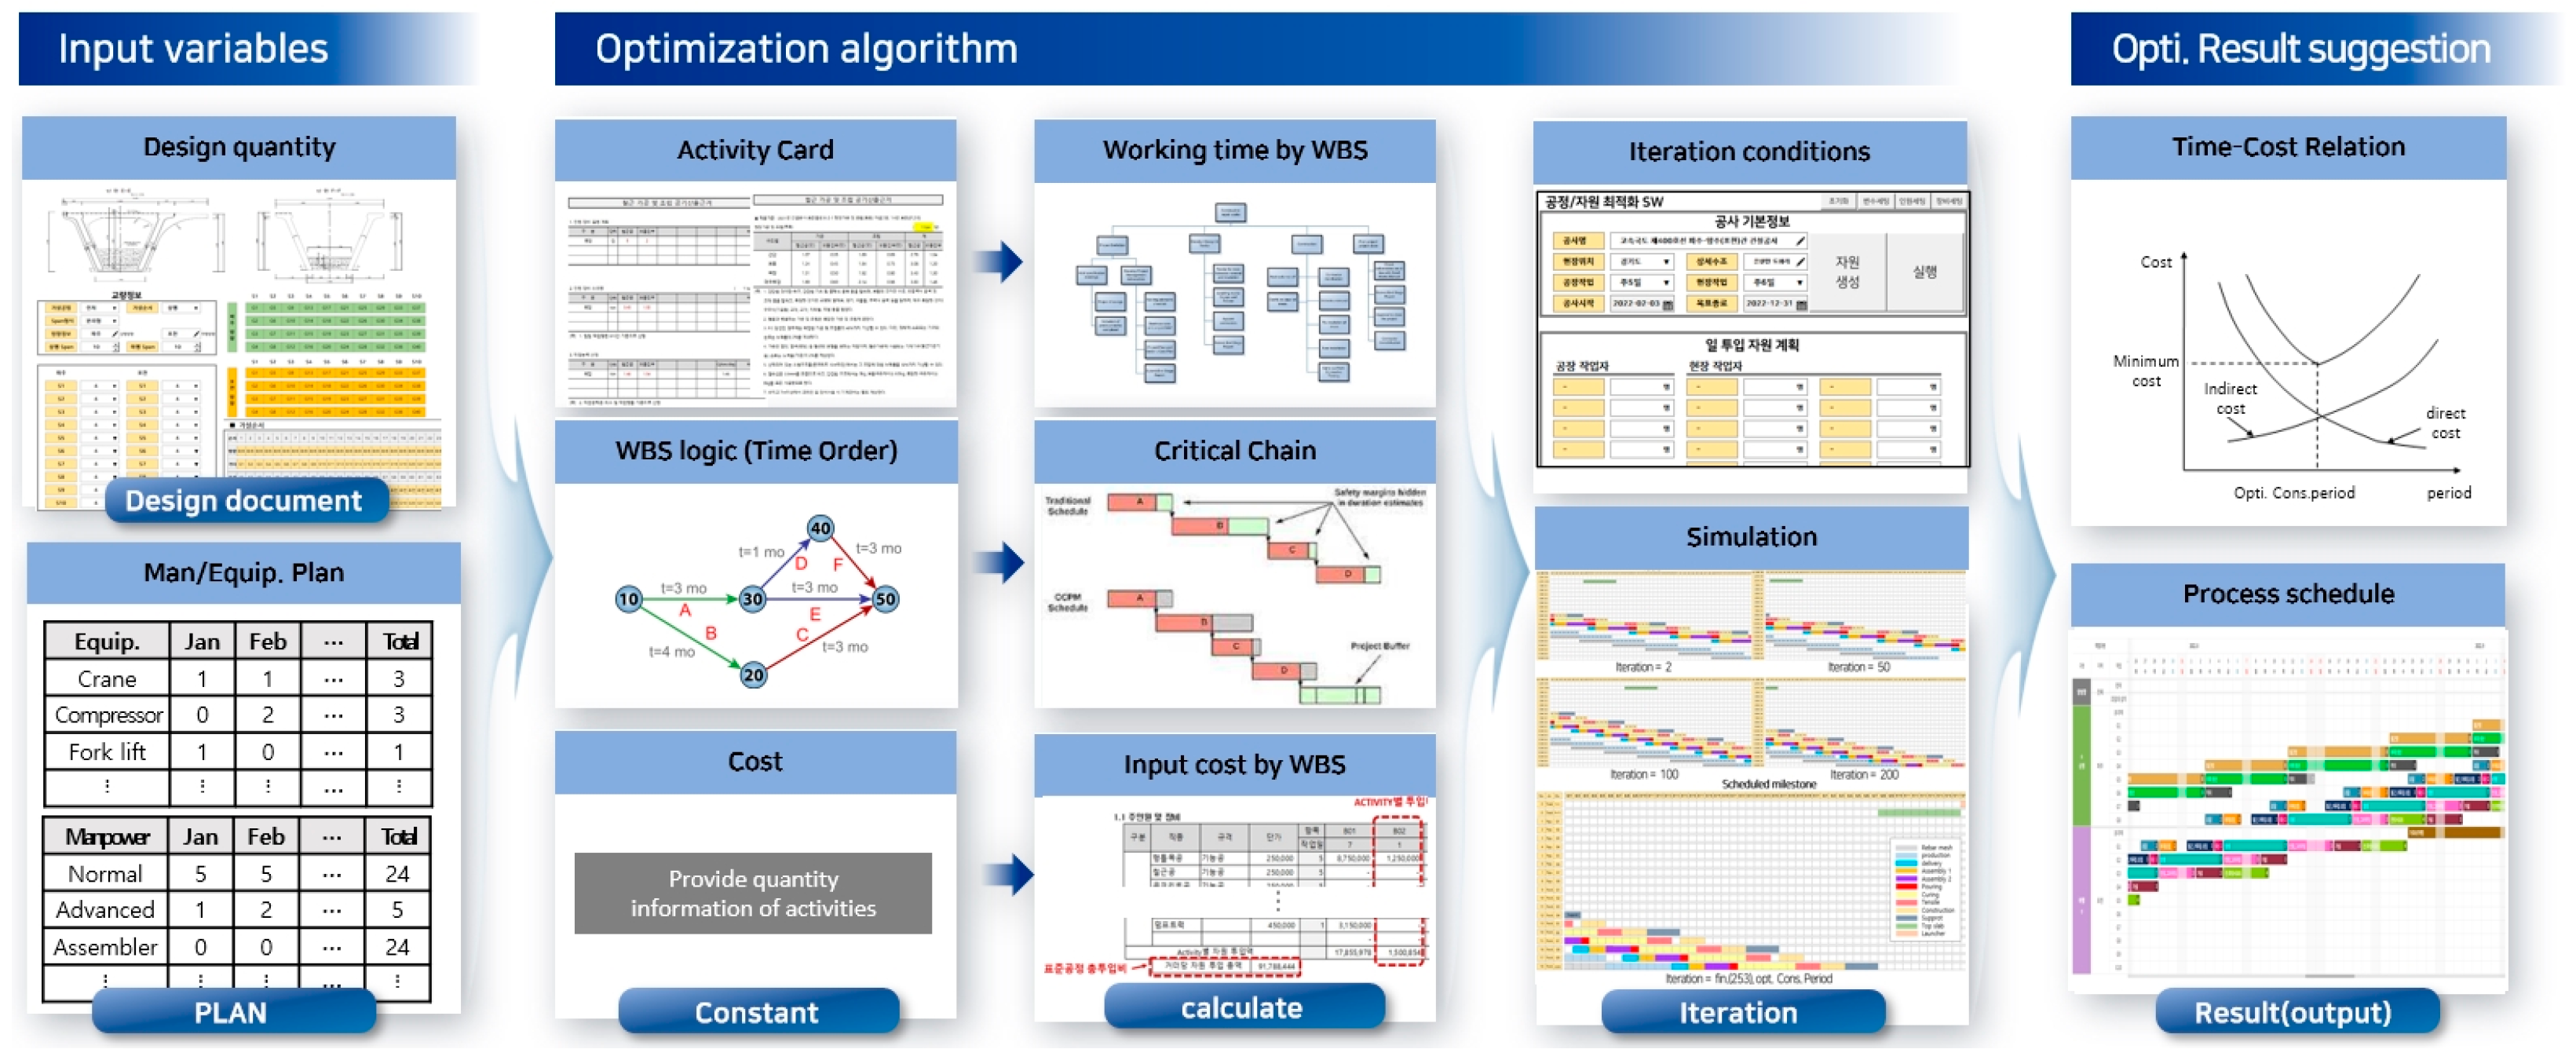
The overall design flow of the optimization algorithm is illustrated in Figure 6. The framework consists of three major stages. First, input variables such as design documents, work quantities, and manpower/equipment plans are collected. Second, the optimization procedure is executed through activity cards, WBS logic, critical chain analysis, and iterative simulation, in which resource allocations are adjusted under predefined conditions. Third, the results are produced in terms of time–cost relationships and optimized process schedules. This flow ensures that probabilistic Standard Time values derived from Bayesian regression are directly incorporated into the TCTO optimization framework, enabling resource-efficient schedules that satisfy project deadlines.

2.5. Object-Based Logging and SPI Performance Analysis

During the execution phase, BIM-based objects are defined as the primary management units, and actual performance data are recorded and analyzed daily against the planned schedule. This approach enables detailed tracking of work progress and resource usage at the component level, ensuring consistency across planning, execution, and performance evaluation.
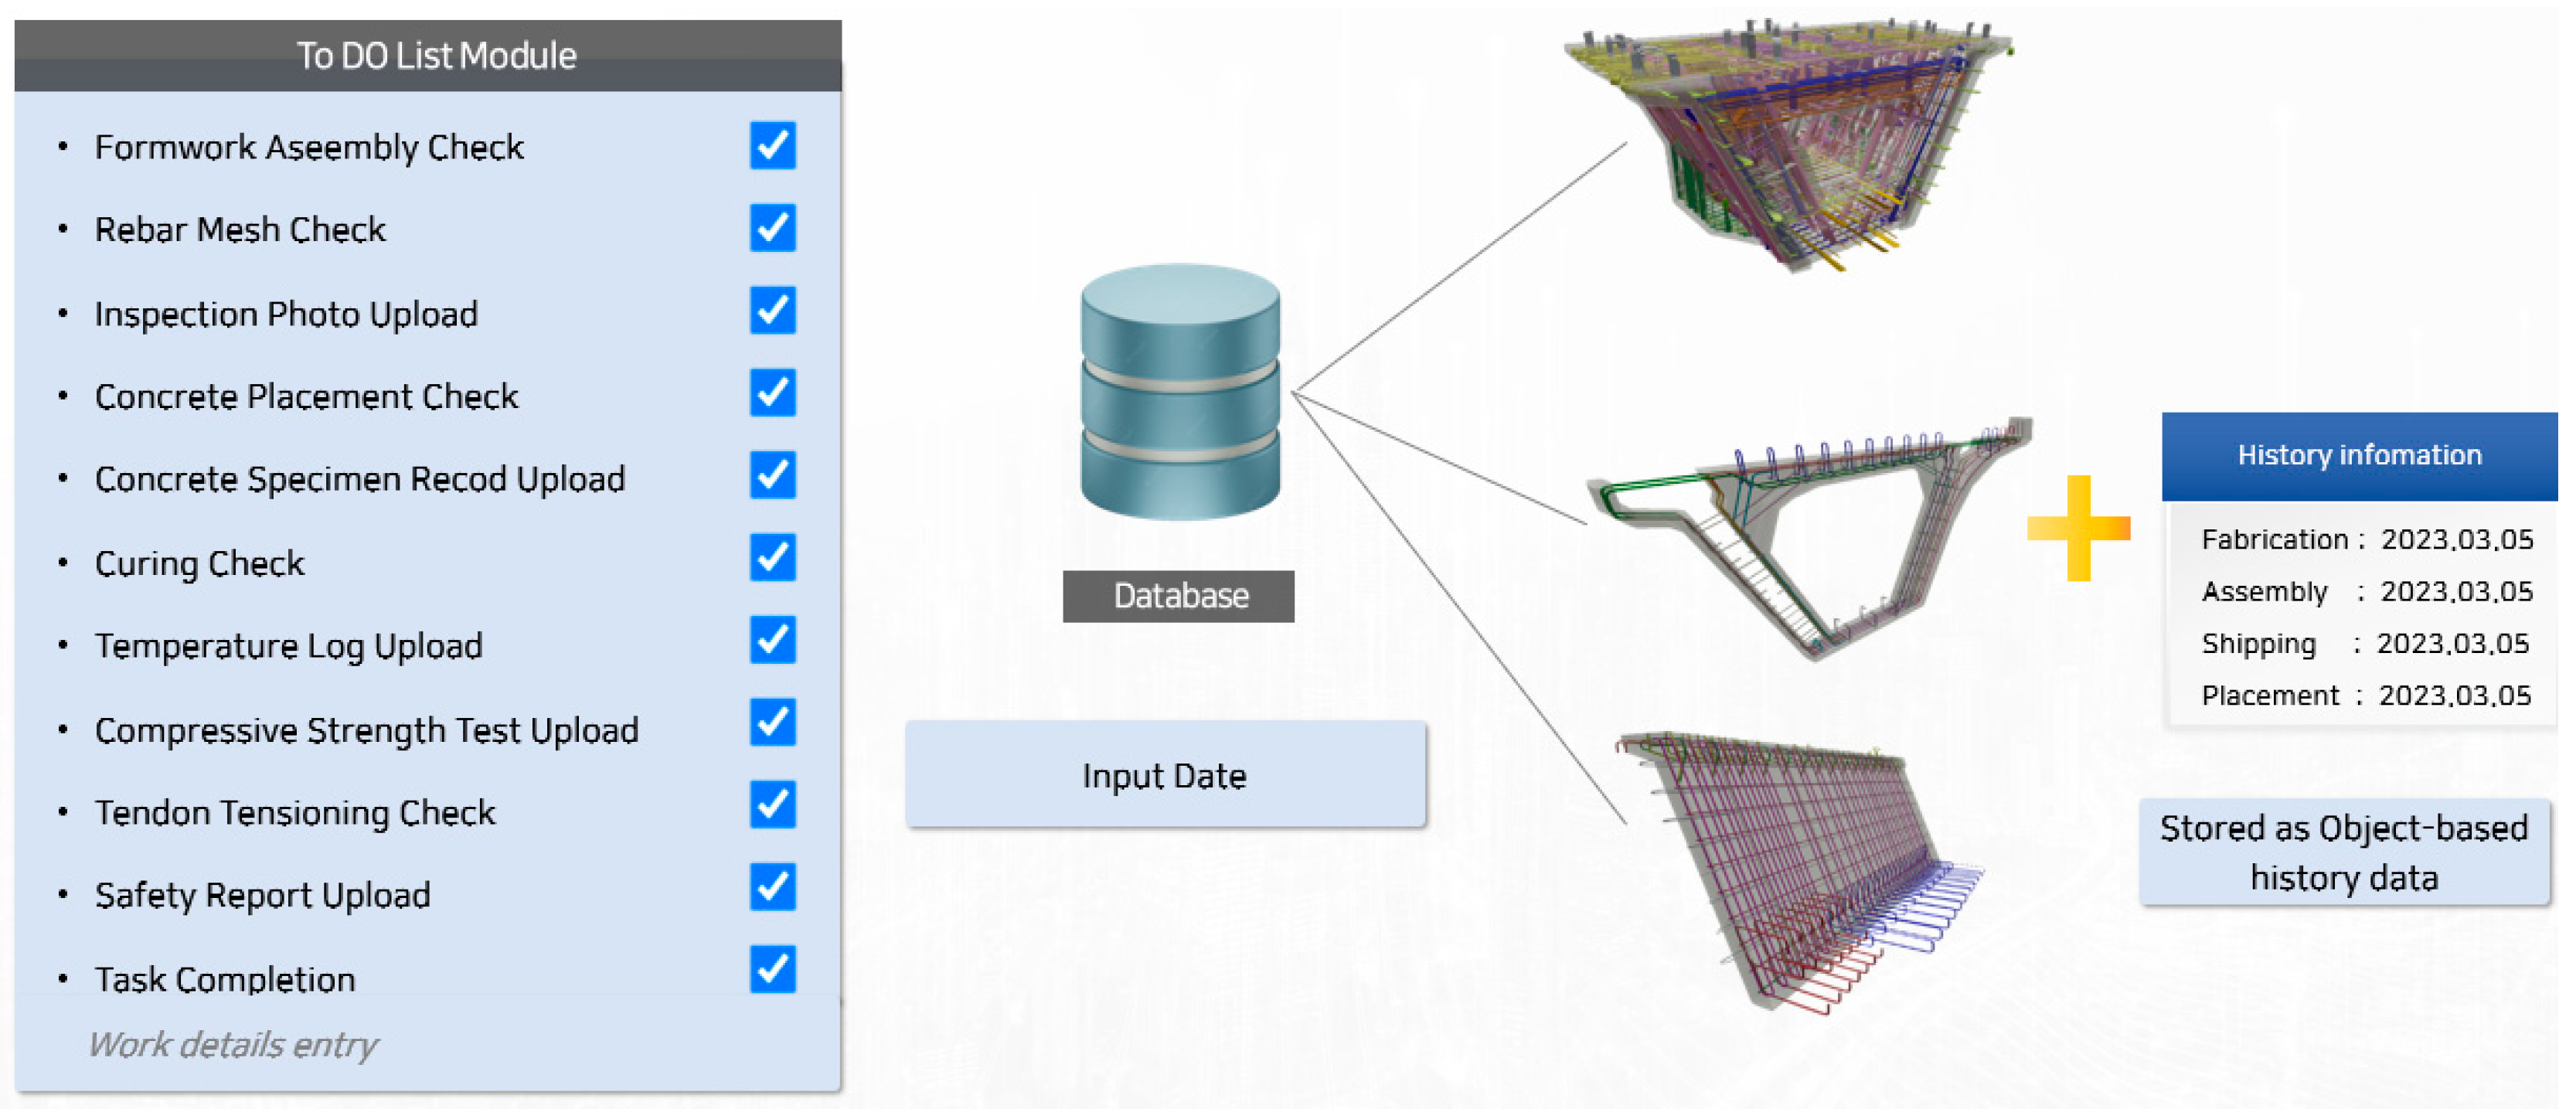
Figure 7 illustrates the digital logging system, where site workers record the completion status of planned tasks and input daily resource usage such as labor and equipment. The collected data are immediately uploaded to a central management system and accumulated for subsequent use in performance evaluation.
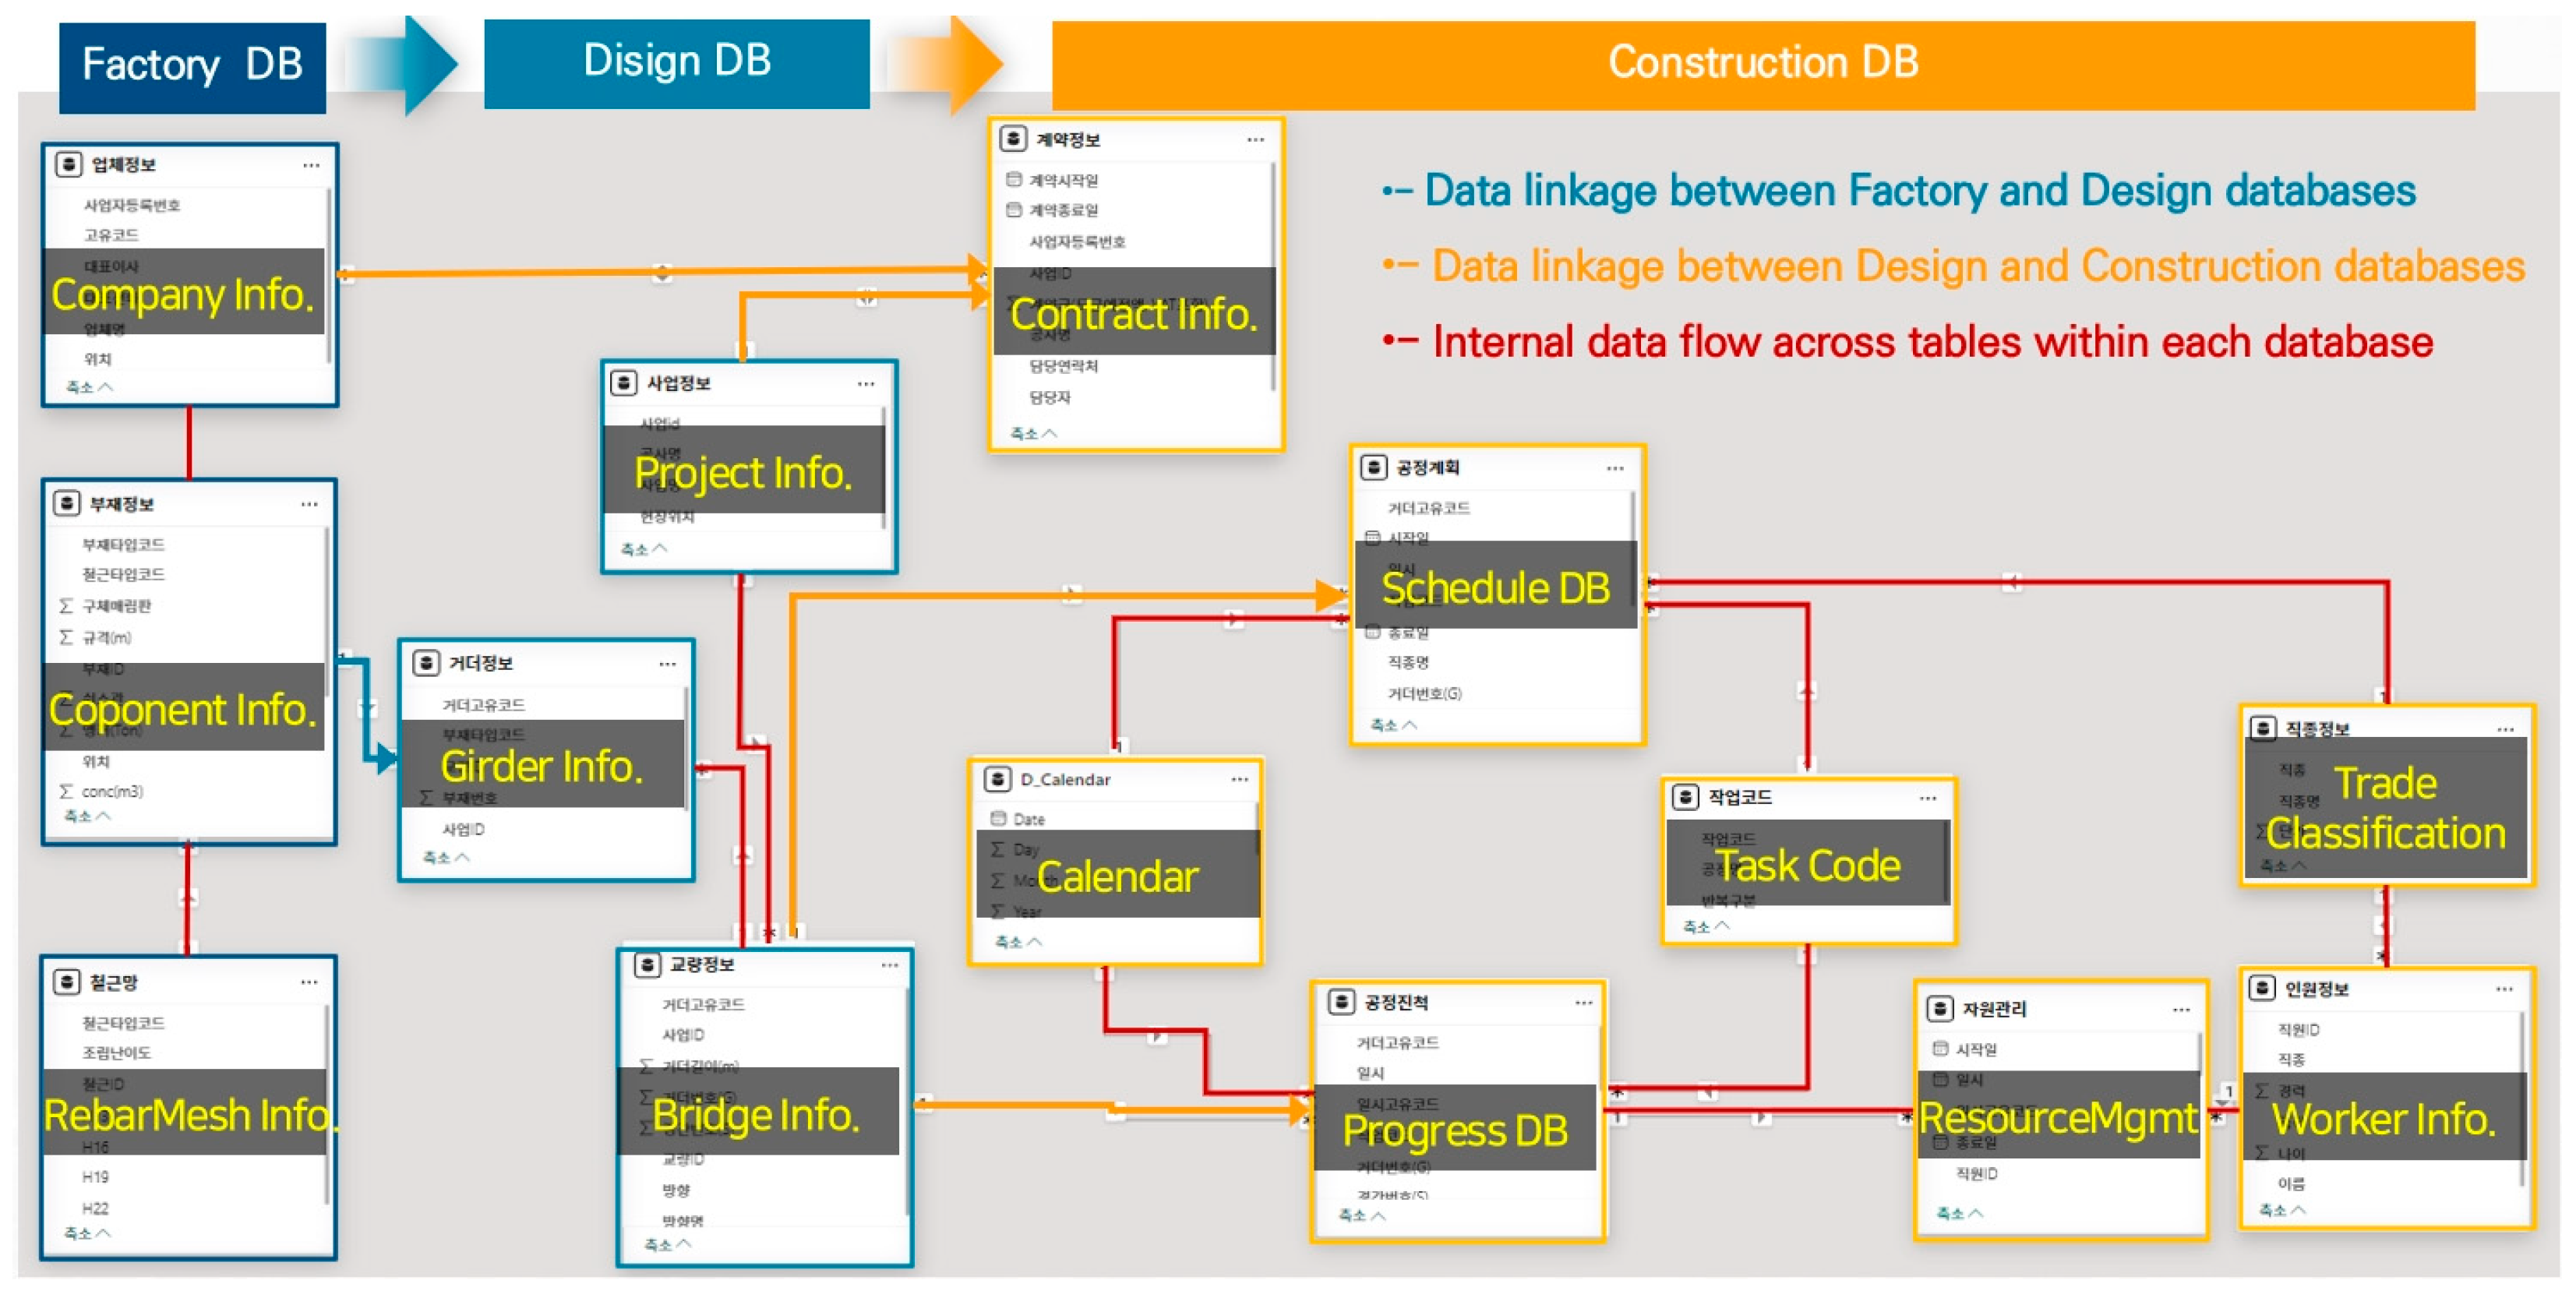
Figure 8 presents the structure of object-level history management. Each component integrates performance records across the entire process—production, transport, assembly, and erection—along with supplementary documents such as quality reports, safety checklists, and approval records. This integrated object-level data storage ensures full traceability of construction activities and provides reliable information for both performance analysis and plan updating.
Performance evaluation is conducted using the Earned Value Management System (EVMS) framework. Planned Value ( P V ) and Earned Value ( E V ) are calculated, and the Schedule Performance Index ( S P I ) is derived as shown in Equation (5):
S P I = E V P V
However, Actual Cost ( A C ) is excluded from this study. The A C concept, originally defined by the U.S. Department of Defense (DoD), incorporates institutional and non-quantitative elements that are not compatible with the Korean construction industry, where project delivery systems and contract-based settlement structures differ significantly. Although several studies in Korea attempted to introduce AC in the early 2000s, it has rarely been applied in practice, and its institutional feasibility remains low. Therefore, this study focuses on schedule performance analysis using P V and E V only, reflecting the realities of Korean construction projects.
Through this approach, project owners can detect schedule deviations at the structural component level, while contractors can quantitatively monitor the workflow of repetitive prefabricated operations. SPI-based analysis provides a simple yet effective diagnosis of discrepancies between planned and actual progress, and the accumulated data are fed back into the Bayesian inference module to enhance the accuracy of Standard Time estimation.

2.6. Bayesian Updating and Self-Correcting Mechanism

The SPI results derived from performance analysis and the object-level logging data are fed back into the Bayesian inference module to continuously update the estimation of Standard Time (ST). Whenever new performance data are incorporated, the prior distribution of the regression coefficients is updated to a posterior distribution, leading to adjustments in the mean and variance of ST. Through this process, the credible interval of the estimation gradually narrows, and the accuracy of ST used in subsequent scheduling is progressively improved.
This updating process does more than enhance the accuracy of individual task predictions. In the highly repetitive environment of prefabricated bridge construction, it functions as a self-correcting mechanism. As datasets of similar task types accumulate, learning effects are captured, and the discrepancies between planning, execution, and performance are reduced over time. Consequently, project owners gain a reliable basis for monitoring schedule deviations at the structural component level, while contractors benefit from improved resource efficiency and strengthened risk management.
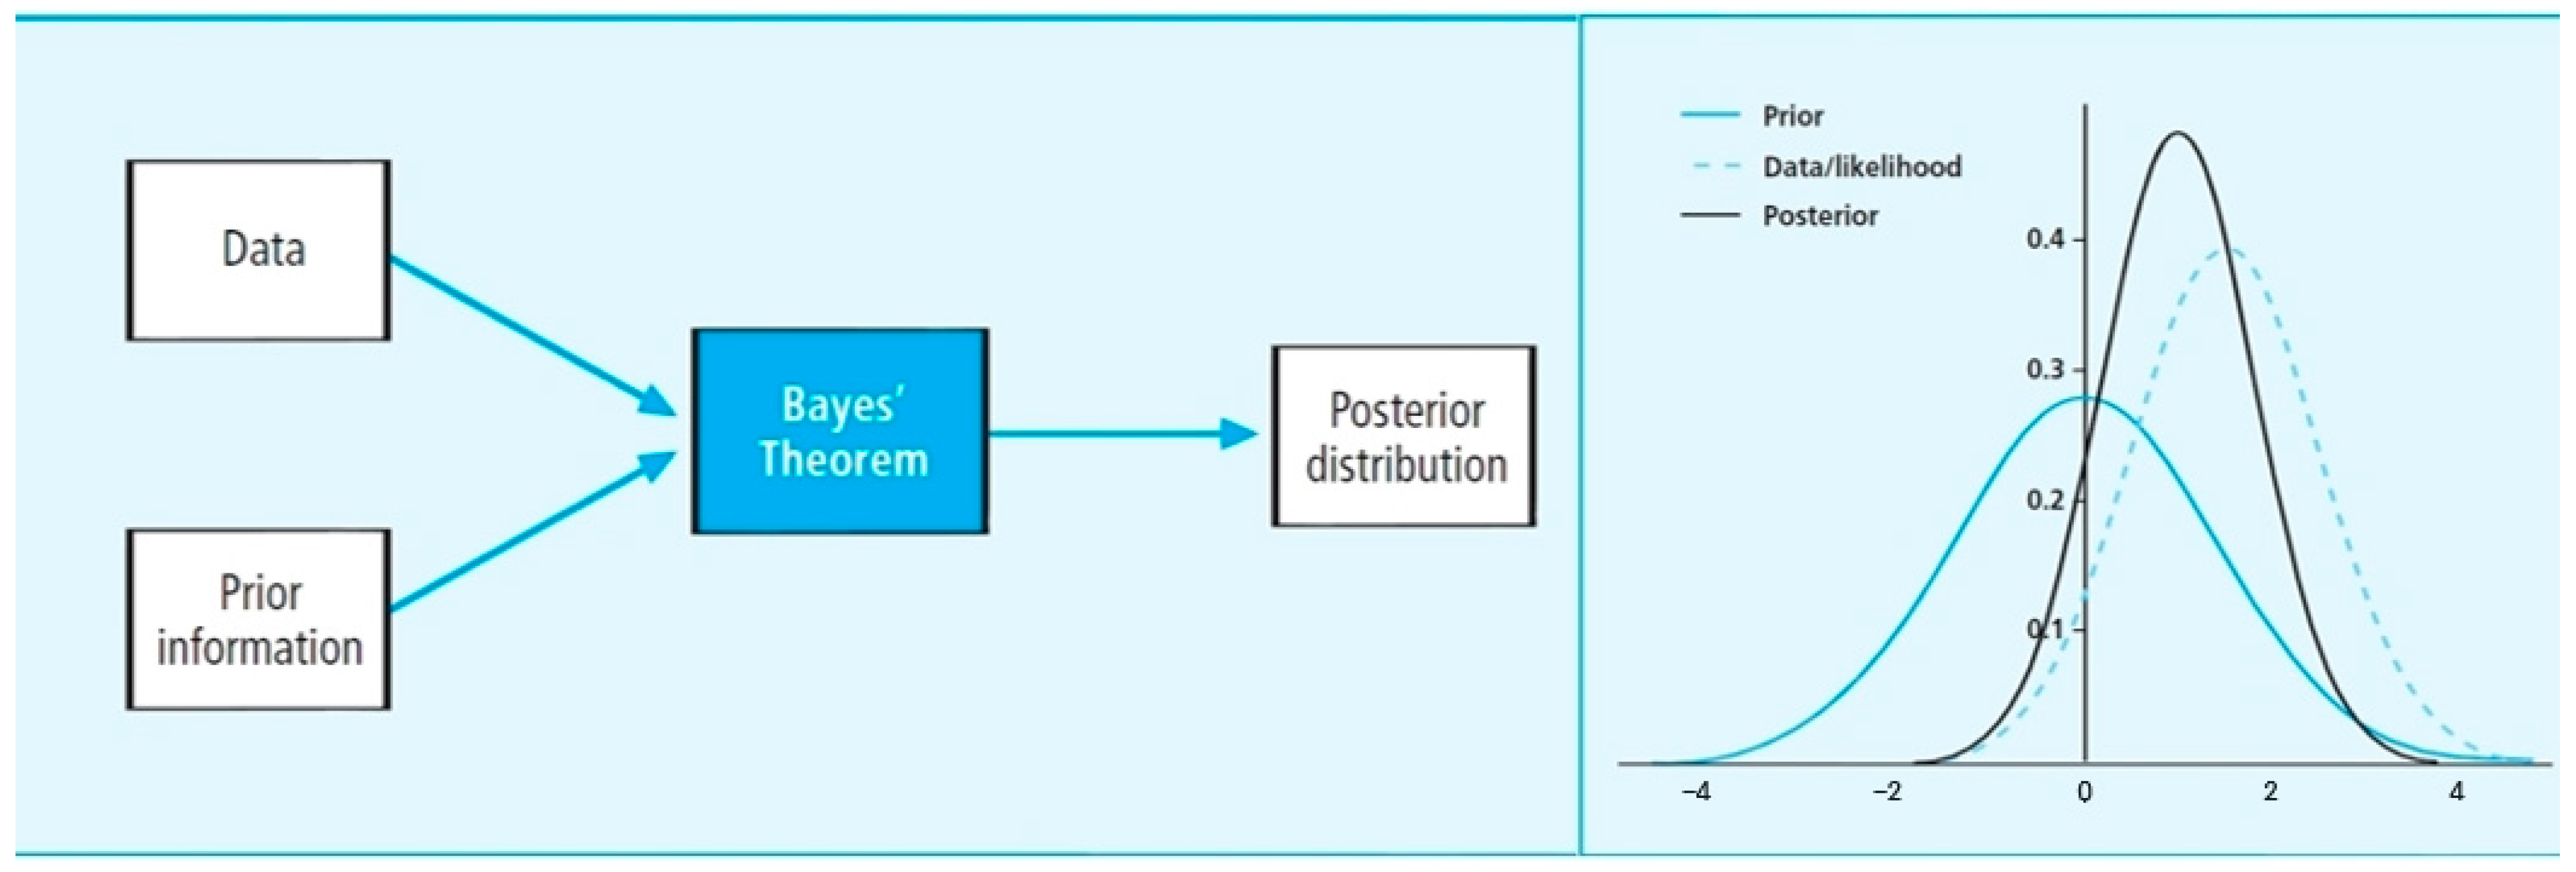
Figure 9 illustrates the Bayesian updating process, where prior information and observed data are combined through Bayes’ theorem to yield a posterior distribution. The figure also highlights how the posterior distribution becomes narrower compared to the prior, reflecting improved precision as project data accumulate.

3. Application and Validation of the Proposed Framework

3.1. Construction Object-Oriented Information Classification System

The proposed closed-loop framework was applied and validated through a three-stage process. First, empirical data from six prefabricated bridge girder projects were used to establish Bayesian regression equations for ST estimation. Second, four independent projects were employed to comparatively verify the predictive accuracy of the regression-based ST when embedded into the Time–Cost Trade-Off (TCTO) optimization algorithm. Third, the framework was integrated into a Smart Delivery System for site-level application, where object-based logging and schedule monitoring were tested in a real prefabricated bridge project (Doha 4 Bridge). This multi-stage approach ensured that the framework was examined both in terms of model robustness and its practical applicability in construction management systems.

3.2. Training and Verification Data for Bayesian Regression

To establish the regression model, six prefabricated bridge girder projects were used as training data (Table 1). For each project, three key variables were collected: the number of girders, the total manpower input, and the actual construction duration. These datasets represent repetitive yet heterogeneous project environments, thereby providing sufficient variation to capture nonlinear relationships between resource inputs and task durations. The regression model derived from these data served as the baseline standard time (ST) estimation for subsequent optimization.
Table 1 summarizes the training projects, while Table 2 presents four additional projects selected for independent verification. These verification projects were not included in model training and were instead used to validate predictive accuracy when the regression-based ST values were embedded into the TCTO optimization algorithm. By comparing planned and actual outcomes in these projects, the robustness and generalizability of the proposed framework were systematically assessed.

3.3. Information Classification System of Construction Objects

To verify the predictive accuracy of the Bayesian regression-based standard time (ST), the four verification projects listed in Table 2 were employed. For each project, regression-derived ST values were embedded into the Time–Cost Trade-Off (TCTO) optimization algorithm to generate planned schedules. These optimized schedules were then compared against the actual project outcomes in terms of both duration and resource usage.
The evaluation metrics were defined as duration error and resource error, which quantify the deviation between planned and actual values. The equations are expressed as follows:
D = D 1 D 2 D 2
R = R 1 R 2 R 2
where
  • D 1 : Planned schedule duration;
  • D 2 : Actual schedule duration;
  • R 1 : Planned resource usage;
  • R 2 : Actual resource usage.
This procedure provides a systematic means of evaluating the alignment between regression-enhanced TCTO schedules and real-world project execution. The results of this comparative verification are presented in Section 4, where deviations in both duration and resource allocation are quantitatively analyzed.

3.4. Information Classification System of Activities

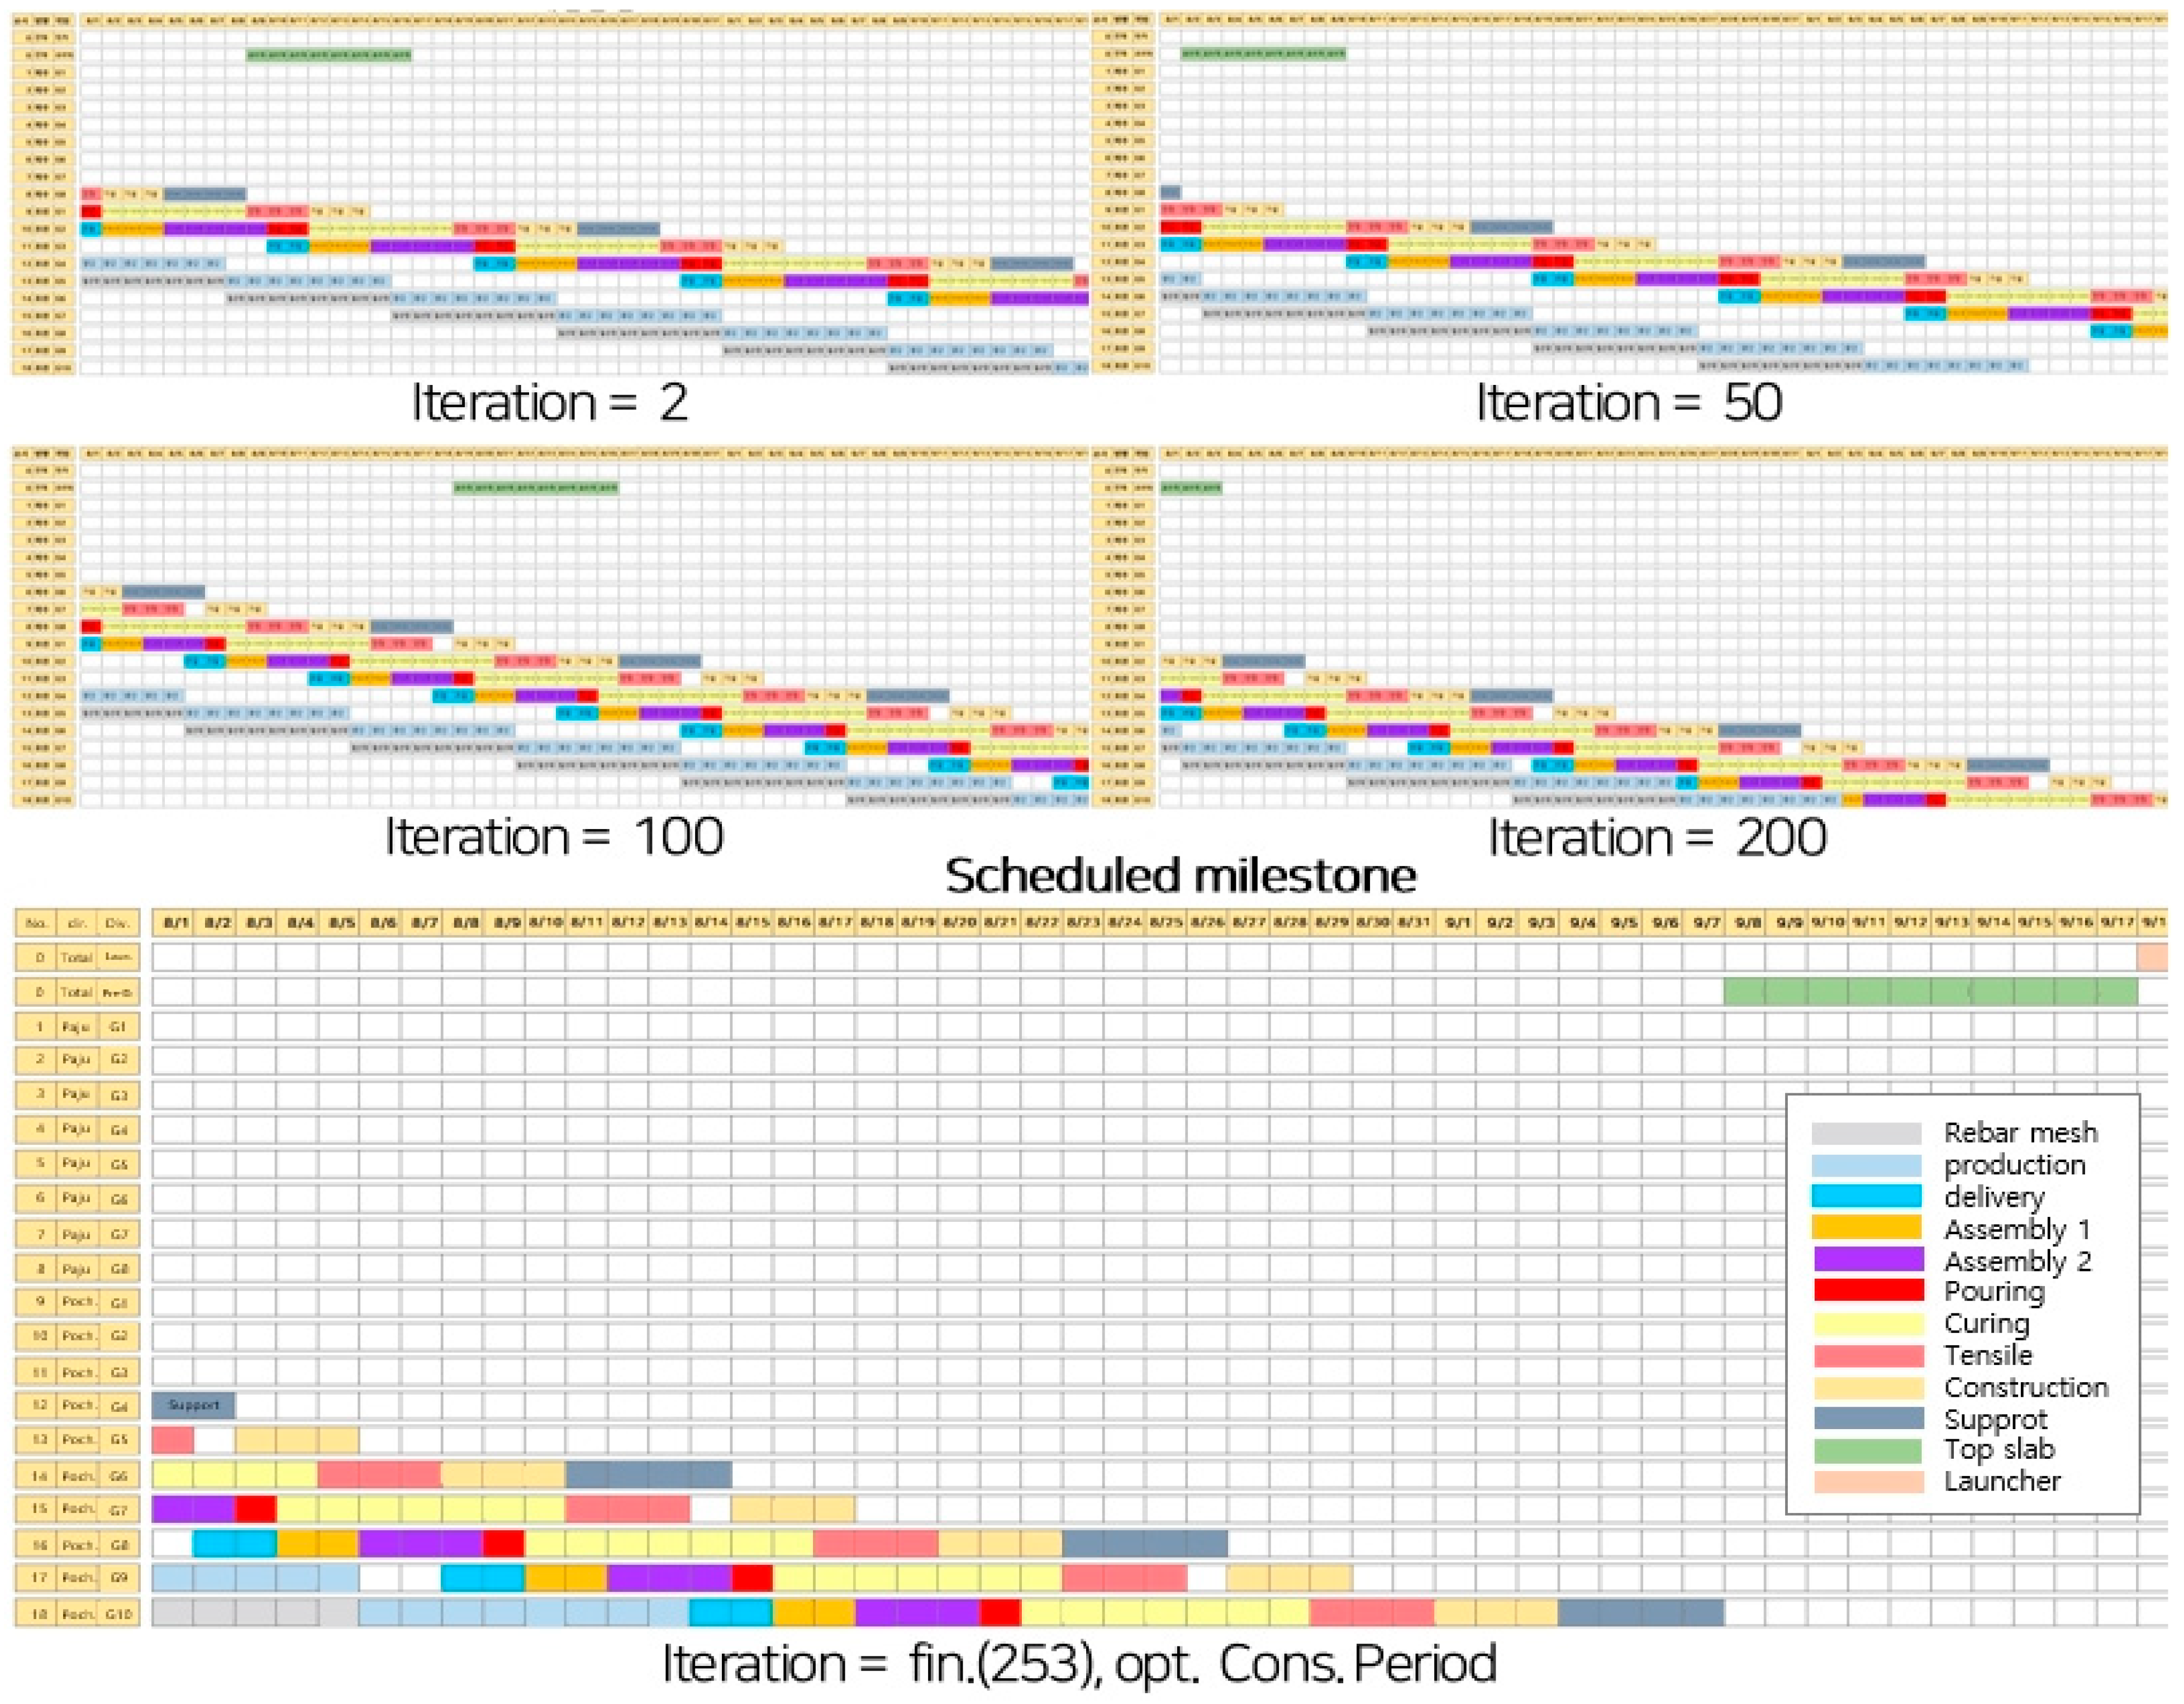
The regression-based standard time (ST) functions were embedded into a Time–Cost Trade-Off (TCTO) optimization algorithm to generate feasible schedules under resource constraints. The algorithm performs iterative simulations, adjusting resource allocations and recalculating task durations until convergence is achieved. As illustrated in Figure 10, the iterative scheduling process begins with initial iterations (e.g., iteration = 2) and progressively stabilizes (e.g., iteration = 253), thereby producing a synchronized and resource-efficient schedule.
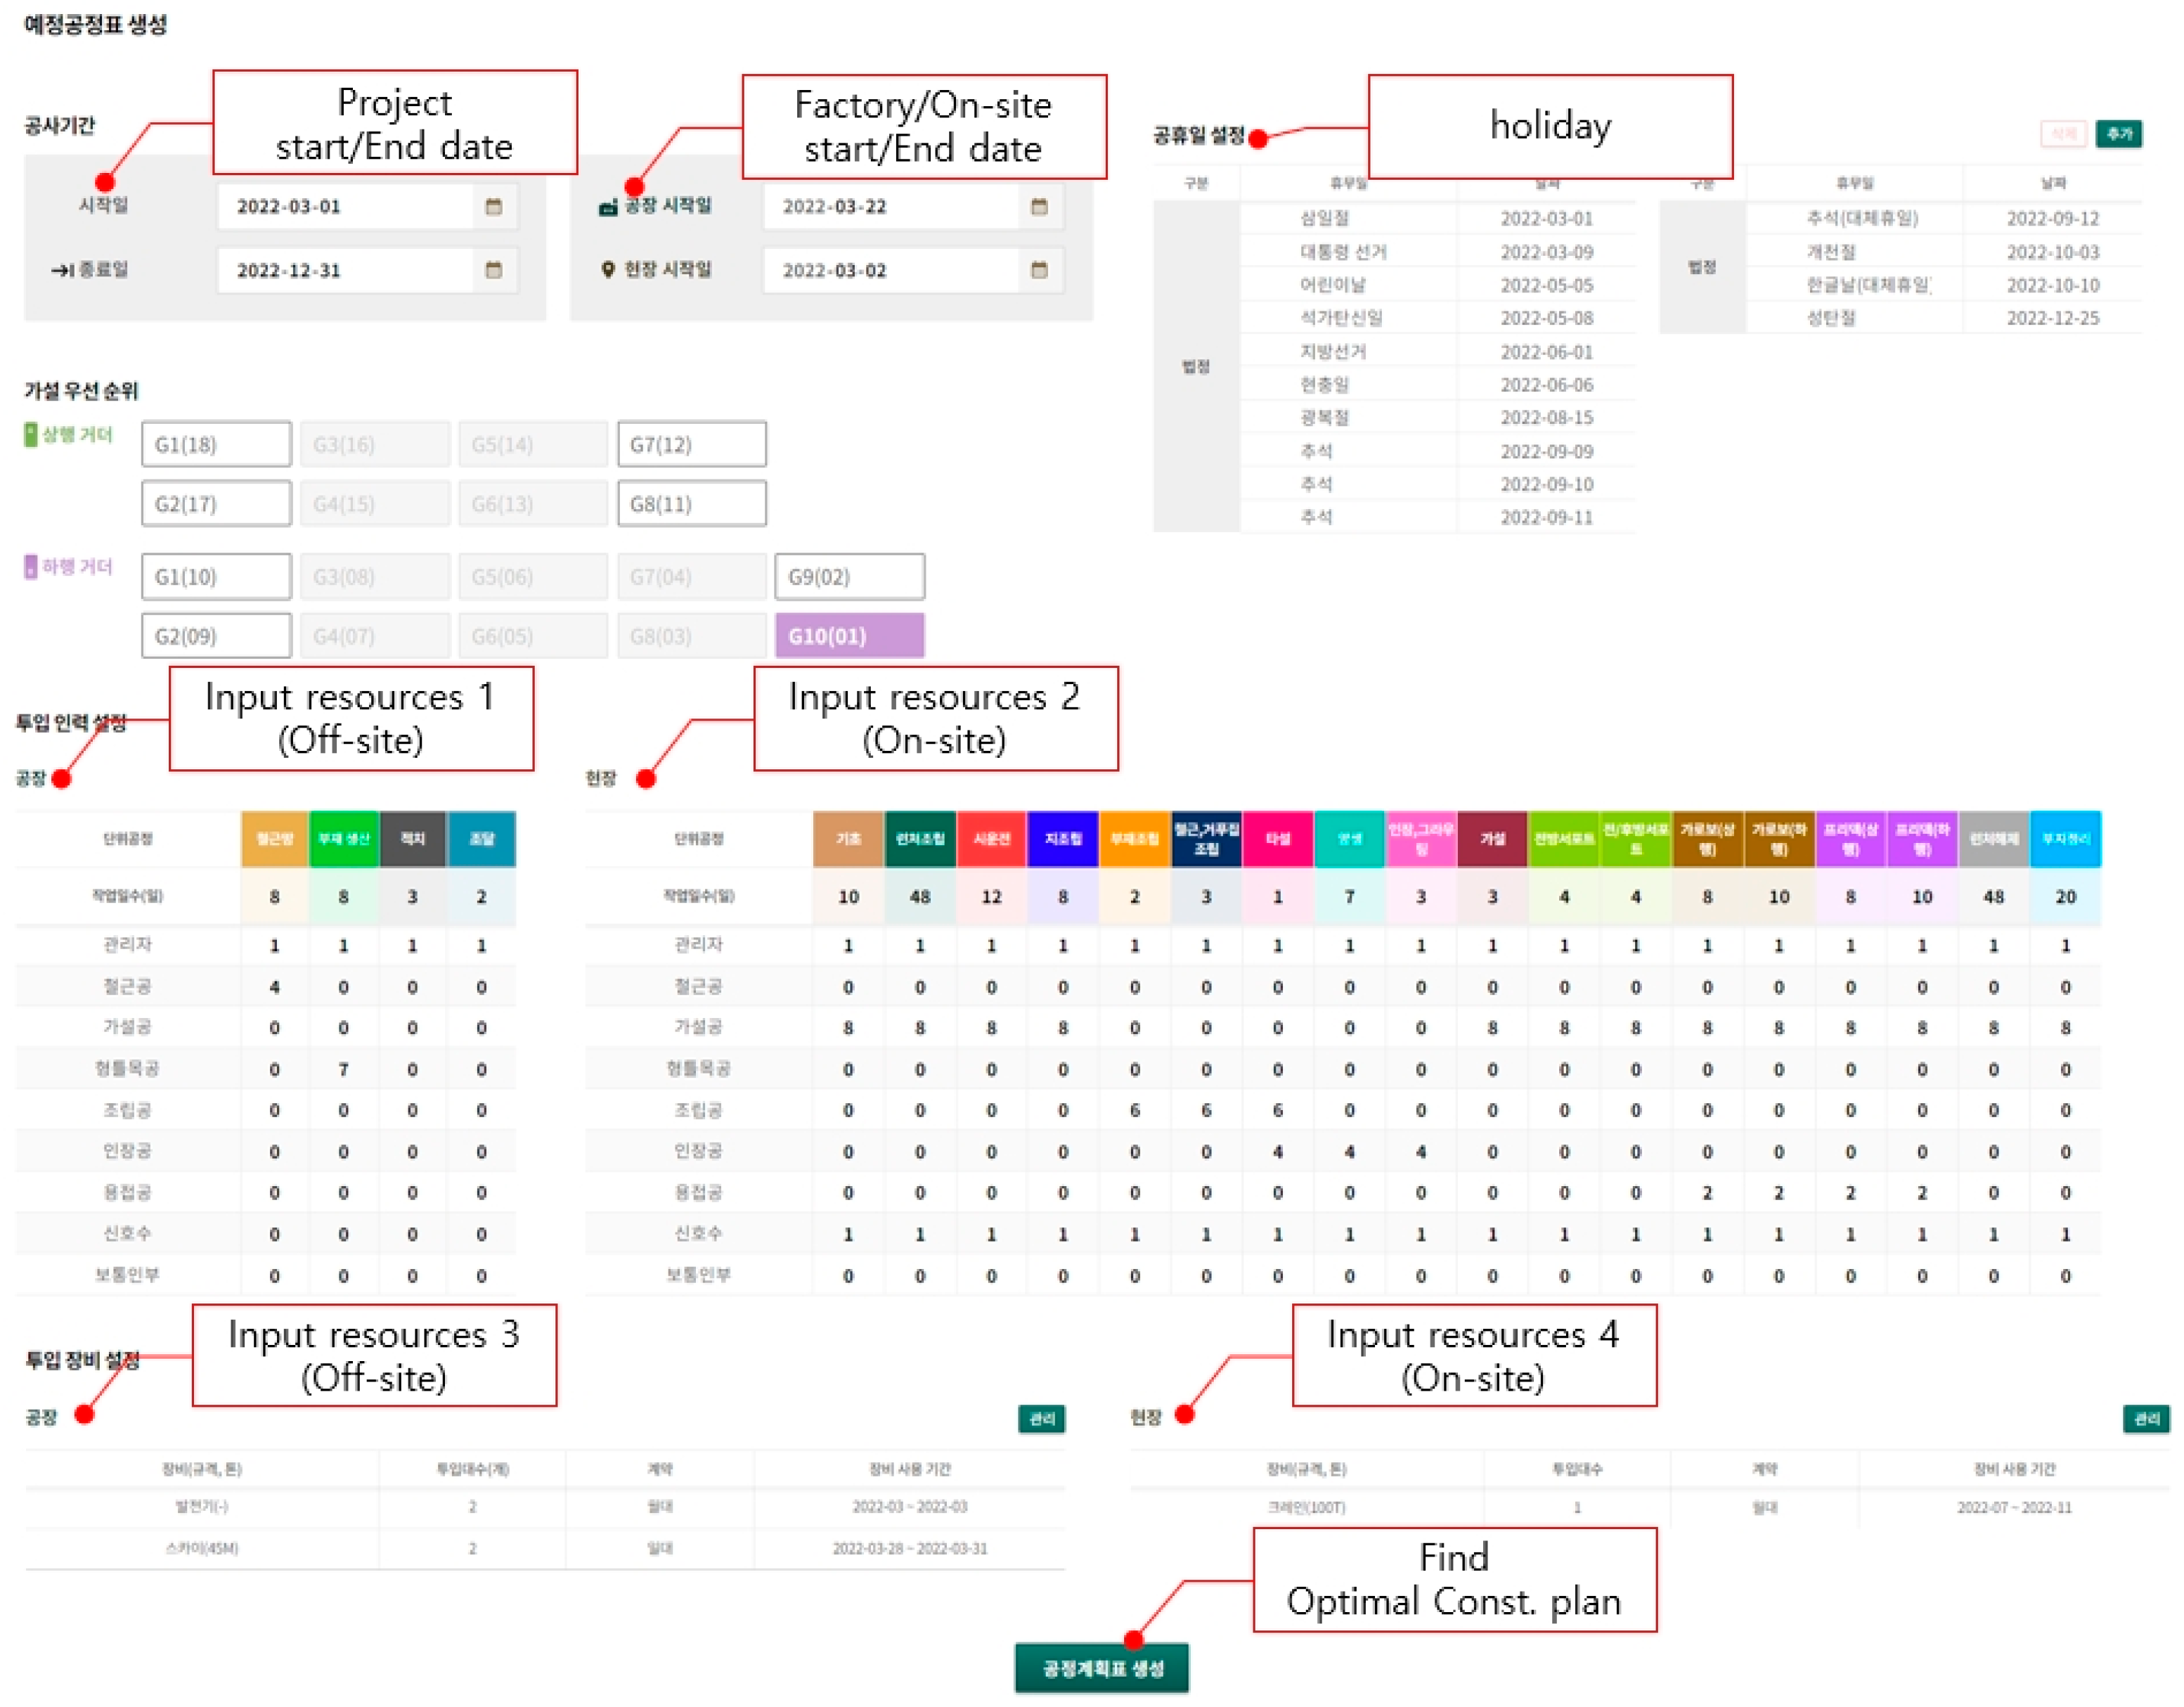
The optimization procedure was further implemented within the Smart Delivery System developed for construction process management. The interface allows project managers to define input parameters such as project start and end dates, site and factory allocations, available resources (labor, equipment, and materials), and external constraints such as non-working days. An example of this configuration process is shown in Figure 11.
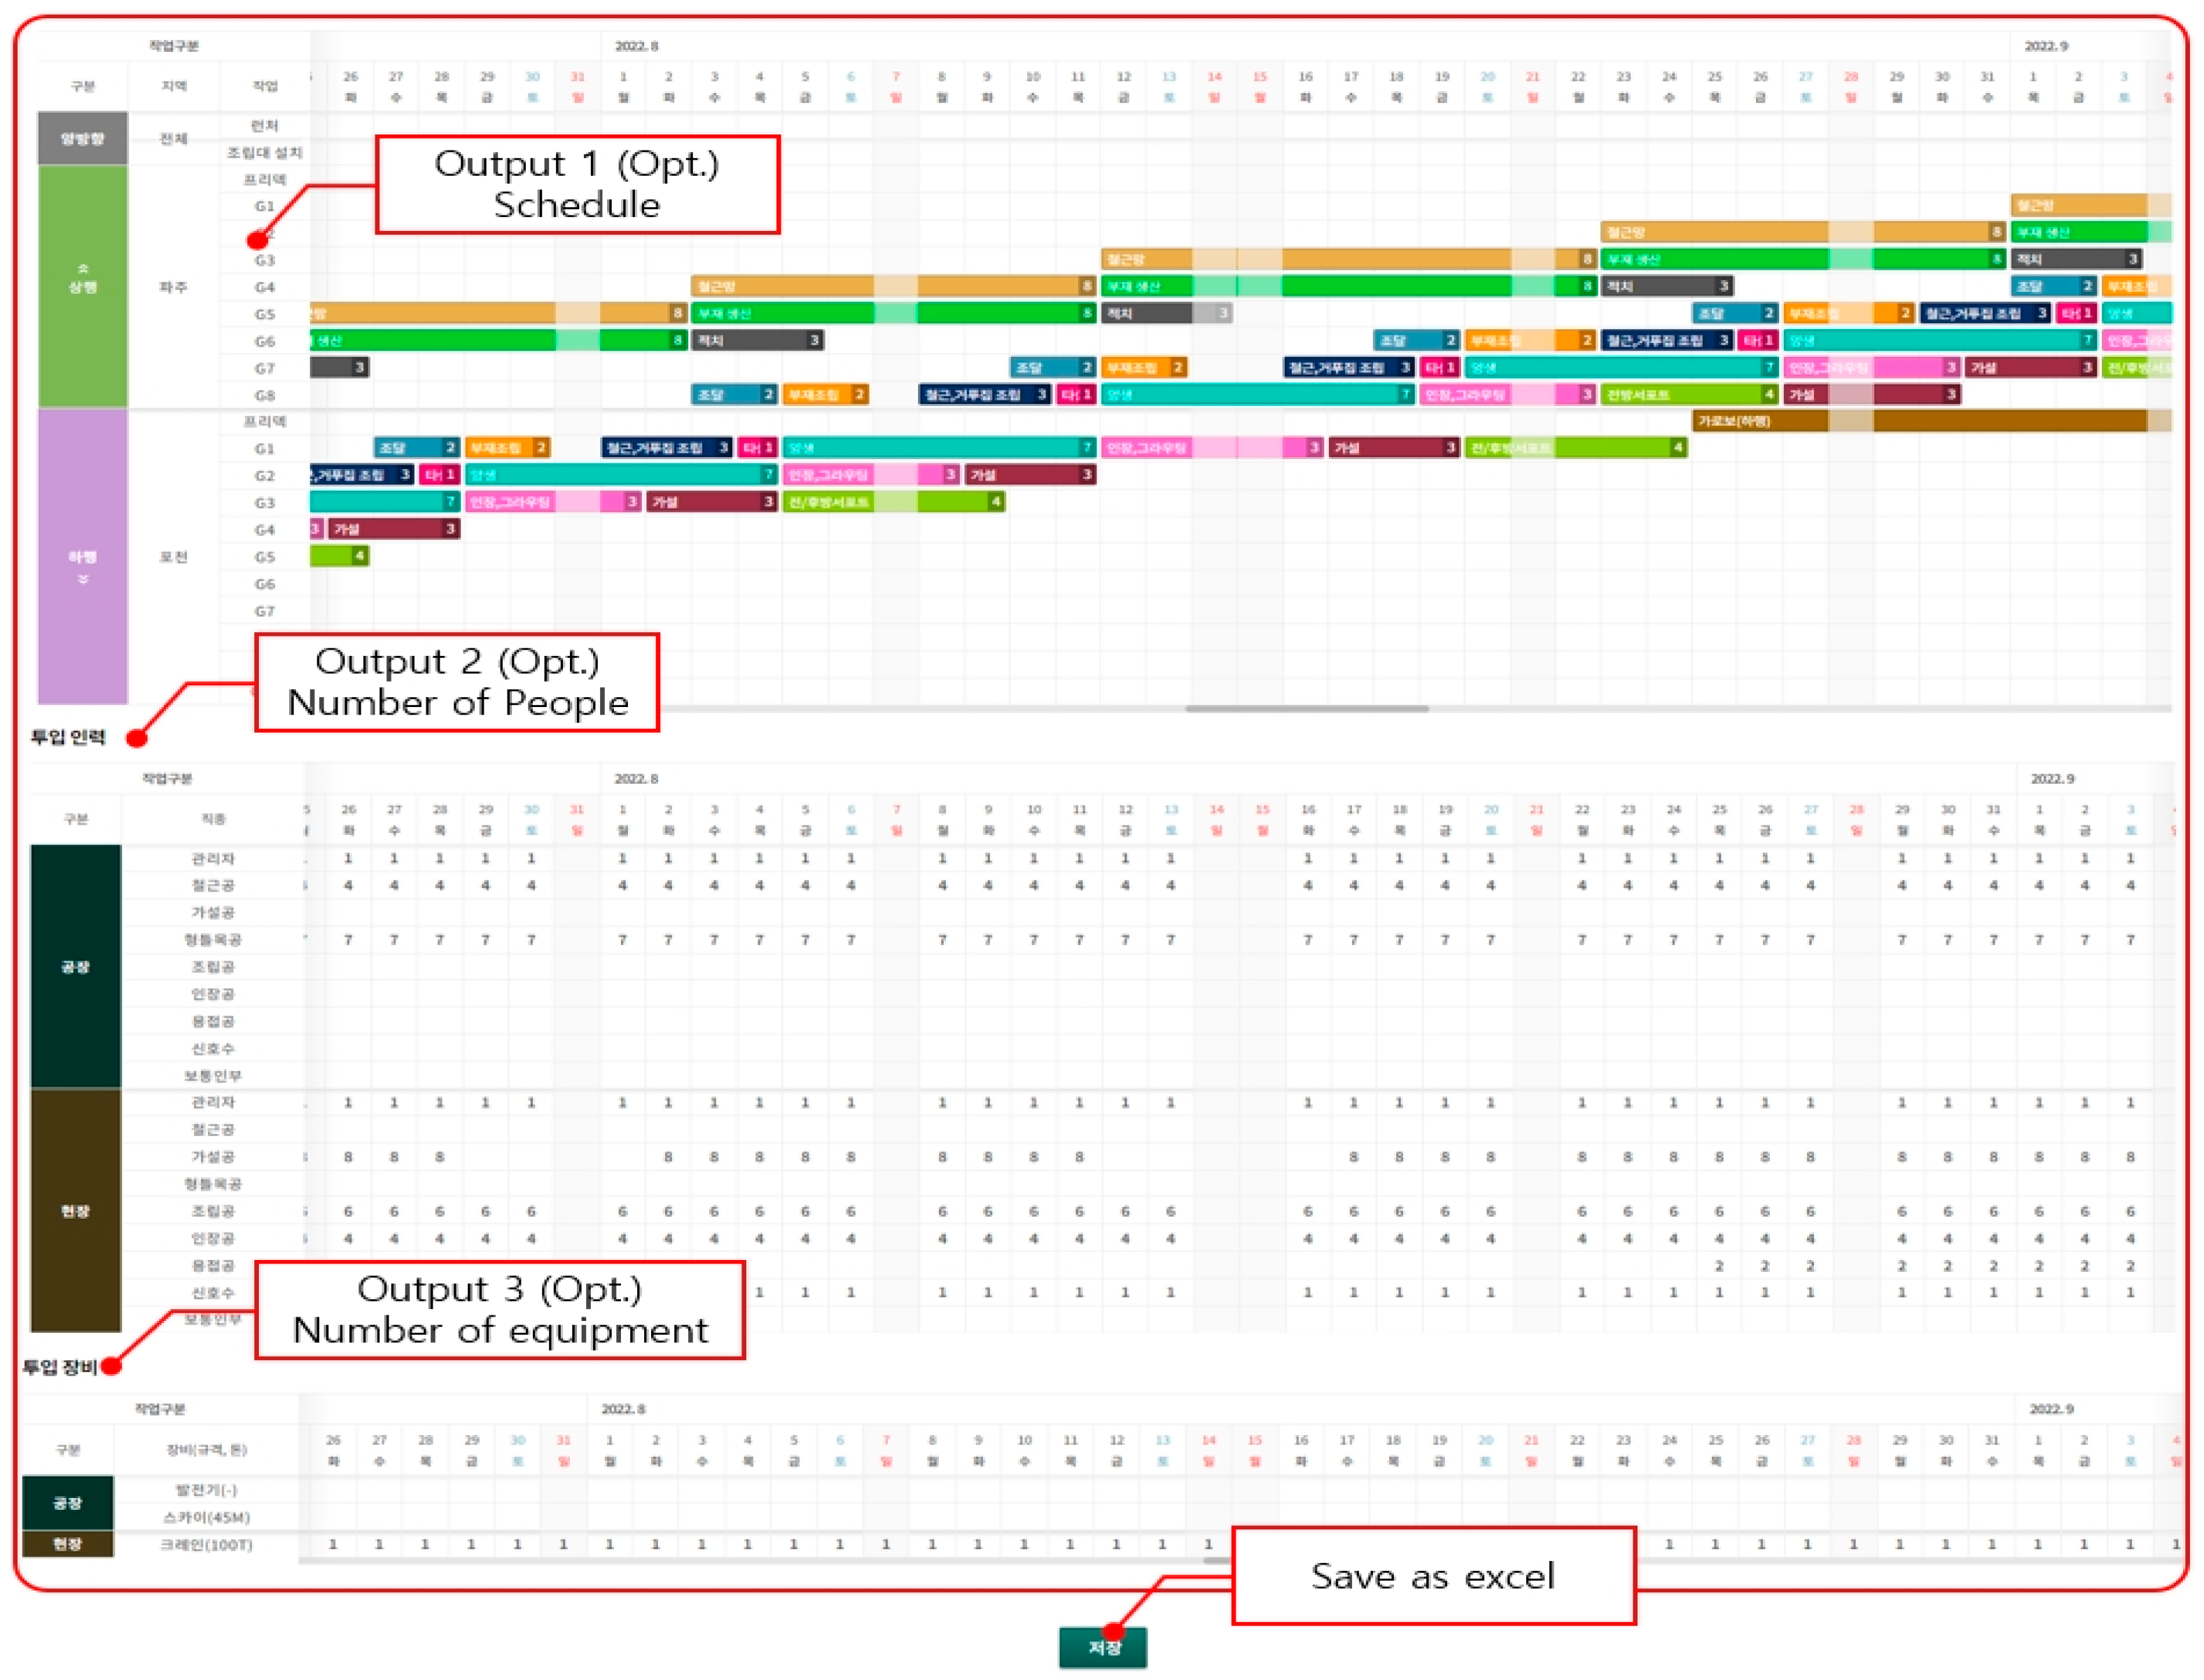
Based on the defined inputs and constraints, the system automatically generates optimized outputs, including the planned construction schedule, manpower allocation, and equipment usage plans. These outputs are illustrated in Figure 12, which demonstrates how the system translates input data into an actionable baseline schedule that balances resource efficiency with project deadlines.
The outputs presented in this section represent the planned baseline schedules generated through the proposed framework. These baseline results are subsequently compared with actual project data and performance metrics in Section 4 to evaluate performance alignment.

3.5. Applications of the Smart Delivery System for Prefabricated Bridge Projects

The Smart Delivery System was employed to operationalize the proposed framework within a digital process management environment. While the process planning module provides functions for defining project duration, component sequencing, and resource constraints, its outcomes have already been presented in Section 3.4. Therefore, this section focuses on the system’s logging and monitoring interfaces that ensure the continuous a feedback loop between planning and execution.
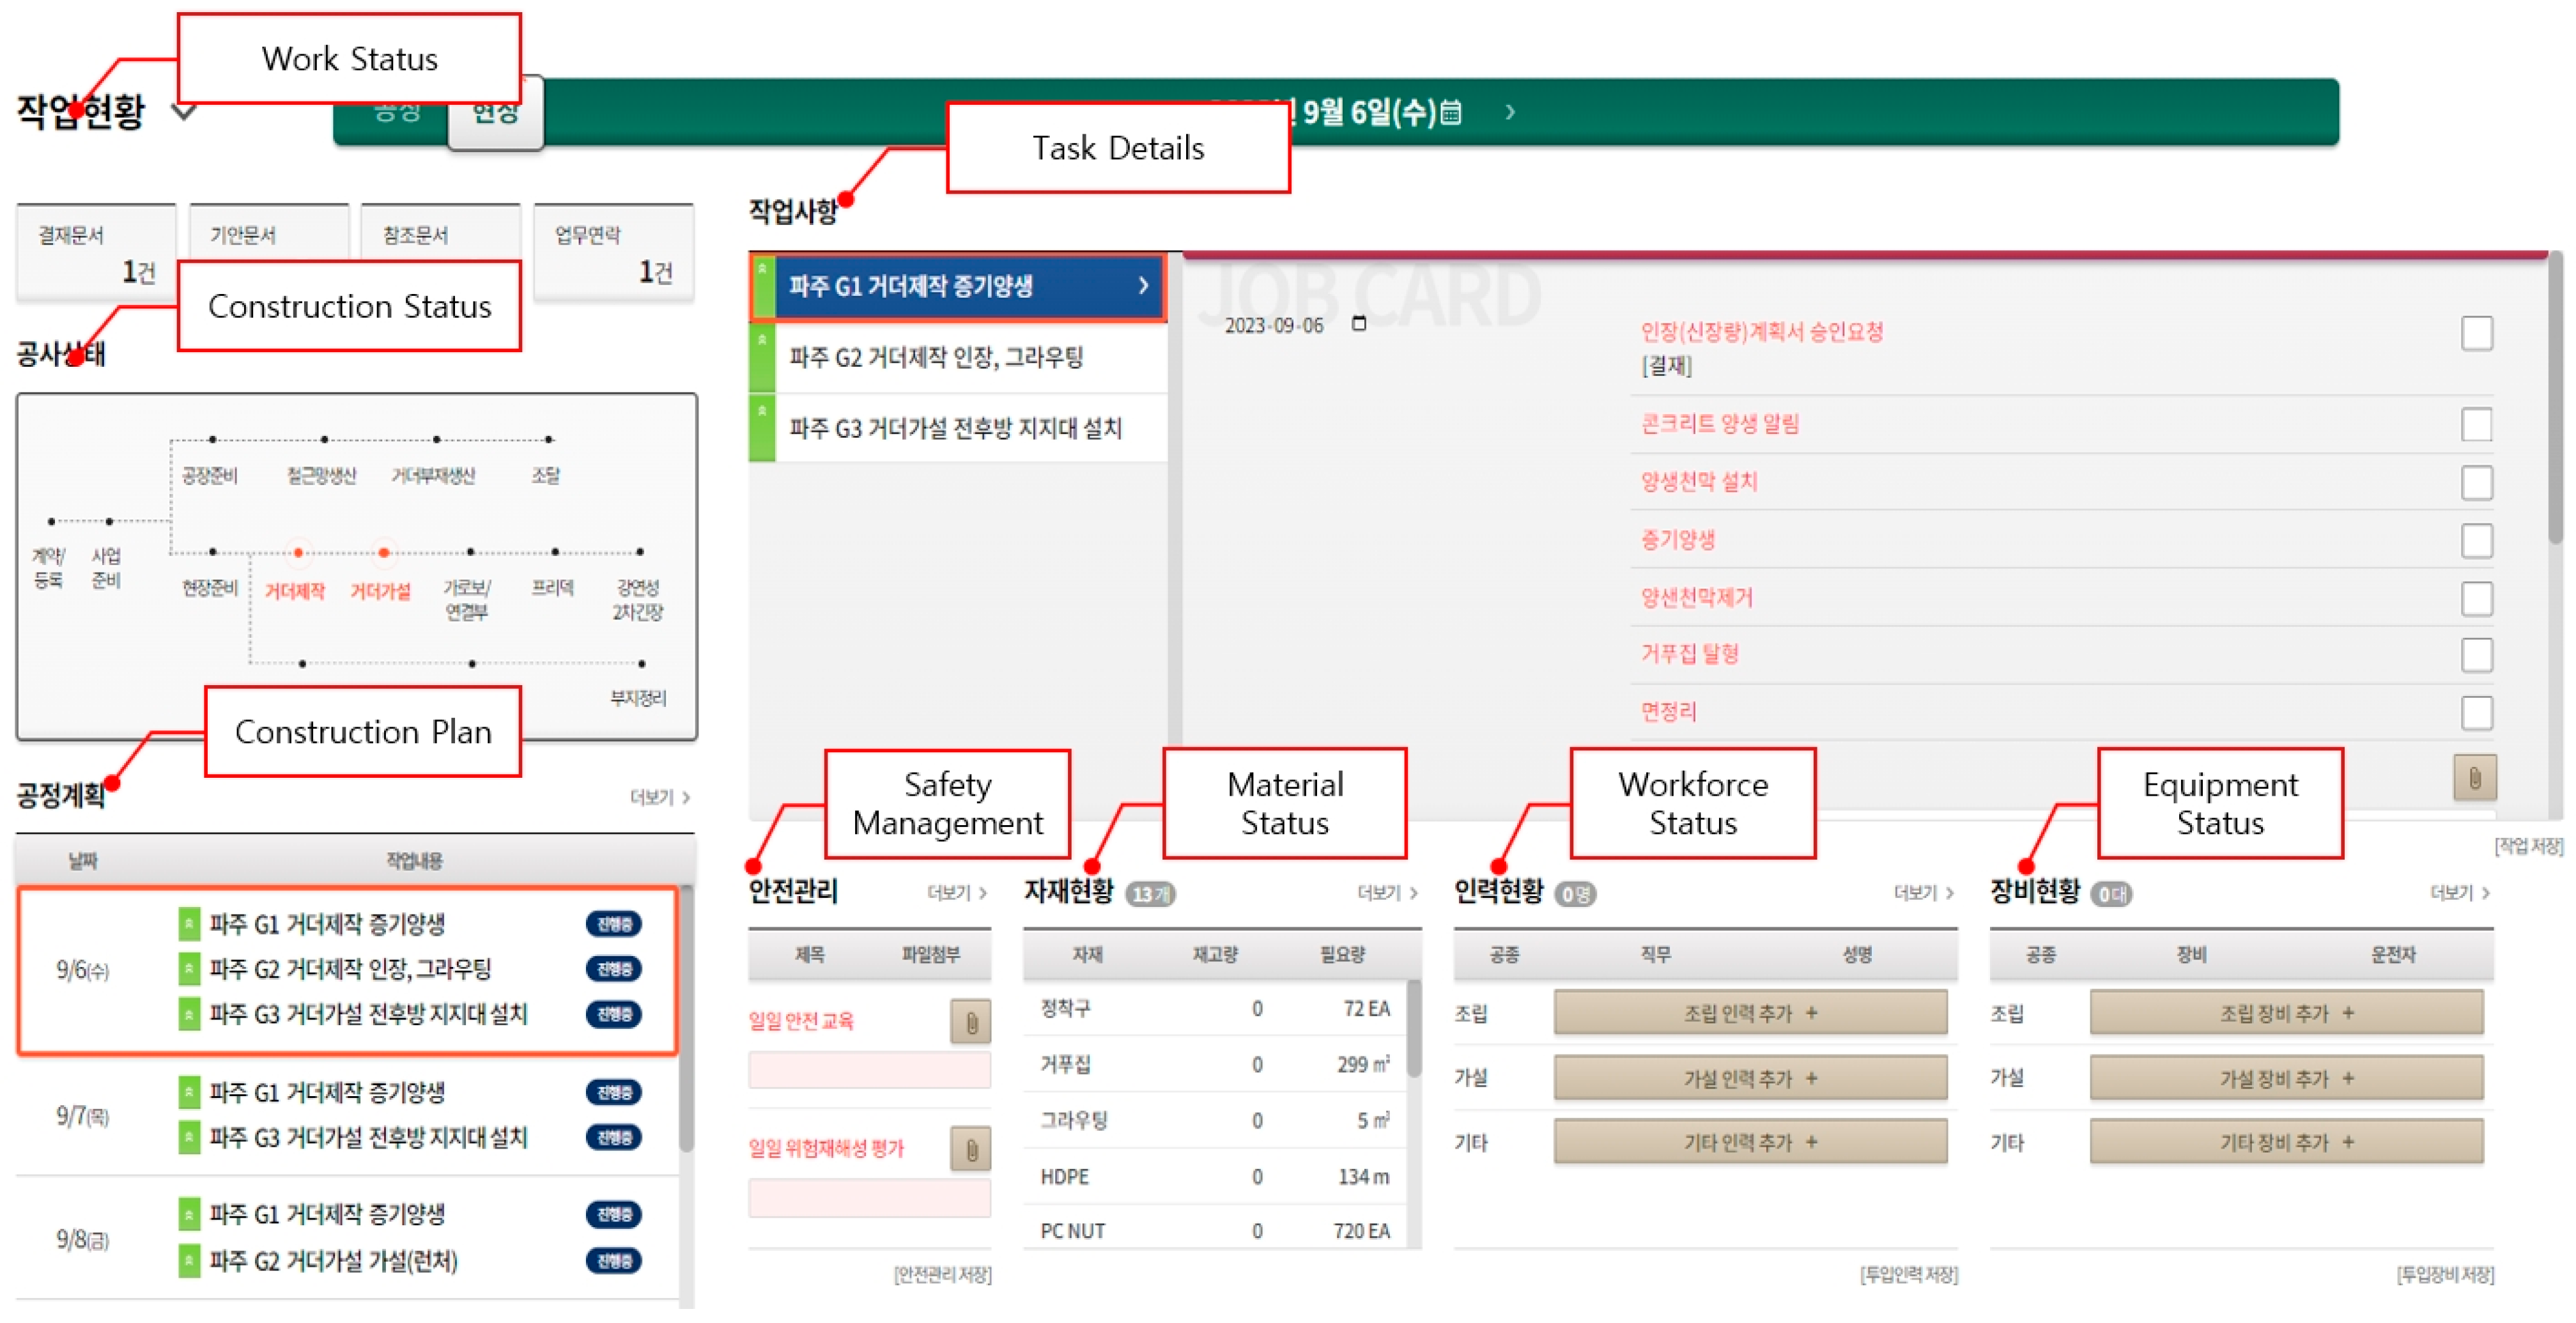
Figure 13 presents the process management UI, where field engineers can record daily performance data, including manpower, equipment usage, and task completion status. These logs are structured according to planned tasks, enabling immediate comparison between scheduled and actual progress.
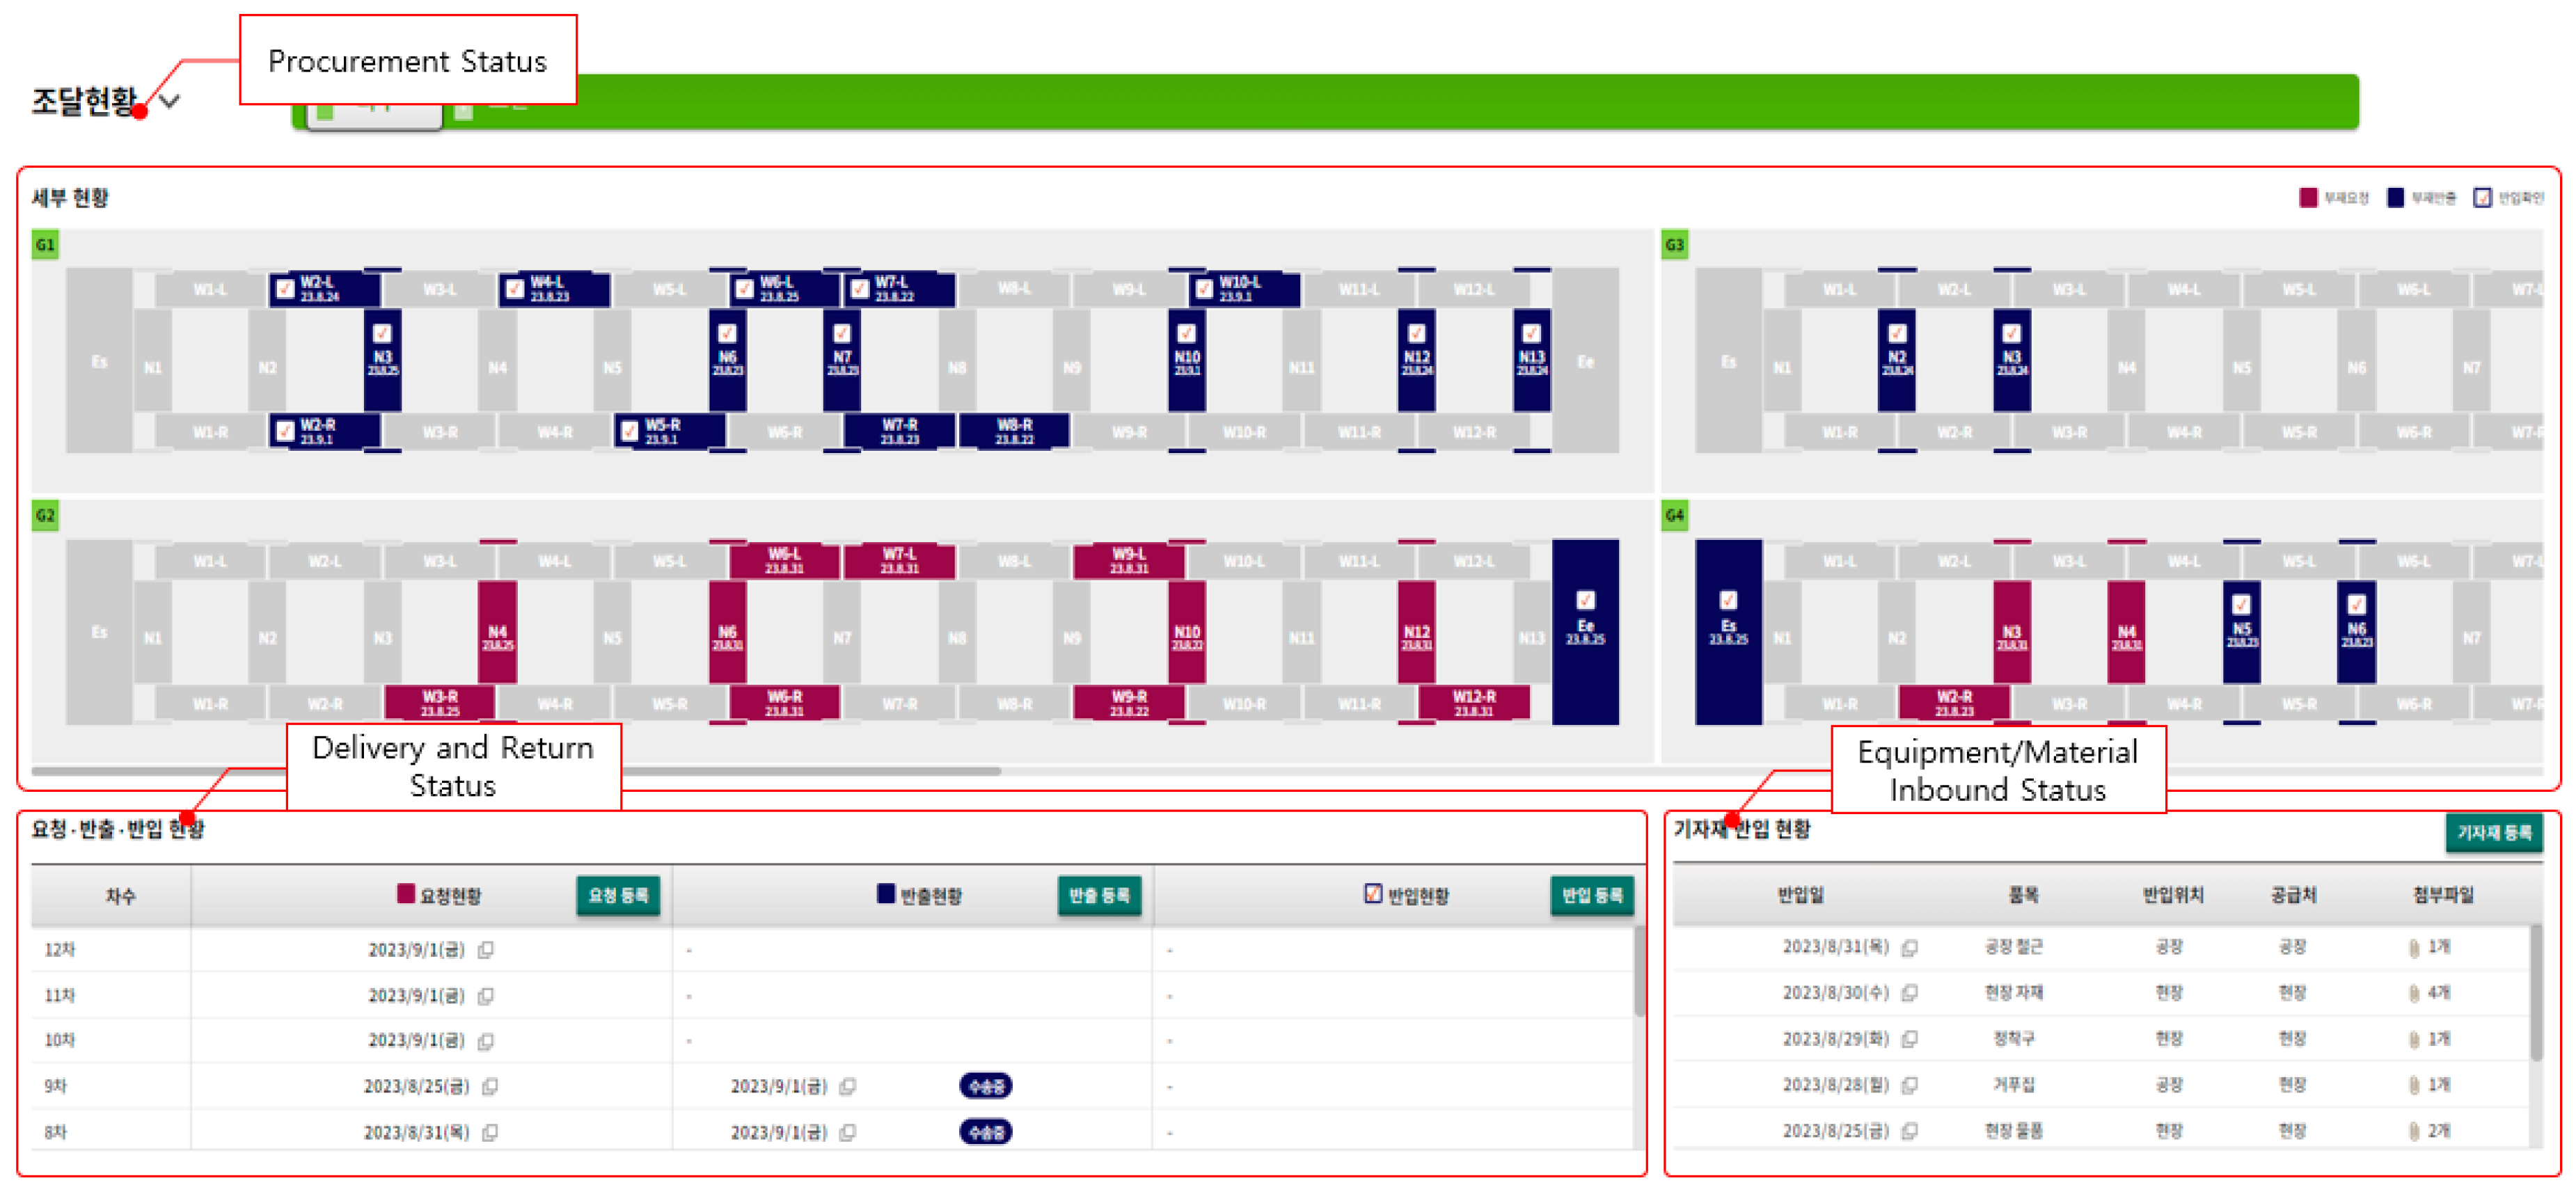
Figure 14 shows the supply chain management interface, which tracks prefabricated component deliveries and material flows. By linking factory outputs with on-site assembly requirements, this module minimizes bottlenecks and ensures synchronization across spatially separated processes.
Figure 15 depicts the human resource and equipment management interface, which consolidates information on workforce allocation and machinery utilization. This integration allows managers to identify over- or under-utilization and reallocate resources dynamically.
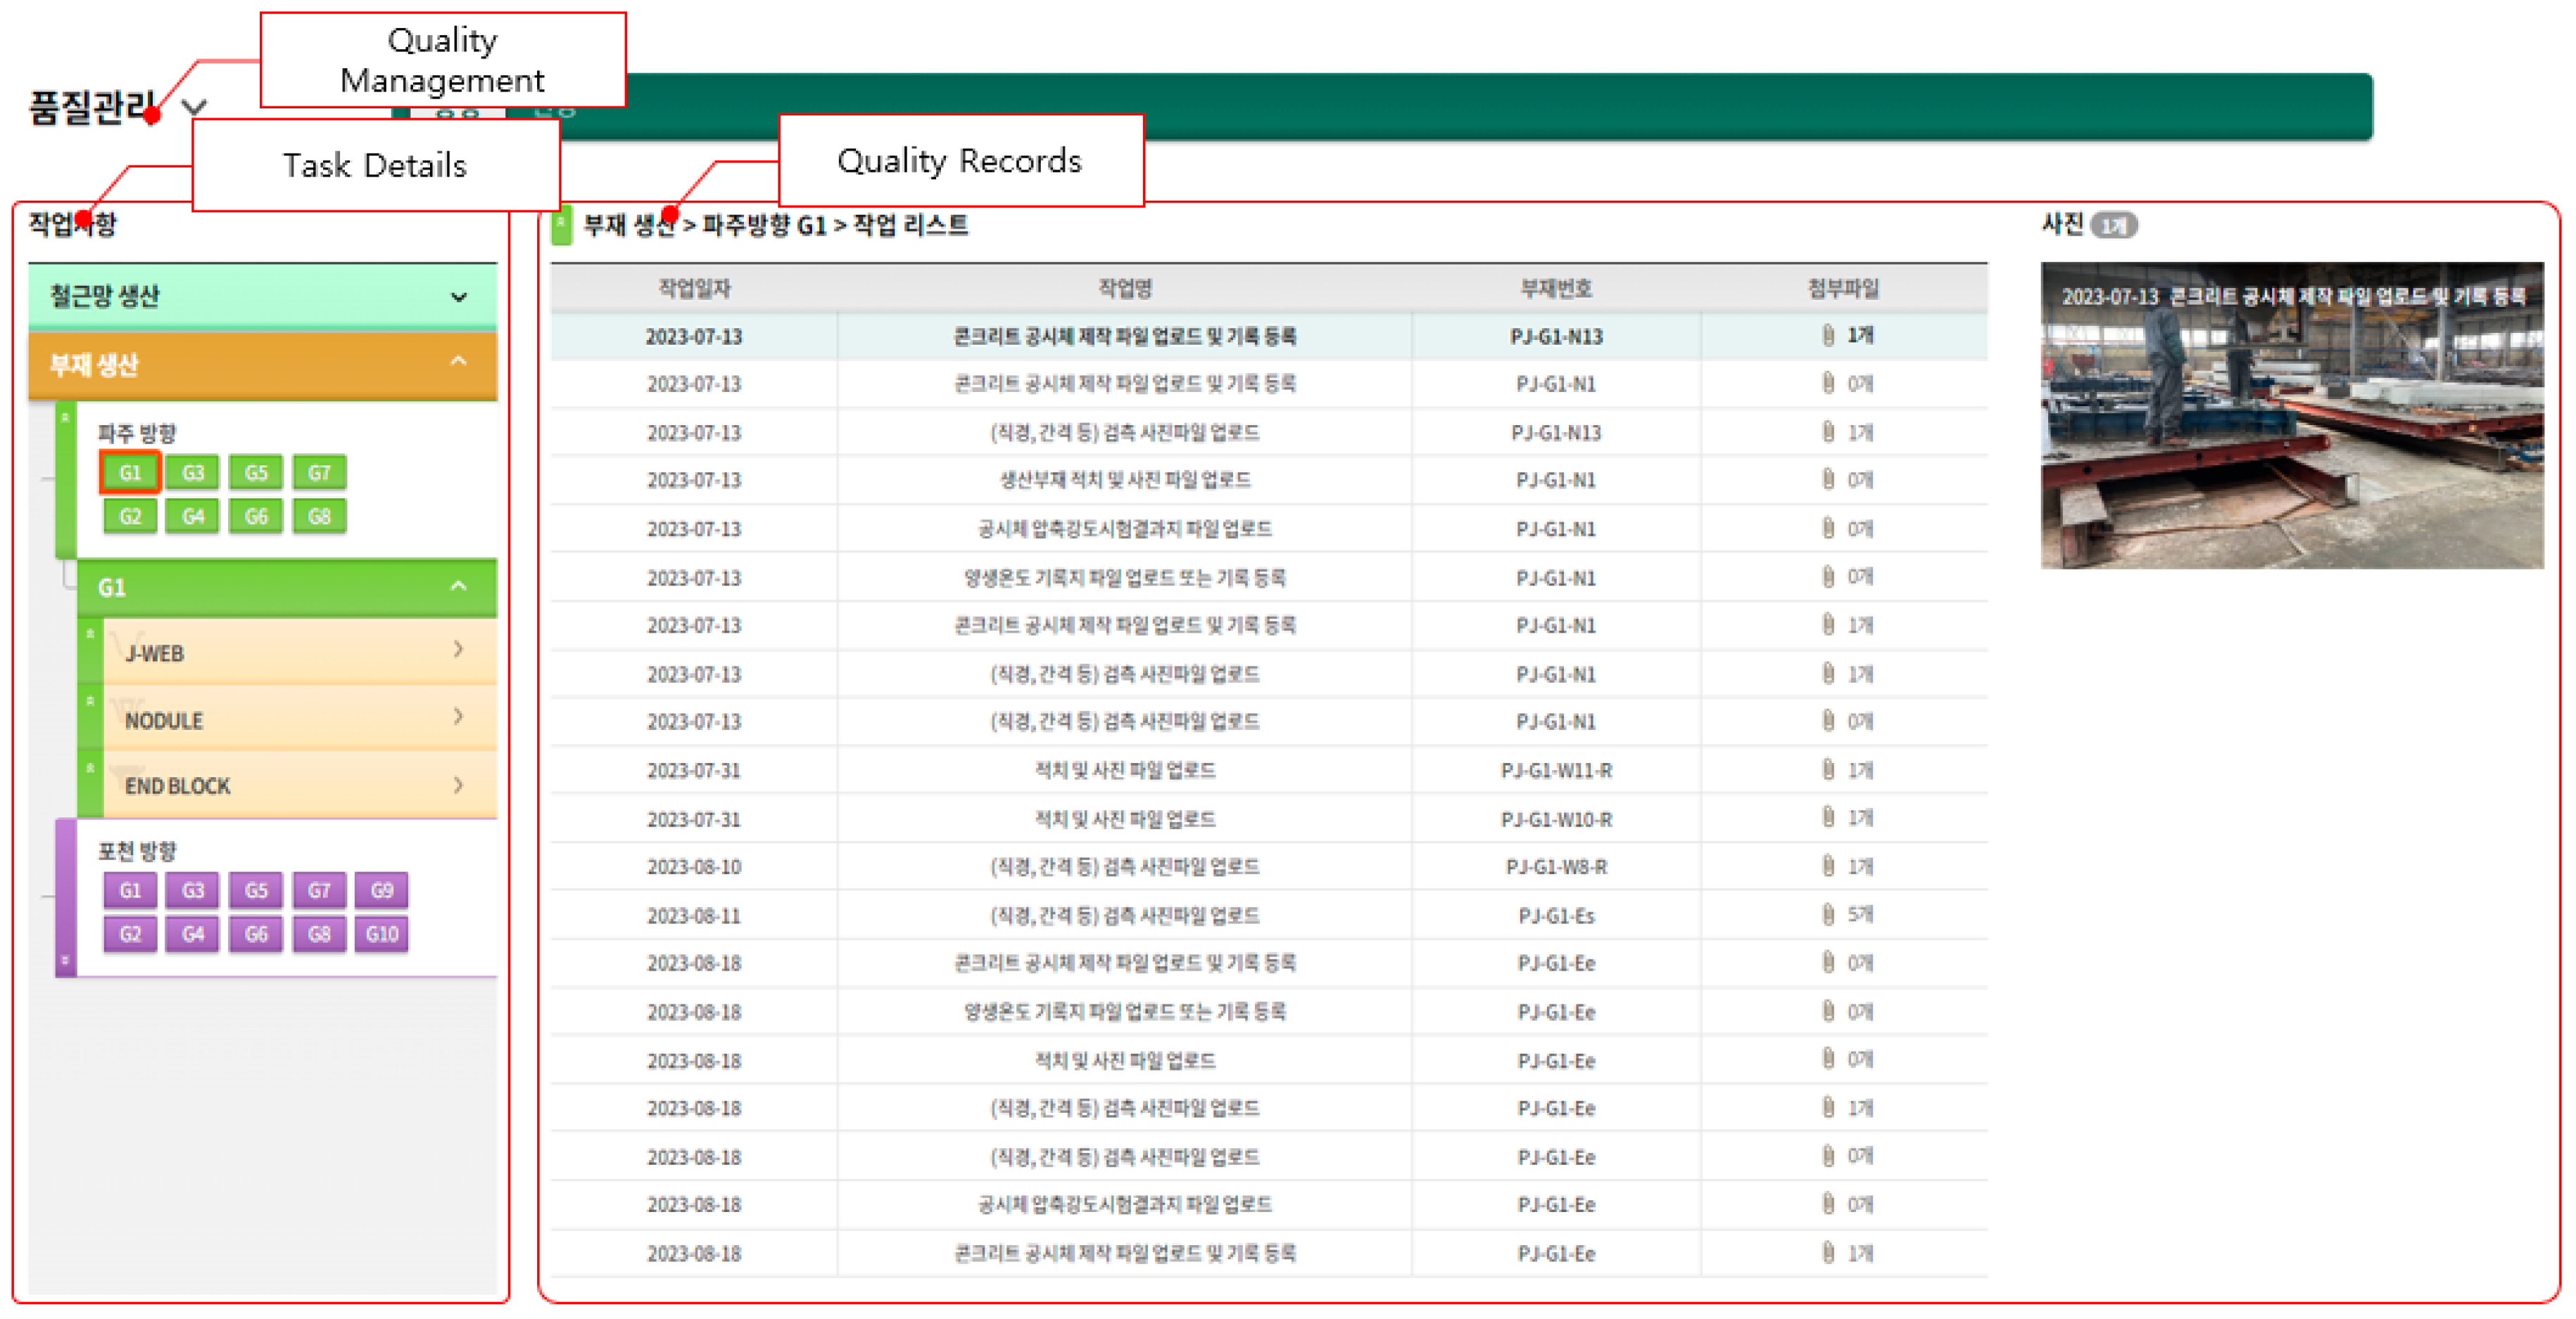
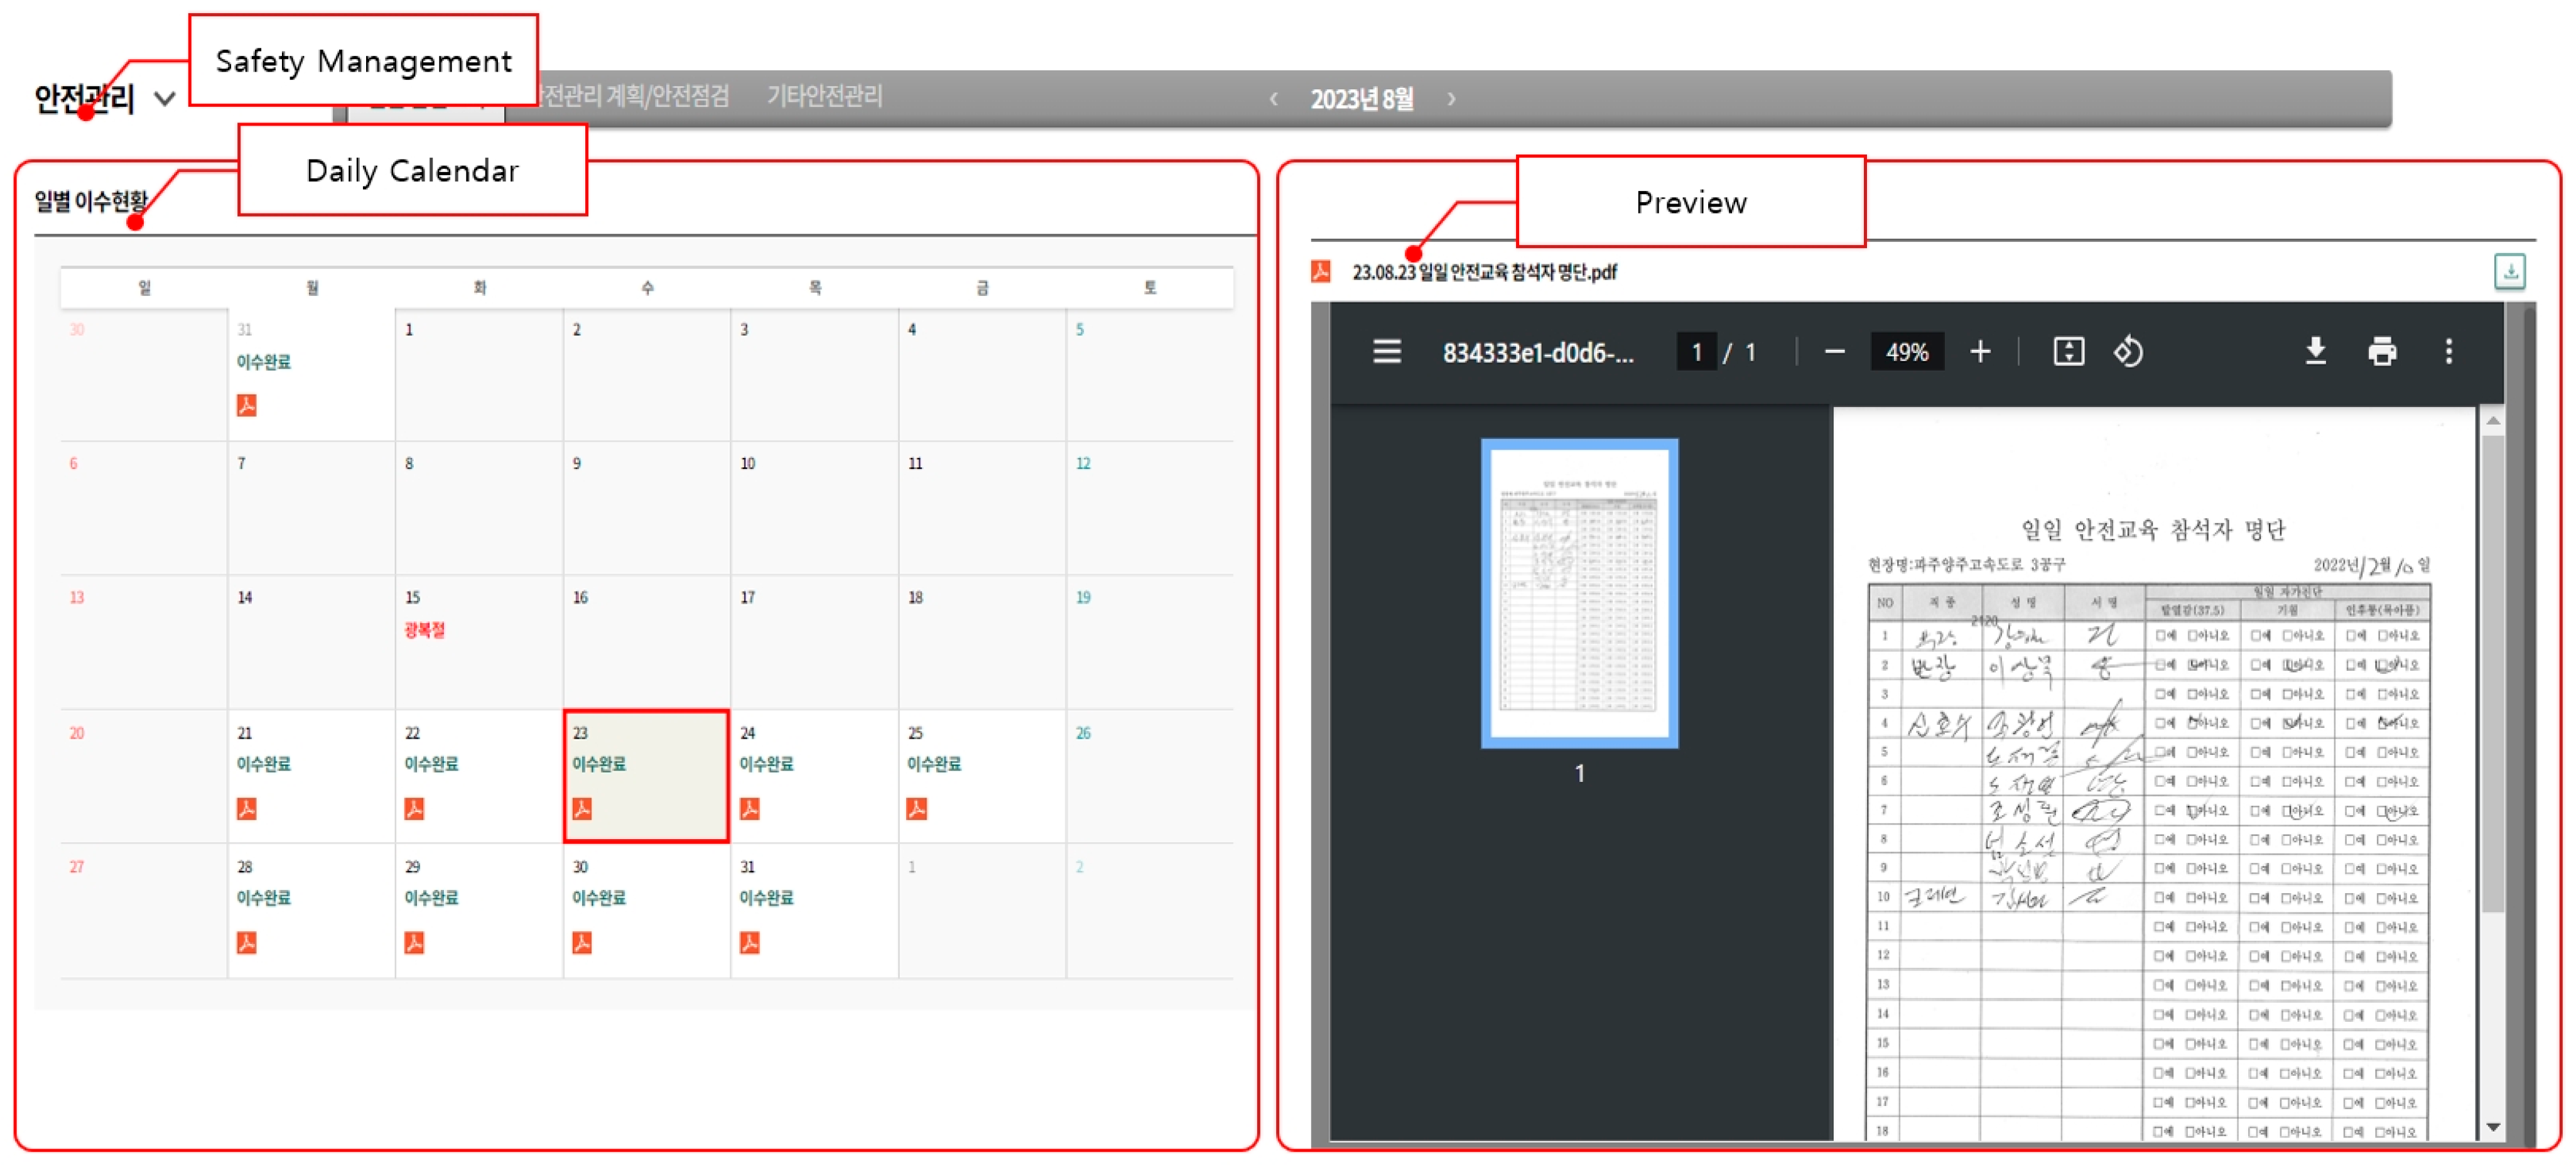
In addition, quality and safety are systematically integrated. Figure 16 displays the quality management interface that stores inspection and testing records, while Figure 17 illustrates the safety management interface for recording safety checks and incident logs. These modules strengthen compliance and traceability across execution stages.
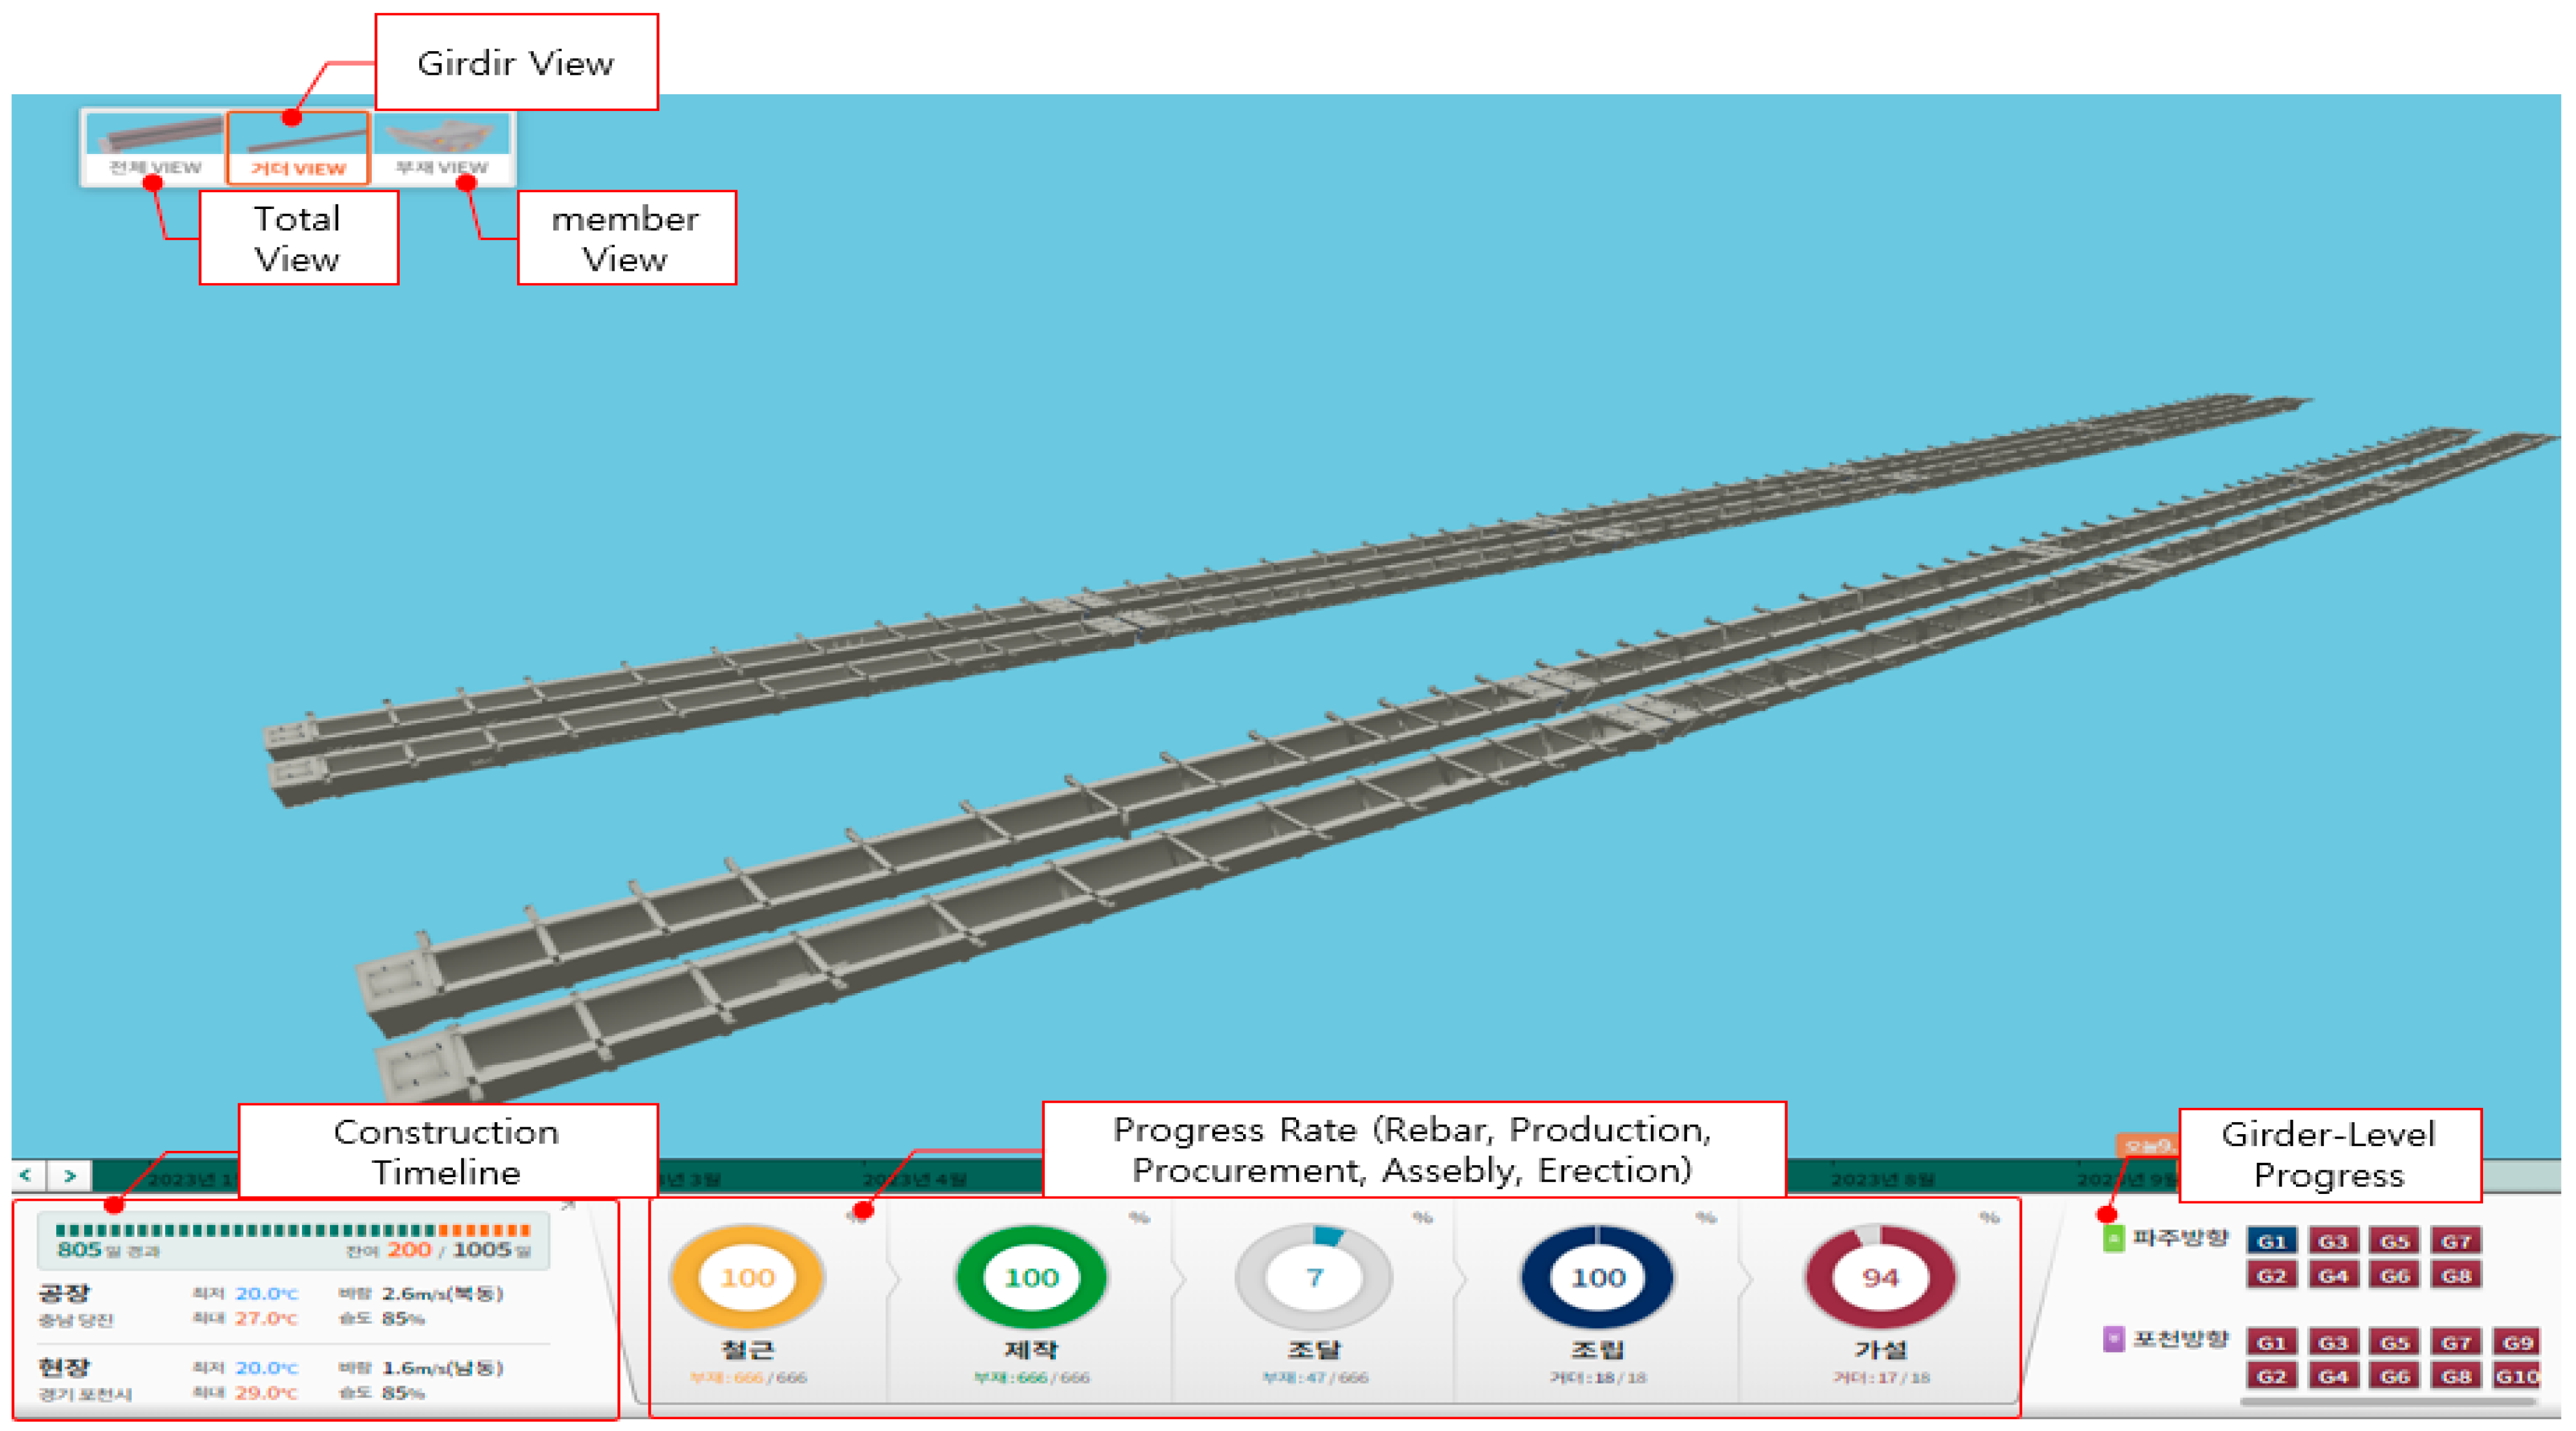
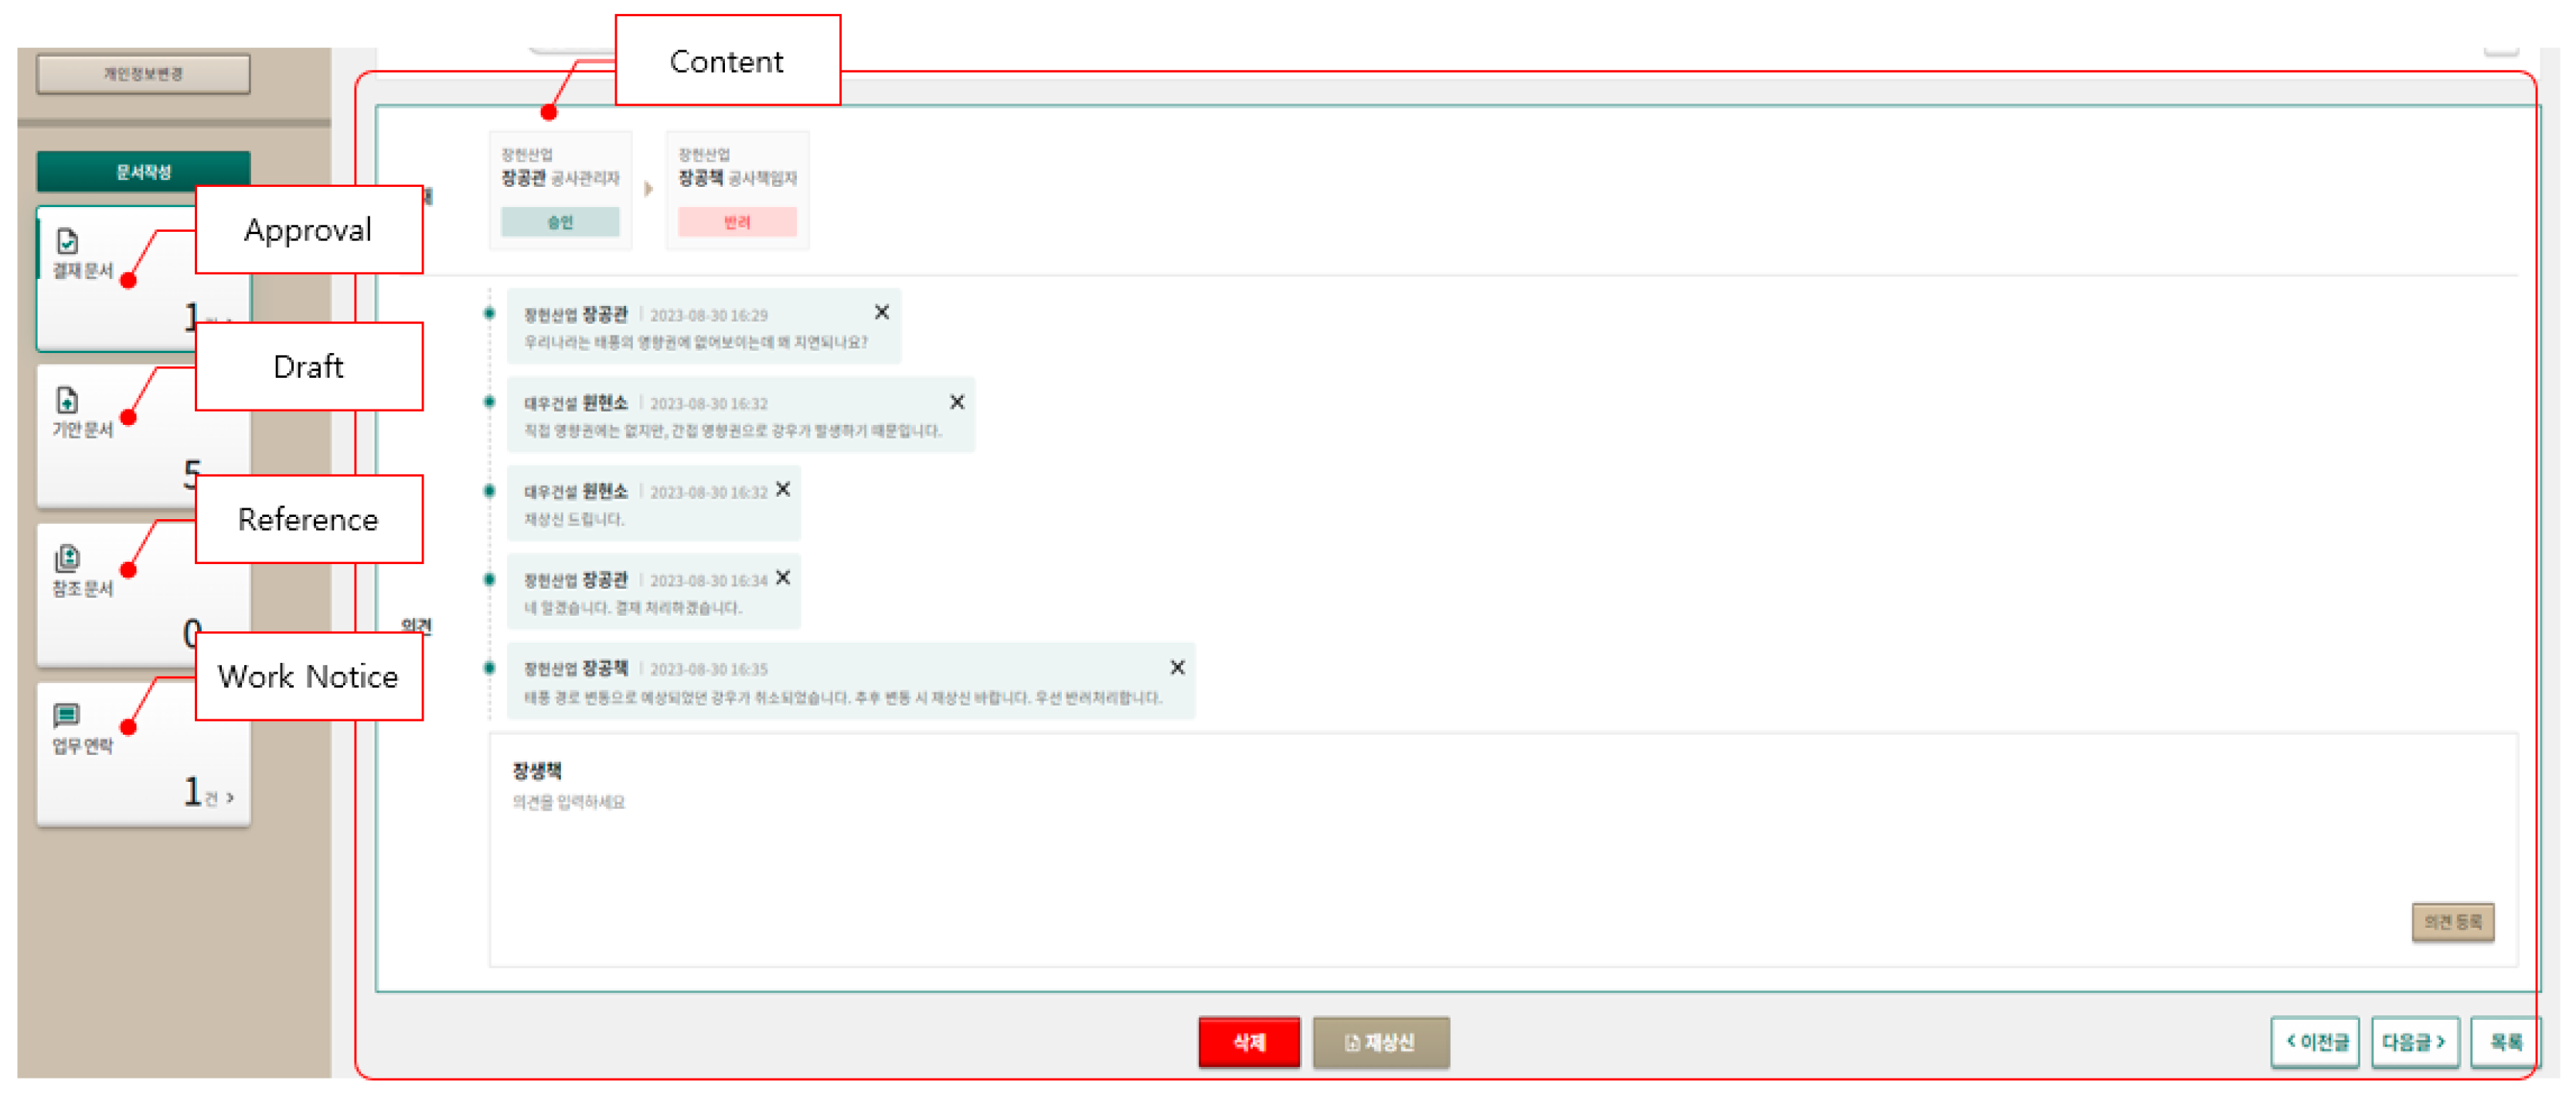
Finally, BIM and communication modules provide enhanced visualization and stakeholder collaboration. Figure 18 shows the BIM-based construction progress visualization interface, linking digital models with real-time schedule and performance data. Figure 19 introduces the project collaboration interface, which enables structured communication among stakeholders, ensuring transparent and efficient decision-making.
Together, these modules implement the proposed Bayesian regression–TCTO framework as a closed-loop system that integrates planning, execution logging, and performance feedback, thereby reinforcing the reliability of prefabricated bridge construction.

4. Results and Discussion

4.1. Bayesian Updating of Standard Time (ST)

The Bayesian updating process was applied to standard time (ST) estimation to incorporate new field data into prior distributions. Instead of presenting regression equations or detailed parameter tables, the results are summarized by means of probability distribution updates. Figure 20 compares posterior distributions with and without prior project information.
In the case without prior data, the distributions converge only gradually as additional observations accumulate, and variability remains relatively wide. When prior data from six completed projects are incorporated, the distributions stabilize more rapidly and exhibit narrower credible intervals. This demonstrates the cumulative learning effect of Bayesian inference in repetitive prefabricated projects, where prior knowledge accelerates convergence and reduces uncertainty.

4.2. Comparative Verification of TCTO Optimization

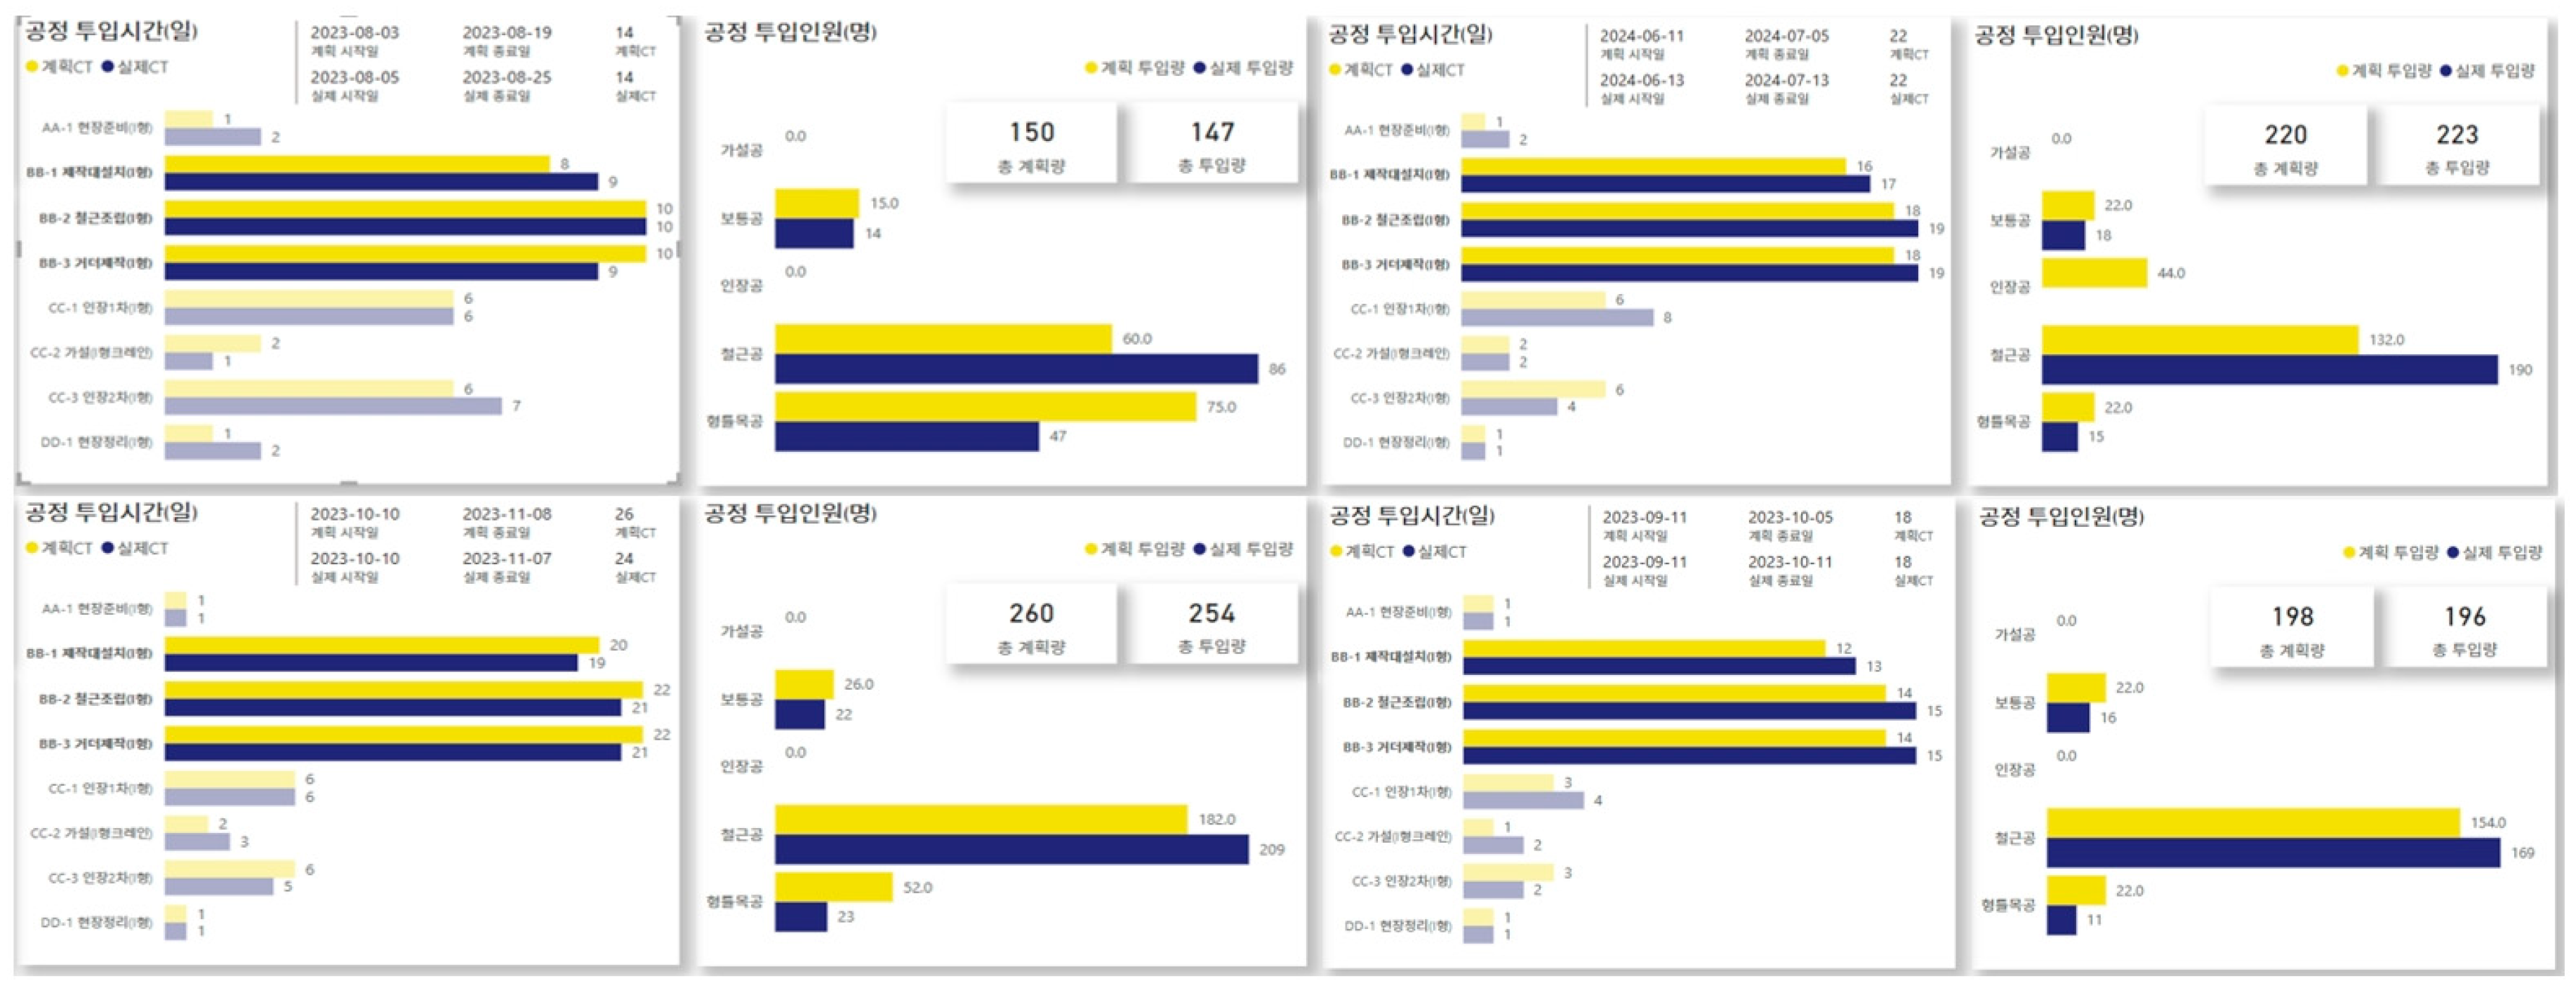
The proposed Bayesian regression-based TCTO framework using verified through four prefabricated girder bridge projects: Jangdong, Jeonggok No.1, Jukjang, and Ip-am. To support comparative analysis, the Smart Delivery System was employed to visualize deviations in project duration and resource allocations. Figure 21 presents the plan–actual comparison interface, which integrates schedule baselines and resource usage into a unified dashboard.
The numerical comparison of planned and actual durations and resource allocations is summarized in Table 3, while graphical results for each project are provided in Figure 22. Overall, the deviations were minimal. In terms of schedule, Jangdong, Jeonggok No.1, and Ip-am achieved perfect alignment with their planned durations, whereas Jukjang exhibited an 8.33% delay due to local manpower adjustments and construction constraints. Resource usage deviations remained within ±3% across all projects, demonstrating the robustness of the proposed optimization process.
The results confirm that the Bayesian regression-based TCTO framework produces reliable plans that align closely with actual field performance. By minimizing discrepancies between planned baselines and realized outcomes, the framework enhances the practical applicability of probabilistic duration estimation and resource–time optimization in prefabricated bridge projects.

4.3. Case Study: Doha No.4 Bridge Results

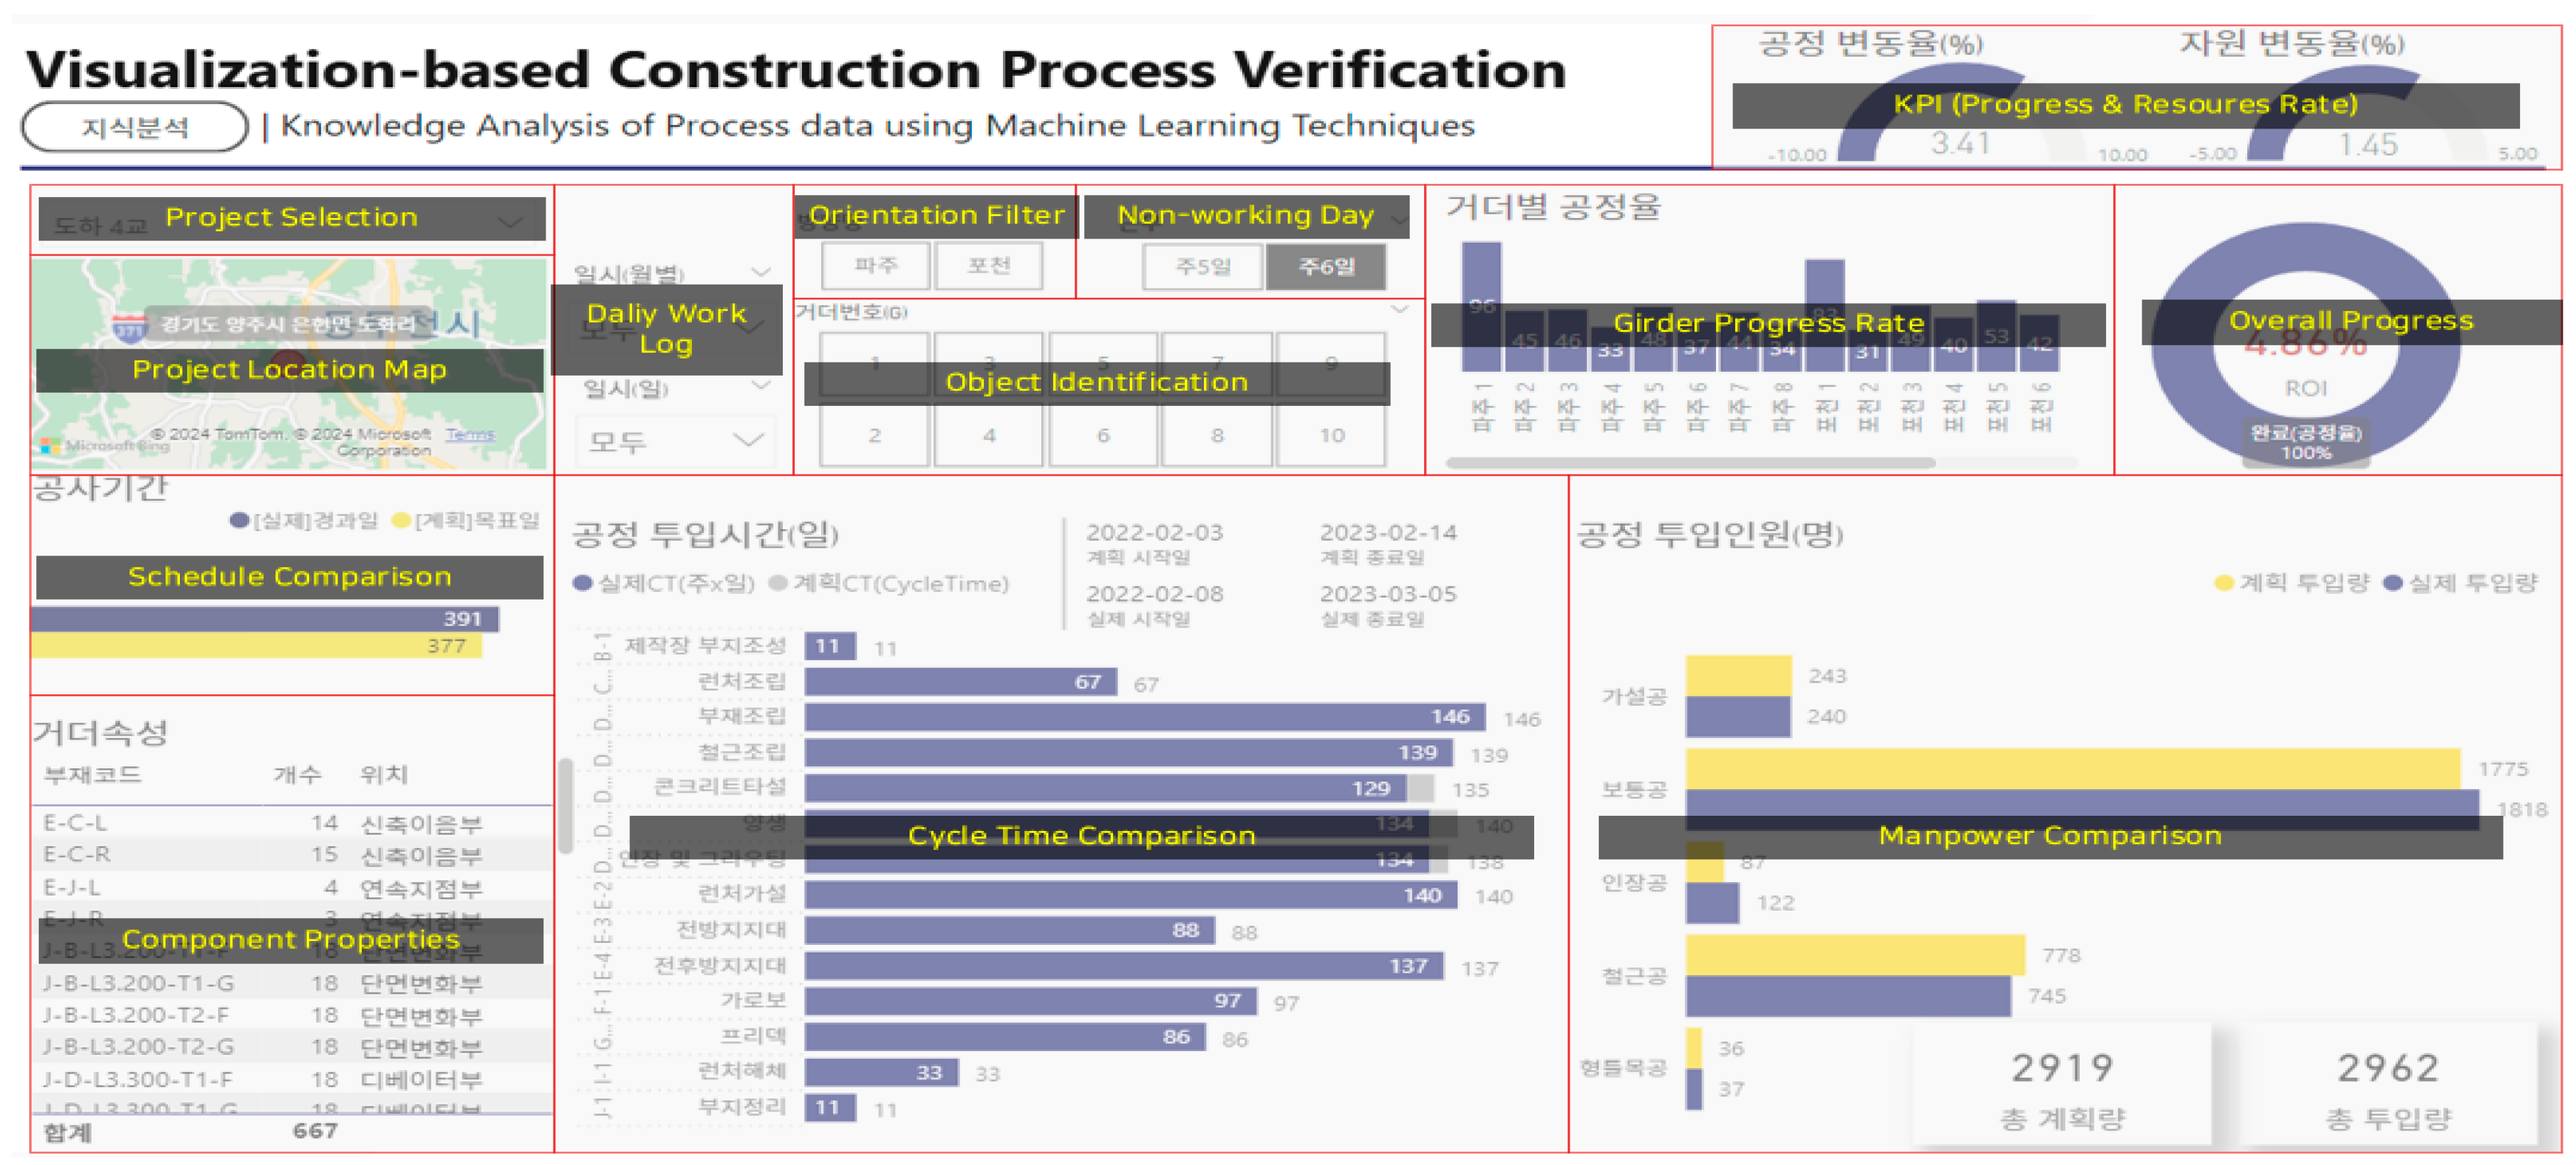
To further validate the proposed framework, the Smart Delivery System was applied to the Doha No.4 bridge project, which adopted prefabricated girders as its main superstructure. The project workflow was segmented into five major stages: (1) Site Preparation, (2) Assembly, (3) Installation (on-site), (4) Cross Beam and Bottom Slab, and (5) Site Demobilization.
Table 4 presents the comparison between planned and actual results in terms of both durations and resource inputs. The total duration increased from 377 to 391 days, corresponding to a deviation of 3.71%. Deviations in individual process durations were contained within ±7%, demonstrating workflow consistency. The discrepancy between summed activity durations and the total project duration occurred because assembly and installation were executed in overlapping cycles at the girder-unit level rather than strictly sequentially, reflecting the repetitive production characteristics of prefabricated construction.
For resource allocations, deviations remained within ±5% up to the assembly stage, indicating strong planning accuracy. However, during on-site installation, actual manpower input exceeded planned levels by more than 300%, largely due to unforeseen constraints such as equipment availability and workforce replacement. Despite this anomaly, the overall deviation in total resource input was limited to 1.47%, as the assembly stage accounted for the largest share of labor, where alignment with the plan was strong.

4.4. Performance Analysis Using SPI

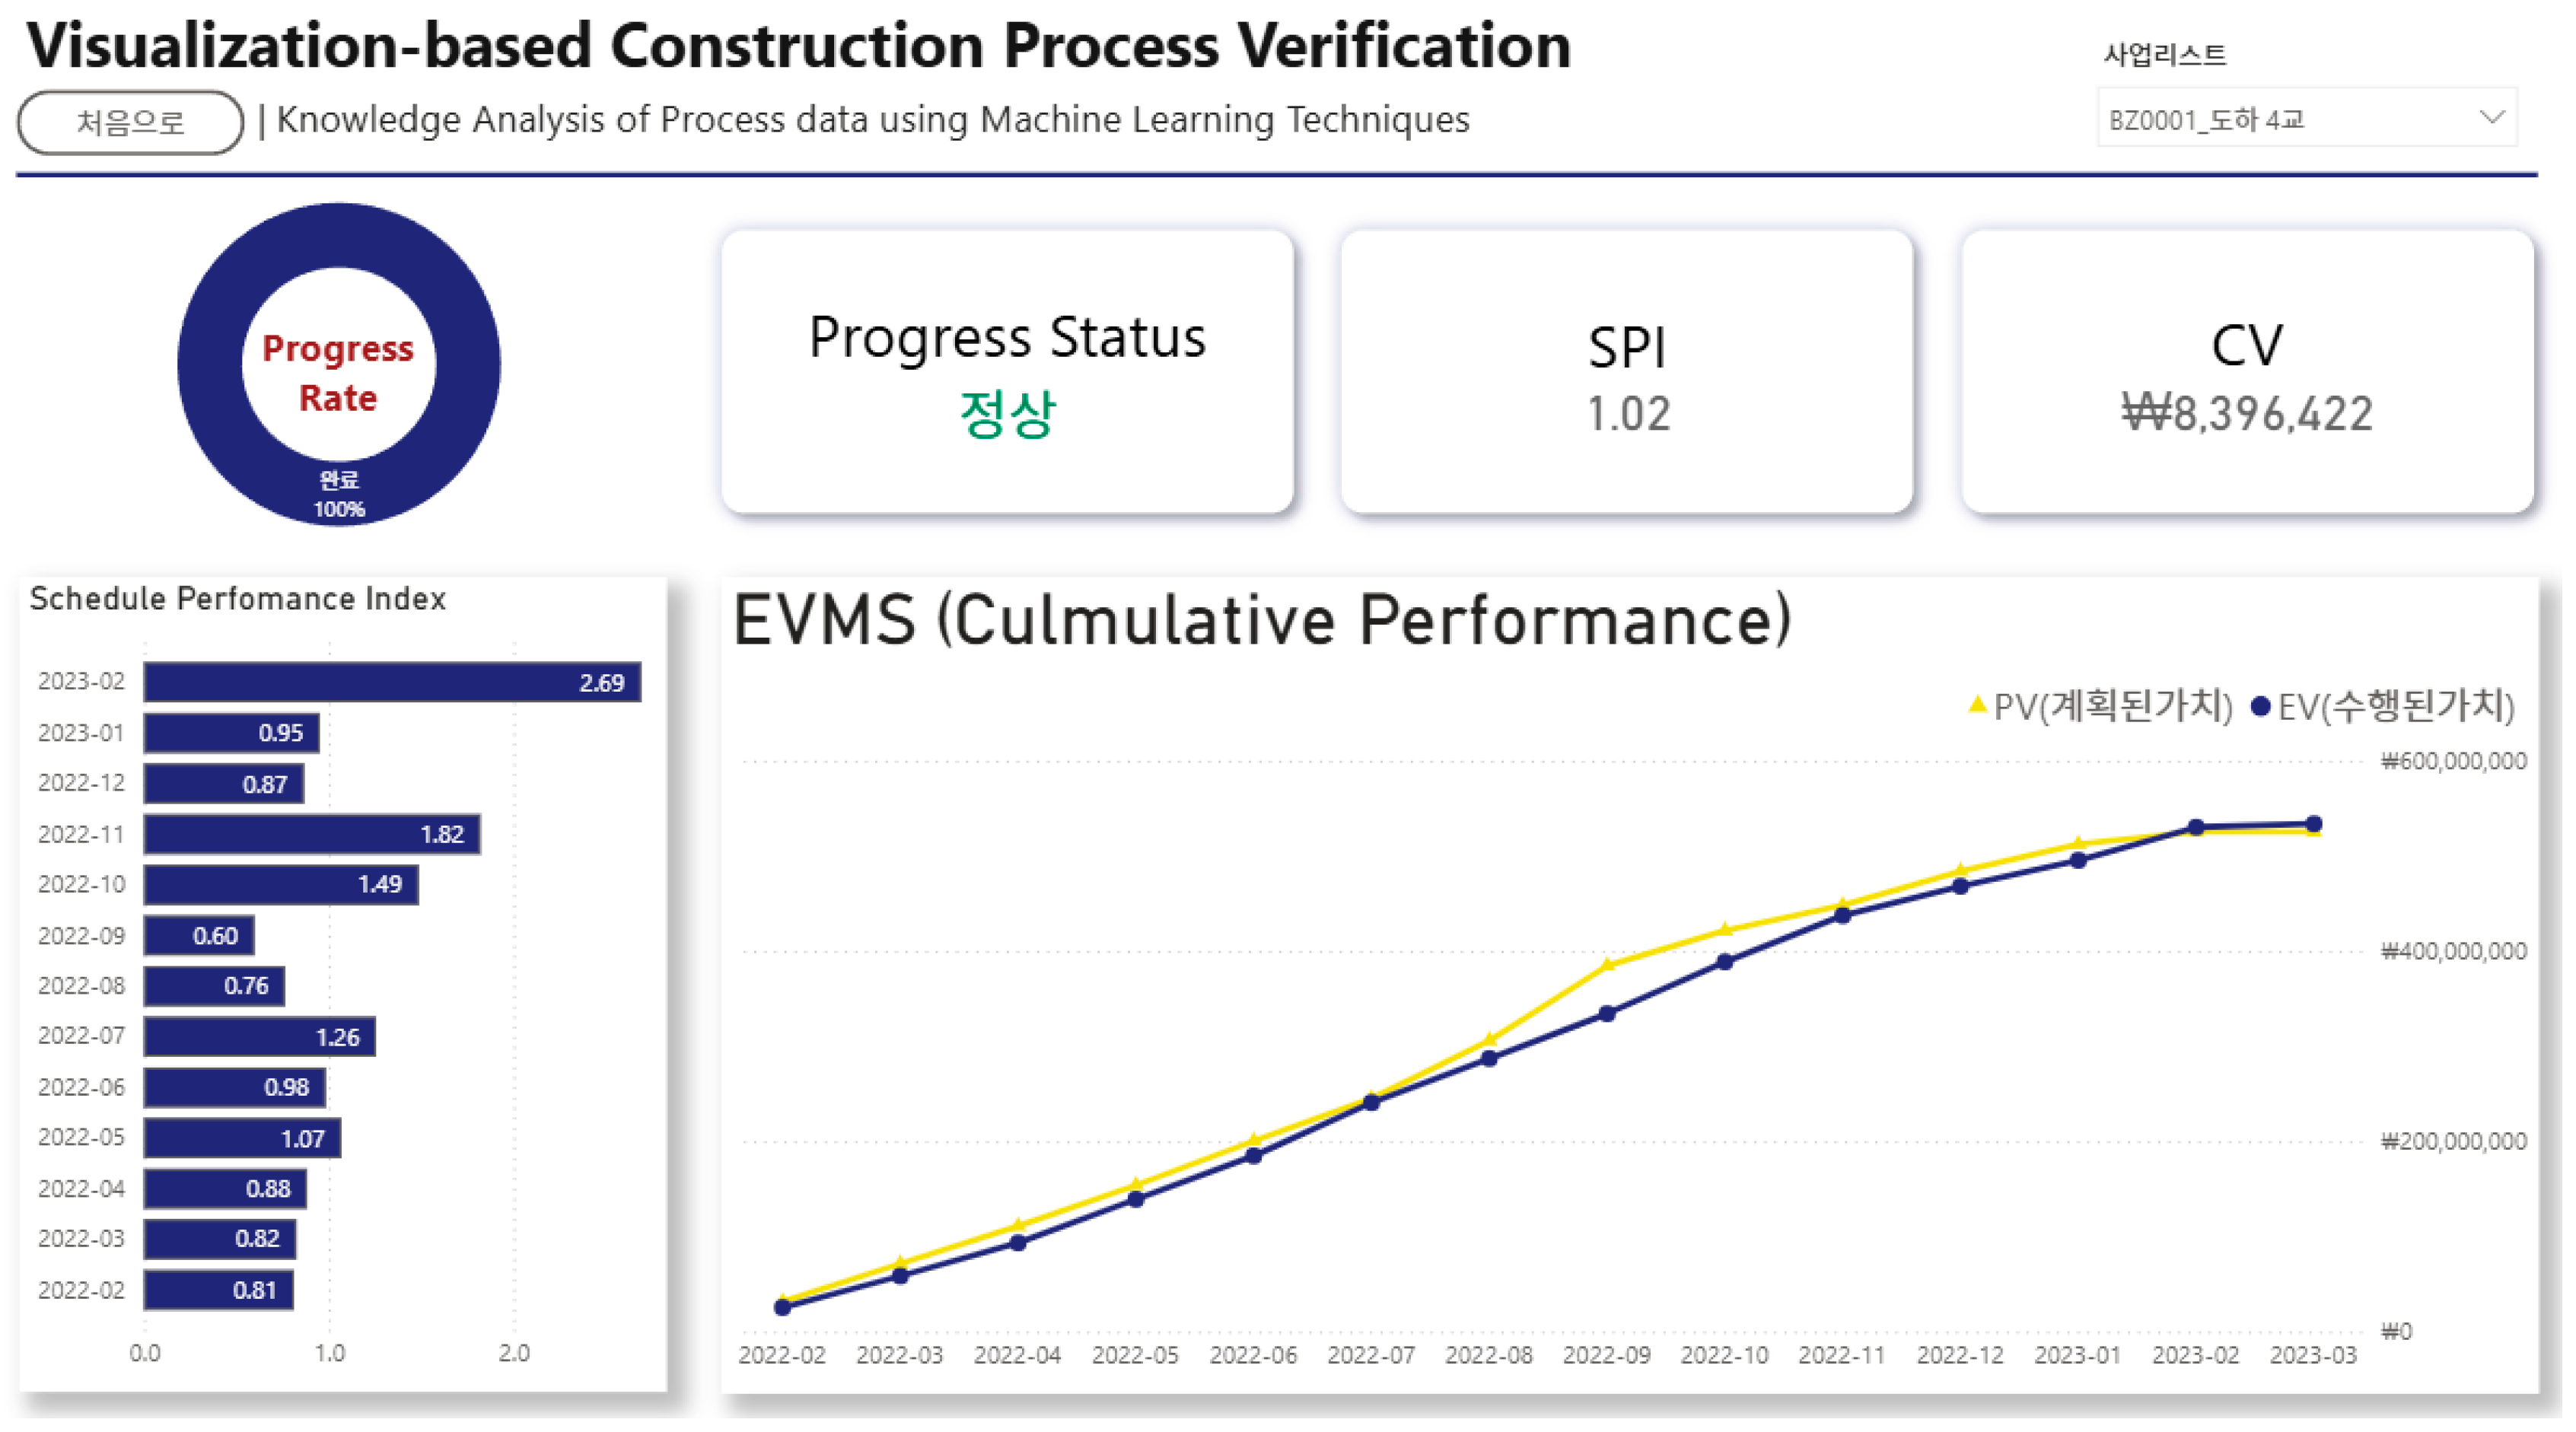
To complement the quantitative comparisons in Table 4, project performance was further assessed using the Earned Value Management System (EVMS) framework implemented in the System. Figure 23 illustrates the visualization dashboard, where cumulative plan–actual progress and schedule performance indicators are monitored in real time.
For the Doha No.4 bridge, the cumulative SPI reached 1.02, indicating that the project achieved slightly earlier progress than planned. However, because the deviation was marginal, this outcome is interpreted not as a substantial schedule gain but as evidence of strong consistency between planned and actual execution.
The visualization also highlights that deviations in specific activities (e.g., resource overruns in the installation stage) did not significantly distort the overall progress trajectory. This reflects the robustness of the proposed Bayesian regression-based TCTO framework when applied to repetitive prefabricated construction contexts.

4.5. Discussion

The empirical validation demonstrates that the proposed Bayesian regression-based TCTO framework and Smart Delivery System can achieve high consistency between planned and actual outcomes in prefabricated bridge girder projects. The observed deviations in total duration (3.7%) and total resource allocation (1.47%) confirm that the framework is robust in modeling repetitive construction processes with probabilistic task durations. For managerial context, we treat project-level duration and manpower within ±5% and SPI in 0.95–1.05 as “on plan”; SPI = 1.02 therefore indicates execution within the normal control band, meaning earned value tracks planned value within ≈±5% and overall plan–actual alignment within acceptable limits.
Several implications arise from these findings. First, the incorporation of Bayesian updating enables the framework to progressively refine standard task times (ST), reflecting learning effects and reducing prediction uncertainty as more project data become available. This provides a self-correcting mechanism particularly suited to repetitive prefabricated environments. Second, the SPI-based performance monitoring highlights that even when deviations occur at the activity level (e.g., unexpected manpower surges during installation), the overall project schedule can remain stable, underlining the resilience of the system’s integrated approach. The installation-stage manpower spike was local, while the assembly stage—which dominates total labor—remained within the ±5% band, keeping project totals acceptable. Third, the visualization features of the Smart Delivery System not only improve transparency for stakeholders but also enable proactive management by identifying schedule risks early.
Nonetheless, limitations should be acknowledged. The validation focused on prefabricated bridge girder construction, which inherently exhibits high repeatability. Application to non-prefabricated or highly customized projects may present greater uncertainty, requiring further adaptation of the framework. Moreover, the current study excluded Actual Cost (AC) metrics due to structural and contractual constraints in the Korean construction industry. While appropriate in this context, this exclusion may limit comparability with international EVMS practices.
Overall, the discussion underscores the potential of integrating probabilistic scheduling, optimization algorithms, and digital performance logging into a closed-loop management cycle, while also highlighting the need for broader applicability and refinement.

5. Conclusions

This study developed and validated a closed-loop construction management framework for prefabricated bridge girders, integrating object-based planning, digital logging, SPI-based performance analysis, and Bayesian updating. The framework was first applied to four prefabricated girder projects (Jangdong, Jeonggok No.1, Jukjang, Ip-am), where planned and actual outcomes showed close alignment in duration and manpower. It was then tested in a full closed-loop application on the Doha No.4 Bridge, where planning, execution logging, and SPI-based performance visualization were integrated. By applying the system to real-world projects, this research indicated that schedule and resource consistency were maintained, with total deviations limited to 3.7% (duration) and 1.47% (resources). Interpreted against routine control bands (SPI ≈ 0.95–1.05; ±5% at project level), these outcomes suggest “on-plan” execution without the need for re-baselining. Bayesian regression with updating appeared to provide probabilistic ST estimates that incrementally improved prediction accuracy and reflected learning effects across repetitive projects. The Smart Delivery System enabled end-to-end integration—from planning through execution logging to performance evaluation—supporting transparency and proactive risk management. SPI analysis suggests reasonable alignment between plan and execution, demonstrating the reliability of the proposed approach in repetitive prefabricated environments.
This research is expected to help narrow the gap between conventional project management and manufacturing-oriented construction practices in Korea. At the same time, it acknowledges that the exclusion of AC metrics and the focus on prefabricated methods constrain generalizability. We chose prefabricated bridge girders deliberately because their repetitive, modular production–transport–erection cycle favors statistical learning of ST and object-level logging, while current digitalization on construction sites is still nascent and broader data are scarce; in this setting, girders offer a tractable starting point for robust data collection and model training. In Korea, superstructure girders are often delivered by patent-holding vendors while substructures are executed by different contractors; this split also made a girder-focused scope practical for field deployment at this stage. In short, the reasons behind our limitations—data heterogeneity and cost-data availability—outline a pragmatic deployment roadmap (standardized unit definitions and logging, conservative update cadence, AC/CPI integration).
Looking ahead, we plan to loop from the girder scope to the full bridge (super- and substructure) as data maturity improves, and to generalize to other prefabricated domains (e.g., modular tunnel components, segments, panels) once consistent unit definitions and logs are available. Where feasible, we also intend to incorporate cost performance (AC/CPI) into the same loop to couple schedule and cost control.

Author Contributions

Conceptualization, D.Y.K. and H.S.K.; methodology, D.Y.K.; software, D.Y.K.; validation, D.Y.K. and H.S.K.; formal analysis, D.Y.K.; investigation, D.Y.K.; resources, R.G.K.; data curation, R.G.K.; writing—original draft preparation, D.Y.K.; writing—review and editing, H.S.K.; visualization, D.Y.K.; supervision, H.S.K.; project administration, H.S.K.; funding acquisition, H.S.K. All authors have read and agreed to the published version of the manuscript.

Funding

This research was conducted with the support of the “National R&D Project for Smart Construction Technology (No. RS-2020-KA156050)” funded by the Korea Agency for Infrastructure Technology Advancement under the Ministry of Land, Infrastructure and Transport, and managed by the Korea Expressway Corporation.

Data Availability Statement

The data presented in this study are available on request from the corresponding author. The data are not publicly available due to privacy or project restrictions.

Acknowledgments

The authors would like to acknowledge the support from the Korea Agency for Infrastructure Technology Advancement (KAIA) and the Korea Expressway Corporation for their administrative and technical assistance during the project.

Conflicts of Interest

Author Dae Young Kim was employed by the company Saman Corporation. Author Ryang Gyun Kim was employed by the company Jangheon Corporation. Author Hyun Seok Kwak was employed by the company Hanmac Engineering. The authors declare that this study received funding from Korea Expressway Corporation. The funder was not involved in the study design, collection, analysis, interpretation of data, the writing of this article or the decision to submit it for publication. The remaining authors declare that they have no commercial or financial conflicts of interest.

Abbreviations

The following abbreviations are used in this manuscript:
STStandard Time
TCTOTime–Cost Trade–Off
OSCOff-Site Construction
EVMSEarned Value Management System
SPISchedule Performance Index
PVPlanned Value
EVEarned Value
ACActual Cost

References

  1. McKinsey Global Institute. Reinventing Construction: A Route to Higher Productivity; McKinsey & Company: New York, NY, USA, 2017. [Google Scholar]
  2. Chan, D.W.M.; Kumaraswamy, M.M. A Comparative Study of Causes of Time Overruns in Hong Kong Construction Projects. Int. J. Proj. Manag. 1997, 15, 55–63. [Google Scholar] [CrossRef]
  3. Flyvbjerg, B.; Holm, M.S.; Buhl, S. Underestimating Costs in Public Works Projects: Error or Lie? J. Am. Plan. Assoc. 2007, 68, 279–295. [Google Scholar] [CrossRef]
  4. Love, P.E.D.; Edwards, D.J.; Irani, Z.; Walker, D.H.T. Project Pathogen: The Anatomy of Project Cost Overruns. IEEE Trans. Eng. Manag. 2009, 56, 548–561. [Google Scholar] [CrossRef]
  5. Hwang, B.G.; Ng, W.J. Project Management Knowledge and Skills for Green Construction: Overcoming Challenges. Int. J. Proj. Manag. 2013, 31, 272–284. [Google Scholar] [CrossRef]
  6. Cynthia, O.U. Implementation of Project Evaluation and Review Technique (PERT) and Critical Path Method (CPM): A Comparative Study. Int. J. Ind. Oper. Res. 2020, 3, 4. [Google Scholar] [CrossRef]
  7. Nasirian, A.; Arashpour, M.; Assasi, B. Multiskilled Human Resource Problem in Off-Site Construction. In Proceedings of the International Symposium on Automation and Robotics in Construction, Berlin, Germany, 20–25 July 2018; pp. 1017–1021. [Google Scholar] [CrossRef]
  8. Barkokebas, B.; Brown, R.; Altaf, M.S.; Hamzeh, F. Evaluation of Multi-Skilled Labor in an Off-Site Construction Facility using Computer Simulation Hybrid Approach. In Proceedings of the 37th CIB W78 Information Technology for Construction Conference, Sao Paulo, Brazil, 2–4 June 2020. [Google Scholar]
  9. Durdyev, S.; Ismail, S. Offsite Manufacturing in the Construction Industry for Productivity Improvement. Eng. Manag. J. 2019, 31, 62–76. [Google Scholar] [CrossRef]
  10. Yan, X.; Zhang, H.; Zhang, W. Intelligent Monitoring and Evaluation for the Prefabricated Construction Schedule. Comput. Aided Civ. Infrastruct. Eng. 2023, 38, 391–407. [Google Scholar] [CrossRef]
  11. Li, Y.; Wu, J.; Hao, Y.; Gao, Y.; Chai, R.; Zhang, B. Process Scheduling for Prefabricated Construction Based on Multi-Objective Optimization Algorithm. Autom. Constr. 2024, 168, 105809. [Google Scholar] [CrossRef]
  12. Lyons, J.S. Critical Success Factors for Prefabricated Construction Firms. Master’s Thesis, Oregon State University, Corvallis, OR, USA, 2024. [Google Scholar]
  13. Bortolini, R.; Formoso, C.T.; Viana, D.D. Site Logistics Planning and Control for Engineer-to-Order Prefabricated Building Systems Using BIM 4D Modeling. Autom. Constr. 2019, 98, 248–264. [Google Scholar] [CrossRef]
  14. Wang, Q.; Shen, C.; Guo, Z.; Zhu, K.; Zhang, J.; Huang, M. Research on the Barriers and Strategies to Promote Prefabricated Buildings in China. Buildings 2023, 13, 1200. [Google Scholar] [CrossRef]
  15. Wu, H.; Qian, Q.K.; Straub, A.; Visscher, H. Exploring Transaction Costs in the Prefabricated Housing Supply Chain in China. J. Clean. Prod. 2019, 226, 550–563. [Google Scholar] [CrossRef]
  16. Luo, L.; Jin, X.; Shen, G.Q.; Wang, Y.; Liang, X. Supply Chain Management for Prefabricated Building Projects in Hong Kong. J. Manag. Eng. 2020, 36, 05020007. [Google Scholar] [CrossRef]
  17. Li, C.Z.; Hong, J.; Xue, F.; Shen, G.Q.; Xu, X.; Luo, L. SWOT Analysis and Internet of Things-Enabled Platform for Prefabrication Housing Production in Hong Kong. Habitat Int. 2016, 57, 187–196. [Google Scholar] [CrossRef]
  18. Cheng, S.; Zhou, X.; Zhang, Y.; Duan, M.; Gao, J. Study on Resilience Factors and Enhancement Strategies in Prefabricated Building Supply Chains. Buildings 2024, 14, 195. [Google Scholar] [CrossRef]
  19. Leach, L.P. Critical Chain Project Management; Artech House: Boston, MA, USA, 2005. [Google Scholar]
  20. Williams, T. Assessing Extension of Time Delays on Major Projects. Int. J. Proj. Manag. 2003, 21, 19–26. [Google Scholar] [CrossRef]
  21. Shin, N.R.; Kim, Y.S.; Han, S.W.; Yeom, D.J. Development of a Decision Support System for Production Scheduling of Precast Concrete Members. J. Archit. Inst. Korea Struct. Constr. 2016, 32, 31–40. [Google Scholar] [CrossRef]
  22. Koo, B.; Fischer, M. Feasibility Study of 4D CAD in Commercial Construction. J. Constr. Eng. Manag. 2000, 126, 251–260. [Google Scholar] [CrossRef]
  23. Feng, C.W.; Liu, L.; Burns, S.A. Stochastic Construction Time-Cost Trade-Off Analysis. J. Comput. Civ. Eng. 1997, 11, 45–52. [Google Scholar] [CrossRef]
  24. De, P.; Dunne, E.J.; Ghosh, J.B. Complexity of the Discrete Time–Cost Tradeoff Problem for Project Networks. Oper. Res. 1997, 45, 302–306. [Google Scholar] [CrossRef]
  25. Sobieraj, J.; Metelski, D. Project Risk in Construction Schedules: Monte Carlo & Time-at-Risk Approach. Appl. Sci. 2022, 12, 1044. [Google Scholar] [CrossRef]
  26. Ezeldin, A.S.; Soliman, A. Hybrid Time–Cost Optimization of Nonserial Repetitive Construction Projects. J. Constr. Eng. Manag. 2009, 135, 42–55. [Google Scholar] [CrossRef]
  27. Lipke, W. Schedule Is Different. Meas. News 2003, 31, 31–34. [Google Scholar]
  28. Vanhoucke, M. Using Activity Sensitivity and Network Topology Information to Monitor Project Time Performance. Omega 2010, 38, 359–370. [Google Scholar] [CrossRef]
  29. Narbaev, T.; De Marco, A. Combination of Growth Model and Earned Schedule to Forecast Project Cost at Completion. J. Constr. Eng. Manag. 2014, 140, 04013039. [Google Scholar] [CrossRef]
  30. Namazian, A.; Haji Yakhchali, S.; Yousefi, V.; Tamošaitienė, J. Combining Monte Carlo Simulation and Bayesian Networks Methods for Assessing Completion Time of Projects under Risk. Int. J. Environ. Res. Public Health 2019, 16, 5024. [Google Scholar] [CrossRef] [PubMed]
  31. Chen, L.; Lu, Q.; Han, D. A Bayesian-Driven Monte Carlo Approach for Managing Construction Schedule Risks of Infrastructures under Uncertainty. Expert Syst. Appl. 2023, 212, 118810. [Google Scholar] [CrossRef]
  32. Wu, W.; Lu, Z.; Sun, Y.; Ang, M.H., Jr. Dynamic Task Assignment of Multiple Heterogeneous Unmanned Aerial Vehicles Based on Consensus with Uncertainties. IEEE Aerosp. Electron. Syst. Mag. 2024, 40, 48–60. [Google Scholar] [CrossRef]
  33. Szwarcfiter, C.; Herer, Y.T.; Shtub, A. Balancing Project Schedule, Cost, and Value under Uncertainty: A Reinforcement Learning Approach. Algorithms 2023, 16, 395. [Google Scholar] [CrossRef]
  34. Kostrzewa-Demczuk, P. Construction Schedule versus Various Constraints and Risks. Appl. Sci. 2024, 14, 196. [Google Scholar] [CrossRef]
  35. Lu, Y.; Liu, C.; Wang, K.I.-K.; Huang, H.; Xu, X. Digital Twin-Driven Smart Manufacturing: Connotation, Reference Model, Applications and Research Issues. Robot. Comput. Integr. Manuf. 2020, 61, 101837. [Google Scholar] [CrossRef]
  36. Wang, Y.; Liao, S.; Gong, Z.; Deng, F.; Yin, S. Enhancing Construction Management Digital Twins through Process Mining of Progress Logs. Sustainability 2024, 16, 10064. [Google Scholar] [CrossRef]
  37. Hwang, B.G.; Shan, M.; Looi, K.Y. Knowledge-Based Decision Support System for Prefabricated Volumetric Construction. Autom. Constr. 2018, 94, 246–254. [Google Scholar] [CrossRef]
  38. Kim, D.-Y.; Chung, T.; Kim, R.-G. Development of Time-Cost Trade-Off Algorithm for JIT System of Prefabricated Girder Bridges (Nodular Girder). J. Korean Soc. Civ. Eng. Constr. Manag. 2023, 24, 12–19. [Google Scholar]
  39. Jordan, M.; Kleinberg, M.; Schӧlkopf, B. Information Science and Statistics: Its benefits and implementation. In Bayesian Probabilities; Springer Science: New York, NY, USA, 2006; pp. 24–28. [Google Scholar]
  40. Nam, J.Y.; Kim, M.J. A study on the Development of BIM Property Classification System in Road and River Field. J. Korea Acad. Ind. Coop. Soc. 2019, 20, 773–784. [Google Scholar]
  41. Xie, L.; Chen, Y.; Chang, R. Scheduling Optimization of Prefabricated Construction Projects by Genetic Algorithm. Appl. Sci. 2021, 11, 5531. [Google Scholar] [CrossRef]
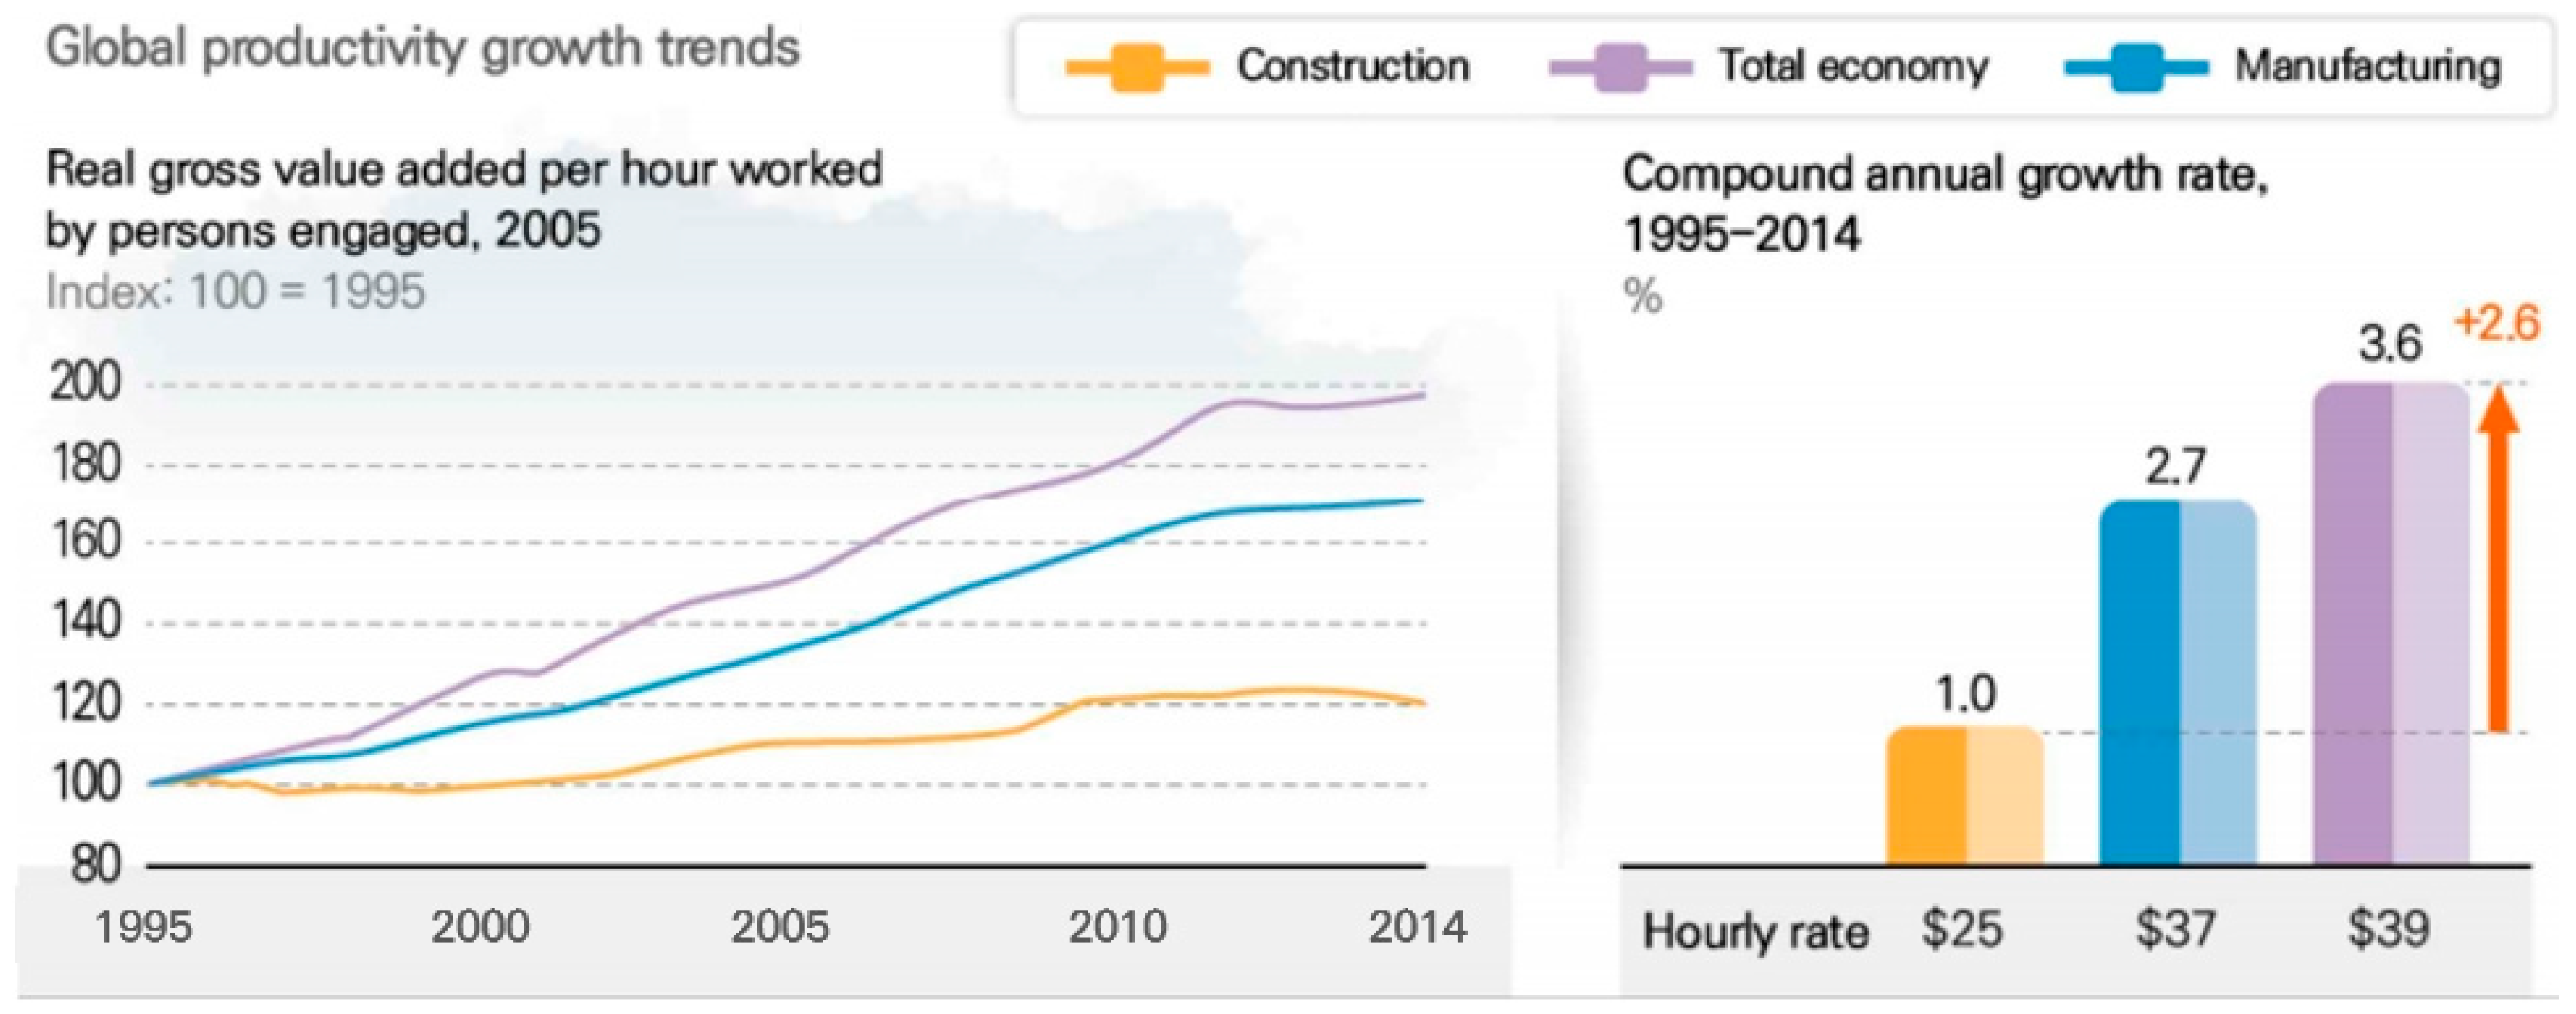
Figure 1. Comparison of productivity growth: construction, economy and manufacturing.
Buildings 15 04168 g001
Figure 2. Closed-loop PDCA framework for schedule optimization and performance feedback; (a) utilization process; (b) dataflow.
Buildings 15 04168 g002
Figure 3. Prefabricated bridge nodular girder components.
Buildings 15 04168 g003
Figure 4. Segmented construction process definition for prefabricated nodular girder.
Buildings 15 04168 g004
Figure 5. Work breakdown structure (nodular girder).
Buildings 15 04168 g005
Figure 6. Algorithm design flow for time–cost trade-off optimization.
Buildings 15 04168 g006
Figure 7. Object-based logging and integration of historical data.
Buildings 15 04168 g007
Figure 8. Integrated data structure covering factory and construction stages for plan vs. actual performance analysis.
Buildings 15 04168 g008
Figure 9. The Bayesian method and example of a trip lot.
Buildings 15 04168 g009
Figure 10. Iterative TCTO optimization process and schedule convergence.
Buildings 15 04168 g010
Figure 11. Smart delivery system interface for input parameters and constraints.
Buildings 15 04168 g011
Figure 12. Optimized baseline schedule and resource allocation outputs.
Buildings 15 04168 g012
Figure 13. Process management user interface (dashboard).
Buildings 15 04168 g013
Figure 14. Supply chain management interface.
Buildings 15 04168 g014
Figure 15. Human resource and equipment management interface.
Buildings 15 04168 g015
Figure 16. Quality management interface.
Buildings 15 04168 g016
Figure 17. Safety management interface.
Buildings 15 04168 g017
Figure 18. BIM-based construction progress visualization interface.
Buildings 15 04168 g018
Figure 19. Project collaboration and communication interface.
Buildings 15 04168 g019
Figure 20. Comparison of posterior distributions of ST with and without prior updating.
Buildings 15 04168 g020
Figure 21. Visualization of plan vs. actual performance for comparative projects.
Buildings 15 04168 g021
Figure 22. Comparative of plan vs. actual performance (top L.: Jangdong; top R.: Jeonggok; bottom L.: Jukjang; bottom R.: Ip-am).
Buildings 15 04168 g022
Figure 23. Plan vs. actual performance visualization using EVMS.
Buildings 15 04168 g023
Table 1. Training Data for Regression Model.
NoProjectContract DateGirderResourcesPeriod
1Onjikcheon20222449633
2Guyongcheon20221627621
3KTX No. 120231823329
4KTX No. 220231514820
5Jeonhwa No. 120231218420
6Jeonhwa No. 220231214423
Table 2. Project Information for TCTO Algorithm Verification.
NoProjectContract DateGirderResourcesPeriod
1Jangdong2023814714
2Jeonggok20231622322
3Jukjang20232025424
4Ip-am20231219618
Table 3. Planed vs. Actual Durations and Resource.
NoProjectDuration PlanDuration ActualResource PlanResource ActualDuration
Deviation
Resource
Deviation
1Jangdong14141501470.00−2.04
2Jeonggok22222202230.00 1.35
3Jukjang26242602548.33−2.36
4Ip-am18181981960.00−1.02
Table 4. Comparison of Plan and Actual Duration and Resources (Doha No.4 Project).
NoActivitiesDuration PlanDuration ActualResource PlanResource ActualDuration DeviationResource Deviation
1Site Preparation68705625422.943.56
2Assembly157156143414140.641.39
3Installation144146783491.39347.44
4Cross Beam1061045704871.8914.56
5Site Demobilization44412751706.8238.18
6Total Duration377391291929623.711.47
Disclaimer/Publisher’s Note: The statements, opinions and data contained in all publications are solely those of the individual author(s) and contributor(s) and not of MDPI and/or the editor(s). MDPI and/or the editor(s) disclaim responsibility for any injury to people or property resulting from any ideas, methods, instructions or products referred to in the content.