Article

Experimental Performance of Timber–Concrete Slab-to-Concrete Wall Connections Under Gravitational and Lateral In-Plane Loading

by
Valentina Maldonado
1,2,3,*,
Hernán Santa María
1,2,3 and
Pablo Guindos
1,2,3,4
1
UC Center for Wood Innovation (CIM UC), Pontificia Universidad Católica de Chile, Av. Vicuña Mackenna 4860, Santiago 7820436, Chile
2
Centro Nacional de Excelencia para la Industria de la Madera (CENAMAD), Pontificia Universidad Católica de Chile, Av. Vicuña Mackenna 4860, Santiago 7820436, Chile
3
Department of Structural and Geotechnical Engineering, Pontificia Universidad Católica de Chile, Av. Vicuña Mackenna 4860, Santiago 7820436, Chile
4
Department of Engineering Construction and Management, Pontificia Universidad Católica de Chile, Av. Vicuña Mackenna 4860, Santiago 7820436, Chile
*
Author to whom correspondence should be addressed.
Buildings 2025, 15(22), 4161; https://doi.org/10.3390/buildings15224161
Submission received: 11 September 2025 / Revised: 4 October 2025 / Accepted: 5 October 2025 / Published: 19 November 2025
(This article belongs to the Section Building Structures)

Abstract

In this research, the lateral and gravitational behaviors of four timber–concrete composite (TCC) slab-to-wall connections were tested to study their lateral and gravitational behaviors. Results showed that the lateral behavior of the connections was mainly controlled by the concrete slab, since the timber sections and connections remained mostly unaffected. The experimental results were contrasted with a linear finite element model built in ETABS, thus explaining why the experimental lateral strength was six times larger than that analytically obtained via ACI 318-19. As for the gravitational tests, results showed a higher shear capacity in connections with screws as the wall-to-slab connector than those with bars. In general, all the connections showed much higher strength and stiffness than those typically required by design code standards.

1. Introduction

Timber–concrete composite (TCC) floors consist of a timber component, such as mass timber panels or beams, connected to an upper concrete layer. In this configuration, the concrete resists compressive stresses, timber resists tensile stresses, and the connection system transfers the shear forces between the two components.
The use of TCC floors instead of concrete floors makes the structure more sustainable, since timber is a carbon-neutral material; facilitates the construction process, since the timber serves as permanent formwork for the concrete; and reduces structural weight due to the low density of wood compared to concrete [1]. This reduction is particularly beneficial in regions susceptible to severe earthquakes because lighter structures demand lower lateral resistance [2]. Consequently, smaller structural elements may meet design requirements, leading to both cost and space savings. Recent studies confirm that TCC systems combine the structural efficiency of concrete with the sustainability advantages of timber, offering a competitive alternative to conventional concrete-only solutions [3,4].
The main role of the floors is to resist vertical forces and transfer them to support elements; they also play an important role in the lateral response of a structure [5]. Adequate in-plane stiffness of the floors and strength of the slab-to-wall connections are required to ensure transfer of the forces to the lateral load-resisting elements (walls and columns) [6].
In design procedures the connections are considered fully rigid or pinned; however, in practice, all wall-to-slab connections are semi-rigid [7], with characteristics that depend on the materials and configuration.
Extensive research [5,6,7,8,9,10] has investigated the lateral behavior of slab-to-wall connections in monolithic concrete structures. TCC slabs may be considered prefabricated as timber slabs with a concrete topping. From this perspective, connections between partially prefabricated slabs and precast walls in concrete structures have also been investigated [11,12]. In these studies, a portion of the slab was prefabricated with protruding U-shaped bars [11] or horizontal reinforcement bars [12,13], which would be embedded in the cast-in-place top concrete layer. Connections showed good lateral behavior, no visible damage when tested in a three-story structure [13], and higher ultimate strength and ductility compared to a monolithic control specimen [11].
Lukaszewska et al. [14] and Fragiacomo et al [15] studied the performance of connections for prefabricated TCC floors. Their investigation covered several connection types designed to facilitate the prefabrication process; however, all of these focused exclusively on the connection between the concrete topping and the underlying timber. Similarly, the study of Khorsandnia et al. [16] developed numerical models for the analysis of TCC beams, but its scope was limited to the timber–concrete connection only. More recently, Krug and Schänzlin [17] investigated the effect of negative bending moments in TCC slabs based on the assumption that an intermediate vertical concrete support was present. However, the joint between the concrete support and the TCC slab was created by joining the corresponding concrete reinforcements only. A similar approach was followed by Otero-Cháns et al. [3], who recently investigated a TCC system considering not just the TCC itself but also its connection to a concrete frame. The connections between the TCC slab and concrete columns were again achieved by reinforcement continuity, assuming that the entire structural system would be temporarily supported (e.g., by scaffolding) throughout the construction process.
In contrast, there is limited research on the behavior of the TCC slab-to-wall connection in timber structures. A commonly used solution for connecting cross-laminated timber (CLT) floors to timber walls is the use of steel angles. Van de Lindt et al. [18] performed a shake-table test on a two-story CLT building with angle brackets fastened with nails as wall-to-slab connections. The connectors, as well as the whole structure, performed within safety margins. However, a major drawback of the steel brackets is its poor performance when exposed to high temperatures, such as during a fire. Mahr et al. [19] quantified this effect by testing a CLT wall-to-slab connection composed of a steel L-bracket under elevated temperatures. Bolts and nails were used to anchor the brackets to the floor and the wall, respectively. Force–displacement curves showed degradation of the connection with increasing temperatures.
A study to evaluate the performance of a TCC slab–timber wall connection was executed by Newcombe et al. [20]. They studied five different types of connections composed of screws or nails at 45° or 90°, connecting either concrete to timber or timber to timber. Connections with inclined fasteners were found to have similar peak strength as orthogonal fasteners but provided significant higher stiffness. Inclined screws showed the highest ductility through the different typologies studied.
Although extensive research has been conducted on the interaction between concrete toppings and underlying timber in TCC systems, there is virtually no research addressing the seismic performance of connections between TCC slabs and concrete walls.
This study investigates the performance of four proposed connection types between TCC slabs and concrete walls, which are subjected to lateral and gravitational forces. An experimental program was conducted to characterize the load–slip relationships of each connection type. To complement the experimental findings and gain deeper insight into the experimental observations, a finite element model simulating the lateral load tests was developed in ETABS.

2. Hypothesis and Objectives

This study tests the hypothesis that the proposed connection systems for timber–concrete composite slabs to reinforced concrete wall assemblies will achieve at least the shear capacities predicted by current design codes for concrete (ACI 318-19 [21]) and timber structures (Eurocode 5 [22]).
The primary objective of this research is to test and analyze the performance of the connections between a composite slab and a concrete wall under lateral in-plane and gravitational loads. This study has three specific objectives: first, to select and design a representative set of connections that reflect a range of expected performance characteristics under loading, ensuring relevance to practical applications and research gaps; second, to conduct an experimental program aimed at capturing the load–displacement behavior, stiffness, and ultimate load capacity of these connections; and third, to evaluate and compare the performance of the tested connections using metrics (stiffness, ultimate load, and hysteretic parameters) derived from the experimental data. This approach enables a systematic assessment of how different connection types respond to loading conditions, providing insights into their relative effectiveness.

3. Materials and Methods

Four slab-to-wall connections with variations in the connector type and inclination were designed and tested under force-controlled procedures. The lateral behavior of the connections was studied through non-reversible cyclic in-plane loading of the slabs, whilst the gravitational performance was tested under monotonic loading perpendicular to the slab. Two repetitions of each configuration were performed.

3.1. TCC Slab

The TCC slab investigated consisted of a nail-laminated timber (NLT) base topped with a reinforced concrete layer, as illustrated in Figure 1. The NLT slab was constructed using 41 × 138 mm-dimensional Radiata pine lumber graded as G2 in accordance to NCh1198.Of2006 [23]. This type of slab was laterally connected using 3 common nails arranged in the pattern shown in Figure 2. The concrete topping was an 80 mm thick reinforced concrete layer composed of G25 concrete according to NCh1037:2009 [24], which was reinforced with the welded steel mesh ACMA C-196. Ready-mix concrete with a specified 28-day compressive strength of 25 MPa was used. Three control cylinders were found to have a mean compressive strength of 29.3 MPa at 28 days. These tests were executed following the provisions of NCh1037:2009 [24]. The slab is connected to two 150 mm thick concrete walls. See Figure 3 for the configuration and general dimensions of the specimen.

3.2. Connections

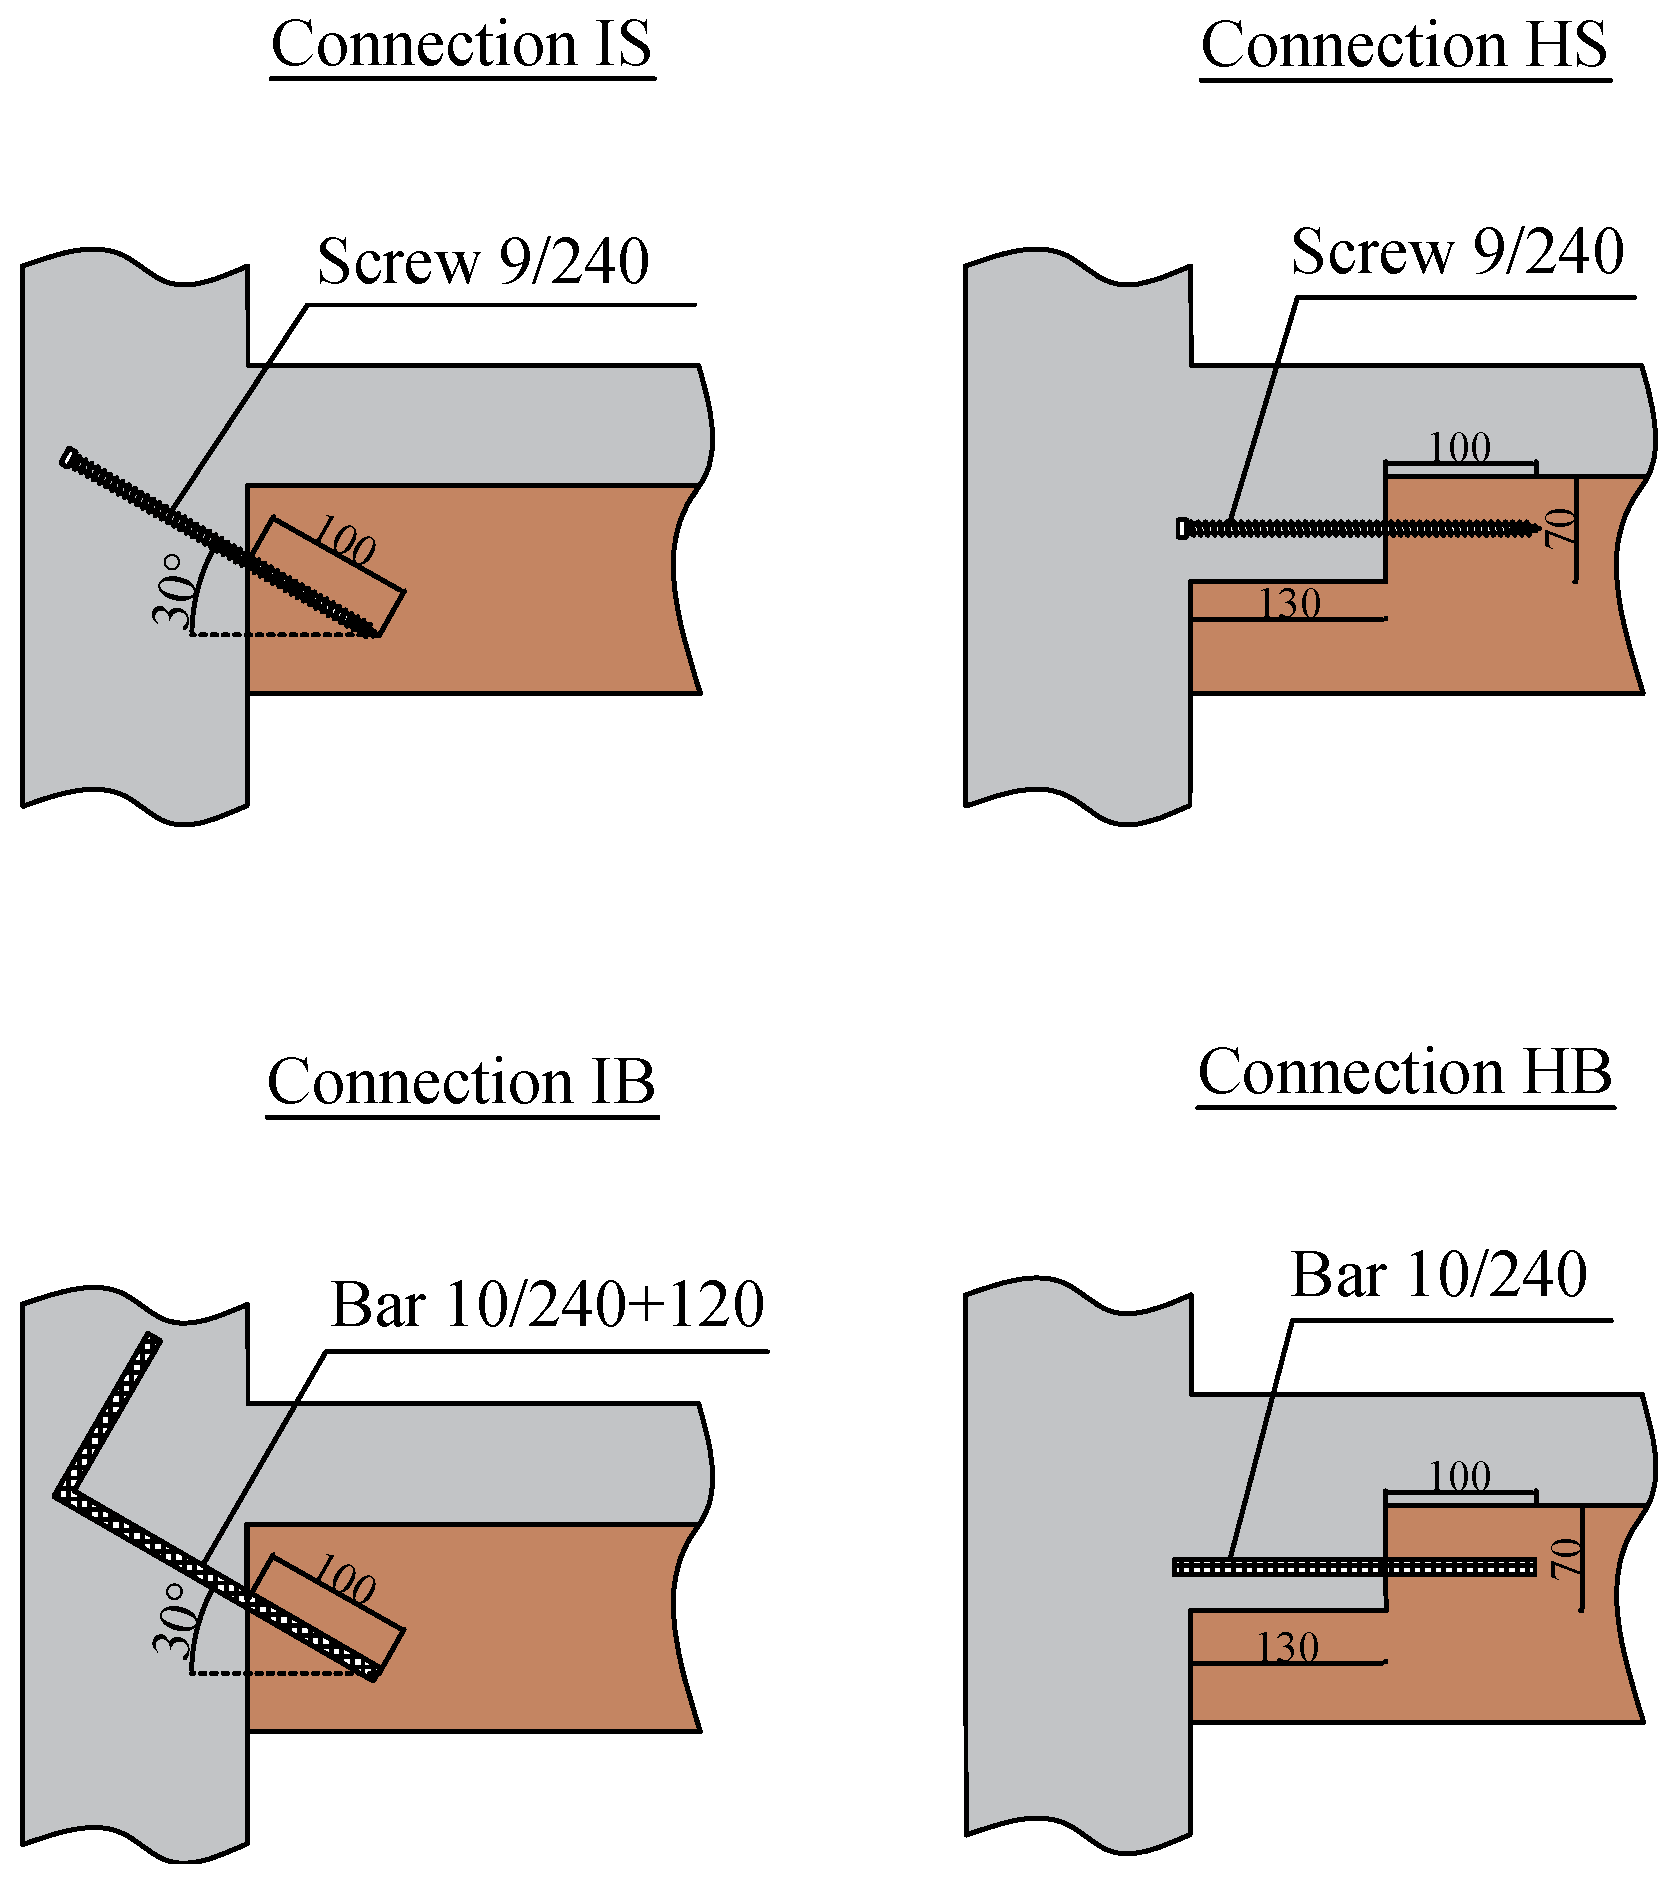
Four connection types were developed considering the common challenge of reinforcement interference in precast connections, particularly the congestion caused by the conflict of protruding bars from adjacent elements [25,26,27]. H-type connections were designed with pre-installed connectors that avoided interference with the vertical reinforcement mesh of the wall, while the I-type connections considered inclined connectors installed on site.
In the H-type connections, the NLT slab was fabricated with 130 mm long rectangular notches in two consecutive lumber beams on every fourth beam, allowing for a locally thickened concrete slab in those regions. Conversely, the I-type connections used connectors installed at a 30° angle, allowing their placement through the reinforcement mesh of the wall and maintaining the conventional NLT slab geometry.
The use of an inclined connector arises from the need to pass the connector through the wall reinforcement. While a horizontal installation is feasible for the first connector, in continuous slab configurations, the placement of a second horizontal connector is obstructed by the pre-positioned timber slab.
Two connectors were considered for each type of connection: 9 mm diameter, 240 mm long screws and 10 mm diameter, 240 mm long deformed bars. In both cases, 100 mm of the connector penetrated the timber section, while the remaining length was embedded in the concrete wall. For improved anchorage, the inclined deformed bars were fabricated with a 120 mm long, 90° bent hook at the embedded end. The screws were installed by driving them into smaller pre-drilled holes in the NLT slab, while the deformed bars were hammered into pre-drilled holes of equal diameter, without the use of an adhesive. The bars used for the connections were A630-420H-grade steel reinforcing bars with Fy = 420 MPa and Fu = 630 MPa [28], whilst the screws were Rothoblaas CTC9240 connectors, which were commonly used for timber–concrete floors.
The selection of these two alternatives aimed to compare the performance of purpose-designed screws with that of conventional reinforcing bars, which are more widely available and cost-effective. In practice, reinforcing bars of 8–10 mm diameter are common in concrete construction, which motivated the choice of 10 mm bars as representative of a standard, economical solution. Accordingly, 9 mm screws were selected to provide a comparable connector size.

3.3. Test Specimens

The test specimens consisted of two concrete walls, with a TCC slab in between, as shown in Figure 2. Each specimen incorporated one of the previously described connection, with three connectors along each interface.
The embedement of the connectors into the timber was defined as at least 10 times the connector diameter to ensure sufficient anchorage. Reinforcement of the slabs and walls was defined according to ACI 318-19 as ϕ 8@16 standard hooks at the slab–wall interface, with two layers of ϕ 8@20 mesh in the walls and C-196 welded mesh in the slab.
A summary of the lateral and gravitational test specimens is provided in Table 1. The alphanumeric code used to identify each specimen indicates the connection type (I or H), the connector type (S for screw and B for bar), the loading direction (S for seismic and G for gravitational), the loading protocol (M for monotonic and C for cyclic), and the repetition number (1 or 2).

3.4. Test Setup and Instrumentation

3.4.1. Gravitational Tests

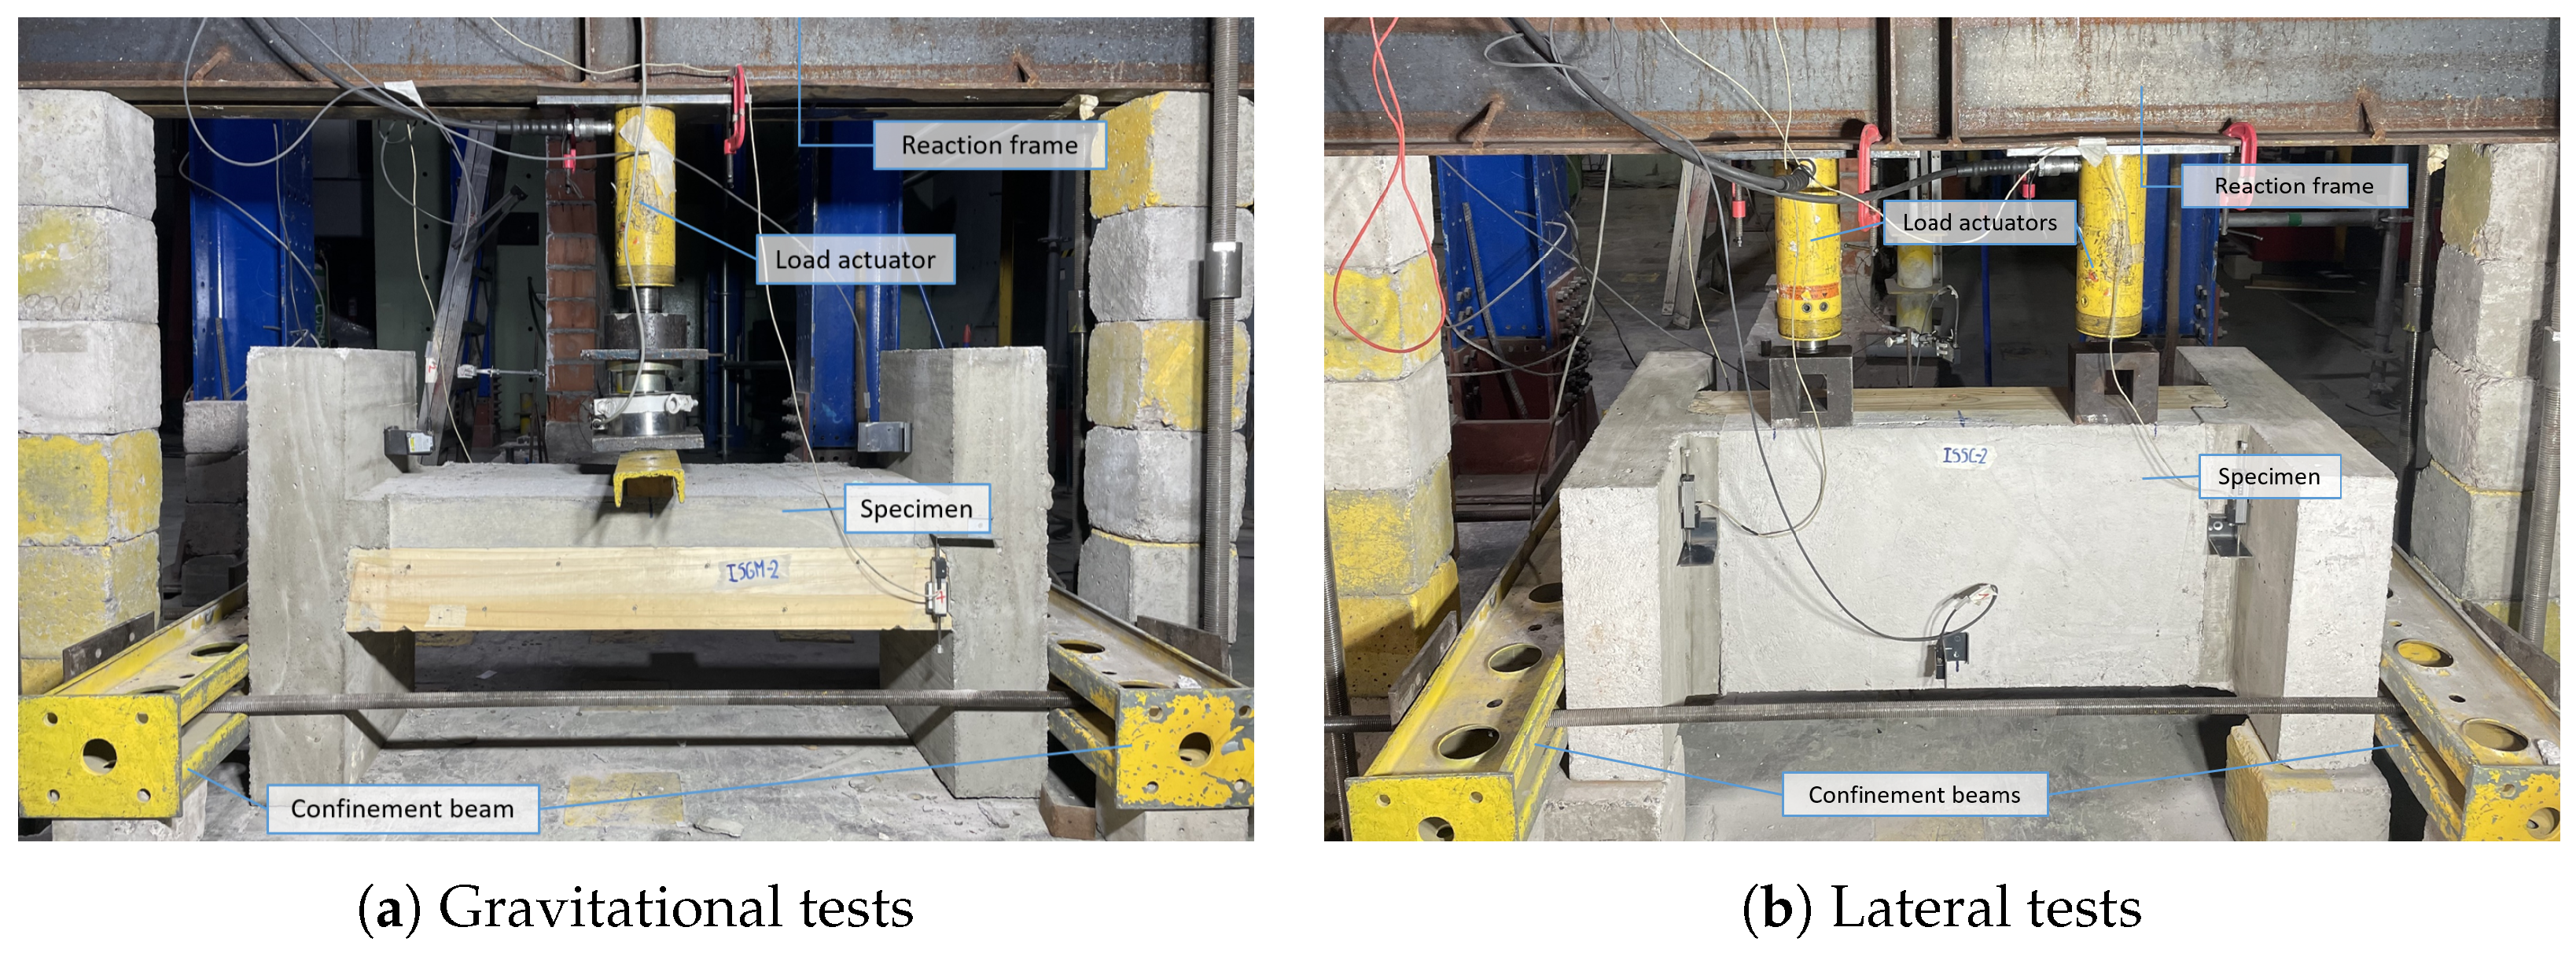
For the gravitational tests, a 300 kN hydraulic jack was used to apply a vertical load on top of the slab of the specimens. The hydraulic jack was positioned midway between the walls and supported by a reaction frame. The load was applied to the concrete topping through a rigid steel beam (Figure 4a). To restrict out-of-plane displacement of the walls, two steel beams with connecting steel rods were fixed at the base of the specimen.
The slip between the concrete topping and the timber relative to the face of the concrete walls was measured at five selected points using linear variable differential transducers (LVDTs). Data were recorded at a frequency of 5 Hz using a calibrated acquisition system. Prior to testing, the specimens were carefully leveled to ensure uniform contact, and all measuring devices were calibrated. All tests were conducted in a closed laboratory environment under stable temperature and humidity conditions.

3.4.2. Lateral Tests

For the lateral tests, the specimens were rotated in 90° so that the load could be applied parallel to the slab. Two 300 kN hydraulic jacks separated by a distance of 500 mm and supported by a reaction frame applied the lateral load to the concrete topping of the slab using 70 × 130 × 130 mm steel elements (Figure 4b). To restrict out-of-plane displacement of the walls, two steel beams with two steel rods were fixed at the base of the specimen.
Displacement measurements were recorded using six LVDTs: two measured the slip between the concrete slab and the walls, while two measured the slip between the timber slab and the walls, and two measured the displacement of the slab at the midpoint between the walls. Data were recorded at a frequency of 5 Hz using a calibrated acquisition system. Prior to testing, the specimens were carefully leveled to ensure uniform contact, and all measuring devices were calibrated. All tests were conducted in a closed laboratory environment under stable temperature and humidity conditions.

3.5. Loading Protocol

3.5.1. Gravitational Tests

Monotonic gravitational tests followed a procedure following the standard EN 26891:1991 [29]. Specimens were subjected to an increasing load up to 0.4 F m a x and maintained for 30 s, then decreased to 0.1 F m a x and maintained for 30 s. The load was gradually increased up to failure. The load rate was adjusted so that the test duration would be approximately 10 min. F m a x was initially estimated through theoretical analysis and later calibrated using preliminary tests.

3.5.2. Lateral Tests

Lateral tests followed a non-reversible cyclic force-controlled procedure. For the second repetition of each configuration, the loading protocol was modified to include higher amplitude cycles. The load rate was adjusted so that the test duration would be approximately 20 min. F m a x was initially estimated through theoretical analysis and later calibrated using preliminary tests. Figure 5 shows both loading protocols.

4. Results

Results regarding the failure mode, load–slip relationships, strength, and stiffness obtained in the gravitational and lateral tests are addressed in this section.

4.1. Gravitational Tests

4.1.1. Failure Mode

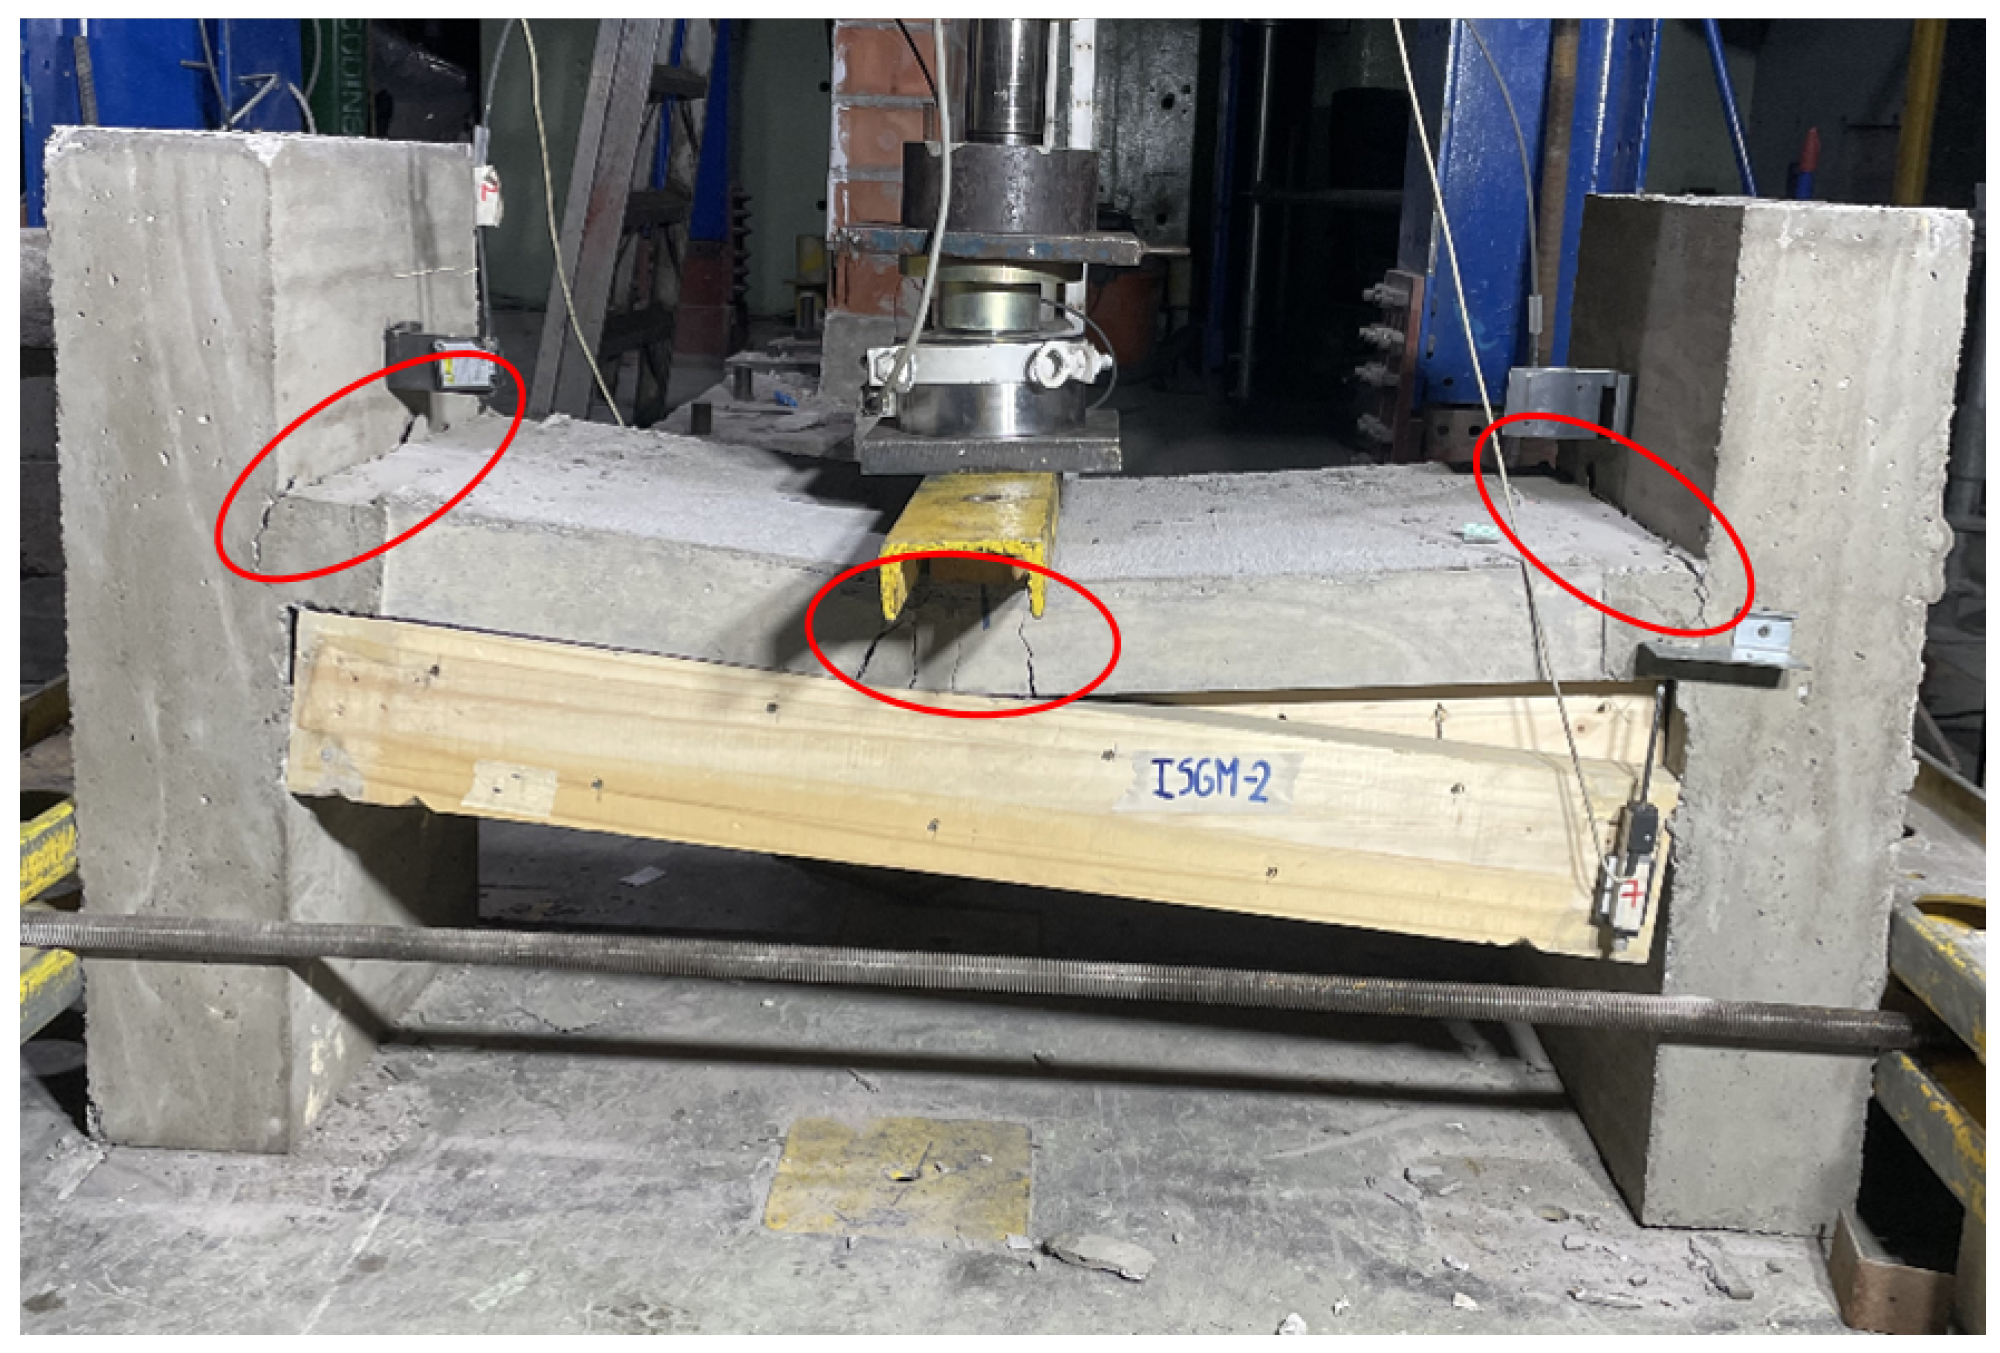
The typical failure mode observed in gravitational tests is illustrated in Figure 6. The first crack developed in all connections at a load of approximately 100 kN, forming as a vertical crack in the middle of the tension side of the slab. At the same time, cracks developed along the slab-to-wall interfaces. For I-type connections, these cracks formed at the slab–wall junction, whereas in H-type connections, they occurred further into the slab, approximately 130 mm from the walls, corresponding to the end of the thicker region of the concrete slab (see Figure 3).
As loading progressed, additional flexural cracks developed in some specimens, and the initial interface cracks (originating at the top of the slab) extended vertically through the slab depth. Shortly after the specimen reached its maximum load, failure occurred by splitting at the mid-span and/or at one of the slab-to-wall interfaces.
In all cases, the timber slab detached from the concrete slab topping at one interface, maintaining its straight shape, while the concrete slab curved in various ways. Considerable damage was observed in the in-plane connections, as the screws disengaged from the concrete slab, and in the slab-to-wall connections, where there was visible yielding of the connectors.
Some specimens were cut open after the tests to further observe the damage in the connectors, as shown in Figure 7. As can be seen, the connectors remained attached to the concrete, while bending occurred at the slab–wall interface.

4.1.2. Load–Slip Curves

The load–slip response of the concrete slabs is shown in Figure 8a. ISGM specimens exhibited higher ductility, with larger displacements before and after reaching their maximum capacity. HBGM, HSGM, and IBGM specimens showed a sudden drop in load after reaching their ultimate capacity, with ultimate displacements under 0.5 mm.
As for the timber slabs, the slips observed were larger than the ones measured in the concrete slab, with values going up to 6 mm in some cases (see their load–slip behavior in Figure 8b). A linear response is observed up to approximately 80 kN, followed by a gradual decrease in stiffness, leading to maximum capacity in most of the cases.

4.1.3. Strength

The average maximum loads obtained for each connection type are presented in Table 2. The lowest capacity observed for connection IBGM was 129 kN, while the largest was 200 kN in the HSGM specimen. Connections with screws exhibited ultimate capacities 25% higher than those with bars, likely because bars are more susceptible to slide given their lower pullout resistance.
Even though the failure modes of connections H and I were very different, the comparison of ultimate loads indicates minimal difference in strength, with a 3% variation in average maximum load.

4.1.4. Stiffness

The secant stiffness K s e c was calculated as the slope of the line connecting the points of the initial load and 0.4 F m a x . Results for the concrete slab are presented in Table 2. Large variability was observed between repetitions, which was attributable to the sensitivity of the reduced slip variation observed in the tests. Overall, H-type connections showed higher stiffness than I-type connections, and connections with bars exhibited higher stiffness than those with screws.

4.2. Lateral Tests

4.2.1. Failure Mode

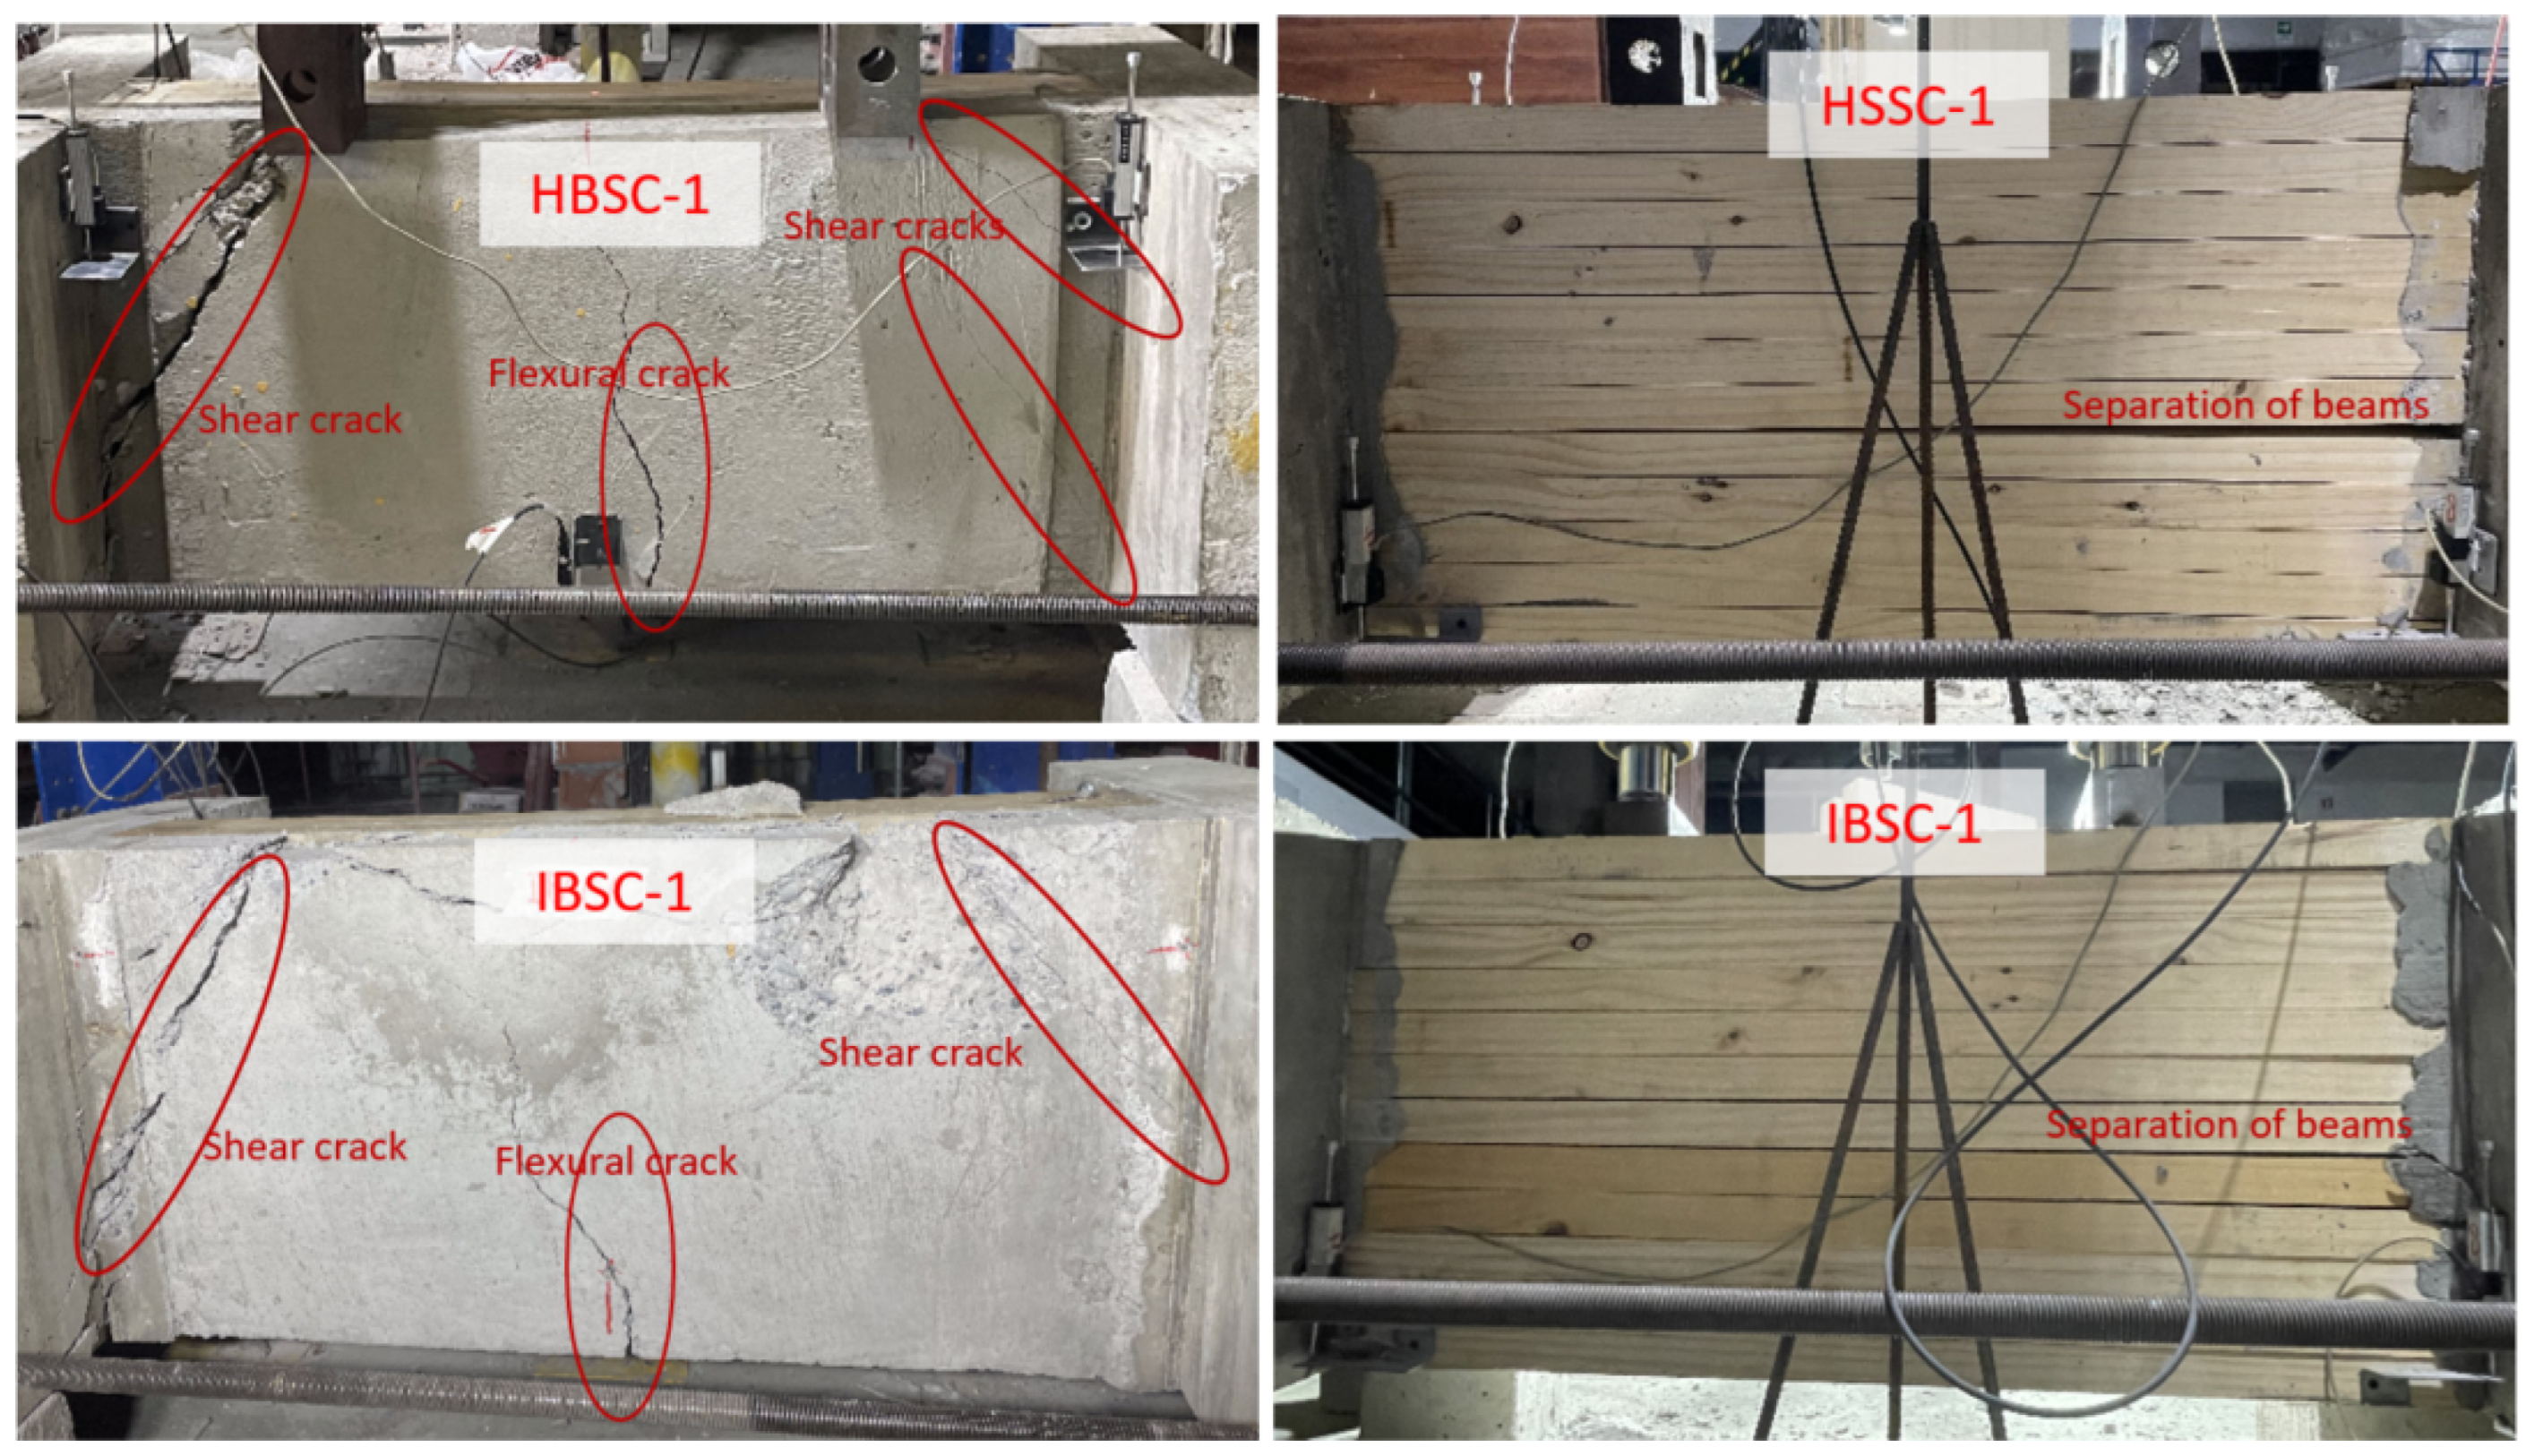
The typical failure mode observed in the lateral tests is presented in Figure 9. The first crack was observed at around 100 kN, regardless of the type of connection. This was a flexural crack near the mid-span of the tension side of the slab, which widened and extended during the first loading cycle. Secondary flexural cracks developed as loading increased, with most of them parallel to the walls, though some extended toward the loading points. At higher load levels (200 kN and above), shear cracks initiated from the loading points and propagated diagonally to the slab-to-wall interfaces. Between one and five shear cracks were observed in the concrete slabs, with an inclination that decreased as they got closer to the loading surface. In H-type connections, multiple shear cracks were observed at a single slab-wall interface, while in I-type connections, no more than one crack developed in each interface. As specimens approached peak load, the shear cracks widened, and eventually one of the interfaces failed in shear. In some cases, such as specimen IBSC-1 (see Figure 9), failure was also accompanied by concrete crushing below the loading points.
For the timber slabs, the typical damage was the detachment between some of the lumber members, typically around the central and bottom slab-to-wall connectors. Other than that, the timber slabs did not exhibit further visible damage.

4.2.2. Load–Slip Relationships

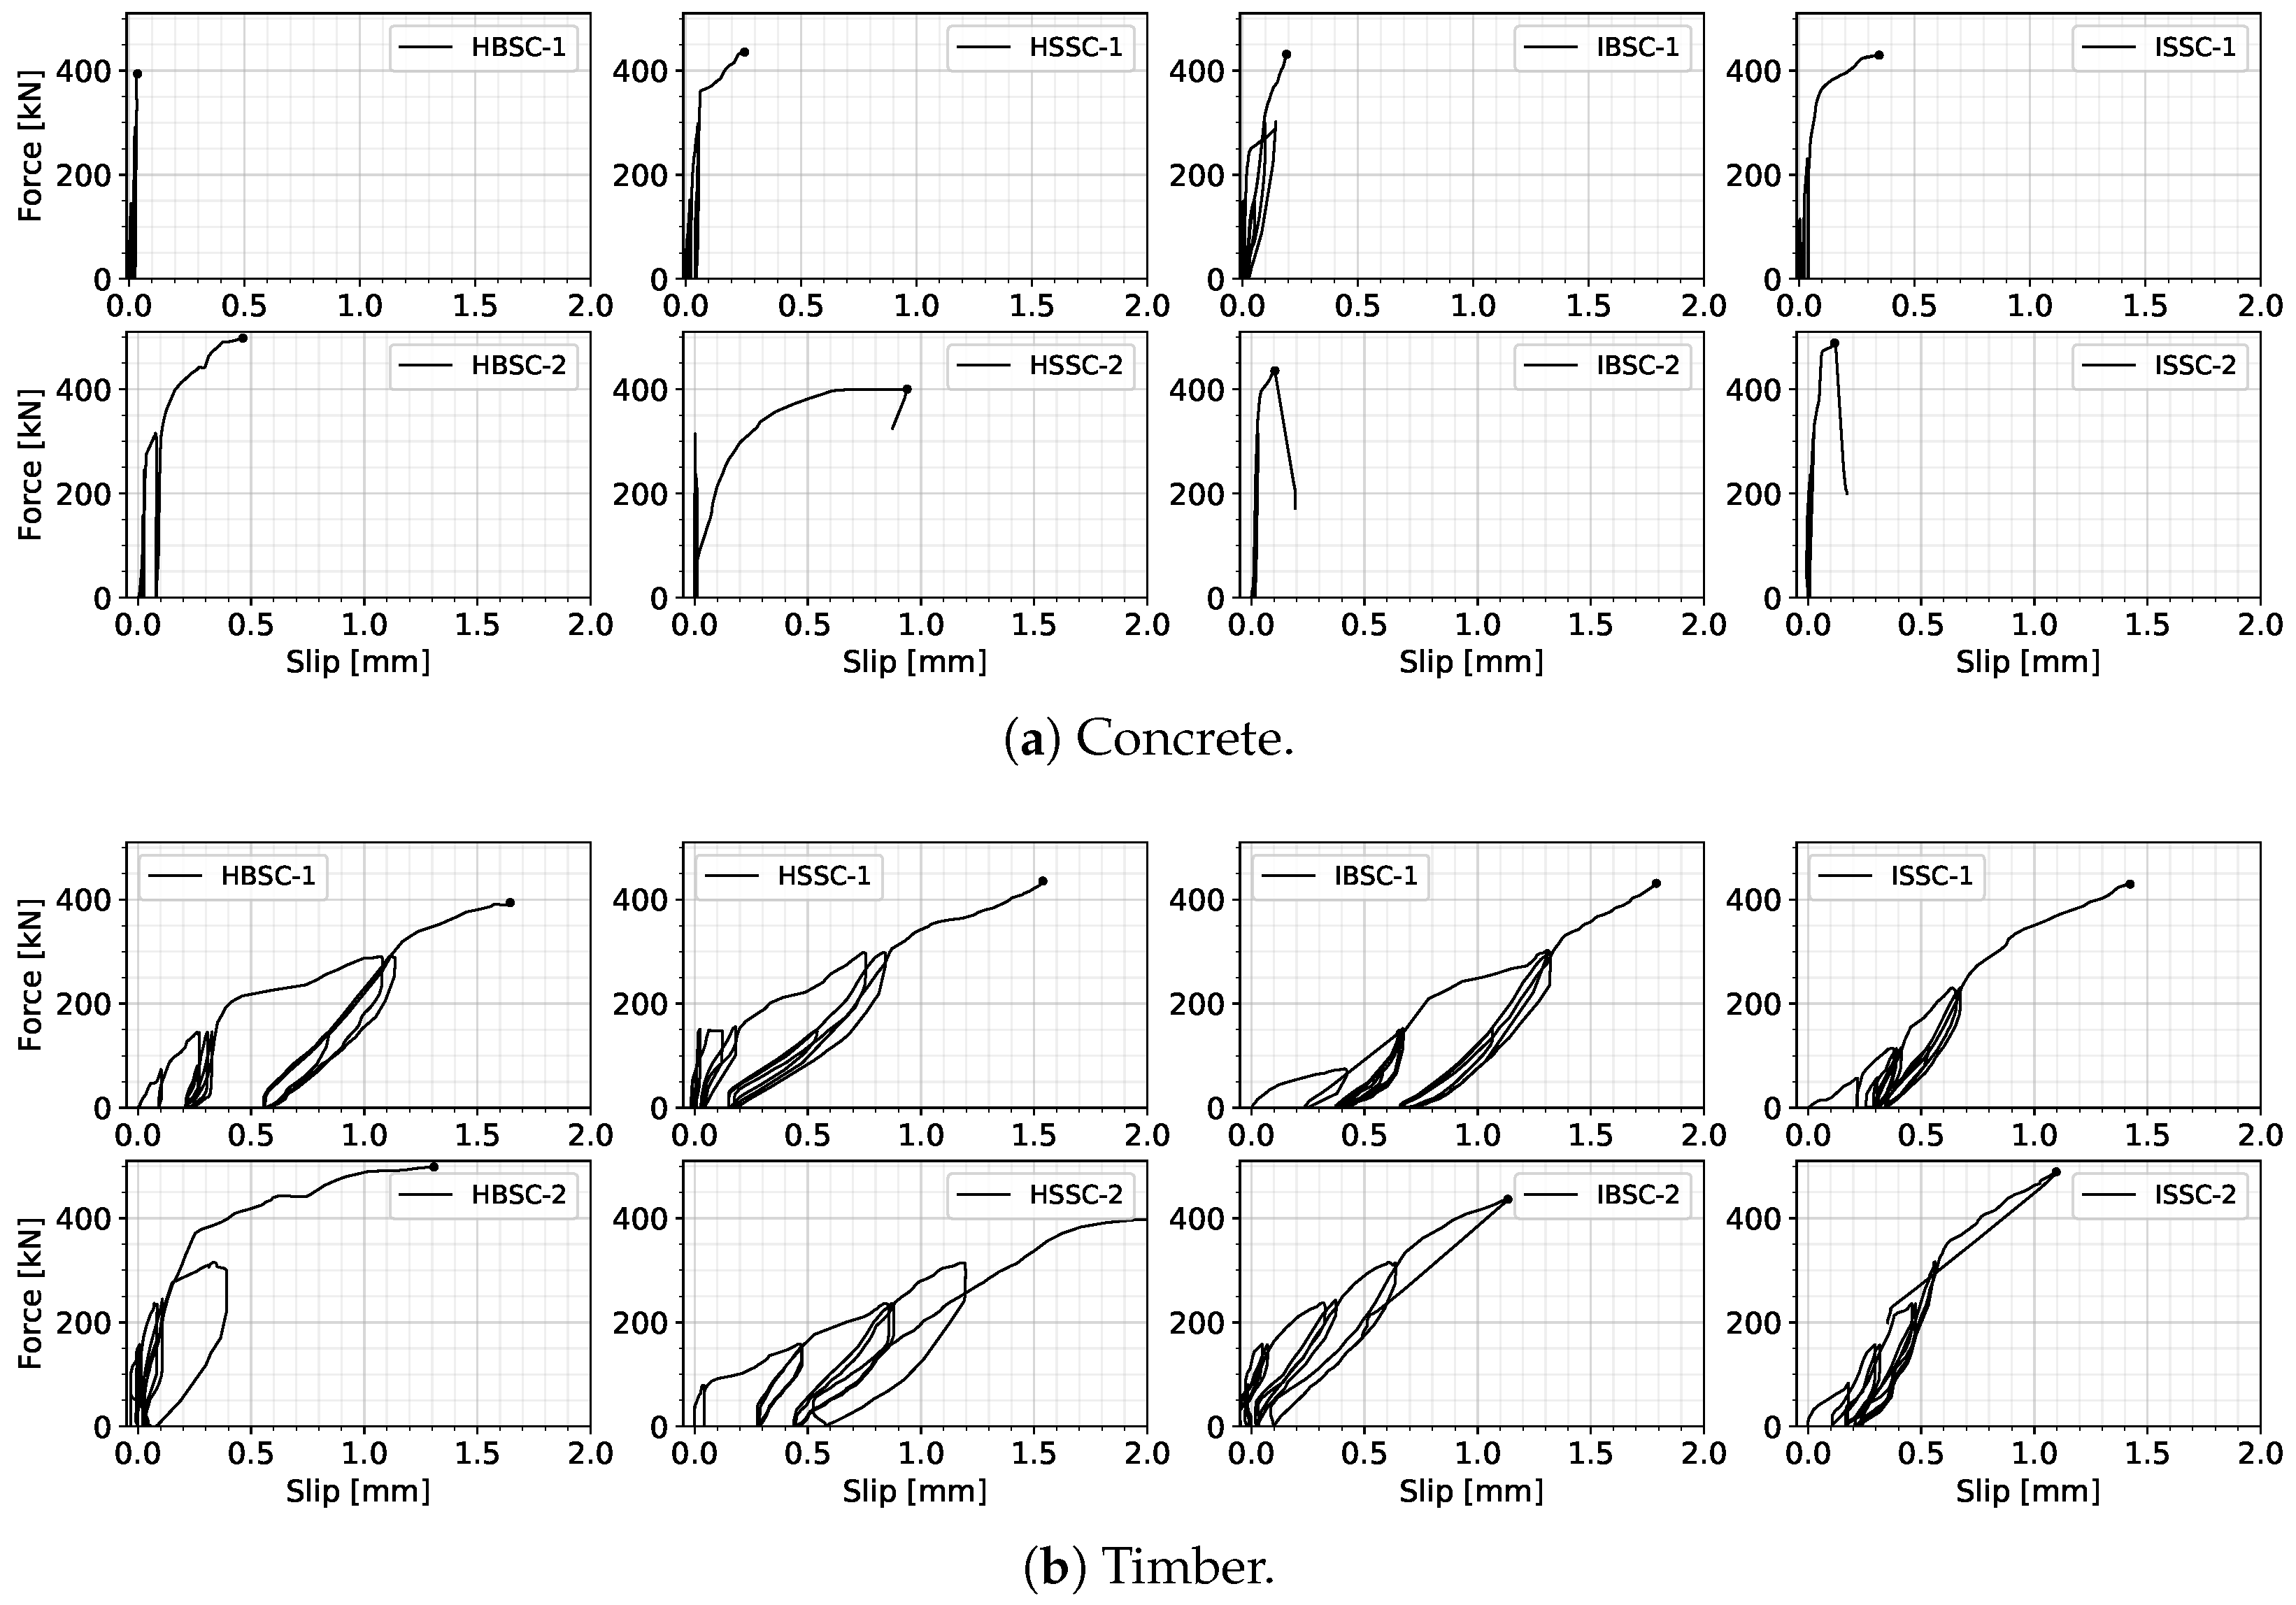
The load–slip curves measured in the concrete slab are presented in Figure 10a. During the initial cycles, the load–slip relationship of the specimens showed a linear behavior up to 300–350 kN. In specimens tested with the first protocol, most of the plastic behavior in the concrete was observed in the final cycle. Therefore, the protocol was adjusted to include different amplitudes; however, the same behavior was observed with both protocols: a linear response up to approximately 75% of the maximum strength.
The load–slip curves measured in the timber slabs are shown in Figure 10b. Slips recorded were considerably larger than those measured in the concrete slabs. In some cases, negative slip was measured at one slab–wall interface, while the measurements in the other interface were positive, indicating the rotation of some lumber pieces.

4.2.3. Strength

The average maximum loads recorded for each connection type are summarized in Table 3. Overall, the different connection configurations exhibited comparable lateral strength, with no significant trends regarding the connector type or inclination angle. This suggests that the concrete slab has a greater influence on the lateral strength of the slab-to-wall connection compared to the NLT slab.

4.2.4. Stiffness

The secant stiffness K s e c was calculated as the slope of the line connecting the initial load and 0.4 F m a x from Figure 10. Results measured in the concrete slab are presented in Table 3.
In general, the results showed a large variation between the repetitions of the same configuration, which is attributed to the high sensitivity of the very small slips observed in the tests, which was less than 0.5 mm in most tests. Therefore, no tendencies can be established regarding the connector type or inclination angle.

4.3. Analytical Capacities

The lateral capacity of the concrete slab was first estimated according to the shear capacity of the concrete calculated with Equation (1) from ACI 318-19 [21]:
V c i = 0.17 f c · b w · d = 34 kN
Considering the presence of two slab-to-wall interfaces, the estimated shear capacity of each specimen was approximately V c = 68 kN .
The capacities of the timber–concrete connections were calculated according to Eurocode 5 [22]. The results are shown in Table 4, while details of the calculations are included in Appendix A.
As summarized in Table 3, the experimental tests significantly exceeded both the ACI- and Eurocode-based predicted lateral capacities. To gain a deeper understanding of the unexpectedly high lateral strength and clarify the failure mechanisms observed, further numerical analyzes are presented in the following section.

4.4. Finite Element Modeling

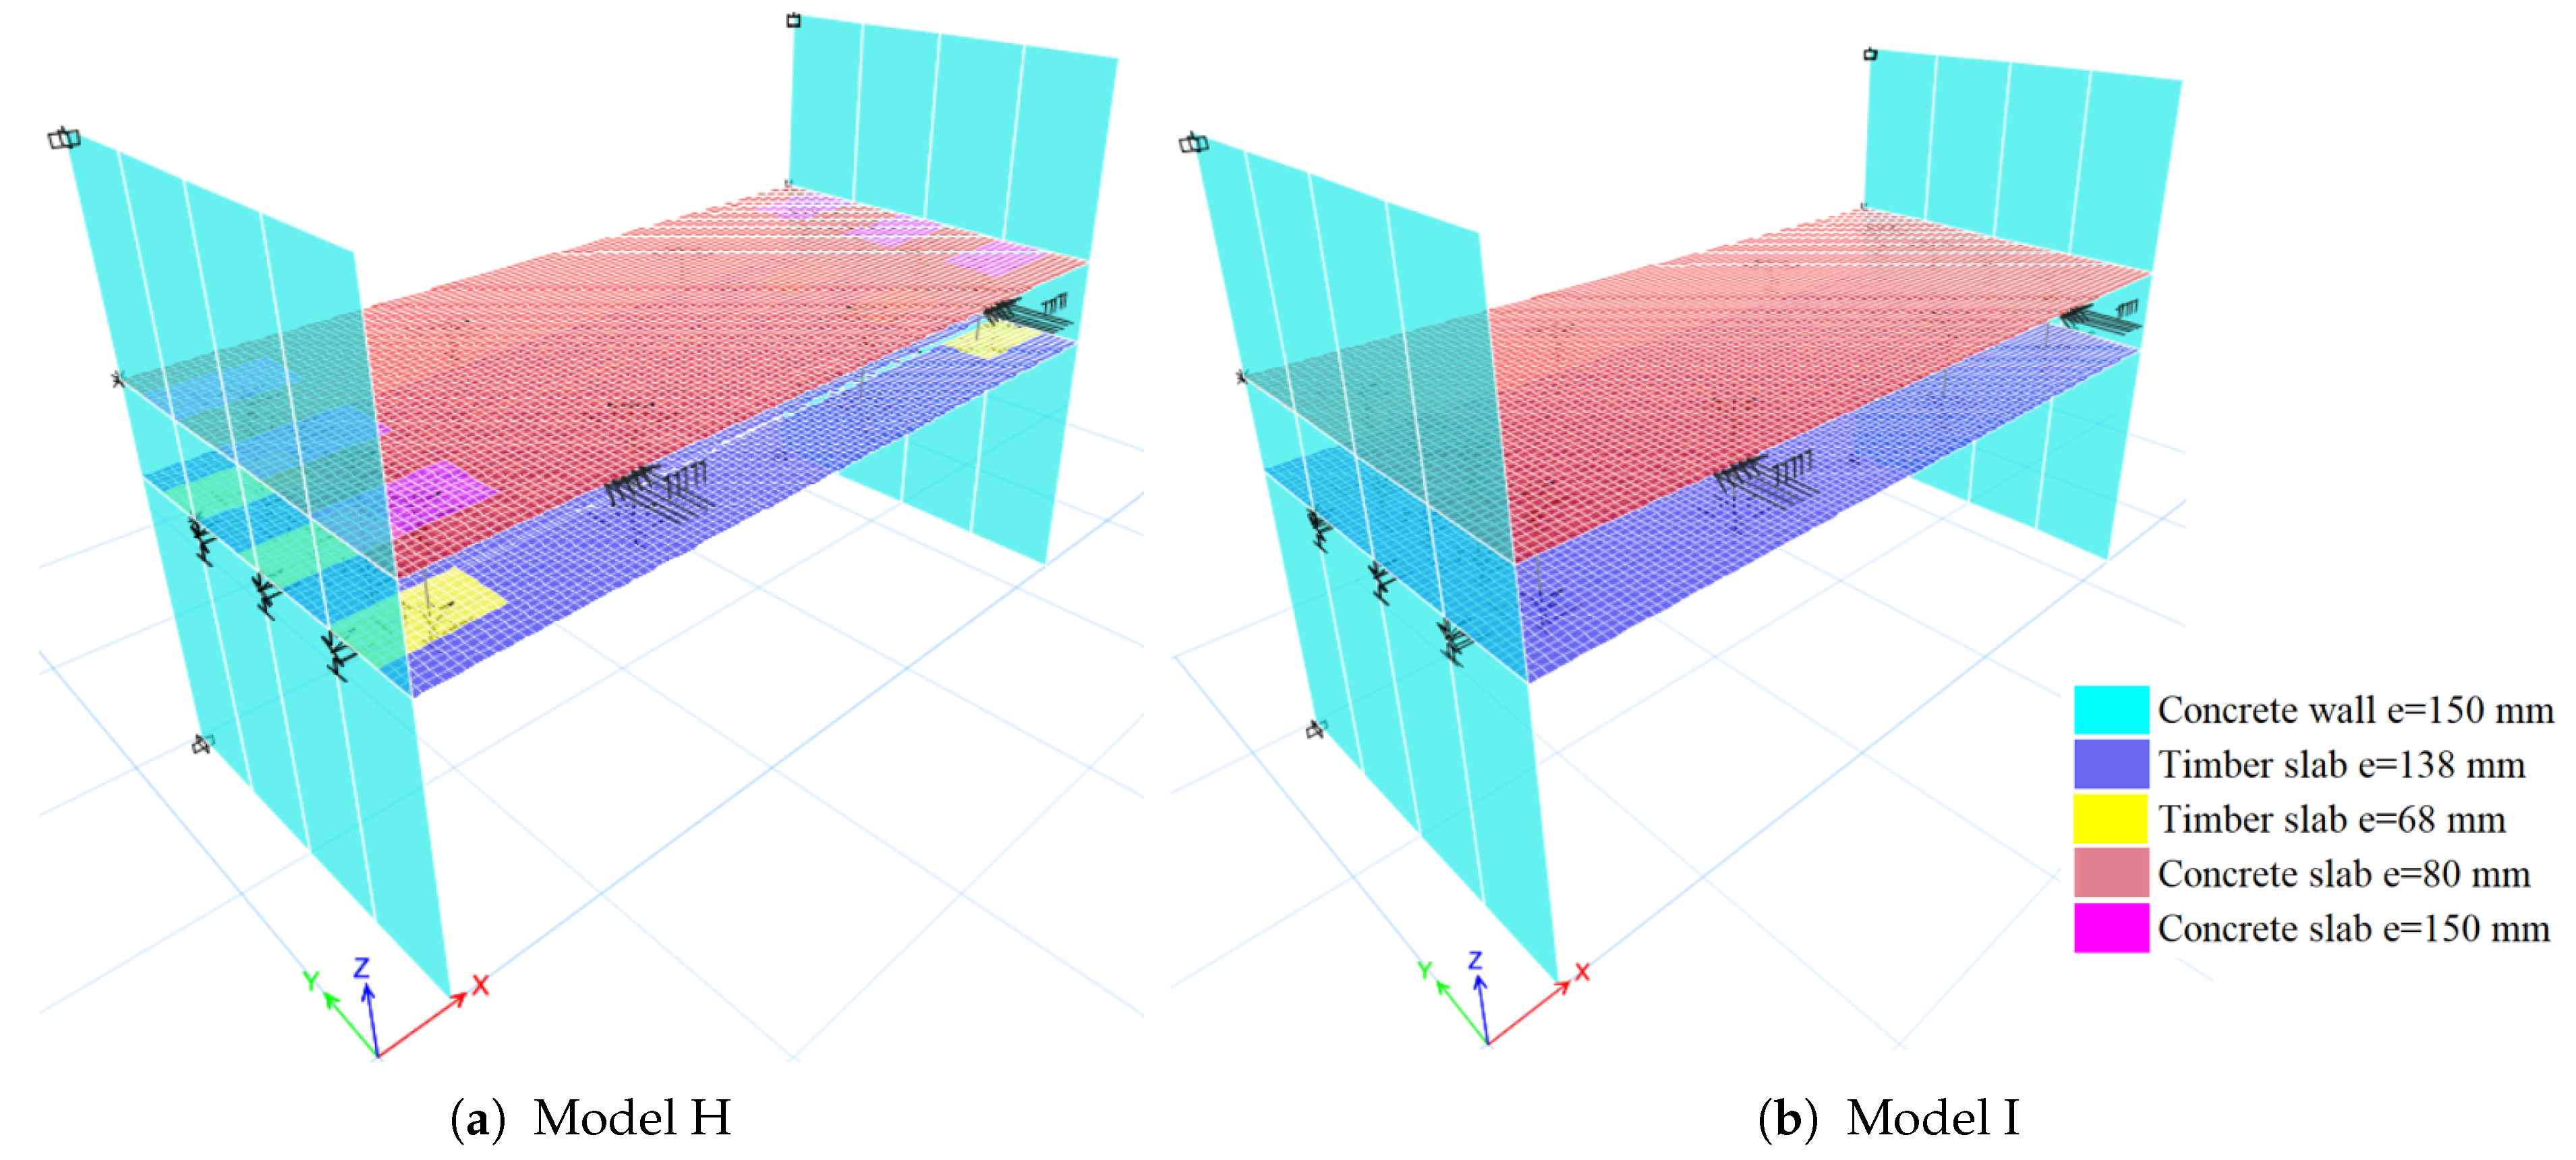
Finite element (FE) models were developed to gain deeper insight into the lateral response observed during experimental testing and to assess the mechanical performance of the proposed connectors. Experimental results indicated a predominantly linear behavior, as evidenced by the load–slip responses measured at the interface between the concrete slab and the shear walls, suggesting that elastic modeling was appropriate for the initial analyses. A total of four three-dimensional linear FE models were constructed, representing each of the proposed connection configurations (see Figure 11). Material properties for the wall and slab components were assigned according to the values presented in Table 5. The TCC slab was modeled using two shell layers to represent the timber and concrete, and interface behaviors (both between slab layers and at the slab-to-wall connections) were modeled using linear elastic spring elements. The corresponding stiffness of the connections was calibrated based on prior experimental results for the slab-to-wall connectors (see Table 6). Loading was applied as a concentrated force distributed across multiple nodes to reflect the experimental conditions. Boundary conditions were defined to replicate the support provided by the floor slab and confinement beams in the test setup. This was implemented by restraining displacements at the ends of the walls opposite the applied load.

4.4.1. Shear Stress Distribution

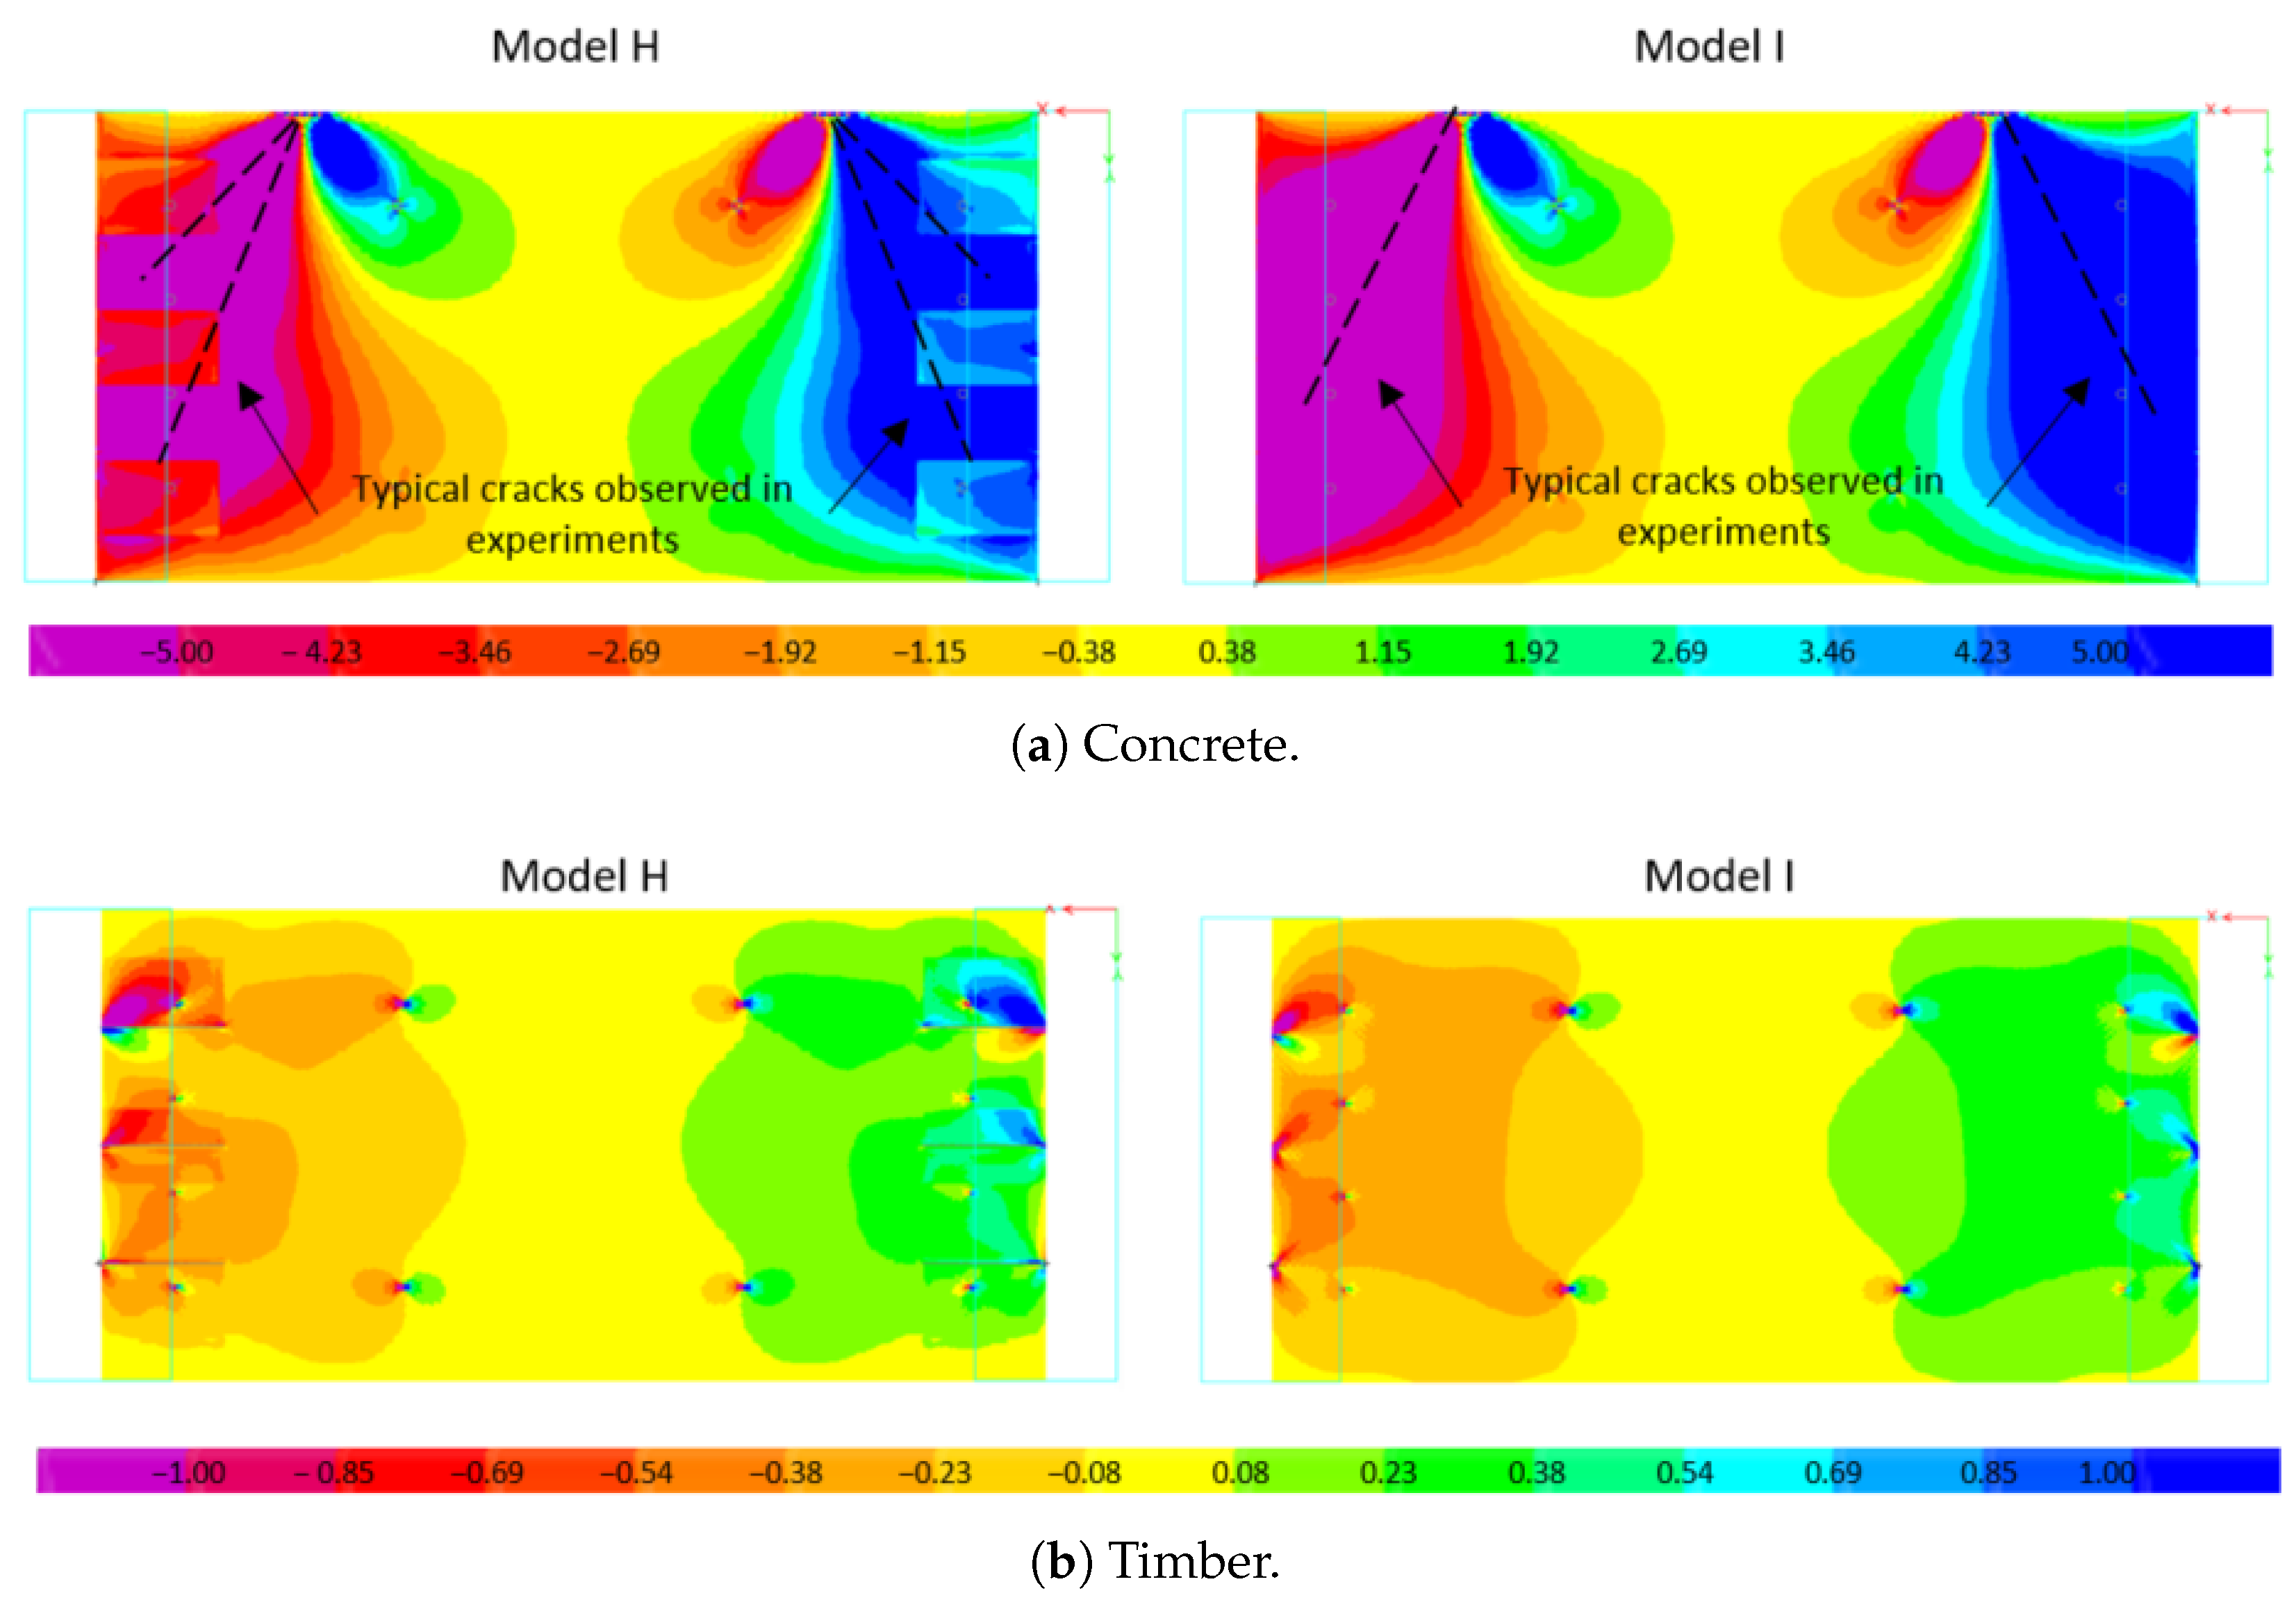
The shear stress distribution across the concrete and timber components of the TCC slab calculated for an applied load of 450 kN is presented in Figure 12. The FE models reproduced the diagonal shear flow observed in the concrete slabs during testing.
The typical crack patterns observed in the experiments indicated that H-type connections commonly developed multiple shear cracks within a single joint. As observed in the shear stress distribution computed with the FE model, the difference in concrete thickness in H-type connections generates a stress discontinuity in the slab, leading to a larger stress concentration in the thinner regions. Consequently, multiple cracks were likely to develop in the direction of such stress concentrations. In contrast, I-type connections exhibited a more uniform stress transfer, consistent with the observation of a single dominant shear crack per interface.
As for the timber slab, the shear stress distribution presented in Figure 12b shows that a significant portion of the slab remains mostly unaffected, with only minor load concentrations near the slab-to-slab and slab-to-wall connectors. The magnitude of stresses in the region of the slab-to-wall connectors decreased away from the loading surface, remaining below the allowable shear stress for G2-grade materials (1.1 MPa according to NCh1198.Of2006 [23]).
Table 7 shows the shear force in each connector according to the FE model. Results show that in the I model, the total shear transferred to the timber slab is 27% higher than in the H model. This reflects the greater stiffness of the H-type concrete slab. In both cases, the connectors were found to be underused relative to their characterized capacities.
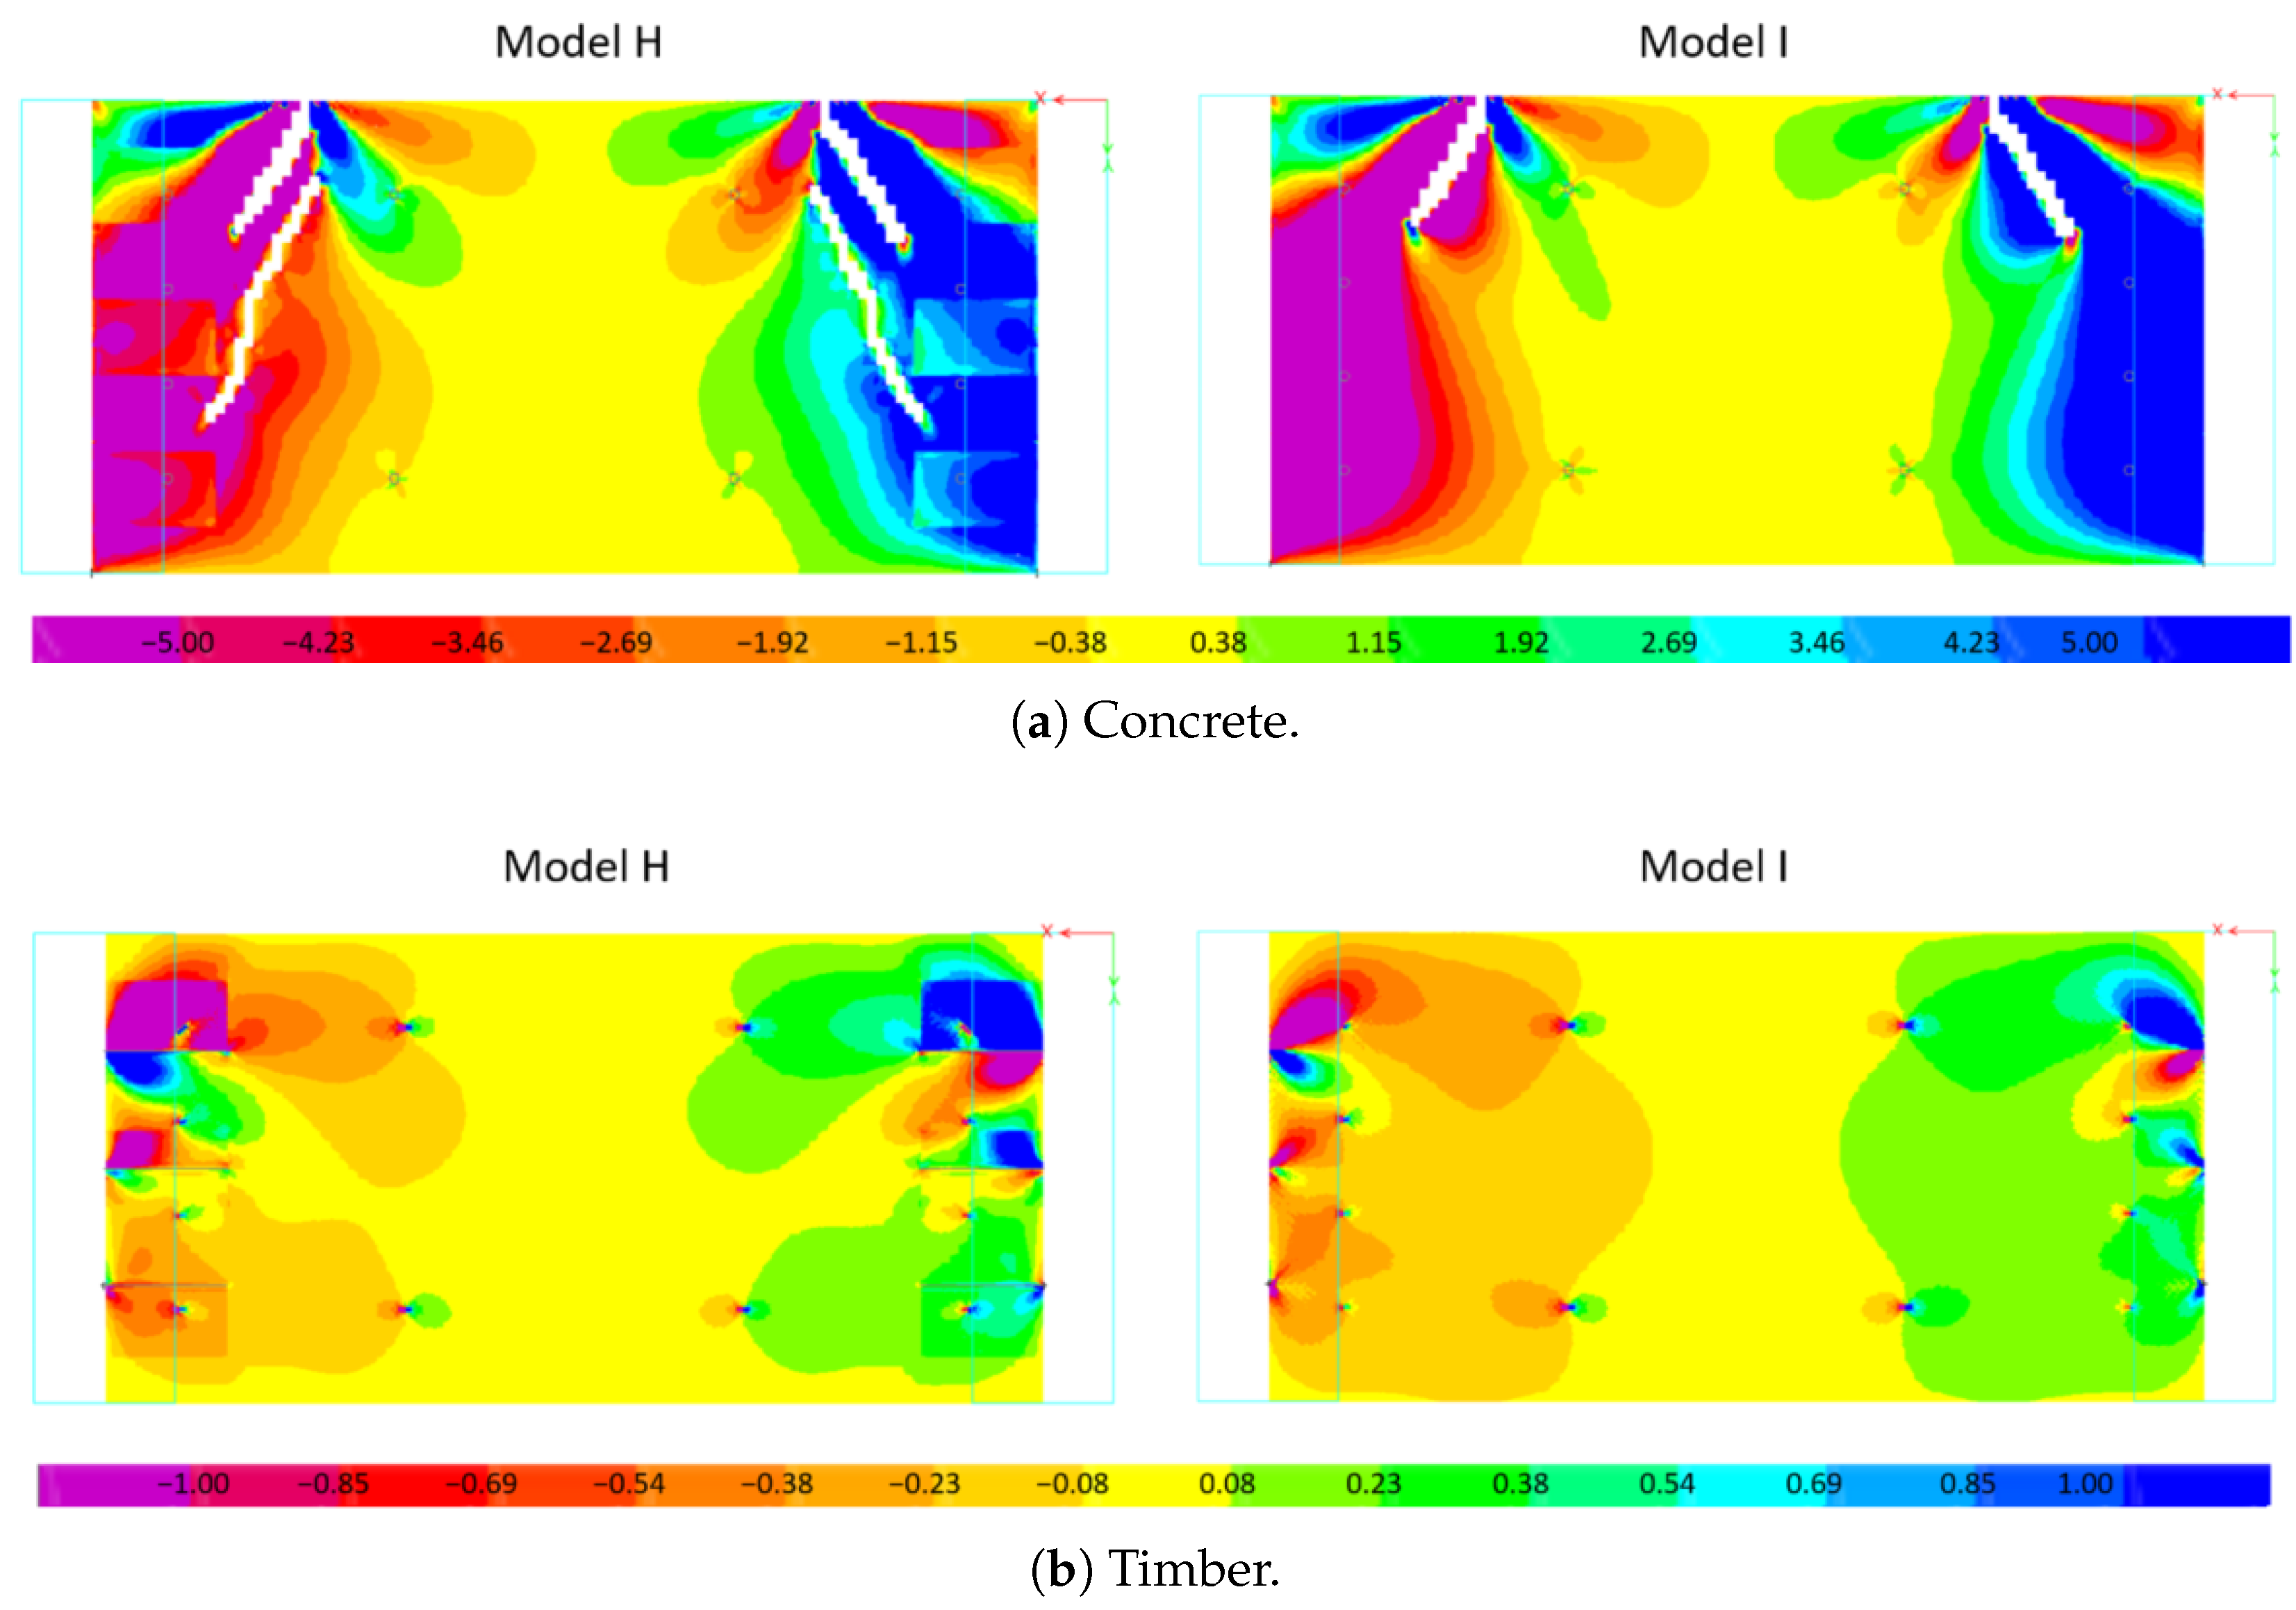
To account for the effect of cracks in the concrete slab, a modified set of the FE models was examined, incorporating cracks in the concrete slab by removing concrete shell elements along a potential crack. The shear stress distribution calculated with the aforementioned models is presented in Figure 13 for concrete and timber slabs. The presence of cracks reduced the stress concentration in the concrete, while in the timber slabs, the presence of concrete cracks resulted in a considerably higher concentration of shear stress, particularly in the vicinity of the first slab-to-wall connector. This result suggests that as the concrete slab develops cracks and transitions into the nonlinear phase, the stress distributions shifts, redirecting the load towards the timber slab via the slab-to-wall connectors. This tendency is further confirmed by the connector forces reported in Table 8, where the cracked models exhibited higher shear forces than the uncracked ones, especially in the first connector, with increases of 40% and 23% in models I and H, respectively.

4.4.2. Principal Stresses

Given that the shear stresses observed in the concrete slabs under ultimate load in tests were considerably larger than the design values according to ACI 318-19 [21], a study of the magnitude and direction of principal stresses is carried out to better understand the behavior of the specimens. Results are presented in Figure 14.
The compressive stresses are notably larger than the tensile stresses, nearly three times as large. Compression was concentrated near the points of application of the load and the slab–wall interfaces, primarily on the lower slab surface. Tensile stresses were concentrated in the central lower side of the slab and in the vicinity of the walls, especially on the top surface. This suggests that the load is predominantly transmitted through compression, with the flow of forces originating at the point of application of the load and converging toward the inner corners of the slab.
The directions of positive and negative principal stresses are illustrated in Figure 15 and represent the inclination of lines drawn for each differential element. The length of this lines is proportional to the magnitudes. In the vicinity of the top center side of the slab, both principal stresses result in compression, which is why the tension plot appears to lack lines in that region.
The orientation of the principal tensile stresses aligns consistently with the cracks observed in the experimental tests. Vertical bending cracks appeared in the central lower surface of the slab, while diagonal shear cracks developed from the loading points towards the slab–wall interfaces. The direction of the principal tensile stress aligns perpendicularly with the formation of the crack, confirming this relationship in both cases.
Concerning the compressive stresses, a significant concentration of stress is evident near the loading points, which explains the failure mode observed in some specimens characterized by concrete crushing in that region.

4.4.3. Strut-and-Tie Model

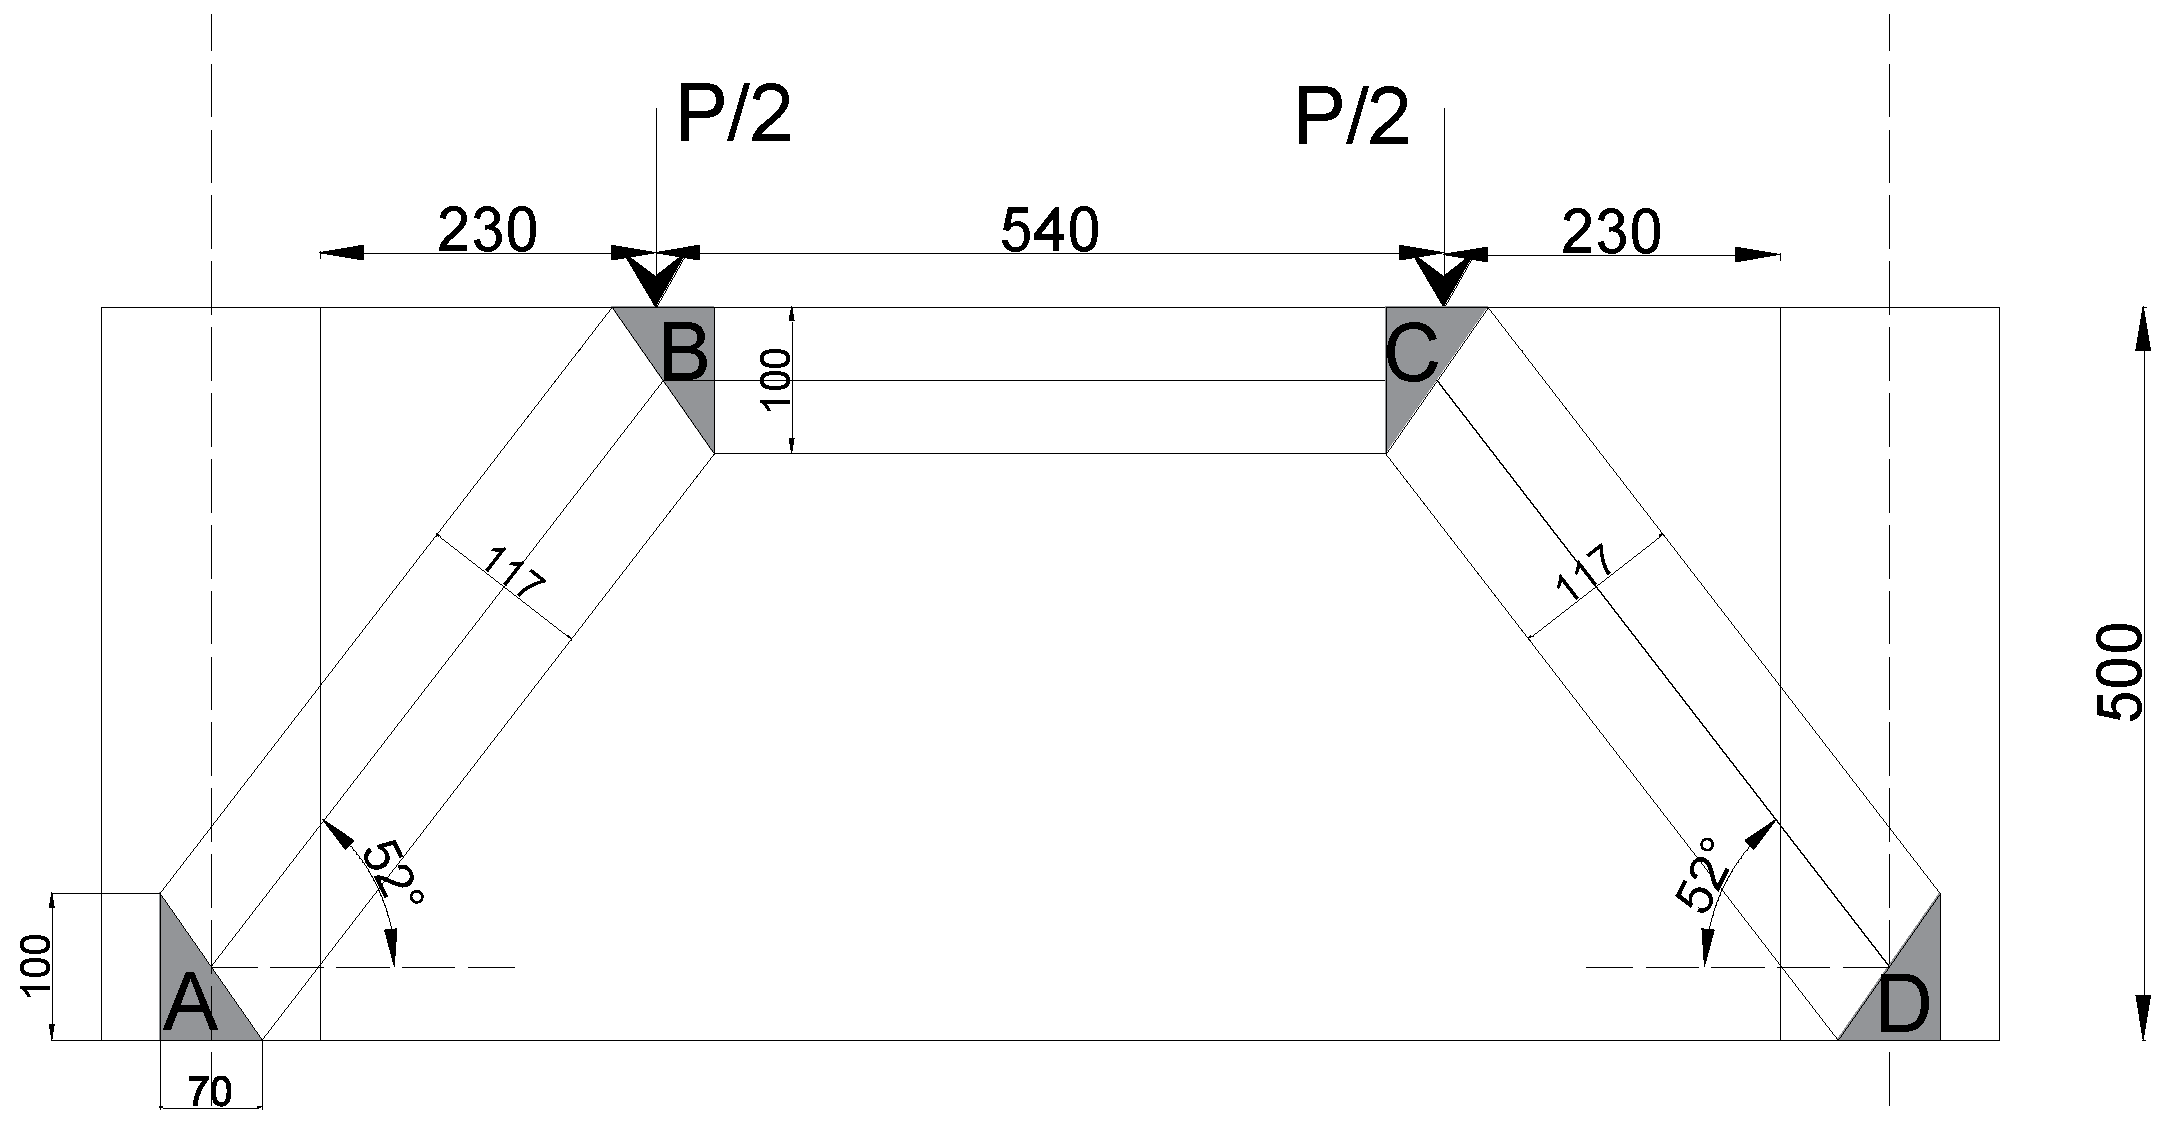
To better understand the unexpectedly large strength observed in the lateral tests, a strut-and-tie model (STM) was analyzed according to the provisions of design code ACI 318-19 [21]. The strut-and-tie method assumes that certain regions can be analyzed and designed by using hypothetical pin-jointed trusses composed of struts in compression and ties in tension connected at nodes.
The proposed STM is composed of three struts fixed at the base, as depicted in Figure 16. By solving the equations for static equilibrium at the upper-left node, the forces in the struts, F A B and F B C , are presented as a function of the applied load P in Equations (2) and (3).
F y , B = 0 : P / 2 = F A B · s i n ( 52 ) F A B = P / ( 2 · s i n ( 52 ) )
F x , B = 0 : F B C = F A B · c o s ( 52 )
The compressive strength of the struts is calculated with Equation (4) from ACI 318-19 [21]:
F n s = 0.85 · β c · β s · f c · A c s
Considering f c = 30 MPa and β c = β s = 1 , the strengths obtained are F A B = 253 kN and F B C = 204 kN. Combining Equations (2)–(4), the shear capacity P of the specimen is calculated as P = 402 kN, which better aligns with the experimental results. This suggests that under the testing conditions, the failure mechanism was not due to shear at the slab–wall joint but rather a result of struts in compression extending from the loading points to the walls.

5. Conclusions

Sixteen tests were conducted to investigate the behavior of four proposed TCC slab-to-wall connections, with half under gravitational loads and half under lateral loads. Each specimen consisted of a central TCC slab flanked by two reinforced concrete walls, which were fixed at their bases to prevent out-of-plane displacement. Specimens were subjected to either monotonic or non-reversible cyclic procedures, depending on the type of test. Key findings can be summarized as follows:
  • Regarding the lateral load response, experimental shear capacities were on average six times larger than design-code predictions, indicating that shear at the slab–wall joint was not the governing mechanism. Finite element analyses revealed that the load was transferred primarily through diagonal compressive stress fields, with localized crushing near load points. A proposed strut-and-tie model captured this behavior more accurately, providing failure load estimates consistent with experimental results.
  • No clear trend was observed between the connector type or inclination and ultimate lateral strength. However, crack patterns differed: multiple cracks formed in H-type connections due to stress concentrations in the thicker concrete zones, while I-type connections typically exhibited a single shear crack at the slab–wall interface.
  • Timber components remained largely undamaged, with only minor detachment at isolated regions following concrete failure. FE models with explicit cracking modeling confirmed that slab-to-wall connectors attracted greater forces after concrete softening, yet overall connector demand remained well below capacity.
  • Regarding the gravitational load response, shear capacities were approximately three times greater than code predictions. Connectors with screws achieved ≈25% higher strength than bar-type connectors, and H-type connections exhibited ≈60% greater secant stiffness than I-type connections. However, stiffness comparisons were influenced by crack locations relative to LVDT measurement points.
  • Connectors experienced more damage at failure under gravity loading than under lateral loading with an uneven force distribution, with some connectors yielding while others remained elastic. Concrete–timber detachment occurred in highly sheared zones due to the inability of connectors to enforce composite action after cracking.
  • The ultimate loads measured in both lateral and gravitational tests were far above service-level demands for typical residential floors in Chile. For example, a typical residential floor in Chile would be designed with a dead load of D = 1.5 kPa and a live load of L = 2.0 kPa. Therefore, the design should focus on ensuring that connectors resist construction loads, particularly during concrete placement, while ultimate lateral resistance can safely be taken as governed by the concrete slab itself. As a practical consideration, construction is feasible using a single strut support located at the mid-span of the slab, which could also serve for pre-cambering during the casting process. Horizontal connectors were found suitable for pre-installation without interfering with reinforcement, while inclined connectors proved efficient for in situ installation. Both alternatives are considered practical and reliable.

Author Contributions

Conceptualization, H.S.M. and P.G.; methodology, H.S.M. and P.G.; validation, P.G.; formal analysis, V.M.; investigation: H.S.M., V.M. and P.G.; data curation, V.M.; writing—original draft preparation, V.M.; writing—review and editing, H.S.M. and P.G.; supervision, H.S.M.; funding acquisition, H.S.M. and P.G. All authors have read and agreed to the published version of the manuscript.

Funding

This research was funded by the program FONDEF ID20I10312 “Bases técnicas para la inclusión de losas industrializables de baja huella de carbono en la normativa chilena”. Funding was also provided by the project FB210015 of the National Center of Excellence for the Wood Industry CENAMAD.

Data Availability Statement

The datasets generated and analyzed during the current study are available from the corresponding author upon reasonable request.

Conflicts of Interest

The authors declare no conflicts of interest.

Nomenclature

T C C Timber concrete composite
N L T Nail laminated timber
F y Yield strength
F u Ultimate strength
K s e c Secant stiffness
V m a x Ultimate shear capacity
V c Concrete shear capacity
f c Specified compressive strength of concrete
b w Width of cross section
dDistance from extreme compression fiber to centroid of longitudinal tension reinforcement
ρ Material density
EModulus of elasticity
ν Poisson’s ratio
F n s Nominal strength of a strut
β c Confinement modification factor
β s Factor used to account for the effect of cracking and confining reinforcement
A c s Cross sectional area at one end of a strut

Appendix A

This section presents the analytical estimation of the capacities of the four proposed configurations, based on the design provisions of Eurocode 5 [22]. The calculations are performed for a single slab-to-wall interface, which consists of three connectors.

Appendix A.1. Connection IS, Capacity According to EC5

d = 9 mm , t 1 = 100 mm , ρ k = 350 kg / m 3 l e f = 100 mm , d h e a d = 12.5 mm , n = 3 , n e f = n 0.9 = 2.688 f u k = 800 N / mm 2 , α = 30 k m o d = 1 , γ M = 1.3 , f t e n s , k = 25 kN
Axial capacity
f a x , k = 0.52 · d · 1 mm 0.5 · l e f · 1 mm 0.1 · ρ k · 1 kg / m 3 0.8 = 11.861 N / mm 2
k d = min d 8 · 1 mm , 1 = 1
F a x , k , R k = n e f · f a x , k · d · l e f · k d 1.2 · cos 2 ( α ) + sin 2 ( α ) = 24.951 kN Withdrawal from timber
f h e a d , k = 14 · d h e a d · 1 mm 0.14 · ρ k 350 · kg / m 3 0.8 · N mm 2 = 9.83 N / mm 2
F a x , p u l l , k = n e f · f h e a d , k · d h e a d 2 · ρ k 350 · kg / m 3 0.8 = 4.128 kN Pull through of the head
F a x , k = max ( F a x , k , R k , F a x p u l l , k ) = 24.951 kNMaximum between pull
through of the head or
withdrawal
(thred pull through)
of the remaining part
F t , R k = n e f · f t e n s , k = 67.197 kN Tensile capacity of steel
F a x , k = min ( F t , R k , F a x , k ) = 24.951 kN Characteristic axial capacity
of the connection
F a x , k , r o p e = F a x , k n e f = 9.283 kN Characteristic axial capacity
of one screw only towards 
the rope effect calculation
Lateral capacity
f h , 0 , k = 0.082 · 0.01 · d 0.3 · ρ k = 26.117 N / mm 2
M y , R , k = 0.3 · f u k · d 1 mm 2.6 = 72.651 kN · mm
F v , R , k , c = f h , 0 , k · t 1 · d = 23.505 kN
F v , R , k , d = f h , 0 , k · t 1 · d · 2 + 4 M y , R , k f h , 0 , k · d · t 1 2 = 10.748 kN Mode d without the
rope effect
F v , R , k , d = F v , R , k , d + min F v , R , k , d , 1 4 F a x , k , r o p e = 13.069 kN Mode e without the
rope effect
F v , R , k , e = 2.3 · M y , R , k · f h , 0 , k · d = 9.505 kN Mode e with rope effect
F v , R , k , e = F v , R , k , e + min F v , R , k , e , 1 4 F a x , k , r o p e = 11.825 kN
F v , R , k = min ( F v , R , k , c , F v , R , k , d , F v , R , k , e ) = 11.825 kN
n e f f = n = 3
F v , R , k , t o t a l = n e f f · F v , R , k = 35.476 kN Lateral capacity of the
connection
F a x , R d = F a x k γ M = 19.193 kN Combined design capacity
F v , R d = F v , R , k , t o t a l γ M = 27.289 kN
1 = F · cos ( α ) F a x , R d 2 + F · sin ( α ) F v , R d 2
F = 20.534 kN

Appendix A.2. Connection HS, Capacity According to EC5

a = 0.5 for solid timber b = 0.7 for solid timber α = 0 end - grain loading k a x = a + b · α 45 = 0.5 k B = 1 for solid timber n e f = 3
Axial capacity
f a x , k = 0.52 · d · 1 mm 0.5 · l e f · 1 mm 0.1 · ρ k · 1 kg / m 3 0.8 = 11.861 N / mm 2
F a x , k , R k = n e f · f a x , k · d · l e f · k d 1.2 · cos 2 ( α ) + sin 2 ( α ) = 16.014 kN Withdrawal from timber
F t , R k = n e f · f t e n s , k = 75 kN Tensile capacity of steel
F a x , k , r o p e = min ( F t R k , F a x , k ) = 16.014 kN Characteristic axial capacity
Lateral capacity
f h , k = 0.082 · ρ k · N mm 2 d · 1 mm 0.3 2.5 cos ( α ) 2 + sin ( α ) 2 = 5.938 N / mm 2
M y , R , k = 0.3 · f u k · d · 1 mm 2.6 = 72.651 kN · mm
F v , R , k , c = f h , 0 , k · t 1 · d = 5.345 kN
F v , R , k , d = f h , 0 , k · t 1 · d · 2 + 4 M y , R , k f h , 0 , k · d · t 1 2 = 2.444 kN Mode d without the rope effect
F v , R , k , d = F v , R , k , d + min F v , R , k , d , 1 4 F a x , k , r o p e = 4.888 kN Mode d with the rope effect
F v , R , k , e = 2.3 · M y , R , k · f h , 0 , k · d = 4.532 kN Mode e without rope effect
F v , R , k , e = F v , R , k , e + min F v , R , k , e , 1 4 F a x , k , r o p e = 9.064 kN Mode e with the rope effect
F v , R , k = min ( F v , R , k , c , F v , R , k , d , F v , R , k , e ) = 4.888 kN
n e f f = n = 3
F v , R , k = n e f f · F v , R , k = 14.663 kN Lateral capacity of the
connection
F v , R d = n e f · F v , R , k · F a x k γ M = 11.28 kN Combined design capacity

Appendix A.3. Connection IB, Capacity According to EC5

d = 10 mm , t 1 = 100 mm , ρ k = 350 kg / m 3 l e f = 100 mm , d h e a d = 25 mm , n = 3 , f u k = 800 N / mm 2 , α = 30 k m o d = 1 γ M = 1.3 , f t e n s , k = 25 kN
Axial capacity
Axial capacity, as well as axial stiffness, is assumed to be very small because the bar is
not glued to the timber.
Lateral capacity
f h , 0 , k = 0.082 · 1 0.01 · d 0.3 · ρ k = 25.83 N / mm 2
M y , R , k = 0.3 · f u k · d · 1 mm 2.6 = 95.546 kN · mm
F v , R , k , c = f h , 0 , k · t 1 · d = 25.83 kN
Due to lack of axial stiffness, it is assumed that there is no rope effect.
F v , R , k , d = f h , 0 , k · t 1 · d · 2 + 4 M y , R , k f h , 0 , k · d · t 1 2 = 12.026 kN Mode d
F v , R , k , e = 2.3 · M y , R , k · f h , 0 , k · d = 11.426 kN Mode e
F v , R , k , e = min F v , R , k , c , F v , R , k , d , F v , R , k , e = 11.426 kN
F v , R , k = min ( F v , R , k , c , F v , R , k , d , F v , R , k , e ) = 11.825 kN
n e f f = n = 3
F v , R , k = n e f f · F v , R , k = 34.278 kN Lateral capacity of the
connection
F a x , R d = n e f · F v , R , k · F a x k γ M = 26.368 kN

Appendix A.4. Connection HB, Capacity According to EC5

Axial capacity
Axial capacity, as well as axial stiffness, is assumed to be very small because the bar is not glued to the timber.
Lateral capacity
The capacity can be expected to be similar to the one of the IB connector, i.e., F v , R d = 26.368 kN .

References

  1. Guindos, P. Fundamentos del Diseño y la Construcción con Madera; Ediciones UC: Santiago, Chile, 2019. (In Spanish) [Google Scholar]
  2. Yeoh, D.; Fragiacomo, M.; Buchanan, A.; Crews, K.; Haskell, J.; Deam, B. Development of semi-prefabricated timber-concrete composite floors in Australasia. In Proceedings of the WCTE2008-10th World Conference on Timber Engineering, Miyazaki, Japan, 2–5 June 2008; Volume 4, pp. 2152–2159. [Google Scholar]
  3. Otero-Chans, C.; Suarez-Riestra, F.; Martin-Gutiérrez, E.; Estévez-Cimadevila, J. Experimental and numerical analysis of a full-scale timber-concrete-composite beam from simply supported to frame-connected. Eng. Struct. 2025, 327, 119624. [Google Scholar] [CrossRef]
  4. Rodrigues, J.N.; Providência, P.; Dias, A.M. Sustainability and lifecycle assessment of timber-concrete composite bridges. J. Infrastruct. Syst. 2017, 23, 04016025. [Google Scholar] [CrossRef]
  5. Nakashima, M. Seismic Resistance Characteristics of Reinforces Concrete Beam-Supported Floor Slabs in Building Structures. Ph.D. Thesis, Lehigh University, Bethlehem, PA, USA, 1981. [Google Scholar]
  6. Imran, I. Preliminary Study of the Lateral Load Behaviour of a Reinforced Concrete Slab-Wall Assembly. Ph.D. Thesis, University of Toronto, Toronto, ON, Canada, 1990. [Google Scholar]
  7. Zenunović, D.; Folić, R. Models for behaviour analysis of monolithic wall and precast or monolithic floor slab connections. Eng. Struct. 2012, 40, 466–478. [Google Scholar] [CrossRef]
  8. Greeshma, S.; Rajesh, C.; Jaya, K.P.; Division, S.E.; Wing, I.; Complex, E.; Division, S.E. Seismic Behaviour of Shear Wall–Slab Joint Under Lateral Cyclic Loading. Asian J. Civ. Eng. (Build. Hous.) 2011, 13, 455–464. [Google Scholar]
  9. Greeshma, S.; Jaya, K.P. Effect of Slab Shear Reinforcement on the Performance of the Shear Wall–Floor Slab Connection. J. Perform. Constr. Facil. 2013, 27, 391–401. [Google Scholar] [CrossRef]
  10. Surumi, R.S.; Jaya, K.P.; Greeshma, S. Modelling and Assessment of Shear Wall–Flat Slab Joint Region in Tall Structures. Arab. J. Sci. Eng. 2015, 40, 2201–2217. [Google Scholar] [CrossRef]
  11. Arthi, S.; Jaya, K. Seismic performance of precast shear wall-slab connection under cyclic loading: Experimental test vs. numerical analysis. Earthq. Eng. Eng. Vib. 2020, 19, 739–757. [Google Scholar] [CrossRef]
  12. Xia, K.; Hu, X.; Xue, W. Experimental studies on in-plane connections of composite beam-precast concrete shear wall under reversed cyclic loading. Structures 2021, 34, 1961–1972. [Google Scholar] [CrossRef]
  13. Han, W.; Zhao, Z.; Qian, J. Global Experimental Response of a Three-Story, Full-Scale Precast Concrete Shear Wall Structure with Reinforcing Bars Spliced by Grouted Couplers. PCI J. 2019, 64, 65–80. [Google Scholar] [CrossRef]
  14. Lukaszewska, E.; Johnsson, H.; Fragiacomo, M. Performance of connections for prefabricated timber–concrete composite floors. Mater. Struct. 2008, 41, 1533–1550. [Google Scholar] [CrossRef]
  15. Fragiacomo, M.; Lukaszewska, E. Time-dependent behaviour of timber–concrete composite floors with prefabricated concrete slabs. Eng. Struct. 2013, 52, 687–696. [Google Scholar] [CrossRef]
  16. Khorsandnia, N.; Valipour, H.; Bradford, M. Deconstructable timber-concrete composite beams with panelised slabs: Finite element analysis. Constr. Build. Mater. 2018, 163, 798–811. [Google Scholar] [CrossRef]
  17. Krug, S.; Schänzlin, J. Experimental and numerical investigations of timber-concrete composite slabs subjected to negative bending moments. In Wood Material Science & Engineering; Taylor & Francis: Abingdon, UK, 2025. [Google Scholar] [CrossRef]
  18. van de Lindt, J.W.; Furley, J.; Amini, M.O.; Pei, S.; Tamagnone, G.; Barbosa, A.R.; Rammer, D.; Line, P.; Fragiacomo, M.; Popovski, M. Experimental seismic behavior of a two-story CLT platform building. Eng. Struct. 2019, 183, 408–422. [Google Scholar] [CrossRef]
  19. Mahr, K.; Sinha, A.; Barbosa, A.R. Elevated Temperature Effects on Performance of a Cross-Laminated Timber Floor-to-Wall Bracket Connections. J. Struct. Eng. 2020, 146, 04020173. [Google Scholar] [CrossRef]
  20. Newcombe, M.P.; van Beerschoten, W.A.; Carradine, D.; Pampanin, S.; Buchanan, A.H. In-Plane Experimental Testing of Timber-Concrete Composite Floor Diaphragms. J. Struct. Eng. 2010, 136, 1461–1468. [Google Scholar] [CrossRef]
  21. ACI 318-19; 318-19 Building Code Requirements for Structural Concrete and Commentary. American Concrete Institute: Farmington Hills, MI, USA, 2019. [CrossRef]
  22. EN 1995-1-1; Eurocode 5: Design of Timber Structures—Part 1-1: General—Common Rules and Rules for Buildings. Standardization European Commission (EC): Brussels, Belgium, 2004.
  23. INN—Instituto Nacional de Normalizacion. NCh1198—Diseño en Madera; INN—Instituto Nacional de Normalizacion: Santiago, Chile, 2006; pp. 1–231. [Google Scholar]
  24. INN—Instituto Nacional de Normalizacion. NCh1037—Hormigón-Ensayo de Compresión de Probetas Cúbicas y Cilíndricas; INN—Instituto Nacional de Normalizacion: Santiago, Chile, 2009. [Google Scholar]
  25. Jiang, Y.; Chen, H.; Nie, X.; Tao, M. Experimental study on bond and anchorage of steel bars in precast concrete structures with new-to-old concrete interface. Eng. Struct. 2021, 247, 113086. [Google Scholar] [CrossRef]
  26. Shang, X.; Zheng, M.; Guo, Y.; Zhuang, L.; Liang, H. Experimental Investigation on Static Performance of Novel Precast Concrete Composite Slab–Composite Shear Wall Connections. Buildings 2025, 15, 1935. [Google Scholar] [CrossRef]
  27. Carmo, R.; Martins, R.; Arruda, M.R.T.; Costa, H.; Valente, D.; Valença, J.; Júlio, E. Reinforcement detailing of connections between perpendicular hollow precast walls. Adv. Struct. Eng. 2023, 26, 1663–1681. [Google Scholar] [CrossRef]
  28. INN—Instituto Nacional de Normalizacion. NCh 203 Acero Estructural—Requisitos; INN—Instituto Nacional de Normalizacion: Santiago, Chile, 2006. [Google Scholar]
  29. UNE-EN 26891-1; Timber Structures-Joints Made with Mechanical Fasteners-General Principles for the Determination of Strength, Deformation, Loading. EN—Eurepean Norm: Plzen, Czech Republic, 1991.
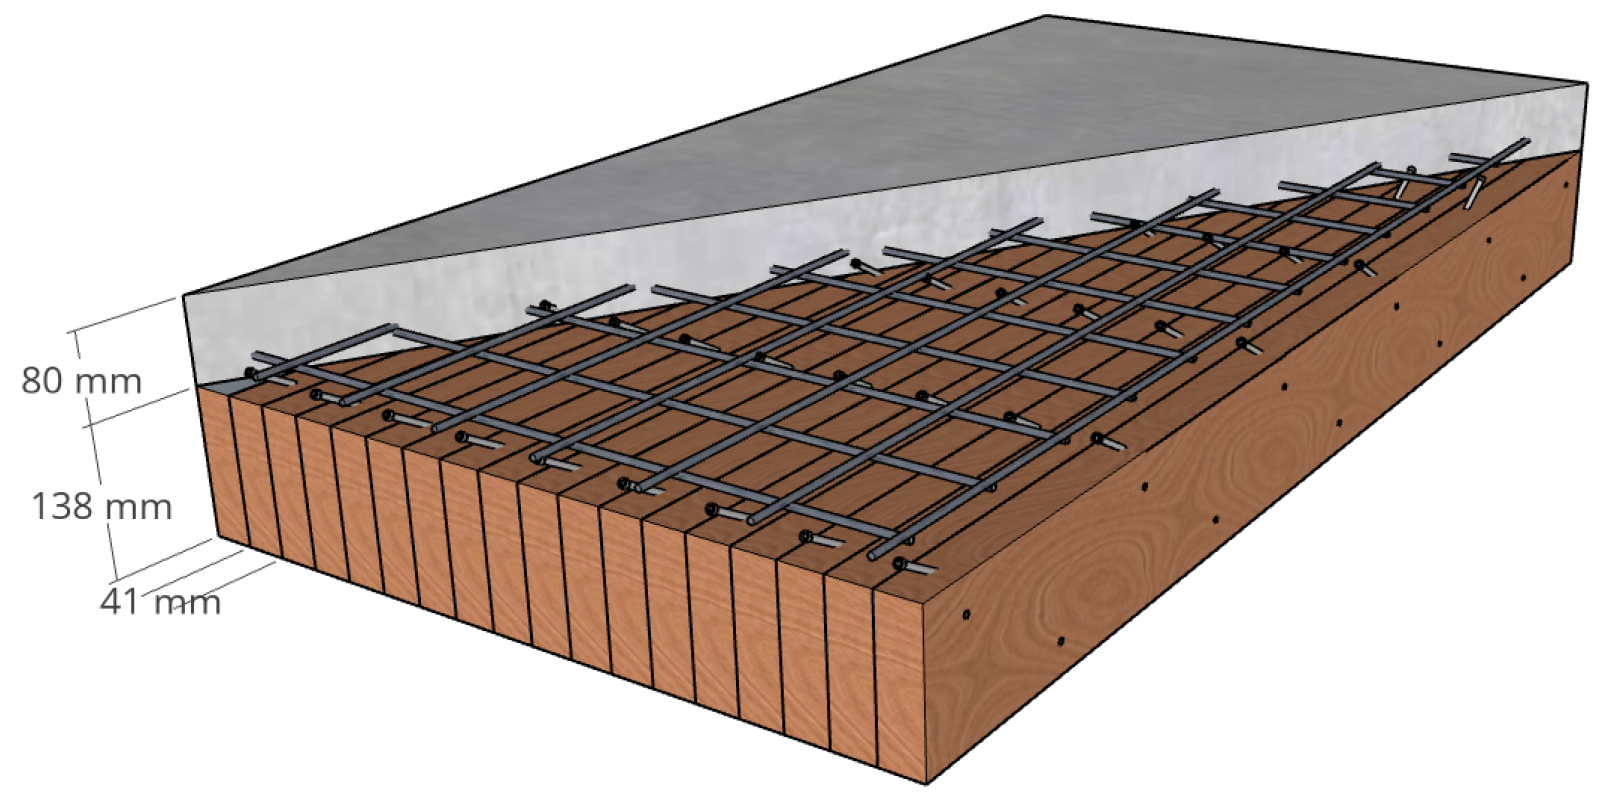
Figure 1. Dimensions of the TCC slab studied.
Buildings 15 04161 g001
Figure 2. Test specimen. Dimensions are in mm.
Buildings 15 04161 g002
Figure 3. TCC slab-to-wall connections tested. Dimensions are in mm.
Buildings 15 04161 g003
Figure 4. Test setup for the experiments.
Buildings 15 04161 g004
Figure 5. Loading protocols for cyclic tests.
Buildings 15 04161 g005
Figure 6. Typical failure mode in gravitational tests. The central red circle indicates the initial cracking point, while the lateral red circles show subsequent cracks along the slab–wall interface.
Buildings 15 04161 g006
Figure 7. Slab-to-wall connectors in cut-open specimens. The red line in the images indicates the approximated initial position of the connectors.
Buildings 15 04161 g007
Figure 8. (a) Measured load–slip response of concrete slabs. (b) Measured load-slip response of timber slabs.
Buildings 15 04161 g008
Figure 9. Typical failure mode of lateral tests. Flexural and shear cracks are highlighted with red circles in the figures.
Buildings 15 04161 g009
Figure 10. Load–slip relationships of lateral tests.
Buildings 15 04161 g010
Figure 11. Model of the slab-to-wall connections. Load and support conditions correspond to lateral tests.
Buildings 15 04161 g011
Figure 12. Shear stress distribution at 450 kN of lateral loading (MPa). Obtained from ETABS.
Buildings 15 04161 g012
Figure 13. Shear stress distribution at 450 kN of lateral loading in the model with cracks (MPa). Obtained from ETABS.
Buildings 15 04161 g013
Figure 14. Magnitude of principal stresses (MPa). Red indicates tensile stresses, while blue indicates compressive stresses. Own elaboration.
Buildings 15 04161 g014
Figure 15. Direction of principal stresses. Red indicates tensile stresses, while blue indicates compressive stresses. Own elaboration.
Buildings 15 04161 g015
Figure 16. Strut-and-tie model for the analysis of the concrete slab. Dimensions in mm.
Buildings 15 04161 g016
Table 1. Denomination of the test specimens for the characterization of the wall-to-slab connections.
Connection TypeConnector TypeLoading DirectionLoading ProtocolConnection ID
ISSCISSC
HSSCHSSC
IBSCIBSC
HBSCHBSC
ISGMISGM
HSGMHSGM
IBGMIBGM
HBGMHBGM
Table 2. Secant stiffness and strength obtained in gravitational tests.
Specimen K sec (kN/mm) V max (kN)Mean V max (kN)
HBGM-115.4133143
HBGM-29.4152
HSGM-16.9153177
HSGM-210.3200
IBGM-111.1129140
IBGM-26.8151
ISGM-10.7170172
ISGM-20.4175
Table 3. Secant stiffness and strength obtained in cyclic lateral tests.
Serie K sec (kN/mm) V max (kN)Mean V max (kN)
HBSC-18.2394446
HBSC-27.6498
HSSC-16.4436418
HSSC-213.8400
IBSC-112.6432434
IBSC-27.4437
ISSC-16.7430460
ISSC-212.1490
Table 4. Analytical capacities of the connections calculated according to EC5.
Connection/CapacityLateral (kN)Axial (kN)
IS41.118.6
HS22.632.0
IB52.70
HB52.70
Table 5. Material properties used in the FE model.
Material ρ (kg/m3)E (MPa) ν (-)
Concrete250025,6480.2
Wood (radiata pine)65088970.2
Table 6. Spring stiffness considered for the model in the different directions.
Spring K x (kN/mm) K y (kN/mm) K z (kN/mm)
Wall-slab I05.25.2
Wall-slab H05.12.8
Slab-slab8.61.11.1
Table 7. In-plane shear forces in each connector under 450 kN of loading.
ElementModel IModel H
V (kN) V (kN)
Connector 14.63.4
Connector 24.43.3
Connector 33.53.2
Table 8. In-plane shear forces under 450 kN loading in the cracked model.
ElementModel IModel H
V (kN) V (kN)
Connector 16.44.2
Connector 24.33.9
Connector 33.73.7
Disclaimer/Publisher’s Note: The statements, opinions and data contained in all publications are solely those of the individual author(s) and contributor(s) and not of MDPI and/or the editor(s). MDPI and/or the editor(s) disclaim responsibility for any injury to people or property resulting from any ideas, methods, instructions or products referred to in the content.