Article

A Generative AI Framework for Adaptive Residential Layout Design Responding to Family Lifecycle Changes

College of Civil Engineering and Architecture, Xinjiang University, Urumqi 830047, China
*
Author to whom correspondence should be addressed.
Buildings 2025, 15(22), 4155; https://doi.org/10.3390/buildings15224155
Submission received: 16 October 2025 / Revised: 13 November 2025 / Accepted: 14 November 2025 / Published: 18 November 2025

Abstract

Rapidly evolving family structures have intensified the demand for residential layouts that can flexibly adapt to diverse spatial and functional needs. Conventional design approaches, whether manual or computer-aided, often fail to maintain user-centered adaptability across the household lifecycle. Meanwhile, advances in generative artificial intelligence have introduced new opportunities for intelligent design generation; however, existing models tend to prioritize visual aesthetics over behavioral and functional coherence. This study proposes an integrated text-to-design workflow that transforms user requirements, extracted from different family lifecycle stages, into structured prompts for AI-driven spatial generation. A dedicated interior dataset is constructed to incorporate lifecycle responsiveness, user preferences, and spatial functionality, while a composite loss function is introduced to enhance diffusion model precision and contextual fidelity. Comparative experiments against mainstream models such as Stable Diffusion and MidJourney reveal superior adaptability, spatial rationality, and user alignment. Overall, the findings demonstrate the potential of generative AI to bridge user behavior analysis with architectural logic, promoting data-driven, adaptive, and human-oriented residential design practices.

1. Introduction

1.1. Background

Interior design plays a vital role in shaping everyday life, influencing not only spatial comfort but also social interaction and personal well-being [1]. Yet contemporary design practices still rely heavily on standardized layouts and designer-driven intuition, often overlooking the nuanced and evolving needs of diverse households [2]. As a result, many residential spaces achieve visual refinement but lack adaptability to changing family structures, functional diversity, and emotional resonance [3].
In recent years, generative artificial intelligence has begun to reshape architectural discourse [4]. Initially applied to exterior form exploration and spatial configuration studies, it has gradually extended into interior design, enabling rapid visualization and iterative design alternatives [5]. Models such as DALL·E 3 [6], Stable Diffusion 1.5 [7], and MidJourney v6 [8] demonstrate strong potential in translating abstract requirements into tangible spatial imagery, bridging the gap between user expectations and design representation. However, their application in interior environments remains limited, as these models struggle to embed lifecycle dynamics and user-specific demands within the generated outputs.

1.2. Literature Review

1.2.1. The Evolution of Architectural and Interior Design Technologies

The evolution of architecture and interior design has always reflected the interplay between technological innovation and shifting design philosophies. Hand-drawn drafting once served as the discipline’s foundation, where design quality depended almost entirely on individual craftsmanship [9]. The advent of Computer-Aided Design (CAD) in the late twentieth century marked a decisive transformation, introducing precision and efficiency that reshaped visualization practices [10]. Tools such as Revit 2024 [11] and 3ds Max 2024 [12] enabled designers to simulate lighting, materials, and structural behavior with unprecedented realism. Yet, despite these advances, such methods remained bound by human control and intuition. The subsequent rise of parametric design and digital simulation over the past two decades signaled a deeper shift—from static representation toward computational exploration of form, performance, and adaptability [13,14].

1.2.2. Advancements of Generative Artificial Intelligence in Architectural Design

Generative Artificial Intelligence (AI) has further accelerated this transformation. Early applications primarily focused on façade design, structural optimization, and spatial layout exploration [15]. For instance, Wen et al. employed fractal geometry to generate conceptual façades [16], while Sharafi et al. used ant colony algorithms to optimize building envelopes [17]. Yi and Kim advanced multi-objective architectural design through clustering methods, linking performance with morphology [18]. More recently, GAN-based systems such as UDGAN have provided architects with rapid design alternatives [19], and hybrid frameworks integrating deep learning with user-preference recognition have even leveraged EEG data to capture aesthetic judgment [20]. Hu et al. demonstrated how GANs could automatically generate residential floor plans, paving the way for automated housing design [21,22], while Yu et al. extended such strategies to site planning, energy optimization, and façade generation [23].

1.2.3. Strengths and Limitations of Mainstream Generative Models

Only in recent years has generative AI shifted toward interior environments, with diffusion-based models showing significant promise in reconciling functional organization with stylistic coherence [24]. Alongside academic research, commercial platforms have reshaped both practice and discourse. DALL·E [6,25,26] pioneered multimodal text-to-image generation, producing imaginative visuals from simple prompts. Stable Diffusion [7] introduced openness and customization, quickly becoming a cross-disciplinary experimental tool. MidJourney [8], with its visual richness and stylistic precision, gained popularity among professional designers. Despite their aesthetic diversity, these systems rely on large-scale, non-specialized datasets, which limit reliability in residential contexts. As noted by Chen et al., such models often underperform in representing cultural subtleties, spatial coherence, and functional intent, underscoring the need for carefully curated, domain-specific datasets [27].
Recently, large-scale multi-modal models such as Grok, GPT-4V, and Gemini have demonstrated emerging image generation capabilities [28]. However, these models are often closed-source or offer limited control over domain-specific outputs, making it challenging to adapt them directly for residential interior design tasks. In contrast, diffusion-based frameworks, such as Stable Diffusion and its derivatives, allow model fine-tuning with curated datasets, controlled prompt structures, and customized loss functions, which are essential for capturing lifecycle-dependent spatial requirements. This comparative discussion clarifies the rationale for selecting a diffusion-based approach in the present study, emphasizing its accessibility, controllability, and suitability for domain-specific adaptation.

1.2.4. Architectural Adaptability and Human-Centered Design

Architecture, at its core, has always been a negotiation between permanence and change. Contemporary theories of adaptability revisit this balance, emphasizing that buildings must accommodate the fluidity of everyday life rather than resist it. In recent years, reinterpretations of Habraken’s open building theory have reasserted the value of separating permanent structural systems from transformable infill components, allowing homes to evolve with their occupants [29,30]. This distinction between framework and infill extends beyond construction logic—it embodies an architectural ethic that embraces time, uncertainty, and participation. In this sense, adaptability becomes not merely a technical parameter but a cultural stance toward change, one that underpins the generative framework proposed in this study.
Parallel to this, Brand’s and Schneider & Till’s explorations of temporality in design reveal architecture as a layered organism, where structure, services, layout, and furnishings operate on different temporal rhythms [31,32]. Some layers endure for decades; others shift with the pace of daily life. Recognizing these temporal layers reframes housing as a living system rather than a fixed artifact. It also opens a path for design methods that translate behavioral and emotional evolution into spatial transformation [33]. Within this theoretical frame, the present research positions generative tools as instruments of human-centered adaptability—tools that do not replace architectural intent but reinterpret it through patterns of domestic life.

1.2.5. Family Structure Transformation and Emerging Research Gaps

Meanwhile, the realities of family life continue to reshape residential needs. Family structures are no longer stable; honeymoon, child-rearing families, education-focused households, and multi-generational co-living arrangements each require differentiated spatial solutions. Bedrooms evolve from private retreats to shared zones; living rooms become multifunctional arenas; kitchens increasingly merge service and social functions. The growing demand for elder care adds further complexity, requiring integration of accessibility and safety within existing domestic functions [34]. These observations resonate with recent demographic and architectural research emphasizing how lifecycle transitions drive shifts in spatial adaptability, functional zoning, and household efficiency [35,36].
However, as Onatayo et al. note, most AI-driven design frameworks remain predominantly focused on visual realism while lacking mechanisms to embed architectural adaptability or respond to lifecycle-dependent spatial transformations [37]. Existing literature thus reveals a critical gap: generative AI can produce aesthetically diverse outcomes but often fails to account for evolving family structures, functional continuity, and adaptability of space over time. Bridging this gap requires shifting from purely style-driven generation toward lifecycle-aware, human-centered design logic that explicitly considers spatial functionality, zoning flexibility, and adaptability to household evolution. In response, this study proposes a framework that integrates a curated interior dataset (Nov-13), a composite loss function encoding lifecycle and functional constraints, and a fine-tuned diffusion model, enabling the generation of interior layouts that are both visually engaging and architecturally responsive to changing family needs.

1.3. Research Gaps and Objective

The research gaps that this study aims to bridge are as follows:
  • Existing studies on generative AI in housing design address single or static residential layouts, often neglecting the dynamic evolution of family structures and associated spatial adaptability requirements across the life cycle. Previous frameworks, such as ControlNet and FloorDiffusion, provide strong control over geometric or semantic conditioning, yet they lack mechanisms to represent functional continuity and behavioral transitions across time. This research focuses on adaptive residential layouts that respond to functional and spatial transformations driven by family transitions, aiming to address how generative AI can systematically capture and generate layouts that reflect evolving household configurations.
  • While prior research has explored user-centered design, there is limited investigation into stage-specific shifts in spatial requirements, zoning flexibility, and multifunctional adaptation resulting from family structure transitions, such as shifts from couples to child-rearing households or multigenerational caregiving. Models such as LayoutDM partially incorporate spatial reasoning but remain restricted to fixed typologies and do not integrate lifecycle variability or user-behavioral logic. This study, therefore, emphasizes mapping behavioral and spatial needs across life-cycle stages, integrating them into AI-driven layout generation to bridge this gap between architectural functionality and life-cycle-aware design.
  • Conventional applications of Stable Diffusion in residential design often exhibit inconsistencies between prompts and generated outcomes, failing to align with functional requirements and the subtleties of family life cycles. To overcome these limitations, the present study introduces a composite loss function that simultaneously optimizes aesthetic coherence, spatial adaptability, and behavioral fidelity. Unlike single-objective diffusion tuning in existing works, the proposed loss formulation establishes a multi-criteria optimization process that allows generative outputs to maintain both architectural rationality and lifecycle sensitivity. Accordingly, this study proposes a framework that translates family-structure-driven requirements into AI-interpretable prompts, incorporates stage-specific floor plans as ControlNet constraints, and introduces a novel composite loss function to guide lifecycle-responsive fine-tuning. This approach enables more accurate and architecturally informed generation of layouts and interior visuals, thereby bridging the gap between evolving family needs and AI-generated design outputs, and contributing to more adaptable, life-cycle-sensitive residential design.
To further clarify the distinction between existing methods and the proposed framework, Table A1 has been added to summarize the methodological differences among ControlNet, FloorDiffusion, LayoutDM, and the present study, highlighting the role of lifecycle-driven composite optimization in achieving adaptive spatial generation.
Accordingly, this study is guided by the following core research question:
How can generative artificial intelligence be leveraged to adapt residential layout design to evolving family lifecycle transitions while maintaining human-centered spatial logic and functionality?
To address this question, three research objectives are established:
  • To analyze family lifecycle characteristics and extract stage-specific behavioral, spatial, and functional requirements that inform adaptive housing design;
  • To construct a generative design framework integrating user-behavioral logic, spatial adaptability principles, and a fine-tuned diffusion model for lifecycle-responsive layout generation;
  • To evaluate the proposed framework through a comparative analysis of functional behavioral, spatial alignment, and performance against conventional design workflows.

2. Methodology

2.1. Framework

This study introduces a framework that integrates generative AI into residential layout design while explicitly considering the dynamic nature of family life cycles. Built upon the professionally curated Nov-13 dataset, the framework draws from over 40,000 high-quality images collected from specialized sources, of which 20,000 were retained after careful screening. Each image was manually annotated to capture user requirements and spatial functions and evaluated for aesthetic quality using an open-source model [38], ensuring both semantic consistency and visual reliability. To render the dataset operationally effective, a composite loss function was devised, balancing responsiveness to life-cycle changes, accurate translation of user requirements, and spatial functionality. Consequently, the fine-tuned diffusion model (Nev) generates outputs that not only pursue visual appeal but also adapt to evolving household functions, distinguishing itself from conventional generative approaches. Further analysis focused on 90 m2, 120 m2, and 150 m2 apartments, mapping four specific life-cycle stages—honeymoon, child-rearing, education, and parental care—onto corresponding floor plans, which serve as the structural foundation for AI-driven layouts. Leveraging large language models, these layouts are converted into structured prompts, enabling the generated designs to embody life-cycle-driven requirements. By embedding family-specific considerations directly into the prompts, the framework allows AI to move beyond a passive visualization tool, actively participating in the conceptual design phase and assisting architects in exploring diverse, context-sensitive solutions. The research framework is presented in Figure 1.

2.2. Nov-13 Dataset

The Nov-13 dataset was constructed by collecting images from professional interior design websites, specifically including Zhimo [39], Google [40], and Bing [41]. An initial collection of over 40,000 high-resolution interior images was curated. Each image underwent detailed evaluation, and those exhibiting inconsistent decorative styles or unclear details were excluded. After a rigorous filtering process, 22,028 images meeting predefined quality and resolution standards were retained. All selected data originated from publicly accessible, non-commercial sources licensed under CC BY-NC 4.0 [42], ensuring compliance with open-data and research ethics guidelines.
To ensure labeling reliability, spatial functions and user requirements were manually annotated by two qualified designers with architectural training, and inter-annotator agreement reached 0.87 (Cohen’s κ) [43], indicating strong consistency. User requirements were classified into five categories: functional and physical needs, behavioral and activity needs, psychological and emotional needs, social and cultural needs, and health and sustainability needs. Spatial functions were categorized as bedroom, living room, dining room, children’s room, and study. Category distributions and examples are summarized in Table 1.
For automated aesthetic annotation of interior design images [38], the dataset leveraged a state-of-the-art scoring model introduced in 2023, which was trained on 137,000 images with existing aesthetic scores. According to its authors, this model outperforms other mainstream models in score prediction. Using this model, each image in Nov-13 was automatically annotated with an aesthetic score. To facilitate training of the diffusion model, all scores were normalized to follow a standard normal distribution and then scaled to integers between 1 and 10 [44]. All aesthetic scores, manual labels, and metadata were validated before training to ensure dataset integrity and reproducibility (Figure 2).

Dataset Transparency and Ethical Compliance

The Nov-13 dataset is an original dataset constructed by the authors, developed through systematic collection and manual curation of publicly available, non-commercial interior design images. The name “Nov-13” refers solely to the authors’ internal versioning and dataset iteration and does not imply any external release or accessibility. Image data were obtained from three major open web platforms—Zhimo, Google, and Bing—and each source was screened for compliance with open-access and research ethics requirements.
All collected materials were explicitly permitted for non-commercial academic use under Creative Commons Attribution–Noncommercial 4.0 (CC BY-NC 4.0) or equivalent terms. To ensure transparency and replicability, the dataset construction process involved (1) downloading over 40,000 candidate images from open web platforms; (2) removing entries containing personal identifiers or copyright-sensitive content; and (3) curating 22,028 high-quality images that met resolution and compositional standards. The dataset covers a broad range of geographic and residential typologies, including apartments, single-family houses, and multi-generational dwellings from Asia, Europe, and North America, thereby enhancing spatial and cultural representativeness.
Ethical compliance was maintained throughout the dataset creation process. No private, commercial, or personally identifiable materials were used. All data were processed solely for academic research and visualization purposes, in full accordance with institutional research-ethics policies and open-data standards. Manual annotation was performed by two trained designers under anonymized conditions to avoid potential bias or privacy concerns.

2.3. Training Loss Function Formulation

During the loss function construction phase, this study introduces a novel composite loss function that incorporates life-cycle responsiveness, user requirements, and spatial functionality as additional loss components (Equation (2)), building upon the conventional loss function of diffusion models (Equation (1)). The primary goal of model training is to generate interior designs that satisfy predefined requirements for life-cycle responsiveness, user requirements, and spatial functionality. The model is trained to minimize the loss, thereby achieving the desired capabilities [45].
The base diffusion model is expressed by Equation (1):
L b a s e = E Y , h , ϵ w t Y ^ θ α t Y + σ t ϵ , h     Y 2 2
In Equation (1), L b a s e denotes the mean reconstruction loss, and model training aims to minimize this value; lower loss indicates higher-quality generation. Here, Y ^ θ represents the diffusion model parameterized by θ , which receives noisy image inputs α t Y + σ t ϵ and conditional text embeddings h to predict Y . The weighting term w t controls the contribution of each timestep during noise scheduling.
To address the limitations of conventional diffusion models—particularly their lack of functional responsiveness and lifecycle adaptability—this study proposes the following composite loss function:
The proposed composite loss function is formalized in Equation (2):
L t o t a l = E Y , h , ϵ , t w t Y ^ θ α t Y   + σ t ϵ , h     Y 2 2   +   λ E Y p r , h p r , ϵ , t w t Y ^ θ α t Y   + σ t ϵ , h p r   Y p r 2 2
This enhanced loss integrates lifecycle responsiveness, user requirements, spatial functionality, and prior-knowledge preservation. The first term corresponds to the standard reconstruction loss, measuring the discrepancy between generated results and ground truth images Y . The second term introduces a prior-knowledge retention mechanism, comparing the outputs of the fine-tuned model Y ^ θ with those of the pretrained model Y p r . This enables the model to assimilate lifecycle-sensitive behavior while avoiding catastrophic forgetting of general diffusion capabilities. To balance these two components, a learnable coefficient λ is introduced. In this study, λ is initialized within the range [ 0.1 , 1.0 ] and updated through gradient descent during training, allowing the network to adaptively control the influence of prior-knowledge preservation relative to lifecycle-dependent learning. This formulation supports stable optimization and ensures that fine-tuning does not overwrite essential generative priors.
By combining these components, the composite loss guides the model to retain general diffusion knowledge while learning to generate interior designs that are aesthetically coherent and aligned with user requirements, lifecycle transitions, and spatial functionality.
Symbol definitions:
  • Y : target (ground truth) interior image;
  • Y p r : image generated by pre-trained diffusion model;
  • h , h p r : textual conditioning or prompt embedding;
  • ϵ , ϵ : Gaussian noise vectors drawn from N ( 0 , I ) ;
  • α t , α t : forward diffusion scheduling coefficients at step t ;
  • w t , w t : time-step-dependent weights;
  • θ : learnable parameters of the diffusion network;
  • λ : adaptive weight for prior knowledge regularization.

2.4. Model Fine-Tuning

The Nov-13 dataset was employed to fine-tune the diffusion model. Specifically, images annotated with diverse interior design styles were input into the diffusion model, which was trained using the novel composite loss function. By incorporating loss components related to life-cycle responsiveness, user requirements, and spatial functionality, the model learns to capture a variety of interior design styles while aligning them with predefined prompts. Subsequently, architects can utilize these predefined prompts to generate interior layouts that conform to the specified design styles, enabling controlled and targeted AI-assisted design generation.

2.5. Generating Designs Using Fine-Tuned Models

Designers can easily leverage the fine-tuned diffusion model to generate high-quality architectural designs by providing architectural terms and guiding prompts. The proposed approach substitutes conventional design workflows—including drawing, modeling, and rendering—with a generative design methodology. Using this method, designs can be generated in just 10 s on a computer equipped with a 12 GB VRAM graphics card, thereby streamlining the architectural design workflow and enhancing both efficiency and output quality. Figure 3 shows the advantages of AI-aided design in practical application by comparing and analyzing the traditional design method and the generative design method.

2.6. Experimental Configuration and Reproducibility

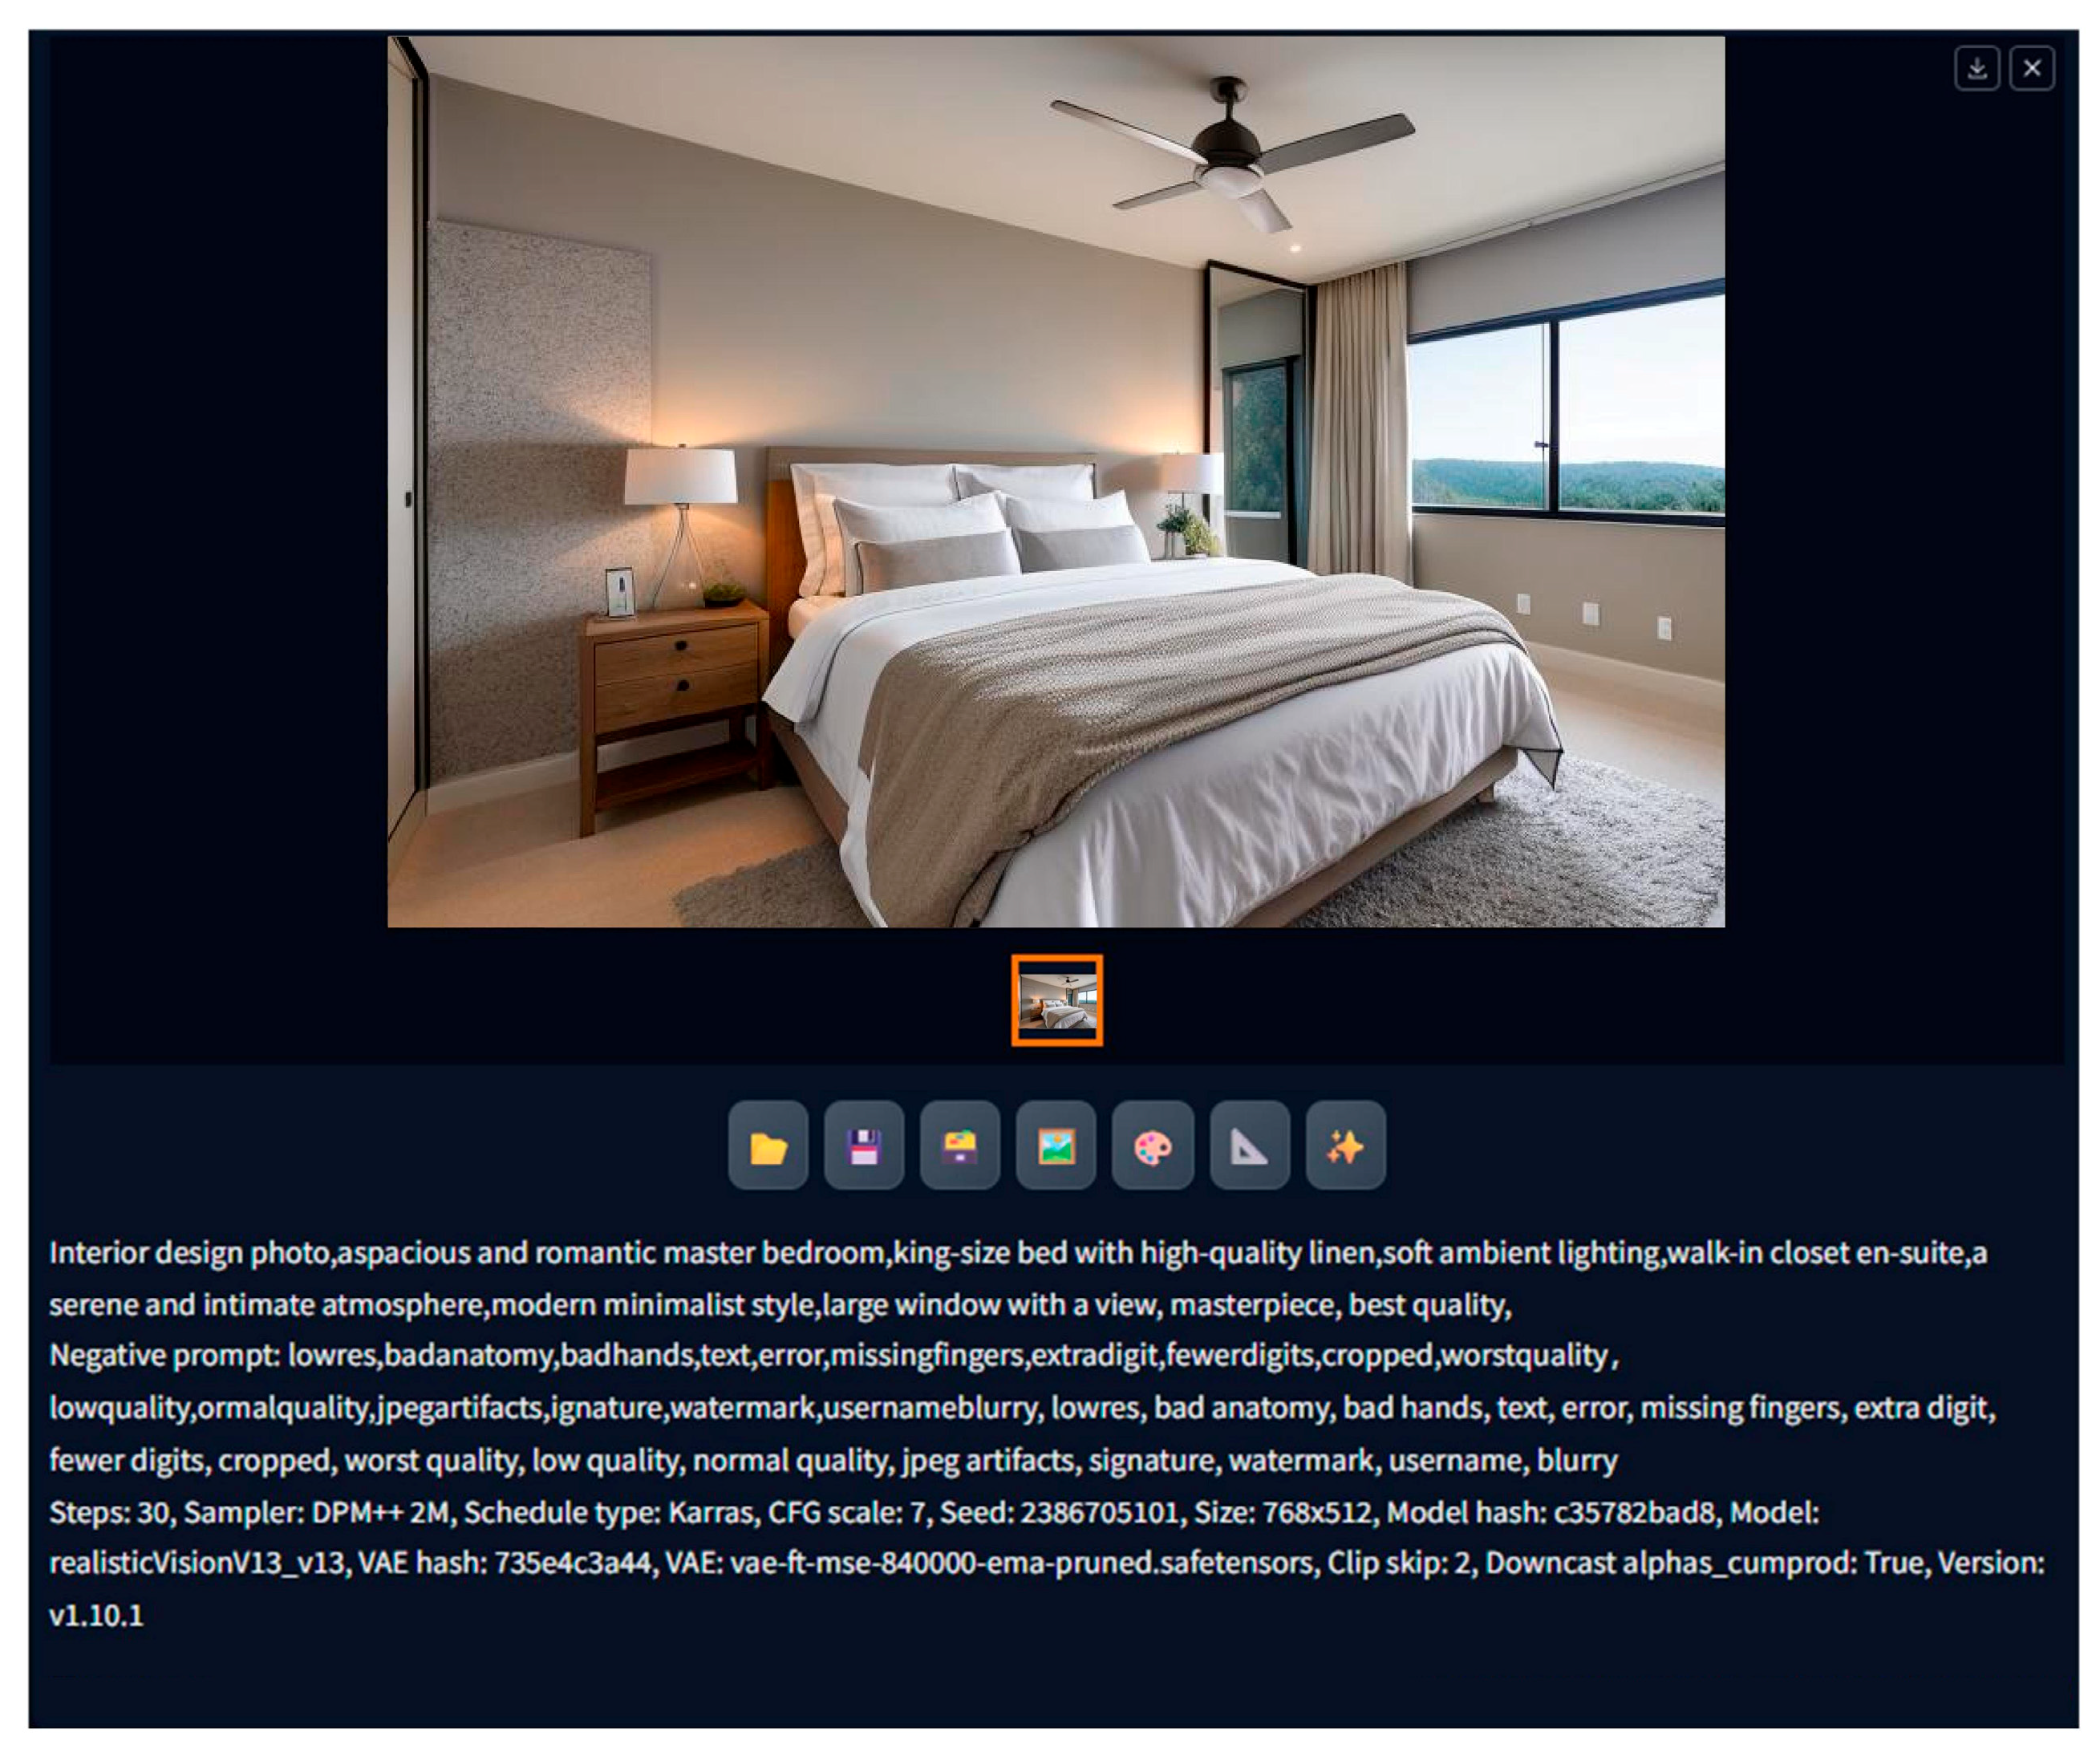
To ensure the methodological rigor and fairness of comparison, all generative models were implemented under standardized workflow settings. Specifically, identical prompt structures, random seeds, and image resolutions (768 × 512 px) were adopted across all experiments. For Stable Diffusion, the ComfyUI 2024 pipeline, SDXL 1.0 base model, and consistent scheduler settings were employed. In order to maintain a neutral baseline, no additional fine-tuning modules such as Lora or ControlNet were introduced, ensuring that model performance reflected the intrinsic capability of the core architecture rather than task-specific optimization. Appendix A summarizes the parameter settings and prompt configurations related to reproducibility.
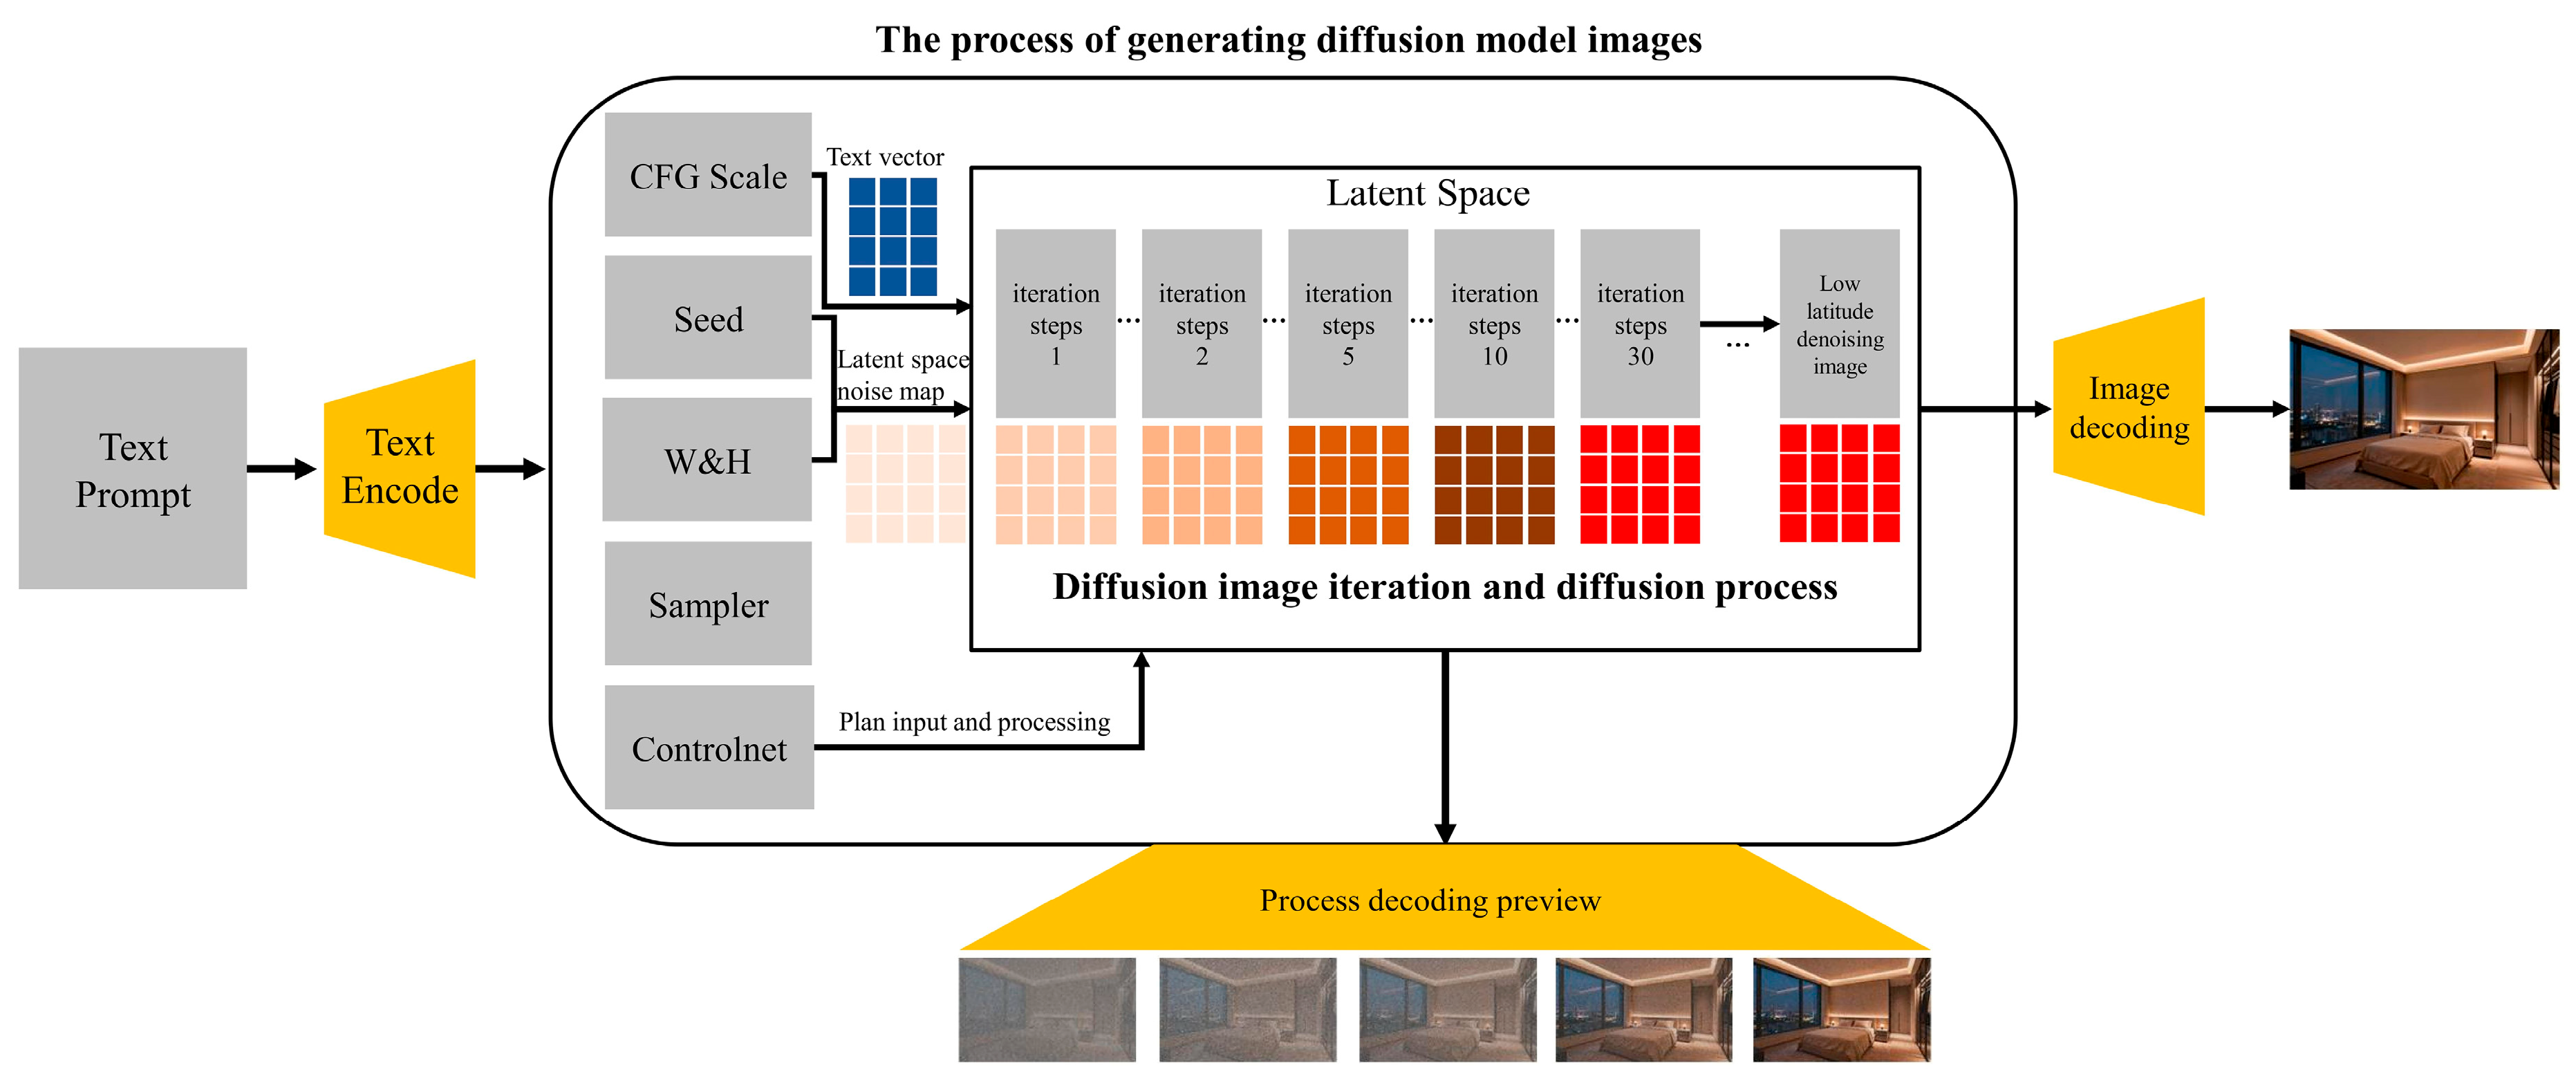
Midjourney (v6.0) was selected as a commercial benchmark due to its widespread adoption and high aesthetic performance in design-oriented AI workflows. Although its internal parameters are proprietary, this study emphasizes relative performance trends across different lifecycle scenarios rather than absolute visual quality. While further fine-tuning or multi-model integration may enhance performance diversity, the current phase primarily focuses on evaluating functional and behavioral alignment between generative outputs and user requirements. Figure 4 provides a visual overview of the complete data flow, illustrating each stage from textual prompt input and ControlNet conditioning to the final image generation process.
However, Stable Diffusion and MidJourney are known to exhibit substantial performance variation under alternative inference pipelines, sampler configurations, or fine-tuning strategies. Given the focus of this study on lifecycle-responsive behavioral alignment rather than aesthetic maximization, a comprehensive parameter-optimization sweep was not undertaken. Instead, representative and widely adopted configurations were selected to provide a controlled, reproducible, and methodologically consistent baseline for comparison. This constitutes a methodological limitation, and the findings should be interpreted as performance under standardized conditions rather than as globally optimal baselines for each model. The potential for extended experimental design and optimization is discussed in Section 4.2 as a future research direction.

2.7. Validation Method

In the field of computer vision, existing validation methods for “text-to-image” generative AI primarily focus on assessing the visual quality of the generated images [46,47]. However, research on the application of text-to-image generative AI in architectural design remains relatively limited. Considering that the evaluation of interior design is inherently subjective and involves aesthetic considerations, Chen et al. [45] employed a questionnaire-based approach, using multiple evaluation criteria associated with professional architects’ design quality ratings—such as overall impression, design details, architectural coherence, and consistency of architectural style—to subjectively assess the images produced by generative AI. Nevertheless, these criteria are insufficient for evaluating the method’s capability to reflect specific design intentions.
To address this gap, the present study evaluates the performance of the proposed model to verify whether particular design intentions are accurately represented in the generated interior design images. Specifically, when given identical inputs, the outputs of the proposed method are compared with those of two existing generative image AI models, Stable Diffusion (SD), and MidJourney. The evaluation focuses on the extent to which each model effectively captures (1) translation of user requirements, (2) spatial life-cycle responsiveness, (3) style consistency, (4) functional completeness, (5) rationality of design details, and (6) overall generation quality. The assessment was conducted via a questionnaire survey involving invited professional designers, who scored each model based on these six criteria.

3. Result

3.1. Family Lifecycle and Corresponding Space-User Requirements

This study analyzes the spatial and functional transformations across four household lifecycle stages—honeymoon, child-rearing, educational, and parental care—based on three typical apartment sizes: 90 m2, 120 m2, and 150 m2. During the honeymoon period (2 occupants), the 90 m2 unit emphasizes compactness and efficient spatial utilization; the 120 m2 unit balances privacy and flexibility with one private bedroom and an adjustable multiuse space; and the 150 m2 unit provides enhanced comfort and more generous shared living areas.
In the child-rearing period (3 occupants), the 90 m2 unit faces functional overlap, especially in providing a dedicated children’s room and sufficient storage. The 120 m2 unit allows moderate reconfiguration—such as converting secondary bedrooms for childcare purposes—while the 150 m2 unit offers clearer zoning between parent–child and adult activity areas. During the educational period (3 occupants), coordination between study and living spaces becomes critical. The 90 m2 unit is constrained in offering independent study corners; the 120 m2 unit flexibly balances study and recreation; and the 150 m2 unit accommodates multifunctional learning areas alongside quiet private zones. In the parental care period (4 occupants), the 90 m2 unit tends to feel overcrowded under multigenerational living conditions; the 120 m2 unit supports the addition of parents’ rooms and shared common areas while maintaining key functional integrity; and the 150 m2 unit ensures superior spatial zoning and comfort to address extended-family caregiving needs [34,48].
Overall, the 120 m2 unit demonstrates the most balanced adaptability across all stages, effectively integrating spatial flexibility with evolving family demands. Consequently, this study adopts the 120 m2 apartment as the primary research prototype to ensure both representativeness and generalizability of the findings. The corresponding spatial design requirements for each lifecycle stage are illustrated in Figure 5, while Table 2 presents the translation of prompt words corresponding to user needs in different spaces, using the 120 m2 apartment as an example.

3.2. Generating Interior Visualizations for Different Spaces Using Three Approaches

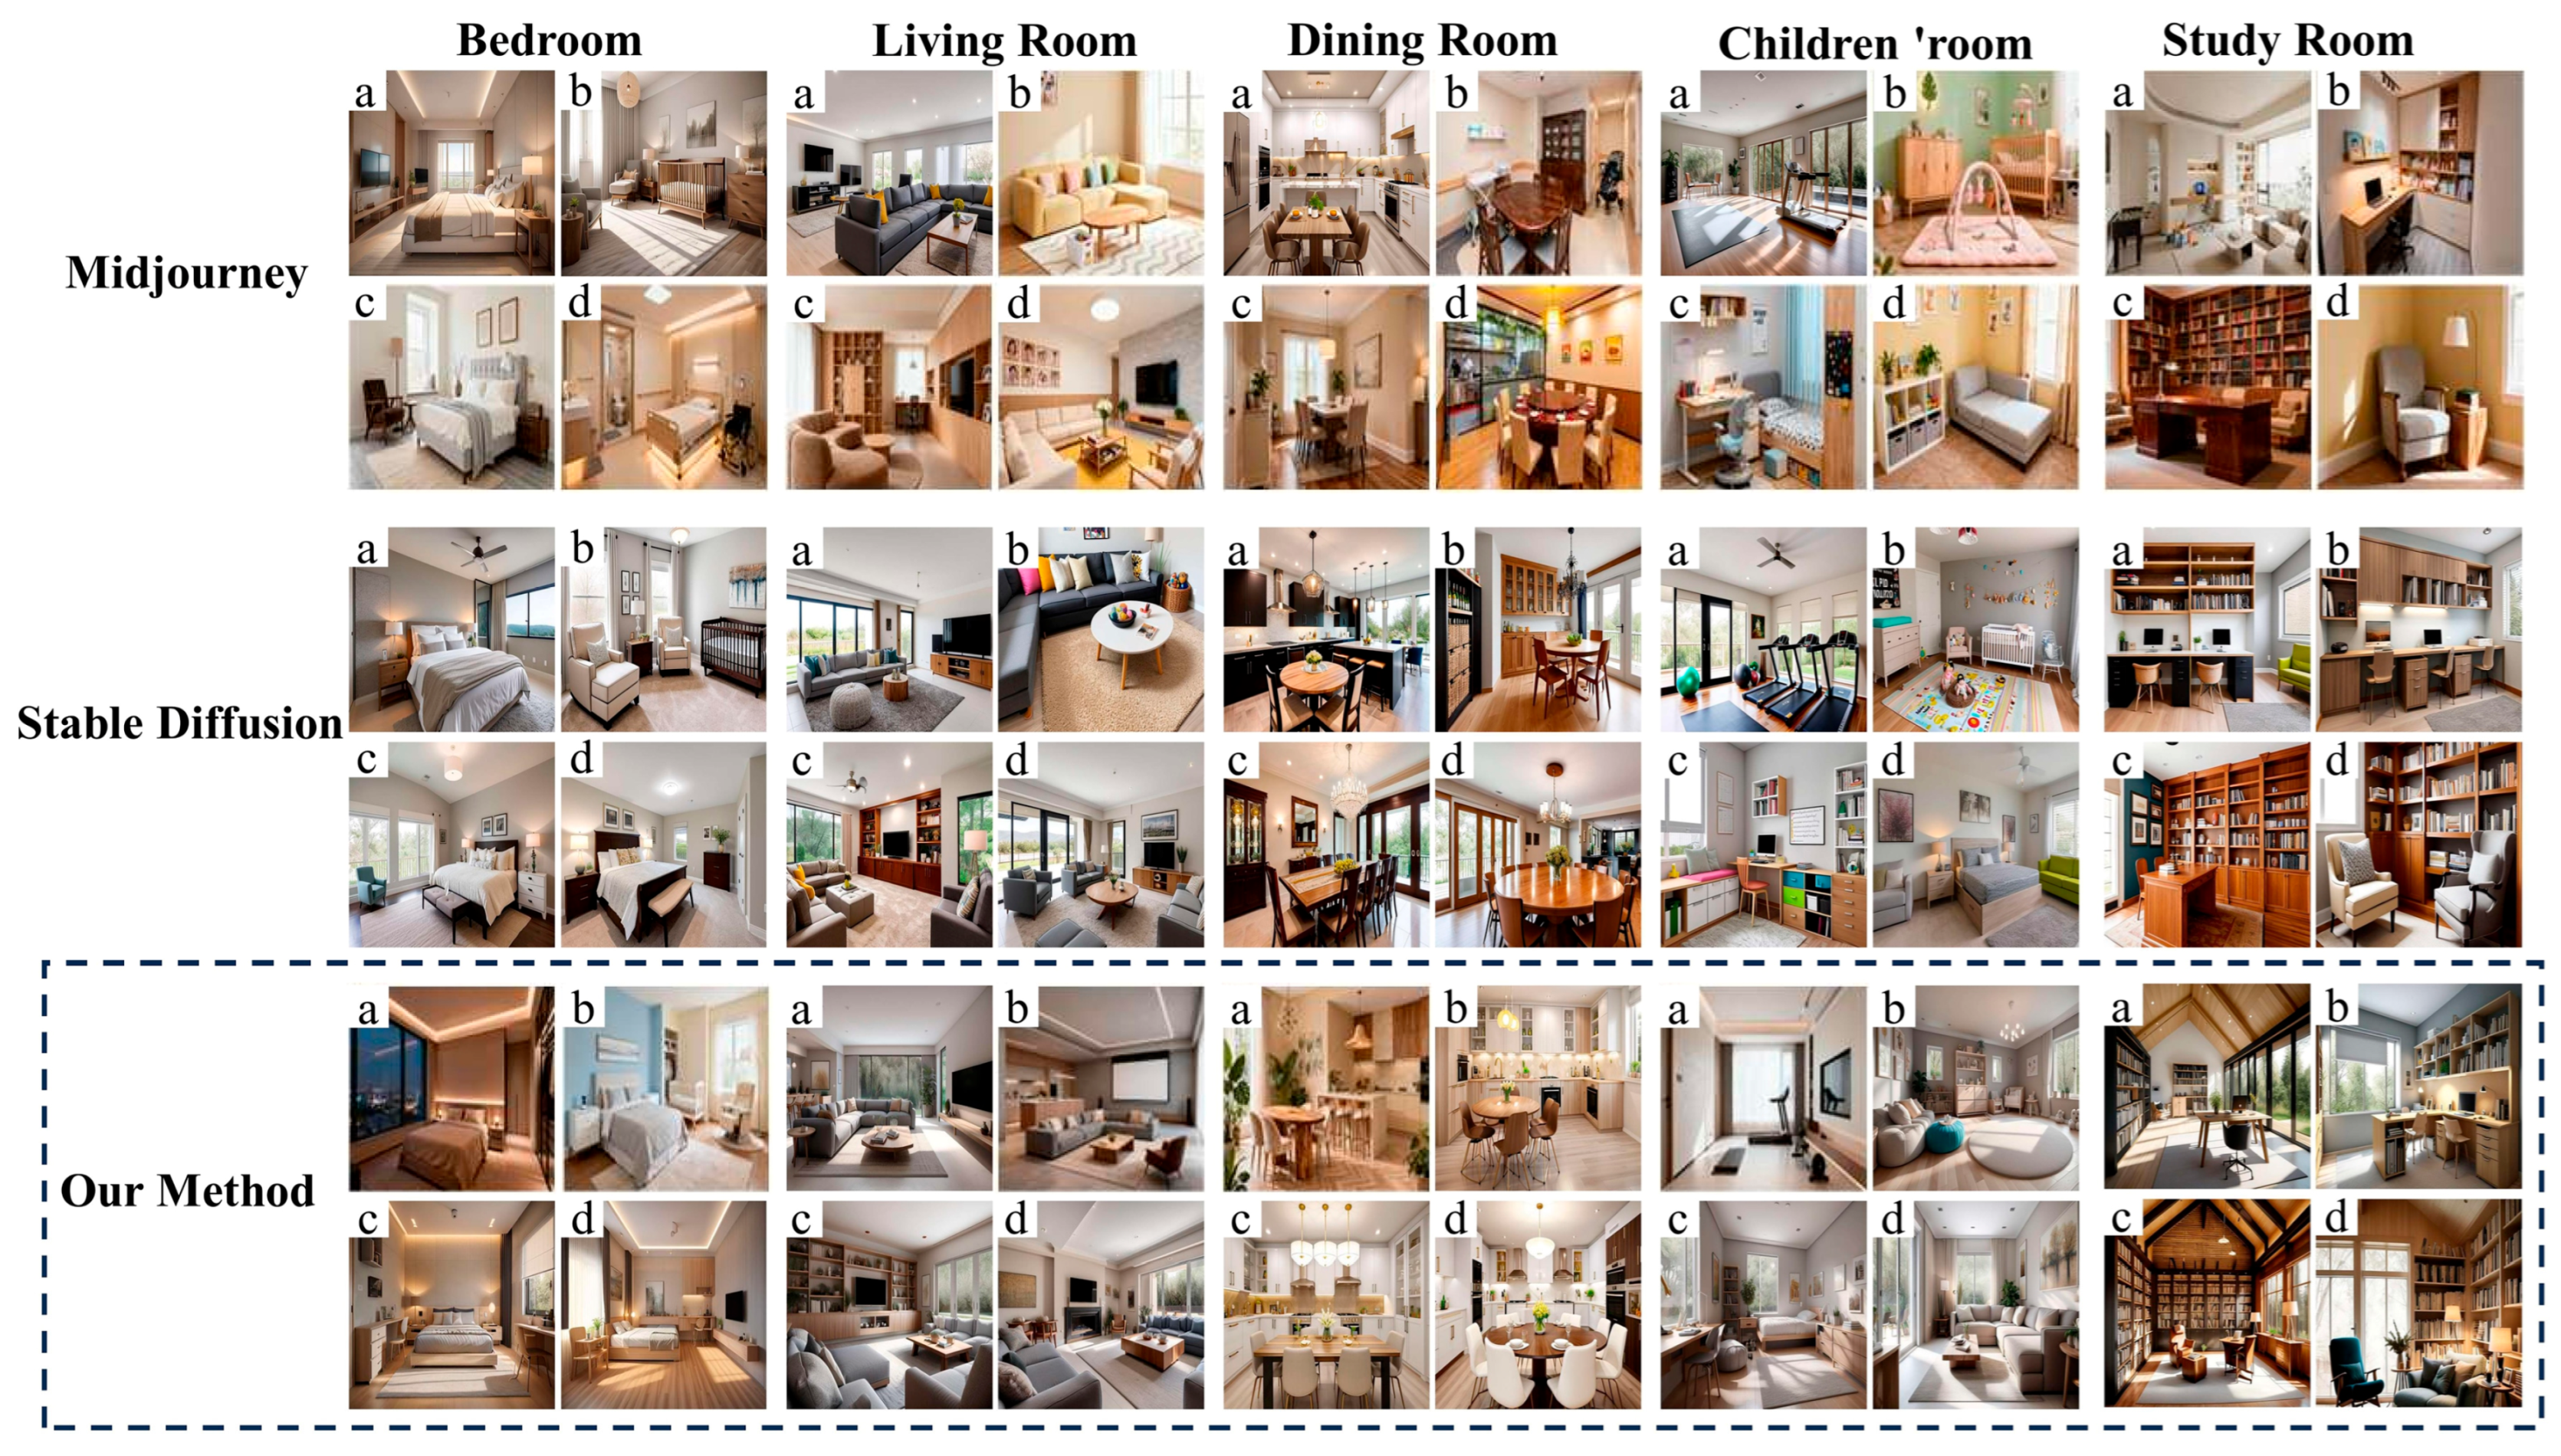
This study uses floor plans of the 120 m2 unit as a reference, focusing on five core spaces: bedrooms, living rooms, dining rooms, children’s rooms, and studies. Indoor visualizations are generated following a three-step process: requirement extraction → prompt translation → model generation. Specifically, functional and emotional requirements are first extracted from different life-cycle stages, then translated into AI-recognizable prompts, which are subsequently input into three methods: Stable Diffusion (SD), MidJourney, and the life-cycle-driven Nev. The comparative visual outcomes are illustrated in Figure 6.
Each method exhibits distinct characteristics. SD offers openness and controllability, making it suitable for detailed and stylistic adjustments, though its outputs are highly sensitive to prompt formulation. MidJourney excels in overall aesthetics and atmospheric rendering but is less precise in reflecting functional requirements. Nev, on the other hand, introduces a composite loss function that integrates life-cycle responsiveness, user requirements, and spatial functionality, achieving a more balanced trade-off between visual quality and functional fidelity. Comparing the outputs of these methods provides insight into their effectiveness in generating visually appealing images that also satisfy user requirements, thereby laying a foundation for subsequent analyses.

3.3. Validation and Results

Based on the evaluation criteria described in Section 2.6, this study designed a questionnaire to quantitatively assess the strengths and weaknesses of the proposed method (Figure 7). Specifically, the questionnaire was developed to evaluate the three generative methods across the four life-cycle periods. Each questionnaire initially presented images generated by the three methods. Although “Nev” was internally designated as Option B for tracking consistency, participants were not informed of this assignment, and the display order of the three options was randomized for each respondent to avoid order bias. Participants were asked to visually assess each image based on six criteria: translation of user requirements, life-cycle responsiveness, style consistency, functional rationality, completeness of details, and overall design quality. Response options for the first five criteria ranged from “Not matched—1” to “Highly matched—5,” while overall design quality was rated on a five-point scale from “Poor—1” to “Excellent—5.”
To ensure statistical power and reliability, an a priori power analysis was conducted using G*Power 3.1 [49], based on a repeated-measures ANOVA framework (α = 0.05, 1 − β = 0.80, Cohen’s f = 0.25). This analysis indicated a minimum required sample size of 15 participants under 12 measurement conditions (3 generative methods × 4 life-cycle periods). Considering potential data invalidity and the moderate-to-small effect sizes typically found in design-related studies, the actual sample size was expanded to enhance robustness and generalizability [50].
A total of 50 questionnaires were distributed to professionals with expertise in architecture, interior design, and human-environment interaction. The participants were selected based on three criteria:
  • Holding a professional degree or equivalent qualification in a design-related discipline;
  • Possessing at least five years of professional or academic experience;
  • Having prior engagement with residential or spatial layout design projects.
Of the 50 distributed questionnaires, 43 valid responses were returned, yielding an effective response rate of 86%. After data screening, three responses were excluded due to incomplete evaluations (missing values in more than two dimensions) or extreme response patterns (e.g., identical scores across all images), which could compromise reliability. Consequently, the final effective sample size was n = 40, ensuring adequate statistical power for subsequent multidimensional analyses.
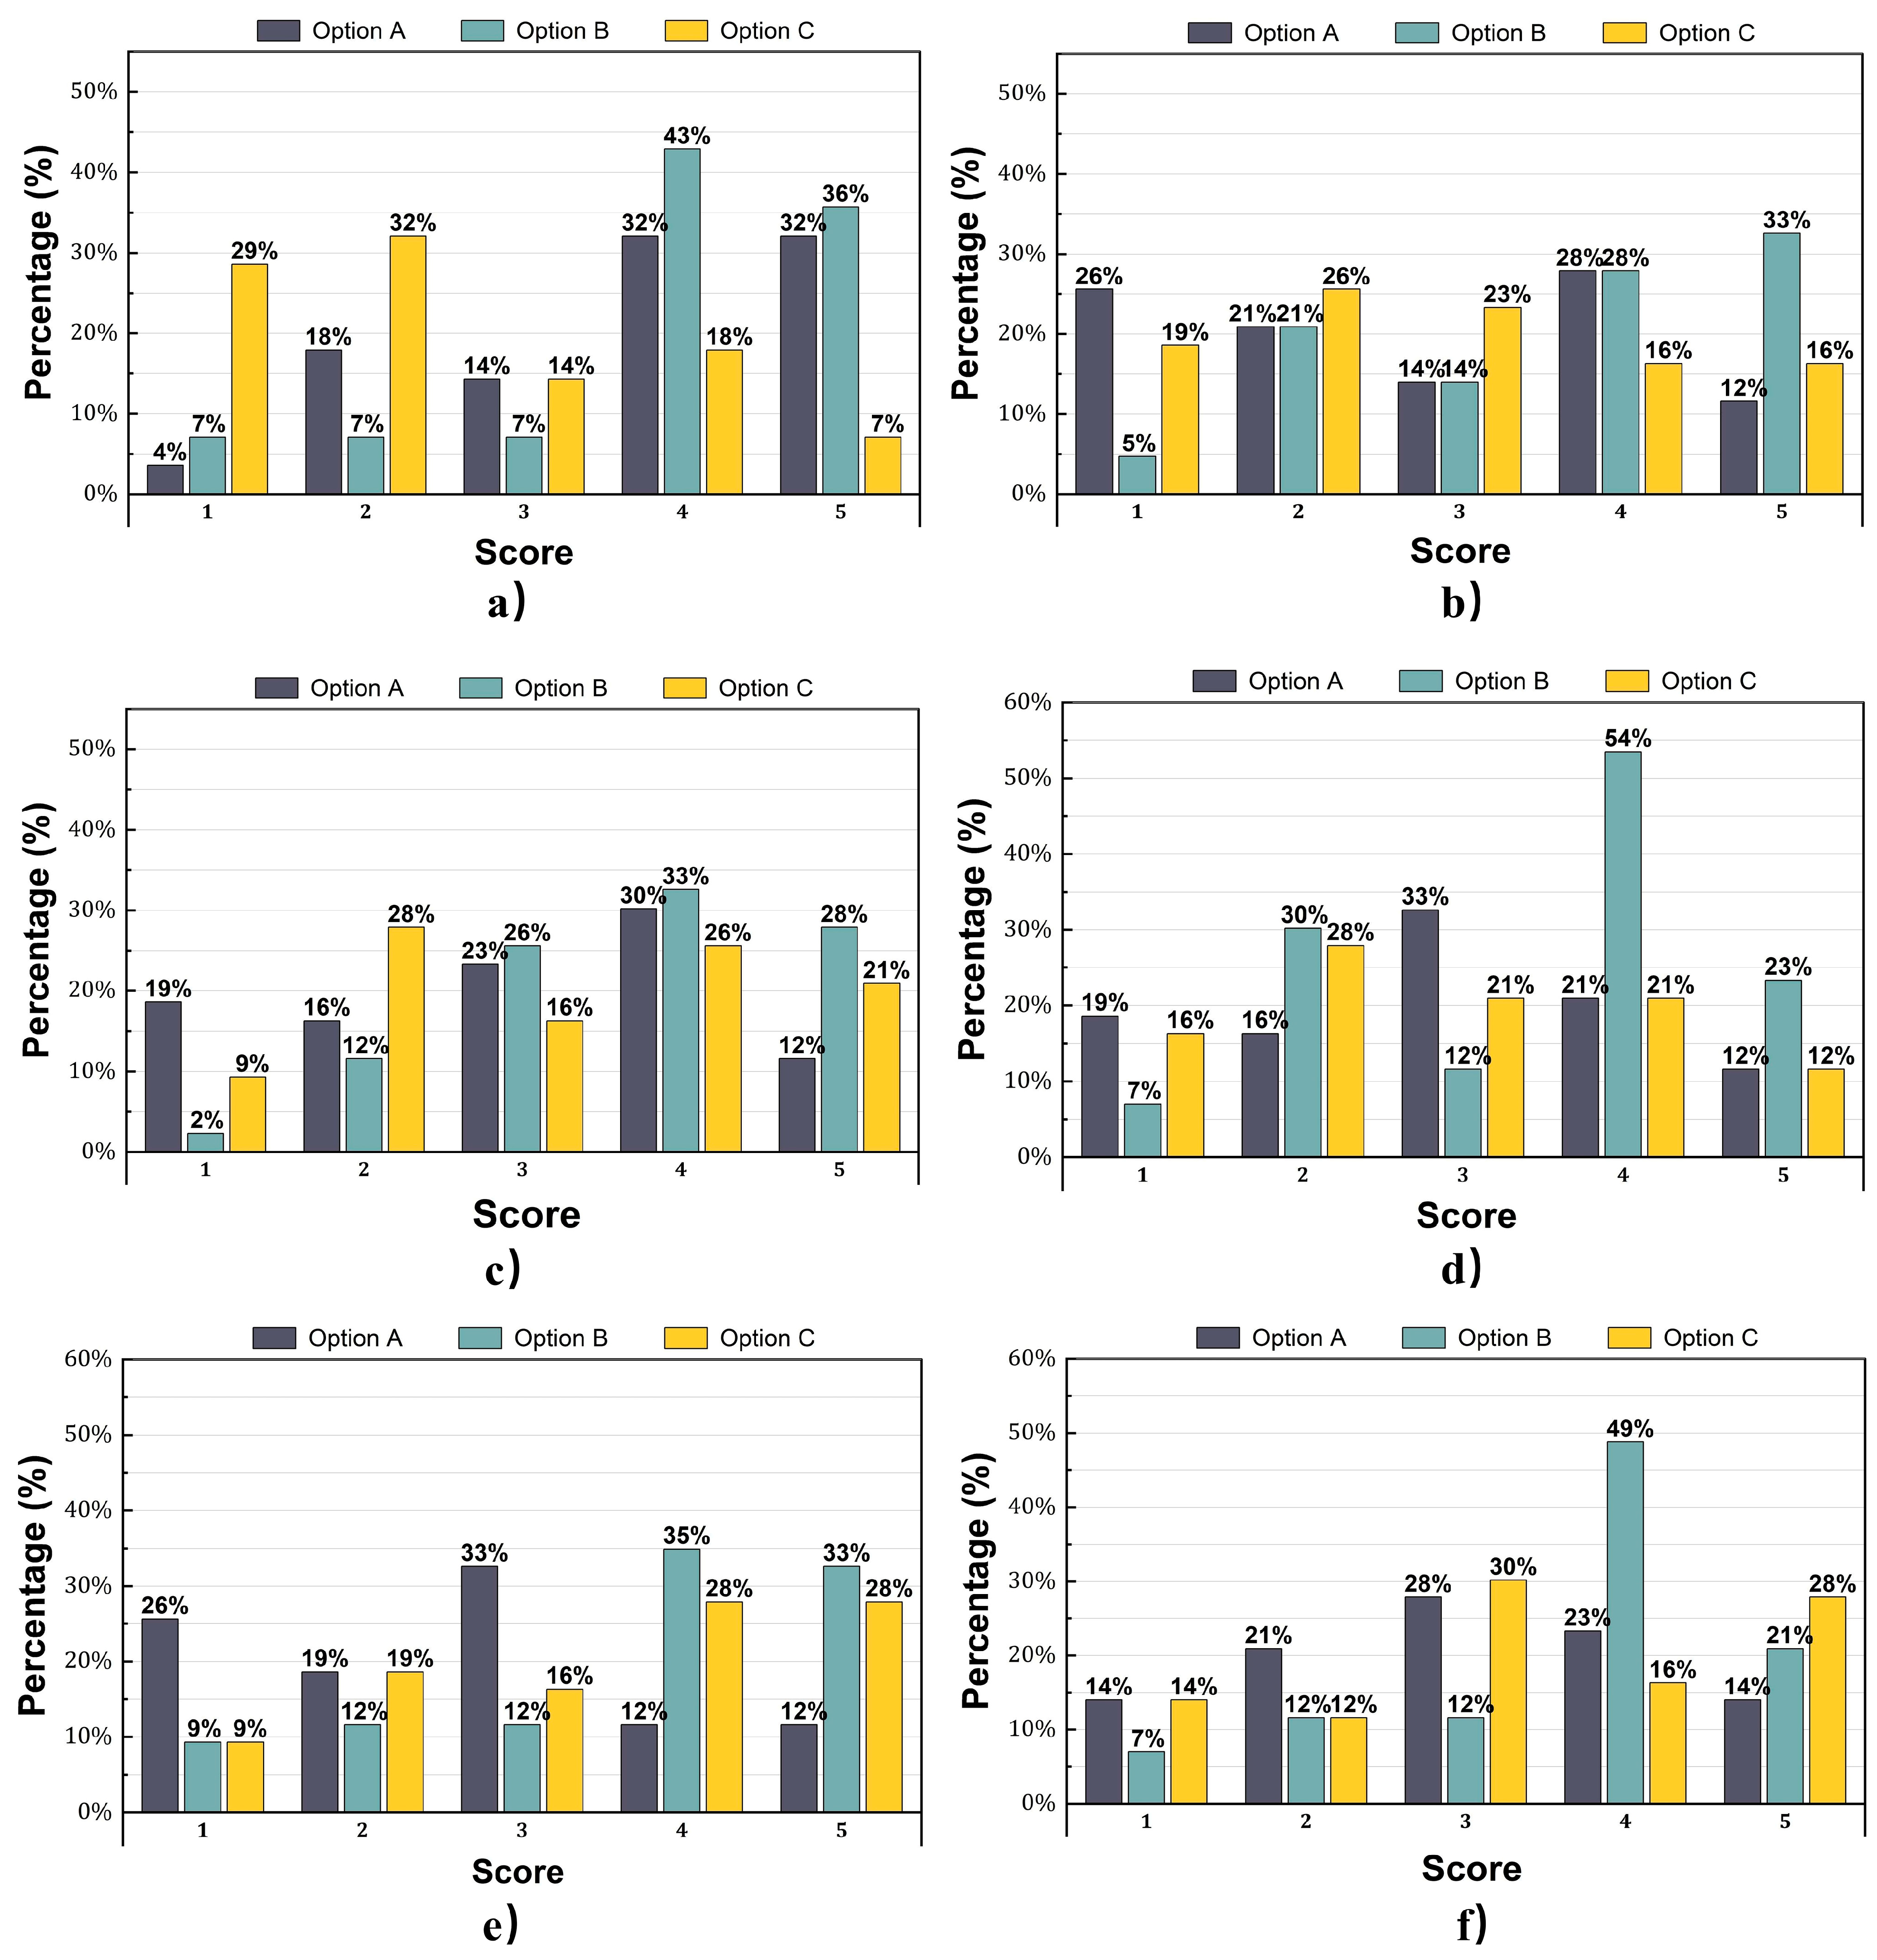
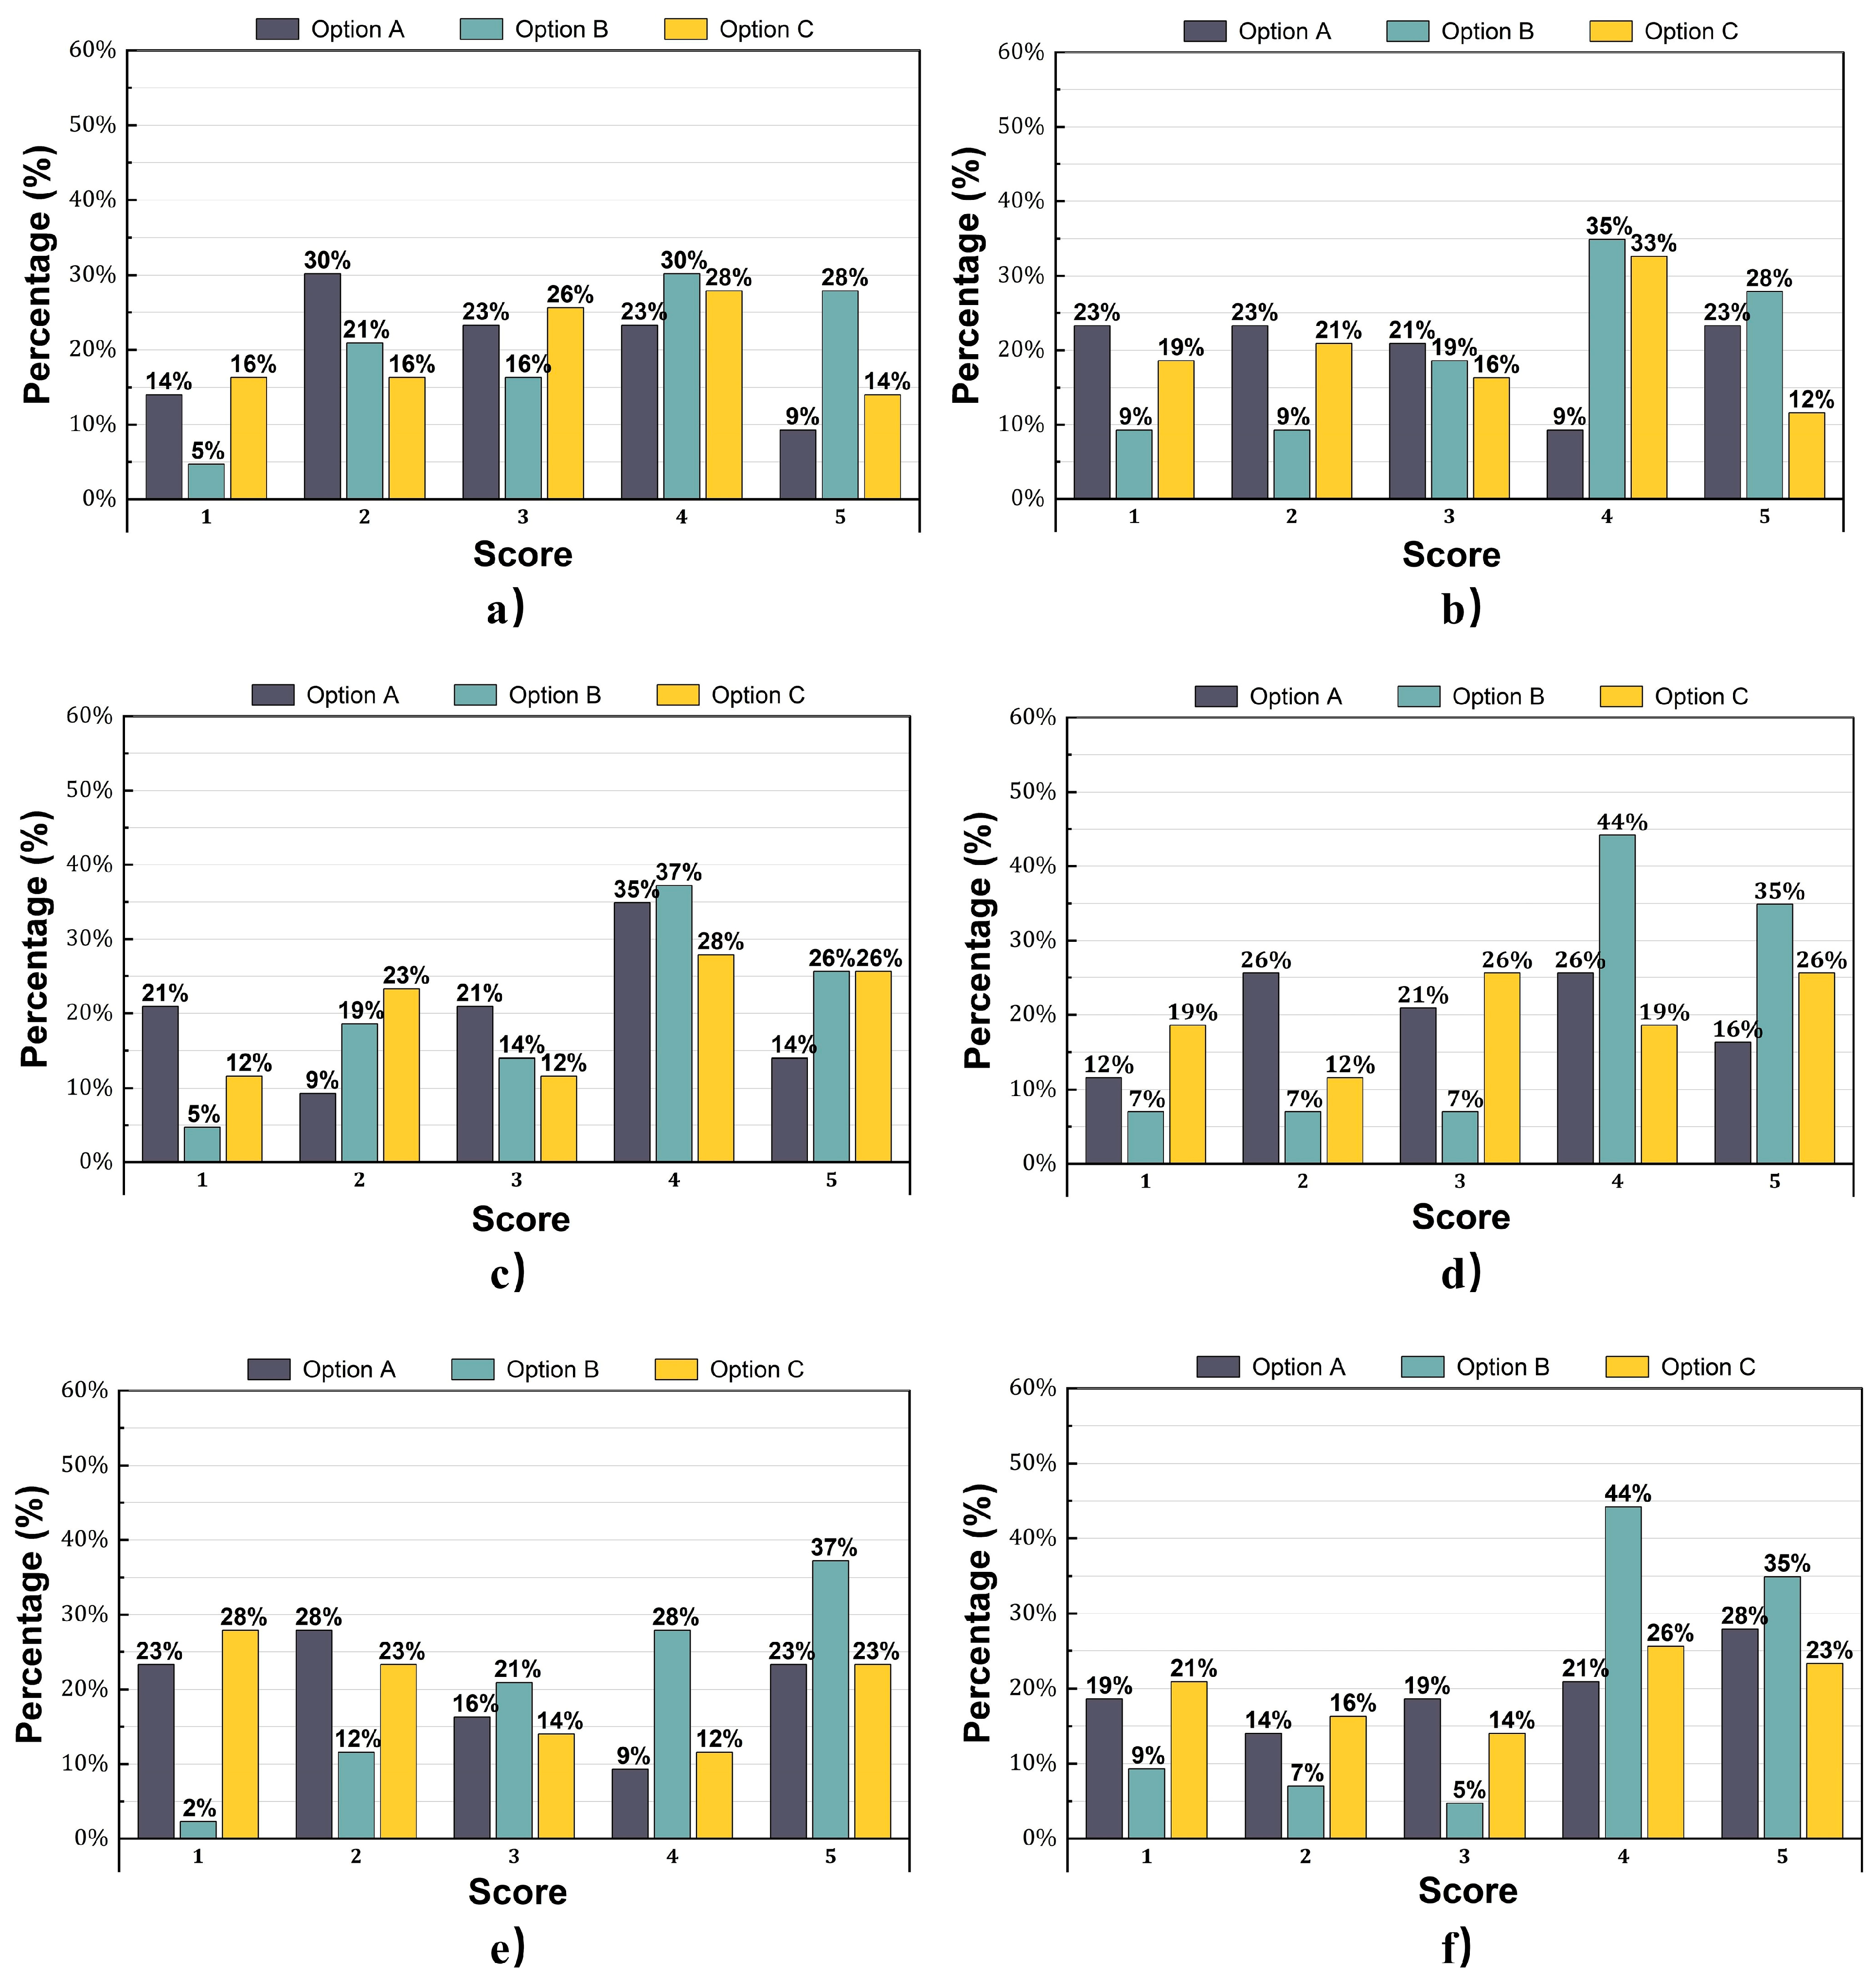
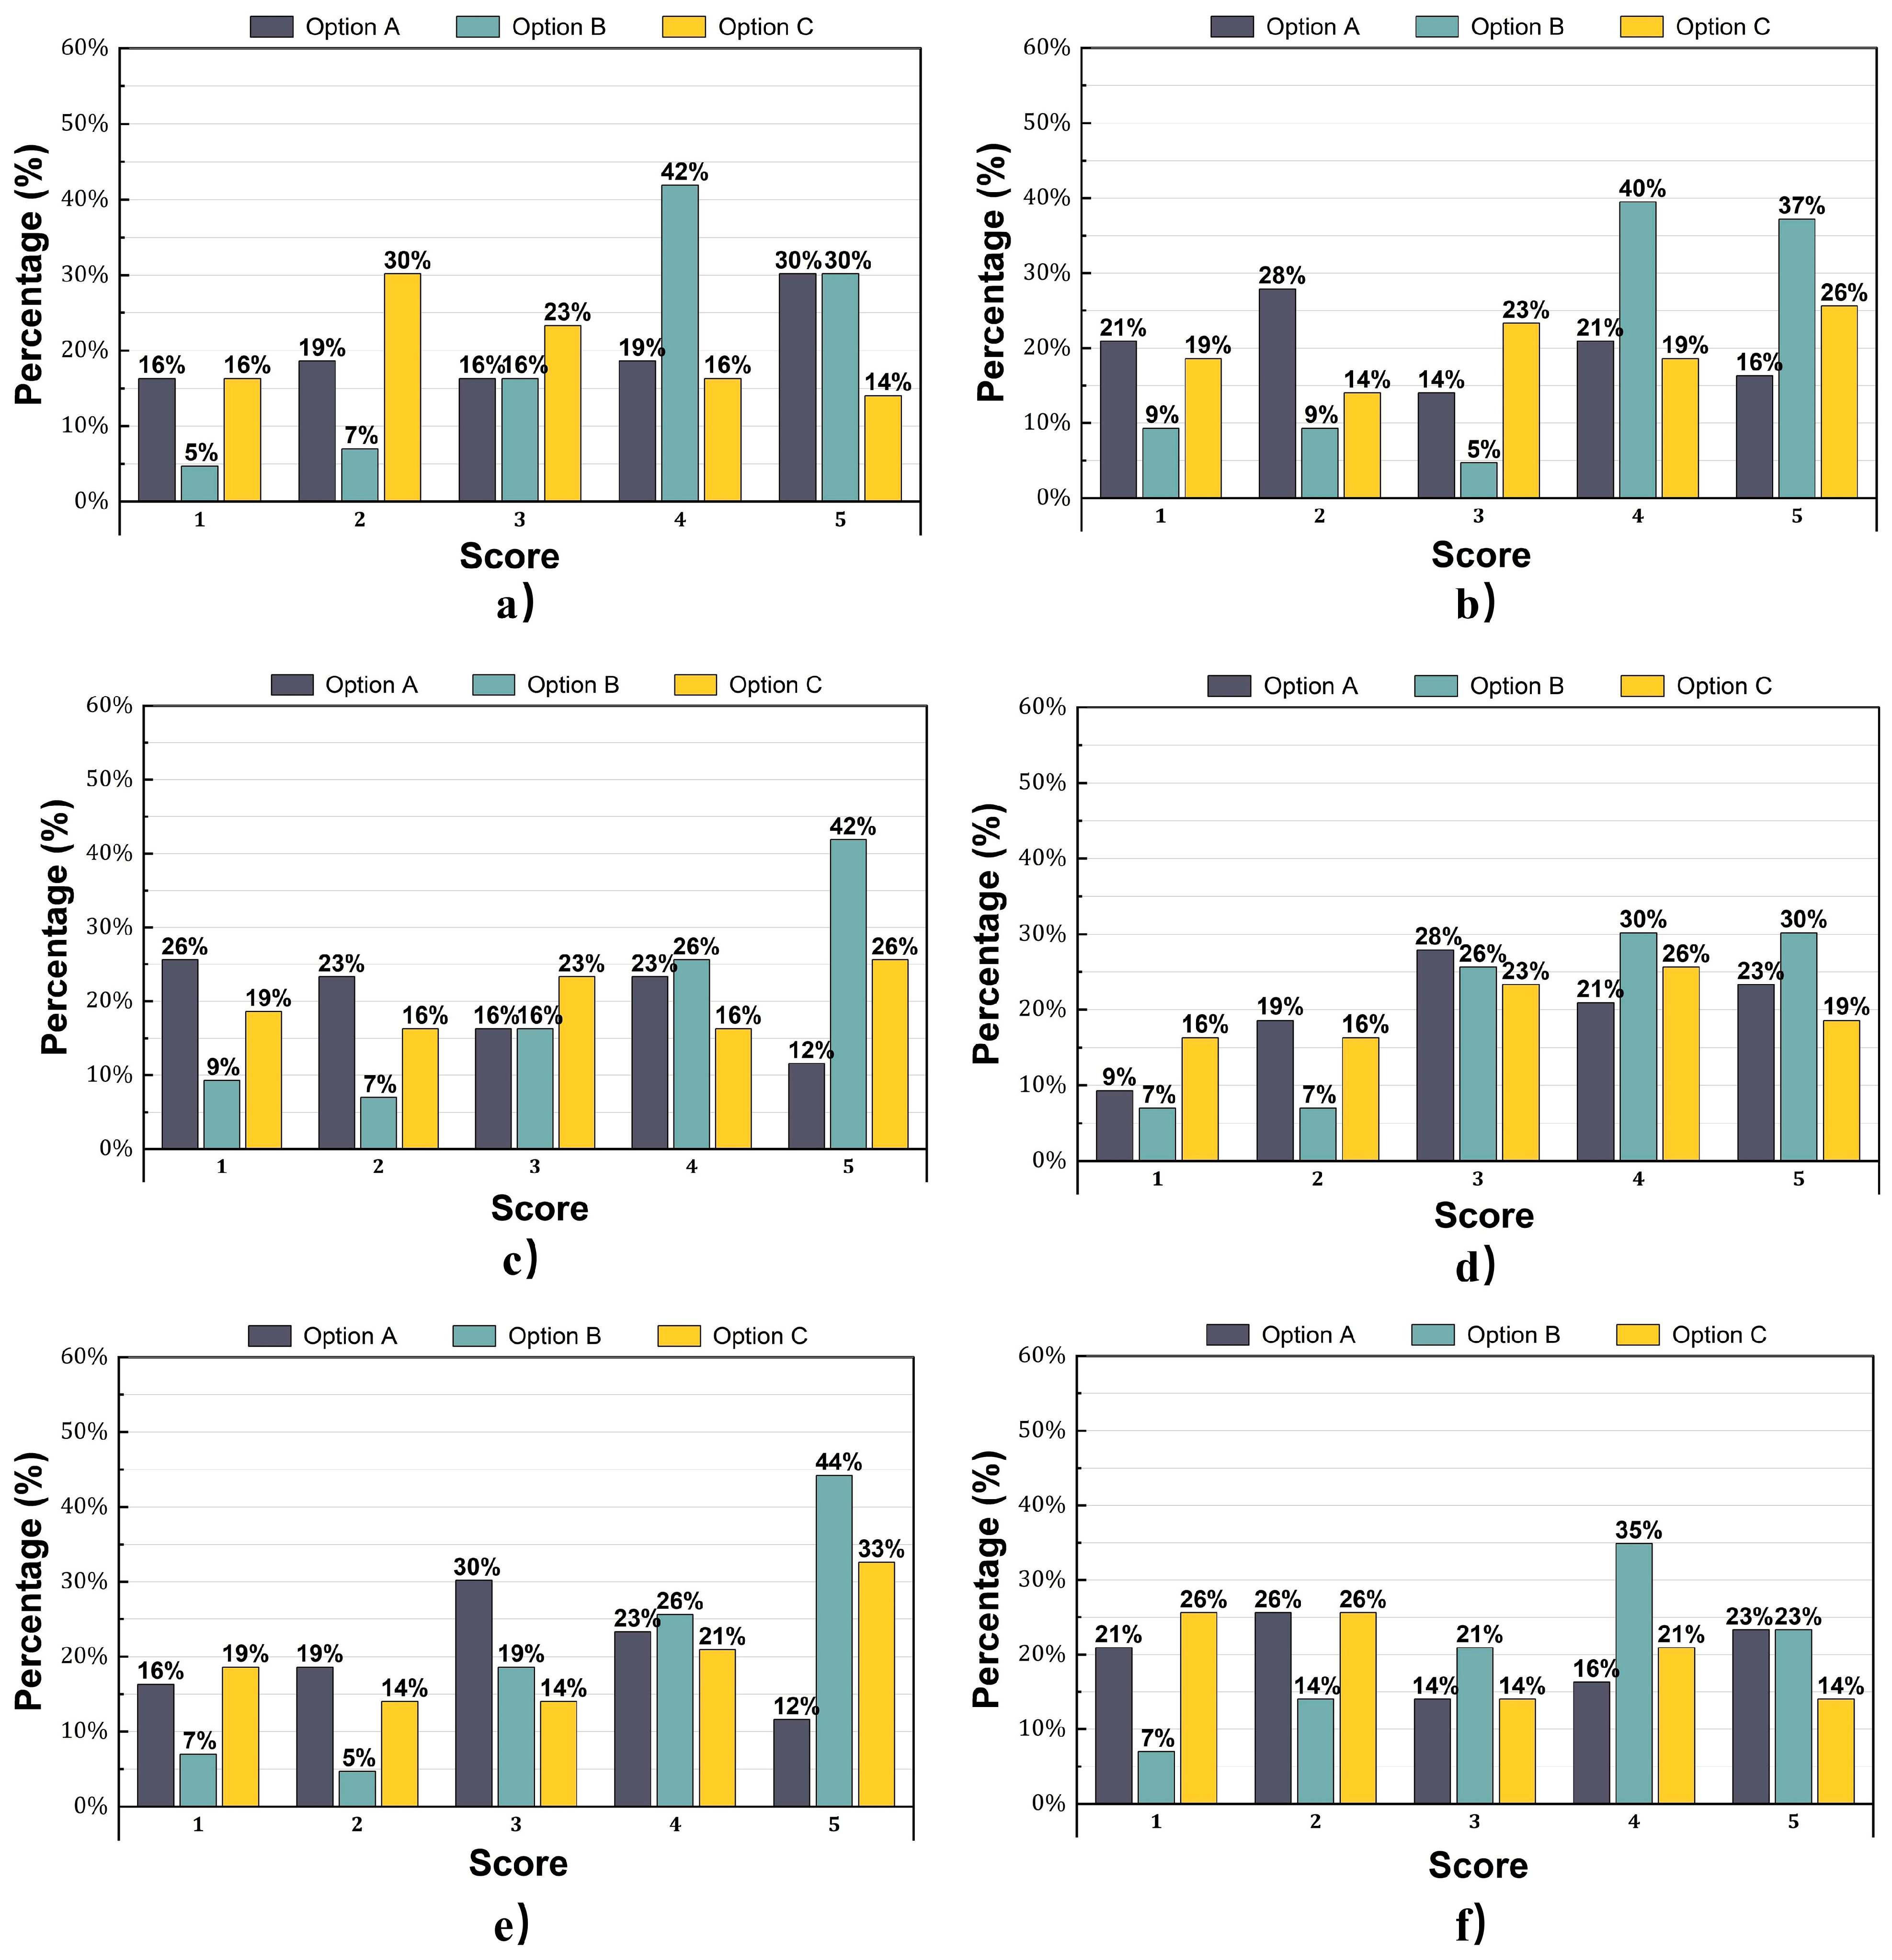
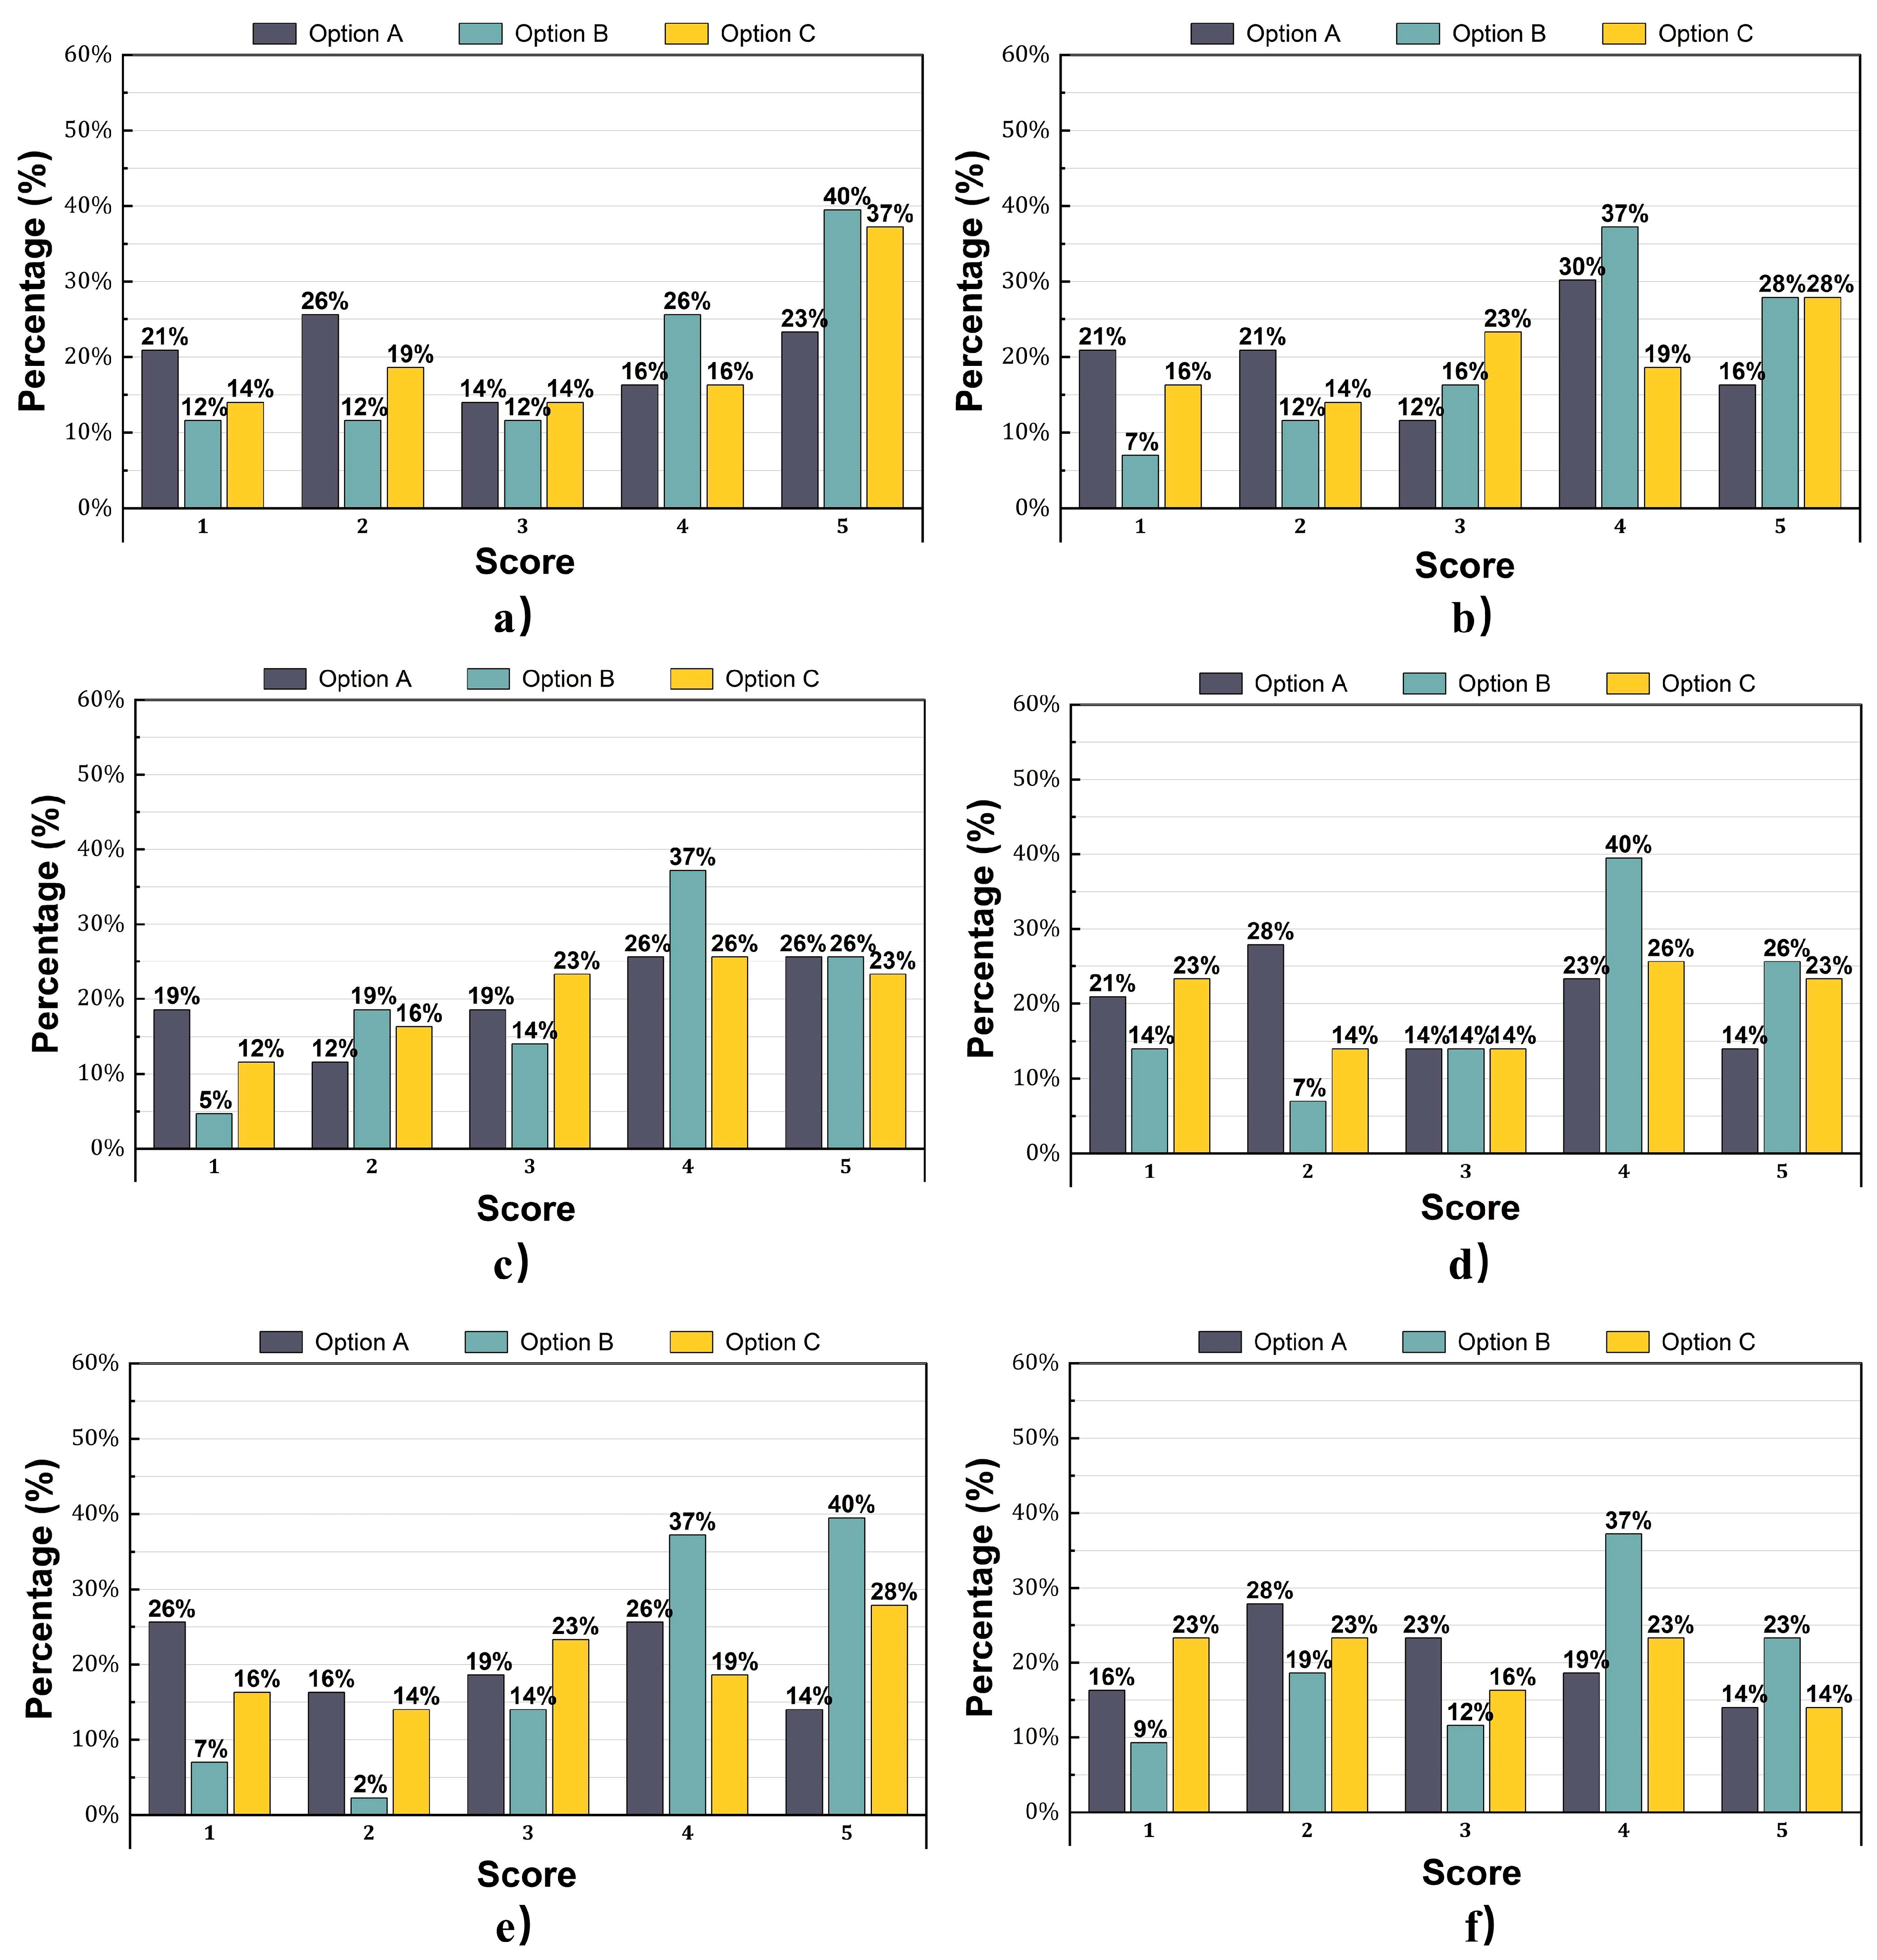
Figure 8, Figure 9, Figure 10 and Figure 11 illustrate the questionnaire score distributions for the three methods across six evaluation dimensions during the four life-cycle periods. The results clearly indicate that during the honeymoon period, Option B outperformed Options A and C across all six dimensions with statistical significance. In the child-rearing period, Option B maintained its advantage, although the level of significance decreased. During the educational period, the advantage of Option B further weakened, remaining statistically significant only in comparison with Option A. In the parental care period, differences among the methods were minimal, with only a few comparisons reaching significance. Across all periods, the greatest differences among methods were observed in the translation of user requirements and functional rationality, whereas overall generation quality showed relatively minor variation. For statistical consistency, scores of 3 or higher (“Moderately matched” or above) were defined as “successful matches,” representing functional and perceptual alignment between generated outputs and user requirements. This metric—denoted as matching ≥3—was used to calculate the proportion of successfully aligned images under each evaluation criterion. Table 3, Table 4, Table 5 and Table 6 summarize the matching rates of the three methods for each criterion across the four periods. A comprehensive analysis reveals that the proposed method consistently demonstrates superior and stable performance, particularly excelling in the three core dimensions of user requirement translation, spatial life-cycle responsiveness, and overall design quality, achieving a remarkable 88.37% in user requirement translation during the educational period. In contrast, Options A and C exhibited greater fluctuations and clear weaknesses; Option A performed reasonably well in style consistency for certain periods but responded slowly to changing requirements, while Option C showed unstable detail handling and lower overall design quality, dropping to 48.83% during the educational period.
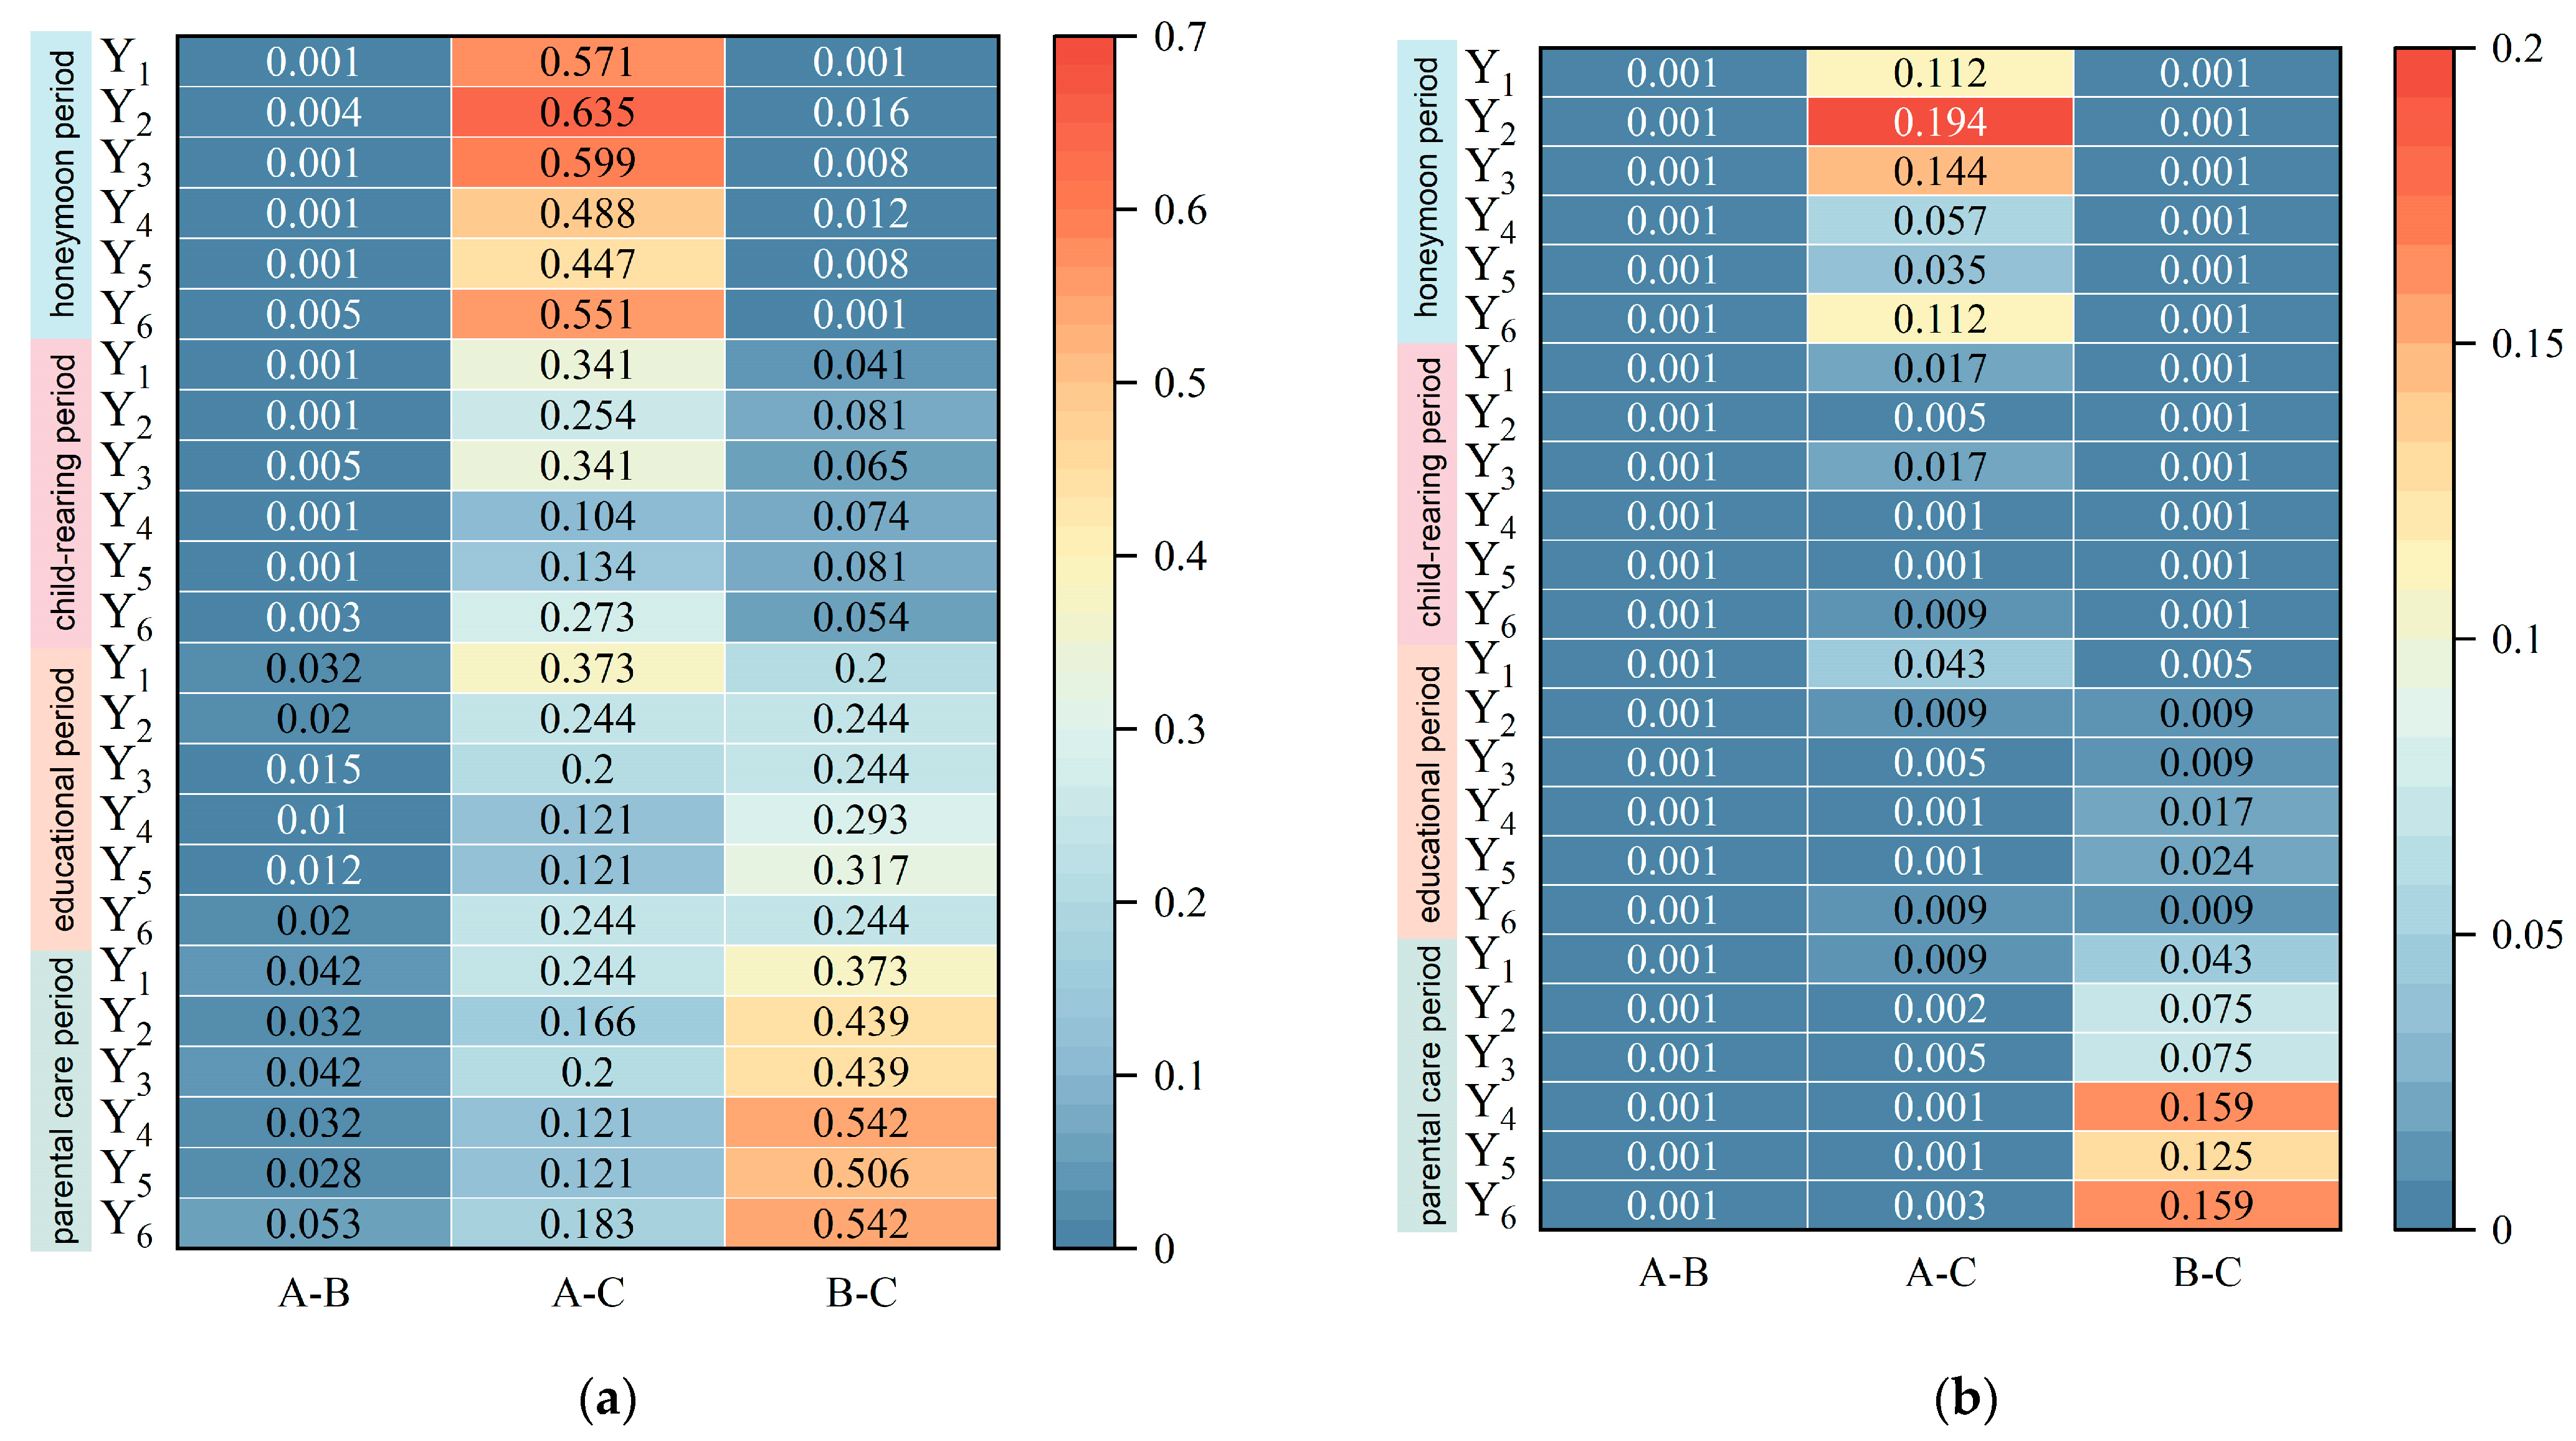
Furthermore, the proposed method was evaluated against the other two methods for specific scoring criteria. First, descriptive statistics are presented in Figure 12. A two-way ANOVA was conducted to examine the main effects of method and lifecycle stage on participant ratings (F(2, 348) = 19.52, p < 0.001, η2 = 0.101) [51]. To provide a more intuitive comparison between methods, paired comparisons were conducted. Specifically, IBM SPSS Statistics 25 was employed to perform a two-way ANOVA on the scores of the three methods across the four life-cycle periods and six evaluation dimensions [52], with Bonferroni correction [53] applied to reduce the risk of Type I errors, as shown in Figure 12. For instance, during the honeymoon period, Option B demonstrated comprehensive performance advantages, achieving statistically significant differences across all six evaluation dimensions in comparison with Options A and C (all Bonferroni-adjusted p < 0.0167, mean differences ranging from −0.58 to −0.72 vs. A, and 0.51 to 0.75 vs. C, η2 ranging from 0.086 to 0.112). In detail, the mean differences of Option B relative to Option A ranged from −0.58 to −0.72, and relative to Option C from 0.51 to 0.75, indicating clear superiority of Option B across all dimensions. Notably, Option B exhibited its most pronounced advantages in the three core dimensions: translation of user requirements, spatial life-cycle responsiveness, and overall design quality. In contrast, comparisons between Options A and C showed no statistically significant differences across any dimensions (0.447 < p < 0.635). To confirm robustness, a post-hoc power analysis (α = 0.05, effect size f = 0.30) indicated sufficient statistical power across all tests (1 − β = 0.83–0.91), supporting the reliability of the ANOVA and paired t-test results.
To further enhance robustness, paired t-tests were conducted using IBM SPSS Statistics 25. Option B consistently outperformed the other two methods across all six evaluation dimensions, with particularly strong advantages in the three key dimensions: user requirement translation (mean differences: Option B vs. A = −0.63, Option B vs. C = 0.75), spatial life-cycle responsiveness (Option B vs. A = −0.61, Option B vs. C = 0.51), and overall design quality (Option B vs. A = −0.58, Option B vs. C = 0.70). By contrast, Options A and C showed no significant differences in other dimensions (p values ranging from 0.035 to 0.194), with only completeness of details exhibiting marginal significance (p = 0.035).
In summary, this study systematically evaluated the performance of the three generation methods across six core dimensions. The results reveal that during the honeymoon period, Option B demonstrated a comprehensive advantage, significantly outperforming Option A (mean differences ranging from −0.58 to −0.72, all p < 0.001) and Option C (mean differences ranging from 0.51 to 0.75, all p < 0.001) across all evaluation metrics. Its superiority was most evident in the translation of user requirements, spatial life-cycle responsiveness, and overall design quality. As the household progressed through subsequent stages, the relative performance of Option B gradually declined: during the child-rearing period, it remained significantly superior but with narrower margins; in the educational period, its advantage further diminished, retaining significance only against Option A; and by the parental care period, Option B exhibited statistical significance in only a few dimensions, with differences from Option C largely non-significant. This dynamic trend suggests that Option B performs markedly better in the initial stages of the family lifecycle, but its comparative advantage converges as spatial, functional, and behavioral complexities increase over time.
To strengthen statistical transparency and facilitate reproducibility, additional descriptive statistics have been included in the Appendix A. Specifically, Appendix A (Table A3, Table A4, Table A5 and Table A6) now reports mean ± standard deviation (SD) and corresponding 95% confidence intervals (CI) for all evaluation dimensions across the four lifecycle stages and three generative methods. These tables complement the inferential results presented in Figure 8, Figure 9, Figure 10, Figure 11 and Figure 12 by providing a complete distributional overview of participant ratings.

4. Discussion

4.1. Performance Analysis and Lifecycle Implications

The statistical and visual analyses collectively indicate that the proposed model, Nev, consistently outperforms both Stable Diffusion and MidJourney across six evaluation dimensions. Its superiority is particularly evident in the honeymoon stage, where the translation of user requirements (85.71%), overall design quality (81.40%), and spatial lifecycle responsiveness (74.41%) reach the highest levels among all models. These metrics reflect the model’s core advantage—its capacity to embed functional logic and temporal adaptability within generative processes. Visual inspection supports these findings: children’s rooms generated by Nev display age-appropriate furniture and flexible layouts, while bedrooms in the parental care stage incorporate accessibility and barrier-free elements. In contrast, Stable Diffusion and MidJourney tend to rely on stylistic patterns detached from contextual functionality.
Although Nev’s advantage slightly diminishes in later stages, it still maintains higher performance in functional rationality and spatial coherence, emphasizing the necessity of embedding life-cycle responsiveness in design generation. This trend reveals that model performance correlates strongly with the increasing complexity of household structures. Moreover, spatial constraints—especially in smaller or medium-sized apartments—interact with evolving family requirements to shape design outcomes. Beyond these technical metrics, the results suggest that integrating lifecycle parameters and user-centered logic can support more flexible and adaptable residential design practices, informing decisions related to modular layouts, prefabrication techniques, and efficient space utilization. Additionally, the model’s outputs could guide environmentally conscious strategies by aligning spatial organization with passive design principles and resource optimization. By integrating lifecycle parameters and user-centered logic, Nev demonstrates the potential to generate interiors that both satisfy current needs and anticipate future transformations, thus bridging a key gap in static generative design paradigms.

4.2. Practical Implications, Limitations, and Future Directions

The proposed workflow demonstrates strong potential to reshape architectural and interior design practice by introducing a generative mechanism that synchronizes spatial formation with user behavior and lifecycle dynamics. As an early-stage conceptual design tool, it enables architects to generate and compare multiple spatial configurations efficiently, reducing reliance on manual iteration and intuition-driven decisions. By translating functional, emotional, and behavioral needs into structured textual prompts, the framework bridges subjective living experiences with computational logic, enhancing both design efficiency and human-centered relevance. This integration allows generative outputs to reflect the evolving social and familial transitions that characterize residential life. Beyond conceptual design, the approach points toward practical applications in adaptive housing and intelligent home systems, where sensor-based feedback and behavioral data could inform iterative spatial adjustments, ensuring responsiveness throughout the household lifecycle.
Despite these advantages, several limitations require acknowledgment to contextualize the scope of this work. The reduced performance observed in the parental care period indicates challenges in capturing the spatial tension and emotional complexity of multigenerational cohabitation. The workflow has not yet been validated across irregular, culturally specific, or non-standard housing typologies, which may limit generalizability beyond the evaluated apartment prototype. Moreover, although the dataset incorporates diverse interior styles, it may underrepresent hybrid household structures or transitional stages, such as post-education independence or communal eldercare. An additional methodological limitation concerns the parameter sensitivity of baseline models: Stable Diffusion and Midjourney can exhibit significantly different outcomes under alternative sampler, scheduler, or fine-tuning configurations. This study relies on widely used, standardized parameter settings to ensure reproducibility and isolate the contribution of lifecycle responsiveness; however, these settings do not represent globally optimized baselines. The implications of this constraint merit further examination in future work.
Advancing beyond these limitations will require expanding the dataset to include broader typological and cultural diversity, refining lifecycle segmentation to capture intermediate behavioral transitions, and integrating multi-objective optimization techniques capable of balancing aesthetic performance, spatial functionality, and adaptive behavior. Future studies may also incorporate usability experiments, user feedback loops, or sensor-derived environmental data to develop self-adaptive residential models that respond to real-time user behavior. By embedding behavioral–spatial intelligence within generative processes, this line of research contributes toward a more dynamic and human-centered conception of residential design and supports the emergence of adaptive, data-informed, and emotionally attuned domestic environments.

4.3. Literature Comparison and Research Positioning

A comparative analysis of fifteen key surveys and review studies (Table 7) was conducted to situate this research within the evolving landscape of AIGC applications in architecture and design. The studies, published between 2020 and 2025, were evaluated across four core dimensions—Lifecycle/User Adaptability, Spatial and Functional Coherence, Generative AI Model, and Evaluation Metric Classification—with contributions classified as L (low), M (medium), H (high), or NA (not applicable).
The results reveal a distinct research imbalance. While earlier works (e.g., Harshvardhan 2020; Miao 2020; Zhu 2023) laid foundational perspectives on generative algorithms and architectural computation, they lack focus on residential adaptability or behavioral dynamics. Mid-stage contributions (e.g., Gan 2024; Wang 2023) improve geometric optimization through GANs and graph-based generation but remain limited to spatial configuration without user adaptability. More recent diffusion-based approaches (e.g., Shim 2024; Chen 2023; Hu 2025) show higher visual fidelity and coherence yet continue to overlook temporal adaptability and family lifecycle transitions.
In terms of evaluation, most literature relies on visual or perceptual quality metrics—such as FID, IS, or LPIPS—rarely incorporating user-centered or behavioral validation. This exposes a persistent gap between aesthetic generativity and functional intelligence, particularly in domestic contexts that demand adaptability over time.
To address these limitations, this study adds a comparative discussion emphasizing differences in model accessibility, controllability, and domain-specific adaptation, thereby clarifying why diffusion-based frameworks were selected for our investigation. While models such as Grok, GPT, and Gemini are acknowledged, they remain proprietary, cloud-based, or limited in controllable image generation, making reproducible comparison with lifecycle-driven and structured prompt workflows challenging. Accordingly, our experimental scope focuses on controllable and open diffusion pipelines (Stable Diffusion, Midjourney, and the fine-tuned Nev model) to ensure methodological rigor and reproducibility.
Methodologically, this research prioritizes functional and behavioral alignment over purely aesthetic image generation. This focus, underpinned by lifecycle-aware datasets and a composite loss function, constitutes a novel contribution distinct from general-purpose multimodal models. The comparative evaluation among fully controllable diffusion-based frameworks ensures fairness, transparency, and repeatability—factors crucial for addressing the research question of adaptive residential design across family lifecycle transitions.
In contrast, the present study (“Nev”) advances the discussion along three interlinked dimensions:
  • It introduces Nov-13, a lifecycle-responsive interior dataset linking user behavior, spatial function, and aesthetic attributes;
  • It refines diffusion-based generation via a composite loss function that balances functional, emotional, and behavioral fidelity;
  • It implements a dual evaluation scheme, combining qualitative expert assessment with quantitative statistical analysis. Together, these innovations yield a mean adaptability score of 79.07% across lifecycle stages—empirically verifying the model’s capacity for adaptive residential generation.
By embedding user-behavioral reasoning into AI-driven design, this research moves beyond stylistic creativity toward a more context-aware, data-grounded, and temporally adaptive paradigm. It thereby positions itself as a pivotal contribution linking generative AI methodologies with the human-centered evolution of residential environments.

Human-Centered and Neurodesign Perspectives

While the proposed generative framework focuses on adaptive spatial configurations responsive to family lifecycle changes, it is equally important to recognize that the success of interior environments ultimately depends on users’ neurological and emotional responses. Recent advances in neurodesign and biophilic design emphasize that the human brain continuously interprets spatial cues—such as light, proportion, material, and geometry—through patterns of comfort, stress, and cognitive engagement. As Sussman and Hollander (2021) highlight in the Handbook of Neuroscience and the Built Environment, visual processing and spatial perception are deeply rooted in evolutionary mechanisms that favor coherence, natural complexity, and a sense of refuge and prospect [58,59]. Similarly, Taylor’s (2021) review on biophilic design demonstrates that fractal geometries and organic visual patterns can measurably reduce physiological stress, suggesting that human-centered spatial responses should complement data-driven optimization [60].
From this perspective, generative AI frameworks for adaptive housing must not only respond to quantitative behavioral data but also account for qualitative, affective dimensions of experience. Integrating affordance theory (Gibson, 1979; Valentine, 2023) into architectural generativity enables the model to encode how users perceive and act upon spatial features—how a doorway invites passage, or how a window frame mediates attention and emotion [61,62]. Furthermore, the design principles outlined by Alexander et al. (1977) [63] in A Pattern Language provide a timeless reference for spatial organization and interior circulation that foster psychological well-being. While the current study centers on modernist domestic typologies typical of East Asian housing, future research may incorporate sensor-based or VR-mediated evaluations to measure users’ neurophysiological responses in adaptive interiors. Such integration would deepen the human-centered validity of AI-generated housing design, ensuring that aesthetic novelty aligns with cognitive comfort and lived experience.

4.4. Limitations and Future Work

While this study establishes a lifecycle-responsive framework for adaptive residential design through generative diffusion models, several limitations should be acknowledged to contextualize its findings. The empirical foundation was deliberately confined to four representative family lifecycle stages within a 120 m2 prototype, reflecting a median-scale urban apartment typical of East Asian housing. This controlled scope ensures internal consistency yet constrains generalization across different dwelling typologies, climatic conditions, and cultural settings. Moreover, the behavioral and ergonomic assumptions underpinning the model are derived from aggregated user data rather than full-scale field observations, implying that the “Nev” model’s adaptability, although consistent across synthetic simulations, requires further validation in inhabited and ergonomically tested environments. Cultural and typological variability also remains insufficiently explored, as family structures, spatial hierarchies, and domestic norms differ substantially across regions; the current four-stage categorization—honeymoon, child-rearing, educational, and parental care—largely corresponds to an East Asian household trajectory and may not fully represent Western or multi-generational living patterns.
Future research will extend this work along three directions:
  • Quantitative spatial performance evaluation, integrating metrics such as space syntax connectivity, daylight accessibility, and circulation efficiency into the generative loss function.
  • Usability and perceptual studies, engaging real users through immersive or participatory design sessions to assess behavioral realism and emotional resonance.
  • Cross-cultural validation, expanding the dataset to include diverse dwelling typologies and socio-spatial norms, thereby enhancing external validity and global relevance.
By positioning these developments within a transparent acknowledgment of scope, the study invites further interdisciplinary verification across generative AI, environmental psychology, and housing design practice, and provides a foundation for more context-aware and human-adaptive residential design models.

5. Conclusions

This study proposed an integrated generative AI framework for adaptive residential layout design, addressing the evolving family structures and user requirements. By embedding life-cycle-based behavioral data into a fine-tuned diffusion model, the approach bridges the gap between human-centered spatial logic and computational generation, demonstrating the model’s effectiveness and its potential to assist architects during the early design stages. Importantly, the framework also shows potential to inform practical architectural considerations, such as flexible spatial planning, modular construction methods, and environmentally responsive housing design.
This study proposed an integrated generative AI framework for adaptive residential layout design, responding to evolving family structures and user requirements. By embedding lifecycle-based behavioral data into a fine-tuned diffusion model, the approach bridges the gap between human-centered spatial logic and computational generation, demonstrating promising potential to assist architects in early-stage residential design.
The main findings can be summarized as follows:
  • The newly developed Nov-13 dataset and the composite loss function improved the model’s ability to capture user behavior, spatial adaptability, and lifecycle responsiveness. The dataset contains over 22,000 annotated images linking core residential spaces with user demand categories, enabling behavior-aware generation with high internal consistency.
  • Comparative evaluation with Stable Diffusion and Midjourney showed that the proposed model achieves superior performance across quantitative and qualitative dimensions. Across four lifecycle stages and six evaluation criteria, the model achieved an average matching accuracy of 79.07%, indicating strong responsiveness and functional coherence.
  • Qualitative analysis further demonstrated that Nev reliably produces layouts aligned with user intent and daily behavioral logic, underscoring its applicability to human-centered and adaptive housing design.
Overall, the framework demonstrates a viable pathway for integrating generative AI, behavioral data, and architectural reasoning. While the results are encouraging, they remain bound by controlled experimental conditions and prototype scales, as discussed in Section 4.4. Future extensions involving spatial performance metrics, user-participatory validation, and cross-cultural datasets are essential to fully establish the framework’s generalizability and real-world applicability.

Author Contributions

Conceptualization, Y.Z. and Y.P.; data curation, Y.Z.; formal analysis, Y.Z.; funding acquisition, Y.Z.; investigation, Y.Z.; methodology, Y.Z.; project administration, Y.Z.; resources, Y.Z.; software, Y.Z.; supervision, Y.P.; validation, Y.Z. and Y.P.; visualization, Y.Z. and Y.P.; original draft writing, Y.Z. and Y.P.; review and editing, Y.Z. and Y.P. All authors have read and agreed to the published version of the manuscript.

Funding

This research received no external funding.

Data Availability Statement

The labeled dataset used to support the findings of this research is available from the authors upon request.

Conflicts of Interest

The authors declare no conflicts of interest.

Appendix A

Table A1. Feature Comparison of Generative Frameworks for Architectural Design.
FrameworkCore
Mechanism
Functional
Adaptability
Lifecycle
Sensitivity
ControllabilityLimitation
ControlNet [64]Structural condition controlLowNoneHighFocused on geometry, lacks functional reasoning
FloorDiffusion [22]Floor plan diffusion with semantic layoutMediumLowMediumLimited adaptability to family transitions
LayoutDM [65]Diffusion for spatial organizationMediumLowMediumStatic typologies only
This Study (Nev)Composite loss with lifecycle-driven fine-tuningHighHighHighNone
Table A2. SD generates the image parameter configuration.
Serial NumberParameterMeaningParameter Value Setting
OneStepsControlling the number of denoising iterations in the latent space directly affects image quality and generation time. In response to the characteristics of architectural design scenes with many details and a large amount of information, it is necessary to moderately increase the number of iteration steps to improve the expression of details30
TwoSamplerDetermine the denoising strategy during the image generation process. In architectural design applications, it is preferred to choose samplers with good convergence to ensure high-quality output.DPM ++ 2M
ThreeCFG ScaleThe matching degree and image quality between the balanced image and prompt words need to be adjusted to an appropriate range according to specific needs. Balance the matching degree and quality between images and prompt words7
FourWidth and heightSet the size of the latent space noise map. For architectural design projects, a size that is too small often cannot obtain sufficient visual information, and a size that is too small can cause computational power consumption and reduce generation efficiency768 × 512
FiveSeedThe number of random noise images extracted from the latent space before iteration will result in different generations, resulting in different seed numbers, even if other parameters remain the same, in different generation batches2386705101
SixRepeatThe number of times each image is learned20~50
SevenBatch sizeThe number of training samples processed simultaneously in a single iteration during model optimization.Recommendation 1 for graphics card memory of 12 GB or less; 16 GB video memory can be set to 2; Video memory above 24 GB can be set to 4
EightControlNet modelPreprocess input drafts and generate composition and details of content guided by models. The mainstream models in architectural scenes include Canny, Lineart, Depth, SEG, Scribble, etc.none
Figure A1. Partial screenshot of the SD-generated image operation interface.
Buildings 15 04155 g0a1
Table A3. Descriptive analysis and 95% confidence interval results of pairwise comparisons of three methods during the honeymoon period.
95% Confidence Interval
Evaluation Dimension(I) Method(J) MethodMean Difference (I–J)Standard
Error
Lower LimitUpper Limit
User Requirements TranslationOption AOption B−0.63 *0.21−1.05−0.21
Option AOption C0.120.21−0.300.54
Option BOption C0.75 *0.210.331.17
Periodic Spatial ResponseOption AOption B−0.61 *0.21−1.03−0.19
Option AOption C−0.100.21−0.520.32
Option BOption C0.51 *0.210.090.93
Style consistencyOption AOption B−0.67 *0.21−1.09−0.25
Option AOption C−0.110.21−0.530.31
Option BOption C0.56 *0.210.140.98
Functional RationalityOption AOption B−0.65 *0.20−1.05−0.25
Option AOption C−0.140.20−0.540.26
Option BOption C0.51 *0.200.110.91
Detail IntegrityOption AOption B−0.72 *0.21−1.14−0.30
Option AOption C−0.160.21−0.580.26
Option BOption C0.56 *0.210.140.98
Overall design qualityOption AOption B−0.58 *0.20−0.98−0.18
Option AOption C0.120.20−0.280.52
Option BOption C0.70 *0.200.301.10
* Applying Bonferroni correction to reduce the risk of Type I errors. Since each metric was compared three times, the significance level is 0.05/3 = 0.0167. The bold option was used in this study.
Table A4. Descriptive analysis and 95% confidence interval results of pairwise comparisons of three methods during the child-rearing period.
95% Confidence Interval
Evaluation Dimension(I) Method(J) MethodMean Difference (I–J)Standard
Error
Lower LimitUpper Limit
User Requirements TranslationOption AOption B−0.60 *0.20−1.00−0.20
Option AOption C−0.190.20−0.590.21
Option BOption C0.41 *0.200.010.81
Periodic Spatial ResponseOption AOption B−0.58 *0.20−0.98−0.18
Option AOption C−0.230.20−0.630.17
Option BOption C0.35 *0.20−0.050.75
Style consistencyOption AOption B−0.56 *0.20−0.96−0.16
Option AOption C−0.190.20−0.590.21
Option BOption C0.37 *0.20−0.030.77
Functional RationalityOption AOption B−0.65 *0.19−1.03−0.27
Option AOption C−0.310.19−0.690.07
Option BOption C0.34 *0.19−0.040.72
Detail IntegrityOption AOption B−0.65 *0.20−1.05−0.25
Option AOption C−0.300.20−0.700.10
Option BOption C0.35 *0.20−0.050.75
Overall design qualityOption AOption B−0.58 *0.19−0.96−0.20
Option AOption C−0.210.19−0.590.17
Option BOption C0.37 *0.19−0.010.75
* Applying Bonferroni correction to reduce the risk of Type I errors. Since each metric was compared three times, the significance level is 0.05/3 = 0.0167. The bold option was used in this study.
Table A5. Descriptive analysis and 95% confidence interval results of pairwise comparisons of three methods during the educational period.
95% Confidence Interval
Evaluation Dimension(I) Method(J) MethodMean Difference (I–J)Standard
Error
Lower LimitUpper Limit
User Requirements TranslationOption AOption B−0.39 *0.18−0.75−0.03
Option AOption C−0.160.18−0.520.20
Option BOption C0.230.18−0.130.59
Periodic Spatial ResponseOption AOption B−0.42 *0.18−0.78−0.06
Option AOption C−0.210.18−0.570.15
Option BOption C0.210.18−0.150.57
Style consistencyOption AOption B−0.44 *0.18−0.80−0.08
Option AOption C−0.230.18−0.590.13
Option BOption C0.210.18−0.150.57
Functional RationalityOption AOption B−0.47 *0.18−0.83−0.11
Option AOption C−0.280.18−0.640.08
Option BOption C0.190.18−0.170.55
Detail IntegrityOption AOption B−0.46 *0.18−0.82−0.10
Option AOption C−0.280.18−0.640.08
Option BOption C0.180.18−0.180.54
Overall design qualityOption AOption B−0.42 *0.18−0.78−0.06
Option AOption C−0.210.18−0.570.15
Option BOption C0.210.18−0.150.57
* Applying Bonferroni correction to reduce the risk of Type I errors. Since each metric was compared three times, the significance level is 0.05/3 = 0.0167. The bold option was used in this study.
Table A6. Descriptive analysis and 95% confidence interval results of pairwise comparisons of three methods during the parental care period.
95% Confidence Interval
Evaluation Dimension(I) Method(J) MethodMean Difference (I–J)Standard
Error
Lower LimitUpper Limit
User Requirements TranslationOption AOption B−0.37 *0.18−0.73−0.01
Option AOption C−0.210.18−0.570.15
Option BOption C0.160.18−0.200.52
Periodic Spatial ResponseOption AOption B−0.39 *0.18−0.75−0.03
Option AOption C−0.250.18−0.610.11
Option BOption C0.140.18−0.220.50
Style consistencyOption AOption B−0.37 *0.18−0.73−0.01
Option AOption C−0.230.18−0.590.13
Option BOption C0.140.18−0.220.50
Functional RationalityOption AOption B−0.39 *0.18−0.75−0.03
Option AOption C−0.280.18−0.640.08
Option BOption C0.110.18−0.250.47
Detail IntegrityOption AOption B−0.40 *0.18−0.76−0.04
Option AOption C−0.280.18−0.640.08
Option BOption C0.120.18−0.240.48
Overall design qualityOption AOption B−0.35 *0.18−0.710.01
Option AOption C−0.240.18−0.600.12
Option BOption C0.110.18−0.250.47
* Applying Bonferroni correction to reduce the risk of Type I errors. Since each metric was compared three times, the significance level is 0.05/3 = 0.0167. The bold option was used in this study.

References

  1. Menninghaus, W.; Wagner, V.; Wassiliwizky, E.; Schindler, I.; Hanich, J.; Jacobsen, T.; Koelsch, S. What are aesthetic emotions? Psychol. Rev. 2019, 126, 171–195. [Google Scholar] [CrossRef]
  2. Bao, Z.; Laovisutthichai, V.; Tan, T.; Wang, Q.; Lu, W. Design for manufacture and assembly (DfMA) enablers for offsite interior design and construction. Build. Res. Inf. 2022, 50, 325–338. [Google Scholar] [CrossRef]
  3. Sinha, M.; Fukey, L.N. Sustainable Interior Designing in the 21st Century—A Review. ECS Trans. 2022, 107, 6801–6823. [Google Scholar] [CrossRef]
  4. Cao, H.; Tan, C.; Gao, Z.; Xu, Y.; Chen, G.; Heng, P.-A.; Li, S.Z. A survey on generative diffusion models. IEEE Trans. Knowl. Data Eng. 2024, 36, 2814–2830. [Google Scholar] [CrossRef]
  5. Qiu, Z.; Liu, J.; Xia, Y.; Qi, H.; Liu, P. Text Semantics to Controllable Design: A Residential Layout Generation Method Based on Stable Diffusion Model. Dev. Built Environ. 2025, 23, 100691. [Google Scholar] [CrossRef]
  6. Ramesh, A.; Dhariwal, P.; Nichol, A.; Chu, C.; Chen, M. Hierarchical text-conditional image generation with clip latents. arXiv 2022, arXiv:2204.06125. [Google Scholar] [CrossRef]
  7. Rombach, R.; Blattmann, A.; Lorenz, D.; Esser, P.; Ommer, B. High-resolution image synthesis with latent diffusion models. In Proceedings of the IEEE/CVF Conference on Computer Vision and Pattern Recognition, New Orleans, LA, USA, 18–24 June 2022; pp. 10684–10695. [Google Scholar] [CrossRef]
  8. Borji, A. Generated faces in the wild: Quantitative comparison of stable diffusion, midjourney and dall-e 2. arXiv 2022, arXiv:2210.00586. [Google Scholar] [CrossRef]
  9. Pérez, R.I.P. Blurring the Boundaries Between Real and Artificial in Architecture and Urban Design Through the Use of Artificial Intelligence. Ph.D. Thesis, Universidade da Coruña, A Coruña, Spain, 2017. [Google Scholar]
  10. Dutta, K.; Sarthak, S. Architectural space planning using evolutionary computing approaches: A review. Artif. Intell. Rev. 2011, 36, 311–321. [Google Scholar] [CrossRef]
  11. Baltus, V.; Žebrauskas, T. Parametric design concept in architectural studies. Archit. Urban Plan. 2019, 15, 96–100. [Google Scholar] [CrossRef]
  12. Mora, R.; Bédard, C.; Rivard, H. A geometric modelling framework for conceptual structural design from early digital architectural models. Adv. Eng. Inform. 2008, 22, 254–270. [Google Scholar] [CrossRef]
  13. Zhu, S.; Yu, T.; Xu, T.; Chen, H.; Dustdar, S.; Gigan, S.; Gunduz, D.; Hossain, E.; Jin, Y.; Lin, F.; et al. Intelligent computing: The latest advances, challenges, and future. Intell. Comput. 2023, 2, 0006. [Google Scholar] [CrossRef]
  14. Brown, A. Computing, AI and architecture: What destinations are we moving to? Int. J. Arch. Comput. 2025, 23, 333–338. [Google Scholar] [CrossRef]
  15. Jang, S.; Roh, H.; Lee, G. Generative AI in architectural design: Application, data, and evaluation methods. Autom. Constr. 2025, 174, 106174. [Google Scholar] [CrossRef]
  16. Wen, W.; Hong, L.; Xueqiang, M. Application of fractals in architectural shape design. In Proceedings of the 2010 IEEE 2nd Symposium on Web Society, Beijing, China, 16–17 August 2010; pp. 185–190. [Google Scholar] [CrossRef]
  17. Sharafi, P.; Teh, L.H.; Hadi, M.N. Conceptual design optimization of rectilinear building frames: A knapsack problem approach. Eng. Optim. 2015, 47, 1303–1323. [Google Scholar] [CrossRef]
  18. Yi, H.; Kim, I. Differential evolutionary cuckoo-search-integrated tabu-adaptive pattern search (DECS-TAPS): A novel multihybrid variant of swarm intelligence and evolutionary algorithm in architectural design optimization and automation. J. Comput. Des. Eng. 2022, 9, 2103–2133. [Google Scholar] [CrossRef]
  19. Gan, W.; Zhao, Z.; Wang, Y.; Zou, Y.; Zhou, S.; Wu, Z. UDGAN: A new urban design inspiration approach driven by using generative adversarial networks. J. Comput. Des. Eng. 2024, 11, 305–324. [Google Scholar] [CrossRef]
  20. Chang, S.; Dong, W.; Jun, H. Use of electroencephalogram and long short-term memory networks to recognize design preferences of users toward architectural design alternatives. J. Comput. Des. Eng. 2020, 7, 551–562. [Google Scholar] [CrossRef]
  21. Hu, X.; Zheng, H.; Lai, D. Prediction and optimization of daylight performance of AI-generated residential floor plans. Build. Environ. 2025, 279, 113054. [Google Scholar] [CrossRef]
  22. Shim, J.; Moon, J.; Kim, H.; Hwang, E. FloorDiffusion: Diffusion model-based conditional floorplan image generation method using parameter-efficient fine-tuning and image inpainting. J. Build. Eng. 2024, 95, 110320. [Google Scholar] [CrossRef]
  23. Yu, S.; Li, J.; Zheng, H.; Ding, H. Research on Predicting Building Façade Deterioration in Winter Cities Using Diffusion Model. J. Build. Eng. 2025, 111, 113365. [Google Scholar] [CrossRef]
  24. Wang, L.; Liu, J.; Zeng, Y.; Cheng, G.; Hu, H.; Hu, J.; Huang, X. Automated building layout generation using deep learning and graph algorithms. Autom. Constr. 2023, 154, 105036. [Google Scholar] [CrossRef]
  25. Li, H.; Gu, J.; Koner, R.; Sharifzadeh, S.; Tresp, V. Do dall-e and flamingo understand each other? In Proceedings of the IEEE/CVF International Conference on Computer Vision, Paris, France, 1–6 October 2023; pp. 1999–2010. [Google Scholar] [CrossRef]
  26. Park, B.H.; Hyun, K.H. Analysis of pairings of colors and materials of furnishings in interior design with a data-driven framework. J. Comput. Des. Eng. 2022, 9, 2419–2438. [Google Scholar] [CrossRef]
  27. Chen, J.; Shao, Z.; Hu, B. Generating interior design from text: A new diffusion model-based method for efficient creative design. Buildings 2023, 13, 1861. [Google Scholar] [CrossRef]
  28. Ahmed, J.; Nadeem, G.; Majeed, M.K.; Ghaffar, R.; Baig, A.K.K.; Shah, S.R.; Razzaq, R.A.; Irfan, T. The Rise of Multimodal AI: A Quick Review of GPT-4V and Gemini. Spectr. Eng. Sci. 2025, 3, 778–786. [Google Scholar] [CrossRef]
  29. Kendall, S.H. Residential Architecture as Infrastructure: Open Building in Practice; Routledge: London, UK, 2021. [Google Scholar] [CrossRef]
  30. Leupen, B.; Heijne, R.; van Zwol, J. Time-Based Architecture; 010 Publishers: Rotterdam, The Netherlands, 2005; Available online: https://books.google.co.jp/books?id=xCgIpz8FCwEC (accessed on 15 October 2025).
  31. Till, J.; Schneider, T. Flexible Housing; Routledge: London, UK, 2016. [Google Scholar] [CrossRef]
  32. Brand, S. How Buildings Learn: What Happens After They’re Built; Penguin Publishing Group: London, UK, 1995; Available online: https://books.google.co.jp/books?id=zkgRgdVN2GIC (accessed on 15 December 2024).
  33. Xie, X.; Ding, W. An interactive approach for generating spatial architecture layout based on graph theory. Front. Archit. Res. 2023, 12, 630–650. [Google Scholar] [CrossRef]
  34. Magdziak, M. Flexibility and adaptability of the living space to the changing needs of residents. IOP Conf. Ser. Mater. Sci. Eng. 2019, 471, 072011. [Google Scholar] [CrossRef]
  35. Gober, P. Urban housing demography. Prog. Hum. Geogr. 1992, 16, 171–189. [Google Scholar] [CrossRef] [PubMed]
  36. Estaji, H. A review of flexibility and adaptability in housing design. Int. J. Contemp. Archit. 2017, 4, 37–49. [Google Scholar] [CrossRef]
  37. Onatayo, D.; Onososen, A.; Oyediran, A.O.; Oyediran, H.; Arowoiya, V.; Onatayo, E. Generative AI applications in architecture, engineering, and construction: Trends, implications for practice, education & imperatives for upskilling—A review. Architecture 2024, 4, 877–902. [Google Scholar] [CrossRef]
  38. Xu, J.; Liu, X.; Wu, Y.; Tong, Y.; Li, Q.; Ding, M.; Tang, J.; Dong, Y. Imagereward: Learning and evaluating human preferences for text-to-image generation. Adv. Neural Inf. Process. Syst. 2023, 36, 15903–15935. [Google Scholar]
  39. Available online: https://www.znzmo.com (accessed on 15 December 2024).
  40. Available online: https://www.google.com (accessed on 15 December 2024).
  41. Available online: https://www.bing.com (accessed on 15 December 2024).
  42. Available online: https://creativecommons.org/licenses/by-nc/4.0/ (accessed on 3 November 2025).
  43. Cohen, J. A coefficient of agreement for nominal scales. Educ. Psychol. Meas. 1960, 20, 37–46. [Google Scholar] [CrossRef]
  44. Chen, J.; Shao, Z.; Zheng, X.; Zhang, K.; Yin, J. Integrating aesthetics and efficiency: AI-driven diffusion models for visually pleasing interior design generation. Sci. Rep. 2024, 14, 3496. [Google Scholar] [CrossRef]
  45. Chen, J.; Wang, D.; Shao, Z.; Zhang, X.; Ruan, M.; Li, H.; Li, J. Using artificial intelligence to generate master-quality architectural designs from text descriptions. Buildings 2023, 13, 2285. [Google Scholar] [CrossRef]
  46. Chen, X.; Kang, S.B.; Xu, Y.-Q.; Dorsey, J.; Shum, H.-Y. Sketching reality: Realistic interpretation of architectural designs. ACM Trans. Graph. TOG 2008, 27, 11. [Google Scholar] [CrossRef]
  47. Wang, B.; Zhu, Y.; Chen, L.; Liu, J.; Sun, L.; Childs, P. A study of the evaluation metrics for generative images containing combinational creativity. AI EDAM 2023, 37, e11. [Google Scholar] [CrossRef]
  48. Arceo, A.; Touchie, M.; O’Brien, W.; Hong, T.; Malik, J.; Mayer, M.; Peters, T.; Saxe, S.; Tamas, R.; Villeneuve, H.; et al. Ten questions concerning housing sufficiency. Build. Environ. 2025, 277, 112941. [Google Scholar] [CrossRef]
  49. Faul, F.; Erdfelder, E.; Buchner, A.; Lang, A.-G. Statistical power analyses using G* Power 3.1: Tests for correlation and regression analyses. Behav. Res. Methods 2009, 41, 1149–1160. [Google Scholar] [CrossRef]
  50. Shi, M.; Seo, J.; Cha, S.H.; Xiao, B.; Chi, H.-L. Generative AI-powered architectural exterior conceptual design based on the design intent. J. Comput. Des. Eng. 2024, 11, 125–142. [Google Scholar] [CrossRef]
  51. St»hle, L.; Wold, S. Analysis of variance (ANOVA). Chemom. Intell. Lab. Syst. 1989, 6, 259–272. [Google Scholar] [CrossRef]
  52. Shi, Z.; Jin, N.; Chen, D.; Ai, D. A comparison study of semantic segmentation networks for crack detection in construction materials. Constr. Build. Mater. 2024, 414, 134950. [Google Scholar] [CrossRef]
  53. Napierala, M.A. What Is the Bonferroni Correction? AAOS Now 2012, 40–41. Available online: https://link.gale.com/apps/doc/A288979427/HRCA?u=anon~f4b0666f&sid=googleScholar&xid=3f3f1bf7 (accessed on 15 October 2025).
  54. GM, H.; Gourisaria, M.K.; Pandey, M.; Rautaray, S.S. A comprehensive survey and analysis of generative models in machine learning. Comput. Sci. Rev. 2020, 38, 100285. [Google Scholar] [CrossRef]
  55. Miao, Y.; Koenig, R.; Knecht, K. The development of optimization methods in generative urban design: A review. In Proceedings of the 11th Annual Symposium on Simulation for Architecture and Urban Design, Vienna, Austria, 25–27 May 2020; pp. 1–8. Available online: https://www.researchgate.net/publication/344460745_The_Development_of_Optimization_Methods_in_Generative_Urban_Design_A_Review (accessed on 15 October 2025).
  56. Li, C.; Zhang, C.; Cho, J.; Waghwase, A.; Lee, L.-H.; Rameau, F.; Yang, Y.; Bae, S.-H.; Hong, C.S. Generative ai meets 3d: A survey on text-to-3d in aigc era. arXiv 2023, arXiv:2305.06131. [Google Scholar] [CrossRef]
  57. Zhang, C.; Zhang, C.; Zhang, M.; Kweon, I.S. Text-to-image diffusion models in generative ai: A survey. arXiv 2023, arXiv:2303.07909. [Google Scholar] [CrossRef]
  58. Sussman, A.; Hollander, J. Cognitive Architecture: Designing for How We Respond to the Built Environment; Routledge: New York, NY, USA, 2021. [Google Scholar] [CrossRef]
  59. Lavdas, A.A.; Sussman, A.; Woodworth, A.V. Routledge Handbook of Neuroscience and the Built Environment; Taylor & Francis: London, UK, 2025; Available online: https://books.google.co.jp/books?id=8fuEEQAAQBAJ (accessed on 15 October 2025).
  60. Taylor, R.P. The Potential of Biophilic Fractal Designs to Promote Health and Performance: A Review of Experiments and Applications. Sustainability 2021, 13, 823. [Google Scholar] [CrossRef]
  61. Gibson, J.J. The ecological approach to the visual perception of pictures. Leonardo 1978, 11, 227–235. Available online: https://muse.jhu.edu/pub/6/article/599064/summary (accessed on 15 October 2025). [CrossRef]
  62. Valentine, C. The impact of architectural form on physiological stress: A systematic review. Front. Comput. Sci. 2024, 5, 1237531. [Google Scholar] [CrossRef]
  63. Alexander, C. A Pattern Language: Towns, Buildings, Construction; Oxford University Press: New York, NY, USA, 1977; Available online: https://books.google.co.jp/books?id=hwAHmktpk5IC (accessed on 15 October 2025).
  64. Zhao, S.; Chen, D.; Chen, Y.-C.; Bao, J.; Hao, S.; Yuan, L.; Wong, K.-Y.K. Uni-controlnet: All-in-one control to text-to-image diffusion models. Adv. Neural Inf. Process. Syst. 2023, 36, 11127–11150. Available online: https://proceedings.neurips.cc/paper_files/paper/2023/file/2468f84a13ff8bb6767a67518fb596eb-Paper-Conference.pdf (accessed on 15 October 2025).
  65. Inoue, N.; Kikuchi, K.; Simo-Serra, E.; Otani, M.; Yamaguchi, K. Layoutdm: Discrete diffusion model for controllable layout generation. In Proceedings of the IEEE/CVF Conference on Computer Vision and Pattern Recognition, Vancouver, BC, Canada, 17–24 June 2023; pp. 10167–10176. [Google Scholar] [CrossRef]
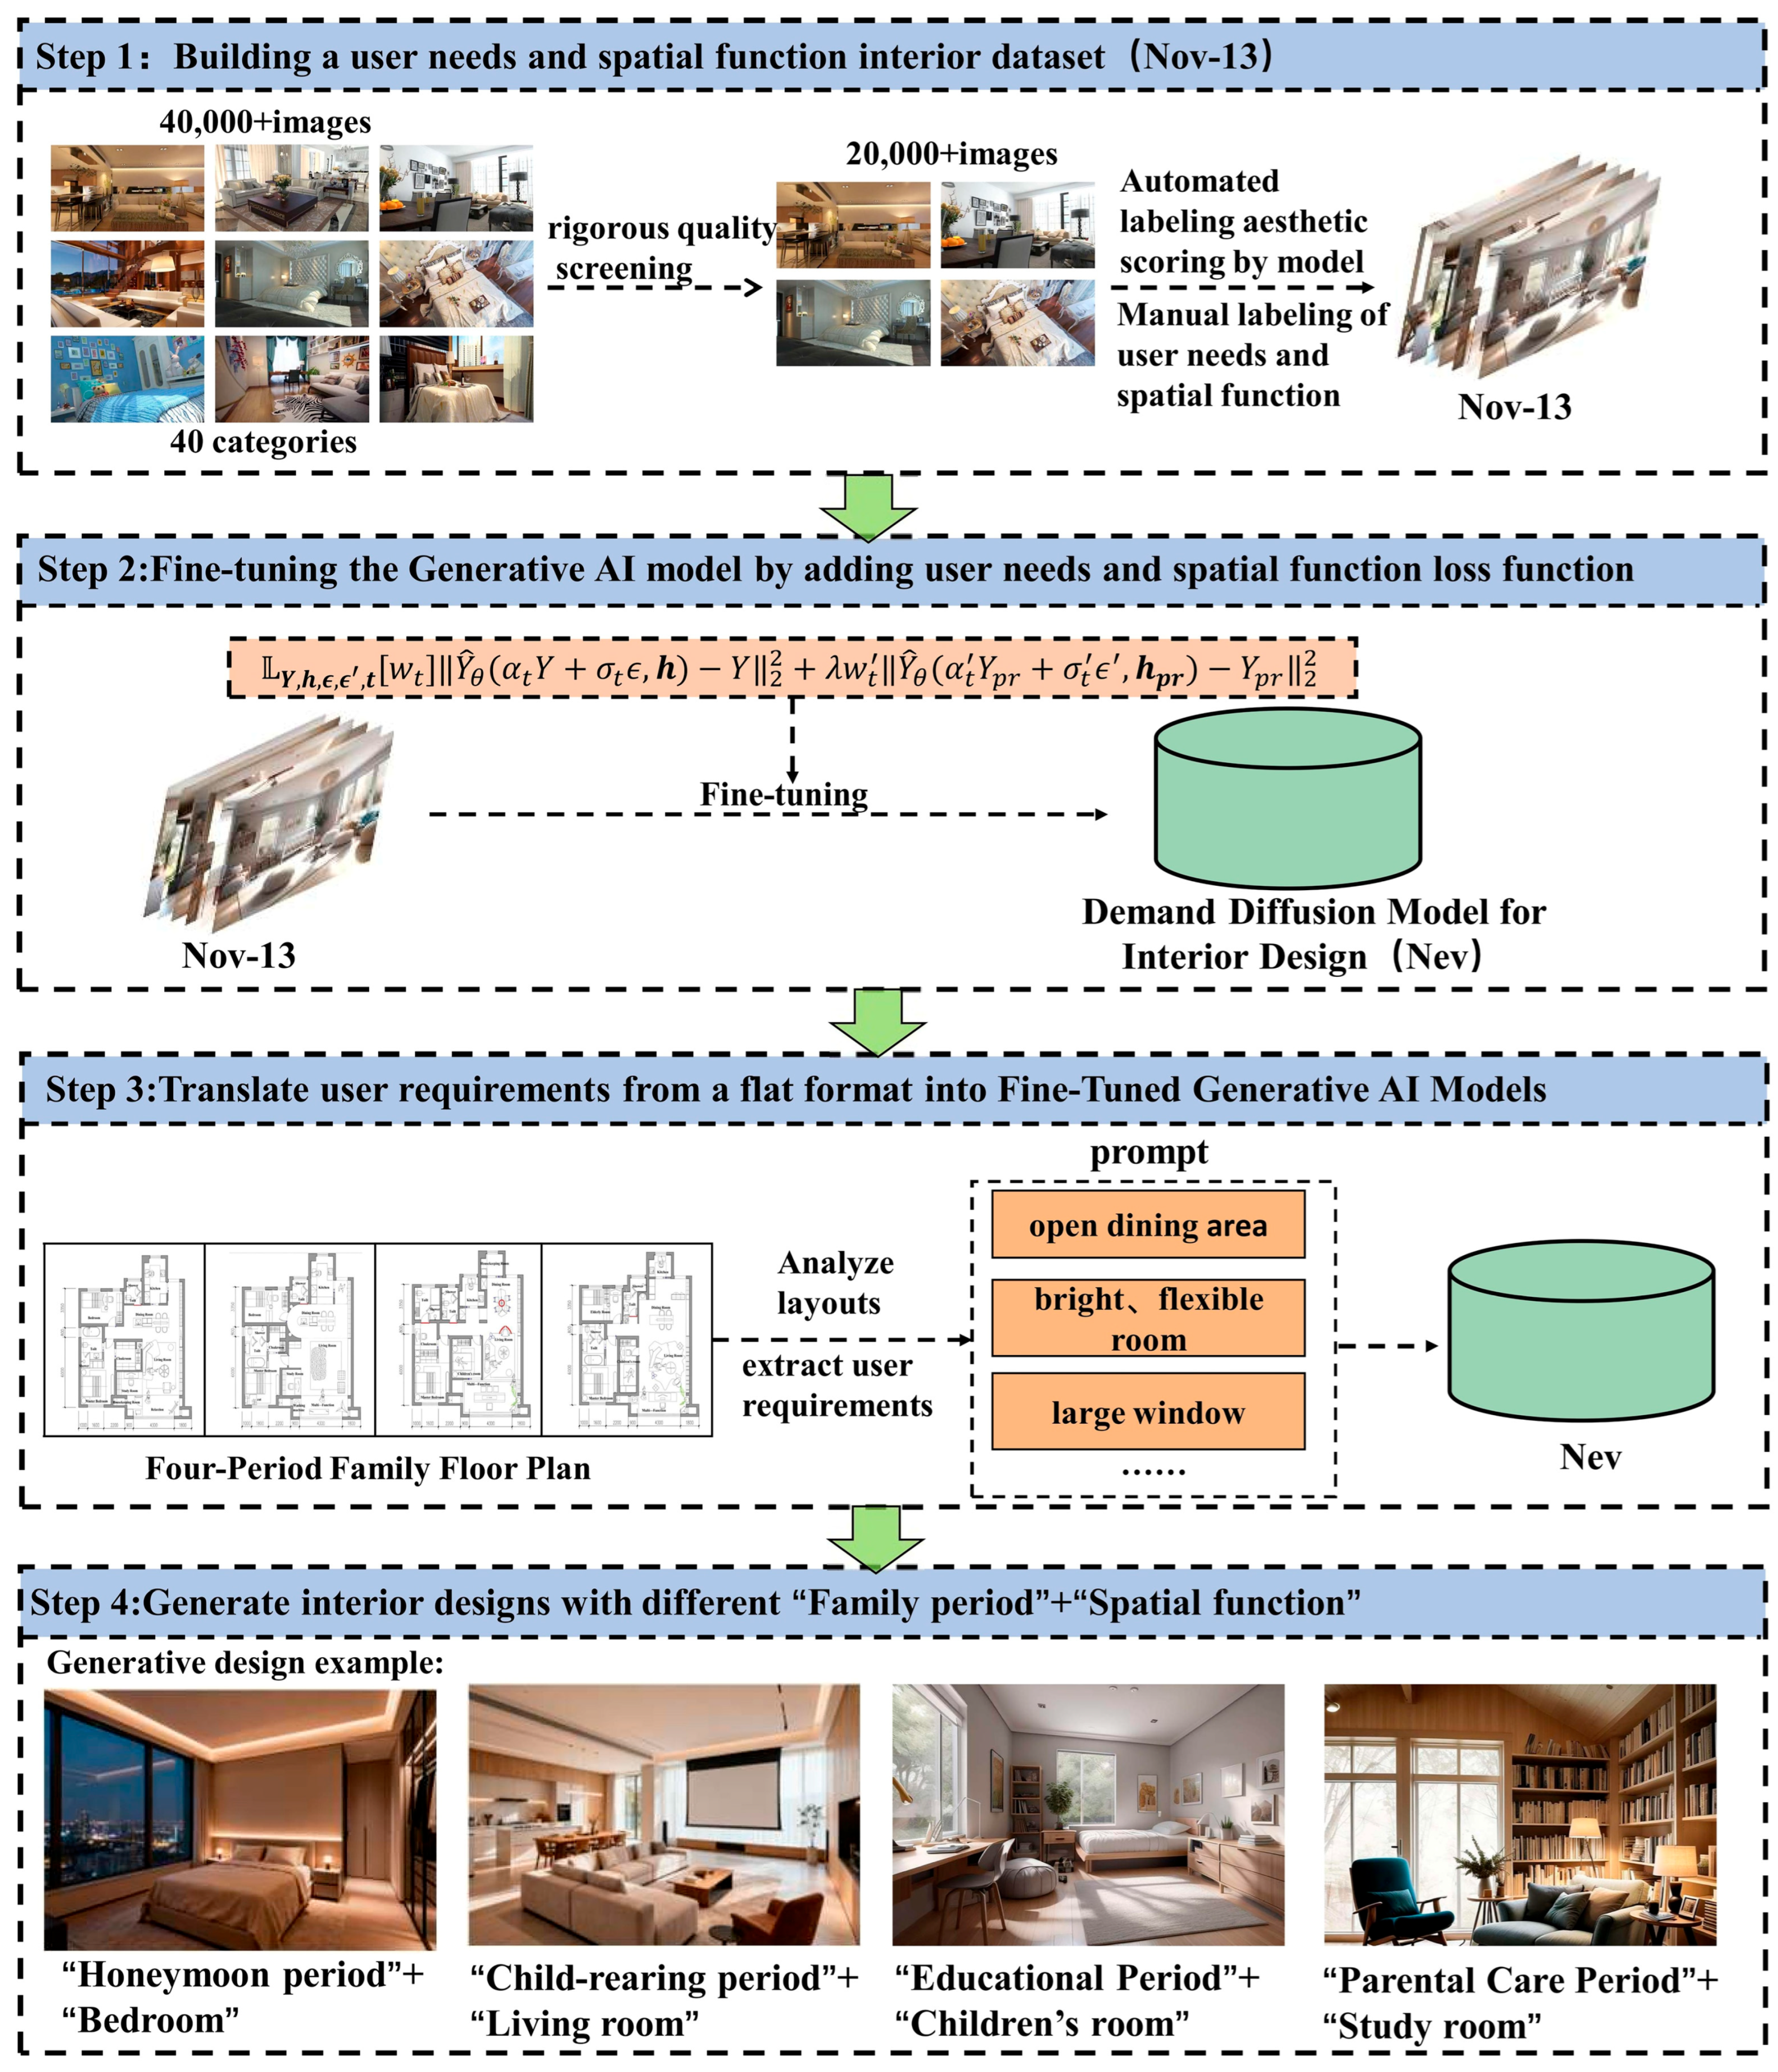
Figure 1. Research framework.
Buildings 15 04155 g001
Figure 2. Distribution of aesthetic scores on the Nov-13 dataset. The dataset uses an aesthetic scoring model to label the aesthetic score of each image automatically and maps all the scores to integers between 1 and 10, conforming to a normal distribution through a normalization method.
Buildings 15 04155 g002
Figure 3. Comparison of the design process between different design methods.
Buildings 15 04155 g003
Figure 4. Image generation process and main parameter diagram of diffusion model.
Buildings 15 04155 g004
Figure 5. Residential space design requirements of 120 square meters in different family life cycle stages.
Buildings 15 04155 g005
Figure 6. Comparison of five spaces generated by three generation methods (SD, MidJourney, and Nev) under different cycles, where (a) represents the honeymoon period, (b) represents the child-rearing period, (c) represents the education period, and (d) represents the parental care period.
Buildings 15 04155 g006
Figure 7. Questionnaire.
Buildings 15 04155 g007
Figure 8. Comparison chart of three methods across six dimensions during the honeymoon period: (a) User requirements translation, (b) Lifecycle response, (c) Style consistency, (d) Functional rationality, (e) Detail completeness, and (f) Overall design quality.
Buildings 15 04155 g008
Figure 9. Comparison chart of three methods in six dimensions during the child-rearing period: (a) user requirements translation, (b) lifecycle response, (c) style consistency, (d) functional rationality, (e) detail completeness, (f) overall design quality.
Buildings 15 04155 g009
Figure 10. Comparison chart of three methods across six dimensions during the educational period: (a) User requirements translation, (b) Lifecycle response, (c) Style consistency, (d) Functional rationality, (e) Detail completeness, (f) Overall design quality.
Buildings 15 04155 g010
Figure 11. Comparison chart of three methods across six dimensions during the parental care period: (a) User requirements translation, (b) Lifecycle response, (c) Style consistency, (d) Functional rationality, (e) Detail completeness, (f) Overall design quality.
Buildings 15 04155 g011
Figure 12. Comparison and validation results of three methods in six dimensions. (a) analysis of variance; (b) Paired t-test; * Y1: User demand translation, Y2: Lifecycle response, Y3: Style consistency, Y4: Functional rationality, Y5: Detail completeness, Y6: Overall design quality; * Applying Bonferroni correction to reduce the risk of Type I errors. Since each metric was compared three times, the significance level is 0.05/3 = 0.0167.
Buildings 15 04155 g012
Table 1. Image distribution of user needs and spatial function corresponding to the Nov-13 dataset.
Functional and Physical NeedsBehavioral and Activity NeedsPsychological and Emotional NeedsSocial and Cultural NeedsHealth and Sustainable NeedsTotal
Bedroom109911678037609754804
Living Room15901078145989711306154
Dining Room7346795044217033041
Children’s room7477077326798633728
Study Room10607888856738954301
Table 2. Translation of prompt words corresponding to user needs in different spaces, taking a 120 m2 apartment as an example.
Spatial FunctionUser NeedsPrompt
Bedroomromantic, spacious, king-size bed, en-suite bathroom, walk-in closet, soft lighting, luxuriousinterior design photo, a spacious and romantic master bedroom, king-size bed with high-quality linen, soft ambient lighting, walk-in closet en-suite, a serene and intimate atmosphere, modern minimalist style, large window with a view
Living Roomopen-plan, great for entertaining, large sectional sofa, projection screen, social hub, bright and airyInterior design photo, a large open-plan living room with great visual flow to the kitchen and dining area, modern low-profile sectional sofa, a large projection screen for movie nights, ideal for social gatherings and relaxation, bright and welcoming atmosphere
Dining Roomopen, kitchen island/breakfast bar, stylish pendant lights, seating for 4, romantic dinners, modern and chicInterior design photo, an open dining area seamlessly connected to the kitchen featuring a central breakfast island/bar, stylish pendant lights above the island, seating for four, creating a perfect atmosphere for romantic dinners and casual entertaining, modern and chic.
Children’s roomflexible multi-function room, home gym, entertainment room, guest room, neutral, adaptable designInterior design photo, a bright and flexible multi-function room, currently set up as a home gym with yoga mats and a treadmill, with potential to be a guest room or entertainment space, clean lines, neutral colors, modern and adaptable design.
Study Roomopen plan, integrated with living area, versatile, home office/gaming room, sleek, bright, multifunctionalInterior design photo, an open-plan home office integrated with the living area, sleek built-in shelves, a modern minimalist desk for a laptop, versatile space that can also serve as a gaming or reading nook, bright and airy, promoting connectivity and relaxation.
Table 3. Three methods of matching degrees in different dimensions during the honeymoon period (n = 43).
User Requirements TranslationPeriodic Spatial
Response
Style
Consistency
Functional RationalityDetail
Integrity
Overall
Design
Quality
Option A78.57%53.49%65.11%65.11%55.81%65.11%
Option B85.71%74.41%86.04%88.37%78.07%81.40%
Option C39.28%55.81%62.79%53.49%72.09%74.41%
Table 4. Three methods of matching degrees in different dimensions during the child-rearing period (n = 43).
User Requirements
Translation
Periodic Spatial
Response
Style
Consistency
Functional RationalityDetail
Integrity
Overall
Design
Quality
Option A55.81%53.49%69.76%62.79%48.83%67.44%
Option B74.41%81.40%76.74%86.04%86.04%83.72%
Option C67.44%60.46%65.11%69.76%48.83%62.79%
Table 5. Three methods of matching degrees in different dimensions during the educational period (n = 43).
User Requirements
Translation
Periodic Spatial
Response
Style
Consistency
Functional RationalityDetail
Integrity
Overall
Design
Quality
Option A65.11%51.16%51.16%72.09%65.11%53.49%
Option B88.37%81.40%83.72%86.04%88.37%79.07%
Option C53.48%67.44%65%67.44%67.44%48.83%
Table 6. Three methods of matching degrees in different dimensions during the parental care period (n = 43).
User Requirements TranslationPeriodic Spatial
Response
Style
Consistency
Functional RationalityDetail
Integrity
Overall
Design
Quality
Option A53.49%58.13%69.76%51.16%58.14%55.81%
Option B76.74%81.40%76.74%79.07%90.70%72.09%
Option C67.44%69.77%72.09%62.79%69.77%53.49%
* Values indicate the proportion (%) of participants whose ratings were ≥3 (“matched” or higher), computed using normalized agreement percentages across six evaluation dimensions.
Table 7. Summary of important surveys on Generative AI (L—Low, M—Medium, H—High, NA—Not Applicable).
ReferenceYear
Published
Lifecycle/User AdaptabilitySpatial & Functional CoherenceGenerative
AI Model
Generative AI Evaluation Metric ClassificationRemarks
[13]2023NANAMLBroad review of intelligent computing advances; not focused on lifecycle or interior specifics
[15]2025MMMLReview of applications, data needs, and evaluation methods; useful taxonomy but limited lifecycle-specific solutions.
[18]2022NAMNALOptimization-focused method for architectural design; not a generative-AI text-to-image study.
[19]2024LMMMGAN-driven urban/architectural inspiration tool; emphasizes rapid alternatives rather than household adaptation.
[20]2020LMMMIntegrates human-preference signals (EEG) into design-selection; informs personalization but not lifecycle modeling.
[21]2025LLLMLinks AI-generated plans to environmental performance; strong on functional evaluation.
[22]2024LHHMConditional diffusion for floor plans with parameter-efficient fine-tuning improves structural fidelity.
[23]2025LMMLApplication of diffusion for façade-deterioration prediction; not interior/lifecycle focused.
[24]2023NALLMAutomated layout generation using DL + graph methods; strong spatial/functional focus but limited lifecycle modeling.
[27]2023MHHHDirectly relevant: text-to-interior diffusion method; focuses on creative efficiency and visual quality more than lifecycle adaptation.
[37]2024MMMLBroad review of AIGC in AEC; highlights practice/education implications but not lifecycle-specific frameworks.
[54]2020LLLLPresented an overview of generative AI model classifications.
[55]2020NANALMFocuses on the application of GANs in architecture and urban design.
[56]2023LMMLA comprehensive survey on the underlying technology and applications of text-to-3D conversion.
[57]2023NANALMA review of text-to-image diffusion models.
This paper2025HHHHIntegrates lifecycle-responsive dataset (Nov-13), composite loss, and fine-tuning; validated both qualitatively and quantitatively.
Disclaimer/Publisher’s Note: The statements, opinions and data contained in all publications are solely those of the individual author(s) and contributor(s) and not of MDPI and/or the editor(s). MDPI and/or the editor(s) disclaim responsibility for any injury to people or property resulting from any ideas, methods, instructions or products referred to in the content.