Article

Study on the Vibration Effects of Brick–Concrete Structures Induced by Blasting in Open-Pit Mines

1
College of Mining Engineering, North China University of Science and Technology, Tangshan 063210, China
2
School of Emergency Management and Safety Engineering, North China University of Science and Technology, Tangshan 063210, China
3
Hebei Province Key Laboratory of Mining Development and Security Technology, Tangshan 063210, China
4
Xinjiang Zhongtai Resource Management Co., Ltd., Urumqi 830009, China
*
Author to whom correspondence should be addressed.
Buildings 2025, 15(16), 2954; https://doi.org/10.3390/buildings15162954 (registering DOI)
Submission received: 13 July 2025 / Revised: 10 August 2025 / Accepted: 17 August 2025 / Published: 20 August 2025
(This article belongs to the Special Issue Dynamic Response of Structures)

Abstract

Ensuring the dynamic safety of buildings near open-pit mines during blasting is a critical concern for the normal conduct of mining operations. This study investigates the effects of blasting vibrations on brick–concrete structures by using deep-hole blasting tests conducted at the mine site, employing blasting vibration monitoring and numerical simulation techniques. The peak particle velocity and energy distribution characteristics of blasting waves in structural columns and brick walls were analyzed. Furthermore, a three-dimensional numerical model was developed to analyze the response characteristics of buildings to blasting vibrations. Considering the impact of a building’s natural frequency on blasting vibrations, harmonic response was utilized to identify the natural frequencies of different components. The relationship between these frequencies and a building’s natural frequency is discussed. Dangerous frequencies and components were identified. The findings of this study can serve as a theoretical foundation for understanding the damage mechanisms of buildings under blasting waves and for controlling the impact of blasting vibration effects.

1. Introduction

Blasting is a technique that uses the energy released by explosives to destroy or deform materials, achieving specific engineering goals [1]. The peak velocity of blasting waves decreases as the distance from the blast center increases. It may also result in varying degrees of damage to non-blasted targets within a certain range. This phenomenon is known as the seismic effect of blasting. If the PPV of blasting waves exceeds the vibration safety standards for buildings or if the main frequency of these waves closely matches the natural frequency of the building, it may result in varying degrees of damage to the building [2]. Compared to natural earthquakes, blasting waves are characterized by higher frequencies and shorter durations, leading to different forms of damage in buildings. The damage is typically localized or stress-concentrated, such as cracks at door and window corners and weakly constrained areas. Frequent disturbances caused by blasting waves in open-pit mines can exacerbate these damages, leading to building injuries and destruction, affecting the normal lives of local residents [3,4,5]. Therefore, ensuring the integrity of buildings requires a clear understanding of the vibration effects of blasting waves within them.
Currently, researchers have extensively explored the impact of blasting vibrations on buildings. However, most studies focus on the dynamic response of buildings under tunnel or foundation pit blasting. For example, He et al. [6] found that the vertical peak particle velocity (PPV) decreases initially and then increases with the height of the floor, while the horizontal and radial PPV follow a different pattern. Wang et al. [7] discovered that the PPV in the vertical direction for high-rise buildings is the highest, while the PPV in the horizontal direction is relatively low. Huo et al. [8] observed that the PPV in masonry structures gradually increases from the first to the third floor, but begins to decrease at the fourth floor. Jiang et al. [9] found that the vertical PPV in reinforced-concrete structures first decreases and then increases with floor height. In contrast, Athanasopoulos et al. [10] proposed that the vertical vibration amplification effect is significant in the higher floors of reinforced-concrete structures, based on their measurements. Ren et al. [11] monitored the effects of historical PPV and found that the drum tower exhibits significant horizontal vibration, while vertical vibration shows a rapid decaying trend. To reduce the impact of tunnel blasting on buildings, Ren et al. [12] proposed a new blasting scheme. Zhang et al. [13] used blasting experiments and numerical simulation methods to analyze the dynamic response of high-rise frame buildings under the action of pit blasting. The PPV amplification effect of high-rise buildings is obvious: the amplification factor is 1.19~1.26 times.
To study the vibration response characteristics of a building’s structural components during blasting, many researchers have used numerical simulation methods to analyze the dynamic responses of buildings with various structural forms. Guan et al. [14] noted that the main vibration frequency of tunnel blasting is close to the natural frequency of building components, so different components experience more intense vibrations compared to the main structure of the building. Jiang et al. [15] used numerical simulation techniques to analyze the vibration effects of blasting on a pagoda, finding that the PPV at the top of the tower is 4.29 cm/s, significantly higher than the 0.29 cm/s at the bottom. Jayasooriya et al. [16] used LS-DYNA and SAP2000 numerical simulation software to assess the damage and residual strength of reinforced-concrete-frame structures and components under explosive loads. Wu et al. [17] used Autodyn3D to study the damage characteristics of masonry structures under the influence of blasting waves. Zou et al. [18] analyzed the blasting vibration response characteristics of residences and proposed a control standard of PPV for the damage characteristics of residences. Yuan et al. [19] studied the vibration response characteristics of high-rise buildings under the action of mine production blasting. The vertical PPV of the building was greater than the PPV in the horizontal direction. The horizontal direction PPV increased with the height of the floor, which showed an increase and then decrease, and, in the high-rise, showed an increasing trend.
The impact of blasting vibrations on building safety has attracted considerable attention, particularly in engineering contexts such as tunnel excavation and deep-pit blasting. Most existing studies have focused on reinforced-concrete or frame structures, which typically exhibit high structural integrity and ductility. However, in the vicinity of open-pit mines, large numbers of aging brick–concrete structures are commonly found. These structures are characterized by simple construction and poor seismic performance, making them more vulnerable to localized damage under blasting-induced vibrations, such as the cracking of window walls or detachment of roof components. Despite their widespread presence in mining areas, relevant research on the dynamic responses of such masonry structures remains relatively scarce.
This paper, situated against the backdrop of open-pit mine production blasting, uses the TC-4850N vibration measurement instrument (Zhongke (Chengdu) Instruments Co., Ltd., Chengdu, China) for on-site monitoring to gather data on brick–concrete structures during blasting events. This study examines the vibration response characteristics of different components from the perspectives of PPV, main vibration frequency, and energy distribution. Using the ANSYS 2024 R2 numerical simulation software for three-dimensional modeling analysis, the hazardous frequencies and components are identified based on harmonic response. This study of the blasting vibration response characteristics of brick–concrete structures can provide a scientific foundation for establishing safety criteria for building blasting vibration. It also contributes to the optimization of blasting design parameters in open-pit mining operations. Furthermore, the findings offer a valuable reference for the vibration response of buildings in other similar blasting scenarios, demonstrating good engineering applicability and potential popularization value.

2. Project Background

2.1. Project Introduction

The experimental open-pit mine is located in China, and is one of the largest open-pit iron mines in the country. The mine covers a surface area of 3 km north–south and 1.5 km east–west, forming an essential part of the Jidong Iron Mine Area. It is classified as an Anshan-type sedimentary metamorphic iron ore deposit. The mine experiences an average of 5–6 blasting operations per day, primarily involving ore extraction and rock stripping. The blasting technique uses digital detonators for sequential hole initiation, with explosives including mixed ammonium oil and emulsion explosives. The borehole diameters range from 150 mm to 310 mm, with a diamond-shaped layout. The hole depths are between 6.5 m and 17 m, with a maximum overburden depth of 1–2 m. The spacing between holes is 4–8 m, and the spacing between rows is 3–7 m. The filling height is typically 4–8 m, with a maximum charge volume of 800 kg per section.
Due to the proximity of open-pit mines to surrounding villages and houses, it is essential to strictly control the scale of blasting and implement protective measures to prevent blasting vibrations from causing damage and ensure the normal operation of the mining area. The pump house within the open-pit mine, being a brick–concrete structure, serves as a typical building for studying the effects of blasting vibrations. The specific location of this brick–concrete structure is shown in Figure 1.

2.2. Blasting Vibration Monitoring Scheme

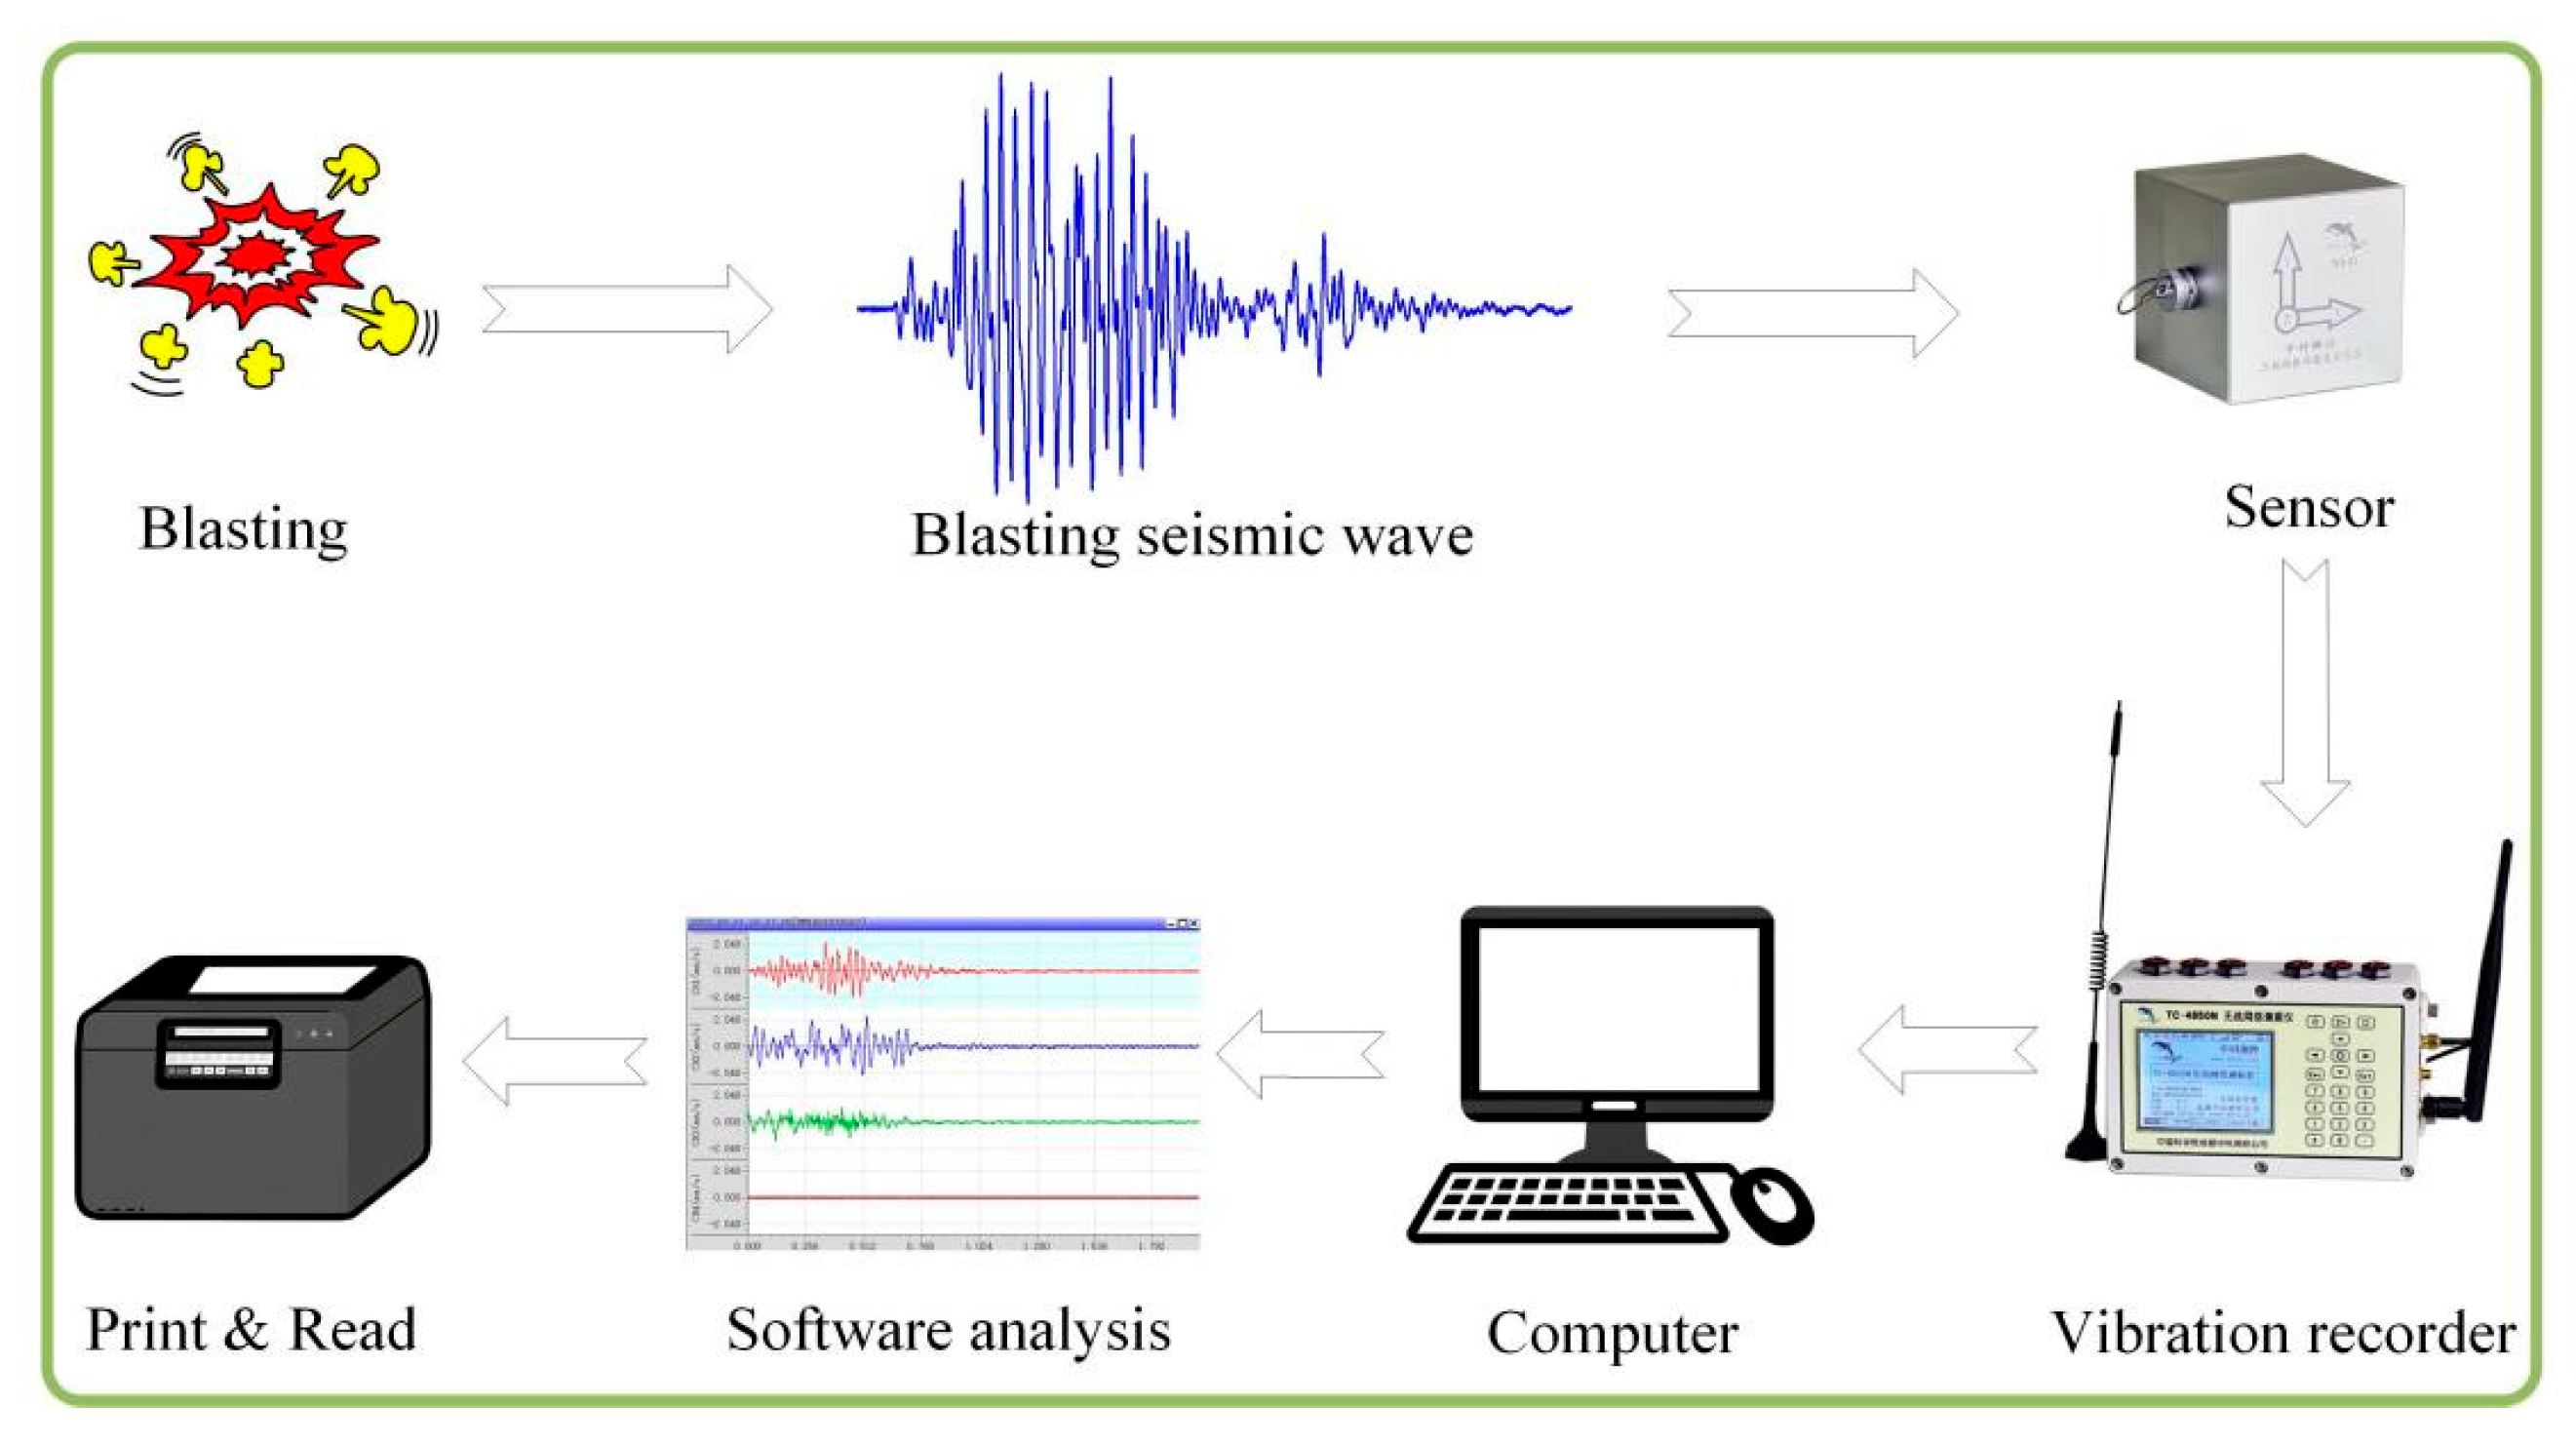
The blasting vibration monitoring system consists of a blasting vibration meter and a three-axis velocity sensor. To ensure high testing accuracy, the TC-4850N blasting vibration meter, developed by Zhongke (Chengdu) Instruments Co., Ltd., Chengdu, China, was used to capture blasting waves. This meter has a frequency range of 5–500 Hz, a sampling rate of 100–100,000 Sps, a resolution of 0.01 cm/s, and a maximum range of 35 cm/s, fulfilling the blasting vibration monitoring requirements. The sensor is a TCS-B3 type three-axis vibration velocity sensor produced by Chengdu Zhongke Measurement & Control Co., Ltd. This sensor can simultaneously monitor blasting waves in three directions, with a frequency response range of 1–500 Hz and a sensitivity of 26–28 V/m/s, meeting the testing requirements. The blasting vibration monitoring system is illustrated in Figure 2.
The brick–concrete structure measures 14.4 m in length, 4.7 m in width, and 4.2 m in height. Before the mine production blasting, the sensor placement areas were cleaned with a brush. The sensor was then bonded to the house’s surface using a mixture of water and gypsum powder to form a sticky paste. The TC-4850N blasting vibration meter was connected to the TCS-B3 three-axis vibration velocity sensor (Zhongke (Chengdu) Instruments Co., Ltd., Chengdu, China) via signal transmission lines, with the X-axis of the sensor pointing towards the blasting area. Parameters such as the sampling rate and sampling time were set, and the data acquisition function was activated to enter a waiting state for triggering.
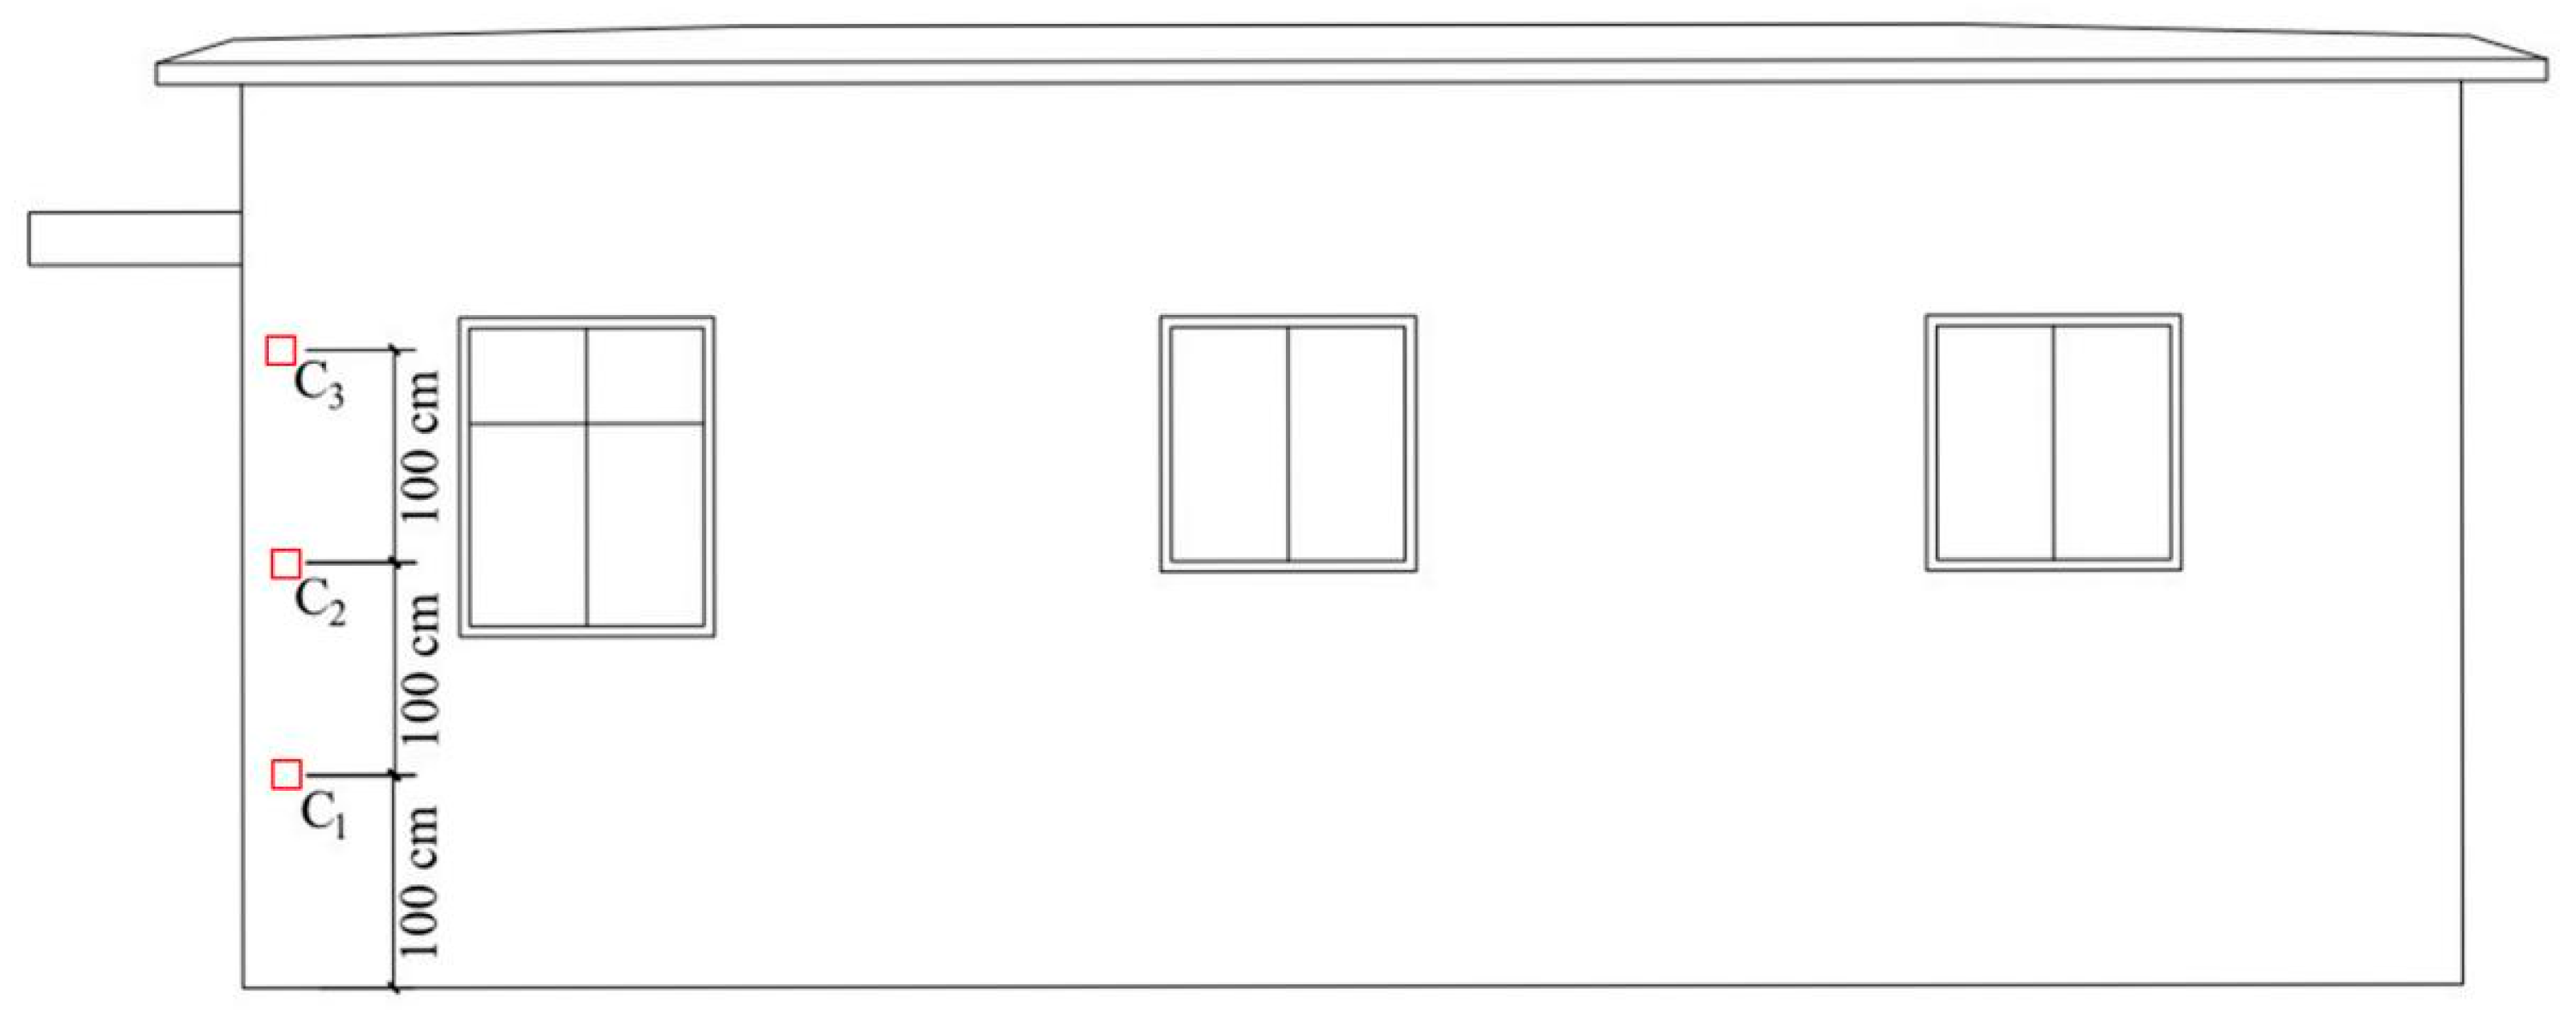
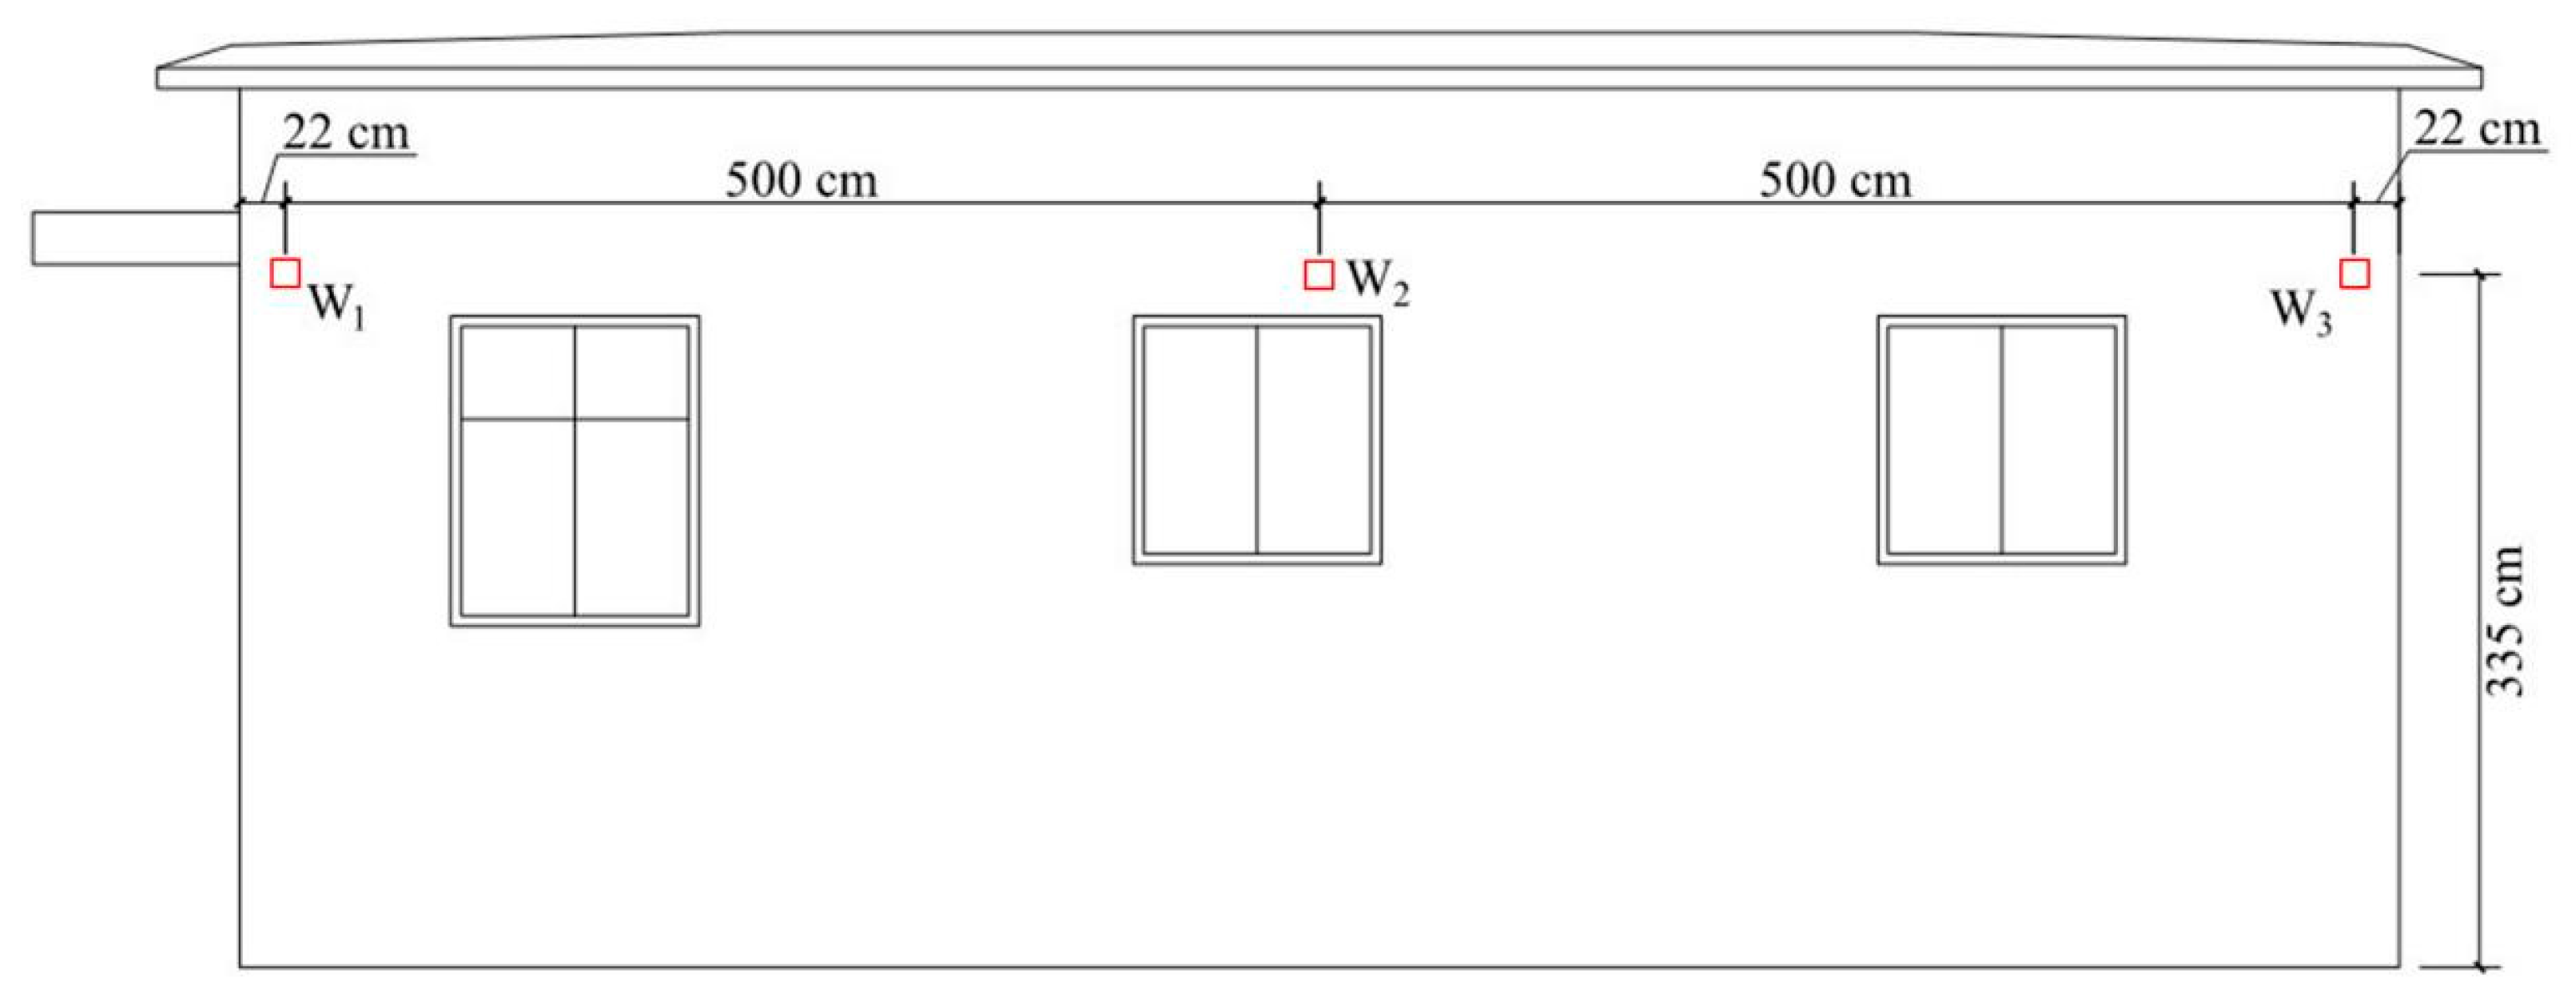
The open-pit mine extends in a north–south direction, with the blasting area mainly situated between the −202 and −262 m levels on the western side of the mine. Two vibration monitoring schemes were put in place, with the surface monitoring point F, located on the south side of the house, serving as the primary monitoring point. Vibration instruments were installed at various heights on the structural column and along the horizontal direction of the brick wall. The arrangement of the surface monitoring points is depicted in Figure 3. Monitoring points C1, C2, and C3 were positioned at different heights on the structural column, as depicted in Figure 4. Monitoring points W1, W2, and W3 were situated along the horizontal direction of the southern brick wall. The layout of these monitoring points is illustrated in Figure 5.

3. Vibration Monitoring and Analysis of Building Components

3.1. Monitoring and Analysis of Blasting Vibration of the Structural Column Component

The TC-4850N vibration meter was set up according to Figure 4 to collect five sets of blasting vibration signals. Each set includes data for both the horizontal (radial and tangential) and vertical components. The monitoring data for different measurement points on the structural column are shown in Table 1.
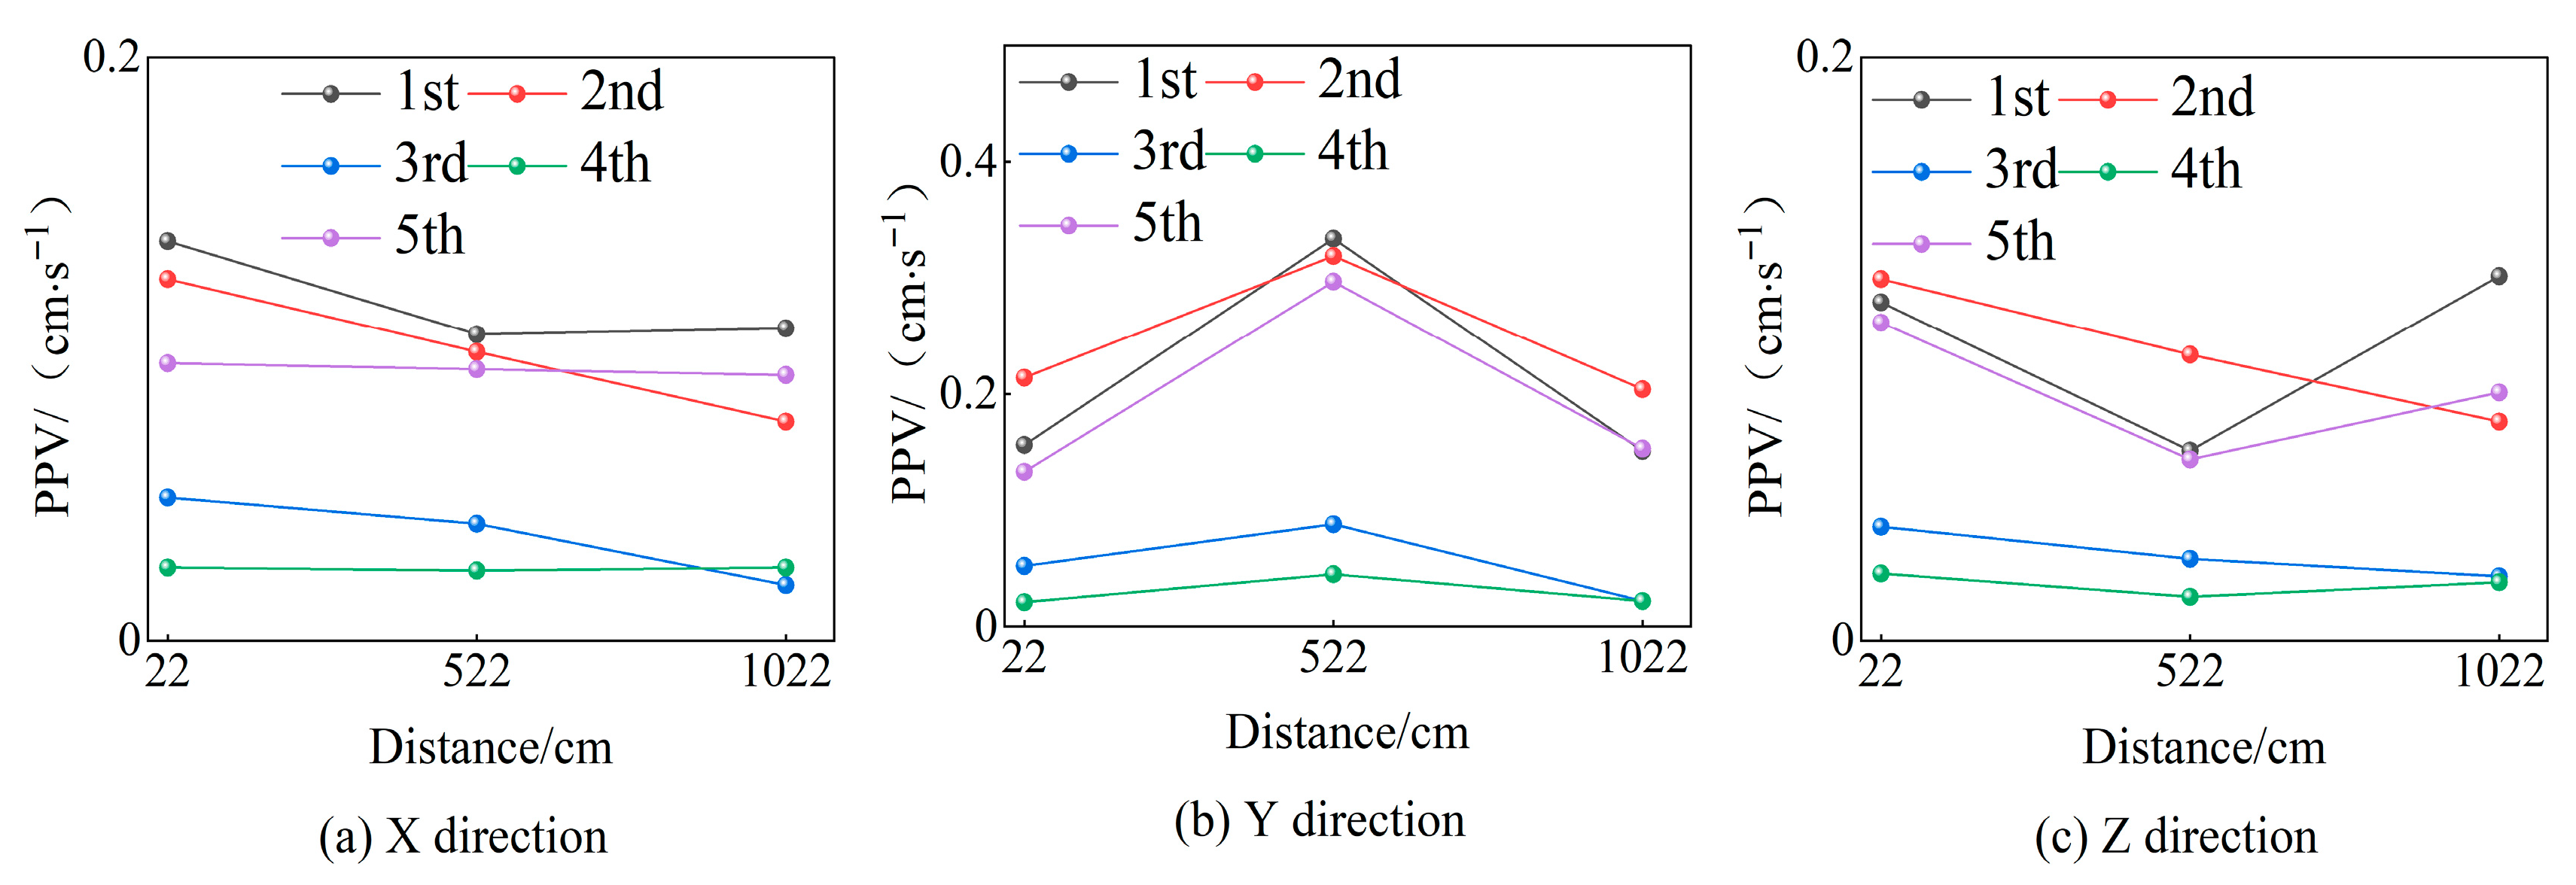
Figure 6 illustrates the variation pattern of PPV at the monitoring points on the structural column. Figure 7 shows the amplification coefficients of the PPV at different measurement points, which are the ratios of the PPV at these points to those at the surface monitoring points.
As shown in Figure 6 and Figure 7, as the height of the monitoring points increases from the ground, the PPV in both the horizontal (radial and tangential) and vertical directions show a gradual increase. Compared to points C1 and C2, point C3 exhibits a greater amplification coefficient for its PPV relative to the surface monitoring point. The amplification coefficients of the PPV at different points are linearly related to elevation, indicating a significant elevation amplification effect. This may be due to the weak constraint of the foundation on the superstructure, which allows for an increased vibration space in the horizontal radial and tangential directions of the structural columns. Additionally, during the propagation of blasting waves from blasting, the interaction with different parts of the building produces a superposition effect, which becomes more pronounced as the height increases, leading to an increase in peak vibration velocities.
The variation pattern of the main frequency at the structural column monitoring points is illustrated in Figure 8. The frequency ratio coefficients, which represent the ratio of the main vibration frequencies at different monitoring points to those at the surface monitoring point, are shown in Figure 9. As can be seen from Figure 8 and Figure 9, the main frequencies at different monitoring points in both the horizontal (radial and tangential) and vertical directions are primarily concentrated in the 15–25 Hz range, with relatively minor variations. Most of the frequency ratio coefficients at different monitoring points are greater than 1. This suggests that, during the propagation of blasting waves along the structural column, both amplification and attenuation effects on the main frequencies occur. The primary reason for this is that the column undergoes multimodal vibration under blasting vibrations, with different vibration modes interacting, leading to more complex changes in the main vibration frequencies.
The contour lines and fitting relationships of the PPV at the structural column and surface monitoring point are shown in Figure 10 and Figure 11, respectively. Figure 10 shows that when the PPV at the surface is constant, then, as the elevation increases, the PPV in both the horizontal (radial and tangential) and vertical directions of different monitoring points gradually increases. When the PPV at the surface exceeds 0.5 cm/s, the vibration response at different monitoring points is relatively significant. When the elevation is fixed, the higher the PPV at the surface, the greater the PPV in both the horizontal and vertical directions at different monitoring points, indicating a linear relationship between the PPV at the surface and different monitoring points. This is consistent with the statistical relationship shown in Figure 11.
Due to the complexity of the mine environment, topographical and geological factors, vibrometer errors, and other reasons, the measured blast vibration signal will be contaminated. In order to obtain the real blasting waves, they need to be measured using blasting vibration signal noise reduction. Before analyzing the energy distribution characteristics of blasting waves, the measured blasting waves were processed using the method described in reference [20] to filter out most high-frequency noise and retain the useful components of the measured signal. The vibration signals from the C1, C2, and C3 measurement points, under identical blasting conditions, were selected for analysis after noise reduction. The sampling frequency of the blasting vibration monitoring instrument is 5000 Hz. According to Shannon’s sampling theorem, the Nyquist frequency is 2500 Hz. The signal was decomposed into nine levels using the db8 wavelet basis, resulting in ten frequency bands. The energy distribution of these bands is shown in Table 2. An analysis of variance (ANOVA) was conducted to evaluate the differences in energy proportions across different measurement points. The results indicate that the variation among the groups was not statistically significant (F = 1.56 × 10⁻⁹, p = 1.00), suggesting a consistent energy distribution trend across all monitoring locations.
As shown in Table 2, The energy of different signals is primarily concentrated below 312.5 Hz, with the energy in the 312.5~2500 Hz band nearly zero, indicating that most high-frequency noise has been filtered out. As the height of the measurement points increases, the total energy of the blasting vibration signal gradually increases, demonstrating an elevation amplification effect. The total energy at point C2 is approximately 1.35 times higher than at point C1, and it is about 1.79 times higher at point C3. The 19.5313~39.0625 Hz band shows a significant energy amplification, followed by the 9.7656~19.5313 Hz band. The energy of different signals is mainly concentrated in the 4.8828~39.0625 Hz band, with the C1 signal primarily concentrated in the 4.8828~9.7656 Hz band and the C2 and C3 signals mainly concentrated in the 19.5313~39.0625 Hz band.
The instantaneous energy spectrum clearly illustrates the relationship between time and instantaneous energy. The instantaneous energy spectrum of the monitoring points is shown in Figure 12. As illustrated in Figure 12, the horizontal radial instantaneous energy at different monitoring points is mainly distributed within the 0.5~1.5 s time interval. Multiple peaks appear at different time points due to the small inter-hole delay time of 24 ms, which causes multiple adjacent peaks to form the main peak segment. The timing of the instantaneous energy peaks varies among different monitoring points, but they are all close to the PPV moments of the actual blasting vibration signals measured at each point. Taking the instantaneous energy peak at C1 as a reference, the instantaneous energy peaks at C2 and C3 show varying degrees of amplification, consistent with the variation pattern of the PPV. This is because the greater the PPV of the point, the greater the dynamic stress generated in the structure, and thus the more energy it carries and releases.

3.2. Monitoring and Analysis of Blasting Vibration of the Masonry Wall Component

In Figure 5, three measurement points are equipped with blasting vibration monitoring instruments to collect the vibration signals during production blasting. The data on the vibration monitoring at different measurement points of the brick wall are shown in Table 3.
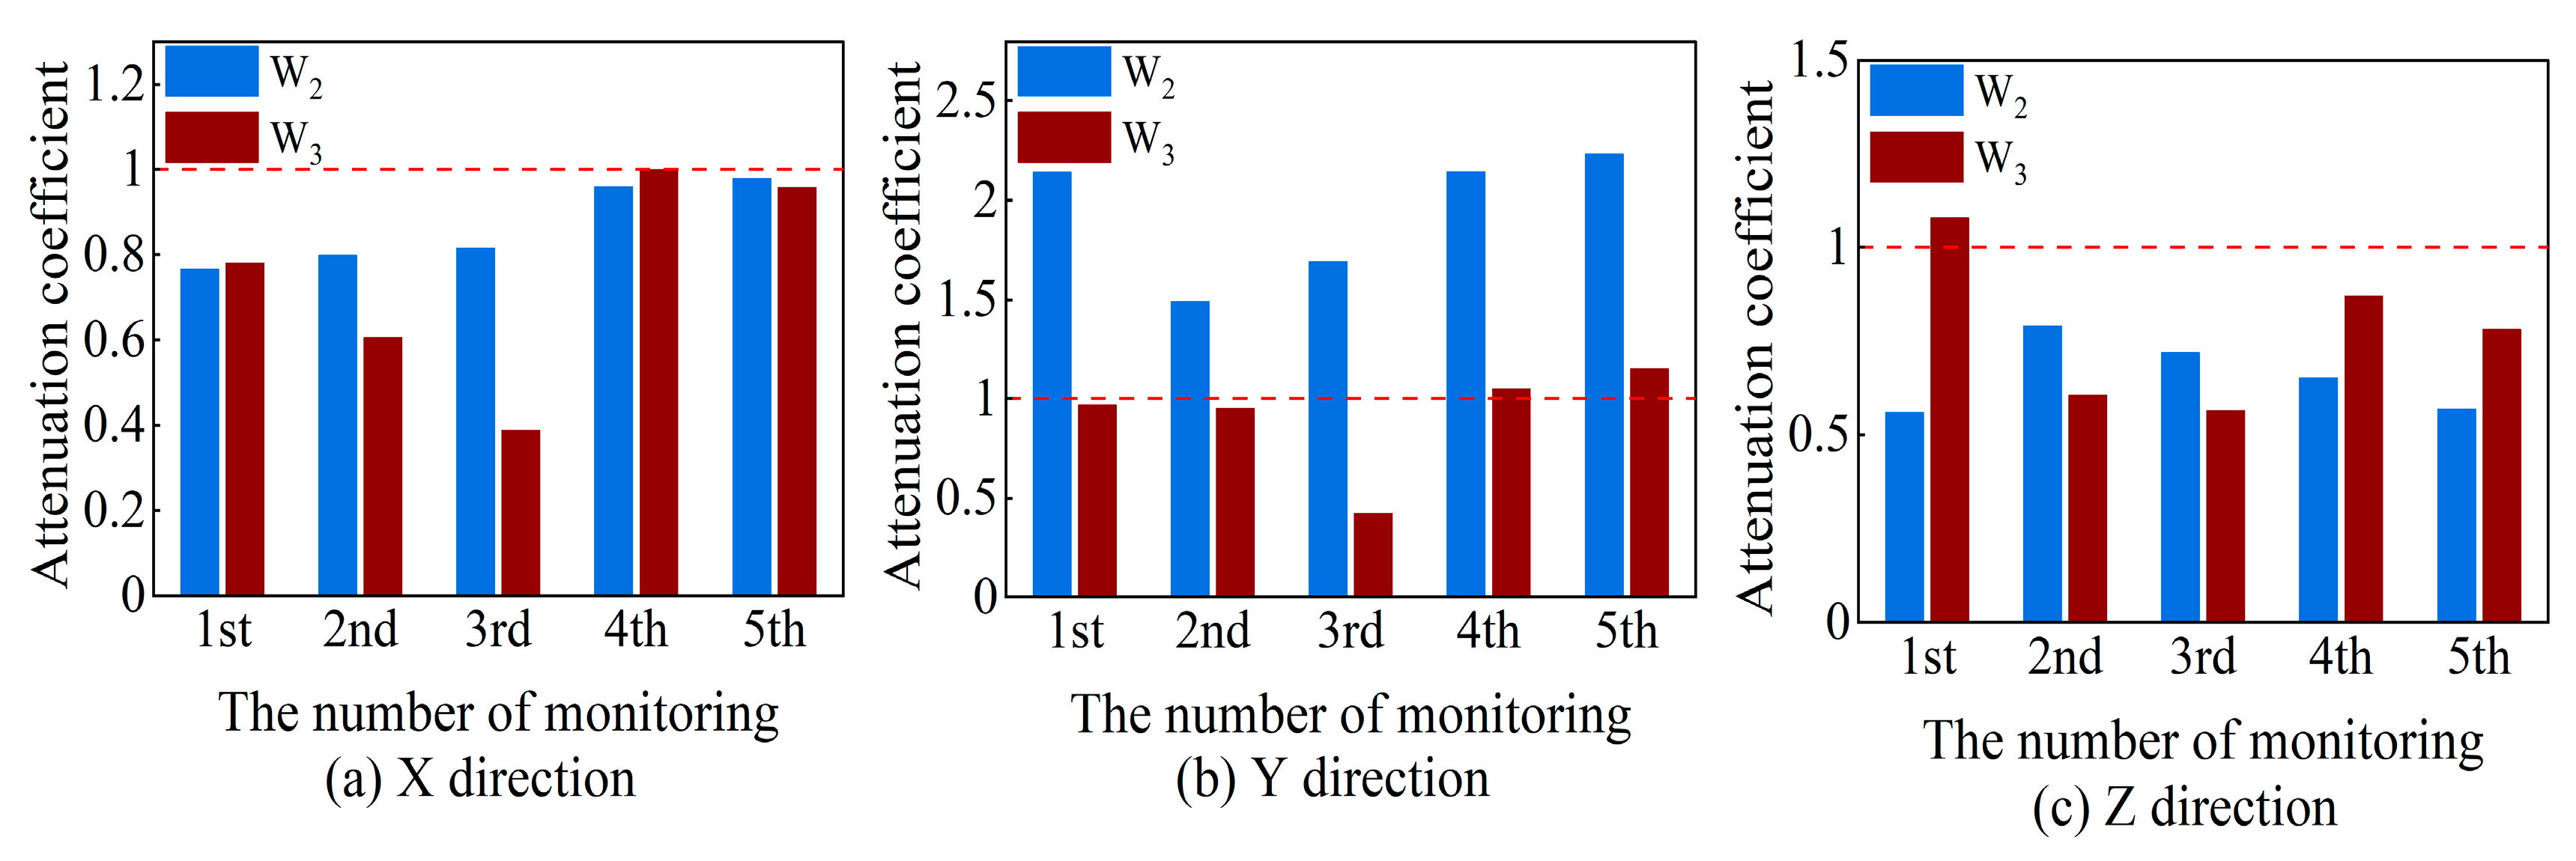
The variation patterns of the PPV at different monitoring points of the brick wall are illustrated in Figure 13. The ratio of the PPV at different monitoring points (specifically, the ratio of the PPV at W2 and W3 points to that at W1 point) is depicted in Figure 14.
As shown in Figure 13 and Figure 14, the PPV in the horizontal tangential direction first increases and then decreases. Specifically, the PPV at the middle of the wall component is higher than at the ends, with a ratio greater than 1. This is because the W1 and W3 points are near the edges of the wall and the columns, while the W2 point is closer to the middle of the wall. Consequently, the W2 point has more freedom in the horizontal tangential direction compared to the W1 and W3 points. The vertical PPV at different monitoring points generally first decreases and then increases, meaning that the PPV at the middle of the wall is lower than at the ends, with a ratio less than 1. There is no clear pattern in the variation in the PPV in the horizontal radial direction. However, the PPV in the horizontal radial direction at the W3 measurement point is lower than that at the W1 point, indicating a decaying trend in the horizontal radial PPV.
The distribution of the main frequencies of blasting waves from different monitoring points on a brick wall is shown in Figure 15. The frequency ratio coefficients for different monitoring points on the brick wall are illustrated in Figure 16. The frequency ratio coefficient is the ratio of the main frequency of the W2 and W3 points to that of the W1 point.
As shown in Figure 15 and Figure 16, the main frequencies in different directions are primarily concentrated in the 15–30 Hz range. The main frequencies in the horizontal radial and vertical directions are relatively dispersed, while those in the horizontal tangential direction are more concentrated. This suggests that there is no clear propagation pattern for the main vibration frequencies of blasting waves from different directions on a brick wall. The frequency ratio coefficients at different monitoring points vary around 1, indicating that both amplification and attenuation effects of blasting waves coexist. This may be due to the combined effects of the propagation and reflection characteristics of blasting waves, the natural frequency of the brick wall, and the damping effect.
The contour lines of the PPV at the brick wall and surface monitoring points are shown in Figure 17. Figure 17 shows that when the PPV at the surface is constant, as the horizontal distance increases, the horizontal tangential PPV at different monitoring points first increases and then decreases. The radial PPV generally show a decaying trend, while the vertical PPV generally show a decreasing trend followed by an increasing trend. When the PPV at the surface exceeds 0.08 cm/s, the vibration responses at different monitoring points are relatively significant.
The fitting relationships of the PPV at the brick wall and surface monitoring points are shown in Figure 18. Figure 18 also indicates that there is a linear relationship between the PPV at the surface and at different monitoring points, suggesting that the PPV in both the horizontal and vertical directions at different monitoring points of the wall components increase with the increase in the PPV at the surface, consistent with the trends observed in Figure 17.
The blasting vibration signals at the horizontal radial points of W1, W2, and W3 under the same blasting conditions were analyzed using the method described in reference [14] to reduce noise in the measured blasting waves and to analyze the propagation patterns of energy along the brick wall. The energy distribution across different frequency bands is shown in Table 4. The ANOVA results indicate that the variation among the groups was not statistically significant (F = 6.48 × 10⁻⁹, p = 1.000), suggesting a consistent energy distribution trend across all monitoring locations (W1, W2, W3). As shown in Table 4, as the horizontal distance increases, the total energy of the blasting vibration signals gradually decreases. The energy at point W2 is 1.35 times lower than that at point W1, and the energy at point W3 is 0.52 times lower than that at point W1. This is because the blasting waves’ front expands with increasing distance, leading to a gradual decrease in energy per unit area. During the propagation of the blasting waves, high-frequency components decay faster than low-frequency components.
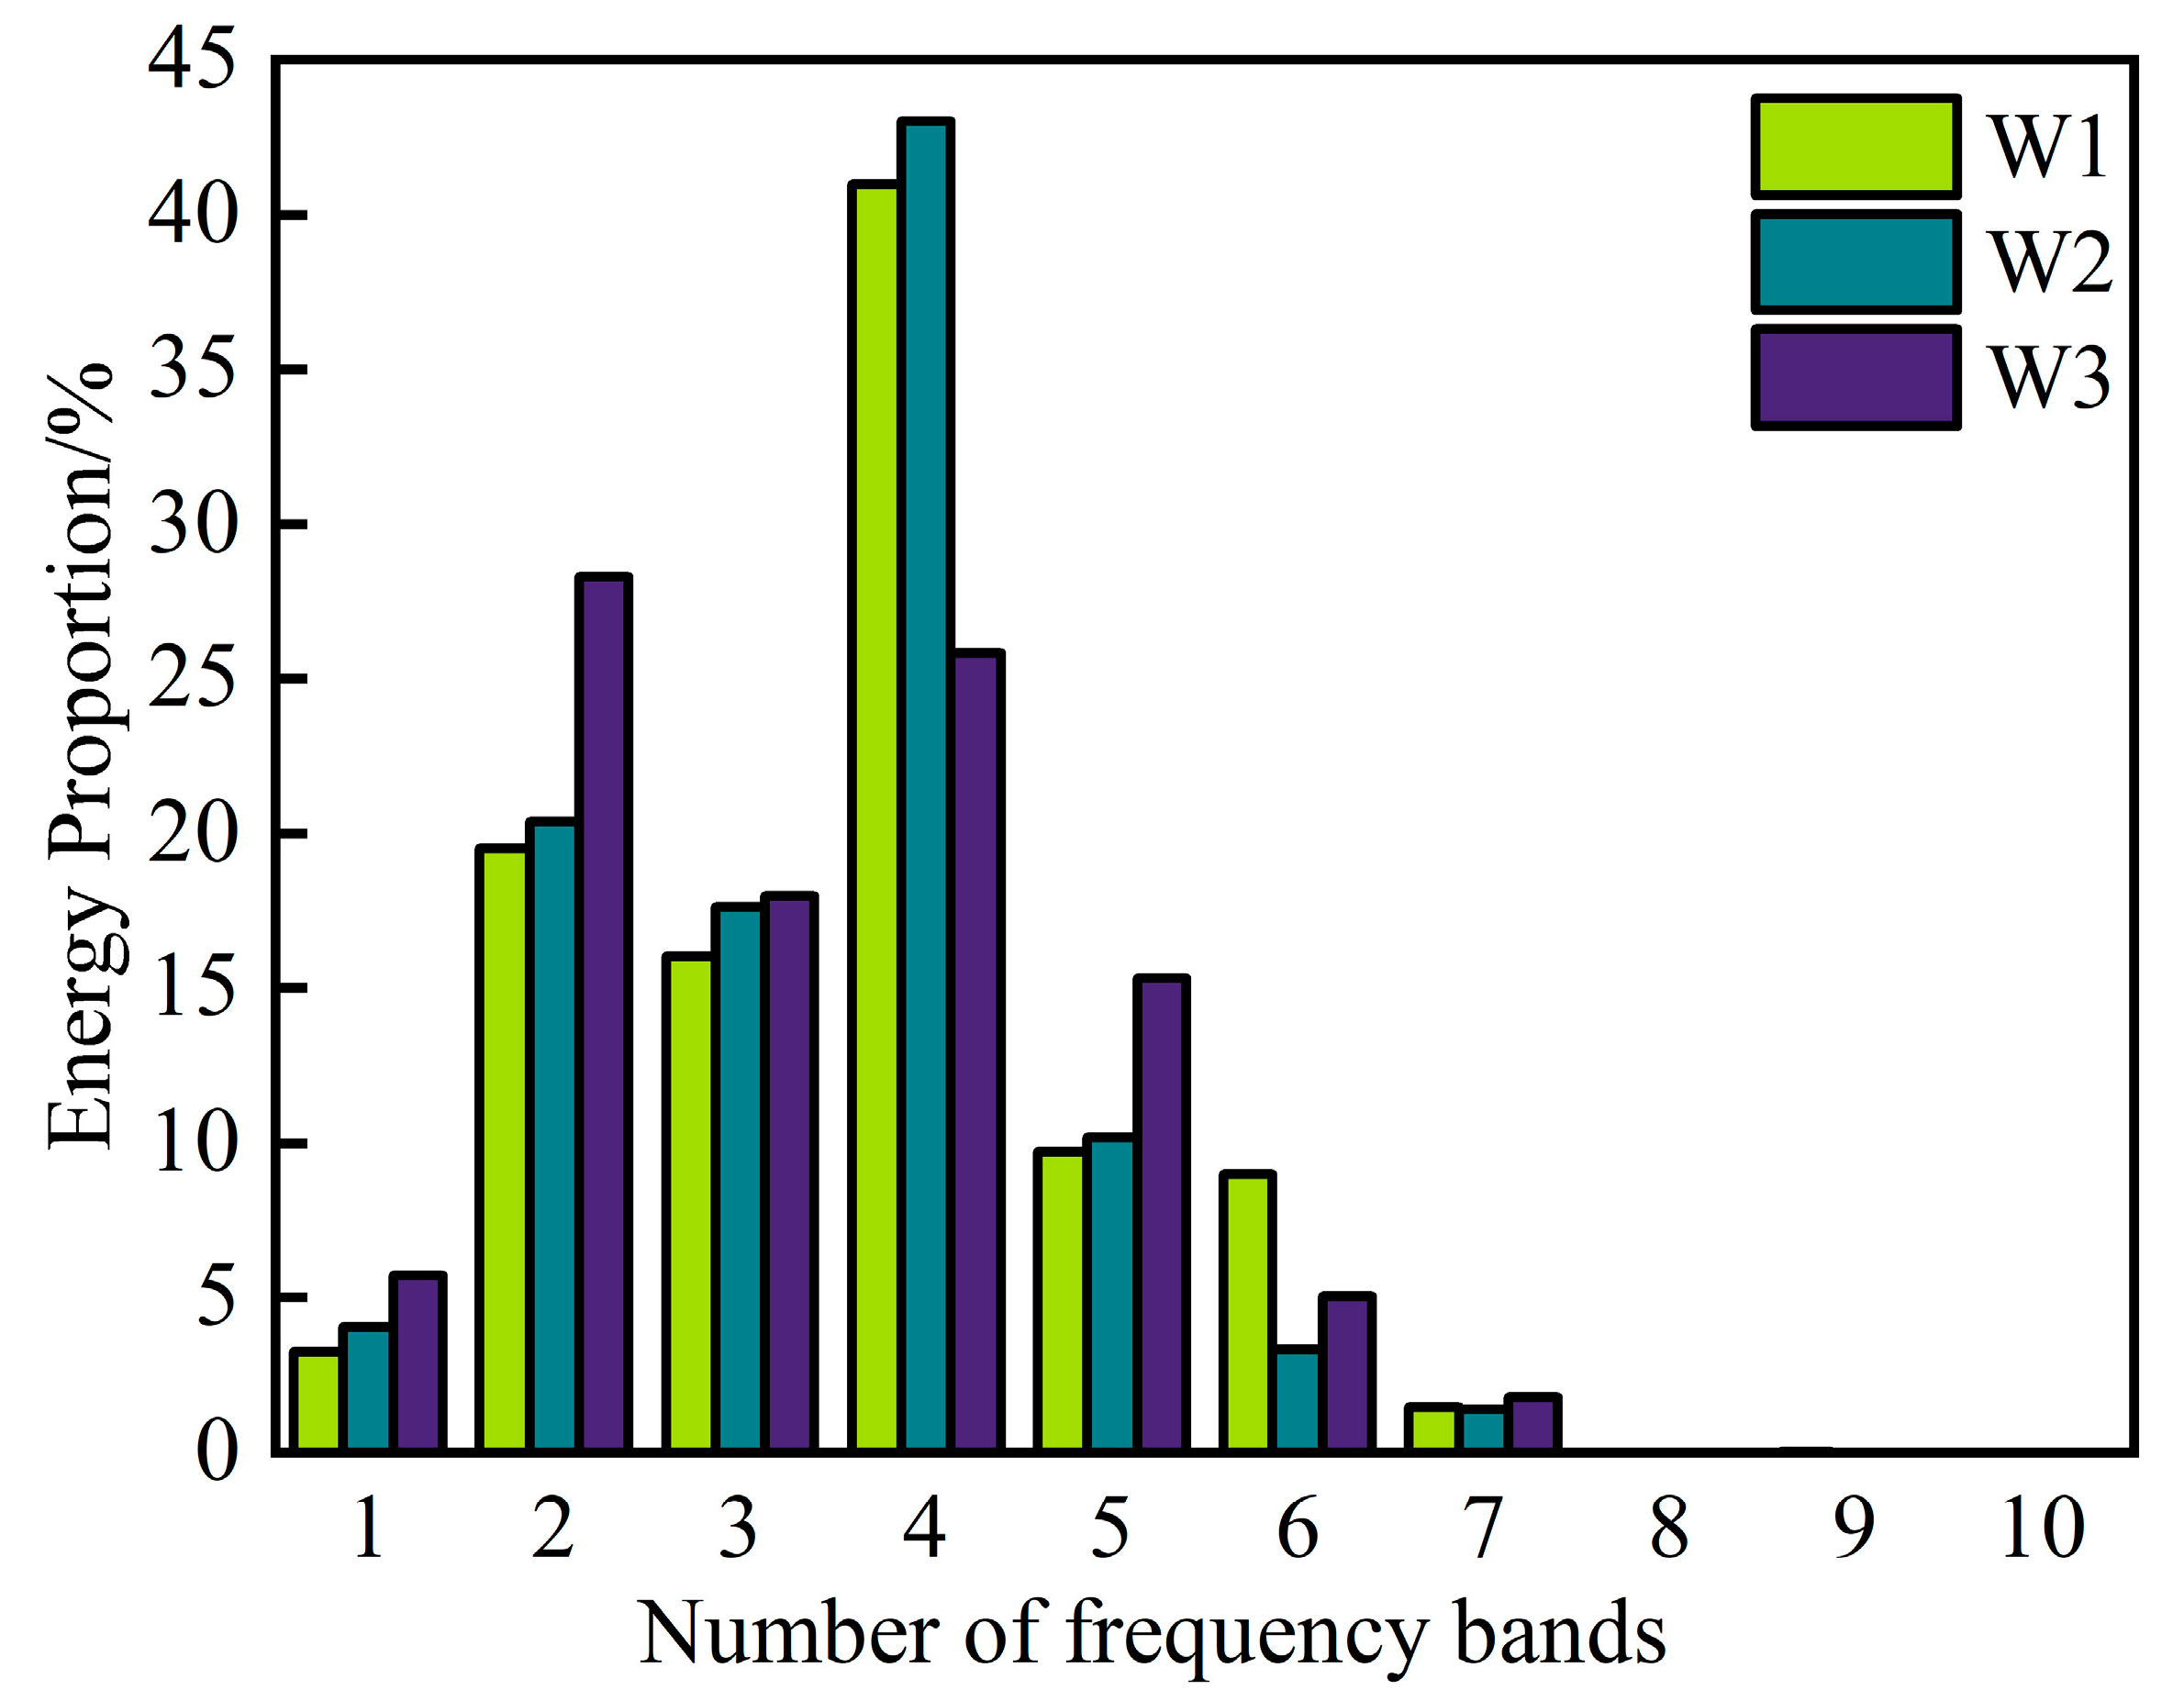
The energy proportion of the horizontal radial signal is shown in Figure 19. The maximum energy proportion of W1 and W2 signals is mainly concentrated in the band of 19.5313–39.0625 Hz, whereas the W3 signals are mainly concentrated in the band of 4.8828–9.7656 Hz. As the blasting wave propagation distance gradually increases, the energy gradually concentrates towards the lower-frequency bands, which are close to the intrinsic frequency of the structure. This is more likely to cause structural resonance, which is more harmful. The energy of the blasting waves at different monitoring points on the wall components is primarily below 312.5 Hz, with the peak energy of the W1 and W2 signals distributed in the 19.5313~39.0625 Hz band and the peak energy of the W3 signal distributed in the 4.8828~9.7656 Hz band.
The instantaneous energy spectrum of the brick wall monitoring points is shown in Figure 20. As illustrated, the instantaneous energy peak at different monitoring points varies significantly. Point W1 has the highest instantaneous energy peak of 0.147 J, while Point W3 has the lowest, 0.076 J. The instantaneous energy peaks at different points typically appear after 0.5 s due to the residual instantaneous energy following the initial wave. This residual energy is further amplified by the superposition effect of blasting waves from other boreholes. The vibration velocities at different points do not coincide with the timing of the instantaneous energy peaks, indicating that the instantaneous energy is influenced by the PPV, its duration, and the main frequency.

4. Dynamic Response of a Building Under Blasting Vibration

4.1. Numerical Model Establishment

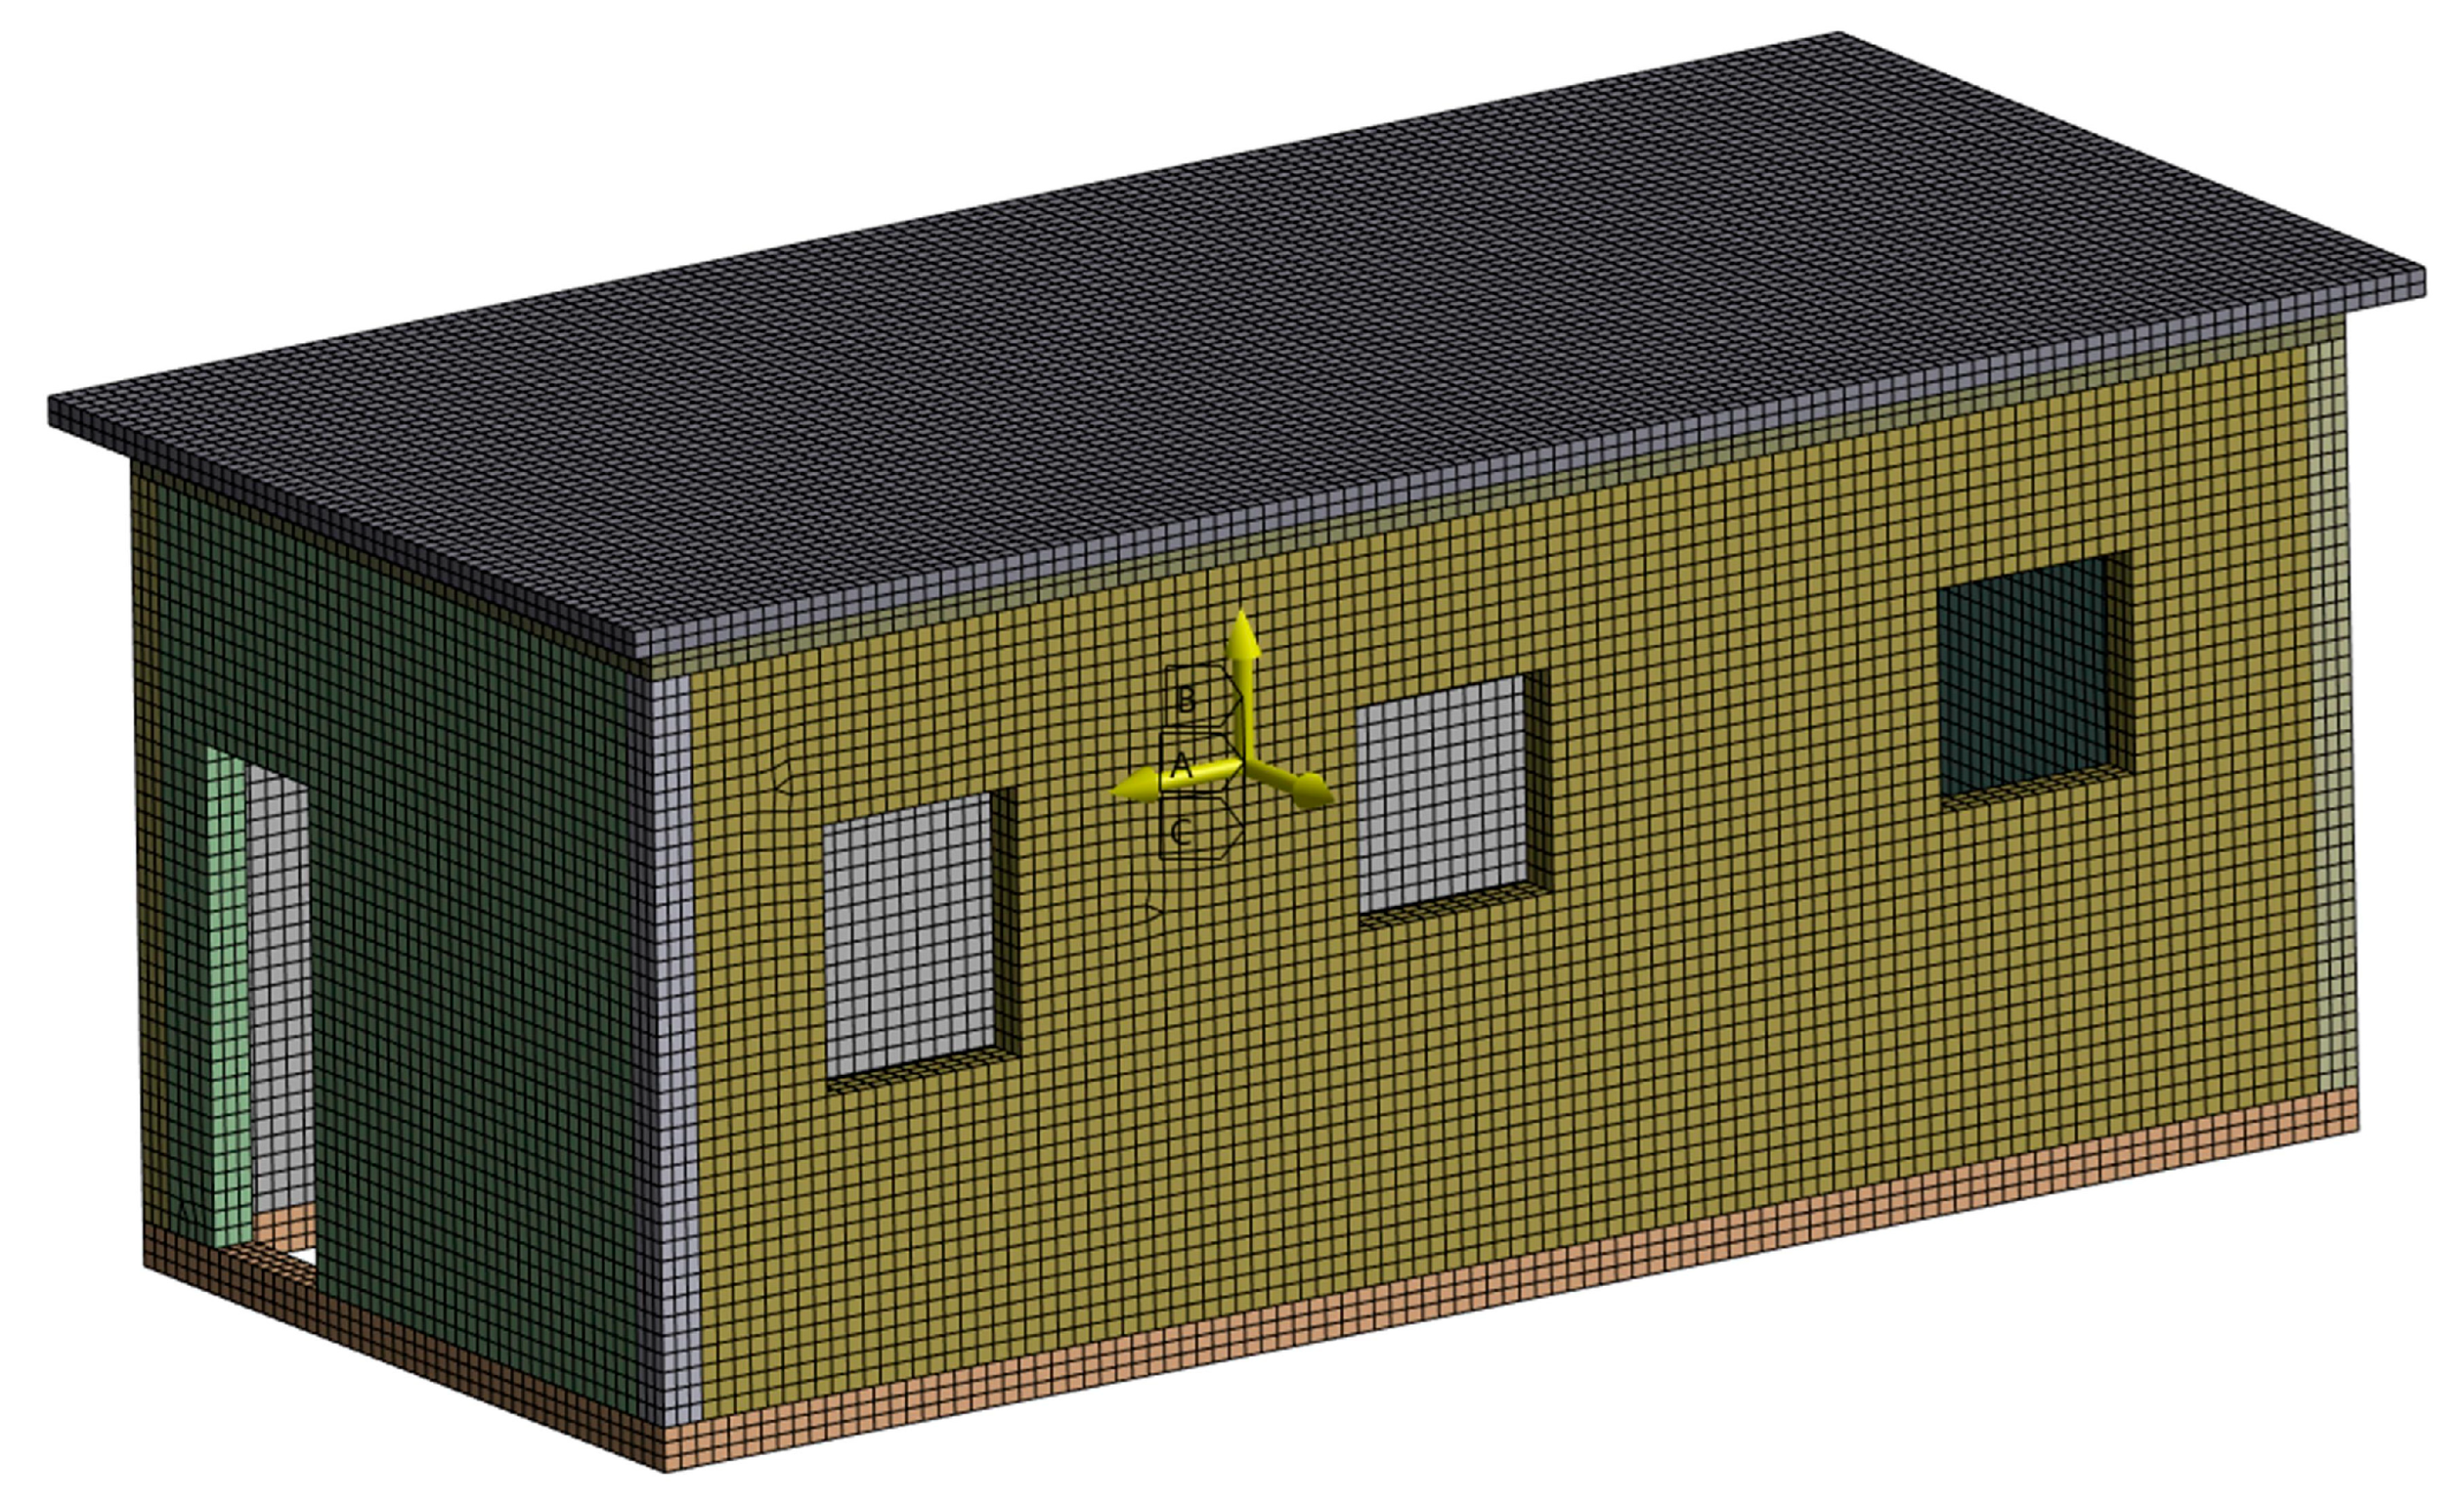
Based on the actual dimensions of the brick–concrete structure, a three-dimensional numerical model (14.4 m × 4.7 m × 4.2 m) was established to study the dynamic response of the house under blasting vibration. The numerical simulation software used was ANSYS 2024 R2. The finite element type was SOLID 186 three-dimensional high-order solid cells. The three-dimensional numerical model is shown in Figure 21.
The numerical model consists of components such as ring beams, walls, columns, and roofs. The walls are solid masonry walls, with beams and columns having a cross-sectional size of 240 mm × 240 mm. The inner and outer walls are 240 mm thick, and the floor slab is 100 mm thick. The material of the numerical model is C30 concrete, a linear elastic isotropic material with an elastic modulus of 30 GPa, a Poisson’s ratio of 0.15, and a density of 2700 kg/m3. The masonry has a density of 1900 kg/m3, an elastic modulus of 27 GPa, and a Poisson’s ratio of 0.15. A hexahedral mesh was created for the numerical model. In order to balance the computational accuracy and resources, the mesh size was set to 10 cm. Each part of the house was simulated as a whole connection using Bonded Contact. The bottom of the numerical model was fixedly supported. Dynamic loads were applied in the horizontal radial direction, horizontal tangential direction, and vertical direction. The mesh division and loading-added way of the numerical model is shown in Figure 22.

4.2. Harmonic Response Analysis of Building Components and Identification of Natural Frequency

4.2.1. Harmonic Response Analysis of House Components

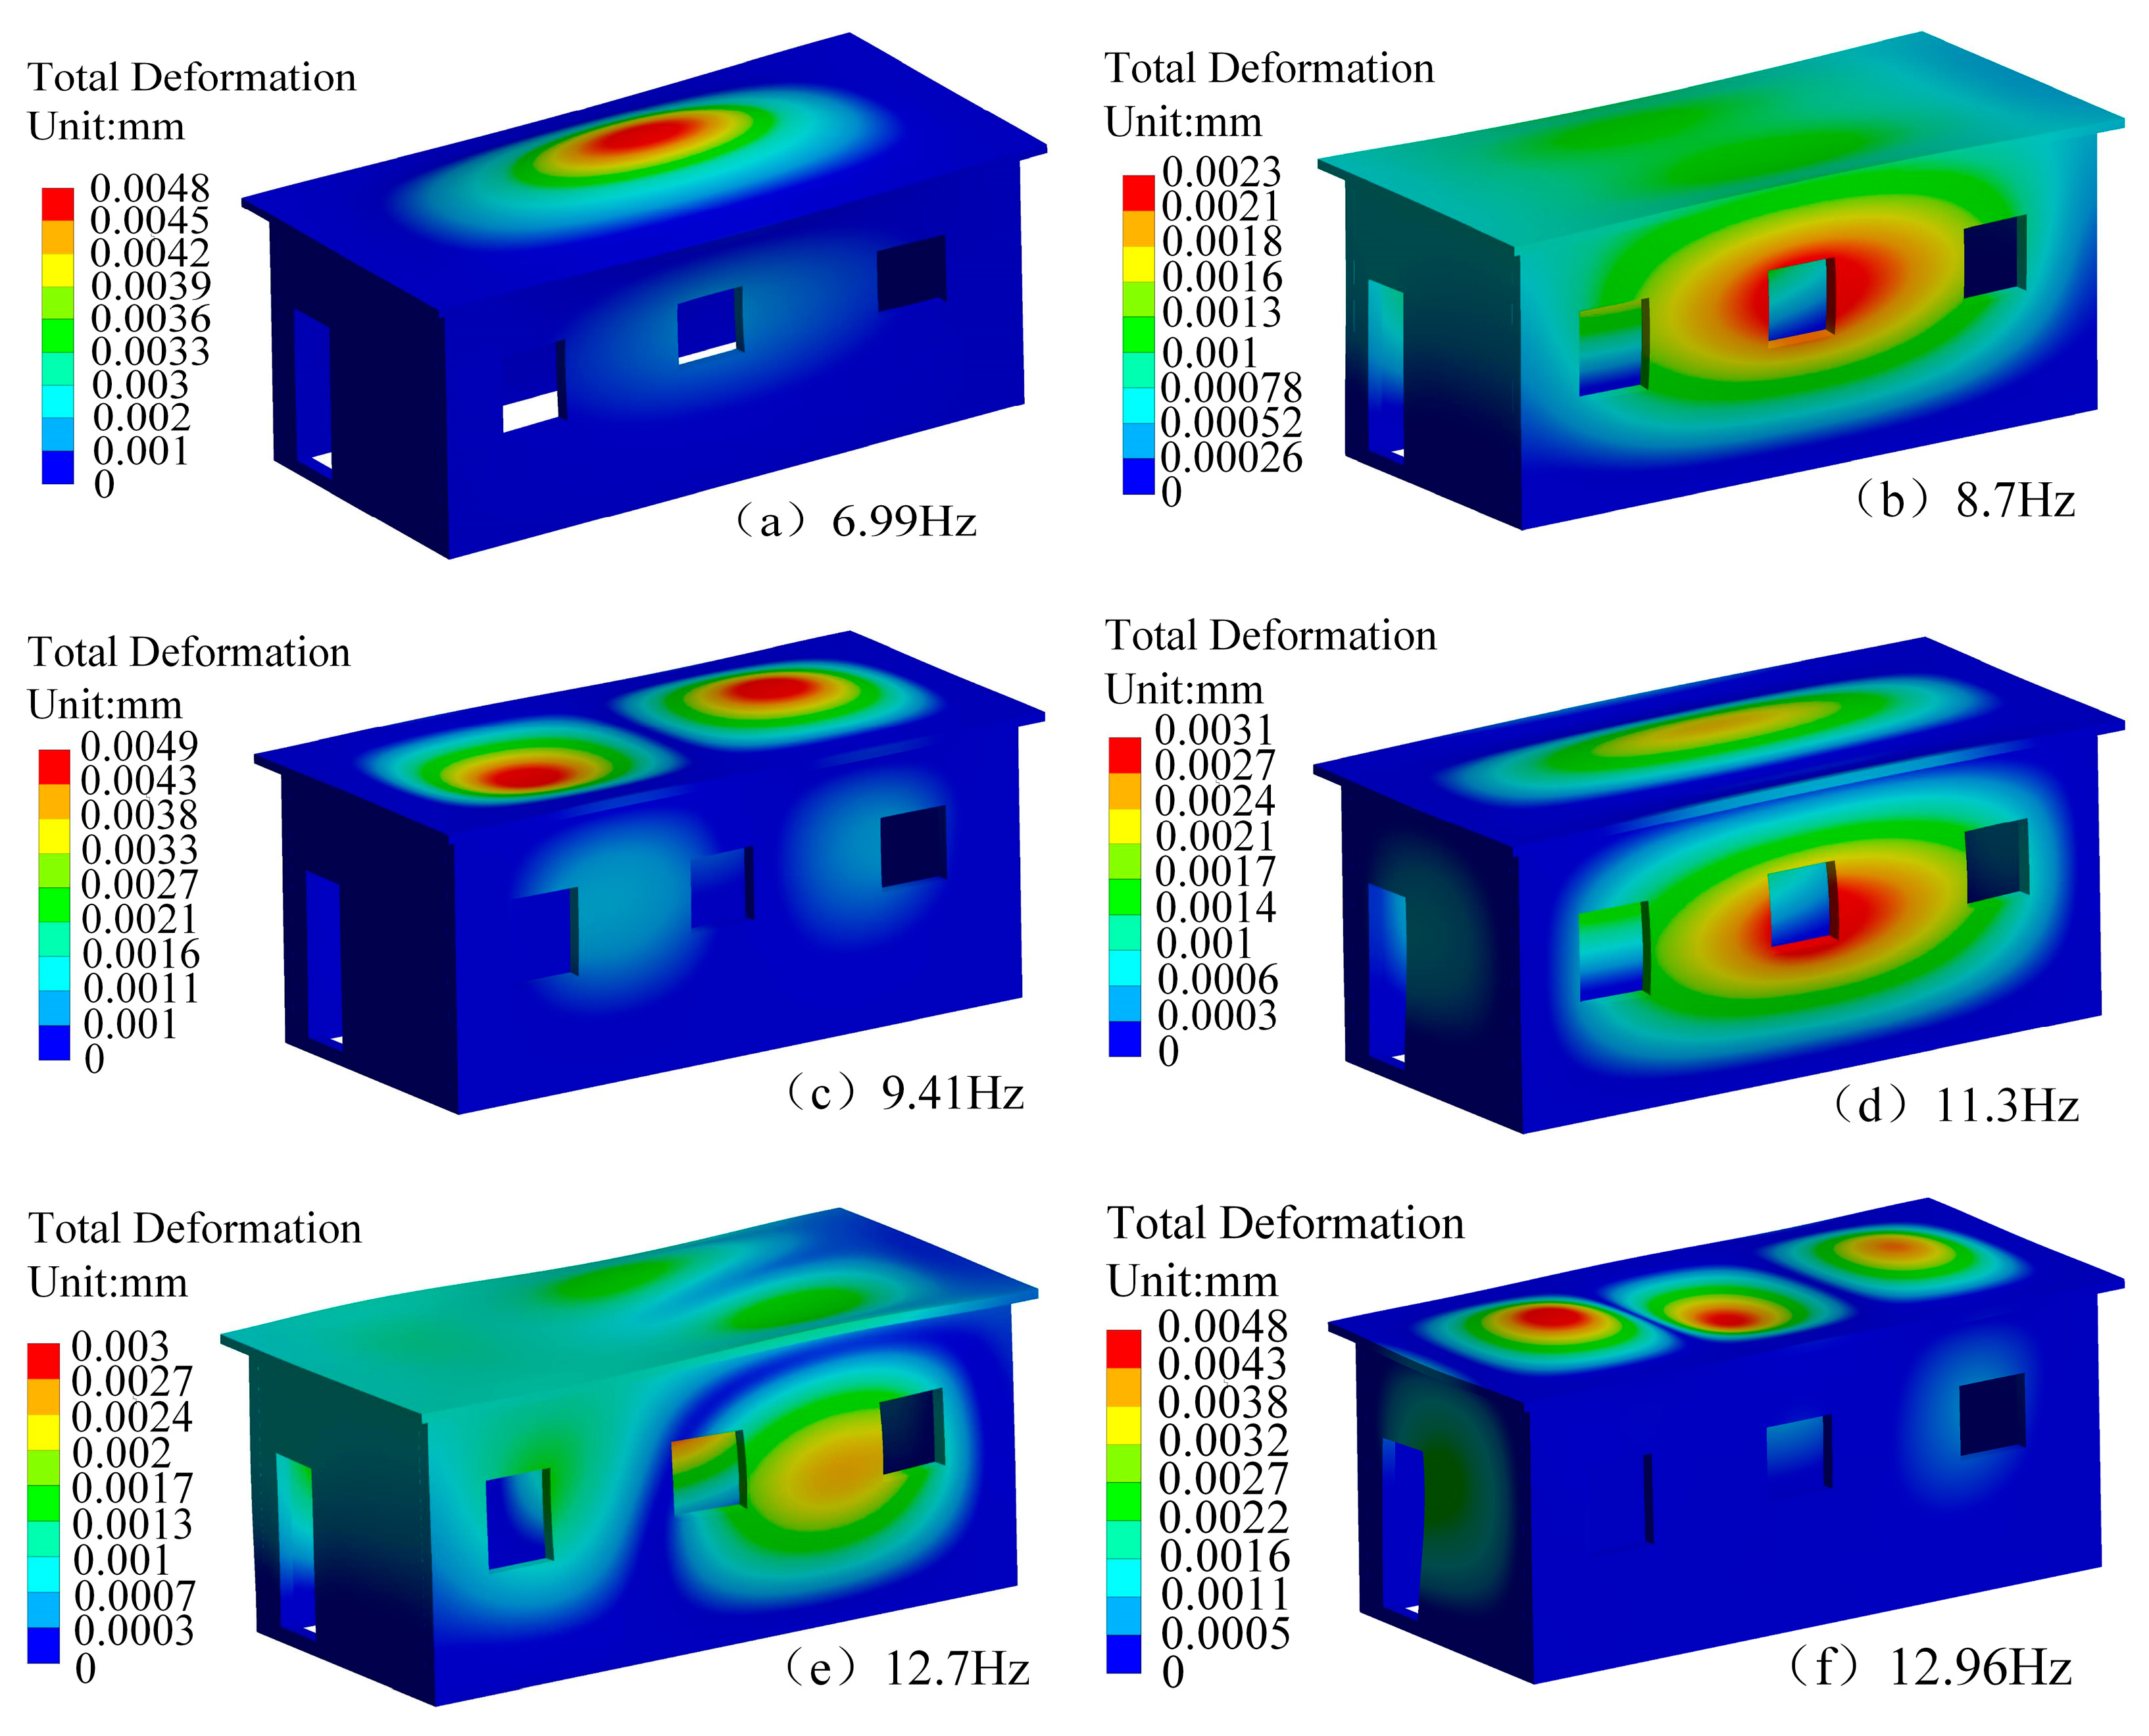
Modal analysis is a fundamental method in dynamic analysis, capable of determining the natural frequencies and corresponding modes [21,22]. By applying zero-displacement constraints to the bottom of the ground beam in the numerical model, modal analysis is performed to obtain the natural frequency and mode of the building. The first ten natural frequencies of the building are listed in Table 5.
The first ten mode shapes of the house are shown in Figure 23. According to Table 6, the natural frequencies of the house increase from 6.99 Hz at the first order to 15.32 Hz at the tenth order. To prevent resonance between the blasting vibration and the building structure, the blasting vibration frequency should not be close to the natural frequencies of the house. As shown in Table 6 and Figure 23, the gate wall mainly exhibits horizontal radial deformation, while the window wall and longitudinal walls mainly exhibit horizontal tangential deformation. The roof primarily shows vertical deformation. This is because the gate wall and transverse walls have greater horizontal radial freedom, the window wall and longitudinal walls have greater horizontal tangential freedom, and the roof has a larger vertical freedom.
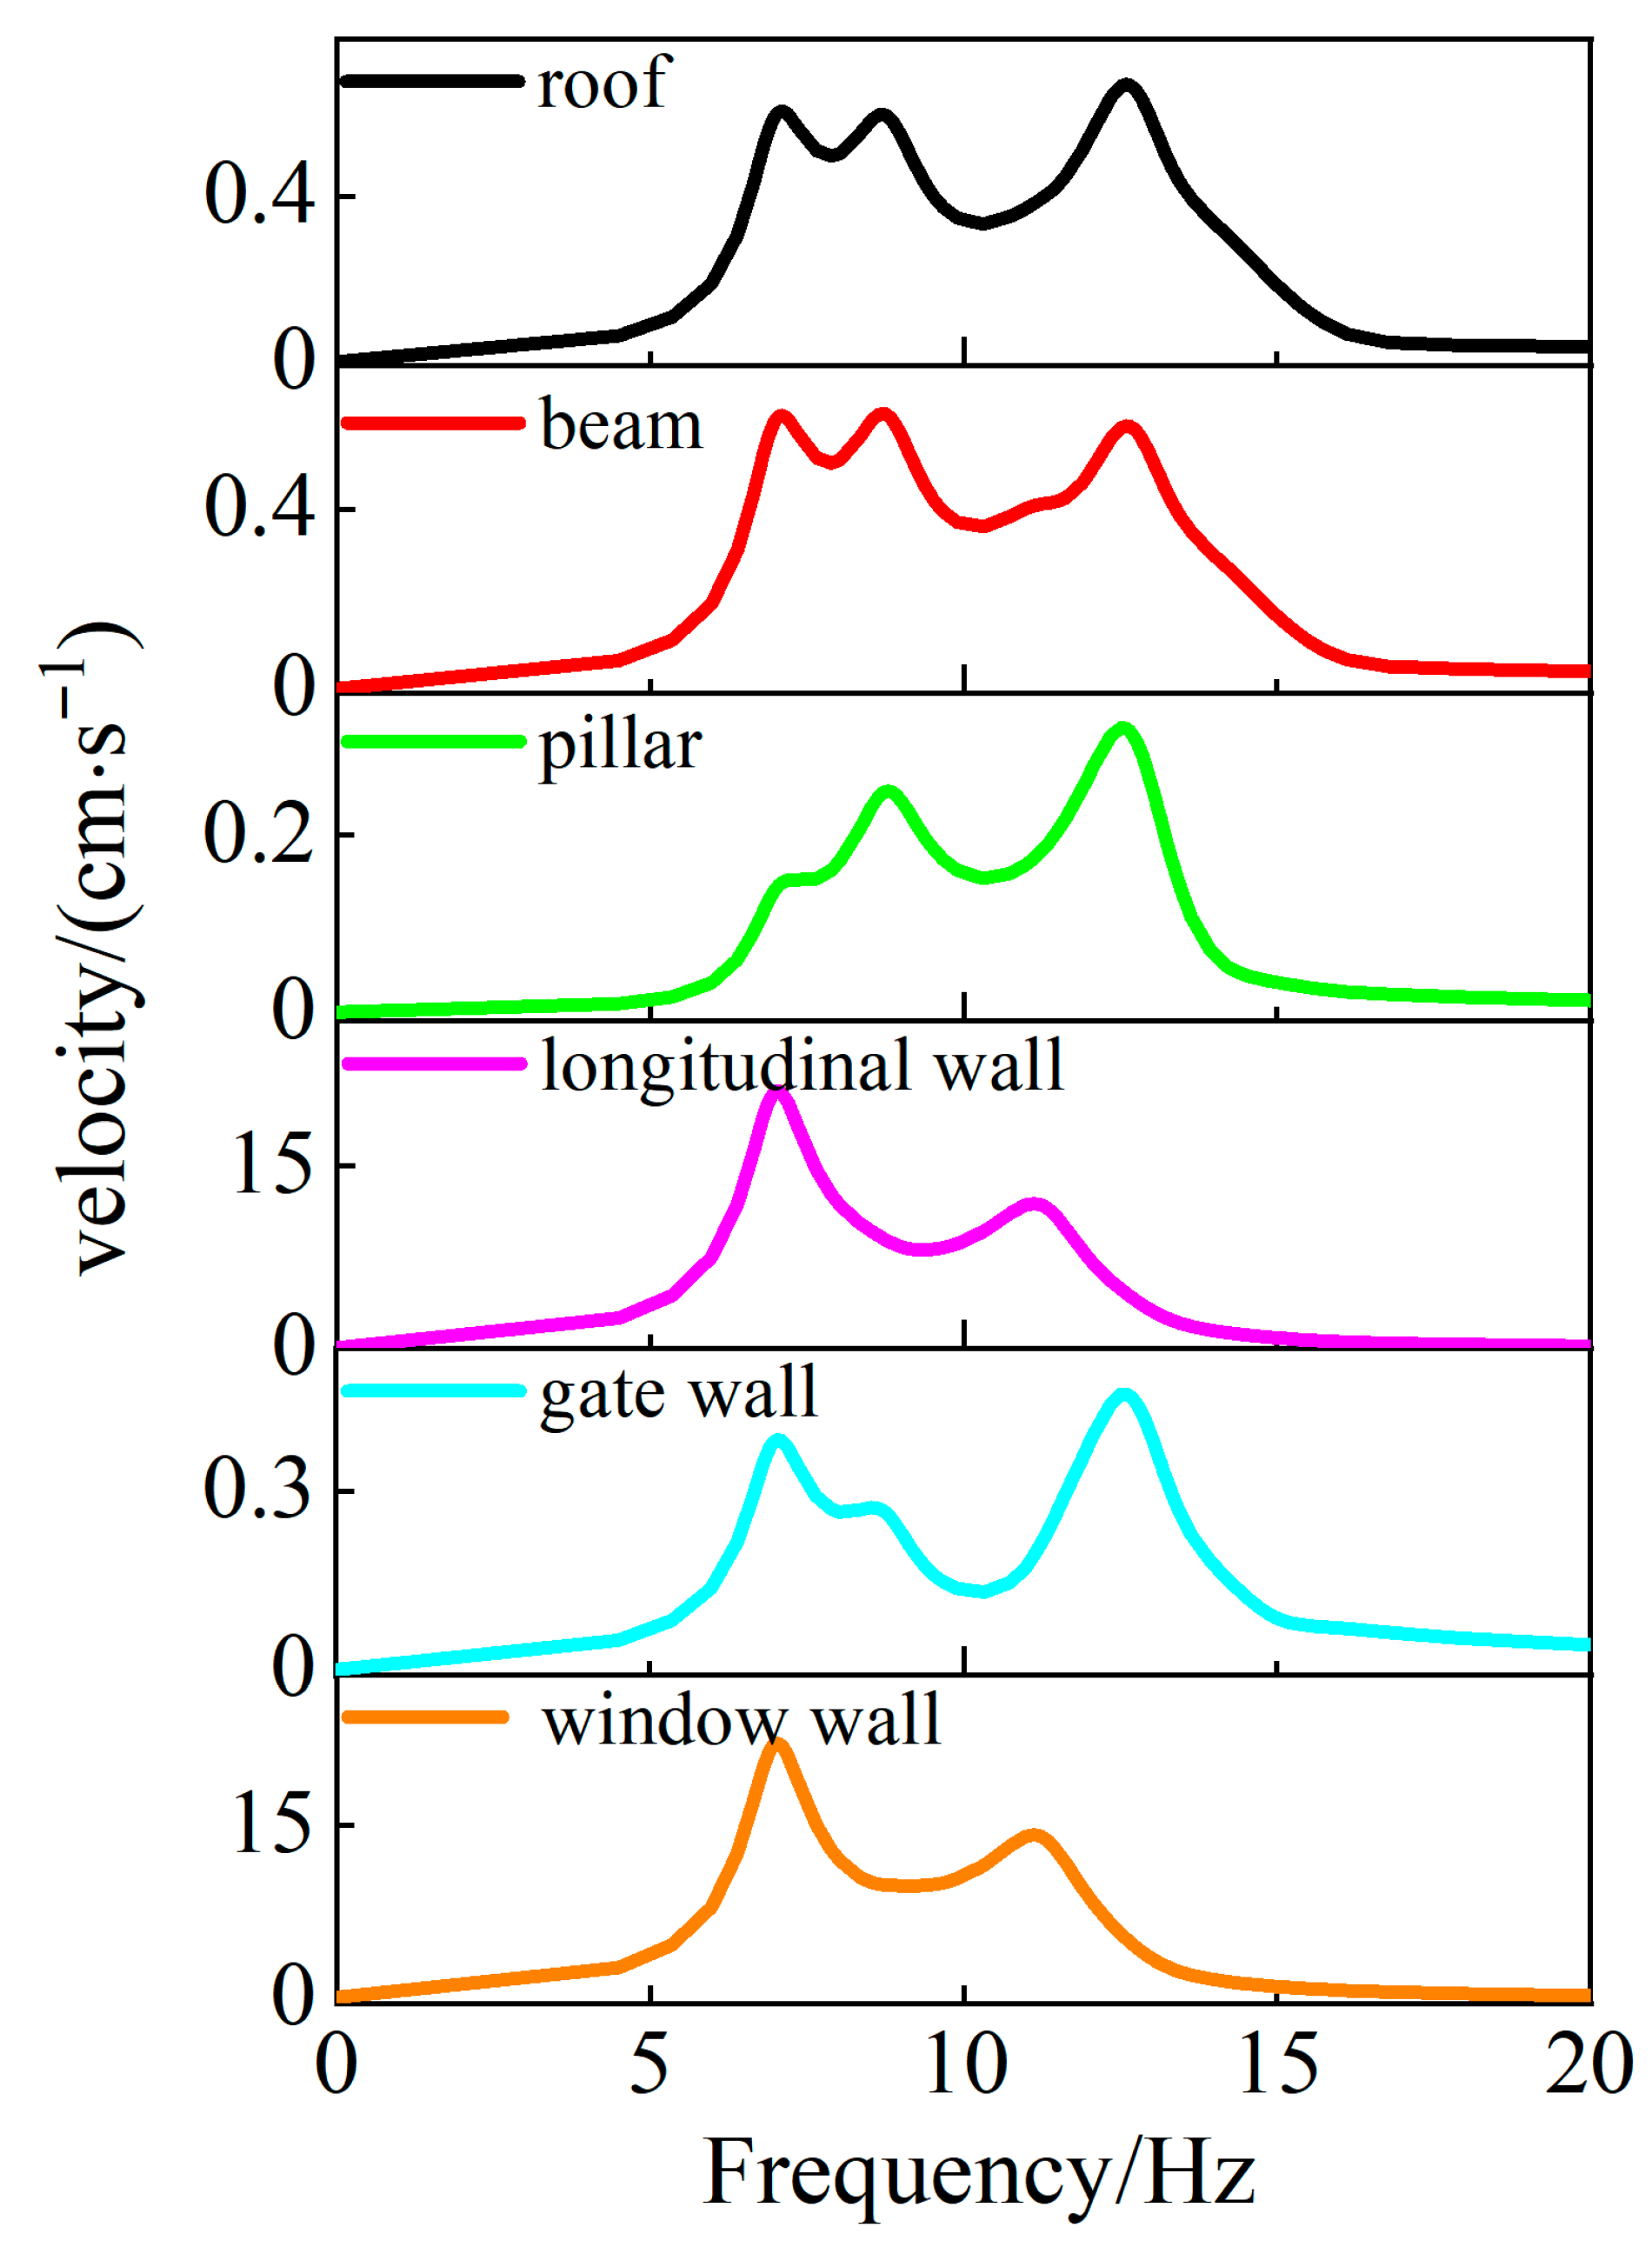
The main frequency of the blasting waves from open-pit deep-hole blasting ranges from 10 to 60 Hz. As shown in Table 6, the first ten natural frequencies of the house are between 6 and 16 Hz, which overlaps with the main frequency of the blasting waves from open-pit deep-hole blasting. Therefore, it is necessary to study the vibration response of the house under different loads using harmonic response analysis. This paper uses the modal superposition method to conduct harmonic response analysis on the house using the ANSYS numerical simulation platform. The harmonic response analysis covers a sweep frequency range of 0–100 Hz, with a load step of 5 Hz, to extract the velocity-frequency response curves of the building components in different directions [23]. The horizontal tangential response curves of different components are shown in Figure 24. The PPV and corresponding frequencies of different components are shown in Table 6.
As indicated in Table 6, the horizontal radial PPV of gate walls and columns are relatively high, while the horizontal tangential PPV of window walls and longitudinal walls are higher. The vertical PPV of the roof are also significant, which aligns with the deformation analysis of the house’s modal behavior. However, the peak values of certain components at specific frequencies have significantly increased. According to Figure 23 and Table 6, when the mode direction is aligned with the excitation direction, the components tend to exhibit more pronounced responses. For instance, the PPV of the window wall in the horizontal tangential direction is approximately 21 times higher than that of the horizontal radial PPV, and the PPV of the gate wall in the horizontal radial direction is approximately 29 times higher than that of the horizontal tangential PPV. Therefore, window walls, gate walls, longitudinal walls, and the roof can be considered as hazardous components of the house. The maximum PPV of the window wall, longitudinal wall, and roof components all correspond to a frequency of 6.991 Hz, indicating that the fundamental frequency significantly influences the dynamic response of the components. As shown in Table 6, under harmonic excitation at frequencies of 6.991 Hz, 11.124 Hz, 11.483 Hz, and 13.138 Hz, the PPV in specific directions of the window wall, door wall, longitudinal wall, and roof increased significantly. This indicates that when the dominant frequency of the blasting seismic wave approaches the house’s natural frequency, the vibration of the structural components is markedly amplified. Based on the house’s vibration mode and its first ten natural frequencies, the frequencies of 6.991 Hz, 11.302 Hz, and 13.202 Hz can be identified as critical or hazardous. Accordingly, the window walls, door walls, longitudinal walls, and roof should be regarded as vulnerable components.

4.2.2. Identification of Natural Frequency of House Components

As can be seen from Table 6 and Figure 24, multiple peaks appear in the response curves of different components. The frequency corresponding to the PPV should be identified to determine whether it is the natural frequency of the component, and the reasons for the peaks appearing in the component should be analyzed.
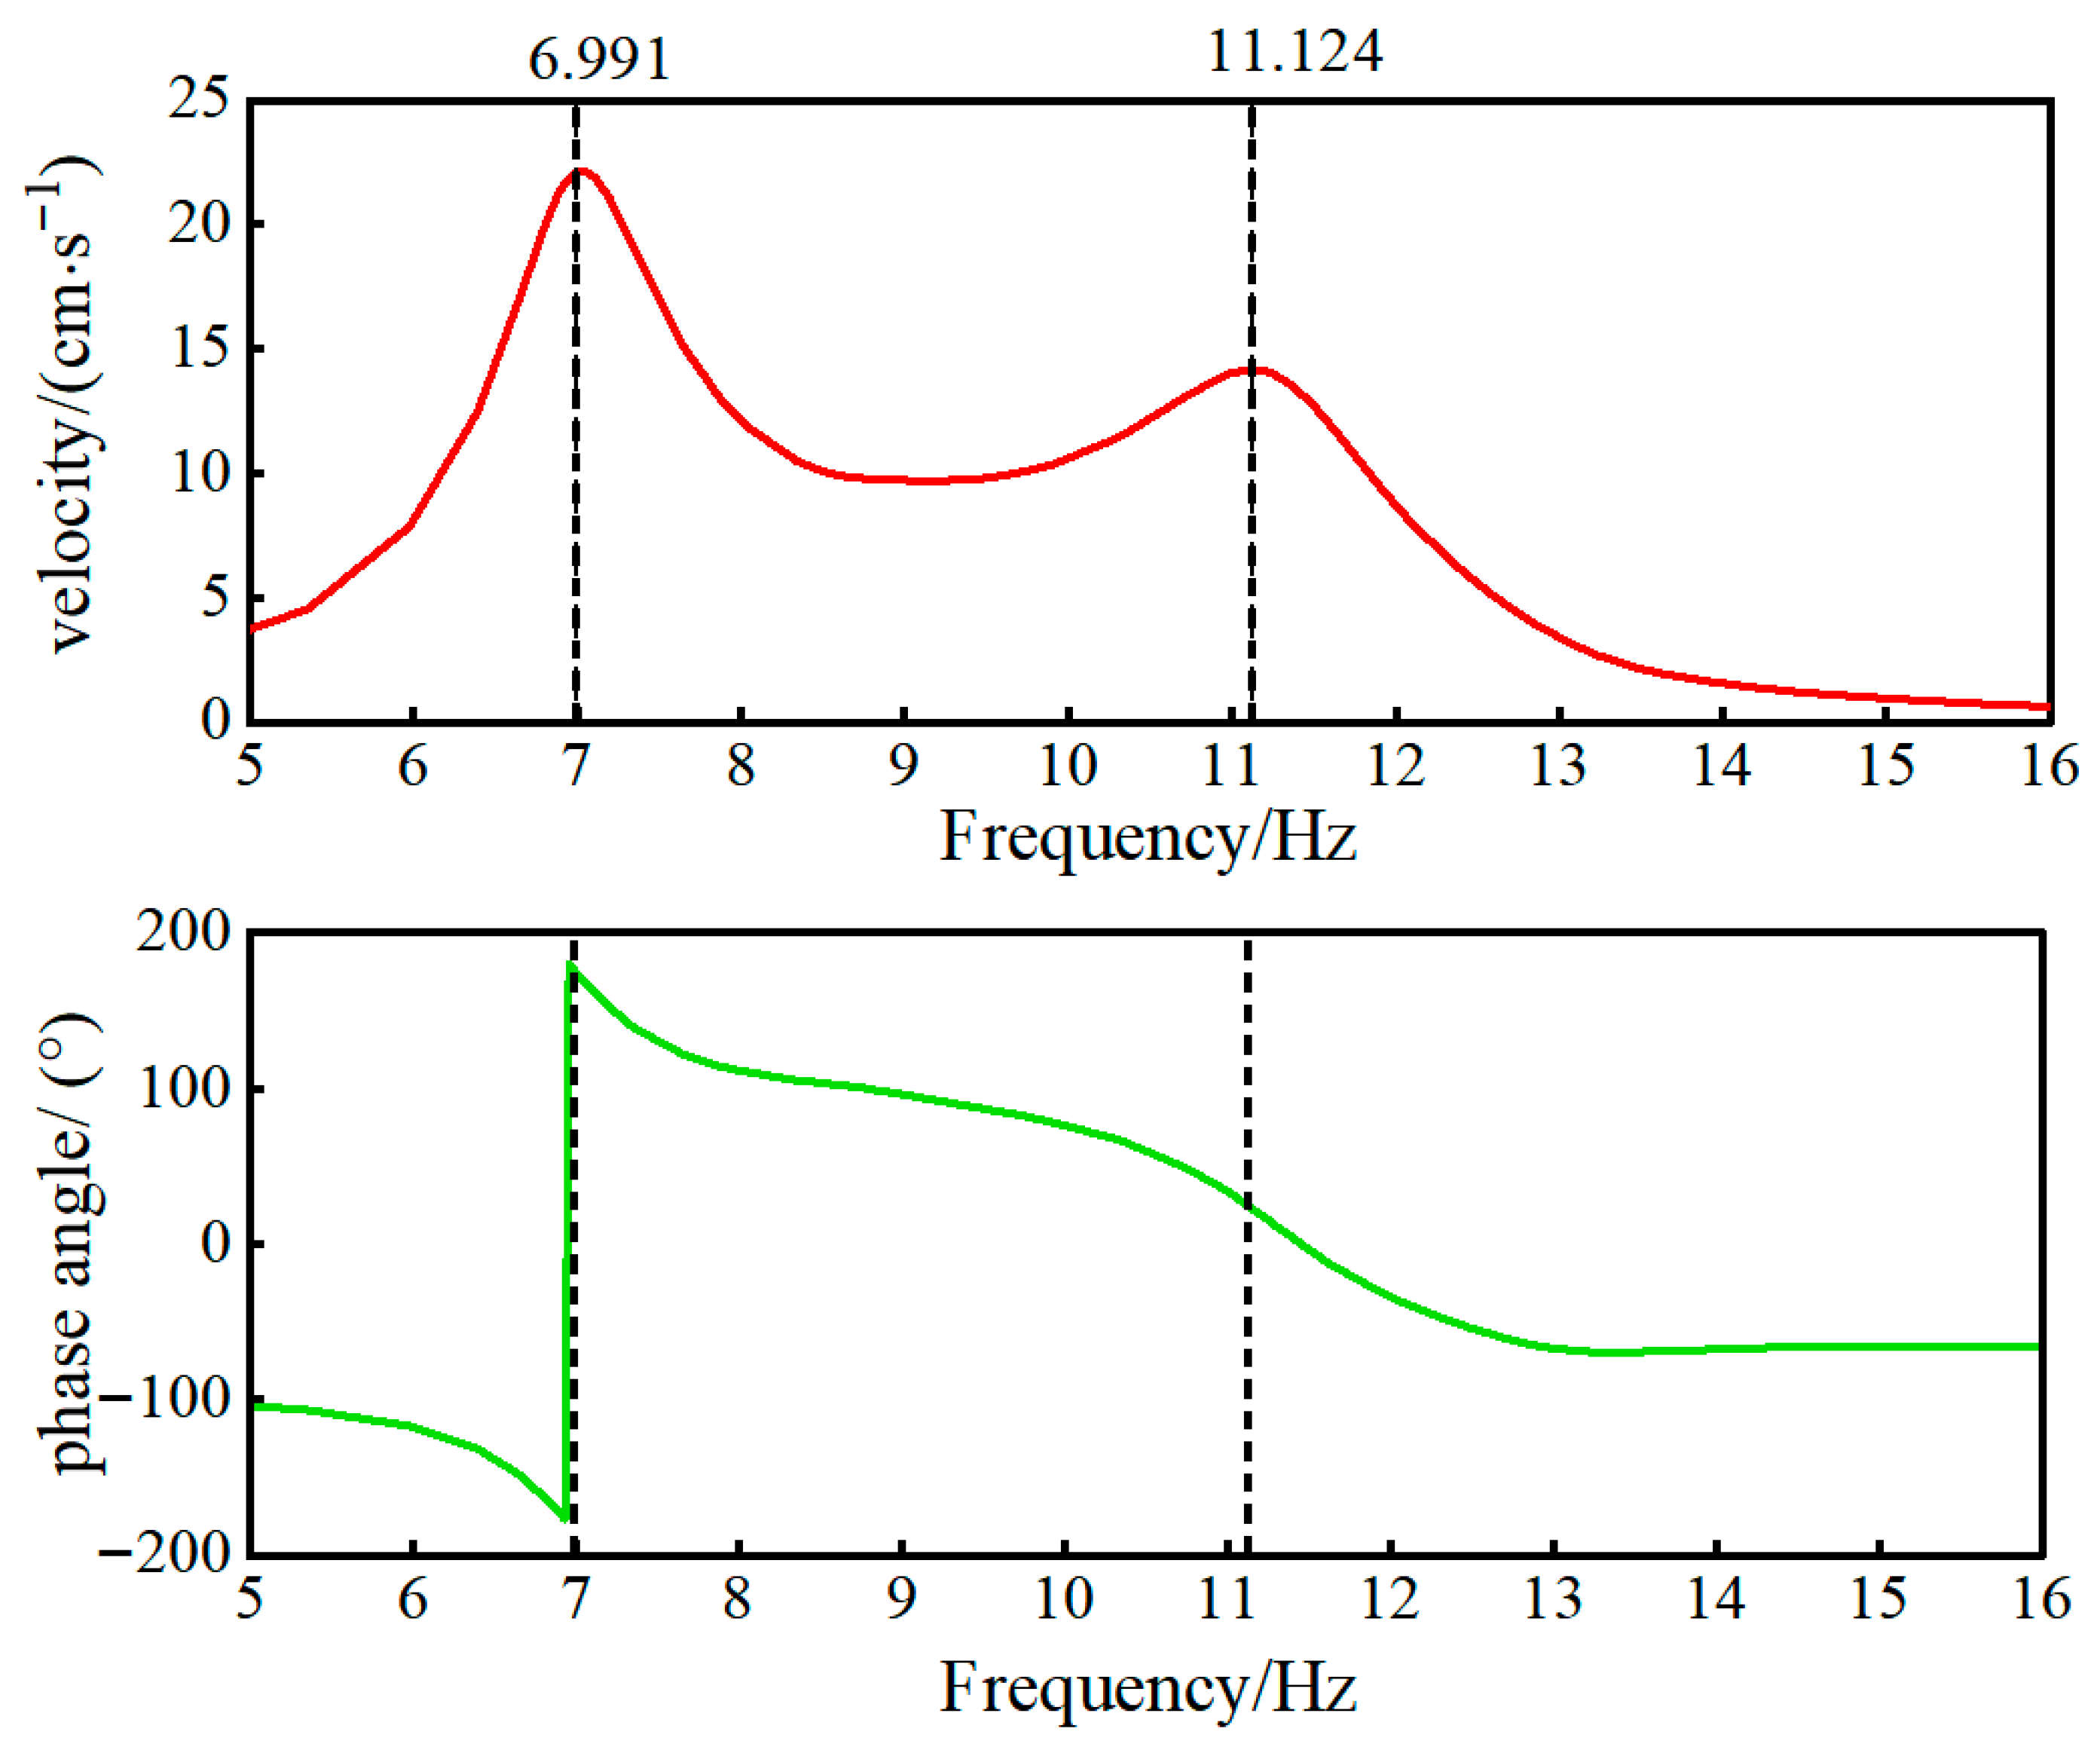
According to the literature [23], when the phase angle corresponding to the PPV of a component changes dramatically to around 180°, it can be determined that this is the component’s natural frequency. This can be identified by analyzing the response curves of other components. The natural frequencies of different components are listed in Table 7. Figure 25 shows the ‘vibration velocity-frequency’ response curve and phase angle change for the horizontal tangential direction of the window wall component. As shown in Figure 25, at a frequency of 6.991 Hz, the vibration velocity of the window wall component reaches its peak, with the phase angle rapidly changing from −176.91° to 179.87° (approaching 180°), a change of 356.78° (approaching 360°). Therefore, 6.991 Hz can be considered the natural frequency of the window wall component. At a frequency of 11.124 Hz, the phase angle changes gradually, but the vibration velocity of the window wall component peaks. This may be due to the natural frequency of the longitudinal wall component being 11.483 Hz, which is close to 11.124 Hz. Due to the mutual coupling of spatial vibration systems among the components, the vibration of the longitudinal wall component can drive significant vibrations in the window wall through connections between structures, resulting in two peaks on the response curve.
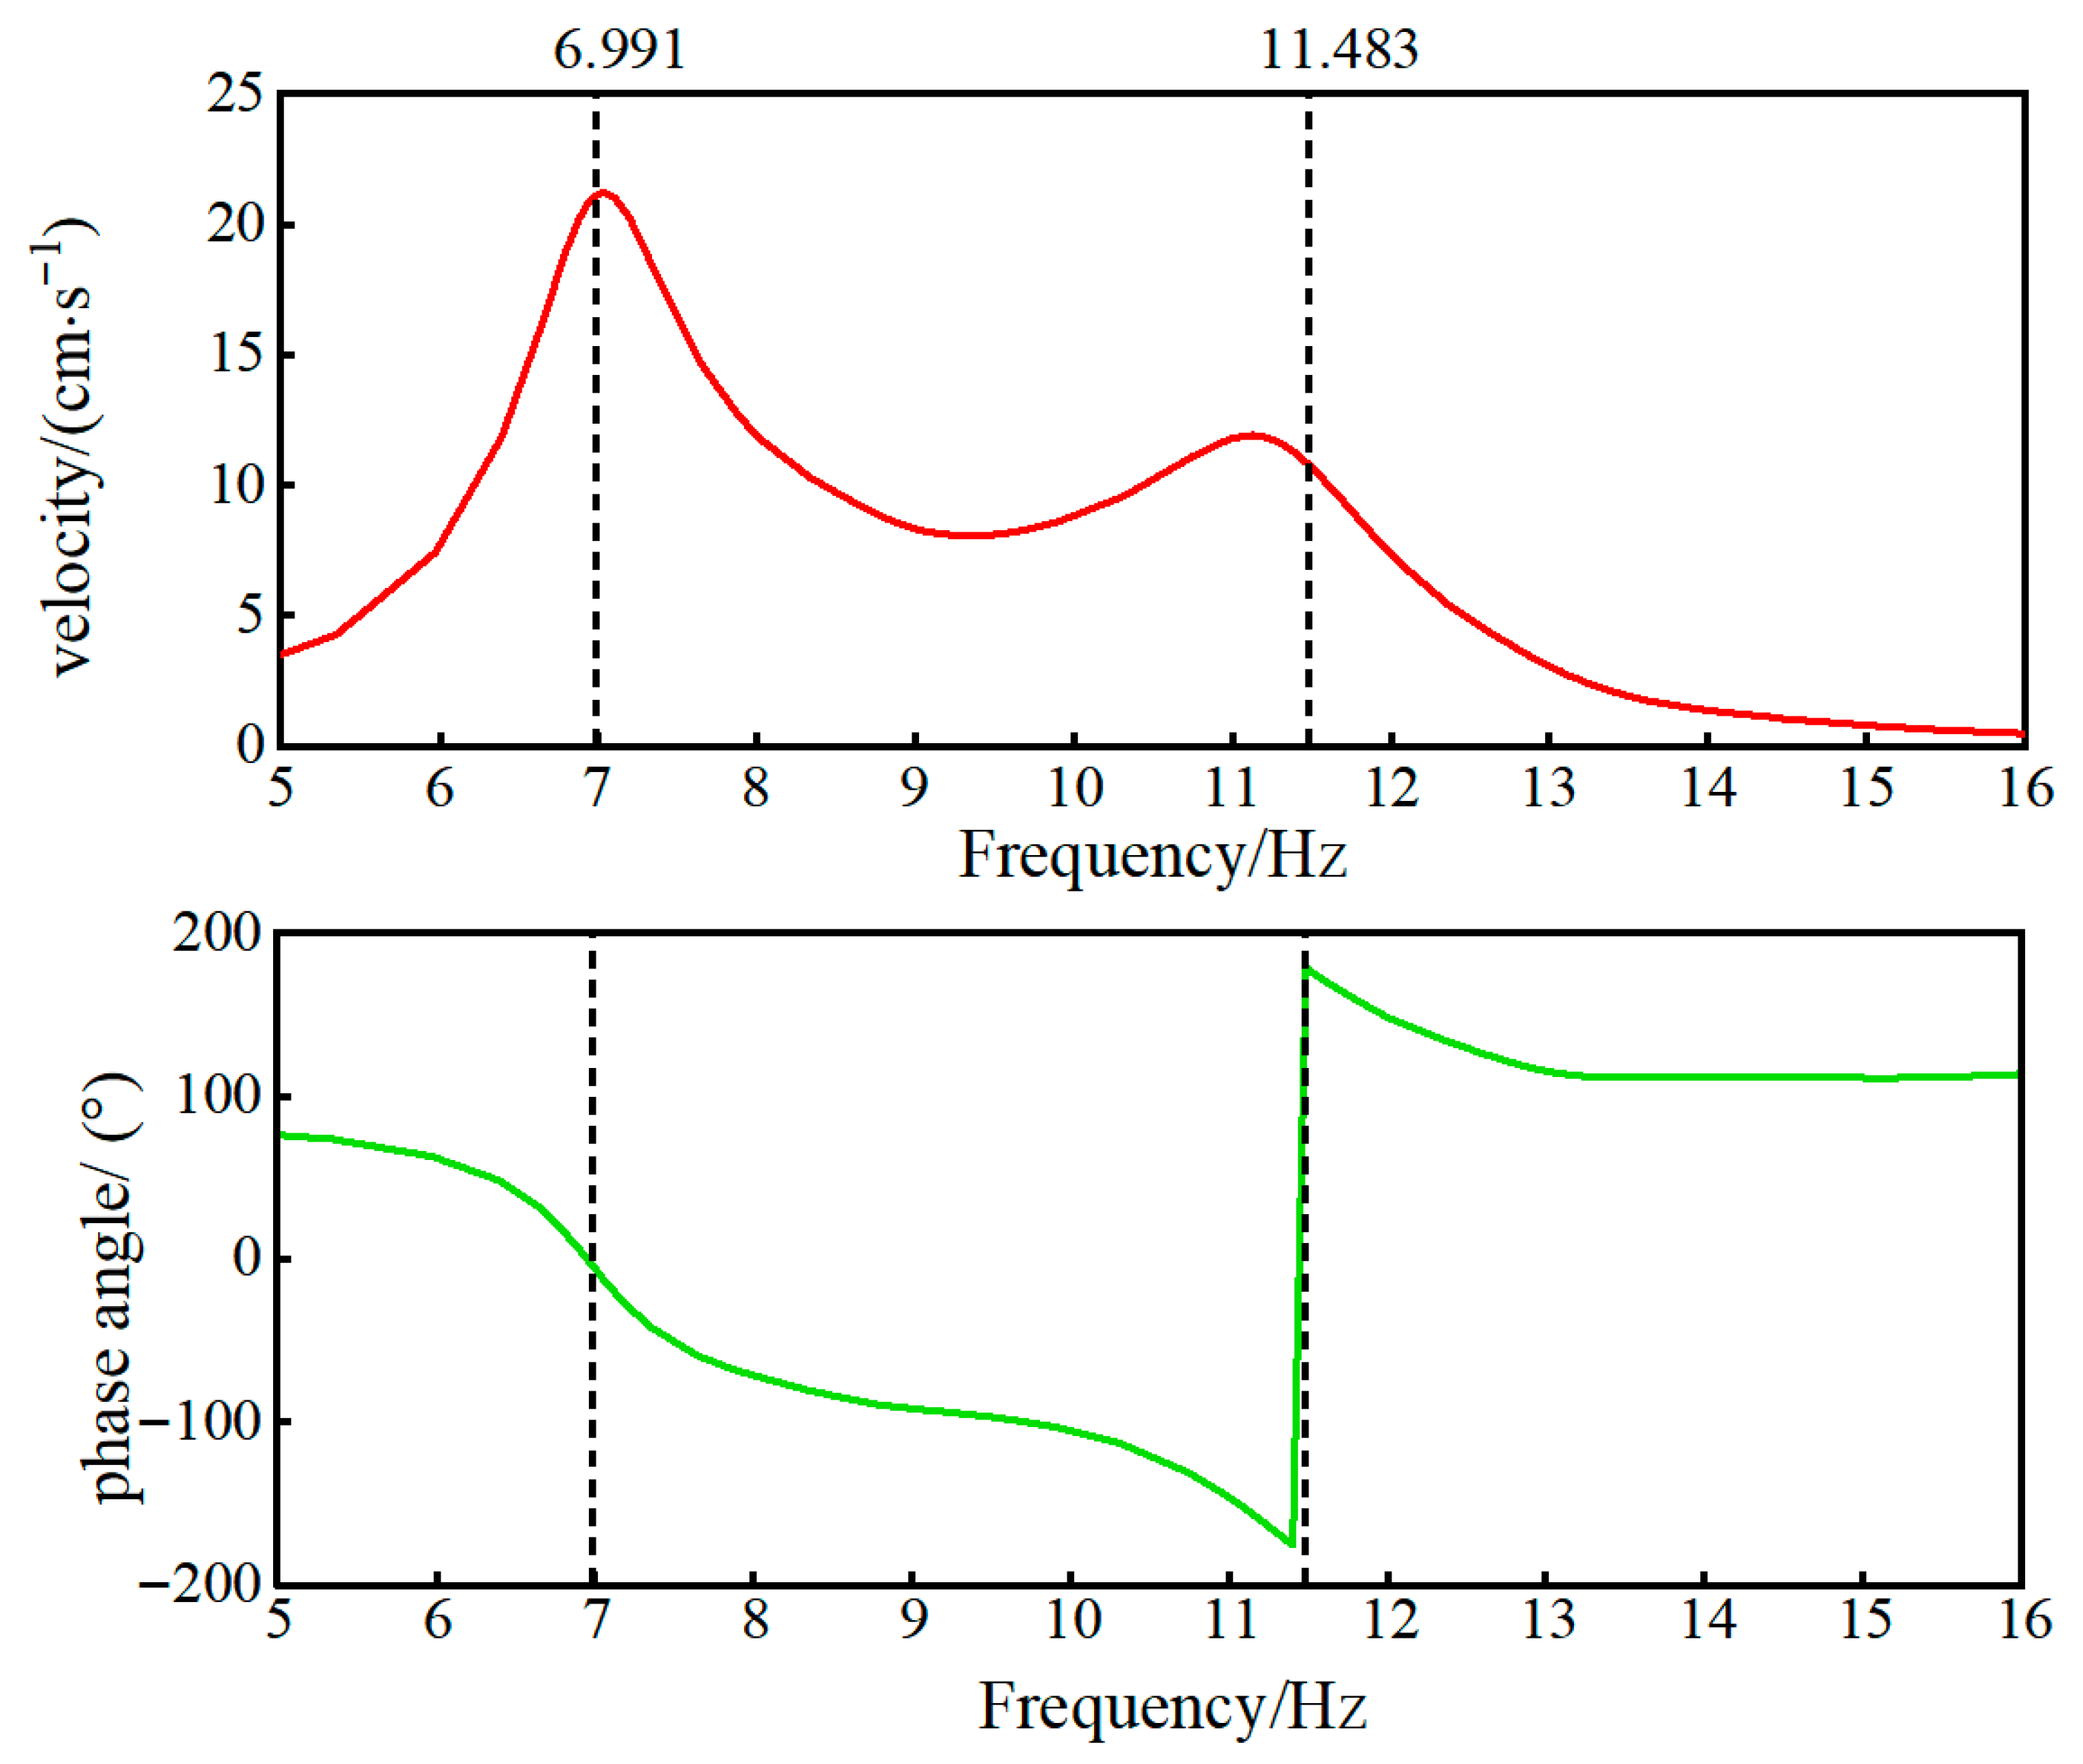
As shown in Table 6 and Table 7, the PPV corresponding to the natural frequency of the component is not the maximum vibration velocity in the response curve. For example, the horizontal tangential response curve and phase angle variation in the longitudinal wall component are illustrated in Figure 26. The frequency 11.483 Hz corresponds to a significant change in the phase angle, indicating that it is the natural frequency. The PPV at this frequency is 10.780 cm/s, while the maximum vibration velocity 21.139 cm/s in the response curve corresponds to a frequency of 6.991 Hz.
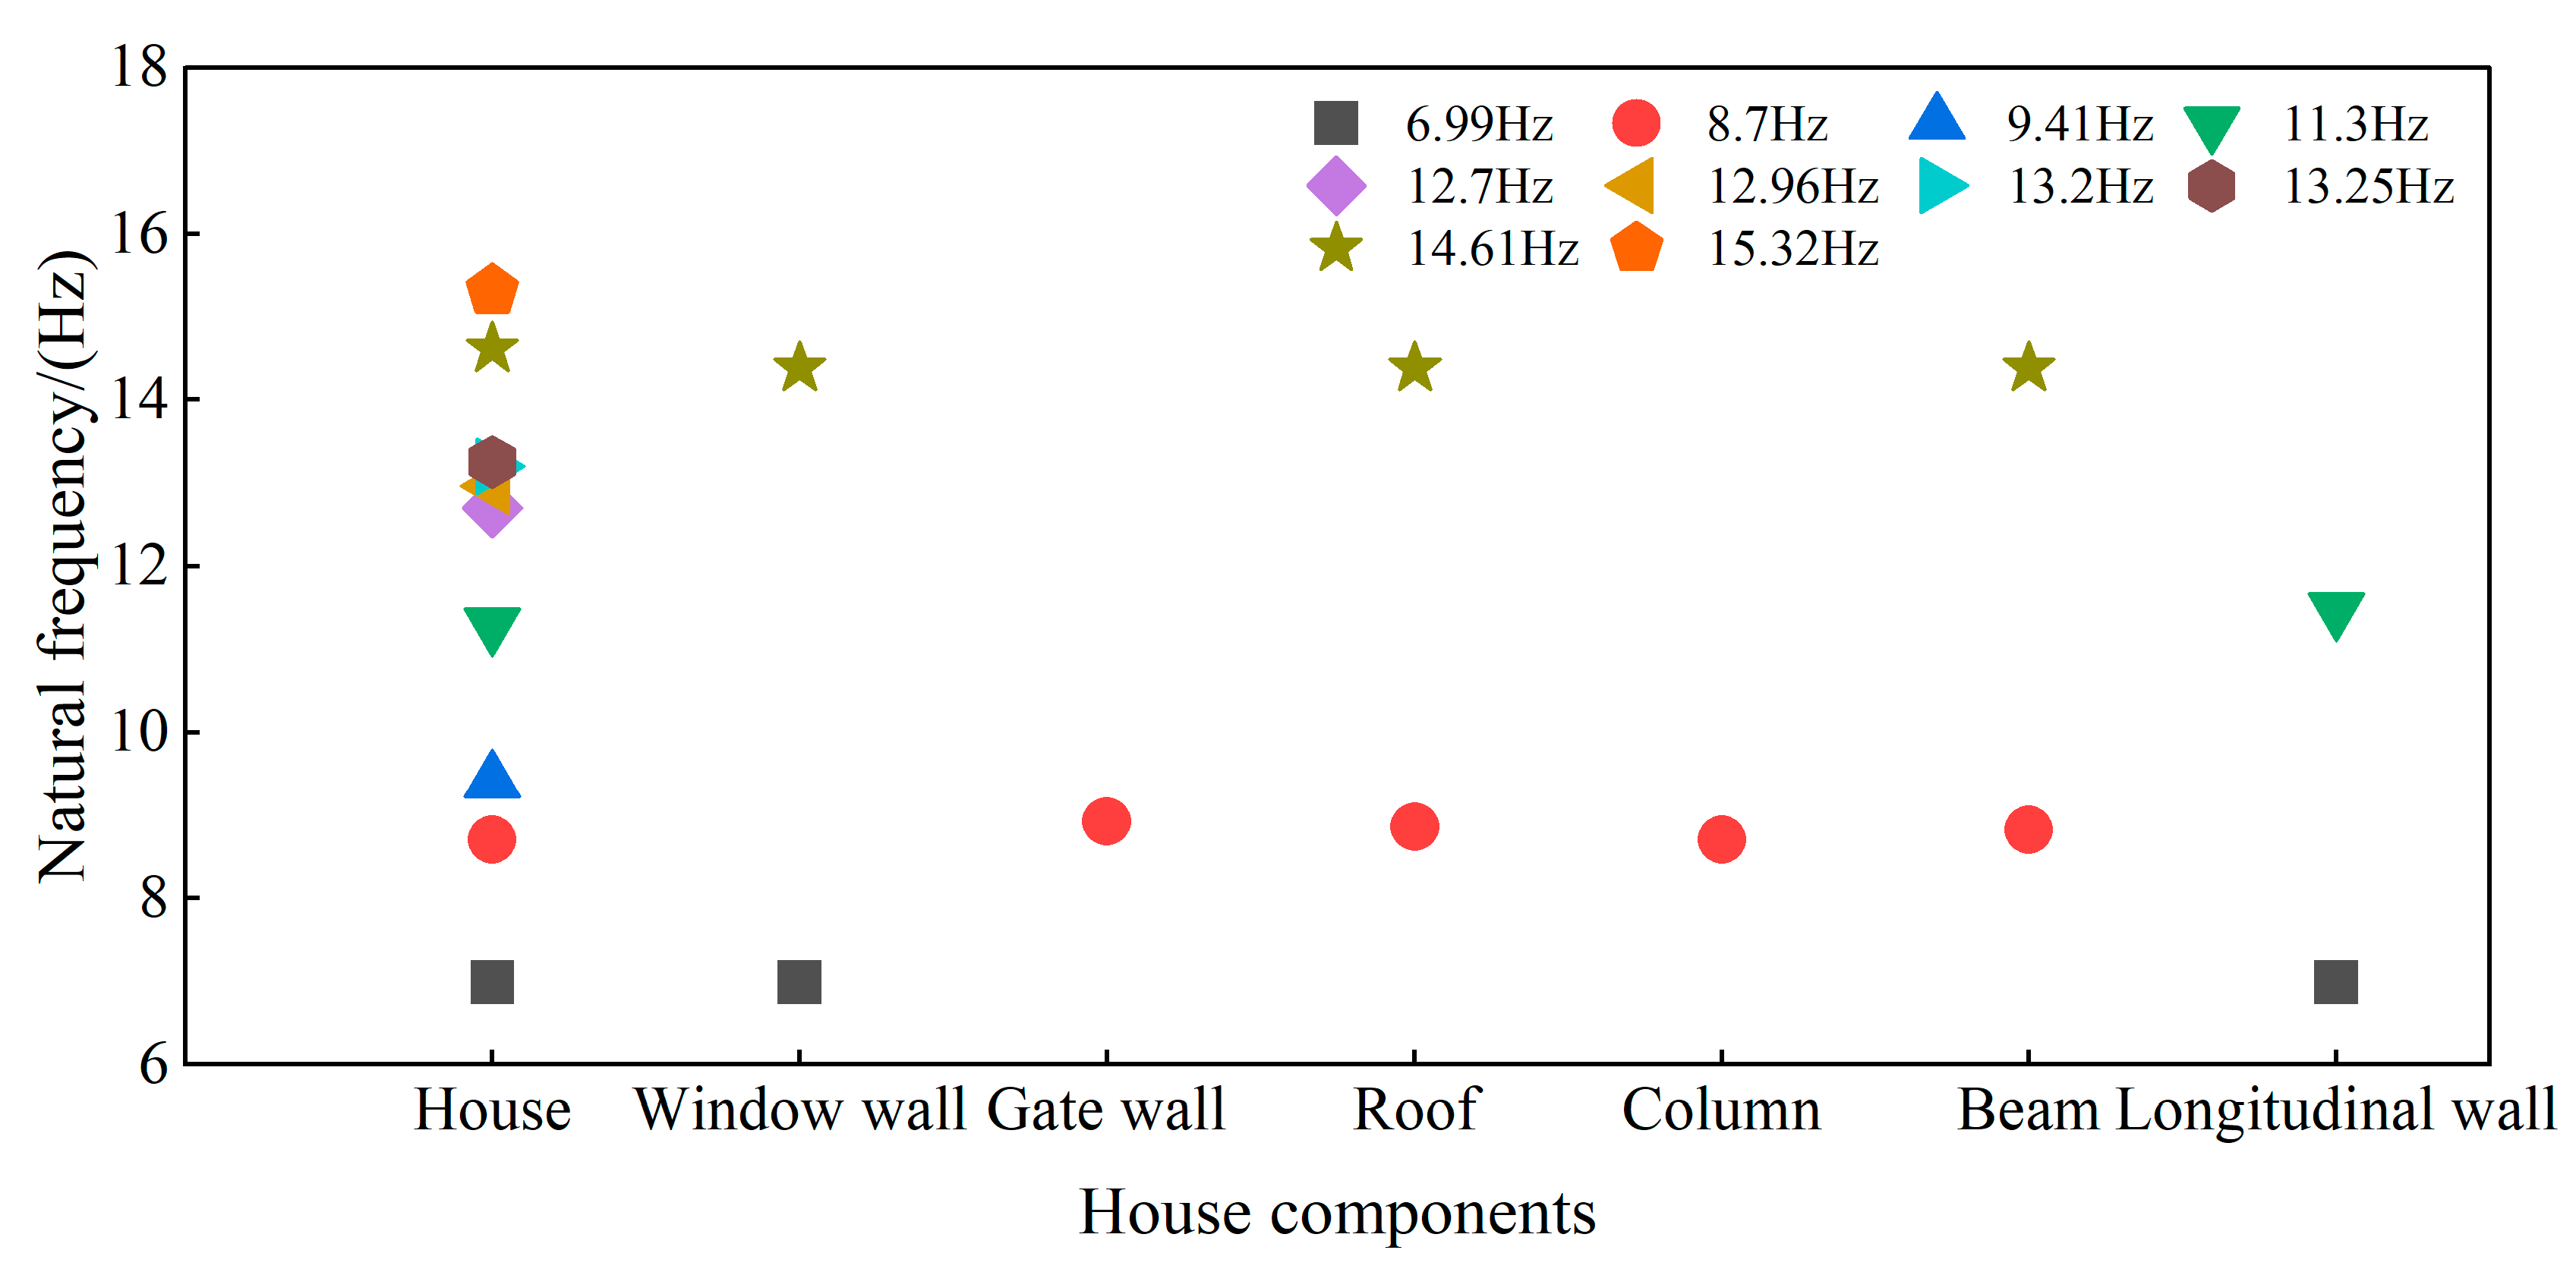
The natural frequencies of different components are compared to the first ten natural frequencies of the house, as shown in Figure 27. It can be seen that the natural frequencies of different components closely match or correspond to the first ten natural frequencies of the house. This indicates that the overall natural frequency of the house is not controlled by a single component, but is a comprehensive performance of the coupling effect of multiple components. The natural frequencies of these components are obviously different, indicating that the participation degree and dominant modes of each component in the overall dynamic response of the house are different. Compared to other components, the window wall and longitudinal wall have significantly lower natural frequencies, which are close to the overall low-order natural frequency of the house. The natural frequencies of the column, beam, and the roof correspond to the middle-order and high-order natural frequencies of the house. Therefore, the overall natural frequency of the house can be regarded as composed of the natural frequencies of different components. The natural frequencies of different components not only determine their own vibration characteristics, but also affect the dynamic behavior of the whole structure through a coupling relationship.

5. Conclusions

This paper integrates theoretical analysis, blasting vibration monitoring, and numerical simulation to investigate the impact of blasting vibrations on brick–concrete structures, leading to the following primary conclusions. The natural frequencies of different components were identified, and the hazardous frequencies and hazardous components of the houses were determined. The findings offer both theoretical guidance and an engineering reference for establishing safety assessment standards for brick–concrete structures subject to blasting vibration.
(1) When blasting waves propagate along the structural column and brick wall, the PPV and the energy characteristics show obvious differences in the horizontal and vertical directions. The PPV at the surface monitoring points and those at the house exhibit a linear relationship.
(2) The fundamental frequency of the building (6.991 Hz) significantly influences the PPV of different components. Amounts of 6.991 Hz, 11.302 Hz, and 13.202 Hz can be regarded as the critical frequencies for the house. The window walls, gate walls, longitudinal walls, and roof can be considered to be critical components.

Author Contributions

Conceptualization, P.Y. and J.T.; methodology, P.Y.; software, P.Y. and J.T.; validation, P.Y. and J.T.; formal analysis, P.Y. and J.T.; investigation, L.H.; resources, L.H.; data curation, P.Y. and J.T.; writing—original draft preparation, P.Y. and J.T.; writing—review and editing, P.Y. and J.T.; visualization, P.Y. and J.T.; supervision, Y.Z.; project administration, Y.Z.; funding acquisition, Y.Z. All authors have read and agreed to the published version of the manuscript.

Funding

This research was funded by the North China University of Science and Technology, grant number CXZZBS2023124.

Data Availability Statement

The data presented in this study are available on request from the corresponding author. The data contain confidential information that cannot be publicly disclosed.

Conflicts of Interest

Author Liangpeng Hao is employed by the Xinjiang Zhongtai Resource Management Co., Ltd. The remaining authors declare that the research was conducted in the absence of any commercial or financial relationships that could be construed as a potential conflict of interest.

References

  1. Shan, R.; Zhao, Y.; Wang, H.; Liu, Z.; Qin, H. Blasting vibration response and safety control of mountain tunnel. Bull. Eng. Geol. Environ. 2023, 82, 166. [Google Scholar] [CrossRef]
  2. Xu, S.; Chen, T.; Liu, J.; Zhang, C.; Chen, Z. Blasting Vibration Control Using an Improved Artificial Neural Network in the Ashele Copper Mine. Shock Vib. 2021, 2021, 9949858. [Google Scholar] [CrossRef]
  3. Zhou, J.; Asteris, P.; Armaghani, D.; Pham, B. Prediction of ground vibration induced by blasting operations through the use of the Bayesian Network and random forest models. Soil Dyn. Earthq. Eng. 2020, 139, 106390. [Google Scholar] [CrossRef]
  4. Yan, Y.; Hou, X.; Cao, S.; Li, R.; Zhou, W. Forecasting the collapse-induced ground vibration using a GWO-ELM model. Buildings 2022, 12, 121. [Google Scholar] [CrossRef]
  5. Bao, S.; Fei, H.; Hu, G. Characteristics and energy distribution of blast-induced ground vibration in deep-hole Blasting. Buildings 2023, 13, 899. [Google Scholar] [CrossRef]
  6. He, R.; Jiang, N.; Li, D.; Qi, J. Dynamic response characteristic of building structure under blasting vibration of underneath tunnel. Shock Vib. 2022, 2022, 9980665. [Google Scholar] [CrossRef]
  7. Wang, L.; Gaon, W.; Sun, B. Study of dynamic response of High-Rise buildings under blasting earthquake considering model simplifying. Mech. Adv. Mater. Struct. 2020, 27, 2068–2089. [Google Scholar] [CrossRef]
  8. Huo, R.; Li, S.; Song, Z.; Fujii, Y.; Lei, S.; Mao, J.; Tian, S.; Miao, Z. Analysis of vibration response law of multistory building under tunnel blasting loads. Adv. Civ. Eng. 2019, 2019, 4203137. [Google Scholar] [CrossRef]
  9. Jiang, N.; Zhang, Y.; Zhou, C.; Wu, T.; Zhu, B. Influence of blasting vibration of MLEMC shaft foundation pit on adjacent high-rise frame structure: A Case Study. Energies 2020, 13, 5140. [Google Scholar] [CrossRef]
  10. Athanasopoulos, G.; Pelekis, P. Ground vibrations from sheetpile driving in urban environment: Measurements, analysis and effects on buildings and occupants. Soil Dyn. Earthq. Eng. 2000, 19, 371–387. [Google Scholar] [CrossRef]
  11. Ren, Y.; Xi, S.; Yang, H.; Wan, T.; Wang, H.; Zhao, K. Structural vibration characteristics of the historical building in a nearby blasting test. Front. Earth Sci. 2024, 11, 1304354. [Google Scholar] [CrossRef]
  12. Ren, K.; Jiang, A.; Guo, X.; Min, Q. Research on Optimization Design of Tunnel Blasting Scheme Adjacent to Buildings. Appl. Sci. 2023, 13, 11509. [Google Scholar] [CrossRef]
  13. Zhang, Y.; Jiang, N.; Zhou, C.; Wu, T.; Luo, X.; Xia, Y. Dynamic response of building structures with high-rise framescaused by blasting vibration at adjacent subway foundation pit. J. China Coal Soc. 2019, 44, 118–125. [Google Scholar]
  14. Guan, X.; Zhang, C.; Zhao, F.; Mou, B.; Ge, Y. Stress response and damage characteristics of local members of a structure due to tunnel blasting vibrations based on the high-order local modal analysis. Shock Vib. 2019, 2019, 7075024. [Google Scholar] [CrossRef]
  15. Shi, H.; Jiang, N.; Zhou, C.; Zhang, Y.; Yao, Y.; Zhou, W.; Cai, Z. Safety assessment of ancient buddhist pagoda induced by underpass metro tunnel blasting vibration. Eng. Fail Anal. 2023, 145, 107051. [Google Scholar] [CrossRef]
  16. Jayasooriya, W.; Thambiratnam, D.; Perera, N.; Kosse, V. Blast and residual capacity analysis of reinforced concrete framed buildings. Eng. Struct. 2011, 12, 3483–3495. [Google Scholar] [CrossRef]
  17. Wu, C.; Hao, H.; Lu, Y. Dynamic response and damage analysis of masonry structures and masonry infilled RC frames to blast ground motion. Eng. Struct. 2005, 27, 323–333. [Google Scholar] [CrossRef]
  18. Zou, Y.; Yan, P.; Liu, L.; Zhou, T.; Lu, W.; Chen, M. Assessment and control of the blasting vibration effect on local residences during theexcavation of abutment slope in the Baihetan project. J. Vib. Shock 2018, 37, 248–258. [Google Scholar]
  19. Yuan, Y.; Gao, Z.; He, L.; Lei, Z. Research on the vibration response of high-rise buildings under blasting loadt. Mathematics 2024, 12, 3165. [Google Scholar] [CrossRef]
  20. Yan, P.; Zhang, Y.; Tian, J.; Wang, H. Blasting vibration signal denoising based on CEEMDAN-K-means algorithm. Blasting 2023, 40, 184–190. [Google Scholar]
  21. Tang, Z.; Wu, H.; Wu, Z.; Jia, D.; Fu, J. Modal analysis and harmonic response analysis of energy-absorbing and anti-scouring columns. Front. Earth Sci. 2023, 11, 1126120. [Google Scholar] [CrossRef]
  22. He, Z.; Zhang, X.; Wang, S.; Bai, Y.; Feng, Q. Research on the effect of rail vibration suppression using the stiffness-damping interventional rail vibration reduction device. Constr. Build. Mater. 2024, 411, 134636. [Google Scholar] [CrossRef]
  23. Zhan, J.; Xia, H. Impact vibration test method for identifying the natural vibration frequency of piers with middle and low heights. China Railw. Sci. 2008, 29, 31–35. [Google Scholar]
Figure 1. Location of the brick–concrete structure.
Buildings 15 02954 g001
Figure 2. Blasting vibration monitoring system.
Buildings 15 02954 g002
Figure 3. Surface monitoring point.
Buildings 15 02954 g003
Figure 4. Monitoring points of the structural column.
Buildings 15 02954 g004
Figure 5. Monitoring points of brick wall.
Buildings 15 02954 g005
Figure 6. Variation law of PPV at the monitoring points of the structural column.
Buildings 15 02954 g006
Figure 7. Amplification coefficient of PPV at different monitoring points.
Buildings 15 02954 g007
Figure 8. Variation law of the main frequency at the monitoring points of the structural column.
Buildings 15 02954 g008
Figure 9. Frequency ratio coefficient of the monitoring points of the structural column.
Buildings 15 02954 g009
Figure 10. Contour lines of the PPV of the structural column and surface monitoring point.
Buildings 15 02954 g010
Figure 11. The fitting relationship between the PPV of the structural column and surface monitoring point.
Buildings 15 02954 g011
Figure 12. Instantaneous energy spectrum of the monitoring points of the structural column.
Buildings 15 02954 g012
Figure 13. Variation law of the PPV at different monitoring points of the brick wall.
Buildings 15 02954 g013
Figure 14. PPV ratio of different monitoring points.
Buildings 15 02954 g014
Figure 15. Distribution of main the frequency of blasting waves at different monitoring points of the brick wall.
Buildings 15 02954 g015
Figure 16. Frequency ratio coefficient of different monitoring points of the brick wall.
Buildings 15 02954 g016
Figure 17. Contour lines of PPV at brick wall and surface monitoring points.
Buildings 15 02954 g017
Figure 18. The fitting relationship between the PPV of the brick wall and the surface monitoring point.
Buildings 15 02954 g018
Figure 19. Energy proportion of the horizontal radial signal.
Buildings 15 02954 g019
Figure 20. Instantaneous energy spectrum of the brick wall monitoring points.
Buildings 15 02954 g020
Figure 21. The numerical model.
Buildings 15 02954 g021
Figure 22. The mesh division and loading-added way of the numerical model.
Buildings 15 02954 g022
Figure 23. The first ten vibration mode shapes of the house.
Buildings 15 02954 g023aBuildings 15 02954 g023b
Figure 24. Horizontal tangential response curves of different components.
Buildings 15 02954 g024
Figure 25. Horizontal tangential response curve of window wall.
Buildings 15 02954 g025
Figure 26. Horizontal tangential response curve of longitudinal wall.
Buildings 15 02954 g026
Figure 27. Natural frequencies of the house and its components.
Buildings 15 02954 g027
Table 1. Blasting vibration monitoring data of different measuring points of the structural column.
Time/sMaximum Explosive Charge per Delay/kgBlast Center Distance/mMonitoring PointsHorizontal Radial
Direction (X Direction)
Horizontal Tangential
Direction (Y Direction)
Vertical Direction
(Z Direction)
PPV/
(cm/s)
Main Frequency/
Hz
PPV/
(cm/s)
Main Frequency/
Hz
PPV/
(cm/s)
Main Frequency/
Hz
1490581.78F0.0589.220.06311.020.0629.46
581.80C10.05910.220.08219.690.07114.71
581.83C20.07513.090.12417.010.08214.88
581.86C30.09615.820.15320.660.08414.71
2500591.31F0.0648.720.04920.010.08814.24
591.32C10.0719.920.05519.690.09119.08
591.35C20.07610.250.09220.130.11219.08
591.38C30.09414.040.12520.490.1319.53
3850328.46F0.23422.350.17527.390.26821.74
328.55C10.22922.520.32425.250.33721.74
328.65C20.32622.520.49223.810.41422.32
328.76C30.42723.360.59522.520.41922.52
4325198.52F0.27118.610.17411.530.15626.85
198.79C10.28218.820.23514.290.30419.38
199.08C20.4919.530.41019.230.38019.37
199.37C30.68720.830.52621.550.39619.38
5450219.32F0.45622.090.71129.850.92443.96
219.66C10.51719.380.71930.860.93321.19
220.01C20.76219.690.94622.731.13521.01
220.36C31.06620.161.15019.081.13420.83
Table 2. Energy distribution of different frequency bands at the monitoring points of the structural column.
Number of Frequency BandsFrequency Band/HzEnergy/(cm/s)2Proportion/%
Signal C1Signal C2Signal C3Signal C1Signal C2Signal C3
10~4.88280.2520.2630.2245.2914.0842.621
24.8828~9.76561.3741.4311.45928.84722.22417.074
39.7656~19.53131.0211.1511.81321.43617.87521.217
419.5313~39.06251.0972.2503.67423.03234.94342.996
539.0625~78.1250.6650.6660.68913.96210.3438.063
678.125~156.250.2860.5850.5946.0059.0856.951
7156.25~312.50.0670.0930.0921.4071.4441.077
8312.5~6250.0000.0000.000000
9625~12500.0010.0000.0000.02100
101250~25000.0000.0000.000000
amount to4.7636.4398.545100100100
Table 3. Blasting vibration monitoring data of different monitoring points of the brick wall.
Time/sMaximum Explosive Charge per Delay/kgBlast Center Distance/mMonitoring PointsHorizontal Radial
Direction (X Direction)
Horizontal Tangential Direction (Y Direction)Vertical Direction
(Z Direction)
PPV/
(cm/s)
Main Frequency/
Hz
PPV/
(cm/s)
Main Frequency/
Hz
PPV/
(cm/s)
Main Frequency/
Hz
1700303.41F0.08316.340.08216.890.11222.32
303.75W10.13716.690.15619.080.11616.03
308.72W20.10519.230.33422.940.06527.17
313.69W30.10720.830.15119.230.12522.94
2800539.83F0.1122.120.17824.270.11425.77
540.03W10.12422.940.21424.040.12420
545.02W20.09921.550.31924.270.09819.53
550.01W30.07517.700.20422.120.07524.27
3200565.31F0.0423.360.05622.320.03621.01
565.41W10.04921.740.05218.3800.03921.37
570.35W20.04025.000.08822.940.02818.94
575.3W30.01929.760.02218.800.02221.93
4200735.51F0.0149.90.0112.740.00913.7
735.59W10.02522.120.02121.190.02323.36
740.17W20.02417.120.04519.410.01523.58
744.76W30.02514.290.02220.660.02020.16
5600303.41F0.06932.470.08314.710.08117.01
303.76W10.09516.670.13319.230.10920.16
308.72W20.09321.010.29725.250.06217.12
313.69W30.09124.040.15316.780.08518.52
Table 4. Energy distribution of different frequency bands at the monitoring points of the brick wall.
Number of
Frequency Bands
Frequency Band/HzEnergy/(cm/s)2Proportion/%
Signal W1Signal W2Signal W3Signal W1Signal W2Signal W3
10~4.88280.2090.2110.1913.2564.065.715
24.8828~9.76561.2521.0610.94619.50820.41628.306
39.7656~19.53131.0290.9150.60116.03317.60617.983
419.5313~39.06252.6312.2350.86440.99443.00625.853
539.0625~78.1250.6230.5290.5129.70710.17915.32
678.125~156.250.5780.1740.1689.0063.3485.027
7156.25~312.50.0940.0720.0601.4651.3851.795
8312.5~6250.0000.0000.000000
9625~12500.0020.0000.0000.03100
101250~25000.0000.0000.000000
amount to6.4185.1973.342100100100
Table 5. The first ten natural frequencies of the house.
Order12345678910
Frequency/Hz6.998.79.4111.312.712.9613.213.2514.6115.32
Table 6. PPV and corresponding frequency of components.
ComponentX DirectionY DirectionZ Direction
Frequency/HzPPV/(cm/s)Frequency/HzPPV/(cm/s)Frequency/HzPPV/(cm/s)
Window wall6.9910.0556.99122.0736.9910.417
13.1380.13711.12414.16411.4830.179
14.3840.11113.2270.142
Gate wall6.9910.7526.9910.3846.9910.243
11.3585.0328.9180.24512.8960.251
13.1387.44812.5920.463
Longitudinal wall6.9910.0196.99121.1396.9910.359
14.3840.10111.48310.78011.4020.152
13.1380.132
Pillar6.9910.3418.7770.2508.6390.112
13.1380.46812.5920.32111.4020.059
13.2270.084
Beam13.3170.3036.9910.5986.9910.642
14.3830.2748.8200.60611.4020.267
12.6420.585
Roof13.3170.2386.9910.5946.99153.680
14.3840.2258.8550.58111.40210.606
12.6420.668
Table 7. Natural frequency of components and corresponding phase angle.
ComponentX DirectionY DirectionZ Direction
Frequency/HzPhase Angle/°Frequency/HzPhase Angle/°Frequency/HzPhase Angle/°
Window wall14.384169.8906.991175.820
Gate wall8.918176.680
Longitudinal wall6.991179.69011.483178.630
Pillar6.991178.9508.855177.8608.777179.250
Beam14.384178.7208.820176.420
Roof14.384175.7308.855177.440
Disclaimer/Publisher’s Note: The statements, opinions and data contained in all publications are solely those of the individual author(s) and contributor(s) and not of MDPI and/or the editor(s). MDPI and/or the editor(s) disclaim responsibility for any injury to people or property resulting from any ideas, methods, instructions or products referred to in the content.