Article

Seismic Performance Testing and Damage Analysis of Reinforced T-Stub Connections

1
School of Intelligent Construction and Civil Engineering, Luoyang Institute of Science and Technology, Luoyang 471023, China
2
Henan Province International Joint Laboratory of Innovative Civil Engineering Structure, Luoyang 471023, China
3
Henan Key Laboratory of Green Building Materials Manufacturing and Intelligent Equipment, Luoyang 471023, China
4
Beijing Institute of Tracking and Telecommunications Technology, Beijing 100094, China
*
Authors to whom correspondence should be addressed.
Buildings 2025, 15(22), 4112; https://doi.org/10.3390/buildings15224112
Submission received: 9 August 2025 / Revised: 28 September 2025 / Accepted: 1 November 2025 / Published: 14 November 2025

Abstract

To improve the seismic performance of semi-rigid steel frame beam–column joints connected by T-stubs, reinforced T-stubs formed via wedge-shaped and thickening modifications are proposed. Taking the middle column joints in steel frames as the research objects, three types of beam–column joints are designed by adopting ordinary, wedge-shaped, and thickened wedge-shaped T-stubs. To conduct a comparative analysis of the seismic performance of the test specimens, this study imposes low-cycle cyclic loads on the column ends of each specimen along their major-axis and minor-axis in-planes. This loading protocol is adopted to simulate the dynamic responses of the specimens under bidirectional seismic action. Comparing the macroscopic failure phenomena of the specimens, the influence of reinforced T-stubs on the plastic development mode of the joints is analyzed. Based on seismic indicators such as hysteresis characteristics, skeleton curves, stiffness degradation, and energy dissipation capacity, the energy dissipation capacity of the specimens along the major-axis is greater than that along the minor-axis, but their deformation capacity is slightly reduced. The bearing capacity, energy dissipation, and rotational stiffness could be improved by reinforced T-stubs, but the deformation capacity is reduced to varying degrees. The stiffness degradation rate of the specimen adopting wedge-shaped T-stubs shows a more obvious accelerating trend. Through the comparative analysis of the three specimens based on the energy damage index, the results indicate that wedge-shaped T-stubs significantly increase the damage degree of the specimens, but thickened wedge-shaped T-stubs have a relatively small impact on the evolution of joint damage.

1. Introduction

Connection detailing for beam–column joints constitutes a critical aspect of steel structure design, with welded and bolted–welded connections representing the most prevalent types [1,2]. Although welded connections can improve the bearing capacity and stiffness of joints while simplifying the configuration, their limited deformation capacity causes significant force amplification during seismic events, often inducing brittle fractures that compromise seismic performance [3,4]. Catastrophic connection failures occurred during the 1994 Northridge earthquake in the United States and the 1995 Kobe earthquake in Japan [5,6].
Traditional steel structure design theory typically idealizes beam–column connections as either perfectly rigid or completely pinned joints. However, engineering observations demonstrate that actual connection behavior typically exhibits semi-rigid properties, which are intermediate between these idealized conditions. Semi-rigid connections combine the load-transfer mechanisms of rigid and pinned joints, allowing controlled relative rotation between structural members while providing substantial bearing capacity and efficient moment redistribution [7,8,9,10]. Contemporary semi-rigid connection techniques primarily use high-strength bolts alongside T-stubs, steel angles, and end-plates to create beam–column joints [11,12,13,14,15]. T-stub connections, in particular, have become widely used in steel structures thanks to their exceptional bearing capacity, rotational stiffness, and compatibility with prefabricated construction methods.
To investigate on the mechanical characteristics and seismic performance of the T-stubs joints, Popov and Takhirov [16,17] designed two distinct T-stub configurations and conducted cyclic loading tests on corresponding semi-rigid connections. Integrated with finite element analysis, their work identified joint failure mechanisms resulting from plastic deformation in T-stubs, which detached from the column flange. This phenomenon is a key factor in enabling energy dissipation and preventing beam buckling for T-stub joints. By adding friction materials, changing cross-sectional forms, and arranging damping devices, the energy-dissipating joints with T-stubs were proposed by Latour et al. [18,19] These joints exhibited superior energy absorption relative to conventional joints while establishing the validated theoretical models and design methodologies. Wang et al. [20] employed the component method to assemble joints with T-stub components equivalently, developing a multi-spring model for connection performance evaluation. Experimental and finite element validation confirmed this specimen’s effectiveness in semi-rigid joint design. To investigate the influence of bolt preload on the mechanical behavior of beam–column joints, D’Aniello et al. [21] conducted monotonic and variable-amplitude tests on HV and HR bolt assemblies in accordance with Eurocode requirements. Furthermore, the failure modes of the components were analyzed and an analysis specimen was defined. Based on Reference [21], Tartaglia et al. [22] examined the effects of bolt configuration and arrangement patterns on T-stub connection performance. Their study revealed that initial imperfections in T-stubs affect bolt force distribution, leading to a proposed method for calculating the ultimate bearing capacity of joints under large deformations. To reduce construction difficulties and installation stress in T-stub connections, a double-web T-stub was proposed by Liu et al. [23] This design reduced bolt quantity while maintaining joint elasticity under minor earthquakes and wind loads, and dissipated energy through slippage to mitigate plastic deformation during moderate and large earthquakes.
Previous studies have demonstrated that T-stub connections have yielded substantial findings, facilitating their application in prefabricated steel structures. However, since joint failure often initiates from severe plastic deformation of T-stubs, optimizing T-stub configuration is essential for enhancing joint performance [24,25,26]. During earthquakes, traditional welded or bolted–welded connections may develop plastic hinges at the joints due to weld fractures, causing significant damage to beams and columns. Guided by the Strong Joint–Weak Member principle, extensive studies indicated that implementing deformation capacity design in traditionally rigid joints relocates the plastic hinge to the beam section away from the column, enhancing the safety margin [27,28,29]. Current ductile joint designs typically employ reinforced or weakened connections. Unlike traditional welded joints, T-stub connection failures primarily occur at the flange–web junctions. This failure mode effectively mitigates beam–column damage, making reinforced connection design methodologies particularly suitable for T-stub joints. Common reinforcing measures include adding stiffeners to the T-stub web or flange, incorporating web angle connections, increasing the number of high-strength bolts, or enlarging the T-stub flange or web widths. Among these, enlarging the T-stub flanges and web widths represents the most straightforward and cost-effective approach [30,31].
This paper carries out a study to investigate the mechanical properties, strengthening mechanism, and performance of reinforced spatial T-stubs joints. Firstly, it takes a spatial middle column joint with T-stub connections as the study object, and analyzes its seismic performance through biaxial low-cycle reversed loading tests. For these tests, this paper employs specimen design and loading protocols that address spatial effects arising from the characteristics of H-shaped steel columns in the major-axis and minor-axis. Then, it designs wedge-shaped T-stubs to locally reinforce semi-rigid spatial joints and compares the seismic performance of wedge-shaped T-stub joints with that of ordinary T-stub joints to validate reinforcement effectiveness. Additionally, it evaluates the influence of increased T-stub thickness on the mechanical response of spatial joints. Finally, it selects a typical damage index model with energy as the parameter is selected to compare and analyze the damage evolution law of the T-stub spatial joints.

2. Research Overview

2.1. Specimen Design

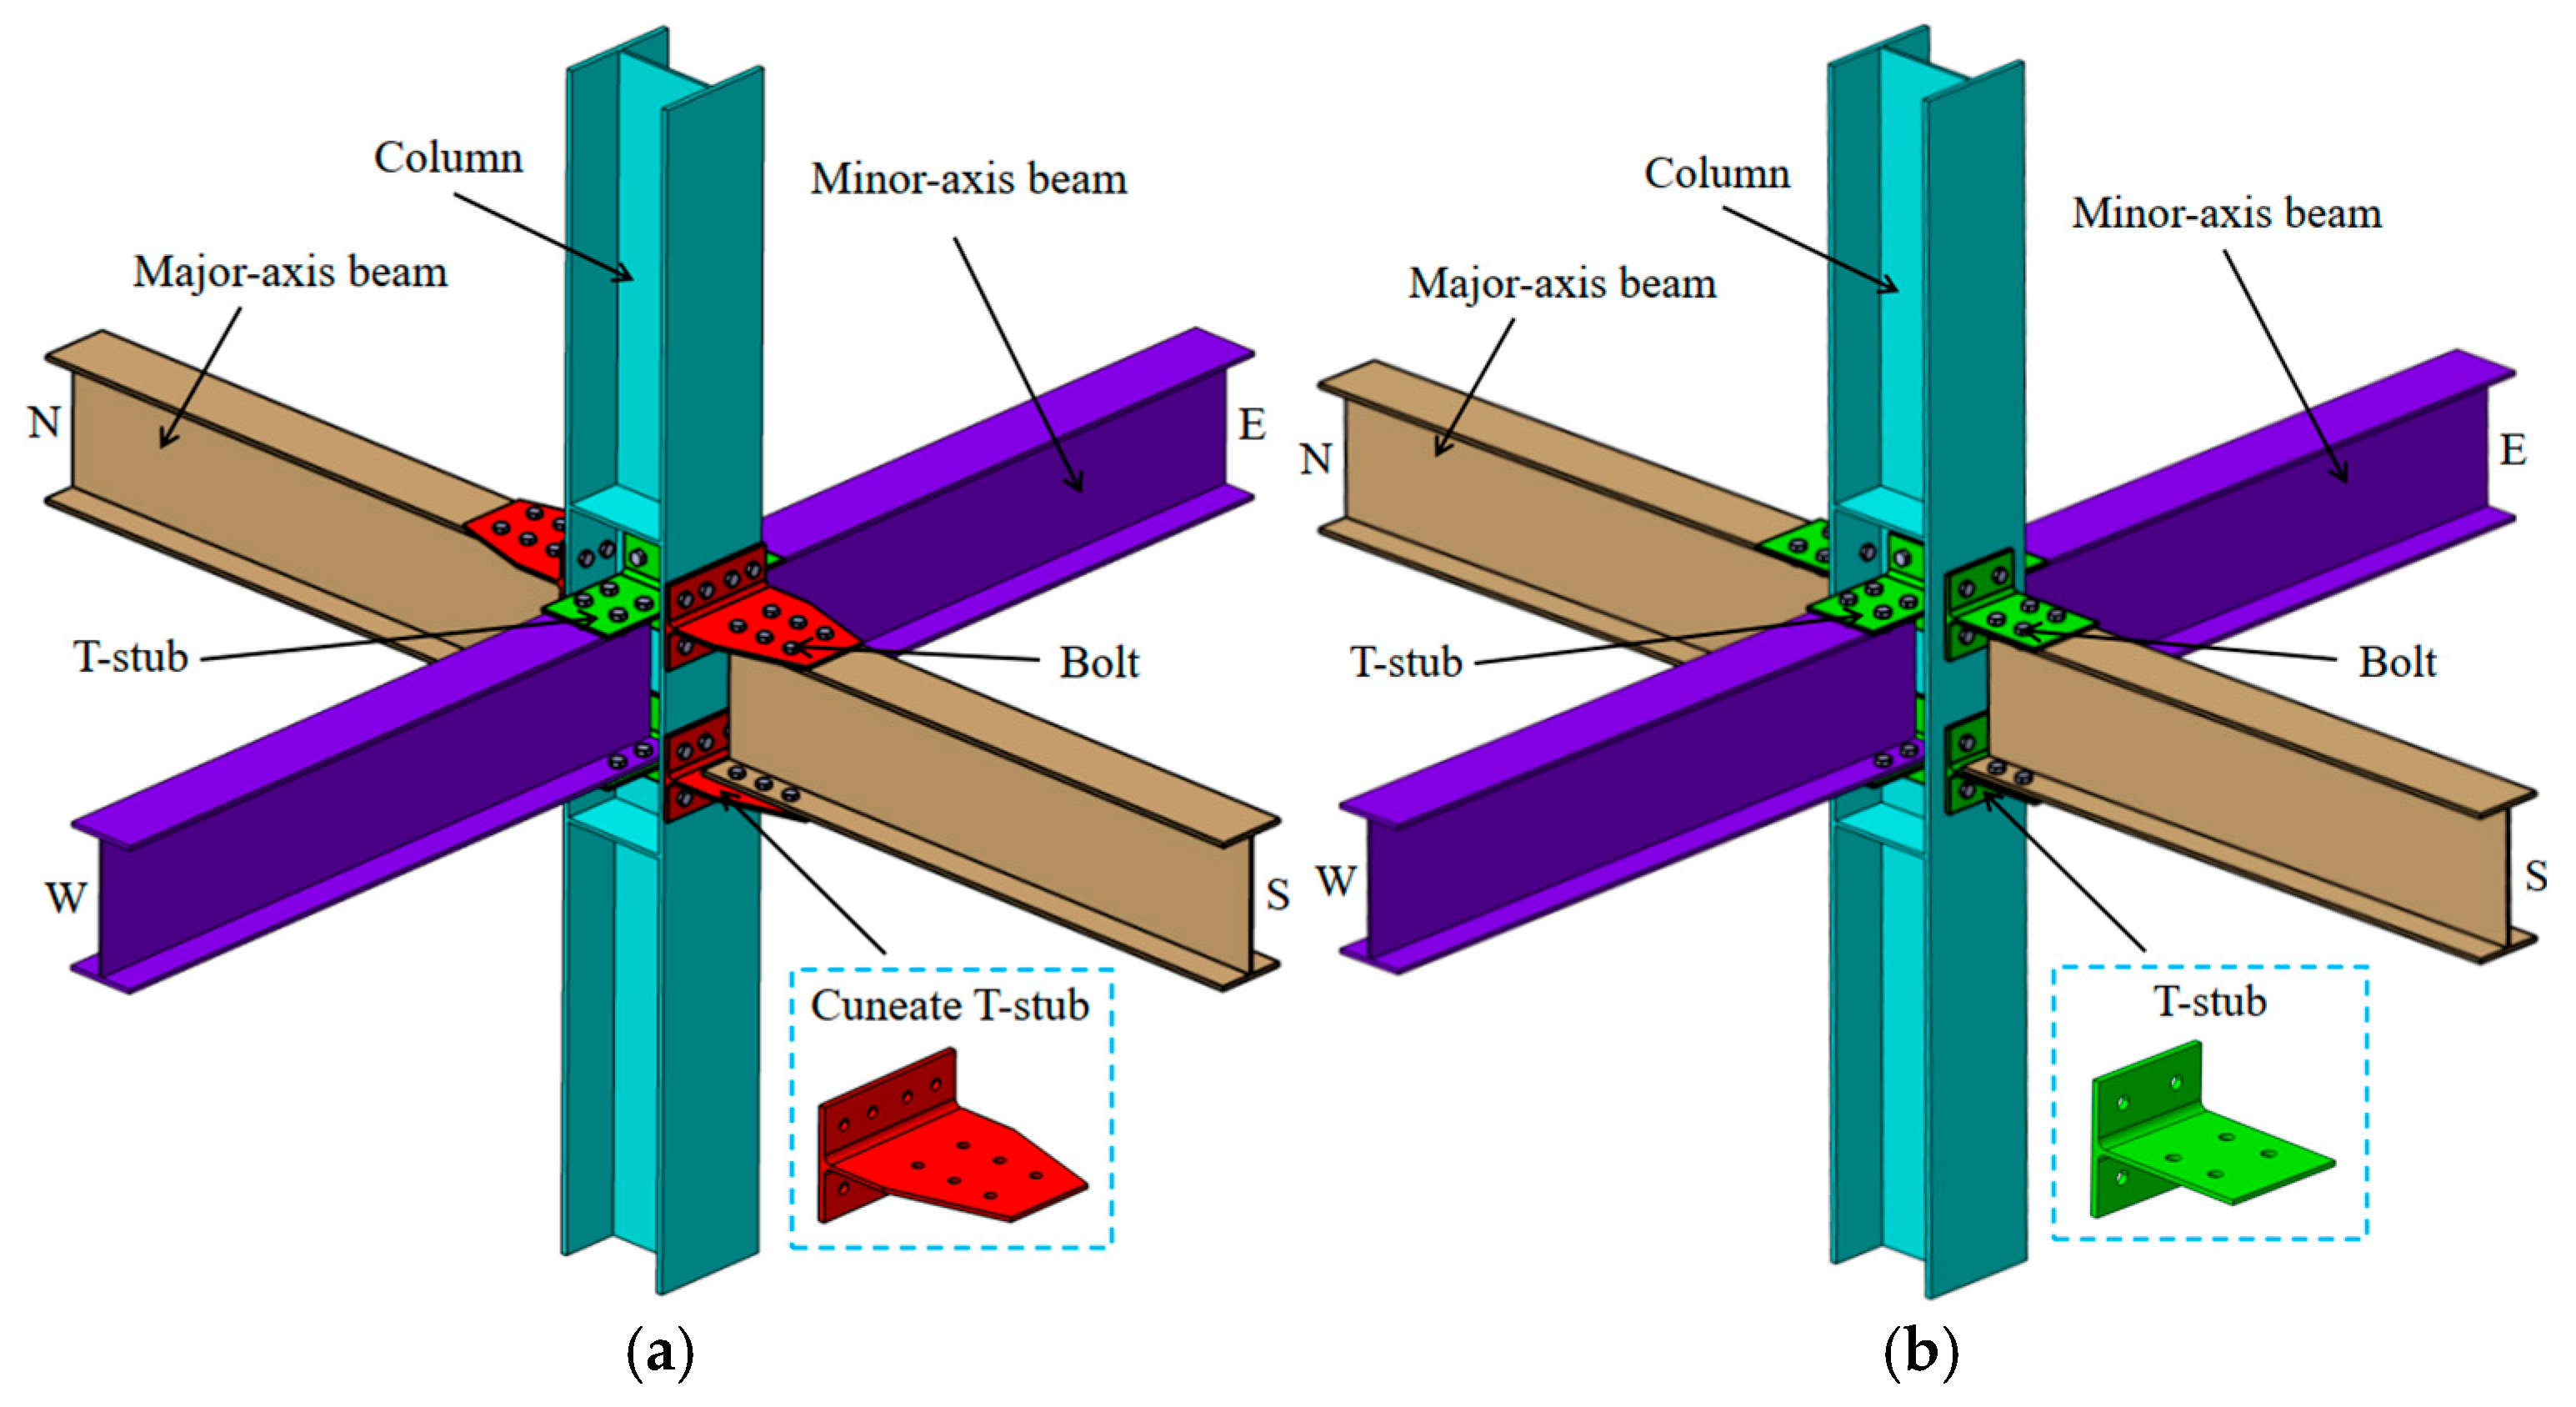
A six-story steel frame structure is designed in accordance with Chinese design codes GB 50017-2017 [32] and GB 50011-2010 [33]. A middle column joint is selected as the research object; the position of the middle column joint in the structure is shown in Figure 1. The test specimens are designed based on the shear deformation mode of the frame structure, and the beams and columns that make up the joints are all cut from the inflection points. To ensure accuracy within test constraints, all the specimens are designed at full scale and take into account the influence of axial pressure. This study designed three test specimens: TN1 is an ordinary T-stub joint, TN2 is a wedge-shaped T-stub joint, and TN3 is a thickened wedge-shaped T-stub joint. The schematic diagrams of TN1 and TN2 are shown in Figure 2. Compared to TN2, TN3 only has an increased T-stub thickness, while all other dimensions remain the same. The schematic diagram of TN3 can refer to that of TN2. Each specimen consists of frame beams, columns, T-stubs, high-strength bolts, and stiffeners. Semi-rigid T-stub connections are implemented along the major-axis and minor-axis to comprehensively investigate failure modes and mechanical behavior under spatial effects [34,35]. In terms of construction, except for the stiffeners welded to the frame columns, all other components are connected by 10.9 grade high-strength bolts. The arrangement and construction of the bolts meet the specification requirements. The T-stub flanges are bolted to the frame column flange in the major-axis. The T-stub flanges in different directions are symmetrically bolted together to the frame columns. The T-stub webs are connected to the flanges of the frame beams in all directions.
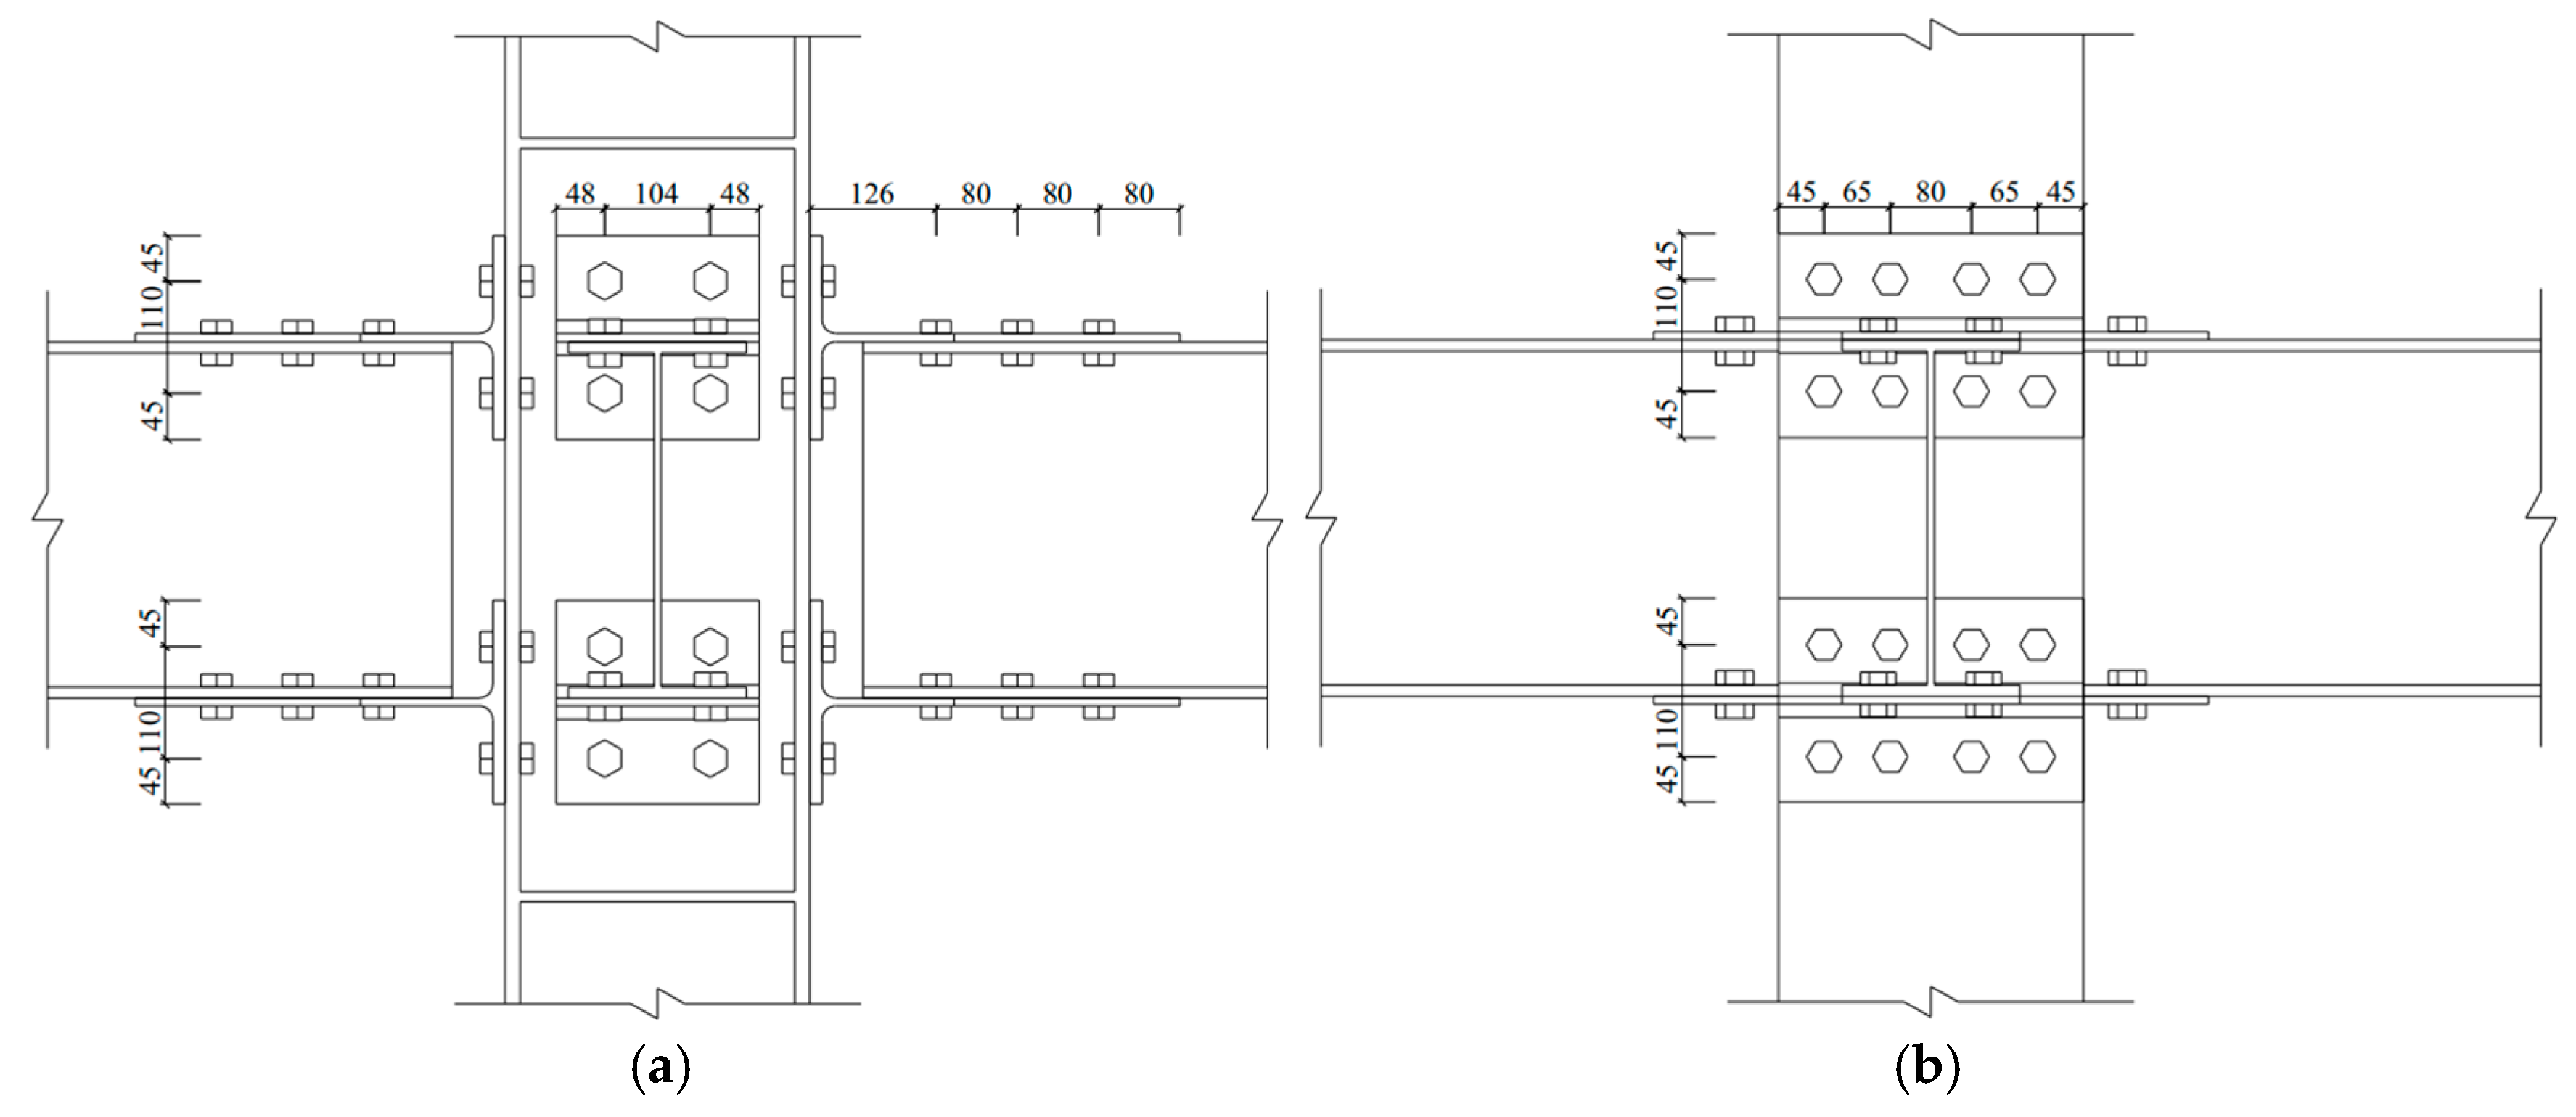
For the specimens, hot-rolled H-section steel WH300 × 300 × 10 × 15 was adopted for fabricating the columns, and NH350 × 175 × 7 × 11 hot-rolled H-section steel was selected for the beams. The height of the column is 3000 mm. The north–south beams along the major-axis are 1800 mm in length, while the east–west beams on the minor-axis measure 1900 mm. T-stub fabrication involves splitting H-sections. TN1 uses ordinary T-stubs on both the major-axis and minor-axis. The T-stubs utilized in TN2 for the major axis feature expanded flange width and web height. To compensate for the increased quantity of bolts at this location, this study appropriately reduced the bolt grade. The minor-axis configuration matches that of TN1. TN3 incorporates thickened wedge-shaped T-stubs based on TN2. Figure 3 illustrates the joint zone configurations for TN2 on both axes. Table 1 summarizes the key structural parameters for all the specimens.

2.2. Material Property Tests

All the specimens use Q235B steel from the same production batch. Following GB/T 228.1-2010: Metallic materials—Tensile testing—Part 1: Method of test at room temperature [36], tensile coupons were extracted from the webs and flanges of frame columns, beams, and T-stubs. Uniaxial tensile tests determine material properties including yield strength (fy), ultimate tensile strength (fu), elastic modulus (E), reduction in area (A), elongation (δ), and yield ratio (fy/fu). Table 2 summarizes these material properties.

2.3. Loading Setup

To account for the influence of P-Δ effects on the frame columns, all of the specimens use column-end loading; Figure 4 shows the experimental setup. Bidirectional loading aligned with the major-axis and minor-axis is applied to simulate multidimensional seismic characteristics. Biaxial loading sleeves are connected to 100-tonne actuators via loading beams at both the column’s top and bottom. The actuator bases are bolted to L-shaped reaction walls. A 200 kN vertical actuator applies axial compression while traversing base rails, enabling in-plane translation. A universal hinge support at the column base accommodates sliding displacements during bidirectional loading. Sliding gears with lateral restraint plates welded to the lattice columns provide pinned in-plane connections while restricting out-of-plane movement at the ends of the beams. Force sensors, mounted above and below the beam ends, record the support reactions in real time.

2.4. Loading Protocol and Instrumentation

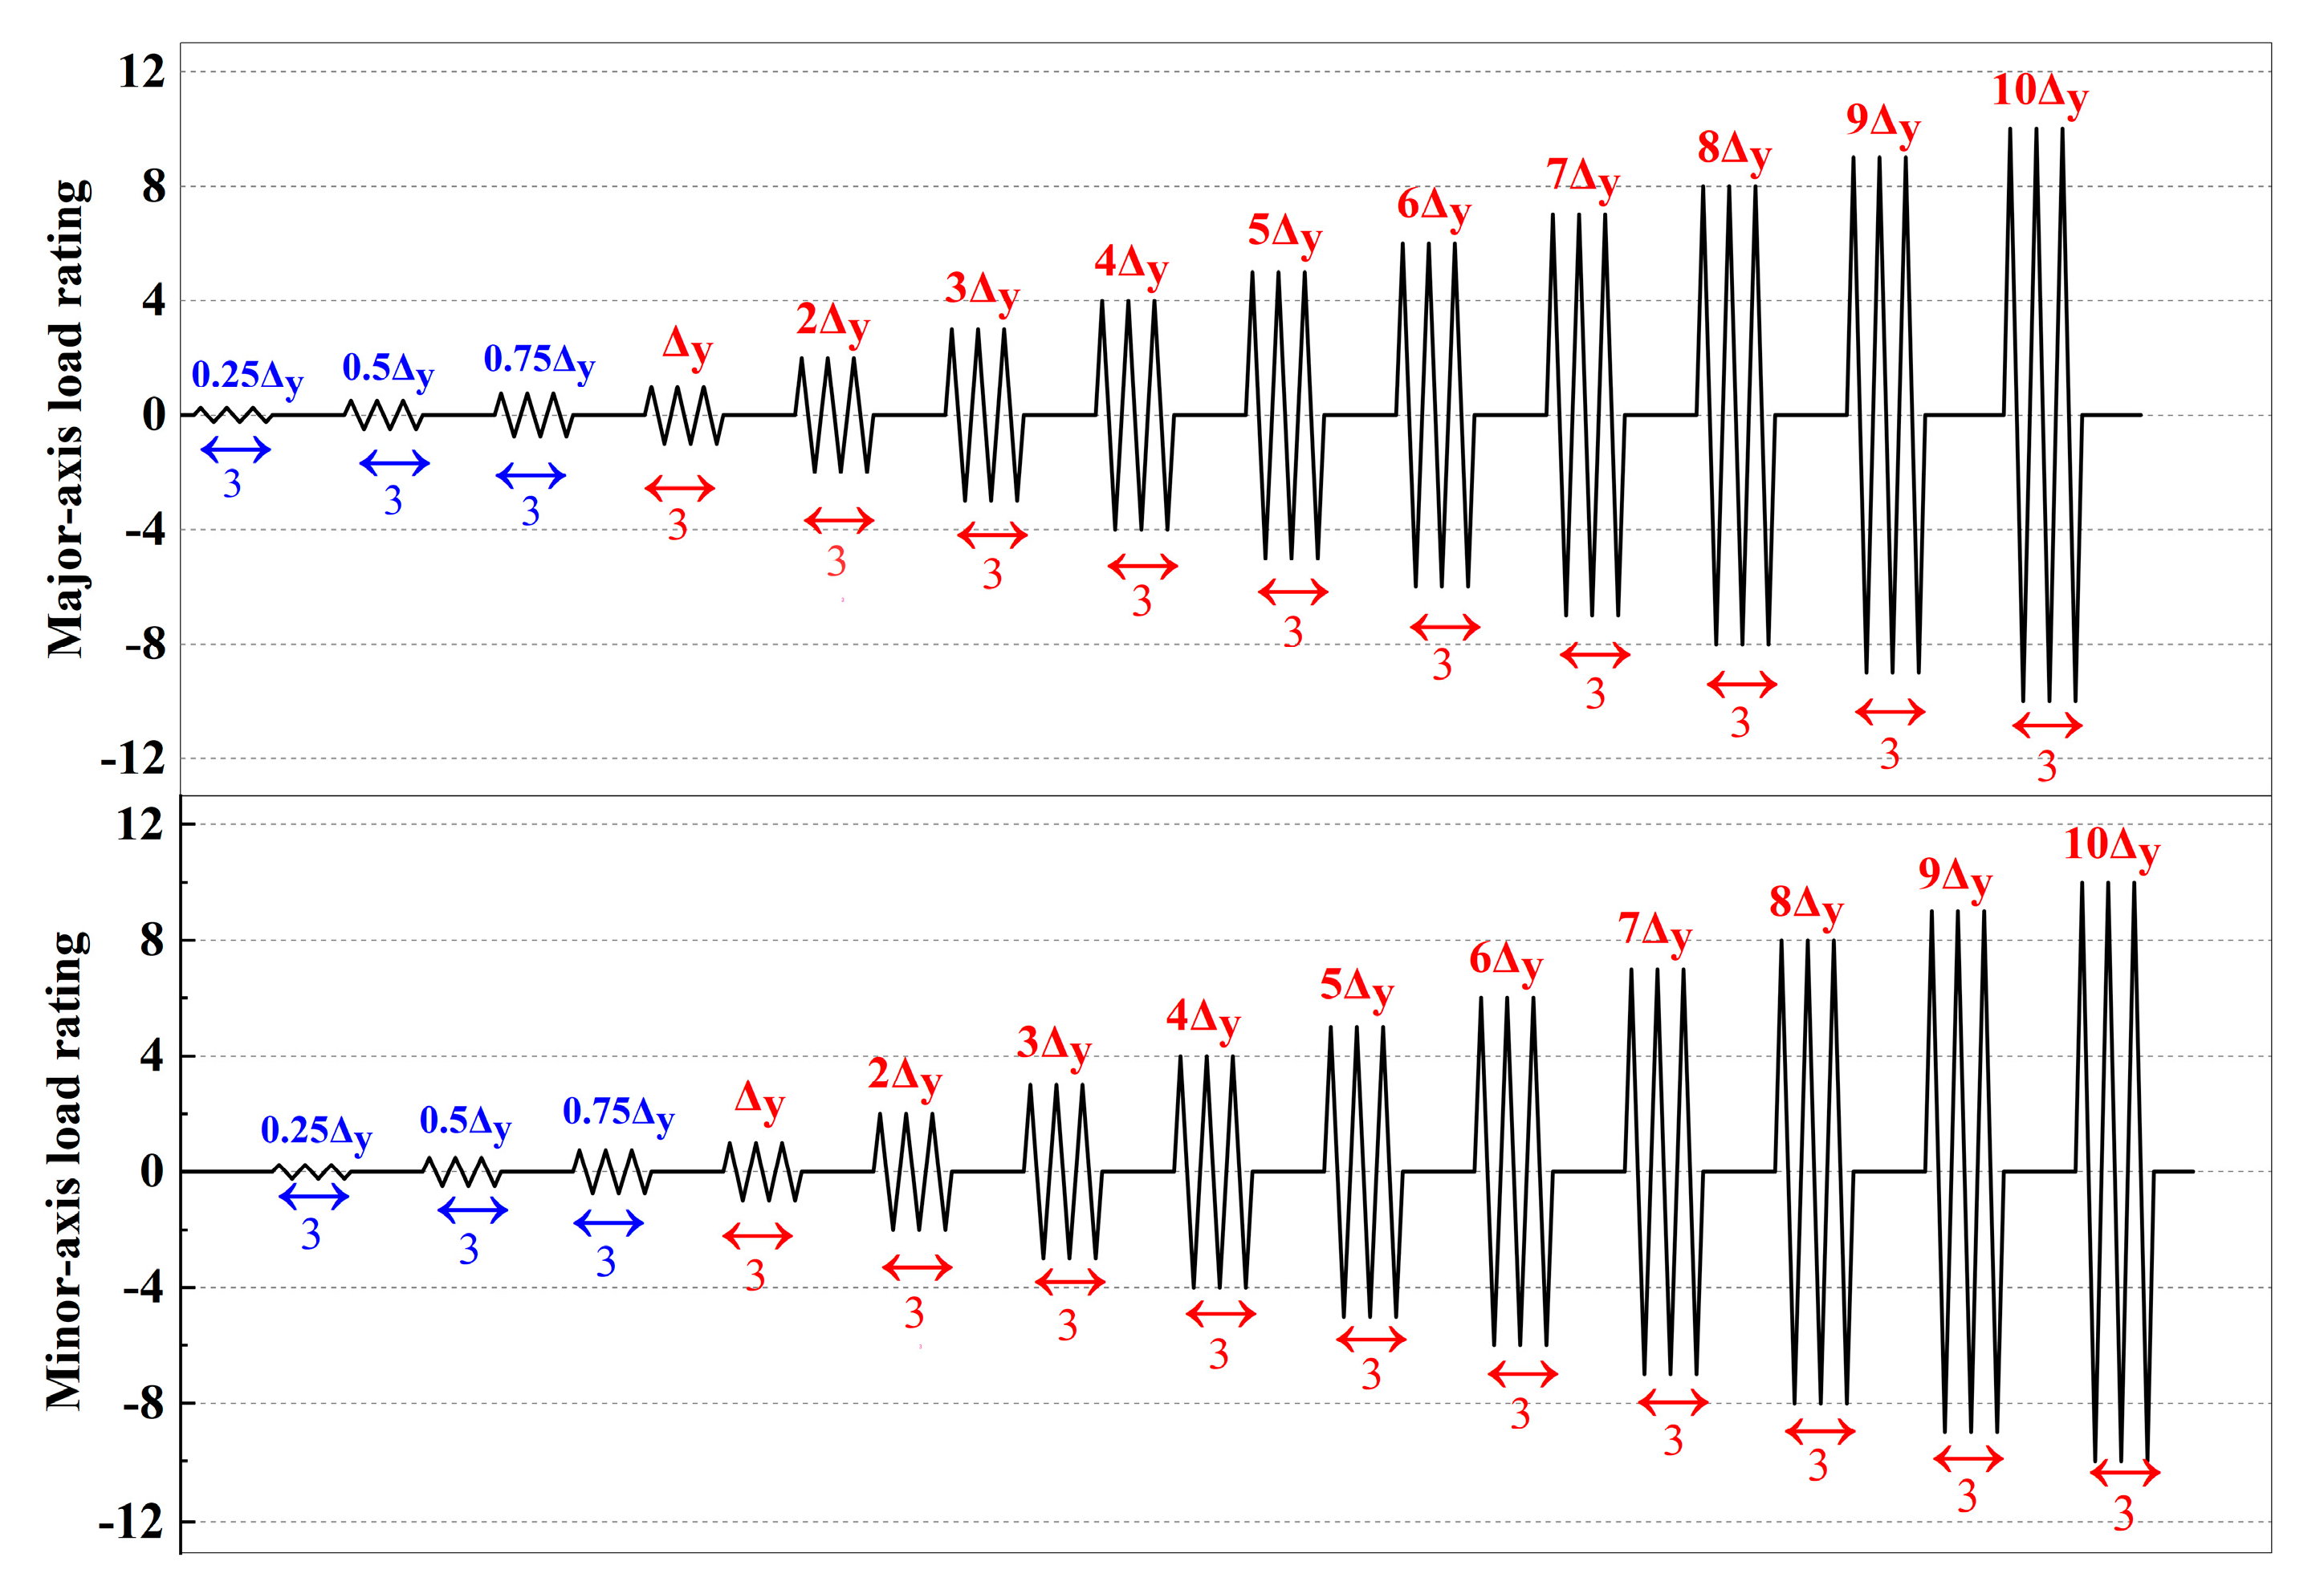
The loading regime for the seismic performance of the specimens was formulated in accordance with the cyclic loading protocol specified in Section 2.8 of the FEMA-461 [37]. This test adopted displacement-controlled cyclic loading along both the major-axis and minor-axis, as shown in Figure 5. A constant 200 kN axial compressive force acts on the column top via a vertical actuator throughout the horizontal loading process, after stabilizing the axial load. Horizontal loading comprises two phases: preloading was conducted to verify sensor functionality and determine the yield displacement, Δy; formal loading was initiated after resetting the actuators to zero load, as depicted in Figure 5. The protocol uses Δy as the benchmark for the load steps, with three cycles per step. Push displacement is defined as positive and pull displacement as negative. During the major-axis loading, the upper and lower actuators apply opposing displacements while the minor-axis actuators remain stationary. Upon completion of one major-axis load step, the minor-axis loading follows identically while the major-axis actuators remain stationary. The test was terminated with T-stub fracture, severe local buckling, or a reduction in load-carrying capacity to 85% of the ultimate force.
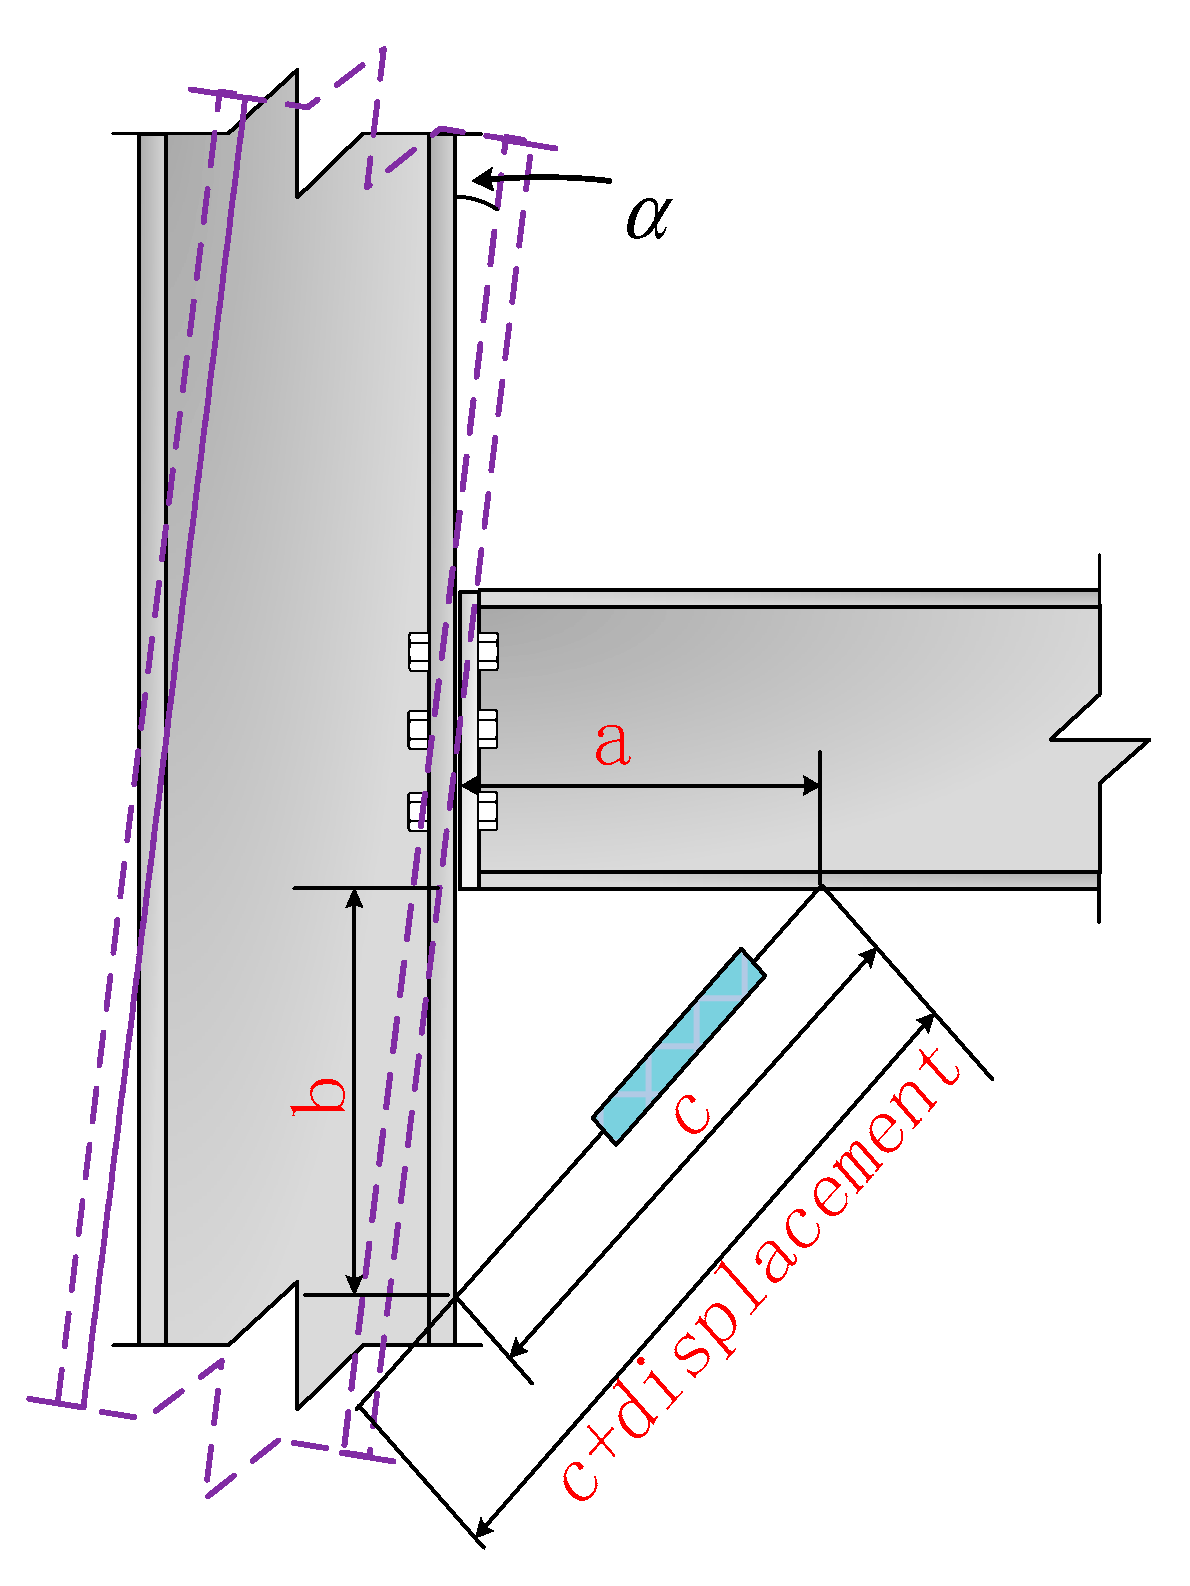
The hysteretic behavior of joints derives from beam-end moments and beam-to-column relative rotations. Beam-end moments are determined by multiplying the support reaction force measured by force sensors by the distance to the T-stub centerline. Beam-to-column relative rotations are calculated from displacements measured at the joint interface using string potentiometers, following Reference [38]. The specific calculation method is shown in Equation (1) and Figure 6. Four string potentiometers were attached to monitor displacements beneath the joint beams—one along the axis of each beam. Strain gauges and rosettes were attached to monitor strain variations at critical locations on the flanges and webs of the T-stubs, frame beams, and frame columns.
α = arccos [ ( c + d i s p ) 2 ( a 2 + b 2 ) 2 a b ] 90 °
where a and b represent the displacement measurement values at positions 0.2 L from the beam end and 0.1 H from the column end, respectively. L and H denote the beam length and column height. This measuring point arrangement can effectively eliminate the interference caused by beam–column bending deformation on the rotation angle measurement.

3. Results Analysis

3.1. Experimental Macroscopic Phenomena

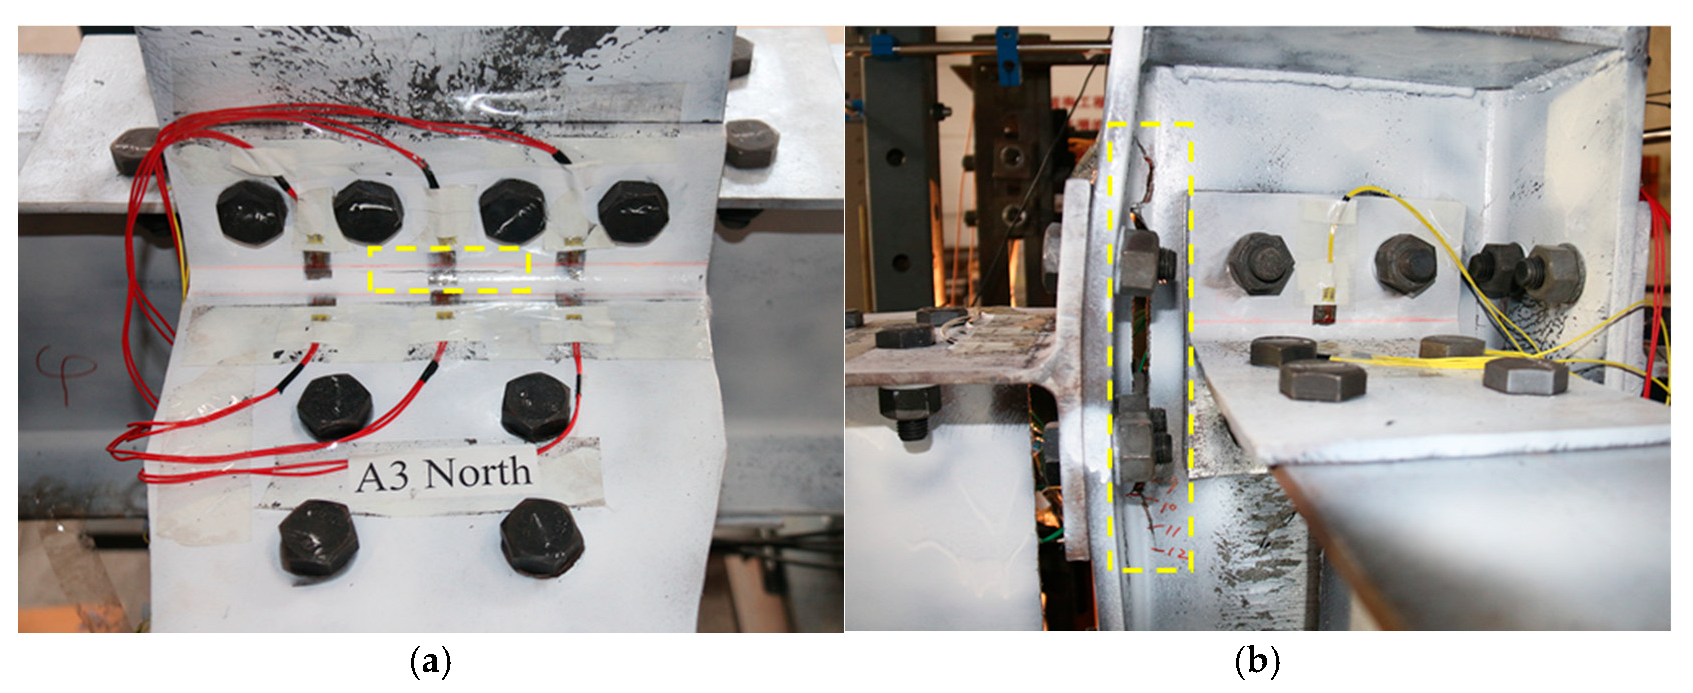
During the preliminary loading phase, no substantial mechanical behavior is observed in the three test specimens. Throughout the testing process, intermittent audible emissions occurred due to friction in the bolted connections, where construction gaps generated noise under cyclic compression. For ease of distinction and description, the yield displacements of TN1, TN2, and TN3 are defined as Δy1, Δy2, and Δy3. During low-cycle reversed loading, the T-stub flanges along the major-axis of TN1 gradually bent during tension–compression cycles, creating gaps at the column flanges that progressively widened. At 6 Δy1, cracks initiated at the flange-to-web junctions of the north upper and south lower T-stubs in the major-axis. Conversely, the minor-axis T-stubs exhibited slow yielding without distinct failure characteristics. Figure 7 shows the final failure pattern of TN1.
Similar to TN1, the failure of TN2 began with deformation of the wedge-shaped T-stub flanges along the major-axis. Before 9 Δy2, the widening of the gap between the wedge-shaped T-stubs and column flanges progressed gradually. However, at 10 Δy2, this phenomenon accelerated sharply, resulting in a through-thickness crack at the flange–web junction of the southernmost upper wedge-shaped T-stub. The minor-axis in-plane failure manifested as cracking at the south flange–web junction. Thus, wedge reinforcement increases the bearing capacity along the major-axis; however, the accompanying increase in ultimate displacement exacerbates failure in the minor-axis. This suggests enhanced material utilization in the minor-axis. Figure 8 shows the final failure pattern of TN2.
Unlike TN1 and TN2, TN3 exhibited T-stub flange deformation and gap formation at the column before 7 Δy3. At 8 Δy3, however, cracking initiated at the column web–flange junction within the joint core, with crack length progressively increasing under higher loads. By 12 Δy3, an 11 mm wide crack led to a total loss of load-bearing capacity, bringing the test to an end. The final failure only involved minor cracking at the north upper thickened wedge-shaped T-stub flange–web junction in the major-axis. Increased flange or web thickness in TN3 enhanced stiffness, which in turn shifted the primary damage to the relatively weaker column web–flange junctions between planes. In the minor-axis, cyclic out-of-plane loading from the symmetrically arranged thickened wedge-shaped T-stubs induced column web deformation, ultimately tearing the web–flange junctions. Figure 9 documents the failure pattern of TN3.

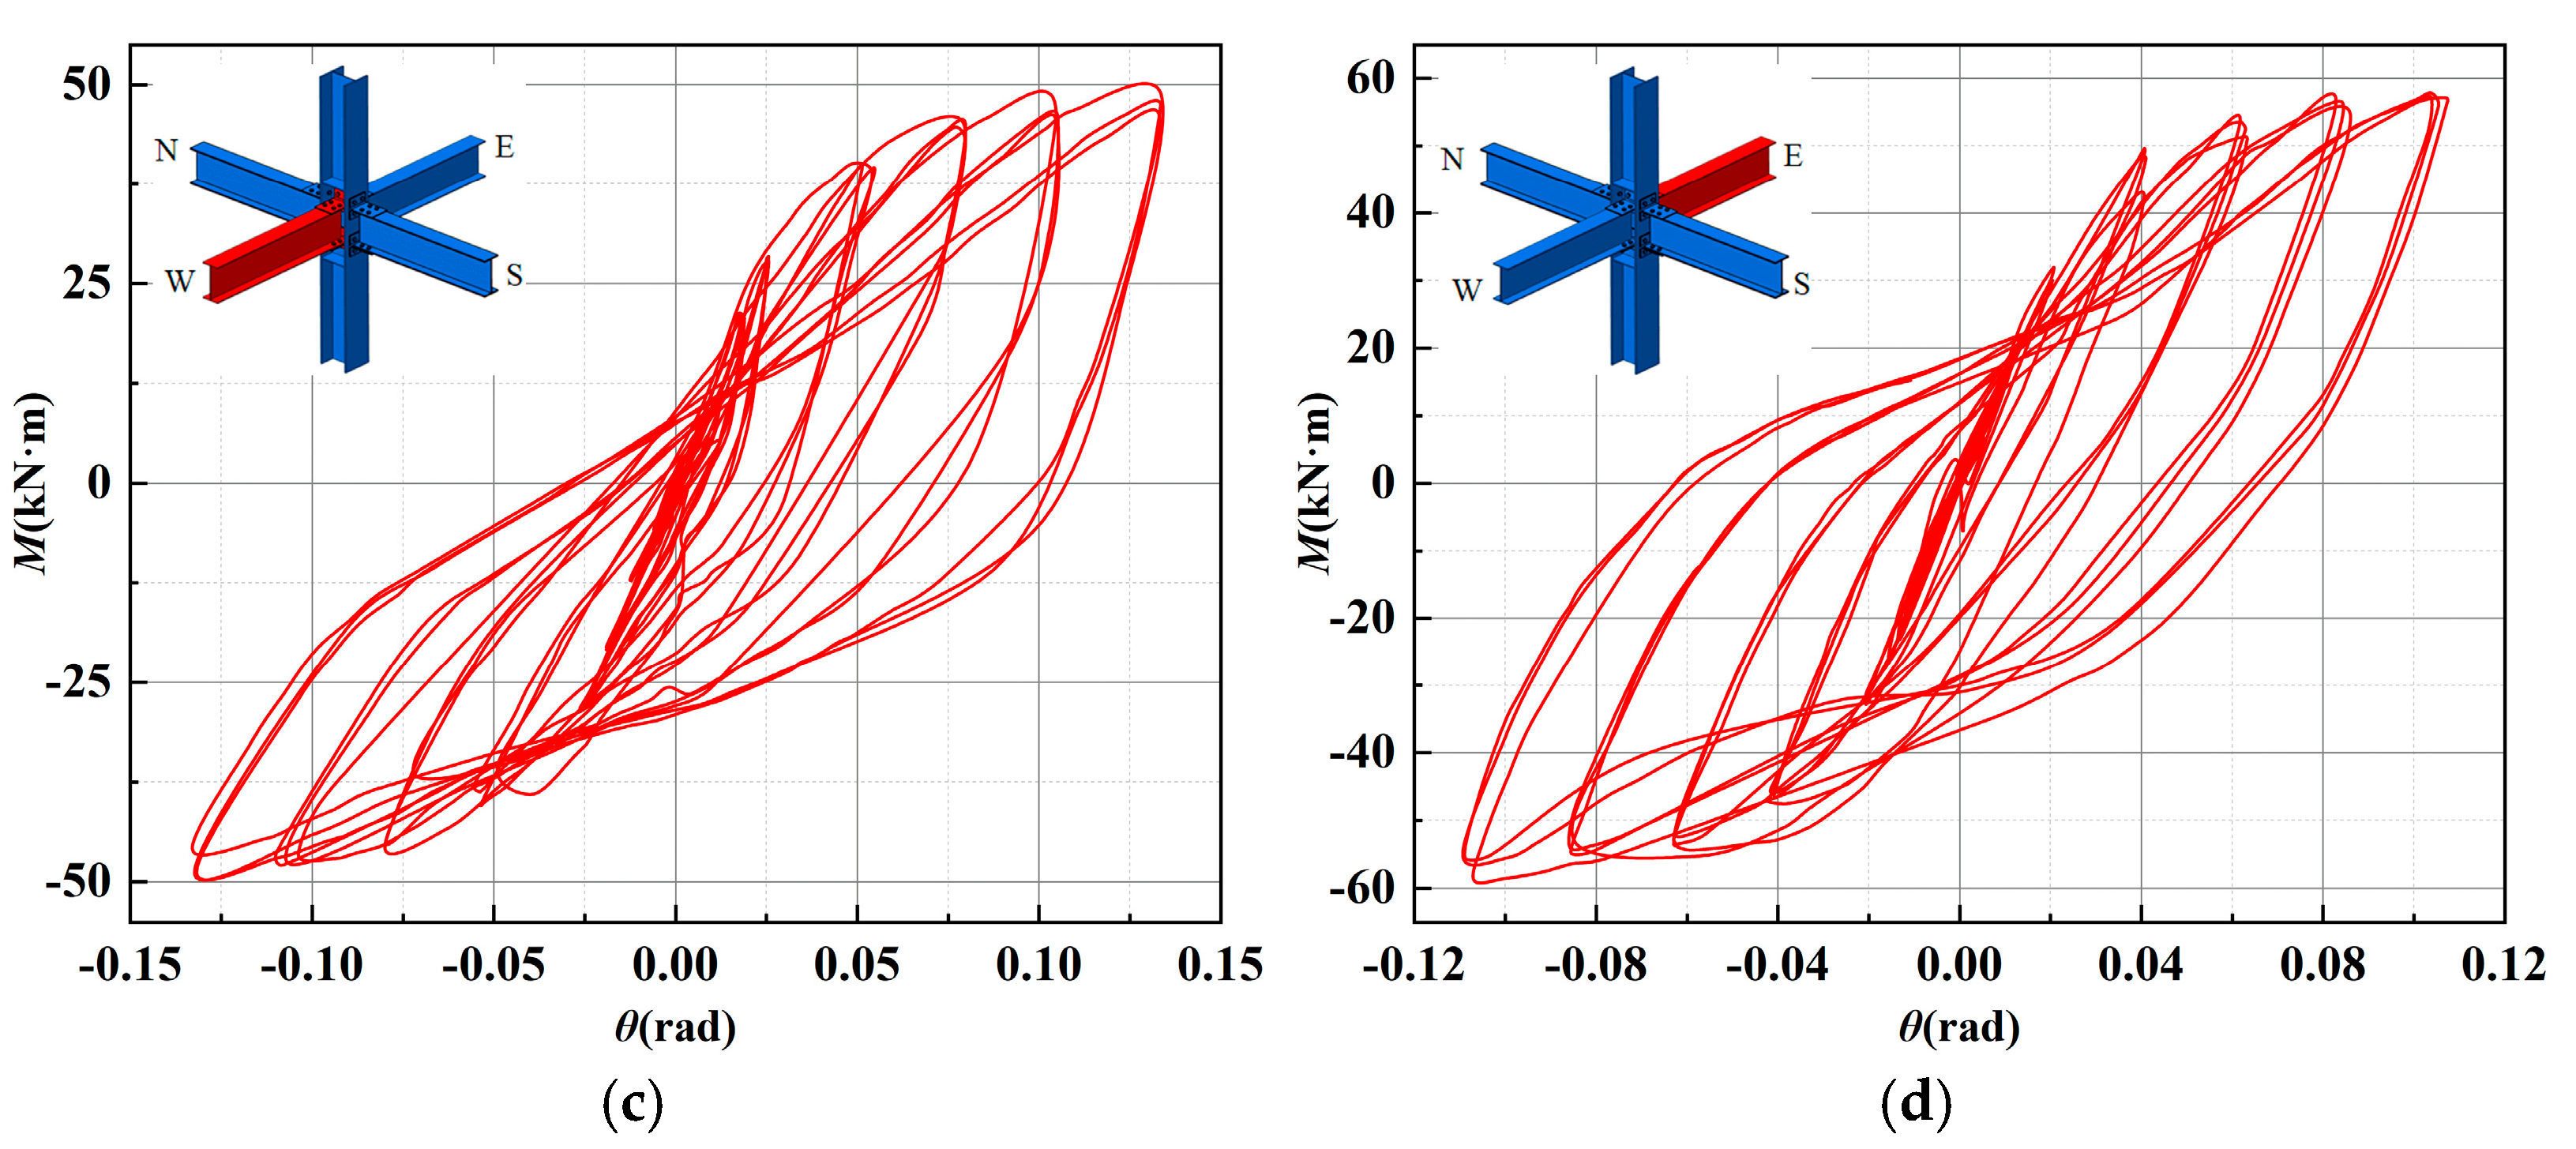
3.2. Hysteretic Curves

Figure 10, Figure 11 and Figure 12 show the moment–rotation hysteresis curves of the specimens. All four loading directions underwent elastic and plastic stages, forming spindle-shaped hysteresis loops with complete contours in the major-axis and minor-axis. This demonstrates favorable plastic deformation capacity and energy dissipation. However, pinching occurred in the minor-axis in-plane curves during the later loading stages due to bolt slippage. The curves of the major-axis exhibited a higher peak moment capacity but lower deformation capacity than the minor-axis across all the specimens. TN2 with the wedge-shaped T-stubs showed an increased bearing capacity and larger hysteresis loop areas compared to TN1, indicating that wedge reinforcement enhances stiffness and strength while reducing deformation capacity. In the minor-axis, where the T-stub dimensions remained unchanged, TN2 exhibited hysteresis behavior similar to TN1, with comparable bearing capacity and rotation angles, and no significant strength degradation.
In TN3, the increased flange and web thickness enhanced the stiffness and bearing capacity relative to TN2, but further reduced the deformation capacity. TN3 exhibited enhanced cyclic stability along the major-axis, as reflected by fuller hysteresis loops. However, early strength degradation occurred in both loading directions in the minor-axis due to cracking at the column web–flange junction within the joint core zone. Consequently, thickening T-stubs significantly alters the mechanical behavior in both planes.

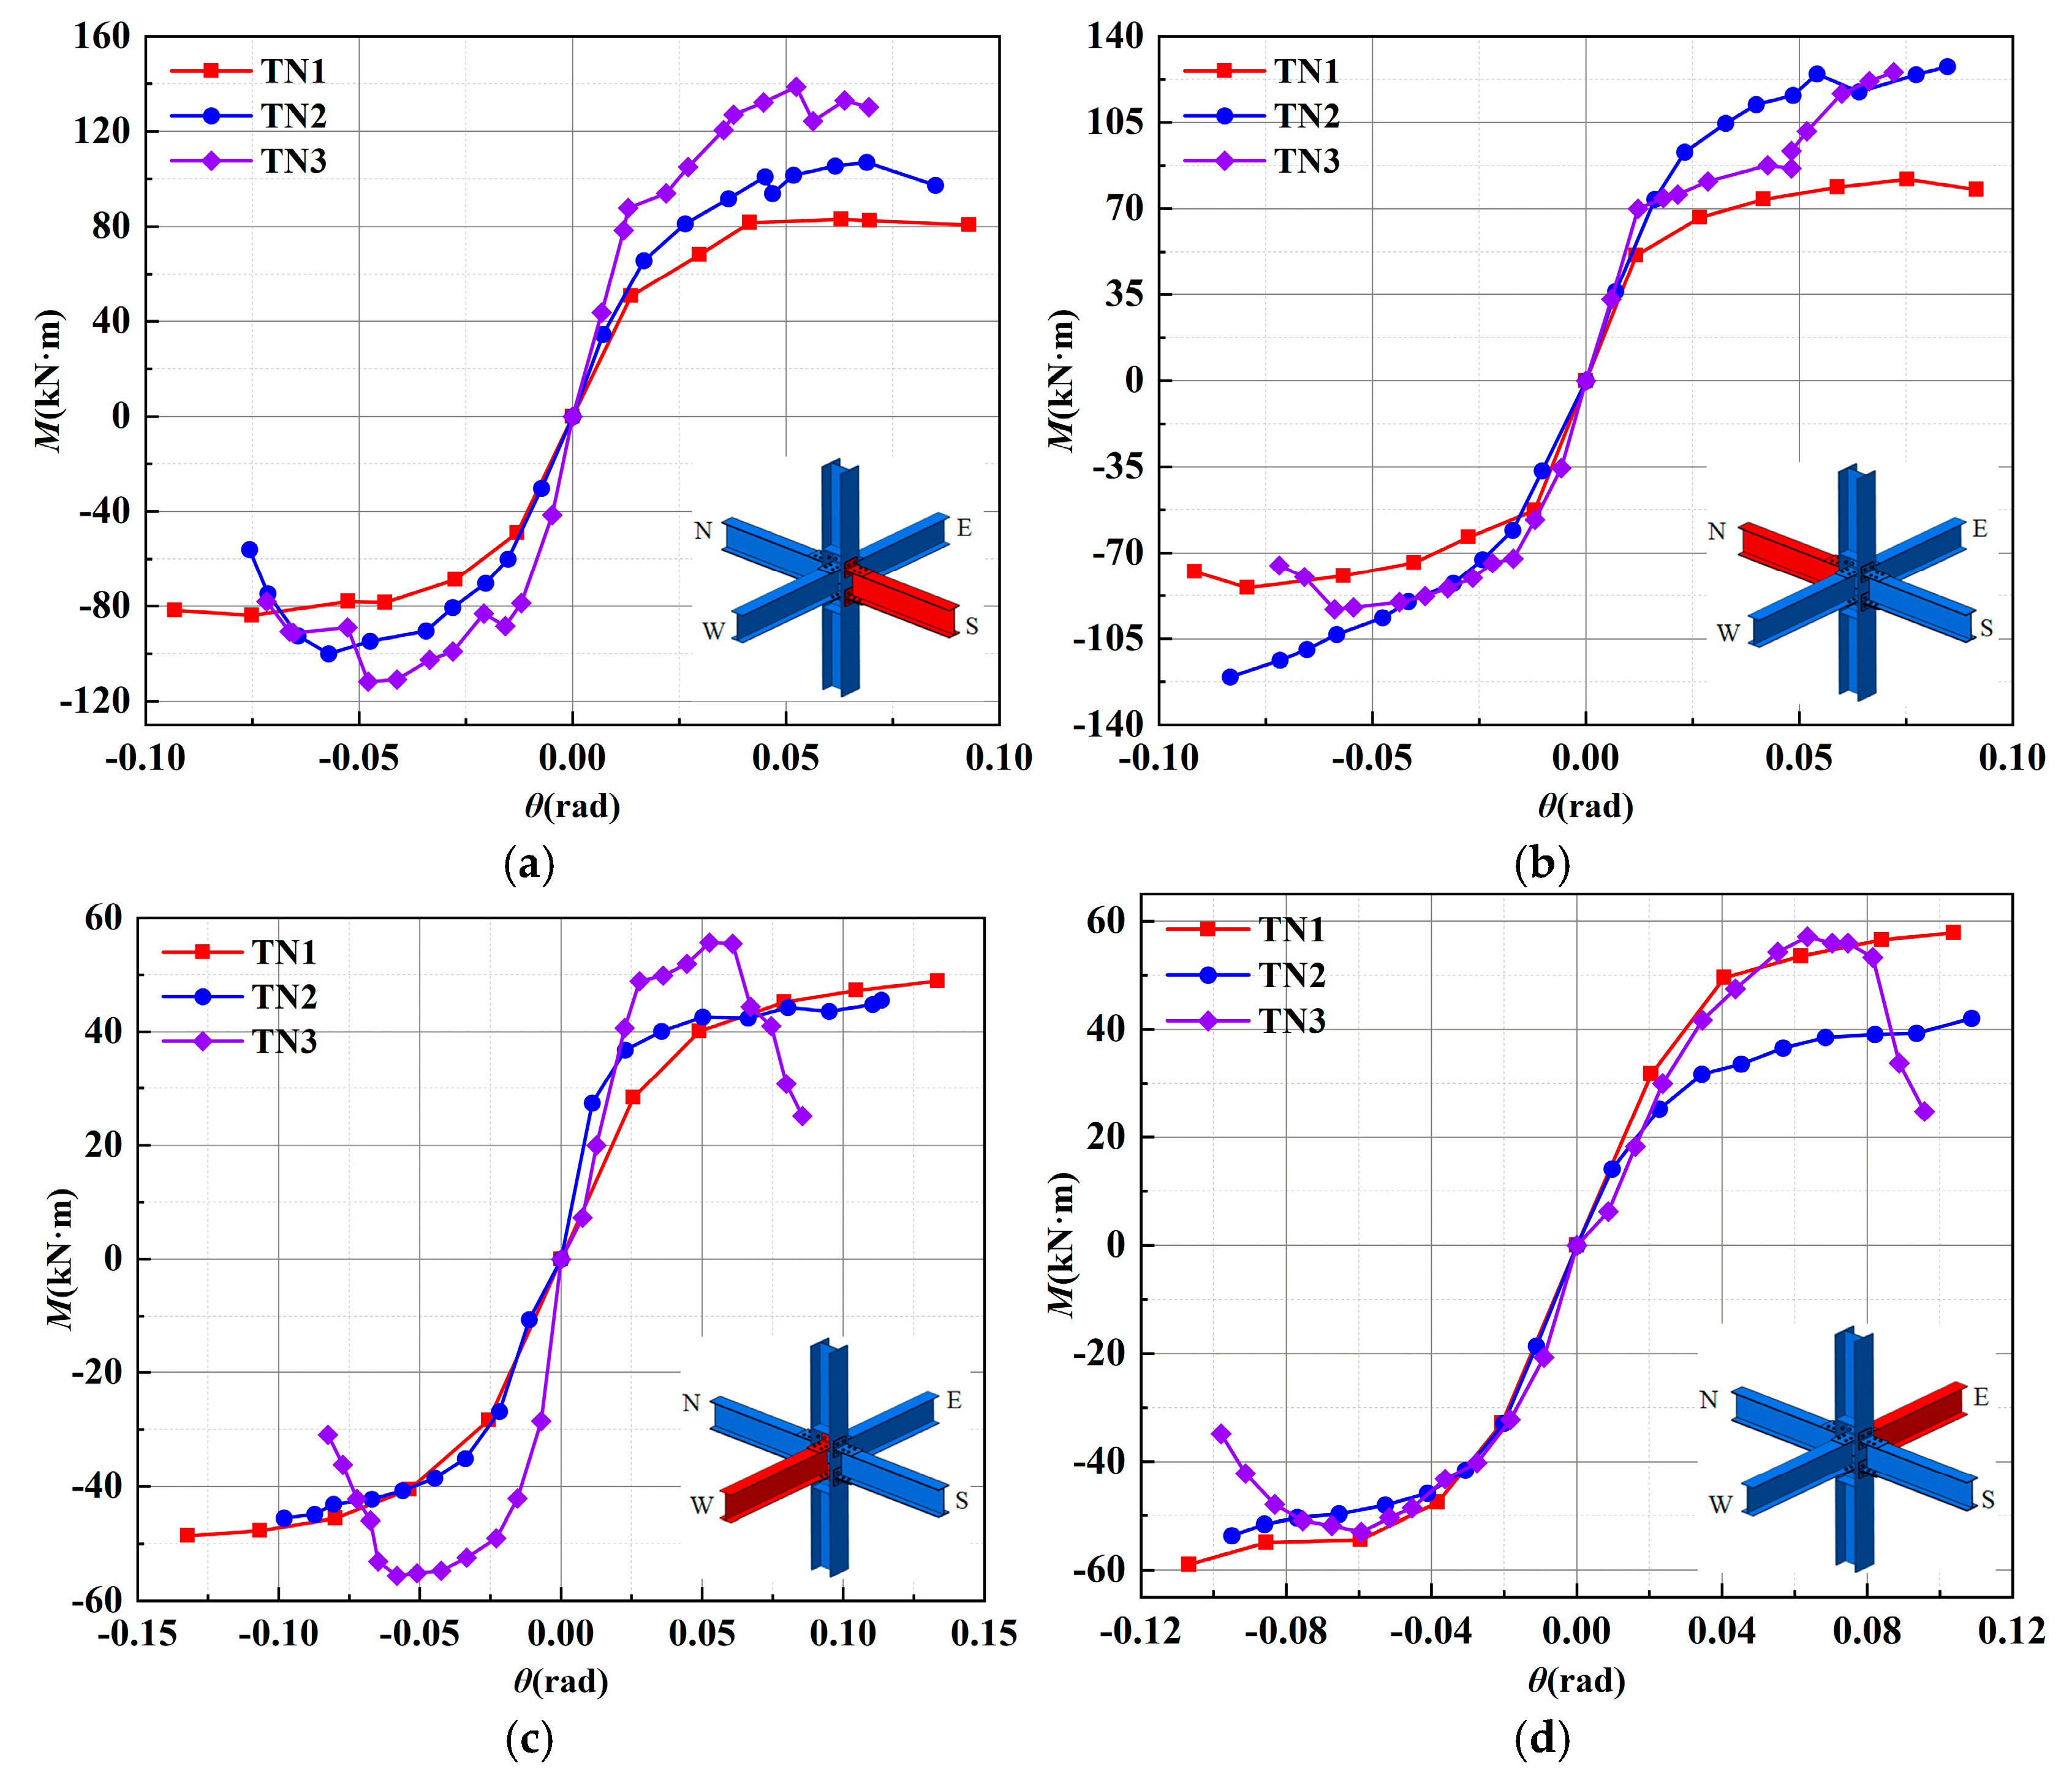
3.3. Skeleton Curves

Figure 13 shows the skeleton curves for the specimens along the major-axis and minor-axis. All curves exhibit distinct yield, peak, and failure phases, with T-stub configurations inducing directional variations. Compared to TN1, TN2 shows reduced rotation angles, most notably during yielding, indicating restricted rotational deformation. Load analysis reveals that the major-axis (Figure 13a,b) of TN2 has a higher bearing capacity and slower degradation. Conversely, in the minor-axis (Figure 13c,d), identical T-stubs yielded reduced capacity due to the effects of the major-axis wedging. The major-axis (Figure 13a,b) exhibited divergent directional responses: an increased peak load in the south versus a decreased peak load in the north. Overall, increasing the T-stub thickness of T-stubs from 12 mm to 14 mm improved the joint’s bearing stability. For TN3, its rotational capacity is further reduced due to the thickened wedge-shaped T-stubs. Although TN3’s peak bearing capacity along the minor axis (Figure 13c,d) is higher than that of TN2, its strength degradation rate is relatively fast.

3.4. Stiffness Degradation

Once a structural member enters the plastic range, its rotational stiffness is quantified using secant stiffness, calculated via Equation (2).
K i = + M i + M i + θ i + θ i
where Mi denotes the peak moment at cycle i; θi denotes the rotation angle at cycle i.
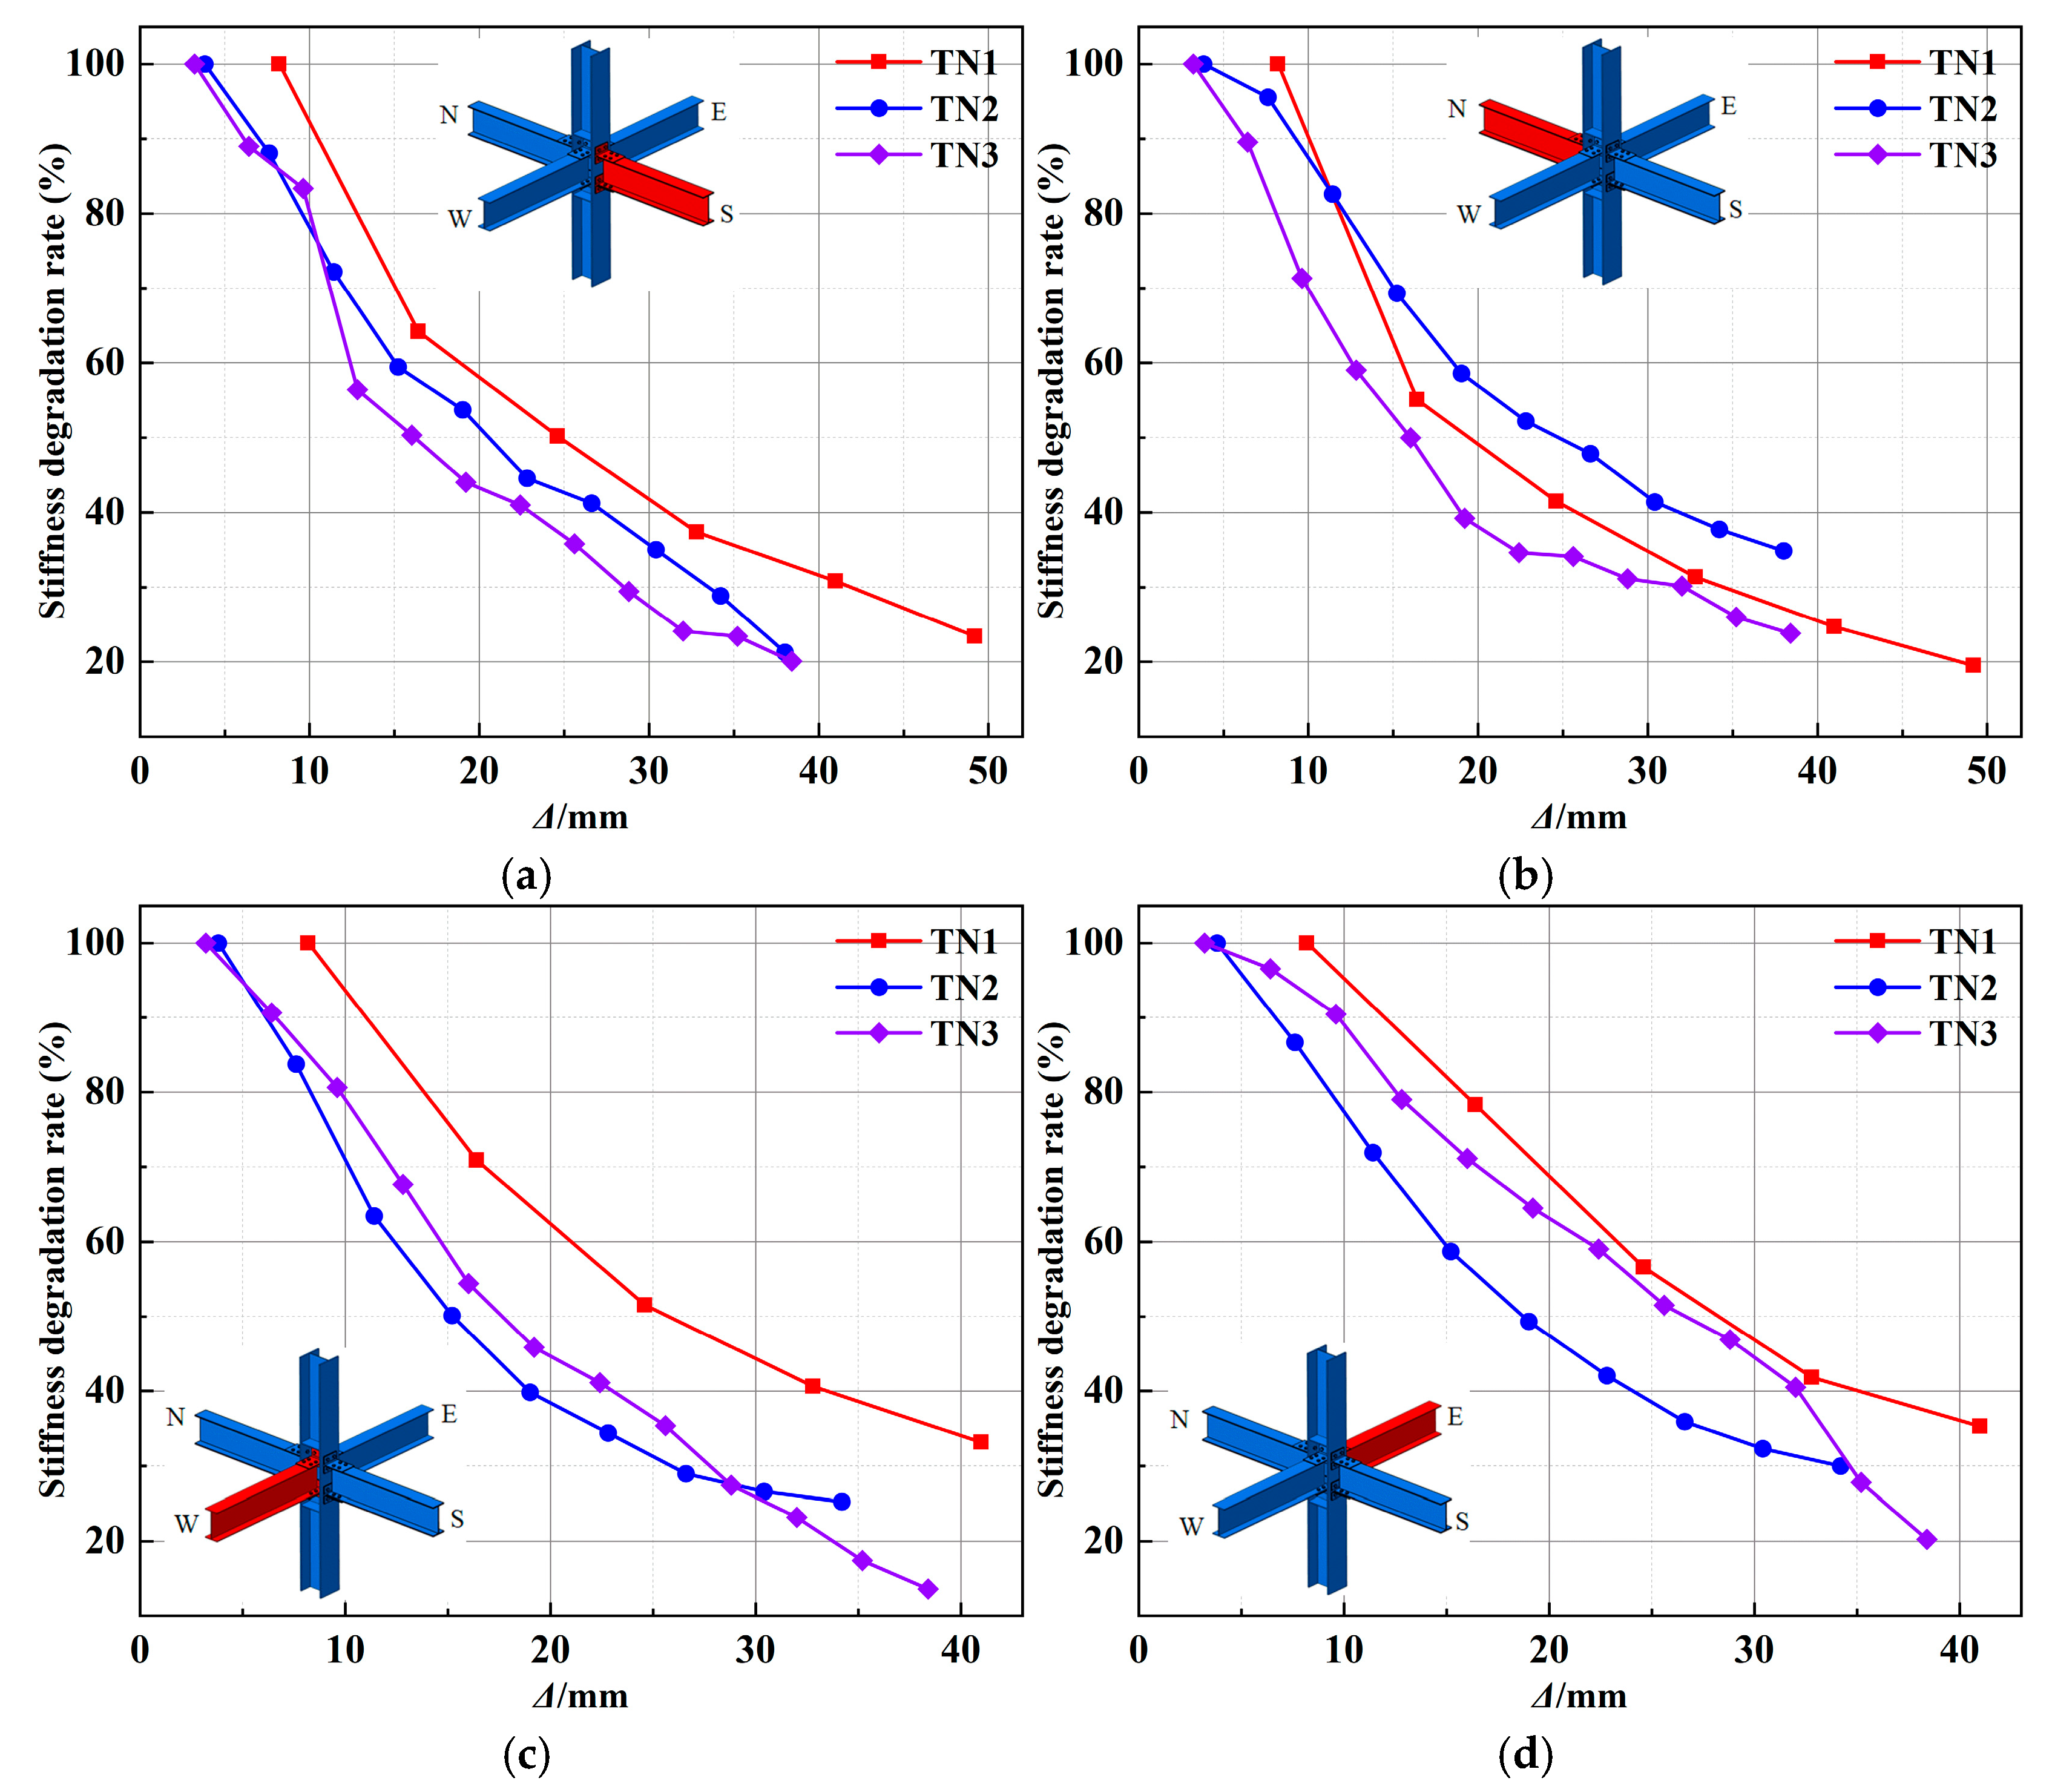
The initial rotational stiffness in all four directions is calculated for each specimen using Equation (1). Average initial stiffness values for the major-axis and minor-axis are determined by averaging the directional values. In the major-axis, the average initial stiffness values for the specimens TN1, TN2, and TN3 are 4043 kN·m/rad, 4360 kN·m/rad, and 6603 kN·m/rad, respectively. In the minor-axis in-plane, the corresponding values are 1339 kN·m/rad, 1635 kN·m/rad, and 1980 kN·m/rad, respectively. The initial rotational stiffness follows the order TN1 < TN2 < TN3 in both planes. T-stub reinforcement improved initial stiffness, though increased thickness was found to be the most effective method; TN3 exhibited 63.3% greater the major-axis stiffness than TN2. Despite no modification to the minor-axis T-stubs in TN2, the minor-axis stiffness of TN2 increases due to the influence of the major-axis wedge-shaped T-stubs. Figure 14 shows the directional degradation patterns; all directions exhibit a rapid initial degradation phase followed by a progressive slowdown. The major-axis degradation in the higher-stiffness TN2 exhibited directional dependence, with accelerated degradation only in the south direction relative to TN1. In contrast, the thickened wedge-shaped T-stubs in TN3 increased degradation rates significantly, whereas the minor-axis in-plane degradation accelerated in TN2 under the influence of the major-axis. Thickened wedge-shaped T-stubs reduced degradation rates in this case.

3.5. Energy Dissipation Capacity

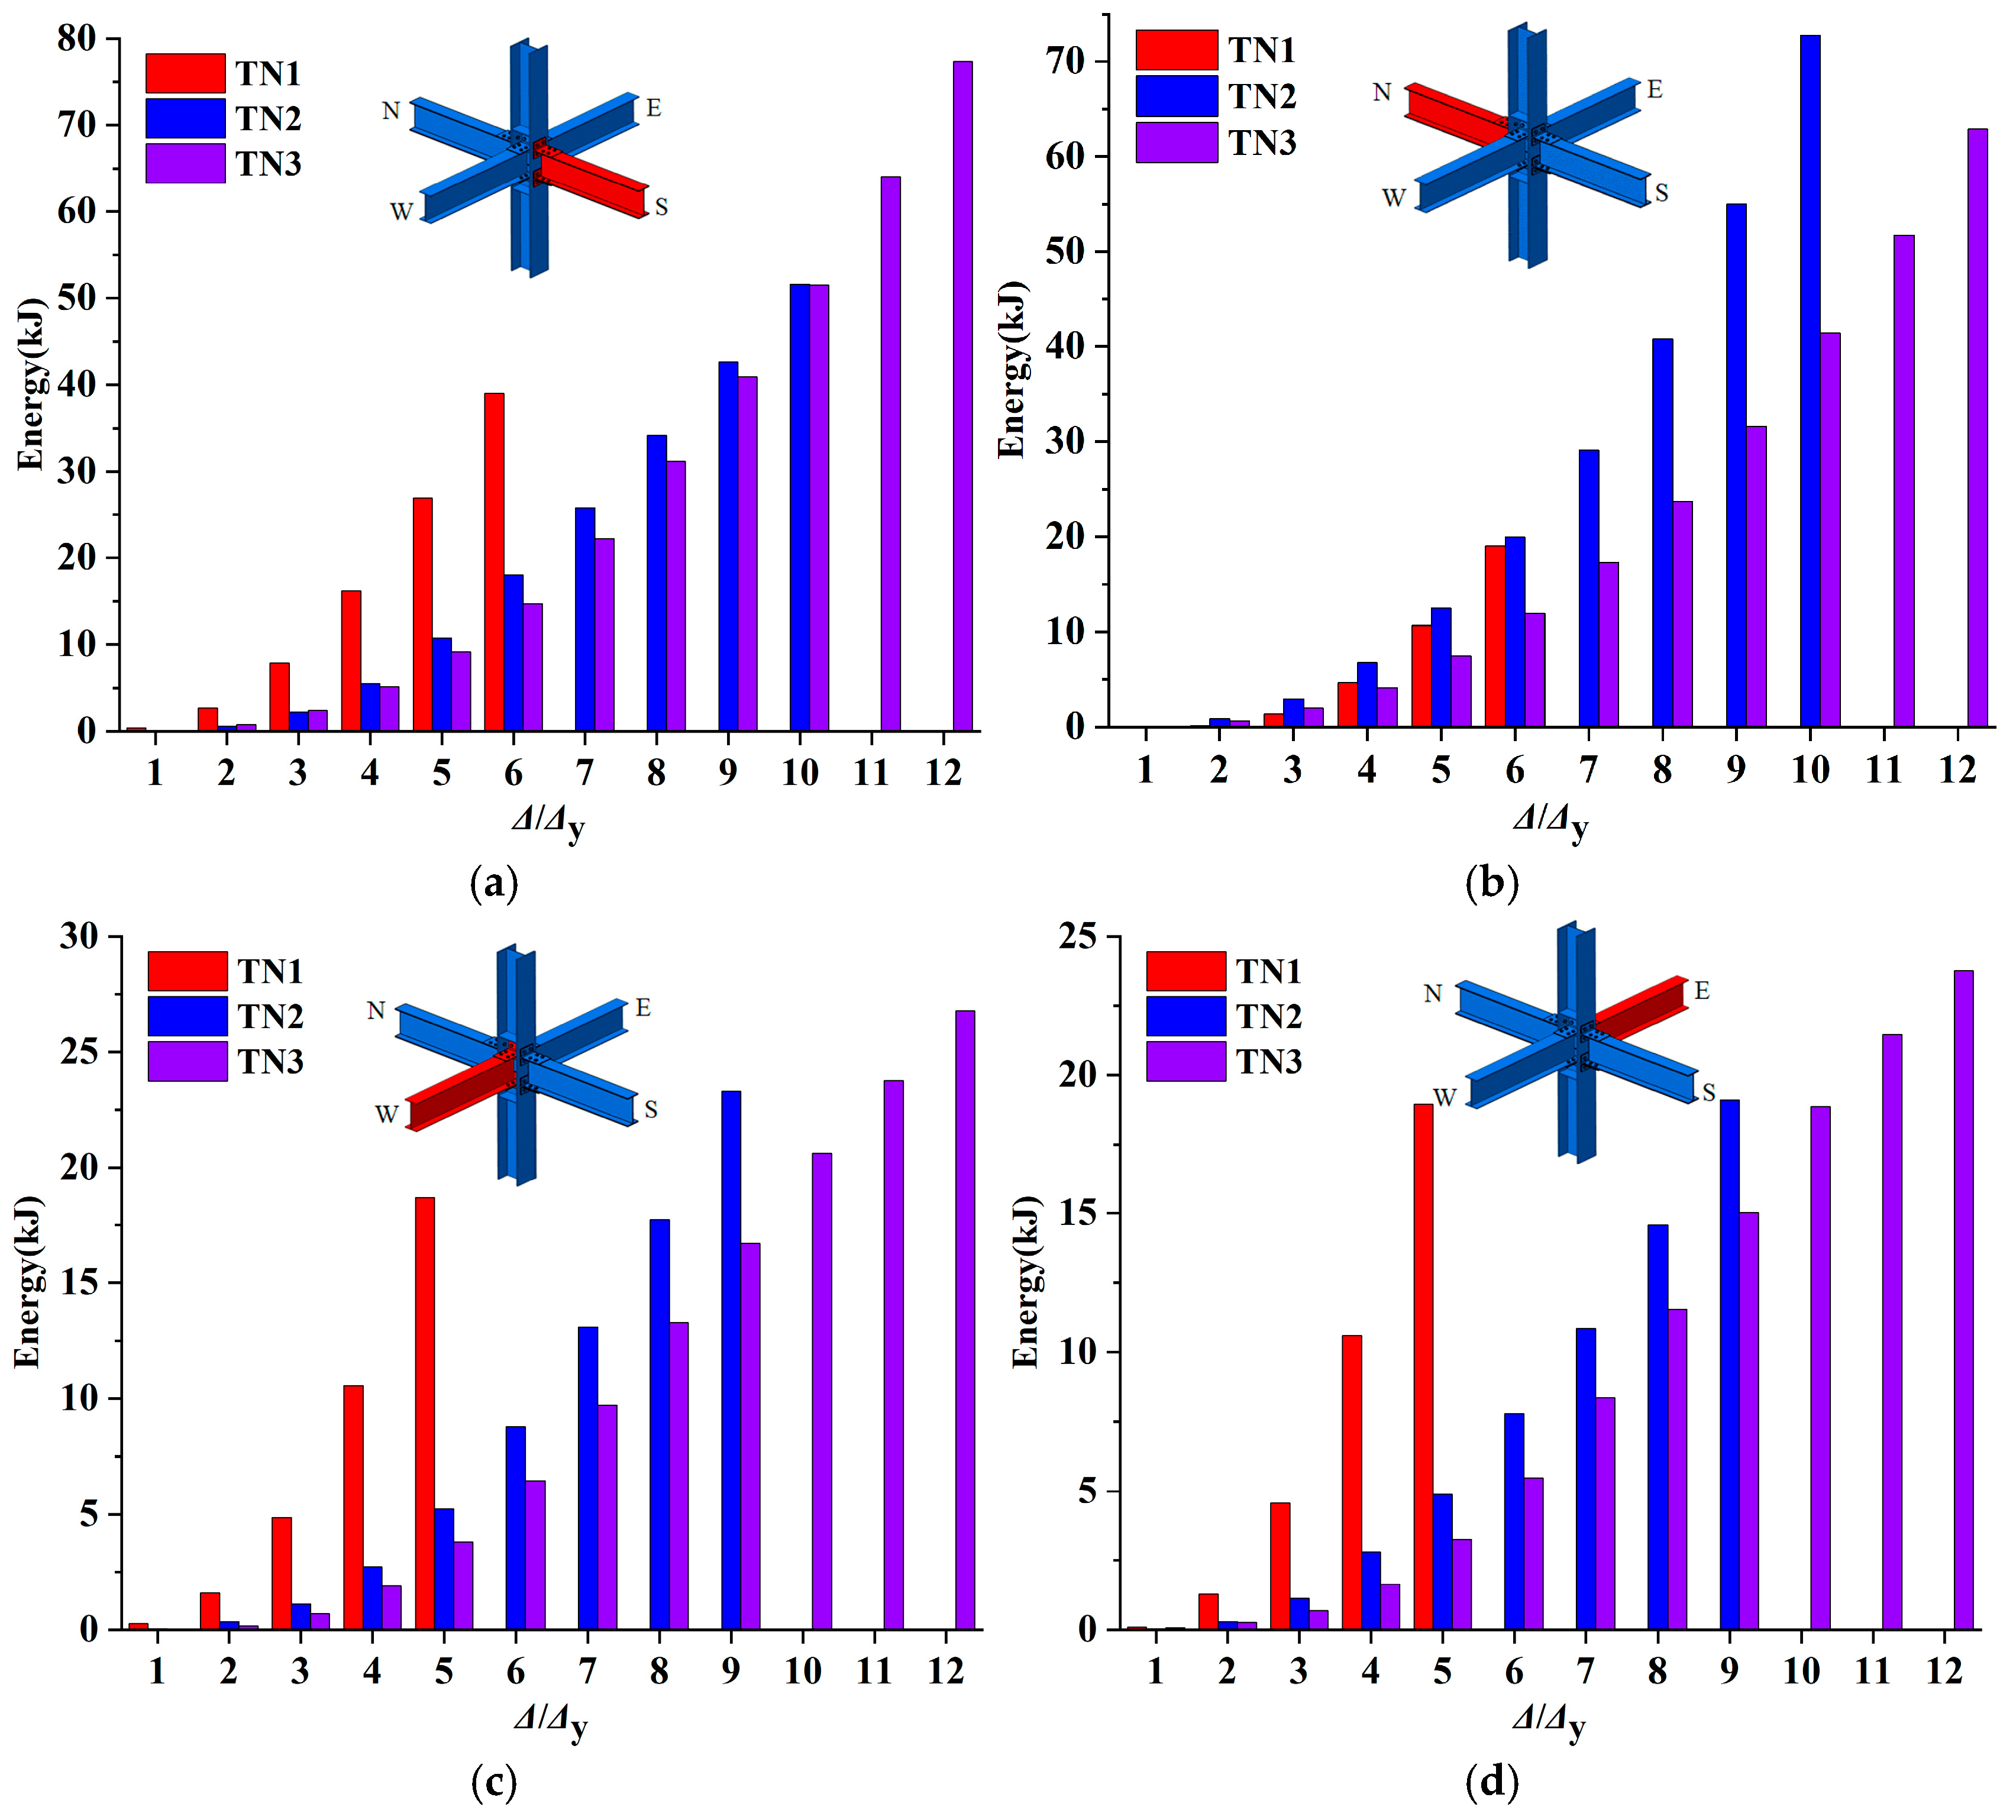
The area of the hysteretic loop effectively characterizes the energy dissipation capacity of each specimen. Figure 15 compares the cumulative energy dissipation across loading amplitudes for the three specimens. The results show that there is superior energy dissipation along the major-axis than along the minor-axis. TN2 exhibits the most significant difference in the major-axis. Comparing the energy dissipation capacity, TN2 demonstrates greater cumulative dissipation in both planes relative to TN1, with its total bidirectional energy dissipation along the major-axis being 1.14 times that of TN1. For TN3, minor differences in bidirectional energy dissipation are observed along the major-axis. However, it shows an increasing trend with a higher growth rate than the minor-axis.

4. Damage Assessment

Structures accumulate damage under cyclic loading. The seismic damage models quantify the damage levels of structures through defined damage variables, enabling standardized assessment of post-damage performance indicators and thus providing a basis for seismic performance evaluation. Since energy dissipation capacity is a key reflection of seismic performance, this study adopts the energy-based damage model developed by Darwin et al. [39] to characterize the cumulative damage of T-stub spatial joints under different loading amplitudes. The damage index is defined in Equation (3).
D = i = 1 N E i F y ( S u S y )
where Ei represents hysteretic energy dissipation at cycle i; N denotes the final cycle number; Fy corresponds to specimen yield load; Sy indicates specimen yield displacement; and Su signifies specimen ultimate displacement.
The damage index D exhibits a monotonic increase within the interval [0, 1]. An undamaged state is represented by D = 0, whereas complete failure is indicated by D = 1.
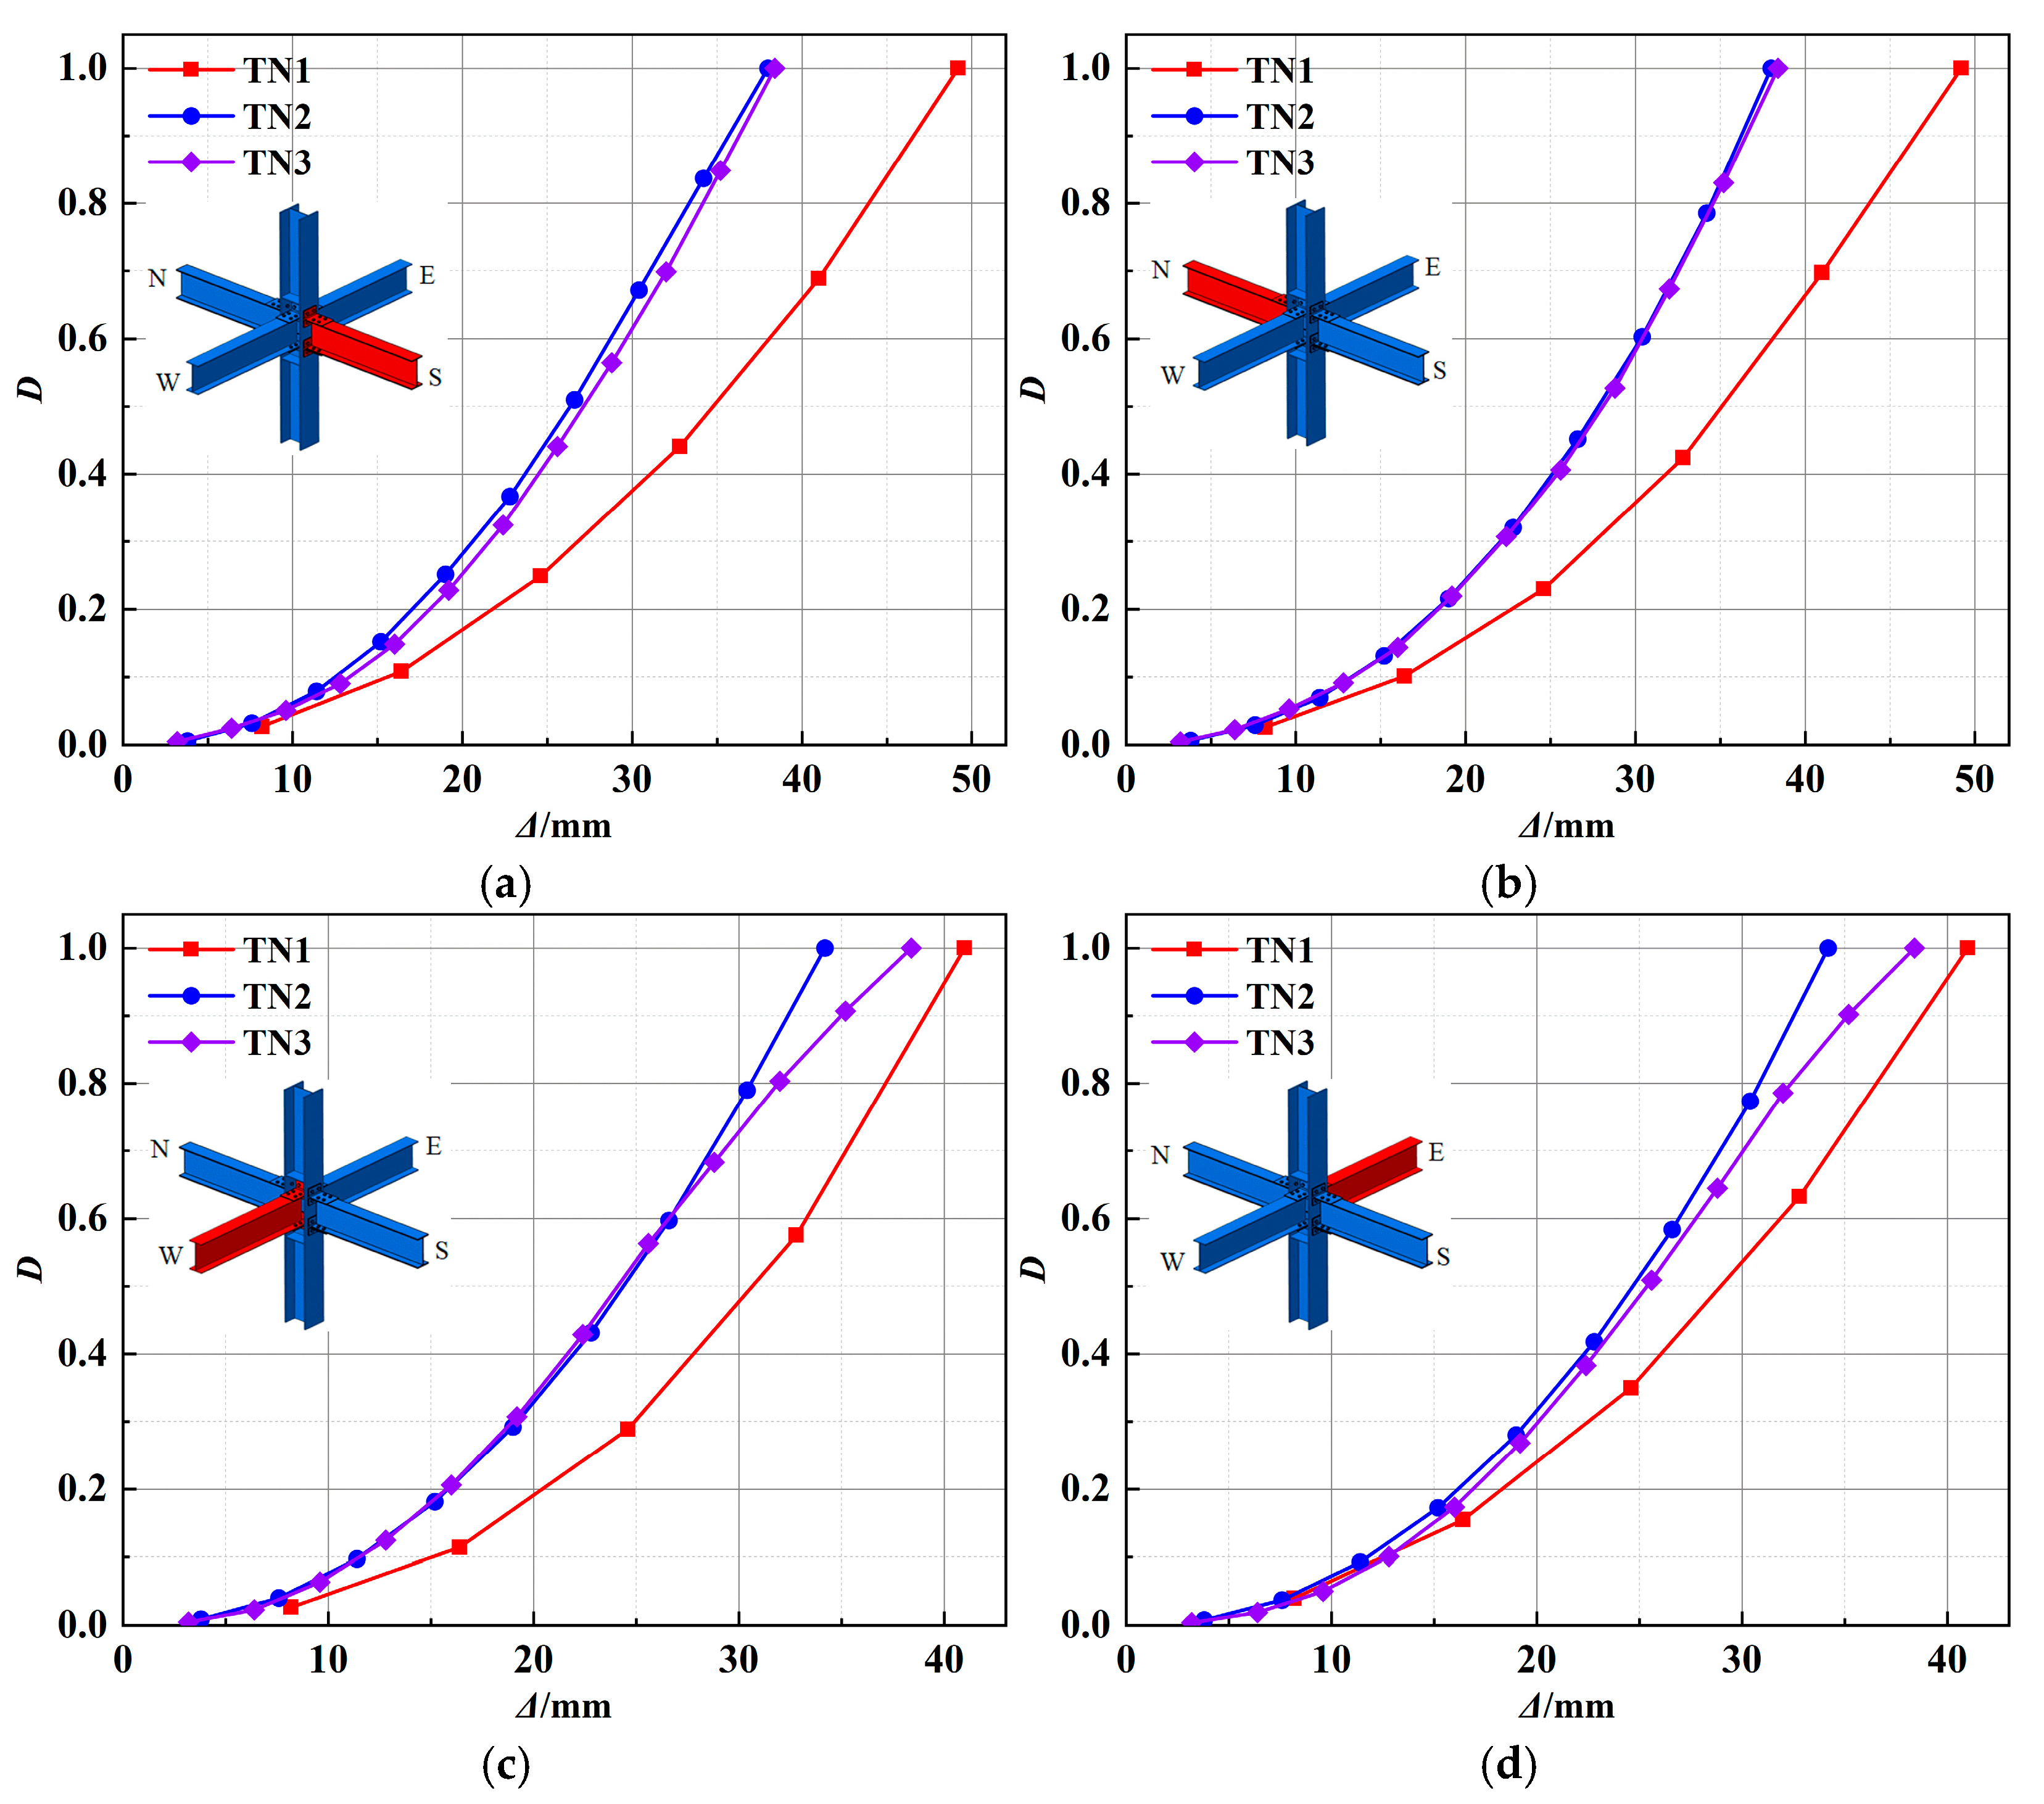
To characterize damage evolution across loading amplitudes, normalized damage indices for the three specimens were computed using Equation (3). Figure 16 shows the resulting progression curves. All the specimens maintained D < 0.1 during initial loading. As displacement amplitudes increased, damage accumulation accelerated progressively until failure at test termination. TN2 exhibited greater damage accumulation in the major-axis and minor-axis compared to TN1. Thus, enhanced joint rotational stiffness under identical yield displacements contributes to accelerated damage progression. In contrast, TN3 showed negligible differences in major-axis in-plane damage evolution relative to TN2, but reduced minor-axis damage accumulation during later loading stages.

5. Conclusions

To enhance the bearing capacity and seismic performance of semi-rigid spatial T-stub joints, this study applied wedge-shaped reinforcement to T-stubs, and further investigated the effect of T-stub thickness increases on the mechanical behavior of the joints. Subsequently, pseudo-static tests were conducted on the three types of T-stub joints, with TN1 using ordinary T-stubs, TN2 using wedge-shaped T-stubs, and TN3 using thickened wedge-shaped T-stubs. The seismic performance of each specimen was comparatively analyzed, and the damage was assessed. The principal conclusions are as follows:
(1) Failure in TN1 and TN2 mainly resulted from severe damage to the T-stubs along the major-axis, though TN2 exhibited a greater extent of damage in the minor-axis than TN1 did. By comparison, the ultimate failure zone of TN3 was predominantly localized in the minor-axis. This indicates that reinforcing T-stubs in either the major-axis or minor-axis can modify the plastic strain distribution within the joint region to varying degrees.
(2) Under low-cycle loading, all the specimens demonstrated a significantly higher energy dissipation capacity along the major-axis than along the minor-axis. In contrast, their deformation capacity along the major-axis was lower than that along the minor-axis. This spatial characteristic necessitates consideration in the design of T-stub joints.
(3) Owing to the wedge-shaped and thickened wedge-shaped modifications to T-stubs, TN2 and TN3 exhibited a sequential increase in both bearing capacity and energy dissipation along the major-axis, accompanied by reduced deformation capacity. In the minor-axis, the use of thickened wedge-shaped T-stubs similarly enhanced bearing capacity and energy dissipation, but resulted in a more pronounced reduction in deformation capacity.
(4) Compared to the joints using ordinary T-stubs, those with wedge-shaped T-stubs exhibited improved rotational stiffness. The joints with thickened wedge-shaped T-stubs achieved the most significant improvement in rotational stiffness in the major-axis. In contrast, the joints using wedge-shaped T-stubs exhibited a relatively faster stiffness degradation rate.
(5) From an energy perspective, under identical yield displacements, the reinforced specimens TN2 and TN3 exhibited greater damage severity than that of TN1. Among the reinforcement methods, the use of thickened wedge-shaped T-stubs had a comparatively smaller impact on joint damage.
(6) It is suggested that shaking table tests be conducted in subsequent studies to explore the failure paths and failure modes that may differ under dynamic loading compared with those under quasi-static loading. This research will not only facilitate the systematic identification of potential weak points but also lay a foundation for a more comprehensive evaluation of the seismic performance of T-stub joints.

Author Contributions

Conceptualization, X.W. and X.B.; Data curation, X.B.; Formal analysis, Z.Z.; Funding acquisition, X.W.; Methodology, Y.C.; Project administration, X.W.; Resources, B.S.; Software, X.Y.; Supervision, Q.H.; Visualization, Q.H.; Writing—original draft, Y.C.; Writing—review and editing, Y.C. All authors have read and agreed to the published version of the manuscript.

Funding

This study was supported by the National Natural Science Foundation of China (Grant NO. 51278238), Henan Provincial Science and Technology Research Project of China (Grant NO. 242102320018), and Natural Science Foundation of Henan Province of China (Grant NO. 252300421260).

Data Availability Statement

The testing and analysis data used to support the findings in this study are included within the article.

Conflicts of Interest

The authors declare no conflicts of interest.

References

  1. Simoncelli, M.; Tagliafierro, B.; Montuori, R. Recent development on the seismic devices for steel storage structures. Thin Walled Struct. 2020, 155, 106827. [Google Scholar] [CrossRef]
  2. Zhang, Y.; Ding, K.W. Study on seismic behavior of fabricated beam-column bolted joint. J. Constr. Steel Res. 2022, 82, 801–812. [Google Scholar]
  3. Prinz, G.S.; Nussbaumer, A.; Borges, L.; Khadka, S. Experimental testing and simulation of bolted beam-column connections having thick extended endplates and multiple bolts per row. Eng. Struct. 2014, 59, 434–447. [Google Scholar] [CrossRef]
  4. Bu, X.; Xiao, S.X.; Wu, Z.J.; Li, X.L.; Wang, X.W. Damage Evaluation of T-Stub Connected to Hollow Section Column Using Blind Bolts under Tension. Buildings 2023, 13, 2603. [Google Scholar] [CrossRef]
  5. Miller, D.K. Lessons learned from the Northridge earthquake. Eng. Struct. 1998, 20, 249–260. [Google Scholar] [CrossRef]
  6. Bruneau, M. Performance of steel bridges during the 1995 Hyogoken-Nanbu (Kobe, Japan) earthquake—A North American perspective. Eng. Struct. 1998, 20, 1063–1078. [Google Scholar] [CrossRef]
  7. Chen, W.F.; Goto, Y.; Liew, R.J.Y. Stability Design of Semi-Rigid Frames; John Wiley & Sons: New York, NY, USA, 1996. [Google Scholar]
  8. Liu, X.; Hao, Z.M. Constitutive model for rotation behaviour of semi-rigid steel beam-to-column joints. J. Constr. Steel Res. 2022, 198, 107563. [Google Scholar] [CrossRef]
  9. Majlesi, A.; Asadi-Ghoozhdi, H.; Bamshad, O.; Attarnejad, R.; Masoodi, A.R.; Ghassemieh, M. On the Seismic Evaluation of Steel Frames Laterally Braced with Perforated Steel Plate Shear Walls Considering Semi-Rigid Connections. Buildings 2022, 12, 1427. [Google Scholar] [CrossRef]
  10. Fan, J.; Wu, Z.F.; Liu, J.H.; Wang, Y.X.; Zheng, H.D.; Tee, K.F. Damage and failure of semi-rigid steel joints during progressive collapse. Structures 2023, 58, 105632. [Google Scholar] [CrossRef]
  11. Abdalla, K.M.; Drosopoulos, G.A.; Stavroulakis, G.E. Failure Behavior of a Top and Seat Angle Bolted Steel Connection with Double Web Angles. J. Struct. Eng. 2015, 141, 04014172. [Google Scholar] [CrossRef]
  12. Monaco, A. Numerical prediction of the shear response of semi-prefabricated steel-concrete trussed beams. Constr. Build. Mater. 2016, 124, 462–474. [Google Scholar] [CrossRef]
  13. Guo, H.C.; Liang, G.; Li, Y.L.; Liu, Y.H. Q690 high strength steel T-stub tensile behavior: Experimental research and theoretical analysis. J. Constr. Steel Res. 2017, 139, 473–483. [Google Scholar] [CrossRef]
  14. Morrison, M.L.; Schweizer, D.Q.; Quayyum, S.; Hassan, T. An Unstiffened Eight-Bolt Extended End-Plate Moment Connection for Special and Intermediate Moment Frames. J. Struct. Eng. 2019, 145, 04019055. [Google Scholar] [CrossRef]
  15. Monaco, A.; Colajanni, P.; La Mendola, L. The structural behaviour of hybrid steel-trussed concrete beams: A literature review of experimental tests and theoretical models. Structures 2025, 71, 108018. [Google Scholar] [CrossRef]
  16. Popov, E.P.; Takhirov, S.M. Bolted large seismic steel beam-to-column connections Part 1: Experimental study. Eng. Struct. 2002, 24, 1523–1534. [Google Scholar] [CrossRef]
  17. Takhirov, S.M.; Popov, E.P. Bolted large seismic steel beam-to-column connections Part 2: Numerical nonlinear analysis. Eng. Struct. 2002, 24, 1535–1545. [Google Scholar] [CrossRef]
  18. Latour, M.; Rizzano, G. Experimental Behavior and Mechanical Modeling of Dissipative T-Stub Connections. J. Struct. Eng. 2012, 138, 170–182. [Google Scholar] [CrossRef]
  19. Latour, M.; Piluso, V.; Rizzano, G. Experimental behaviour of friction T-stub beam-to-column joints under cyclic loads. Steel Constr. 2013, 6, 11–18. [Google Scholar] [CrossRef]
  20. Wang, Z.Y.; Zhang, J.F.; Jiang, J.Q. A multi-spring component modelling approach for T-stub connections. Adv. Struct. Eng. 2016, 19, 883–896. [Google Scholar] [CrossRef]
  21. D’Aniello, M.; Cassiano, D.; Landolfo, R. Monotonic and cyclic inelastic tensile response of European preloadable gr10.9 bolt assemblies. J. Constr. Steel Res. 2016, 124, 77–90. [Google Scholar] [CrossRef]
  22. Tartaglia, R.; D’Aniello, M.; Zimbru, M. Experimental and numerical study on the T-Stub behaviour with preloaded bolts under large deformations. Structures 2020, 27, 2137–2155. [Google Scholar] [CrossRef]
  23. Liu, X.C.; Zhu, Y.N.; Chen, X.S.; Li, Y.M. Seismic performance of bolted double-web T-stub connections with T-shaped steel column. J. Constr. Steel Res. 2022, 191, 107168. [Google Scholar] [CrossRef]
  24. Bayat, K.; Shekastehband, B. Seismic performance of beam to column connections with T-shaped slit dampers. Thin-Walled Struct. 2019, 141, 28–46. [Google Scholar] [CrossRef]
  25. Meng, B.; You, K.; Yang, B.; Kong, D.Y.; Wen, J.L. Anti-progressive collapse performance and design method of novel T-stub connections. Eng. Struct. 2024, 319, 118880. [Google Scholar] [CrossRef]
  26. Hou, G.L.; Shang, Y.T.; Zhang, L.; Sun, L.L.; Wu, J.Y.; Lu, Y.Y.; Zhu, A.B.; Mou, Y.H. Bending performance of bolted beam-column joints with T-stubs. J. Constr. Steel Res. 2025, 226, 109280. [Google Scholar] [CrossRef]
  27. Oh, K.; Lee, K.; Chen, L.; Hong, S.B.; Yang, Y. Seismic performance evaluation of weak axis column-tree moment connections with reduced beam section. J. Constr. Steel Res. 2015, 105, 28–38. [Google Scholar] [CrossRef]
  28. Xu, Y.L.; Hao, J.P. Seismic performance of spatial beam-column connections in steel frame. J. Constr. Steel Res. 2021, 180, 106586. [Google Scholar] [CrossRef]
  29. Shi, G.; Jiang, S.; Zhang, N.Z.; Hou, L.T.; Zhao, H.T. Seismic performance of double-sided plate-reinforced connections between steel beams and built-up box columns. Thin-Walled Struct. 2025, 208, 112872. [Google Scholar] [CrossRef]
  30. Saberi, V.; Gerami, M.; Kheyroddin, A. Comparison of bolted end plate and T-stub connection sensitivity to component thickness. J. Constr. Steel Res. 2014, 98, 134–145. [Google Scholar] [CrossRef]
  31. Wang, P.; Pan, J.R.; Wang, Z.; Chen, S.Z. Experimental and analytical behavior of stiffened angle joints. Steel Compos. Struct. 2018, 26, 67–78. [Google Scholar]
  32. GB 50017-2017; Standard for Design of Steel Structures. China Architecture & Building Press: Beijing, China, 2017. (In Chinese)
  33. GB 50011-2010; Code for Seismic Design of Buildings. China Architecture & Building Press: Beijing, China, 2010. (In Chinese)
  34. Shi, Q.; Yan, S.L.; Kong, L.L.; Bu, X.; Wang, X.W.; Sun, H.S. Seismic behavior of semi-rigid steel joints—Major axis T-stub and minor axis end-plate. J. Constr. Steel Res. 2019, 159, 476–492. [Google Scholar] [CrossRef]
  35. Lu, S.C.; Wang, Z.; Pan, J.R.; Wang, P. The Seismic Performance Analysis of Semi-rigid Spatial Steel Frames Based on Moment-Rotation Curves of End-plate Connection. Structures 2022, 36, 1032–1049. [Google Scholar] [CrossRef]
  36. GB/T228.1-2021; Metallic Materials-Tensile Testing-Part 1: Method of Test at Room Temperature. China Standards Press: Beijing, China, 2021. (In Chinese)
  37. FEMA-461; Interim Testing Protocols for Determining the Seismic Performance Characteristics of Structural and Nonstructural Components. Applied Technology Council: Redwood City, CA, USA, 2007.
  38. Xiao, S.X.; Bu, X.; Shen, B.; Fan, L.D.; Chen, Y.F.; Wang, X.W. Seismic performance and damage characteristics evolution of spatial beam to corner column connection with T-stubs. J. Build. Eng. 2025, 111, 113186. [Google Scholar] [CrossRef]
  39. Darwin, D.; Nmai, C.K. Energy dissipation in RC beams under cyclic load. J. Struct. Eng. 1986, 112, 1829–1846. [Google Scholar] [CrossRef]
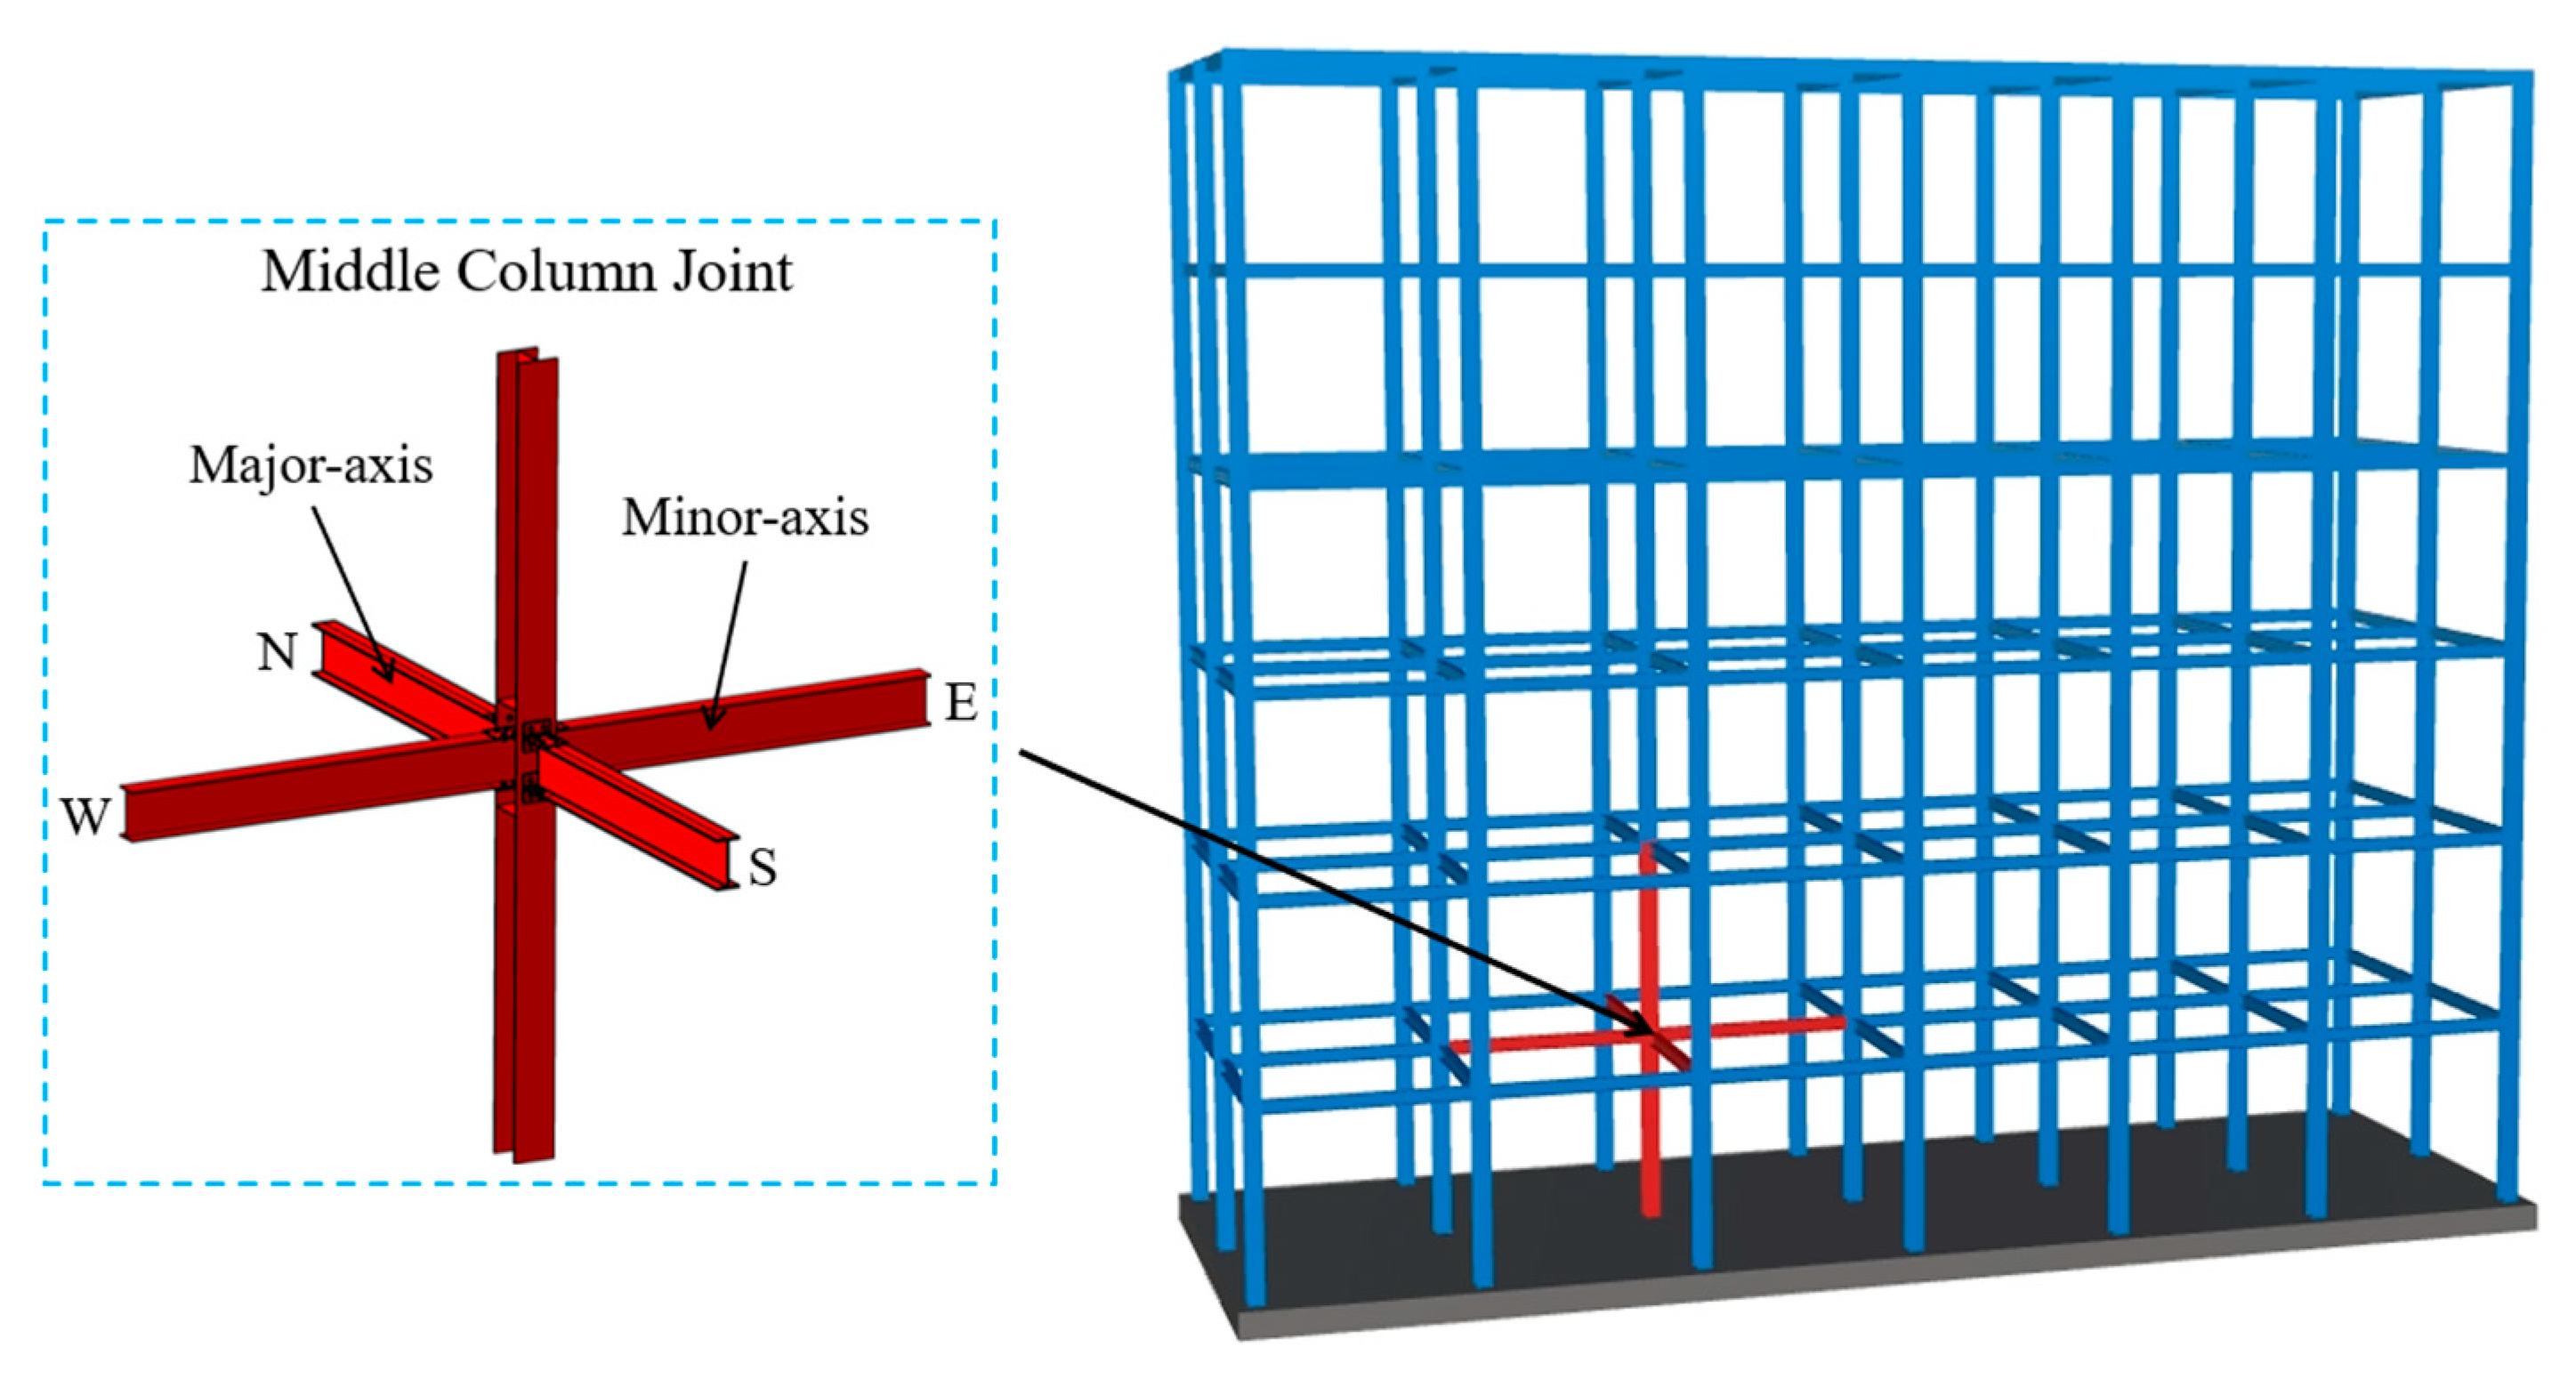
Figure 1. Position of middle column joint.
Buildings 15 04112 g001
Figure 2. Schematic diagram of T-stub spatial joints. (a) TN1. (b) TN2.
Buildings 15 04112 g002
Figure 3. Dimensional details of TN2 joint. (a) Major-axis. (b) Minor-axis.
Buildings 15 04112 g003
Figure 4. Experimental loading apparatus.
Buildings 15 04112 g004
Figure 5. Loading history curve.
Buildings 15 04112 g005
Figure 6. Relative rotation angle.
Buildings 15 04112 g006
Figure 7. Typical failure modes of TN1. (a) Major-axis in-plane northward upper. (b) Minor-axis in-plane southward lower.
Buildings 15 04112 g007
Figure 8. Typical failure modes of TN2. (a) Major-axis in-plane southward upper. (b) Minor-axis in-plane westward upper.
Buildings 15 04112 g008
Figure 9. Typical failure modes of the TN3. (a) Major-axis in-plane northward upper. (b) Minor-axis in-plane eastward upper.
Buildings 15 04112 g009
Figure 10. Hysteretic loops of TN1. (a) South. (b) North. (c) West. (d) East.
Buildings 15 04112 g010aBuildings 15 04112 g010b
Figure 11. Hysteretic loops of TN2. (a) South. (b) North. (c) West. (d) East.
Buildings 15 04112 g011
Figure 12. Hysteretic loops of TN3. (a) South. (b) North. (c) West. (d) East.
Buildings 15 04112 g012
Figure 13. Comparison of skeleton curves. (a) South. (b) North. (c) West. (d) East.
Buildings 15 04112 g013
Figure 14. Stiffness degradation rate. (a) South. (b) North. (c) West. (d) East.
Buildings 15 04112 g014
Figure 15. Cumulative energy dissipation comparison. (a) South. (b) North. (c) West. (d) East.
Buildings 15 04112 g015
Figure 16. Damage index curves. (a) South. (b) North. (c) West. (d) East.
Buildings 15 04112 g016
Table 1. Key structural parameters.
Specimens NumberThe Specimens Used for Dividing T-stubs/mmBolts TypeBolts Quantity
MajorMinorMajorMinorMajorMinor
TN1H270 × 200 × 8 × 12H270 × 200 × 8 ×12M22M223224
TN2H450 × 200 × 8 × 12H270 × 200 × 8 × 12M20M225624
TN3H450 × 200 × 9 × 14H270 × 200 × 9 × 14M20M225624
Table 2. Mechanical properties of specimen steel.
Specimenfy/MPafu/MPaE/GPaA/%δ/%fy/fu
Column flange27143020936310.63
Column web27443620240350.63
Beam flange25644520340320.58
Beam web24943820143360.57
T-stub flange28648118935.5330.59
T-stub web29049020136.5350.59
Disclaimer/Publisher’s Note: The statements, opinions and data contained in all publications are solely those of the individual author(s) and contributor(s) and not of MDPI and/or the editor(s). MDPI and/or the editor(s) disclaim responsibility for any injury to people or property resulting from any ideas, methods, instructions or products referred to in the content.