1. Introduction
The operations of buildings account for 30% of global final energy consumption and 26% of global energy-related emissions, and to meet the requirement of the Net Zero Scenario, carbon emissions from building operations need to more than halve by 2030 [
1].
Smart buildings are designed to save energy while maintaining acceptable occupants’ comfort by incorporating automation technology and energy and resource management systems within buildings [
2]. The extensive deployment of heterogeneous sensors has provided a massive amount of building operational data, which facilitates various energy conservation research, such as energy usage analysis and benchmarking [
3], detection of anomalous usage patterns [
4], building energy system optimization [
5,
6], and fault detection and diagnosis (FDD) [
7,
8].
Good data quality plays an important role in building energy performance analysis [
9] and is essential for policy and decision making [
10]. A large amount of research effort was invested into ensuring high accuracy of sensor data, including the sensor FDD frameworks of building systems [
11,
12,
13], in situ calibration methods for low-cost environmental monitoring sensors [
14,
15], sensor calibration based on virtualization techniques [
16,
17], etc. Despite the great efforts to secure measurement accuracy, building operational data are time series data that consist of an ordered collection of measurement values collected at regular time intervals. Therefore, the accuracy of temporal information is of equal importance as the measurement accuracy. In dynamic data monitoring systems, the timestamp of measurements can be inaccurate due to reasons like inaccurate local clocks, communication delays or network-induced delays, and system processing delays [
18,
19,
20]. Furthermore, in distributed multi-sensor networks, the asynchronization between sensors can be caused by the usage of various types of devices, different transmission protocols, distinct sampling periods, and initial sampling time instants [
21,
22,
23]. Therefore, assuring the temporal accuracy of sensor data and achieving time synchronization is a necessary procedure before multi-source data aggregation and analysis [
24].
However, in most existing literature regarding building operational data analysis [
25,
26], prediction [
27,
28,
29], and quality assessment [
30,
31], there is a universal absence of reporting checks on the temporal accuracy of the data, and the timestamps of data are assumed implicitly to be synchronous and accurate. Only a few researchers reported performing approximate correction on the timestamp to achieve data synchronization when conducting multi-source data pre-processing. Rusek et al. [
32] reported rounding the timestamps of the building users’ subjective comfort opinion data to the nearest 10 min to align with the energy consumption data. Lee et al. [
33] reported manually synchronizing the time of different types of measured environmental data using a spreadsheet software. Sözer et al. [
34] and Chew et al. [
35] both reported matching the time of data collection with different protocols or sampling frequencies, yet without detailed elaboration. Wang et al. [
36] mentioned that the sampling between two data acquisition cards was not simultaneous, and the synchronization lag was manually corrected before data analysis. Nevertheless, manually aligning unsynchronized data sequences inevitably disturbs the original correspondence between the measurement value and its timestamp, thereby introducing numerical errors that may exceed the acceptable error limit, especially for dynamic measurements whose value changes drastically with time.
Time registration [
37], or time alignment, is the transformation that maps local sensor observation times
t to a common time axis
t′. This technique has been explored to solve the alignment problem of time series data in fields such as multi-source data fusion [
38], target tracking [
39], ocean spatial positioning technology [
40], head-related virtual acoustics [
41], etc. In multi-sensor architectures, a similar process is also referred to as the asynchronous data fusion [
42,
43,
44]. In practice, it is usually preferred to obtain a comprehensive insight from the data of multiple sensors with more accuracy and reliability. Distributed systems such as wireless sensor networks (WSN) [
45] are given particular attention due to the limitations of bandwidth and energy. Though with inconsistent taxonomies in the literature [
40,
42,
46,
47], common time registration methods include interpolation or curve-fitting methods, least squares methods, the exact maximum likelihood (EML) methods, the Kalman filter and its variants, etc. Chen et al. [
39] designed a time registration algorithm based on the spline interpolation applicable to a high-accuracy target tracking system with measurement missing and non-uniform sampling periods. The interpolation methods can adapt to any length of sampling period but are extremely sensitive to measurement errors. Although the curve fitting method can avoid this by setting global smoothness, it has poor adaptability to local conditions. Moreover, both categories lack multivariate data fusion capabilities, limiting their practical applications.
On the contrary, most asynchronous data fusion methods can adapt to centralized or distributed multisensory frameworks, but they are usually limited to specific relationships of sensors’ sampling periods. Zhu et al. [
48] proposed sequential asynchronous filter algorithms based on the Kalman filter and particle filter to perform target tracking in asynchronous wireless sensor networks, in which the sampling periods of all sensors were assumed to be the same while the measurements were taken at different time instants. Similar assumptions can be found in [
49] by Wang et al., where the starting times of sensors’ measurements are different. For sensors with different sampling periods, certain relationships are also required. Blair et al. [
50] originally proposed the least-squares-based time alignment approach for two dissimilar sensors whose sampling rates are in an integer relation. Lin et al. [
51] proposed a distributed fusion estimation algorithm for multisensor multi-rate systems with correlated noises, where the state update rate is a positive integer multiple of the measurement sampling rates. Some studies have also examined the situation where time delays exist. Julier et al. [
52] proposed the Kalman filter incorporated with the Covariance Union algorithm to address the problem of state estimation for multiple target tracking, where the observation sequences are imprecisely timestamped. However, the delays of the timestamps were assumed to be multiple times the time step of the filter. Similar settings with uniformly spaced time series and random but discrete time delays can be found in [
53]. Furthermore, assumptions with different sampling frequencies and initial sampling times were found in [
54] by Huang et al., where an adaptive registration algorithm for multiple navigation positioning sensors was proposed based on the real-time motion model estimation and matching using the least squares method and the Kalman filter. A more complicated setup with different and varying sampling periods is adopted in [
42], where the spatiotemporal biases of multiple asynchronous sensors were attempted to be simultaneously compensated for data fusion, but the signal transmission delay was assumed to be constant. In summary, asynchronous data fusion, including time registration, is a class of practical engineering problems that are strongly dependent on system architecture, sensor configurations, and problem settings. Therefore, it is crucial to select the appropriate methods based on the problem-specific characteristics.
To the best of the authors, the synchronization and the temporal accuracy of sensory data remain rarely discussed topics in studies related to building energy consumption data. However, most building energy management systems (BEMSs) have a centralized architecture consisting of multi-source heterogeneous sensors, smart meters, and data collectors, where time asynchronism cannot be completely avoided. In addition, most measurement data are measured by meters and sensors, collected by data collectors, and then attached with a unified timestamp and uploaded to data centers [
55]. This means that the time delay may accumulate in multiple processes, including data transmission and processing. In this article, based on the analysis of real data from a campus building energy consumption monitoring platform (BECMP), it is proven that both time delays and time asynchronism are found in the timestamps of building energy data. This problem is jointly caused by the characteristics of RS-485 communication and the flawed timestamping mechanism. If not detected, such temporal deviations can greatly affect the data accuracy and introduce uncertainty into the data analysis results.
Most of the existing asynchronous data fusion methods are based on the situation of the same type of sensors [
48,
49], and have specific requirements for the sampling period of multiple sensors [
50,
51] or are based on the assumption that the delay is discrete [
52,
53]. However, in the problem of this paper, the range of time deviation is continuous and random, and the energy consumption monitoring meters in buildings are mostly not equipped with redundant counterparts, which limits the applicability of these methods. Although the spline interpolation method [
39] can effectively solve the problem of continuous delay, it may cause oscillation or overshoot for building energy consumption data. Therefore, it is still necessary to study applicable methods for the problem of time deviation correction in BECMPs.
Therefore, improvements to the timestamping mechanism are first proposed, followed by an A-PCHIP-iKF time registration method for the synchronization of the building electricity consumption data with non-negligible time deviations.
The rest of the article is organized as follows.
Section 2 gives a detailed analysis of the causes of the time deviation phenomenon of building energy data and its characteristics according to the data collection and transmission process. In
Section 3, the A-PCHIP-iKF method is proposed for the correction of data with non-negligible time deviations. In
Section 4, the proposed method is compared with traditional methods on simulated data, and the contributions and limitations of the proposed method are discussed. The conclusions of this study are summarized in
Section 5.
2. Problem Description
2.1. The Source of Time Deviation
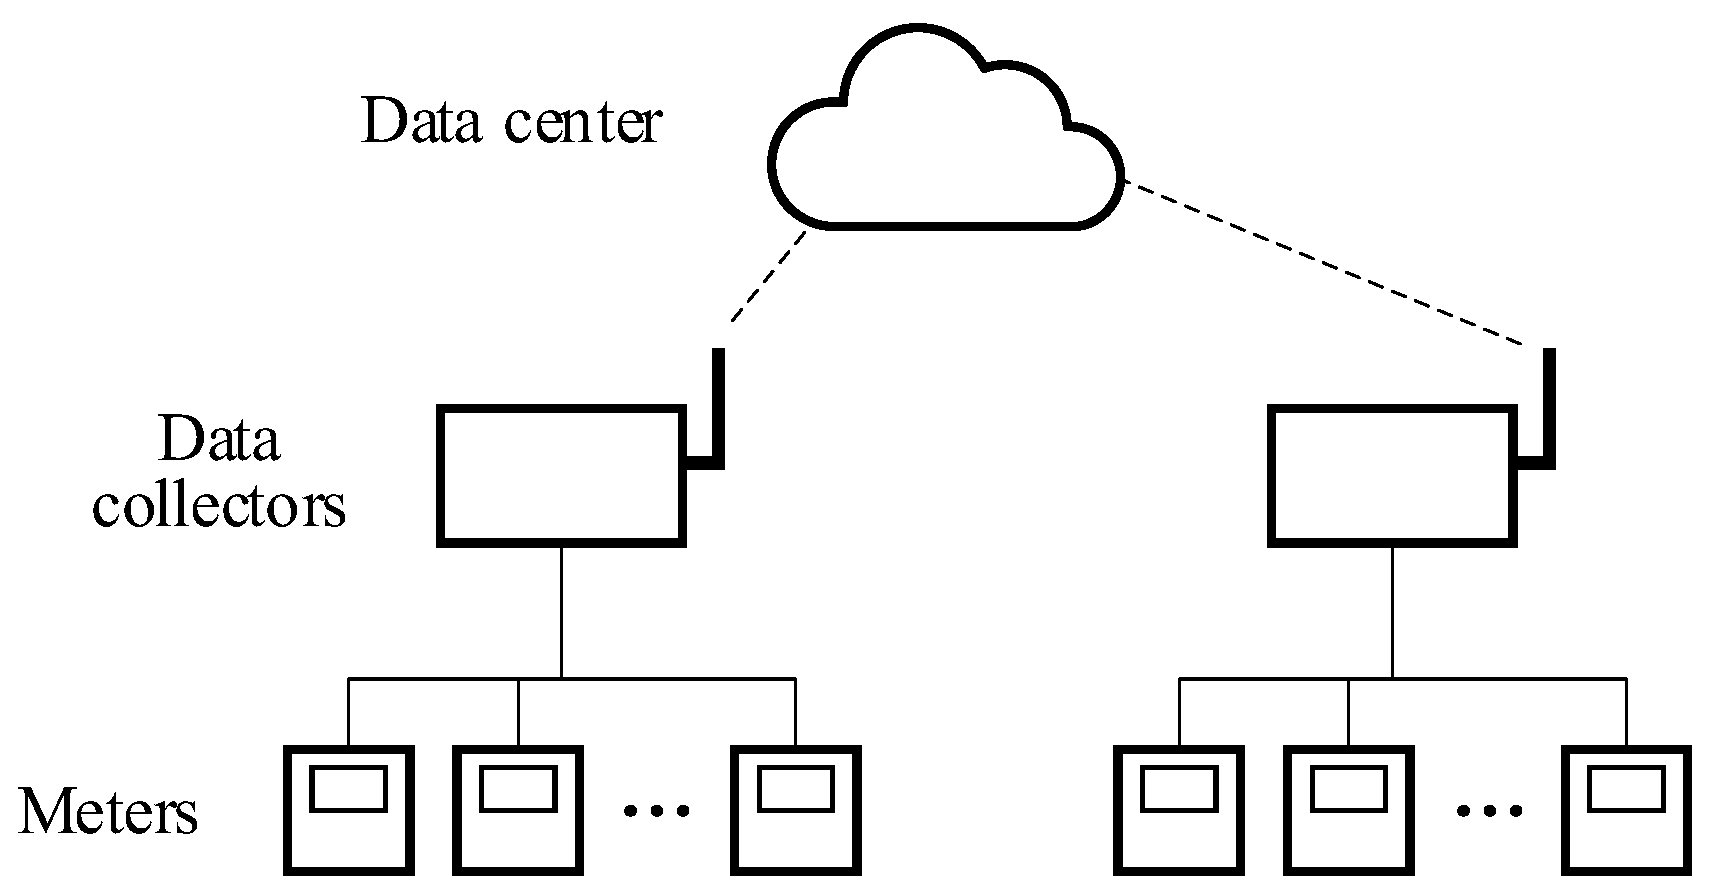
The typical structure of a BECMP is shown in
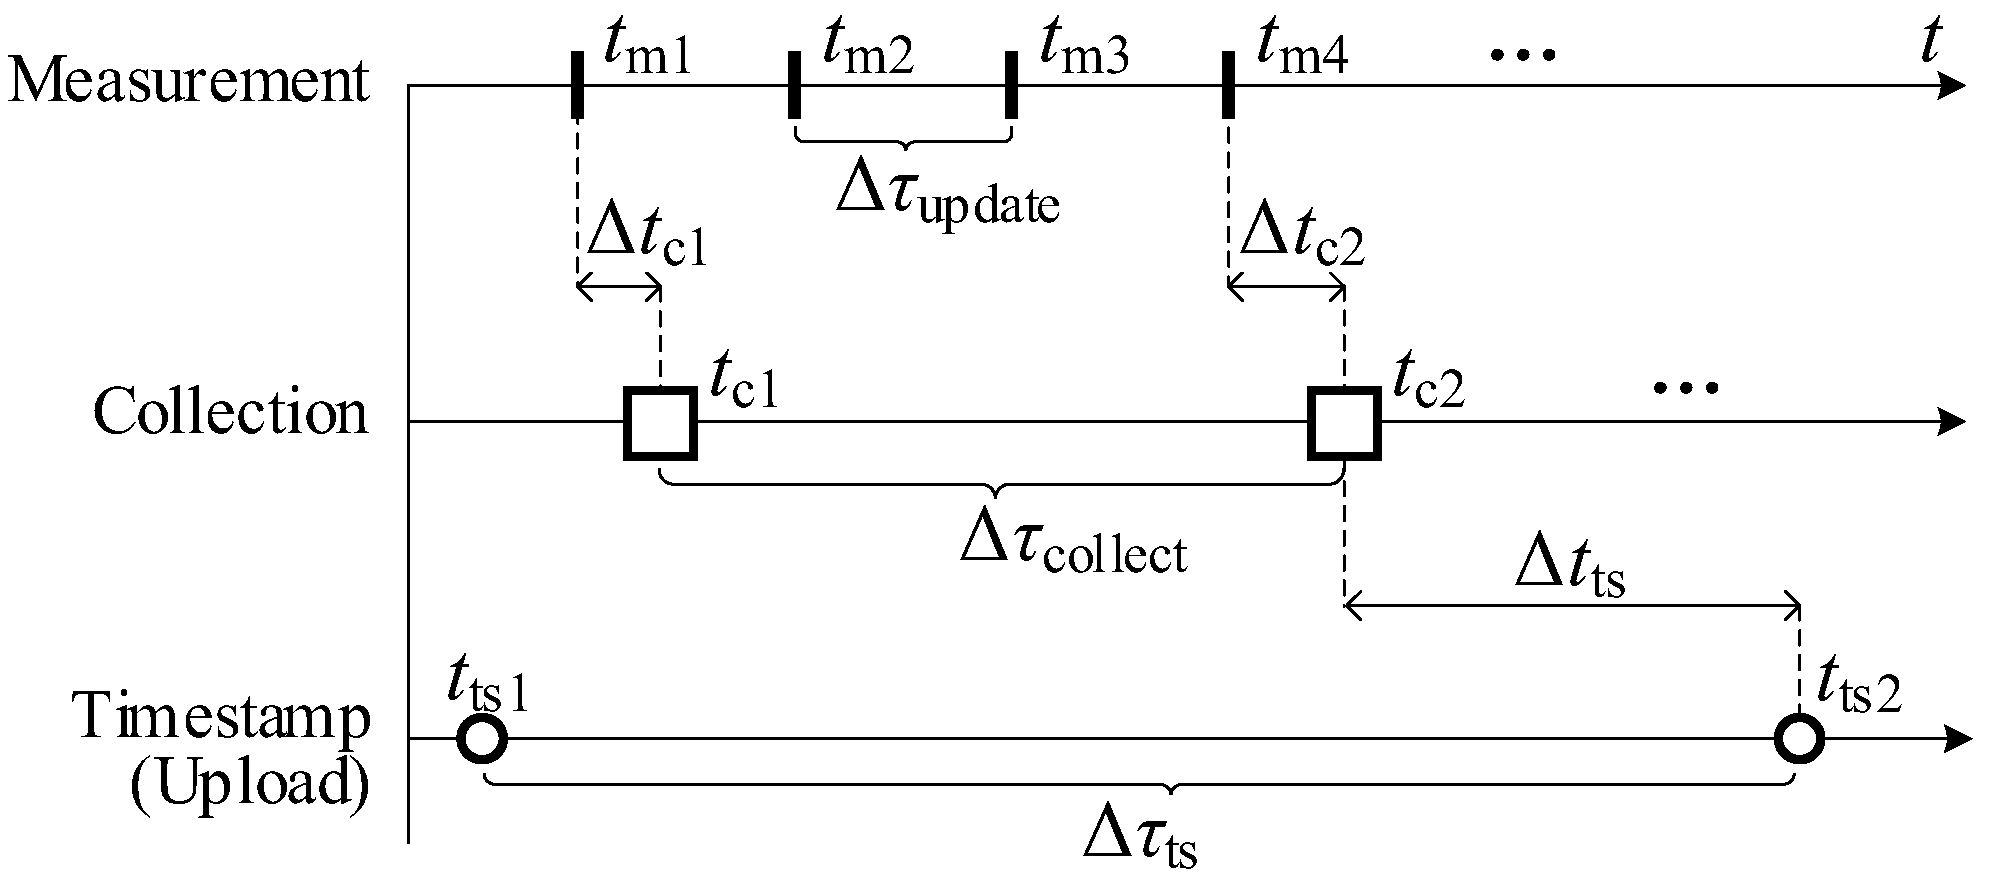
Figure 1. The bottom layer consists of meters and sensors that regularly measure the parameters of interest. In the middle layer, the data collectors perform data collection by acquiring the latest measurements from the registers of meters and sensors with preset frequencies and data buffering by temporarily storing the measurements in the local memory. When the local clock of the data collector reaches a predetermined time for data upload, the data collector packages all the buffered measurements as a data packet with a single timestamp and uploads the packet to the data center. In these processes, the measurement of energy consumption and its timestamping are performed on different devices at different time instants. Therefore, multiple time delays exist, which are summarized in
Table 1. The corresponding processes are illustrated in
Figure 2.
(1) Measuring delays of sensors
The response of meters may be delayed from the actual change of the target physical quantity due to various factors, and it takes time for the meter to process the measurement and update it on the register. The total delay in such a process is referred to as the measuring delay. In the context of building energy data monitoring, the measuring delay is assumed to be negligible compared to the usual minimum data upload frequency of 15 min to 1 h.
(2) Data collection delays of data collectors
The collection delay Δtc is defined as the duration from the time the latest measurement is updated by a meter to the measurement is collected by a data collector. It is mainly determined by the relative temporal relationship between the data collections and the register updates, as well as the transmission latency of the communication bus.
For example, as illustrated in
Figure 2, a meter updates its measurements with a fixed interval Δ
τupdate and a data collector performs data collections with a fixed interval Δ
τcollect. Two consecutive data collections, c
1 and c
2, correspond to the measurements m
1 and m
4, respectively, and the collection delays Δ
tc1 and Δ
tc2 can be different due to the non-integer multiple relationship between the two intervals.
The data collection delay is assumed to be negligible in this study.
(3) Timestamping delays
The timestamping delay Δ
tts is the duration from the time a measurement is collected by a data collector to the time the measurement is attached with a timestamp. As mentioned, the timestamp is only attached by a data collector when a data packet is uploaded, rather than immediately after data measuring. Such a mechanism is regulated by the current national technical specification for building energy monitoring [
56]. However, for all meters on the same RS-485 bus, the data collections are executed in a polling manner due to the half-duplex communication mechanism, which means the actual collection time
tc for each measurement is unique. Since all measurements share a uniform timestamp, their timestamping delays are non-uniform. Therefore, the timestamping delay of a measurement is mainly determined by its order in the data collection queue before each data upload, which may vary in each cycle.
For example, as shown in
Figure 3, a data collector collects the measurements of three parameters, c
1, c
2, and c
3, in a polling manner in a data uploading cycle Δ
τts, starting with c
3 at time
tc3″ and ending with it at time
tc3′. Before the data uploading time
tts, the latest measurements of the three parameters are collected at
tc1,
tc2′, and
tc3′. Therefore, their timestamping delay are Δ
tts1, Δ
tts2, and Δ
tts3, respectively.
The inherent asynchronism of data collections of different meters has two aspects of impact. Firstly, in a data upload cycle, although all measurements share a uniform timestamp, their actual times of data measuring are in sequence rather than synchronized. Secondly, the order of meters in the data collection queue before each data upload may vary; therefore, the timestamping delays of a meter in different data upload cycles can be different. This means that for each meter’s sequence of measurements, its actual timestamps may not be uniformly spaced on the timeline. Both impacts are illustrated in
Figure 4.
(4) Abnormal timestamping delays
Normally, the timestamping delay is about seconds to minutes, which is negligible in most cases. However, in practice, a randomly occurring data-collecting failure phenomenon was observed, where the latest value of a parameter cannot be successfully collected. Possible reasons for this phenomenon are electromagnetic interference, poor wiring, and defects in devices. The failure may occur multiple times consecutively, but it can usually recover automatically.
If such a failure happens before data uploading and has lasted for less than a certain number of times, the data collector will upload its last normally collected measurement as a substitute. This is a remedy for uploading a null value, but it also means the timestamping delay of the substitute is much larger than the normal one. For example, in
Figure 3, the collection of c
1 failed at
tc1′ before data upload, and its substitute is collected at
tc1, whose timestamping delay is Δ
tts1, which is larger than the normal timestamping delays Δ
tts2 and Δ
tts3.
The existence of abnormal timestamping delay can exacerbate the asynchronism of measurements. Depending on the number of parameters to be collected and the times of data collection failures, abnormal timestamping delays can range from tens of seconds to several minutes. It has a significant negative impact on data accuracy and needs to be addressed with emphasis.
(5) Clock offset of the data collector
The local clock of the data collector may accumulate errors if not calibrated regularly, resulting in seconds to minutes of clock offset. However, it can be directly corrected using the network time protocol (NTP). Therefore, it is feasible to eliminate the clock offset and achieve clock synchronization between all data collectors and the data center servers.
(6) Total time deviation of the timestamp
Total time deviation is the sum of all delays and the clock offset. As mentioned above, the measuring delay and data collection delay are negligible, and the data collector clock can be directly synchronized. Therefore, the total time deviation mainly depends on the timestamping delay, especially the abnormal one.
2.2. The Characteristics of Time Deviations
The time deviation can result in the misalignment between the measured value and its timestamp. If the value of the measured variable changes during the interval, there will be a numerical deviation in the measurement. For energy usage values, time deviations will result in the wrong attribution of energy usage between the adjacent intervals, as illustrated in
Figure 5. In the interval from
t1 to
t2, if there are time deviations on both the starting point and the ending point of the interval and the actual times of measuring are
t′
1 and
t′
2, respectively, then the measured energy usage is
W0 +
W1 while the true value is
W0 +
W2, and the measurement error equals
W1 −
W2.
However, in BECMPs, the energy usage in an interval is calculated by the difference between the two cumulative energy consumption values measured by the electricity meter at the interval endpoints. Therefore, the true energy usage from t1 to t2 cannot be acquired due to the lack of true cumulative values at t1 and t2. In this study, a campus building is chosen for real data analysis, in which the primary and secondary circuits are fully monitored with sub-metering, and thus the energy usage values of the sub-meters can be summed up to be compared with that of the total meter.
Reasons for the difference between the energy usage values measured by the total meter and that by all the submeters (hereinafter referred to as total-sub difference) include the measuring error of meters, numerical deviations caused by the time deviation, line losses, and unaccounted-for energy consumption of unmeasured secondary circuits.
Figure 6 shows the distribution of the total-sub difference of the same group of meters in a year with different time granularities. Firstly, the relative total-sub difference of hourly, daily, and monthly data are analyzed, including both normal and abnormal data from all meters. For daily and monthly data, the relative total-sub differences are under 5% with the presence of abnormal data, indicating the time deviations’ negligible influences on these scales. The total meter’s values are consistently larger than the summation of the submeters’ values, which points to possible line losses or other measurement-related factors. On the other hand, the relative total-sub difference of hourly data exhibits a much wider and symmetrical distribution, ranging between ±25%. On the basis of the measurement-related factors contributing less than 5% total-sub difference, the large difference of the hourly data points to a more dominating factor, which is the time deviations.
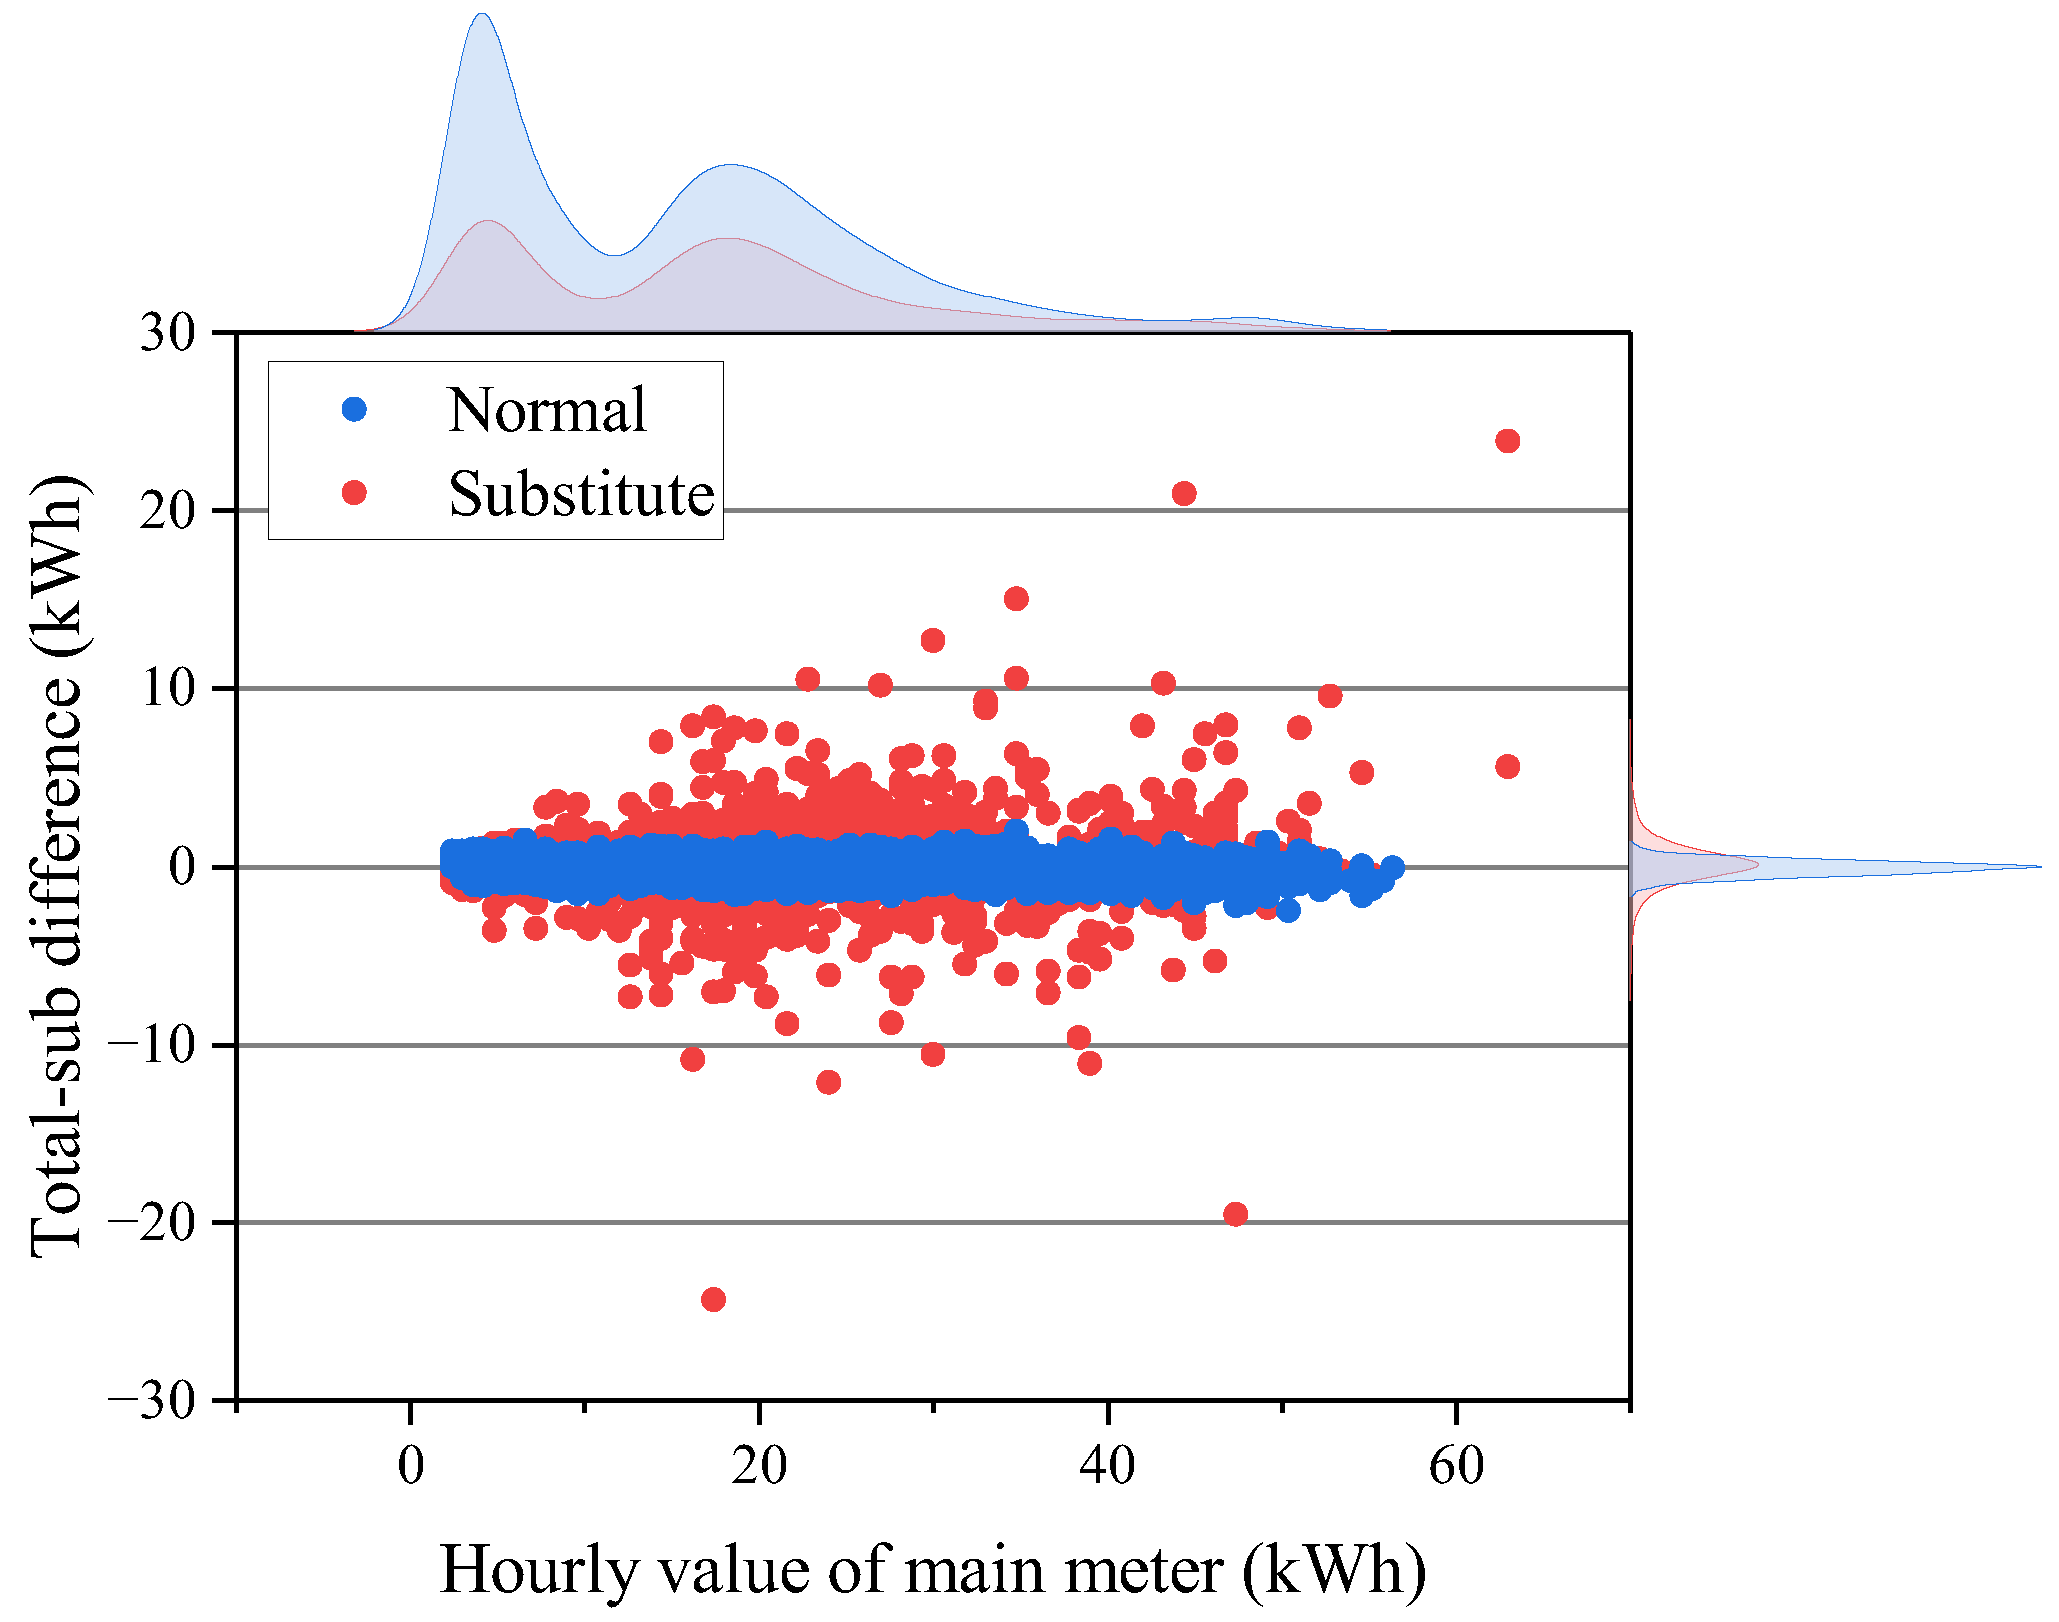
The data collectors used in the platform are designed to attach data collection status codes, which can help with the differentiation of normal and abnormal data. With a zoom-in inspection of the hourly data, the normal values of the submeters are sorted out and summed up to compare with the data of the total meter, which is classified into normal and substitute categories using status codes, as shown in
Figure 7.
The total-sub differences of both categories are not strictly equal to zero but are distributed symmetrically around zero. For the normal category, the total-sub difference approximately follows a normal distribution with a mean of 0.13 kWh and a standard deviation of 0.44 kWh, while the abnormal category’s mean is 0.14 kWh and the standard deviation is 2.02 kWh. Evidently, both normal and substitute measurements of the total meter have numerical deviations, while the deviations of the latter are much larger. With a rough estimation by dividing the total-sub differences by the corresponding relative true values, the total meter’s abnormal time deviations can be up to 30 min, while those of the normal ones are mostly within five minutes.
Two other buildings were inspected following the same procedure using the data collection status codes, and substitute data of the buildings’ total meters were also found, although with relatively smaller ranges of numerical deviations. With an expanded inspection of all 7451 electricity meters’ historical data in the platform’s database, about 70% of the meters exhibited substitute data. The highest meter-wise abnormal data proportion during the four years was 59%. Obviously, this issue is not an isolated case.
The time–frequency characteristic of the collection failure is highly random.
Figure 8 shows the time series of the hourly energy consumption of a meter, in which the abnormal collected data are marked differently. Based on the analysis of historical data, such phenomena mostly emerge from the very beginning of the platform’s operation, and are mostly contributed to by certain specific meters, indicating the strong correlation with specific equipment defects or low wiring quality.
2.3. The Necessity of Correcting Time Deviation
Time deviation can cause reduced data accuracy and time synchronization, leading to the distortion of data patterns and thereby pseudo characteristics, which may result in misleading conclusions and decisions in building-energy-data-related studies. The temporal accuracy of building energy data also plays a vital part in the carbon neutrality goal, where the dynamic carbon emission factors [
57] of power grids could be used for the carbon accounting of building end-users. The synchronization of electricity usage data and dynamic carbon emission factors is crucial for the precise calculation of carbon emissions.
In BECMPs, time accuracy is particularly crucial for meters that monitor the energy consumption of an entire building or a larger scale, of which the energy consumption rate is usually high, and even small temporal deviations can result in great numerical deviations. Such meters are often used as analysis objects or data sources in research and applications, making the correction of time deviation in such scenarios extremely important.
3. Methodology
In this study, the correction of abnormal time deviations is mainly studied due to their great influence on data accuracy. An additional assumption is made that the accurate measuring times of the substitute data are known. Although such information is currently unavailable due to the restriction of the regulations, the modification of the timestamping mechanism of the data collectors is feasible and necessary. On the other hand, the intention of uploading substitutes is to remedy uploading null values and preserve the original information as much as possible. Without timestamps representing the actual times of measuring, the substitute data cannot be accurately positioned on the timeline, thereby losing their effectiveness in evaluating the degree of the temporal deviation and in providing a basis for data correction. Under such a condition, the problem is essentially equivalent to performing data imputation in the absence of the substitute data.
To correct the time deviations, a two-step framework is proposed, consisting of a time registration procedure utilizing the temporal correlation of each meter’s time series data, and a data fusion procedure where the spatial correlation of the building’s total meter and sub-meters is comprehensively utilized.
3.1. Time Registration
The energy consumption behavior of buildings usually has short-term and long-term temporal regularity that can be utilized for forecasting and regression. Long-term regularity is mainly manifested in the periodic and seasonal patterns of energy consumption data on a month or yearly scale, which are driven by external climate conditions and inherent characteristics of the building. However, due to the randomness of the collection failure phenomenon described in
Section 2.2, it is difficult to obtain sufficiently long and error-free historical time series of the target meter to perform statistical and machine learning methods like ARIMA [
58] and artificial neural networks that require enough data for modeling or training. Moreover, the abnormally collected data points of the time series are not equally spaced on the time axes, which do not meet the requirements of common methods for dealing with time series, such as LSTM [
59].
Short-term regularity manifests as the high-frequency and periodic fluctuations of the energy consumption curve within a 24-h period, whose driving factors are mostly human activities. Considering the length of time, deviations are mostly less than one hour, the utilization of short-term patterns can be further shortened to the local trend of the energy consumption curve, which can be only several hours around the temporally deviated data point. As simple yet efficient time registration techniques, interpolation methods do not require equal time intervals or model training using historical data and are suitable for utilizing the local characteristics of curves. Most importantly, interpolation methods can effectively cope with the continuous value range of the time deviation problem in this study.
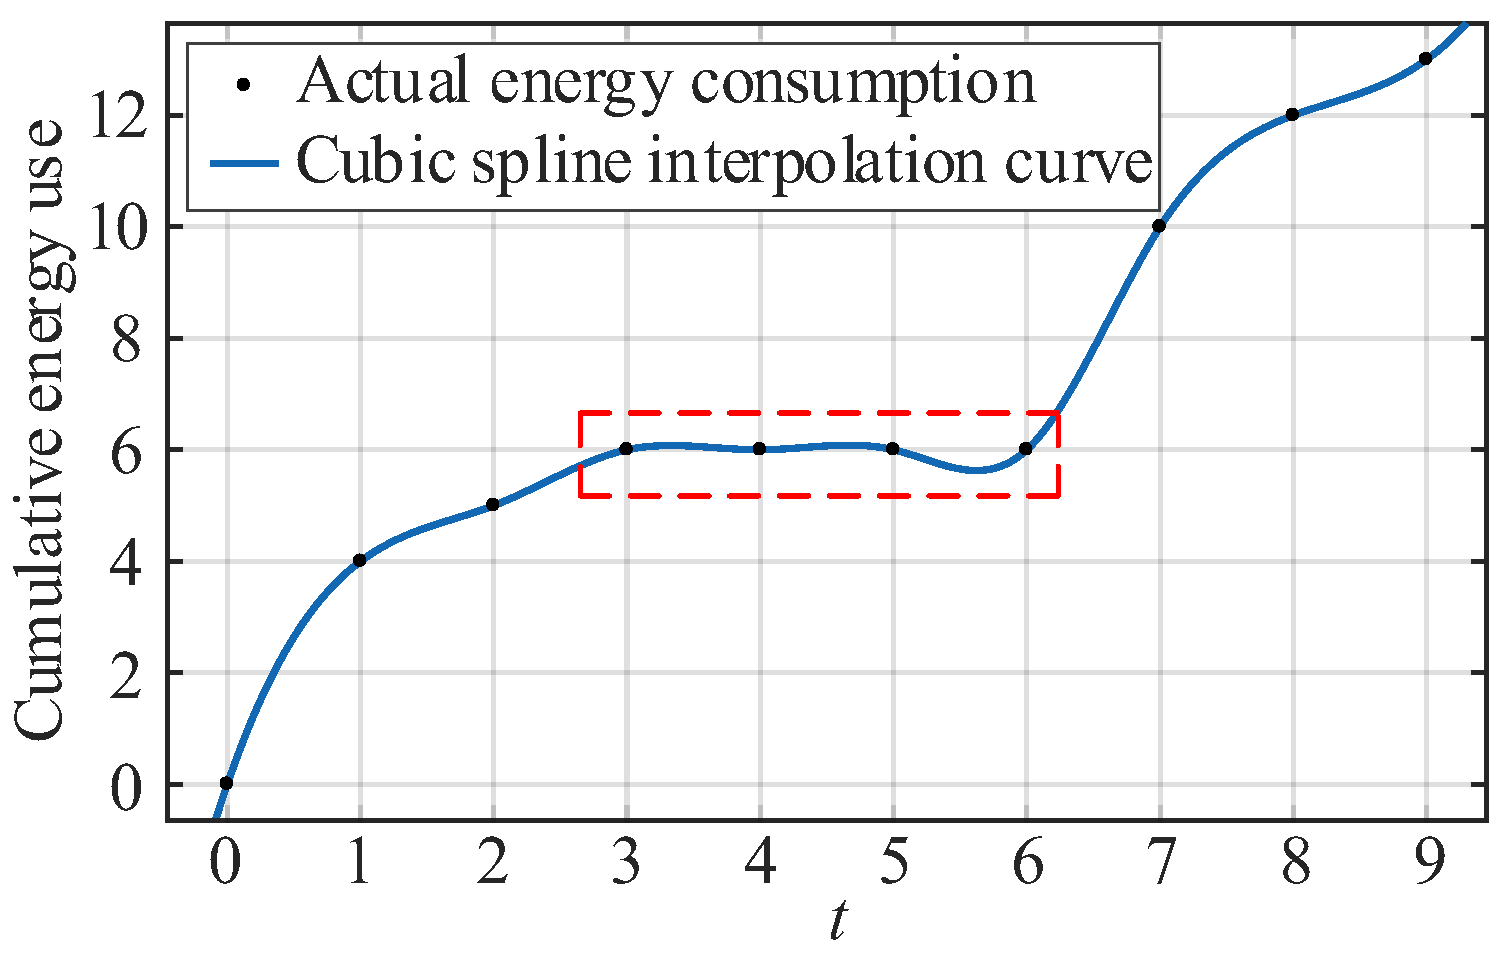
Among interpolation algorithms, the commonly used B-spline and cubic spline methods emphasize the smoothness of the interpolation curve, and the continuity of the higher derivative of the spline function is usually required. This makes them lack the ability to preserve monotonicity and are unsuitable for tracking the cumulative building energy consumption curves, as the latter may remain unchanged during idle hours, while the spline interpolation curve may exhibit fluctuations that do not conform to physical laws, as shown in
Figure 9.
The piecewise cubic Hermite interpolating polynomial (PCHIP) [
60] is a category of interpolants including the spline interpolants and others, but with various settings of derivatives. Currently, the PCHIP function in scientific computing tools like MATLAB 2025a and SciPy 1.16.0 adopts the derivatives setting originally proposed by Fritsch et al. [
61] for its shape-preserving ability. Therefore, it is employed for time registration in this study for its monotonicity-preserving ability for cumulative building energy consumption values. However, in Fritsch’s original design, the weight coefficients used to calculate the derivative values were a fixed linear combination of the lengths of adjacent intervals. This made it lack the ability to adapt to specific data characteristics. Therefore, an adaptive PCHIP method is proposed in this study, which optimizes the interpolation parameters through a data-driven approach and is particularly suitable for the time registration of time series of cumulative building energy data.
3.1.1. Adaptive PCHIP
Consider the time series (
ti,
yi),
i = 1, 2, …,
N, where the timestamps of normal data points are accurate and uniformly spaced from each other, while the timestamps of the sparsely distributed substitute data are deviated from the standard time instants. The base function of PCHIP for any data point at
t ∈ [
ti,
ti + 1] is:
where the normalized local variable
s = (
t −
ti)/
hi, the length of the interval
hi =
ti + 1 −
ti, and the coefficients of the base function are
h00(
s) = (1 + 2
s)(1 −
s)
2,
h10(
s) =
s(1 −
s)
2,
h01(
s) =
s2(3 − 2
s),
h11(
s) =
s2(
s − 1).
At any known internal data point at
ti (2 ≤
i ≤
N−1), the derivative
di is calculated by:
where
δi is the slope of [
ti,
ti + 1] calculated by:
w1 and
w2 are weights determined by the lengths of the two adjacent intervals:
where
α1 and
α2 are coefficients to be optimized according to actual time series data.
For any interpolation point, a total of four known data points is required to calculate the function value, with two points on each side. Due to the sparsity of the temporally deviated data points, it is always possible to find consecutive normal data points as the beginning and end of the entire time series to be interpolated. Therefore, the special treatment of the derivative values at the sequence endpoints can be omitted.
3.1.2. Parameter Optimization
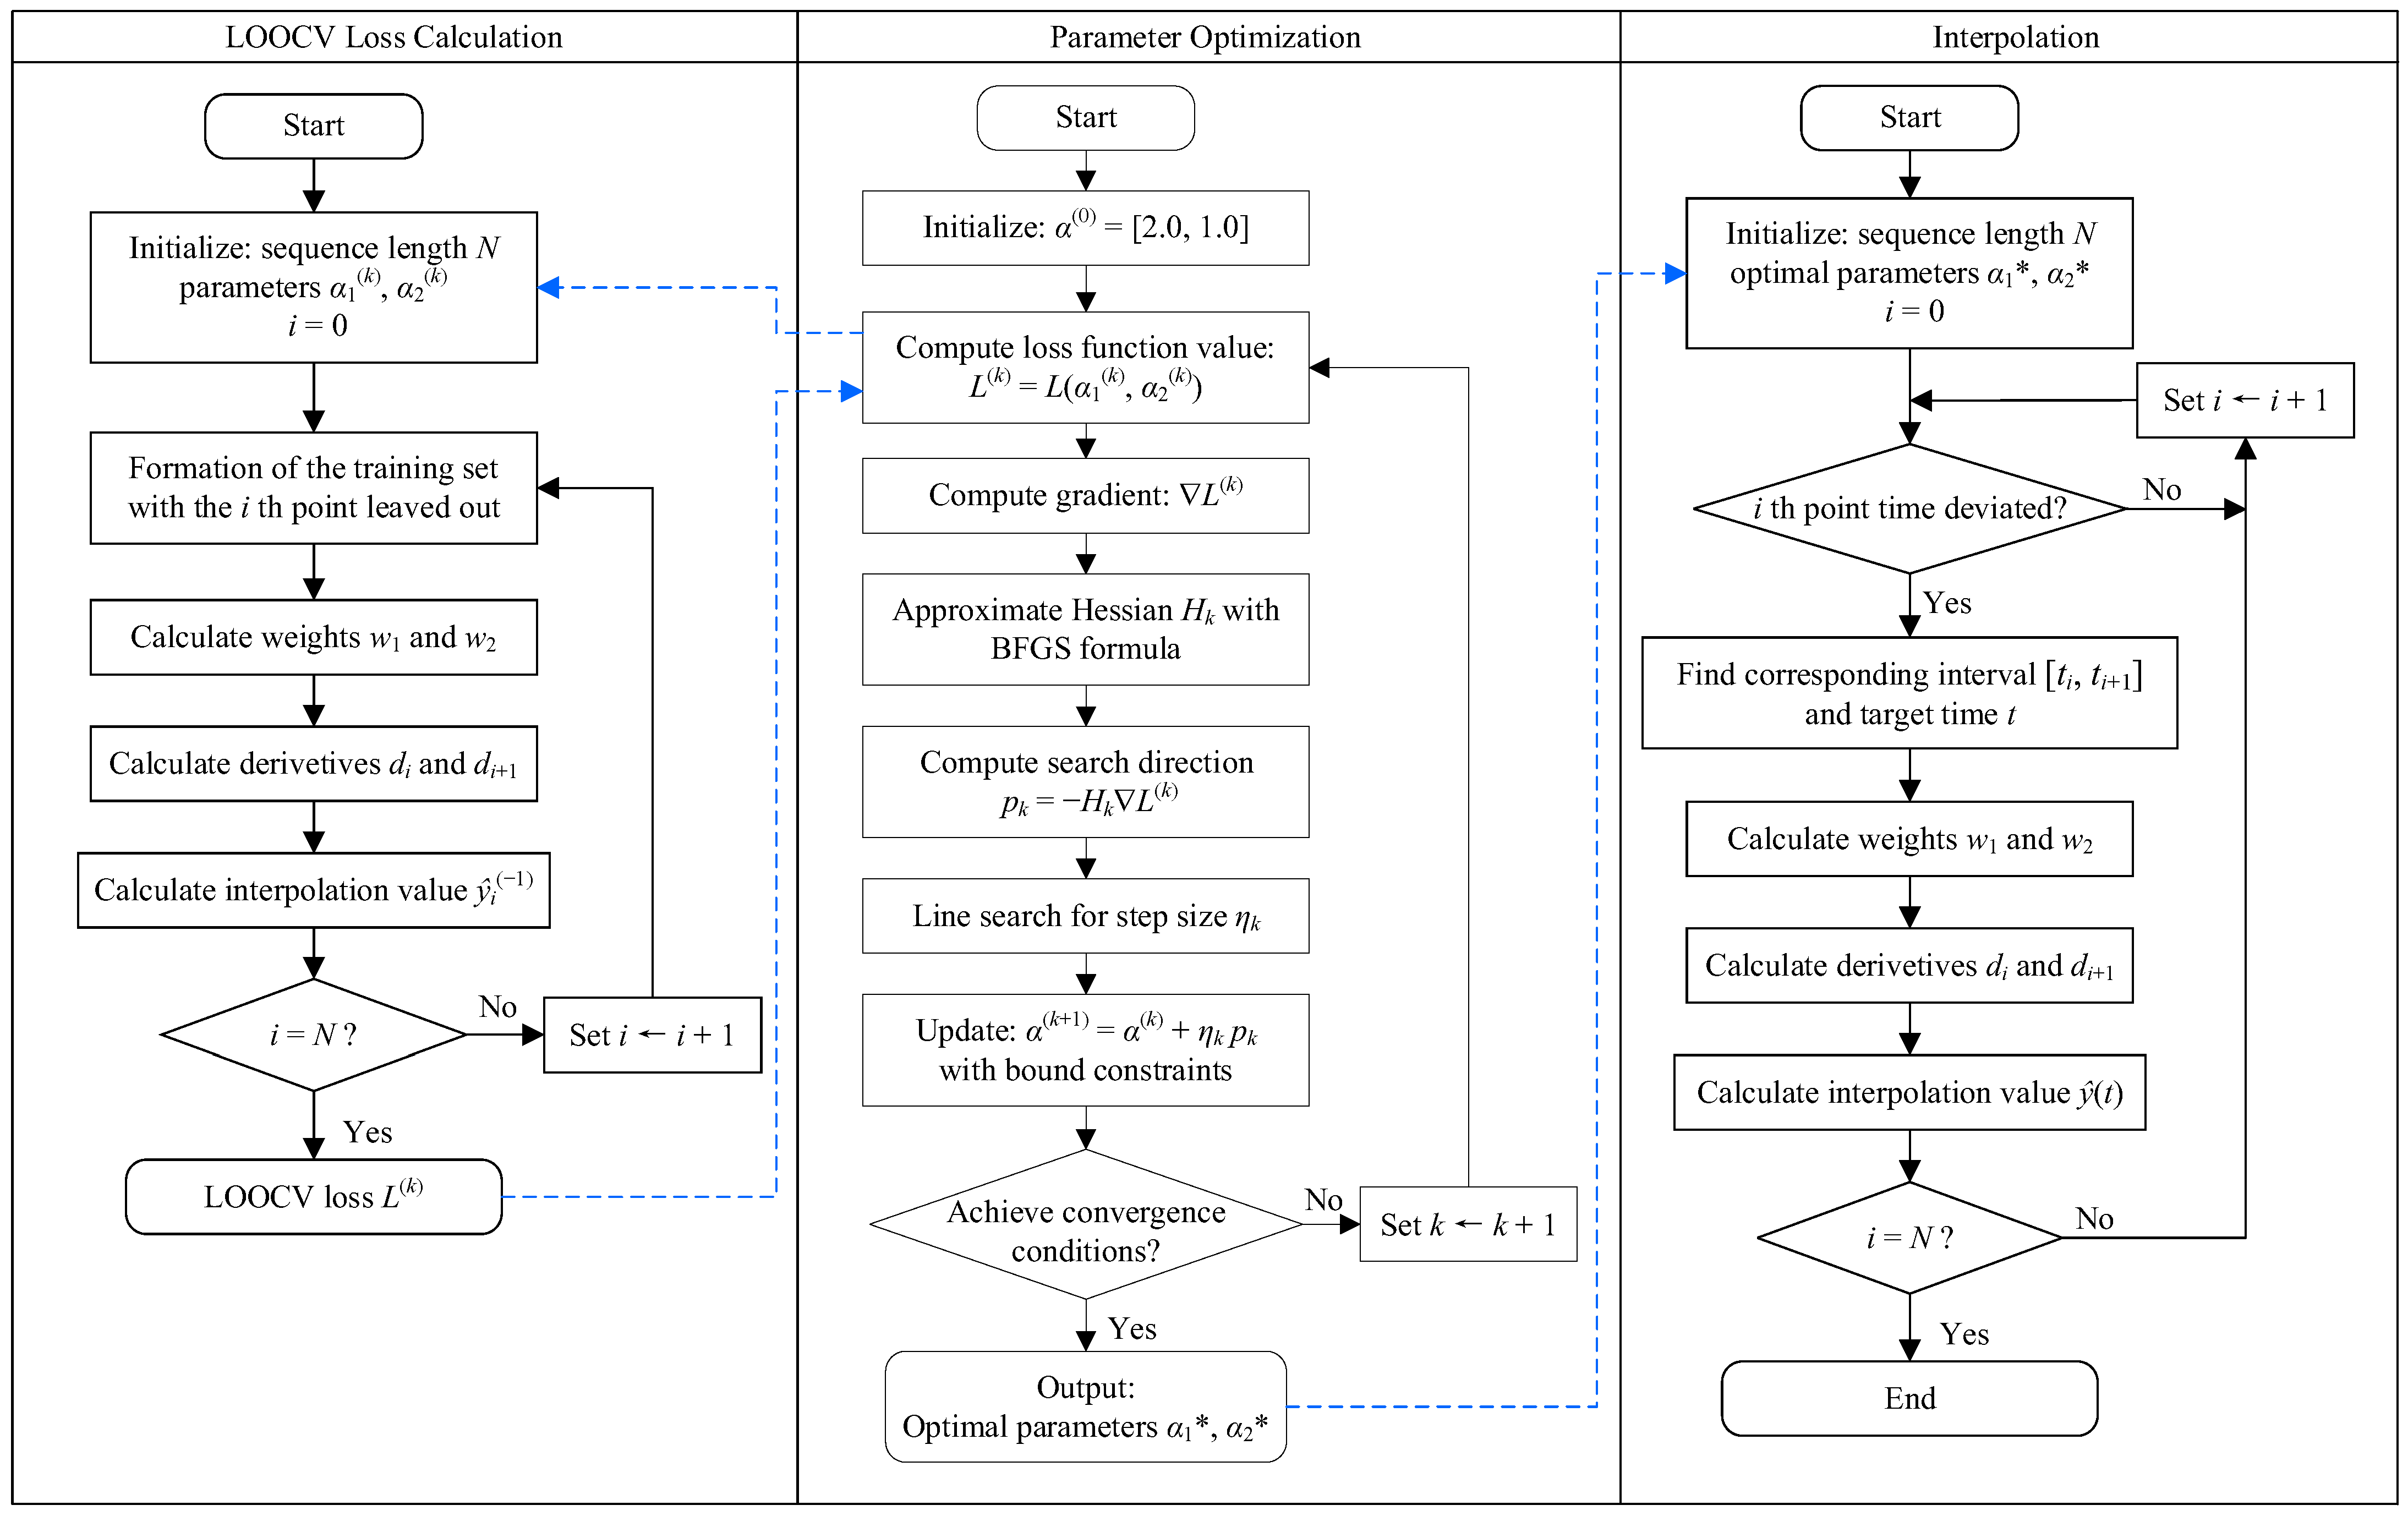
In the adaptive PCHIP algorithm, the optimal weight coefficients α1 and α2 need to be found such that the mean square error (MSE) of the interpolation result on the validation set is minimized. The Leave-One-Out Cross-Validation (LOOCV) strategy is employed to construct the loss function for parameter optimization. The method is capable of providing a near-unbiased global evaluation of the model performance due to the employment of all internal data points of the entire time series. The overall process of the method is, for a dataset containing N samples, N rounds of training and validation are conducted, and within each round, N-1 samples are used as the training set and the remaining one sample is used as the validation set. Finally, the average error of all N validations is calculated as the evaluation of the model’s performance.
The loss function is defined as:
where
yi is the truth value of the
ith data point,
is the prediction value using coefficients
α1 and
α2 with the
ith data point excluded.
Moreover, to ensure that the weight coefficients do not become too small and thus lead to unstable values, or too large and cause overfitting, the coefficients are subjected to the constraints:
The minimization of the loss function described in (6) is solved using the L-BFGS-B algorithm, a limited-memory quasi-Newton method designed for large-scale optimization problems with bound constraints [
62]. This algorithm effectively exhibits robust performance for non-linear and non-convex objective functions and can incorporate constraints on the coefficients.
The convergence conditions include:
The flowchart illustrating the workflow of the A-PCHIP method, including the calculation of the LOOCV loss function, parameter optimization and interpolation, is shown in
Figure 10.
3.2. Iterative Data Fusion
Estimates obtained through time registration may contain estimation errors, and the estimates of correlated meters may conflict with each other and break the law of conservation of energy. Therefore, to ensure physically meaningful results of correlated meters and achieve higher estimation accuracy, it is necessary to correct the preliminary estimation errors utilizing the spatial correlation of meters as the limiting boundary condition.
The Kalman filter (KF), as a commonly used data fuser, is an efficient autoregressive filtering model consisting of a set of equations that can estimate the optimal state of a dynamic process in terms of minimizing the mean squared error (MMSE) [
63], even when the precise nature of the modeled system is unknown [
64]. By recursively applying the “prediction” and “correction” process, it only needs to retain the current system state data [
65]. Therefore, it is suitable for the correction of time deviations in this study.
However, in most BECMPs, redundant sensors are unavailable, which means the common condition of multiple sensors monitoring the same target cannot be satisfied. Therefore, the proposed data fusion technique adopts the implementation of an iterative Kalman filter (iKF) consists of two iteratively executed steps: the generation of the virtual meter and the measurement fusion. Firstly, select the set of a total meter and submeters {m0, m1, m2, … mM} whose normally collected data satisfy the law of conservation of energy. Secondly, repeatedly execute the generation of a virtual meter and the data fusion, starting from m0 and ending with mM. Meanwhile, when each data fusion process is completed, the fused time series is then used for the generation of the next virtual meter, replacing its unfused one. Finally, when the fused time series of the last submeter is obtained, all fused series of submeters are used for the last round of virtual meter generation and data fusion for the total meter.
3.2.1. The Generation of Virtual Meters
The virtual meter of each meter is generated using the time series of all the other meters, which includes the time-registered series Em,R, or the fused series Em,F, if the latter are available.
The virtual measurement of the total meter (
m = 0) at
t can be calculated by:
where
Em, R/F(
t) is the time-registered or fused measurement of submeter
m (
m = 1, 2, …) at
t, and
M is the total number of submeters,
M ≥ 2. Whenever the fused time series of a meter is available, it is substituted into (11), replacing the unfused one. The measurement of a virtual submeter at time
t can be calculated by:
where
E0,F(
t) is the fused measurement of the total meter at
t.
The measurement values used in Equations (11) and (12) can either be time-segmented energy usage values, like the hourly values, or they can be cumulative energy consumption values if the time series of all the meters are aligned to a relative zero point so that the cumulative energy consumption values can be added up directly. The cumulative values are chosen in this study.
3.2.2. The Measurement Fusion
The second step is the data fusion of the time series of each meter and its virtual meter using the Kalman filter, where the time series
Ej(
t) and
E′
j(
t) are fused via a measurement fusion model based on the KF [
66]. The temporal evolution of cumulative energy consumption can be approximately modeled by the discrete-time linear equation:
where
t is the uniformly spaced time index,
xt is the state vector at time
t,
zt is the observation vector,
wt-1 and
vt are the uncorrelated zero-mean process noise and measurement noise vector with covariances
Q and
R, respectively, and
A and
H are the state transition and observation matrices.
The system dynamics within each time interval are assumed to be governed by the constant acceleration (CA) kinematic model. The parameters to be estimated in the model are given by the state vector:
where
x,
, and
represent the position, velocity, and acceleration components of the system state, respectively. The state transition matrix is:
The position component, i.e., cumulative energy consumption, is an explicit state, while the velocity and acceleration components, i.e., the time-segmented energy usage and its changing rate over time, are hidden states. The observation vector
zt consists of the time series values of the current meter and its virtual meter:
and the observation matrix is:
The state and covariance time propagation equations of the measurement fusion model are:
where
is the a priori estimate of the fused state vector at
t + 1,
is the posterior estimate of the fused state vector at
t,
is the covariance matrix of the prior estimation error, and
is the covariance of the posterior estimation error. When the noise sequences {
wt} and {
vt} are Gaussian, uncorrelated, and white, the KF is the minimum variance filter and minimizes the trace of the estimation error covariance at each time step.
The state and covariance update equations are:
where
is the Kalman gain, and
I is a 3 × 3 identity matrix.
The measurement noise covariance is:
where
R1 and
R2 are determined by the reconstruction error of the LOOCV process of the adaptive PCHIP using the optimized coefficients.
R1 is the reconstruction MSE of the current meter
m:
and
R2 is the sum of the reconstruction MSE of all the other meters:
The procedure of iKF algorithm is outlined in Algorithm 1.
| Algorithm 1: Iterative Kalman filter data fusion |
| Input: Time registered sequences Em,R, LOOCV losses Lm, m = 0, 1, … , M |
| Output: Fused sequences Em,F, m = 0, 1, … , M |
| 1: for m ∈ {0, 1, … , M} do |
| 2: R1 = Lm |
| 3: R2 = SUM(Lm) – R1 |
| 4: if m = 0 then |
| 5: Calculate virtual meter E′0 by Equation (11) |
| 6: else |
| 7: Calculate virtual meter E’m by Equation (12), use fused data if exists |
| 8: end |
| 9: /* Kalman filter initialization */ |
| 10: Z = [Em, E’m], X_fused = [], P_fused = [] |
| 11: Initialize empirically X_posterior, P_posterior, Q |
| 12: Add X_posterior to X_fused, add P_posterior to P_fused |
| 13: Set A, H, R by Equations (16), (18) and (24) |
| 14: /* Kalman filter measurement fusion */ |
| 15: for i ∈ {0, 1, … , N} do |
| 16: State and covariance propagation by Equations (19) and (20) |
| 17: Calculate Kalman gain by Equation (21) |
| 18: State and covariance update by Equations (22) and (23) |
| 19: Add X_posterior to X_fused, add P_posterior to P_fused |
| 20: end |
| 21: /* Fusion result of current meter */ |
| 22: Em,F ← X_fused[:, 0, 0] |
| 23: return Em,F |
| 24: end |
| 25: /* Final fusion for the total meter */ |
| 26: Calculate virtual meter E′0 by Equation (11) with all fused sequences Em,F |
| 27: Kalman filter initialization and measurement fusion for Z = [E0, E′0] |
| 28: return E0,F |
The flowchart of the proposed iterative data fusion method is illustrated in
Figure 11 with an example of five meters.
