1. Introduction
Climate change represents a pressing global challenge, influencing many aspects of human life and causing widespread environmental alterations. Decades of observational data reveal a consistent rise in global mean temperatures, a trend projected to intensify, causing more frequent and prolonged heat events in large parts of the world [
1]. The Mediterranean region is particularly vulnerable to these shifts, facing a projected increase in the frequency and intensity of droughts and heat waves [
2]. The region’s diverse topography, including coastal areas, inland valleys, and high mountains, creates local microclimates that can intensify overheating risk in buildings, particularly in regions where natural ventilation (NV) is the predominant cooling strategy [
3,
4].
Since NV performance depends heavily on outdoor atmospheric conditions, indoor environments are more susceptible to rising ambient temperatures, potentially leading to reduced thermal comfort and higher heat stress [
4]. Consequently, this built environment, the residential building stock faces a significant and growing risk of overheating.
Beyond mere discomfort, prolonged overheating elevates the risk of heat-related morbidity and mortality [
5,
6,
7]. Therefore, a thorough understanding of the thermal response of naturally ventilated residential buildings to heatwave events is critical to evaluate their inherent resilience and identify effective passive design interventions. This necessitates exploring how specific passive interventions can enhance building resilience under NV operation, thereby ensuring acceptable indoor environmental quality for occupants during periods of extreme heat.
Lebanon, overlooking the East Mediterranean Sea, is known for its diverse climate zones due to varying topography and is particularly vulnerable to heat waves [
8]. This diversity, ranging from humid coastal areas to cooler mountainous regions and semi-arid inland plateaus, strongly influences thermal comfort and building ventilation performance [
9]. Projections indicate that temperatures will rise by approximately 1 °C on the coast region and 2 °C inland by 2040, escalating to 3.5 °C to 5 °C by 2090 [
10]. Such a significant increase in the frequency and intensity of heat waves poses critical challenges to residential buildings concerning their thermal performance and resilience under future climatic conditions [
11]. Historically, Lebanon’s mild climate has favored natural ventilation as the primary cooling method, resulting in a building stock poorly suited to cope with increasing temperatures [
12]. Socioeconomic inequality further intensifies these vulnerabilities, as lower-income populations disproportionately experience discomfort and risk due to inadequate infrastructure and limited access to effective cooling solutions [
13]. Additionally, Lebanon experiences major infrastructural challenges, including an insufficient and unreliable power supply, which further limits the implementation of effective cooling strategies during prolonged heat waves [
9]. Consequently, buildings and their occupants become increasingly susceptible to overheating risks, emphasizing the urgent need for effective passive cooling interventions.
To mitigate such issues, there is a need to incorporate building design solutions that strengthen building resilience. Optimizing building envelope components such as shading devices, insulation levels, and ventilation systems can significantly reduce heat gain, lower indoor temperatures, and maintain comfortable living conditions during extreme heat waves. With the intensifying effects of climate change, such solutions play a crucial role in protecting occupants and maintaining tolerable indoor thermal conditions during extreme weather events [
14].
Several studies have examined different approaches for building design adaptation to increasing temperatures, and these have provided valuable information on the performance of increased insulation, reflective coatings, and passive cooling. Grygierek et al. conducted a multi-objective optimization of a naturally ventilated building focusing on orientation, insulation thickness, and window characteristics, resulting in significant reductions in thermal discomfort and electricity use [
15]. Similarly, Lin et al. optimized office building envelope parameters, achieving a substantial reduction in lifecycle costs by refining shading, construction materials, and fenestration size [
16].
Additionally, several researchers have focused on adaptive shading devices as potential solutions to reduce indoor temperatures and enhance resilience against overheating in naturally ventilated buildings. Maleki demonstrated that overhangs, louvers, and reflective surfaces could effectively reduce indoor temperatures by 2.5 to 4.5 °C [
17]. Porritt et al. further highlighted the effectiveness of external shading, especially when paired with natural ventilation, in maintaining indoor thermal comfort during peak heat periods [
18]. These findings were supported by Rahif et al. who showed shading significantly enhances building resistance to overheating [
19]. The orientation of a building is very important in naturally ventilated spaces as it affects airflow patterns and exposure to solar radiation. Aflaki et al. reported that the optimization of building orientation can considerably decrease the overheating risks, especially if it was coupled with other passive cooling strategies, such as shading and natural ventilation. For instance, the alignment of buildings for maximum exposure to prevailing winds can increase natural ventilation and improve thermal comfort [
20,
21]. These findings are supported by studies emphasizing the importance of aligning openings with prevailing wind directions to maximize natural ventilation efficiency. Proper orientation can enhance thermal comfort by optimizing natural ventilation pathways and reducing reliance on mechanical cooling systems [
19].
Window technologies are integral to optimizing natural ventilation. Michaux et al. examined airflow windows, which preheat or cool incoming air, improving indoor conditions and maintaining ventilation efficiency [
22]. Annan et al. also highlighted the importance of window placement and operation in achieving effective natural ventilation, particularly in regions with high diurnal temperature variations [
12].
Younes et al. assessed the impact of climate change on naturally ventilated residential buildings in Lebanon, highlighting increased risks of overheating under future climate scenarios [
6]. Their study did not implement specific design interventions, revealing that relying solely on natural ventilation will become insufficient for maintaining acceptable indoor conditions under future extreme weather scenarios [
6]. This underscores the necessity for targeted interventions, which are explicitly addressed and optimized in current research.
Porritt et al. provided a ranking of interventions to reduce overheating in buildings, with external shading and optimized window operations identified as primary strategies for mitigating thermal discomfort during heat waves [
18]. These findings are supported by Causone, who demonstrated that the combined use of shading and ventilation strategies significantly improves the Climate Potential of Natural Ventilation (CPNV), a key metric for assessing thermal comfort in naturally ventilated spaces [
23].
Rahif et al. introduced the Climate Change Overheating Resistivity (CCOR) metric, assessing how different passive cooling strategies, including natural ventilation, resist the impacts of climate change [
19]. Similarly, Hamdy et al. demonstrated the use of CCOR to evaluate the effectiveness of natural ventilation and other passive measures in reducing indoor overheating across various climatic zones [
24].
In addition to envelope-based strategies, other passive ventilation concepts such as solar chimneys have demonstrated strong effects in boosting airflow rates and reducing indoor overheating in hot climates. Solar chimney configurations can increase natural ventilation airflow by 20–60%, and reduce indoor temperatures by up to 4 °C if properly dimensioned [
25]. Adaptive or sensor-controlled ventilation terminals that regulate incoming air based on temperature, carbon dioxide levels, or safety thresholds are also implemented as dynamic NV solutions in buildings [
26]. While overheating is the primary focus of this study, indoor air quality (IAQ) and contaminant accumulation also represent important performance factors in naturally ventilated buildings, particularly during extended hot periods with limited airflow. To isolate the thermal effects of passive envelope variables, IAQ was excluded from the present optimization.
Nevertheless, with Lebanon facing economic challenges and diverse climates, it is crucial to determine the appropriate and optimal interventions for enhancing resilience. The country has been struggling with severe financial crises, with climate change expected to reduce GDP by up to 32% by 2080 [
27]. Mismanagement has led to the near collapse of the electricity sector, leaving many with only 1–2 h of power daily. Lower-income households bear the burden of high generator costs and frequent outages. These economic constraints make active mechanical systems unaffordable for most residents. For this reason, it is essential to implement passive systems that are more cost-effective in the long term [
28]. Therefore, solar chimneys and sensor-based concepts were not included in the present analysis, as the study is focused on low-cost, envelope-based interventions that do not require structural alterations. Given these challenges, practical and cost-effective interventions should be carefully implemented to enhance the resilience of naturally ventilated buildings against the increasingly severe impacts of climate change, particularly in economically strained contexts like Lebanon.
Previous studies have demonstrated the specific quantitative benefits of insulation, reflective materials, shading devices, and natural ventilation. However, a detailed, integrated analysis of these interventions under predicted future weather conditions, considering both their performance and economic feasibility, remains largely unexplored.
This study aims to optimize passive design strategies to improve the overheating resilience of NV residential buildings across four Lebanese climate zones under both cur-rent and future scenarios. The scope includes the variation of several parameters like building orientation, window type, and size, and shading elements such as overhangs, and the employment of a building energy model for a representative structure, coupled with an optimization algorithm to identify refurbishment options that balance resilience and the cost of interventions, ultimately improving performance under more severe cli-mate conditions. General recommendations for building envelopes are then made to enhance the building resilience of naturally ventilated buildings in the Mediterranean region.
The novelty of this work lies in the use of multi-objective optimization, multiple future climatic situations and a long-term overheating resilience metric (CCOR), applied to NV building stock in the Mediterranean context.
2. Problem Statement
This study proposes and tests a comprehensive framework for cost-effectively optimizing the resilience of typical Lebanese residential buildings, considering multiple climate zones and future climate scenarios. To establish the thermal context,
Figure 1 illustrates climatic zones in Lebanon, while
Table 1 presents the average summer and winter temperatures for each zone, extracted from the EPW weather files used in this study. These zones differ in altitude, humidity, and exposure, which shape both indoor thermal behavior and outdoor thermal stress levels.
Table 1.
Summary of climate zones in Lebanon.
Table 1.
Summary of climate zones in Lebanon.
| Zone | Climate Description | Average Summer Temperature | Average Winter Temperature | Context |
|---|
| Zone 1 | Coastal—warm and humid | 27.5 °C | 14.5 °C | Urban |
| Zone 2 | Low mountain—moderate | 26.2 °C | 12.0 °C | Semi-urban |
| Zone 3 | Inland plateau—semi-arid | 27.3 °C | 9.0 °C | Rural |
| Zone 4 | High mountain—cold with snowfall | 22.4 °C | 4.5 °C | Rural |
Figure 1.
Lebanon Climate Zones (UNDP).
Figure 1.
Lebanon Climate Zones (UNDP).
To assess building performance in the face of climate change, this study simulates indoor comfort across five climate scenarios, outlined in
Table 2. These include:
Typical Meteorological Year (TMY): Representing historical hourly averages.
Future climate projections for the years 2050 and 2080, under two Shared Socioeconomic Pathways (SSPs): SSP1-2.6, a low-emissions sustainable scenario; SSP5-8.5, a high-emissions, fossil-fueled development path.
Future weather files were generated using the morphing technique proposed by Belcher et al. [
29], applied to TMY data. The Future Weather Generator tool was selected for its integration of updated IPCC climate models, higher spatial resolution, and ability to morph multiple climatic parameters such as dry bulb temperature, dew point, humidity, solar radiation, and wind speed [
30]. Simulations were conducted for two projection periods: 2050 and 2080, using two climate change scenarios, SSP1-2.6 (low emissions) and SSP5-8.5 (high emissions) applied to each of four representative climate zones.
The building typologies selected in each zone reflect standard residential configurations typically found in their respective urban or rural contexts. All selected units have approximately the same apartment area, ensuring a consistent basis for comparison across climate zones. The buildings were selected following Lebanese building codes and municipal zoning regulations, which define maximum building heights and form typologies by location and urban density.
Table 3 details the story count, building type, and urban context for each case.
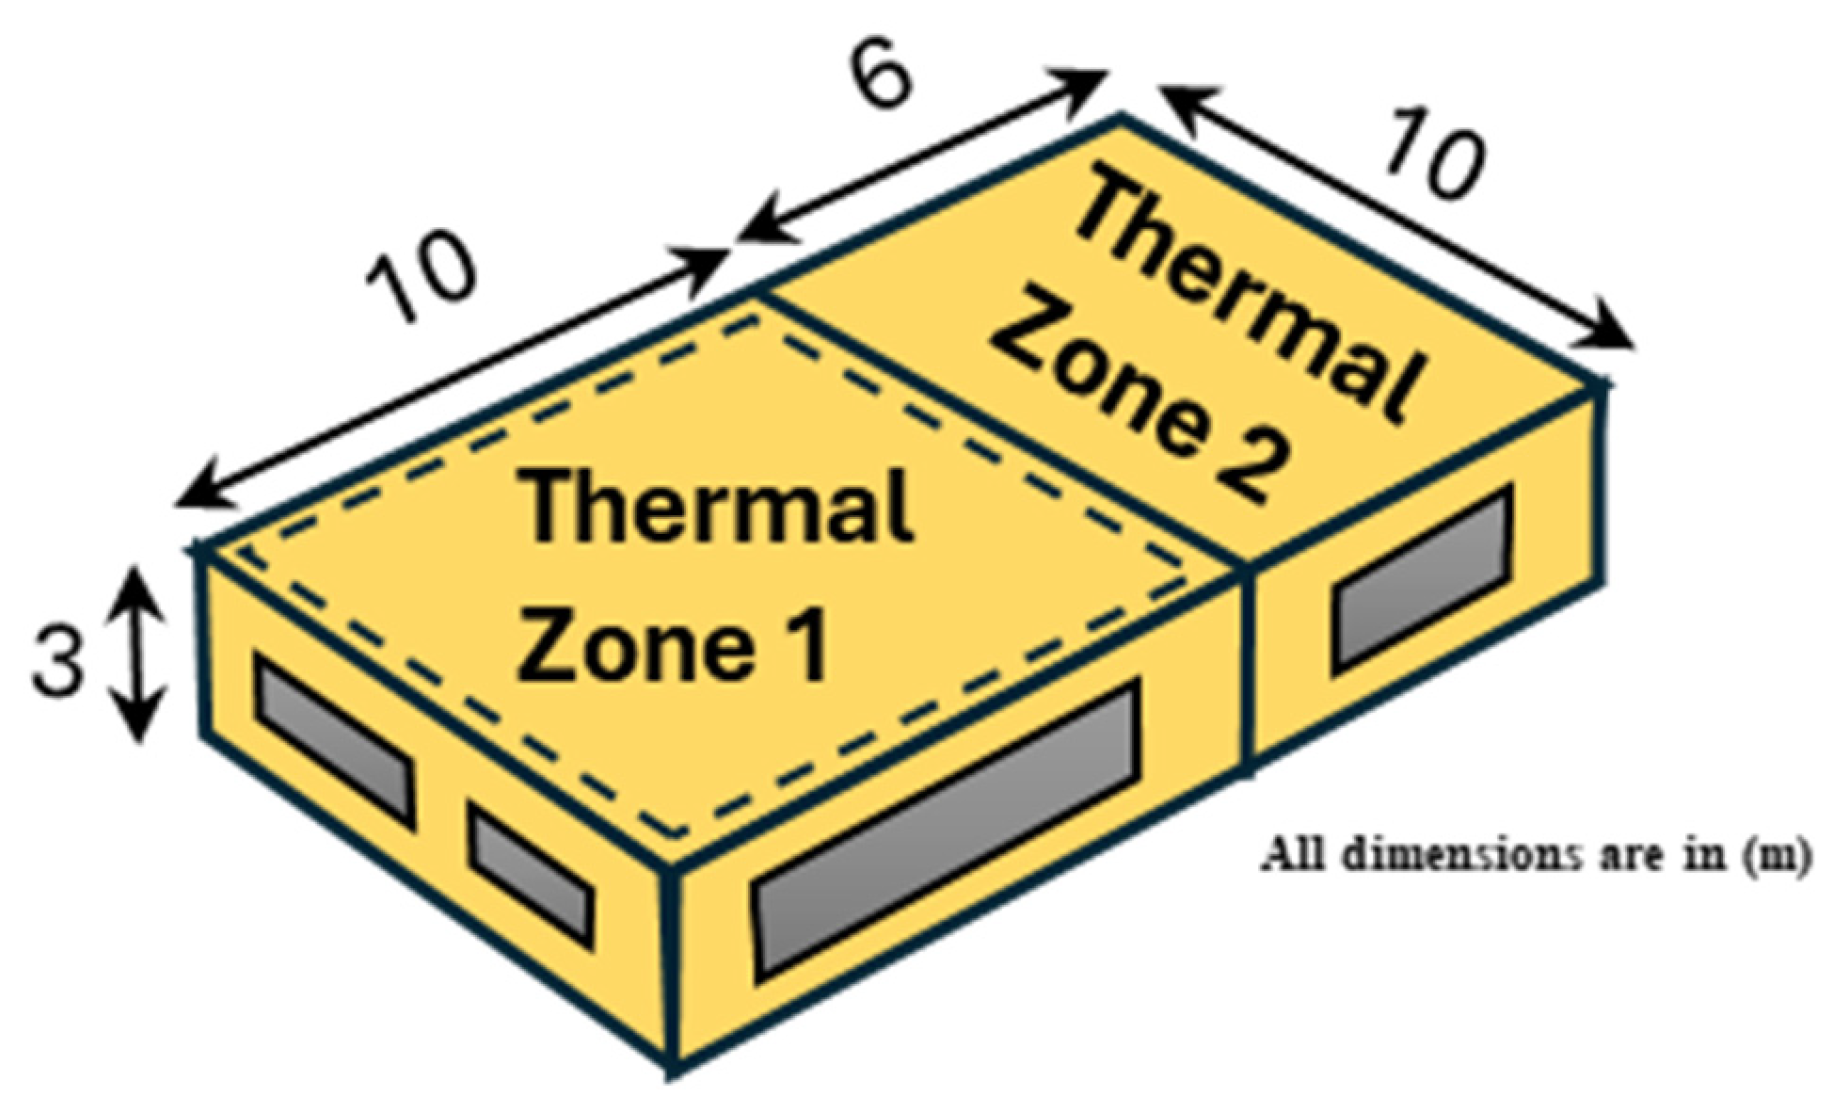
All apartments include two thermal zones, and simulations focus on the primary occupied zone (Thermal Zone 1), where two sedentary occupants are assumed, reflecting average apartment occupancy in Lebanese households. The occupancy pattern, internal gains, and natural ventilation assumptions are consistent across all zones.
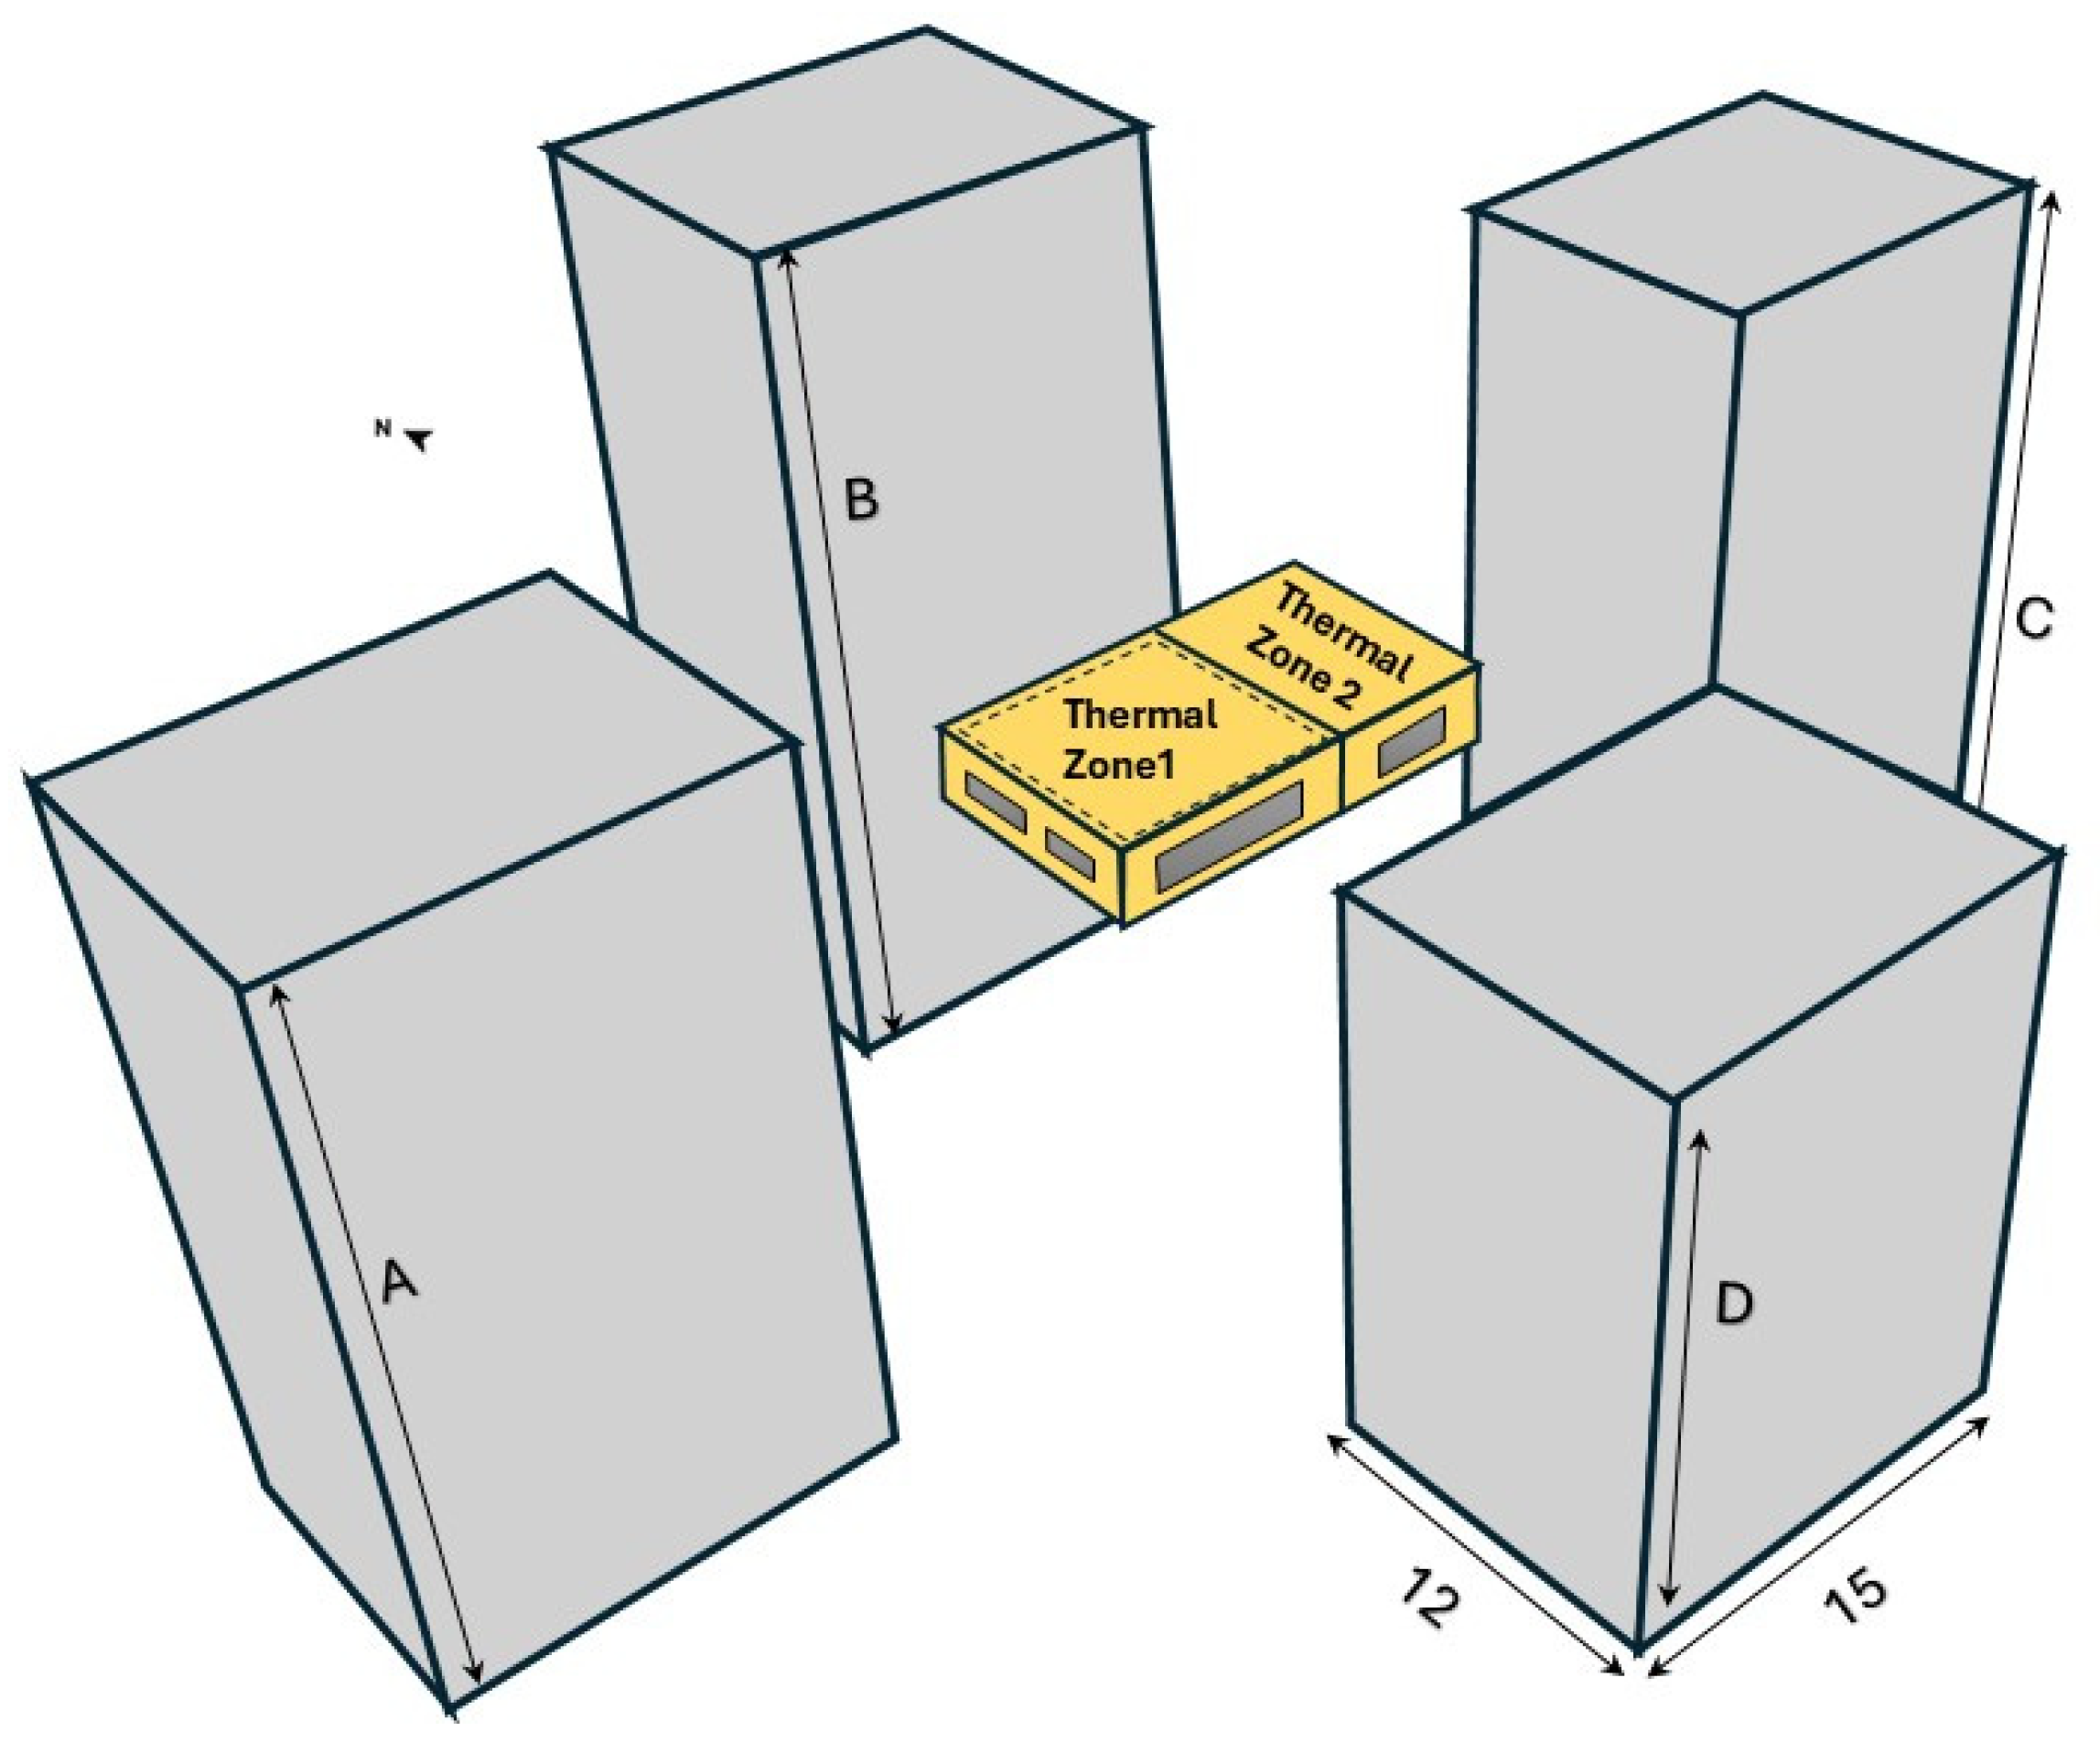
Heat transfer with floors above and below is ignored to simplify thermal modeling, assuming a similar thermal response across vertically adjacent spaces. Neighboring buildings are treated as fixed shading elements, representing surrounding urban morphology or landscape conditions depending on the zone.
This simplification is consistent with the modeling approach of Annan et al. simulating natural-ventilation performance in a single representative apartment (mid-floor) of Beirut residential buildings [
12]. Their study demonstrated that a mid-floor level captures the typical thermal and airflow behavior of the building, as wind-induced pressure differences between consecutive floors are small compared with façade-to-façade gradients [
12]. Since the simulated unit in the current work represents a middle floor, and surrounding buildings are explicitly modeled (see
Table 4), excluding upper and lower floors is not expected to significantly affect the pressure distribution or ventilation performance.
Figure 2 shows the reference apartment configuration. The apartment has identical geometry and construction across all zones, providing a consistent basis for comparison. However, the external environment, specifically the surrounding shading buildings varies based on the zones urban or rural context. These external buildings are modeled to simulate realistic solar obstruction and ventilation conditions. Their relative positions and heights, which affect shading and wind exposure, are detailed in
Table 4 and visually depicted in
Figure 3. The labels A, B, C, and D represent the heights of the surrounding buildings as labeled in
Figure 2.
Figure 2.
Geometry and layout of the representative apartment used in the simulation. The apartment consists of two thermal zones and is modeled consistently across all climate zones.
Figure 2.
Geometry and layout of the representative apartment used in the simulation. The apartment consists of two thermal zones and is modeled consistently across all climate zones.
Table 4.
Heights of surrounding buildings (Labeled A–D in
Figure 3).
Table 4.
Heights of surrounding buildings (Labeled A–D in
Figure 3).
| Zone | A (m) | B (m) | C (m) | D (m) | Notes |
|---|
| Zone 1 | 25 | 30 | 25 | 25 | Dense urban surroundings with tall residential blocks |
| Zone 2 | 18 | 25 | 18 | 18 | Mixed-height buildings in semi-urban residential areas |
| Zone 3 | 9 | — | — | 9 | Limited shading in a rural setting |
| Zone 4 | — | — | — | — | Open rural landscape with no immediate shading structures |
Figure 3.
Heights of studied apartment and surrounding buildings used to simulate shading in the model. Values for A, B, C, and D differ by climate zone, as detailed in
Table 4.
Figure 3.
Heights of studied apartment and surrounding buildings used to simulate shading in the model. Values for A, B, C, and D differ by climate zone, as detailed in
Table 4.
The thermal envelope and glazing specifications used in this study are based on typical construction practices for the Mediterranean region and follow Lebanese standards set by the Order of Engineers and Architects (OEA) [
31].
Table 5 summarizes the baseline construction specifications.
Windows are modeled with two operational states: fully shut or fully open. In the open configuration, only half of the glazing area is assumed to allow air passage, representing typical sliding window operation.
The baseline energy model is developed in EnergyPlus version 23.2.0 and is used to assess the thermal response and resilience of the case study apartment under natural ventilation. Each apartment includes two thermal zones; however, analysis is focused on Thermal Zone 1, occupied by two sedentary individuals. The internal load assumptions include a 100 W lighting source and 200 W of equipment when occupied.
The model employs the “Add Wind and Stack Open Area” feature to simulate natural ventilation airflow paths through operable windows.
Table 6 details the occupancy schedule applied uniformly across all scenarios.
Construction materials and window-to-wall ratios follow the Lebanese standards [
31], with the same construction material as described in
Section 2. The accuracy of the EnergyPlus model, along with the baseline building parameters and settings characteristic of Lebanese standards, was validated in a previous study by Annan et al. [
12]. This validation involved comparing the predicted mean indoor temperatures for 24 h on 26 July 2013, with measured indoor temperatures. Throughout these validation runs, windows were assumed to be continuously open, mirroring the conditions of the real building. A total of 40 simulations, each spanning one year, were carried out using the same building model across a range of climate zones and weather scenarios.
The model validation against Annan et al. [
12] demonstrated that simulated indoor temperature patterns closely follow the measured trends in both timing and magnitude. Daytime peaks and nighttime cooling behavior are well reproduced under the condition of continuously open windows, consistent with the original case study. Some residual discrepancies likely arise from simplified assumptions around infiltration, internal gains, or occupant behavior, but overall, the agreement is adequate to support the model’s use in assessing instantaneous overheating risk (IOD) and long-term resilience (CCOR) under projected climate scenarios. A detailed list of all passive design interventions simulated comprising window types, shading depths, and orientations is provided in
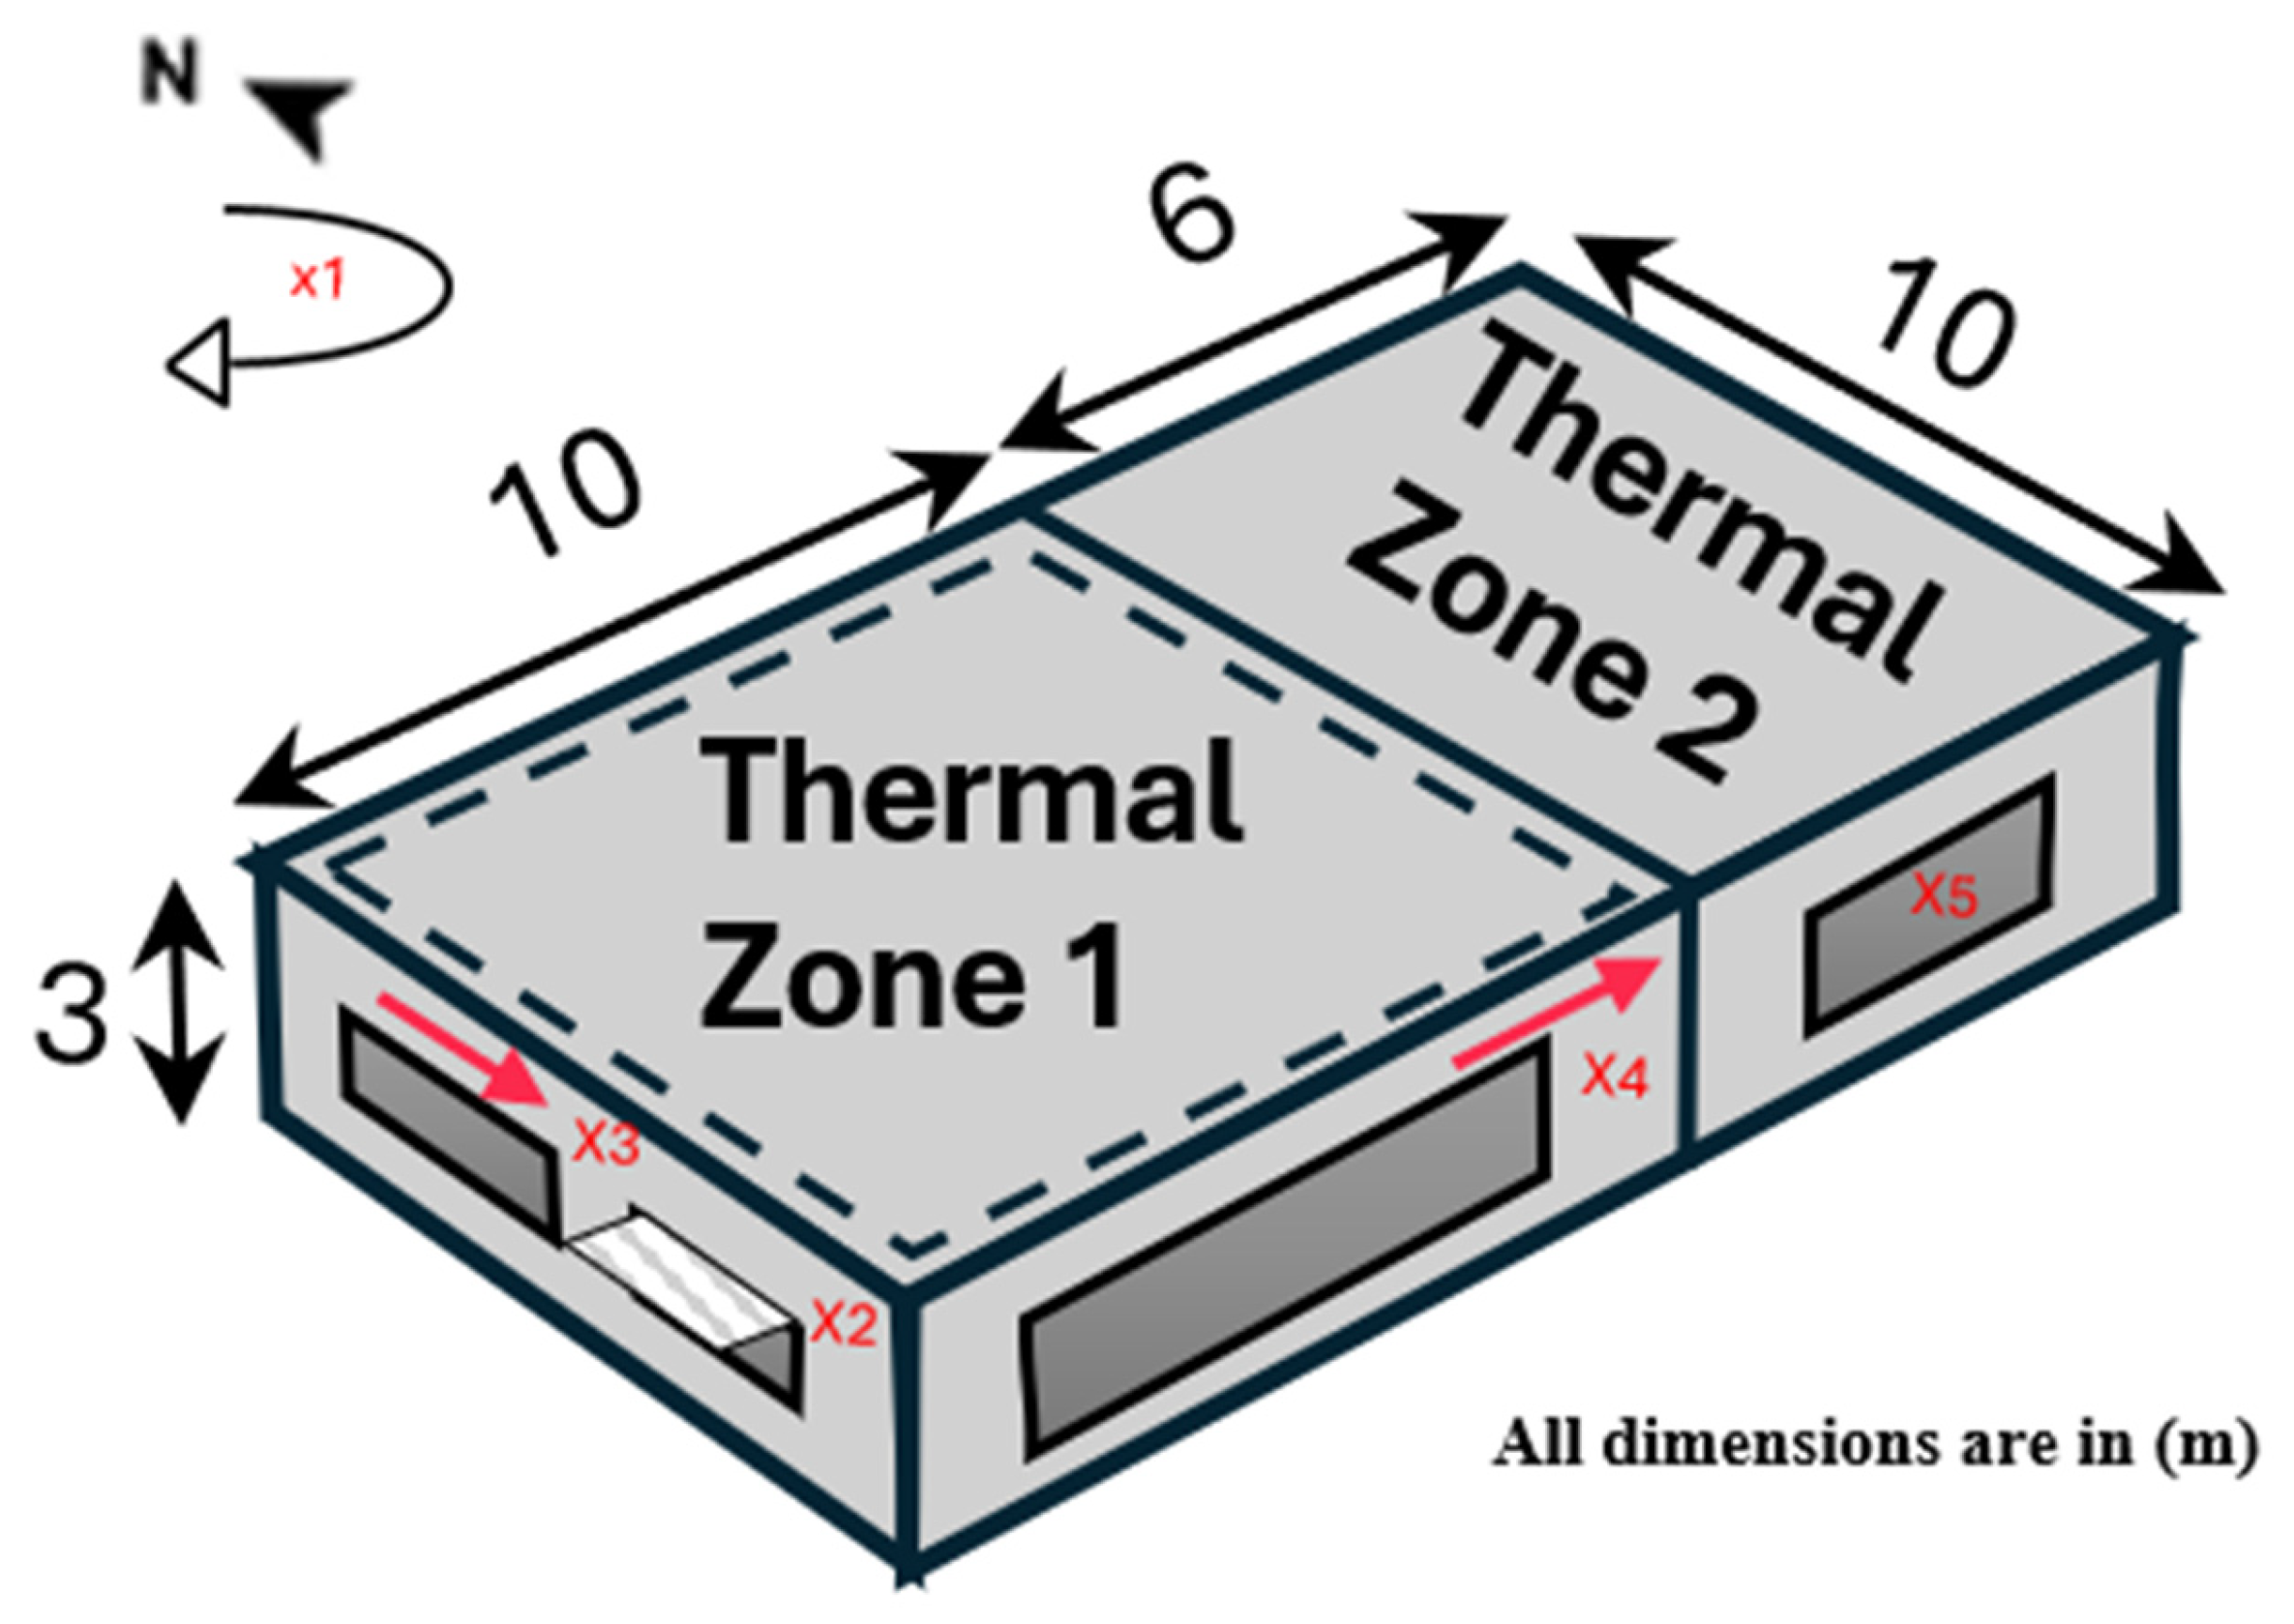
Table 7, along with descriptions of the combined intervention strategies explored in the optimization analysis. These variables define the complete search space for the optimization process and represent all possible retrofit combinations tested for each climate zone and weather scenario. For visual clarity, the floor-plan sketch and the variables are shown in
Figure 4.
3. Methodology
The methodology section outlines the approach used to assess and enhance the resilience of naturally ventilated buildings under future climate conditions. The methodology is divided into several key areas: (i) defining resilience indicators for building performance, (ii) developing a baseline building energy model to be used for optimization, (iii) characterizing the four different climate zones in Lebanon and the corresponding five different weather scenarios, and (iv) the multi-objective optimization method that aims to enhance resilience at minimal intervention cost, thus recommending the most optimal interventions for each climate zone that remain effective across the five different weather scenarios.
3.1. Building Resilience and Indicators
In terms of building performance, resilience is the capacity of the building to continue operating and providing thermal comfort in the face of climate change, extreme weather events, or changes in the surrounding environment [
32]. Therefore, in the absence of mechanical ventilation systems to provide indoor thermal comfort, it is imperative to enhance the resilience of naturally ventilated buildings that rely on passive design interventions to achieve indoor thermal comfort.
The adaptive comfort model is suitable for assessing thermal comfort in naturally ventilated buildings. Unlike static models, adaptive models do not predict exact comfort responses but identify conditions under which occupants are likely to feel comfortable. The term “adaptive” reflects the idea that people adjust to their thermal environment through conscious (changing clothing insulation, posture, activity level) or unconscious physiological (variations in skin blood flow, adaptations to fluid loss) adjustments [
32]. The conditions of adaptive thermal comfort can be identified as upper and lower bounds of the operative comfort temperature (
TOC). Based on the de Dear and Brager model (ASHRAE, 2017) [
33], the operative comfort temperature is computed using the monthly average outdoor temperature (
Tout) using the following equation:
The upper and low bounds for a 90% acceptability range are defined as follows:
Therefore, the operative comfort temperature, with its upper and lower limits, is crucial for defining and evaluating several building performance indicators to measure the effectiveness of the building envelope. Such metrics include the Indoor Overheating Degree (IOD), Climate Change Overheating Resistivity (CCOR), Ambient Warmness Degree (AWD), and Comfort Potential for Natural Ventilation (CPNV) [
19]. These metrics help evaluate how the building reacts to current and upcoming weather patterns, especially regarding overheating and occupant comfort [
32].
3.1.1. Indoor Overheating Degree (IOD)
The Indoor Overheating Degree (IOD) reflects the extent and frequency instances of indoor temperature exceeding comfort limits. It is defined as the sum of positive differences between the indoor operative temperature (T
op) and the upper comfort temperature limit (T
oc_high) over all occupied hours, and is used to quantify overheating intensity:
where
k is the simulation time step counter,
Nocc is the total number of occupied time steps,
Top,k is the indoor operative temperature at time
k,
Toc,high is the upper comfort temperature limit, and
tk is the duration of time step
k. ( )
+ means that only positive values are considered; otherwise, it is zero [
24].
3.1.2. Climate Change Overheating Resistivity (CCOR)
Climate Change Overheating Resistivity (CCOR) is a key metric used to evaluate the building resistance to future climate change impacts. It measures the sensitivity of IOD to increases in outdoor temperature [
6]. To calculate CCOR, the Ambient Warmness Degree (AWD) is used to quantify the severity of external thermal conditions:
where T
out,k is the outdoor air temperature at time k, T
b is the base temperature (set at 18 °C for temperate climates), N
occ is the total number of occupied hours, and t
k is the simulation time step (hours). Then, the CCOR is computed by performing linear regression between IOD and AWD:
where Sc is the weather scenario counter, M is the total number of weather scenarios,
and
are the IOD and AWD for scenario ‘s’, and
and
are the mean IOD and AWD across all scenarios. This regression assesses the relationship between indoor overheating and outdoor warmness across different climate scenarios. The reciprocal of
is derived from the slope of this regression line.
CCOR is selected as the primary resilience indicator because it directly and sensitively quantifies how a building’s indoor overheating responds to long-term climatic warming. In contrast to single-scenario comfort indices such as the Cooling Potential of Natural Ventilation (CPNV) or weighted degree-hours, CCOR evaluates the rate at which indoor overheating intensifies with respect to outdoor temperature rise across multiple future scenarios. This approach provides a more robust representation of thermal resilience by capturing both the magnitude and the trajectory of comfort degradation under climate change. As such, CCOR complements short-term metrics like the IOD, which measures instantaneous overheating severity, by adding a longitudinal dimension that reflects the building’s capacity to maintain stable indoor conditions under progressive warming. Consequently, CCOR was adopted as the anchor metric for resilience evaluation, offering a consistent basis for comparing intervention effectiveness across climates and future emission pathways [
19,
23,
24].
To ensure methodological consistency with the CCOR definition, the metric was computed using a fixed intervention set across all five climate scenarios (TMY, SSP1-2.6 for 2050 and 2080, and SSP5-8.5 for 2050 and 2080). For each tested intervention combination included in the CCOR analysis, the building parameters, orientation, shading depth, window type, and window size were kept constant across scenarios. This approach allowed CCOR to quantify how the same building configuration responded to varying external thermal conditions. Since optimization processes across scenarios may yield different parameter sets, a solution-matching step was applied to identify configurations that were feasible across all five scenarios. Only these consistently defined configurations were used for CCOR evaluation. This process ensures that CCOR reflects the thermal resilience of a single building design subjected to multiple future climate projections, thereby preserving the integrity of the metric.
To evaluate the resilience performance metrics using the EnergyPlus model, custom output variables, such as the Ambient Warmness Degree (AWD) and the Indoor Overheating Degree (IOD), were created using the “Energy Management System: Output Variable” feature in EnergyPlus. Eventually, these outputs are utilized to calculate the Climate Change Overheating Resistivity (CCOR).
3.2. Optimization Method and Algorithm
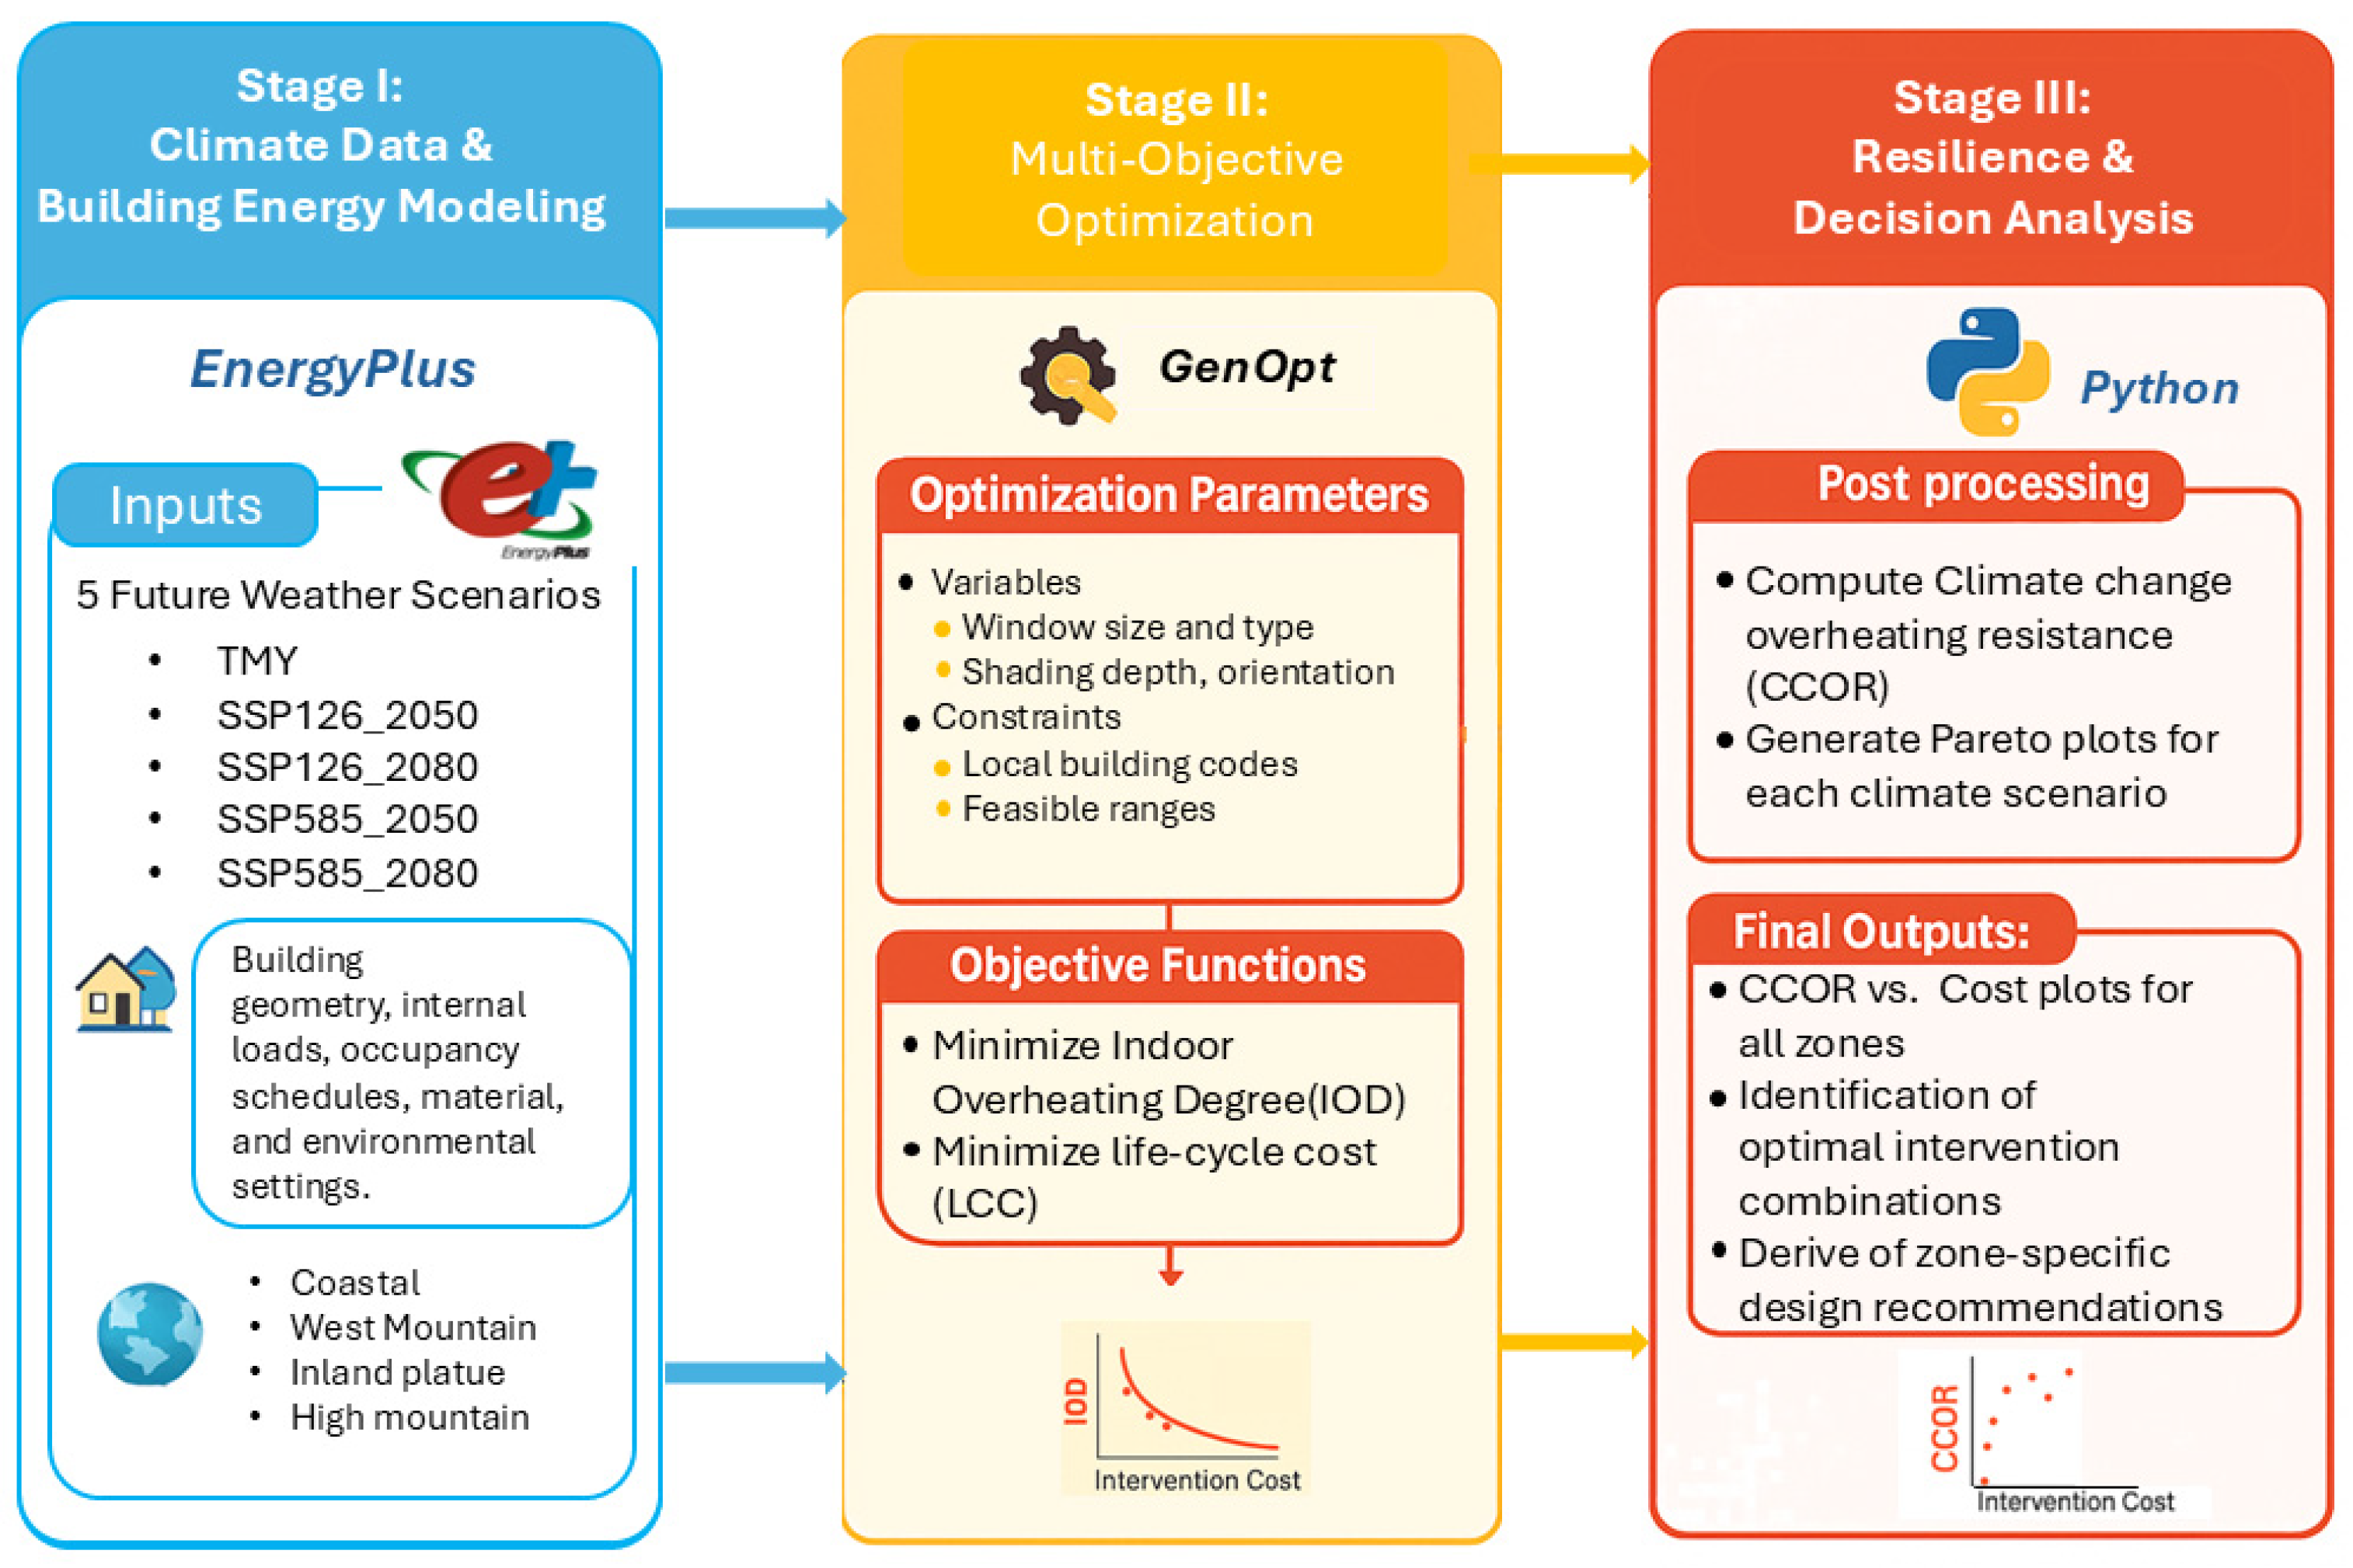
A structured workflow was adopted to carry out the multi-objective optimization process, as shown in
Figure 5. This includes building a simulation setup, defining optimization parameters, applying the hybrid optimization algorithm, and simulating each intervention scenario using EnergyPlus under five extreme weather files.
An optimization process was conducted to evaluate various interventions that could potentially enhance the thermal performance of the building, including adjustments to building orientation to optimize solar exposure and natural ventilation, modifications to window type and size, and incorporation of shading elements like overhangs to reduce solar gains.
The tested design variables include four passive parameters (
Table 7): (i) orientation (x
1) ranging from 0° to 360°; (ii) overhang depth (x
2) varying between 0.1 m and 1.0 m; (iii) south- and west-facing window widths (x
3, x
4) ranging from 1.5 m to 5.0 m and 2.4 m to 4.5 m, respectively; and (iv) window glazing type (x
5), tested as clear, bronze, and low-emissivity single glazing with distinct U-values and SHGCs. These parameters define the design space explored during optimization.
The primary objectives of the optimization were to minimize the Indoor Overheating Degree (IOD), reflecting the frequency and intensity of indoor temperature exceedances, and to minimize intervention costs to ensure economic feasibility. GenOpt (version 3.1.0)an optimization software designed for use with building energy simulation programs like EnergyPlus (version 23.2.0), was used to facilitate the search for optimal solutions by automating simulations and applying advanced optimization algorithms.
The hybrid algorithm employed combines the Particle Swarm Optimization (PSO) and Hooke–Jeeves (HJ) methods. PSO is a population-based, stochastic optimization technique inspired by the social behavior of animals, effective for global search by simulating particles adjusting positions based on individual and collective experiences. HJ is a direct search, deterministic optimization method that iteratively refines solutions by exploring the vicinity of the current best solution, effective for local search. This hybrid approach balances exploration and exploitation for robust optimization and handles mixed continuous and discrete variables effectively.
The objective functions in this analysis can be formulated as follows:
Objective Function 1: Minimize Indoor Overheating Degree (IOD).
Objective Function 2: Minimize Initial Intervention Cost.
The design variables
through
represent the selected passive interventions, whose ranges and options were previously detailed (
Table 7).
The initial cost of overhang includes glazing replacement and fixed shading (overhang) additions. The overhang cost was calculated from the projected horizontal area of the shading plate on each façade, taken as the product of overhang depth
(m) and façade window length
(m). A unit price of 50 USD/m
2 was adopted, following construction-cost benchmarks for external shading devices reported in recent retrofit studies [
34]. Thus, for façade i:
This formulation is consistent with the cost functions implemented in GenOpt.
The three simulated window types differ in thermal and solar performance characteristics, as well as cost. These specifications are summarized in
Table 8, which outlines the glazing properties and associated costs used in the optimization process.
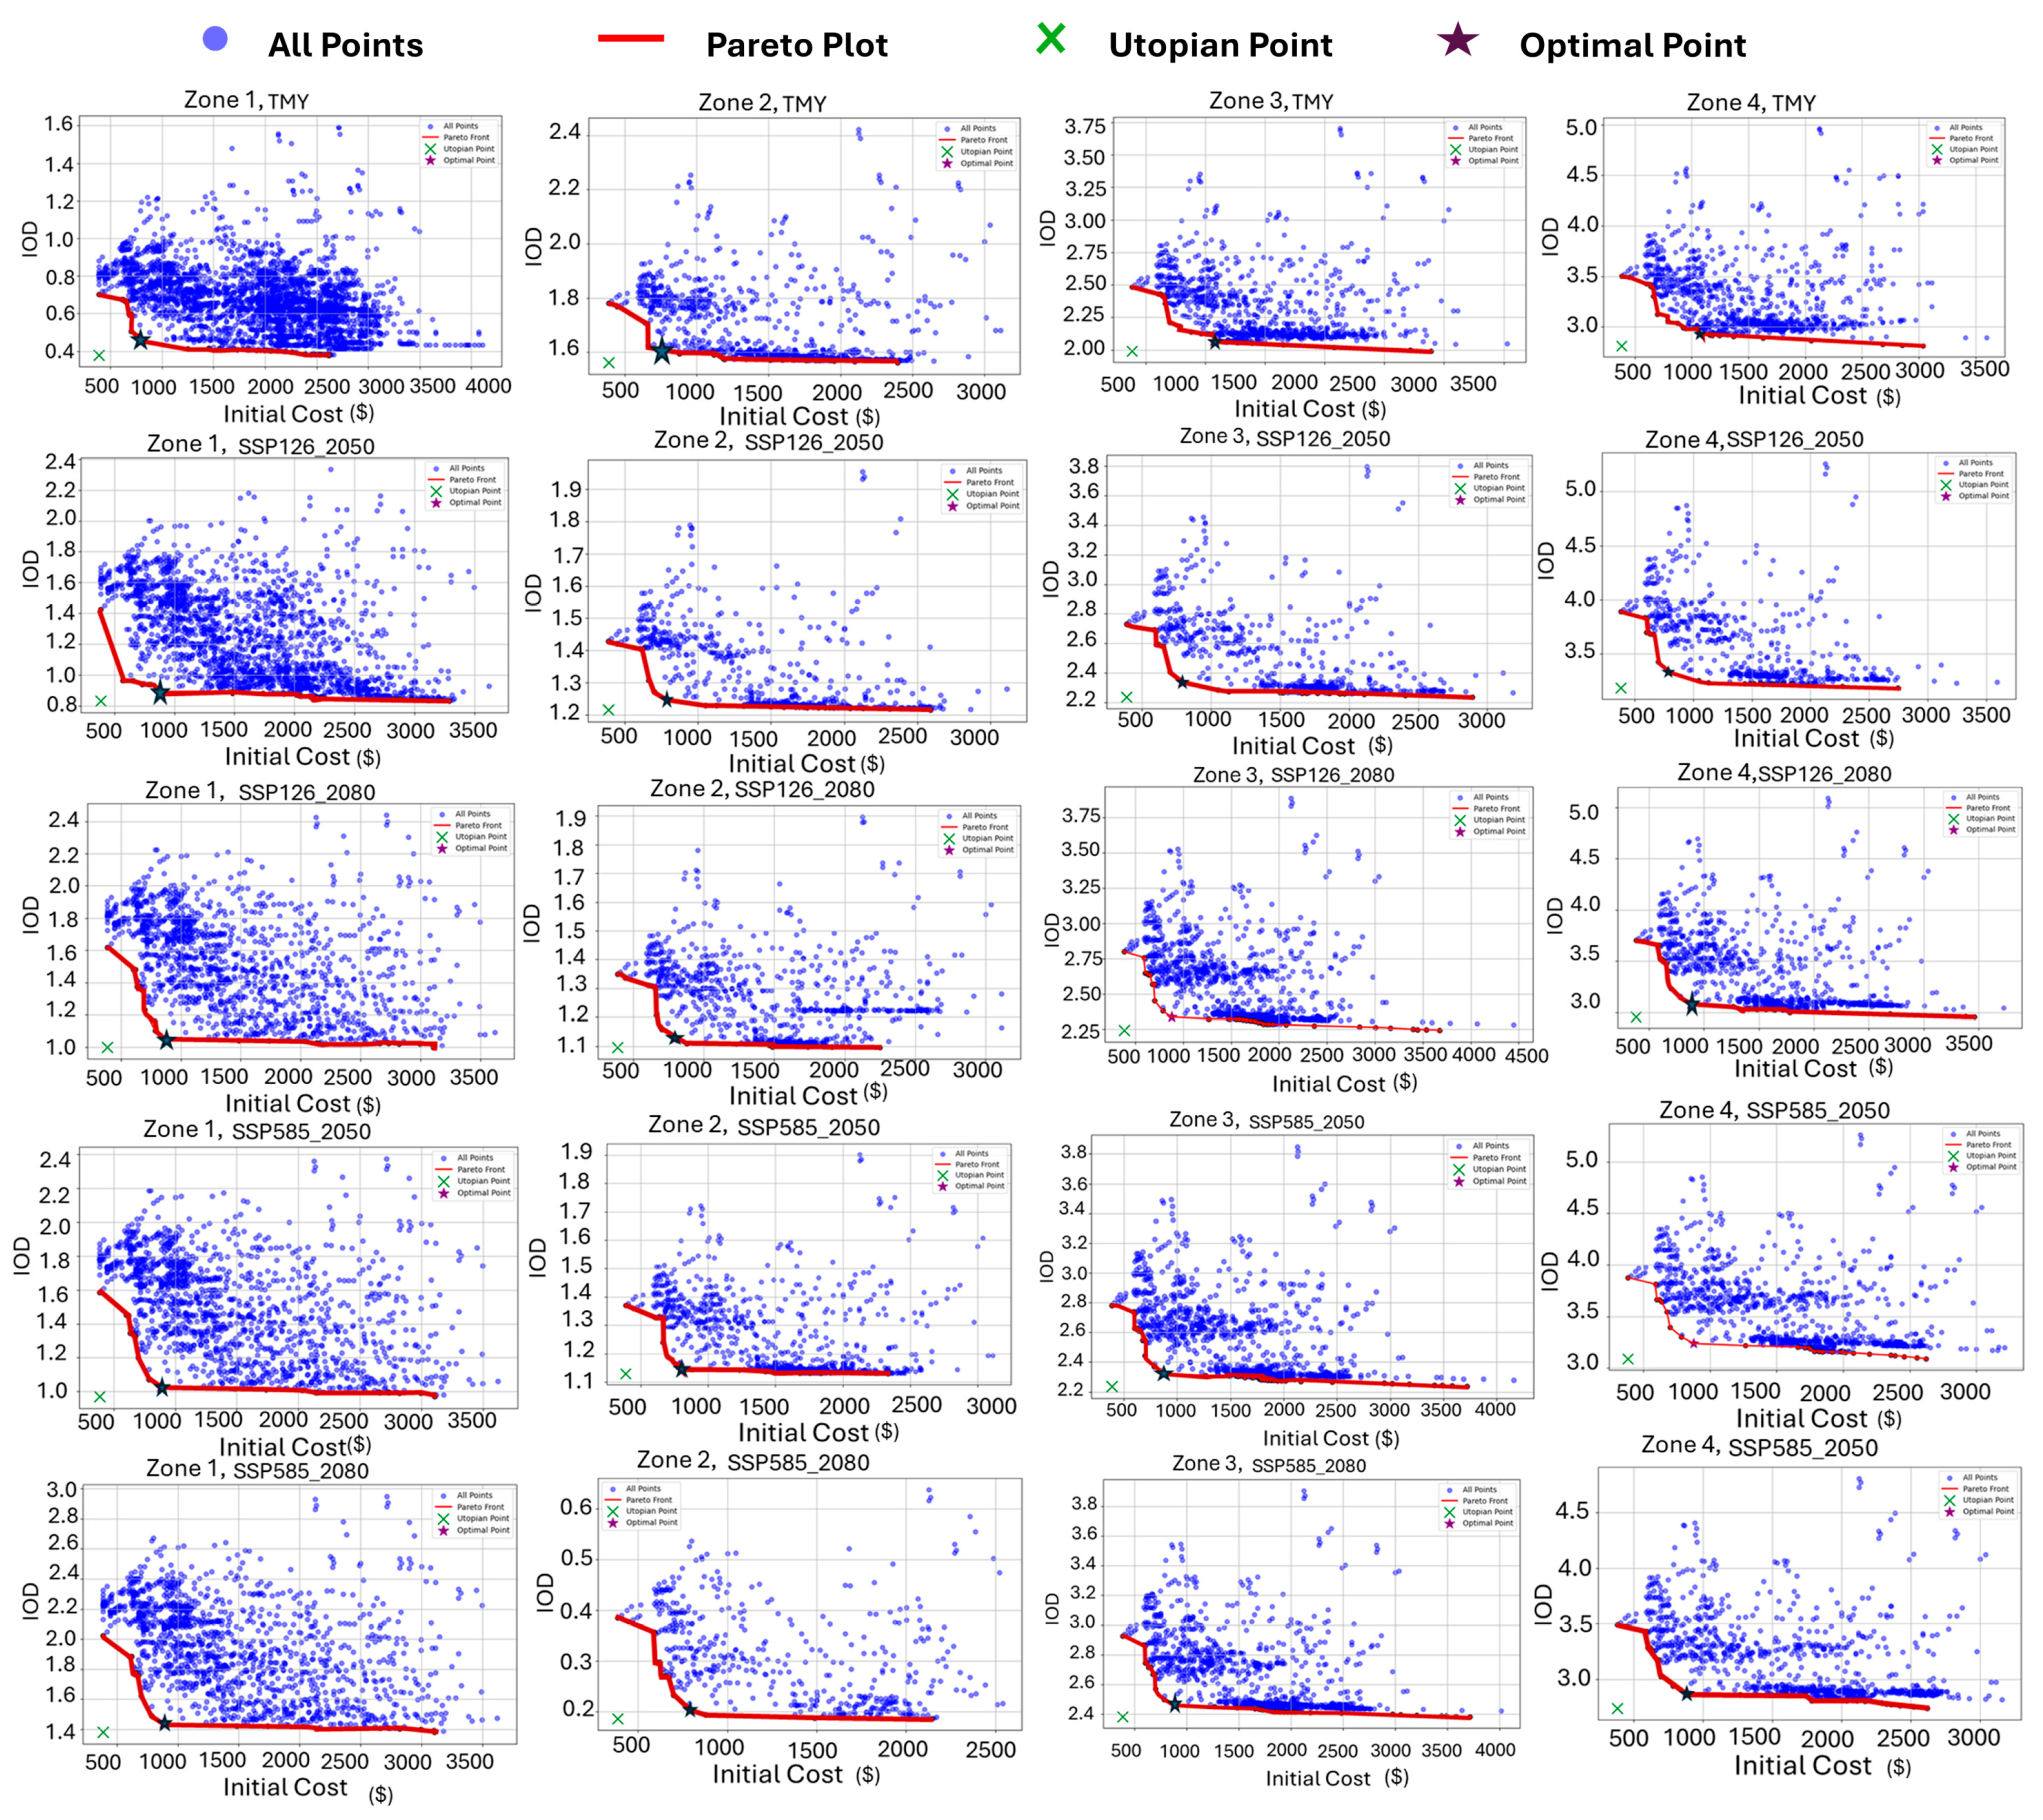
The optimization was applied to each climate zone under five weather scenarios (TMY, SSP126-2050, SSP126-2080, SSP585-2050, SSP585-2080), resulting in different combinations of interventions evaluated for each case. Two optimization runs were conducted, one targeting the minimization of Indoor Overheating Degree (IOD) and the other minimizing intervention cost. The combined outputs were used to generate Pareto plots that visualize the trade-offs between thermal performance and cost. A total of 20 Pareto plots were generated (one per zone per scenario), each showing all feasible configurations of interventions. The clustering observed near the minimum-IOD axis is a result of the local refinement behavior of the Hooke–Jeeves algorithm, which intensifies search around thermally favorable configurations. In contrast, the cost axis displays a sparser distribution due to the nature of the objective function and problem landscape.
Furthermore, it is necessary to generalize the recommendation of interventions for a specific climate zone alone under various weather scenarios. Thus, a subsequent workflow was conducted to refine the interventions and optimize resilience. For each climate zone, all combined feasible solutions, accounting for the five different weather scenarios, were utilized to determine the most optimal intervention recommendation per zone. This process leverages BESOS (Building and Energy Simulation, Optimization, and Surrogate Modelling), to further enhance the EnergyPlus model, incorporating adjustments based on results from GenOpt. This allowed further evaluation of intervention performance under various weather files by integrating them into baseline EnergyPlus models. The BESOS framework facilitated large-scale simulation management, including the configuration of simulation parameters, objective tracking (e.g., IOD, CCOR), and scenario-specific analysis, helping determine zone-specific optimal solutions.
BESOS is a Python-based package that integrates with simulation tools like EnergyPlus to facilitate parameterization, optimization, and analysis of building models. The developed algorithm performed batch simulations in EnergyPlus by integrating each feasible solution, for each climate zone, into baseline EnergyPlus models with defined parameters (e.g., orientation, shading depth, window size) and objectives (e.g., IOD). It iterated over multiple weather files and parameter sets, running simulations for each configuration and determining a different set of feasible solutions suitable for all weather scenarios. The resulting data corresponded to all feasible interventions that can be implemented across the five different weather scenarios, with their associated IOD, AWD, and intervention costs.
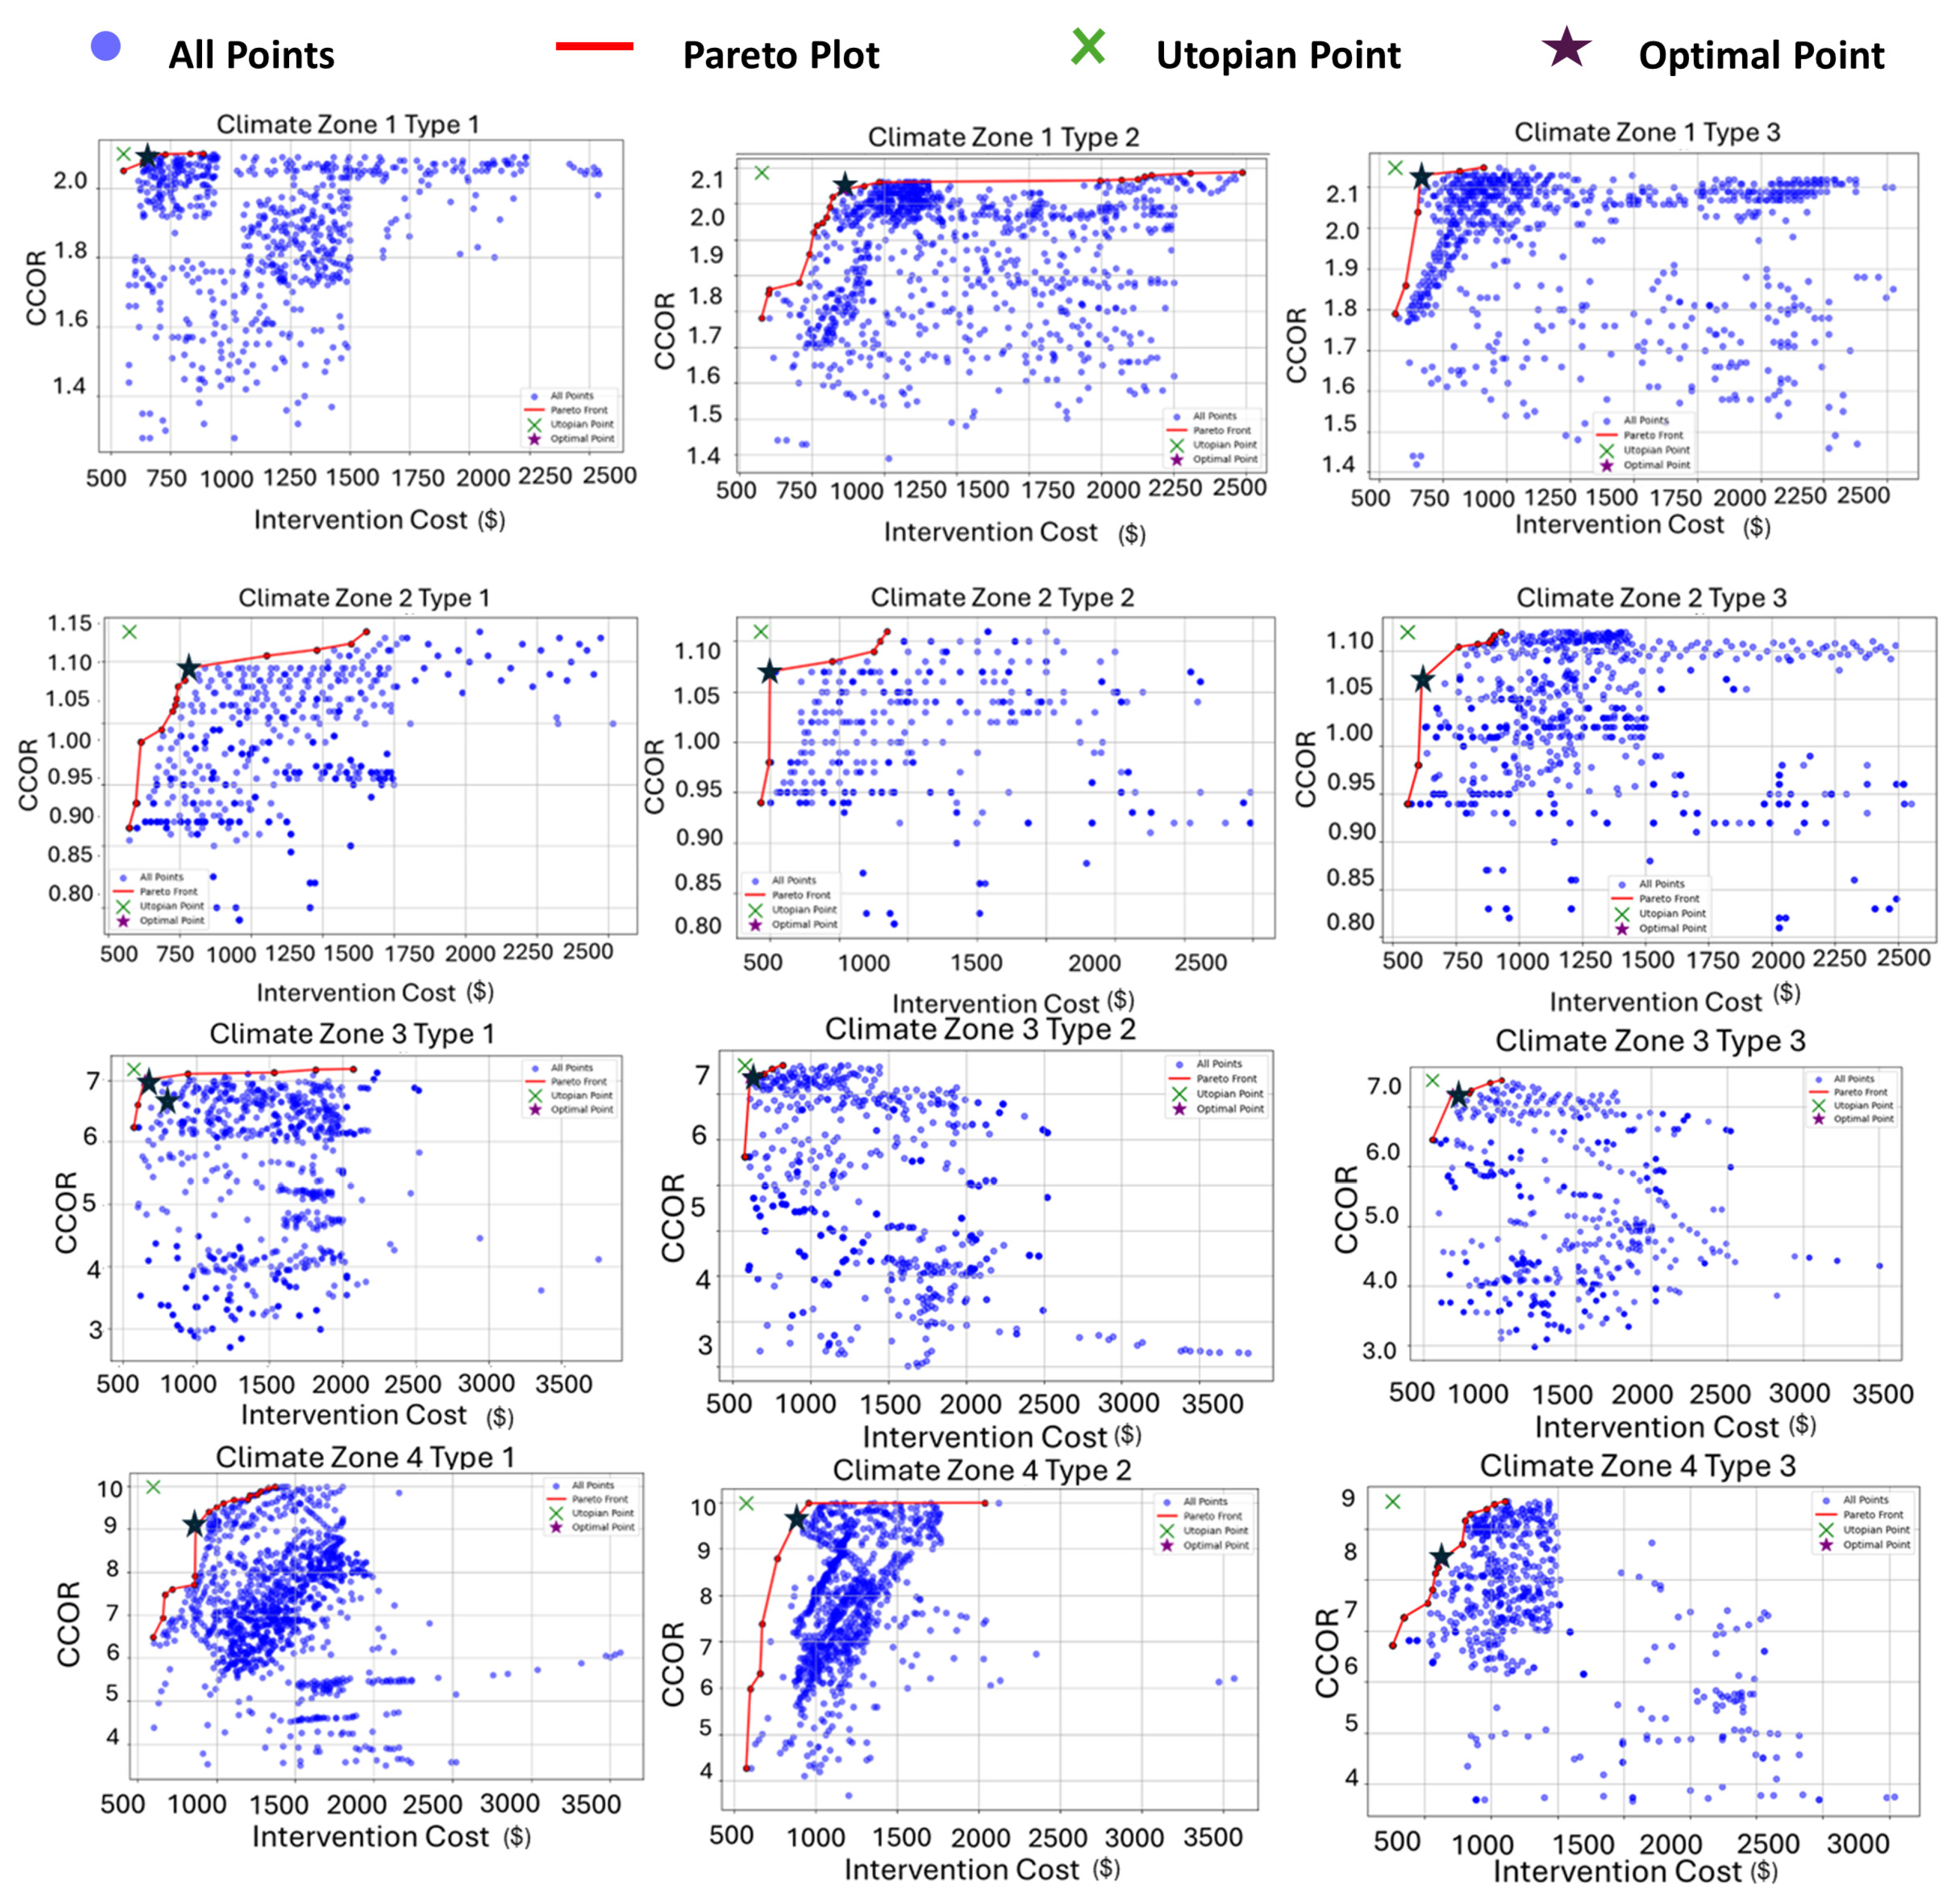
Finally, in selecting general recommendations for optimal interventions in each zone, a CCOR vs. Intervention Cost Pareto chart was plotted. The CCOR value for each building intervention is computed using the respective IOD and AWD. The Pareto front was configured to maximize the CCOR and minimize the intervention cost, offering an optimal balance between resilience performance and financial feasibility.
To evaluate thermal resilience under future climate uncertainty, a single intervention configuration was optimized per climate zone and applied consistently across five climate scenarios (TMY, SSP1-2.6 for 2050 and 2080, SSP5-8.5 for 2050 and 2080). CCOR was then computed using this fixed configuration to reflect the building’s ability to resist overheating regardless of the climate trajectory. This ensures methodological consistency and aligns with CCOR core purpose: quantifying performance degradation under worsening climatic conditions.
4. Results and Discussion
This section presents the result of the multi-objective optimization analysis with the aim of improving the thermal robustness of naturally ventilated domestic buildings across the four climate zones of Lebanon. The analysis merges performance indicators like Indoor Overheating Degree (IOD) and Climate Change Overheating Resistivity (CCOR) to quantify the impact of various passive design interventions under five future weather scenarios. These are future Typical Meteorological Year (TMY) and future climate conditions for 2050 and 2080 under SSP1-2.6 (low-emission) and SSP5-8.5 (high-emission) scenarios previously summarized in
Table 2. The scenarios reflect the effects of rising temperatures and climatic fluctuations on indoor comfort levels. Optimization results are graphically presented by Pareto plots to show intervention costs against thermal performance trade-offs. Each plot point represents a unique combination of design interventions. A comparative case study is then established between baseline and optimized cases, with an in-depth analysis of the sensitivity of each zone to climate change and the potential of passive strategies in minimizing overheating. The debate is concluded with practical recommendations for building envelope performance enhancement in diverse climates.
4.1. Results on Indoor Overheating Degree (IOD)
The Indoor Overheating Degree (IOD) was used as a primary resilience indicator to assess the thermal performance of buildings in four Lebanese climate zones: coastal (Zone 1), low mountain (Zone 2), inland plateau (Zone 3), and high mountain (Zone 4) (see
Figure 1 and
Table 1). In this study, IOD is expressed in degree-hours per occupied day, representing the average intensity of indoor temperature exceedance above the adaptive comfort limit. For example, an IOD of 1.0 indicates that, on average, the indoor temperature exceeded the comfort threshold by 1 °C for one occupied hour per day, a level generally perceived as minor and tolerable, whereas higher values denote more frequent or severe discomfort. For each zone, IOD was evaluated under five weather conditions: TMY, SSP1-2.6 (2050 and 2080), and SSP5-8.5 (2050 and 2080) (see
Table 2). Optimization consisted of the experimental testing of numerous combinations of passive intervention orientation, glazing type of windows, and depth of shading with results reported in the Pareto plots of
Figure 6.
Figure 6 illustrates the overall optimization space for each climate zone and weather scenario. Each plot visualizes the distribution of simulated intervention combinations based on their respective Indoor Overheating Degree (IOD) and intervention cost outcomes. The Pareto front is marked using the red curve as a non-dominated solution, and the star marks the optimal (non-feasible) point balancing IOD and initial cost. The Utopian point represents the ideal but unattainable condition where both objectives, minimum IOD and minimum cost, are simultaneously minimized. It is used as a reference for evaluating the relative performance of optimized solutions along the Pareto front.
The shape and density of such fronts vary among zones, with the coastal and plateau climates (Zones 1 and 3) being inclined where there is a fall-off of IOD for increases in cost that are steep, and mountainous regions (Zone 4) levelling out in the trade-offs due to the baseline overheating always being lower.
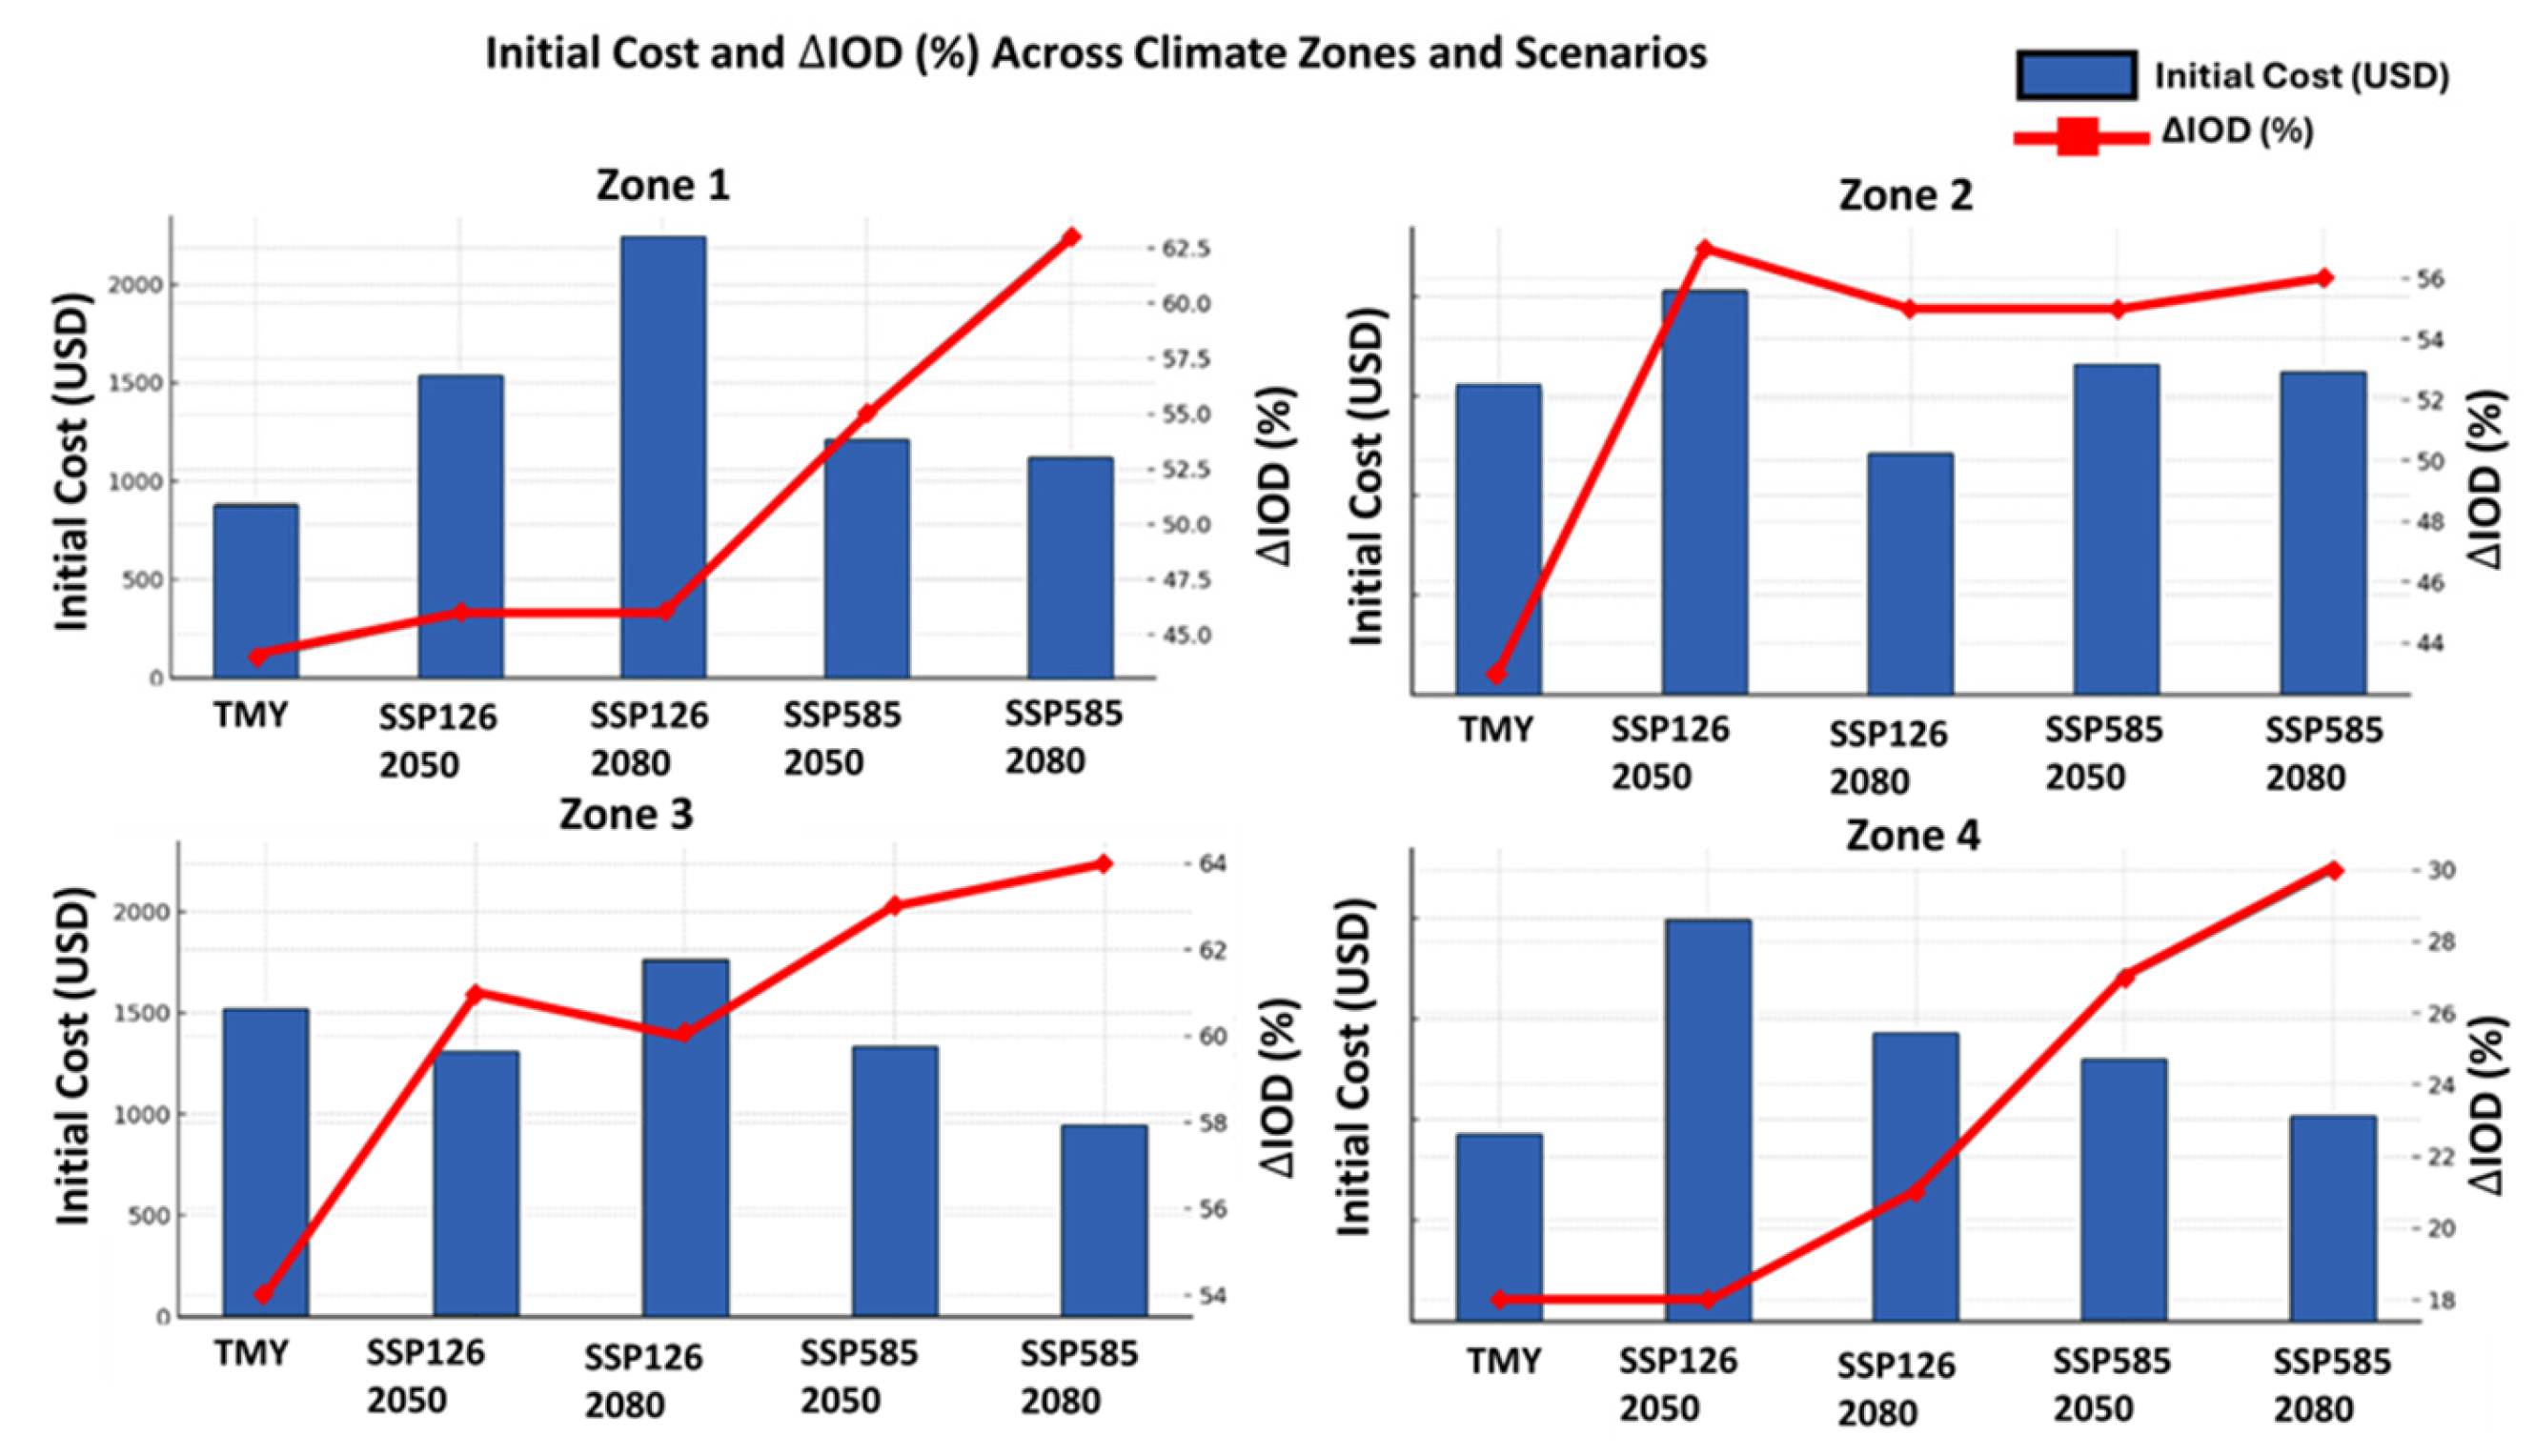
The magnitude to which passive envelope design modifications enhance thermal performance in the four climatic zones is demonstrated by the aggregate data in
Figure 7 and
Table 9. For instance, in Zone 1 (coastal), IOD decreased by 63% from 1.84 in SSP5-2080 to 0.68 when best-bet treatments were implemented. This was achieved with southeast orientation (150°), bronze glazing (Type 2), and medium overhangs (0.9 m), coupled with window sizes of 3.5 m (south) and 4 m (west). The same patterns were evident across all scenarios, with optimized IOD always below 1.0, confirming the profound effect of envelope optimization in the face of warm and humid coastal climates.
While the Pareto plots identify optimal configurations, it is essential to interpret how decision-makers can select among the trade-off solutions along the Pareto front. In practical applications, stakeholders may prioritize either minimal cost or maximum resilience depending on project context. Identifying the inflection point, where additional cost yields diminishing improvement in IOD or CCOR, provides a rational criterion for choosing a balanced configuration. This interpretation enhances the applied value of the optimization results, guiding practitioners toward economically efficient yet thermally resilient designs.
Zone 2 (low mountain) experienced consistent 55–60% reductions in all instances. More surprisingly, the best window types varied between low-e (Type 3) and bronze (Type 2) depending on the emission scenario. Overall, overhangs of 0.8 m to 1.0 m with southeast to south orientation were optimal. These findings suggest that even under relatively warm mountain conditions, minor modifications of window performance and shading depth can yield significant thermal comfort gains.
Zone 3 (plateau inland), where SSP5-2080 had the highest baseline IOD values of 2.85, registered the most significant improvements. Improved IOD was reduced to a minimum of 0.89 (TMY) and 1.02 (SSP5-2080), representing reductions of as much as 64%. Zone 3 was also the most sensitive to Type 3 high-performance glazing, 0.9–1.0 m consistent overhangs, and increased south- and west-side windows. The susceptibility of the inland zone to excessive solar gains made it highly vulnerable to extreme envelope strategies.
Zone 4 (mountain high) was contrastingly defined by modestly sized IOD decreases of 18–30%. Due to its naturally cooler climate and mountain-top exposure, baseline IOD levels were already high (3.33–3.74), but absolute gains were constrained. Optimum designs included low-e glazing, 0.8–1.0 m shading, and comparatively conservatively sized windows. These configurations achieved substantial summer peak performance increases but performed less well than lower-altitude zones.
Overall, this research yields the importance of building orientation, glazing, overhang, and window size in minimizing IOD. The thermally stressed coastal and inland zones benefited most from passive optimization. In all instances, the interventions were zone-specific to climatic demands, which validates that a single approach is not sufficient when designing for resilience against diverse future weather conditions.
These optimized configurations vary between 2050 and 2080 scenarios due to changes in outdoor thermal conditions. Each future scenario reflects different projected intensities and timelines of climate change. Since the effectiveness of passive design strategies is highly sensitive to external thermal conditions, the optimal intervention sets for 2050 and 2080 differ. For example, the higher solar radiation and ambient temperatures expected in 2080 may necessitate deeper shading or more advanced glazing than those suitable for 2050. While ideally, buildings would be upgraded progressively, in practice, it is recommended to adopt the more robust 2080-optimized configurations to ensure long-term thermal resilience.
4.2. Results on Climate Change Overheating Resistivity (CCOR)
Based on the Climate Change Overheating Resistivity (CCOR) factor, we estimate the future indoor overheating resistance of buildings to around a certain value. It quantifies the quantitative relationship between interior overheating (IOD) and exterior warming (AWD) and is a better estimation of building long-term thermal resistance to climate change. The higher the CCOR, the more the building insulates indoor areas from increased outdoor heat conditions.
Figure 8 illustrates CCOR Pareto plots for every zone and window type. Every point represents a tested intervention setting (orientation, shading, and glazing), where the red line indicates the Pareto front of non-dominated solutions. The green star indicates the selected optimal intervention point that maximizes CCOR and minimizes initial cost. Each of the subfigures in
Figure 8 corresponds to a different glazing type and climate zone: (a) Type 1—clear, (b) Type 2—bronze, and (c) Type 3—low-e.
To more closely evaluate performance improvement,
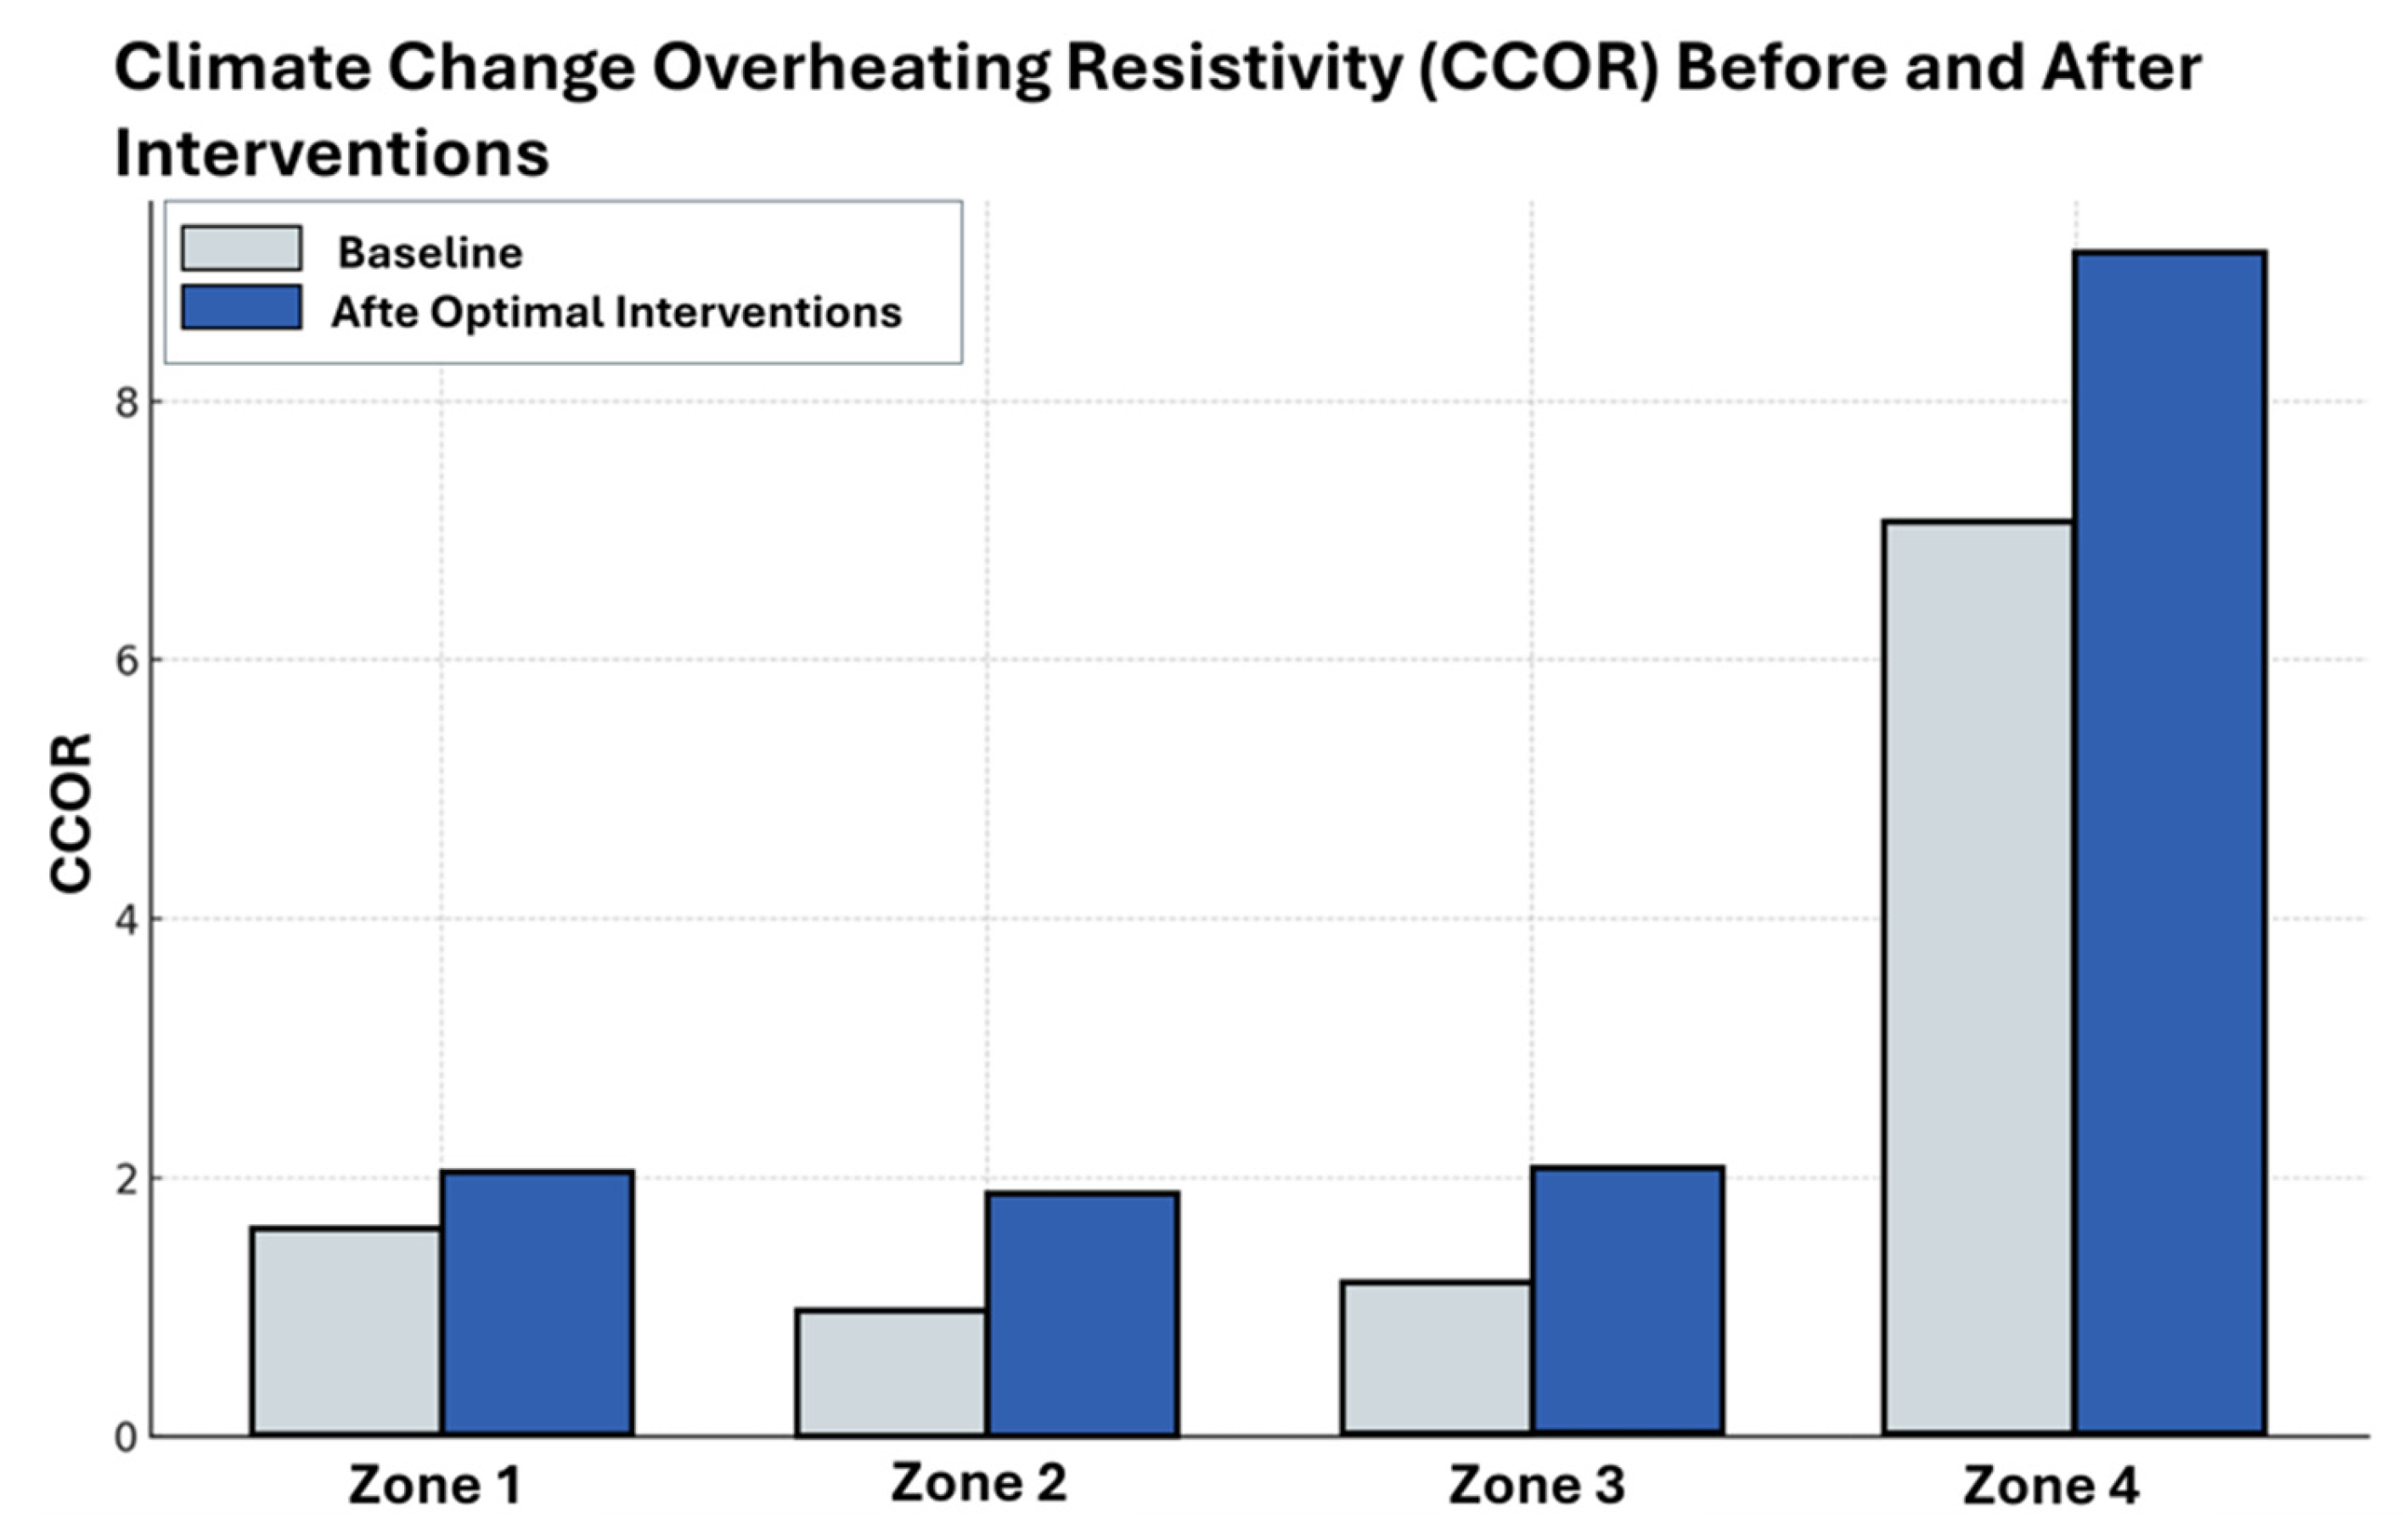
Figure 9 provides baseline CCOR values compared with those achieved following optimization for all window types within all zones. For Zone 1 (coastal), baseline CCOR was approximately 1.6, which improved to 2.03, 2.09, and 2.04 for Types 1, 2, and 3, respectively. While the absolute gains were minimal, these values show that the total effect of southeast orientations (150–165°), moderate overhangs (0.6–0.9 m), and properly sized windows (about 3.5–4.0 m) significantly enhances resilience even in moderate, humid climates. Type 2 (bronze) glazing was slightly better than the others, showing a thermal advantage under these conditions in this climate.
Zone 2 (low mountain) did not show much CCOR improvement despite large reductions in IOD. From a baseline CCOR of nearly 1.0, post-intervention values were around 1.07 for all window types. This indicates that passive measures were found to be effective in minimizing short-term overheating but less effective in affecting long-term climate sensitivity in this zone. However, optimized scenarios with south orientations (165–180°), 0.8–1.0 m overhangs, and medium window sizes provided consistent thermal benefits.
Zone 3 (plateau interior) underwent the most dramatic change, with the baseline CCOR of 1.3 skyrocketing to 6.50 (Type 1), 6.80 (Type 2), and 7.10 (Type 3). These dramatic gains are attributed to the extensive sunlight exposure and aridity in this zone, making it extremely responsive to envelopes tampering. Optimal designs relied heavily on low-e glazing, increased shading, and increased window openings in southern and western exposures demonstrating that a good envelope can offer tremendous protection in more severe, hotter climates.
In Zone 4 (high mountain), which had a high baseline CCOR of 7.1 because it is cooler, the gains were more modest in percentage terms but still significant. Optimized CCOR increased to 8.3, 8.7, and 9.0 for Types 1, 2, and 3, respectively. Although percentage savings were lower, the resulting values exhibit improved resistance to intermittent summer overheating. The most efficient combinations were low-e glazing, lower window area, and 0.8–1.0 m overhangs, specially designed to reject unwanted solar gains while maintaining adequate daylight.
Generally, CCOR optimization confirms the core significance of envelope design in mitigating overheating risk due to climate change. Across all zones, the optimized passive interventions, most notably particularly high-performance glazing and well-optimized orientations, played a powerful role in increased thermal resistance. The inland plateau and coastal zones benefited most significantly, with the mountain zones demonstrating that even already resilient conditions are further upgradable.
4.3. Cross-Zone Synthesis and Intervention Recommendations
The optimization analysis revealed unique patterns across Lebanon’s diverse climatic zones, highlighting the importance of customized passive measures in achieving thermal resilience. The coastal and inland plateau regions (Zones 1 and 3), which face the most severe overheating under high-emission scenarios, responded optimally to combined interventions that adjust orientation, glazing, overhanging depth, and window size. Low- and high-mountain zones (Zones 2 and 4) recorded more moderate improvements, reflecting cooler baselines and reduced solar sensitivity. Across all zones, orientations between 150° and 180° proved most effective in limiting solar exposure. Bronze-tinted (Type 2) and low-emissivity (Type 3) glazing yielded the best performance depending on climate severity, while overhang depths of 0.6–1.0 m consistently enhanced both IOD and CCOR. The effectiveness of every measure increased when used as part of a bundled envelope strategy, confirming that combined interventions achieve far more robust outcomes than isolated upgrades.
The superior performance of bundled interventions suggests synergistic effects that go beyond the sum of individual measures. For example, the temperature reduction achieved by upgrading glazing alone might be amplified when combined with optimal orientation or shading, because each measure reduces a different source of heat gain or delays its arrival indoors. Although the optimization did not isolate all individual-measure outcomes in this manuscript, the Pareto front density and cost–benefit slopes imply strong interaction: configurations combining orientation, glazing, and shading consistently outperform those relying on glazing or shading alone at similar cost levels. This indicates that resilience is not strictly additive but benefits from the cumulative, complementary impacts of measures. Quantifying such interaction effects, by comparing paired vs. single-measure solutions, could be a useful extension of the methodology in future work.
4.3.1. Final Recommendations
Based on the multi-objective optimization, this study identifies balanced configurations that achieve major reductions in overheating at reasonable cost for each zone.
Zone 1 (Coastal): Southeast orientation (150–165°), bronze glazing (Type 2), and overhangs of 0.6–0.9 m with window widths of ≈ 3.5 m (south) and 4.0 m (west) provided the best balance of performance and affordability. Configurations with slightly deeper overhangs or higher-performance glazing gave only minor additional gains, indicating that solar-gain control dominates thermal behavior in this humid climate.
Zone 2 (Low Mountain): A southern orientation (165–180°), bronze glazing (Type 2), and shading of 0.8–1.0 m with window widths of 3.5–4.0 m were optimal. Increasing shading beyond 1 m or upgrading glazing produced diminishing returns once major solar exposure was mitigated.
Zone 3 (Inland Plateau): The most heat-sensitive region required a southern orientation (165–180°), low-e glazing (Type 3), and overhangs of ≈ 0.9–1.0 m with larger windows (4.0–4.5 m) to enhance cross-ventilation. Beyond these ranges, further cost or complexity yielded negligible improvement.
Zone 4 (High Mountain): A southeast orientation (150–165°), bronze or low-e glazing depending on budget, a 0.8–1.0 m shading depth, and moderate window widths (3.0–3.5 m) achieved effective protection. Greater shading or higher glazing grades offered minimal benefit in this cooler context.
Across all climates, the convergence toward low-emissivity glazing and ≈1 m overhangs illustrates a consistent physical driver: controlling direct solar gain is the primary pathway to mitigate overheating in Lebanese buildings. Therefore, the revised discussion focuses on these balanced, high-impact configurations rather than repeating identical “maximum-performance” cases. To address socioeconomic disparities, cost-effective solutions using affordable glazing (Type 2) and medium overhangs still provide meaningful resilience improvements. While the 2080-optimised configurations show the highest thermal resilience, it is important to identify no-regret retrofit strategies that perform reliably across multiple future scenarios. These interventions, for example, moderate shading, incremental glazing upgrades, or refined orientation, deliver consistently strong reductions in overheating (IOD) and improvements in resilience (CCOR) under both 2050 and 2080 projections, regardless of emission pathway. Such options offer decision-makers a balanced approach between cost and performance, reducing the risk of over- or under-investing in interventions relative to uncertain climate futures. For long-term preparedness, adopting configurations optimized for 2080 scenarios is recommended wherever future overheating risks are high.
4.3.2. Applicability to Other Mediterranean Contexts
Although this study is based on five Lebanese climate zones, the underlying methodology (multi-objective optimization combining thermal comfort, cost, and future-climate resilience via CCOR) is broadly transferable. The quantitative outcomes (optimal shading depths, glazing types) may vary in other regions, depending on local meteorological profiles, building materials, construction practices, and occupancy schedules. For example, in areas where buildings use thicker masonry walls or heavier thermal mass, or where glazing practices differ, the relative benefit of shading vs. glazing may shift. Nonetheless, the process of defining intervention bundles, generating Pareto fronts, and evaluating both short-term comfort (IOD) and long-term overheating sensitivity (CCOR) remains valid. Stakeholders in other Mediterranean or Middle Eastern jurisdictions can adopt this framework, but should calibrate base-case envelope assumptions, cost inputs, and climate projections to their local data. This ensures that results are context-specific while benefiting from the methodological rigor demonstrated here.
5. Conclusions
This study developed and applied a multi-objective optimization framework to enhance the thermal resilience of naturally ventilated residential buildings across four Lebanese climate zones under five current and future weather scenarios (TMY, SSP1-2.6—2050/2080, and SSP5-8.5—2050/2080). The optimization simultaneously minimized the Indoor Overheating Degree (IOD) and intervention cost, while the Climate Change Overheating Resistivity (CCOR) metric quantified each building’s long-term resistance to future warming.
Quantitatively, the optimized passive-envelope combinations reduced IOD by 45–74% and increased CCOR from baseline values of 1.0–1.6 to as high as 7.1, depending on the climate zone. The inland plateau (Zone 3) exhibited the greatest improvement, achieving up to 64% reduction in IOD and a six-fold increase in CCOR, while the coastal zone (Zone 1) showed reductions of up to 63% in IOD. Even the cooler mountain zones benefited measurably, with IOD decreases of 18–30% and CCOR values rising above 8.5.
The results confirm that thermal resilience depends on an integrated set of envelope interventions rather than isolated measures. Overhang depths of 0.6–1.0 m, south-facing orientations between 150° and 180°, and climate-appropriate glazing (Type 2 or Type 3) consistently yielded the best balance between thermal performance and cost. These configurations effectively mitigated overheating across all emission scenarios and time horizons.
Overall, these findings provide actionable, data-driven guidance for climate-adaptive building design. The proposed framework can be directly applied to similar Mediterranean or semi-arid regions facing future warming. By quantifying the achievable reductions in IOD and gains in CCOR, this work establishes clear performance targets for enhancing the resilience of naturally ventilated buildings in energy-constrained contexts such as Lebanon.

